Embed Size (px)
Citation preview

STRUCTURAL
SAFETY
Structural Safety 26 (2004) 367–389
www.elsevier.com/locate/strusafe
Probability analysis of RC member deformation limitsfor different performance levels and reliability of
their deterministic calculations
Yong Lu *, Xiaoming Gu
School of Civil and Environmental Engineering, Nanyang Technological University, 50 Nanyang Avenue, Block N1, 1a-29,
Singapore 639798, Singapore
Received 19 February 2003; received in revised form 28 October 2003; accepted 23 January 2004
Abstract
The quantified definition of performance levels of RC members, in terms of limit sectional curvature and
member drift, is necessary for the implementation of the performance-based design of building structures.
Because of various uncertainties involved, the curvature and drift limits satisfying prescribed performancecriteria are probabilistic in nature; therefore, it is necessary to understand their probability distributions
before any reliable deterministic values can be decided. In this paper, the probability distributions of RC
member behavioural parameters, namely the strength and deformation capacities at yield and ultimate
stages, and the deformation limits at two intermediate performance levels (‘‘Functional’’ and ‘‘Damage
Control’’), are established by means of Monte Carlo simulation in conjunction with the RC section analysis.
Subsequently, the reliability of employing the deterministic predictions for the deformation limits is as-
sessed. Results show that the limit curvature and drifts at different performance levels generally follow the
normal distribution, with a coefficient of variation on the order of 10%, 15%, 35%, and 40% for the yield,Functional, Damage Control, and Ultimate performance levels, respectively. In most cases, the probability
of actual curvature and drift capacities exceeding the respective limit values predicted by deterministic
calculations ranges from 50% to 70%. However, for heavily confined members and under a relatively low
axial force, the above probability could reduce to only about 30%.
� 2004 Elsevier Ltd. All rights reserved.
Keywords: Reinforced concrete members; Probabilistic behaviour; Section curvature; Inter-storey drift; Performance
levels; Monte Carlo simulation
*Corresponding author. Tel.: +65-6790-5272; fax: +65-6791-0676.
E-mail address: [email protected] (Y. Lu).
0167-4730/$ - see front matter � 2004 Elsevier Ltd. All rights reserved.
doi:10.1016/j.strusafe.2004.01.001

368 Y. Lu, X. Gu / Structural Safety 26 (2004) 367–389
1. Introduction
The behaviour of reinforced concrete (RC) members, especially the inelastic behaviour, de-pends on various geometric and material parameters, most of which are of a random nature.Therefore, uncertainty exists in the RC member behaviour concerning the strength, ductility, aswell as the responses at other performance levels in the context of the emerging performance-based design [1]. To more realistically describe such capacities requires a probabilistic model.Specific values for design or performance verification can then be determined from the proba-bilistic model according to a desired percentage chance of being exceeded by the respective actualcapacities. However, the application of a probability procedure in actual design is not practical;instead, in the design practice the influencing parameters are often treated as deterministic usingtheir characteristic or nominal values.
Because of different contributions that different variables may have on a particular behaviouralcapacity, especially regarding the deformation, the reliability of a deterministic calculation asmentioned above is not always clear. The problem is compounded by the uncertainties introduced inmodelling somehighly uncertain phenomena such as the confined concrete behaviour and the plastichinge length at inelastic response stages. This paper presents a systematic probabilistic evaluation ofthe member strength and deformation capacities, including the sectional curvature and memberdrift, at different performance levels. On this basis, the reliability of commonly used deterministiccalculations in predicting the curvature and drift capacity limits is assessed. The establishment of theprobability distributions of these limits and the reliability assessment of the corresponding deter-ministic calculations can also be useful in the development towards a uniform reliability design.
The uncertainties of RC member behaviour at the sectional level concerning the curvatureductility have been investigated by some researchers [2,3], based on simplified relationships be-tween the curvature and the influencing random variables. In the study by Kappos et al. [3], themodel uncertainty factor for the confined concrete strain was also considered. In the presentstudy, a refined RC section analysis procedure [4] is employed to carry out direct Monte Carlosimulation to obtain the probability distribution of the sectional response at the yield and ultimatestages, as well as at two intermediate performance levels for which little information about theirprobabilistic properties is available in the existing literature. By applying a direct simulation, theerrors that might arise from simplifying the sectional responses can be minimized.
The probability distribution of the member lateral drift capacities depends not only on theprobabilistic sectional curvature but also on the distribution of the inelastic deformation along themember length. The latter can be described using an equivalent plastic hinge length, althoughexperimental evidences have shown that the determination of the plastic hinge length is highlyuncertain. In this study, a unified plastic hinge length formula is employed, while its uncertainty isdescribed using a model uncertainty factor in association with a probability distribution. Usingthis probabilistic plastic hinge length model and the aforementioned sectional curvature model,the distributions of the drift limits at different performance levels are established using MonteCarlo simulation.
The sectional curvature and the drift limits are then predicted using the deterministic approachwhereby the characteristic material strengths and nominal limit strain values are adopted. Bycomparing to the probabilistic results, the reliability of these deterministic calculations is iden-tified in terms of the probability that actual limit values exceed the deterministic predictions.

Y. Lu, X. Gu / Structural Safety 26 (2004) 367–389 369
2. Definition of performance levels
In the context of performance-based design, Vision 2000 [5] proposed five performance levels,namely Fully Operational, Operational, Life Safety, Near Collapse and Collapse. This definitionprovides an overall picture of the building performance satisfying different design demands in lin-guistic terms. However, when it comes to physical quantification it is found that the boundary be-tween any two adjacent performance levels is not easily drawn. For this reason, it is deemed morepractical at the present stage to combine some performance levels to allow for more explicit trans-lation into physical quantities. Thus, three performance levels emerge: (a) ‘‘Functional’’ performancelevel, referring to the state that the normal function of the building is maintained, (b) ‘‘DamageControl’’ level which is mainly concerned with controllable structural damage and the life safety ofbuilding occupants, and (c) ‘‘Collapse’’ level. For individual members the ‘‘Collapse’’ can be inter-preted to correspond to the ultimate capacities of themember.More detailed quantifications follow.
(a) Functional level: In terms of the material properties, crushing of compressive unconfinedconcrete and unacceptable residual crack widths could be used to define the Functional perfor-mance level for which easy repairing work is possible without major interruption to the normalfunction of the building. Priestley [1] suggested that for a fully operational state the strain forcompressive concrete and tensile reinforcing bars be limited to 0.004 and 0.015, respectively.These two values correspond respectively to the onset of crushing of concrete cover and a statewhereby residual crack width is about 1.0 mm. These values are employed in the present study asthe nominal limit criteria for the Functional performance level.
(b) Damage Control level: Damage Control (DC) level can also be defined by the material strainlimits to restrict excessive structural damage. A rated ultimate compressive strain of confinedconcrete, ecm, may be used as the DC level concrete compressive strain at which the confinedconcrete may still be considered repairable. Based on a model uncertainty study related to theultimate compressive strain of confined concrete by Dymiotis [6], the confinement model origi-nally suggested by Tassios [7] and adopted in EC8 [8], as will be described later, appears to begenerally conservative by around 50%, which means the actual ultimate state will not occur untilthe compressive strain of confined concrete further increases from the predicted value by about50%. Since this level of reservation is just adequate for controlling the damage to confined con-crete, as considered also by some other researchers [9], the confined concrete strain calculatedusing the EC8 model is considered as the nominal DC level concrete strain limit in the presentstudy. Hence, the limit concrete strain (mean value) will be a function of the transverse confiningreinforcement. On the other hand, for the longitudinal reinforcement a limit tensile strain (esm)equal to 60% of the strain at the maximum stress is adopted to avoid buckling of compressivereinforcement and low cycle fatigue [1]. According to Kappos et al. [3], the mean ultimate strain oftypical longitudinal reinforcement is about 0.09; thus, the mean limit strain of reinforcement atDC level is taken to be 0:6� 0:09 ¼ 0:054. It is noted that in a previous study Kowalsky [9]suggested that for damage control of bridge columns the limit compressive strain of confinedconcrete core be 0.018 and the limit tension reinforcement strain be 0.060.
(c) Ultimate level: The ultimate level implies that partial to total collapse occurs. From thematerial strain point of view, it can be interpreted as the state whereby the confined concretereaches the ultimate compressive strain, ecu, or the longitudinal reinforcement on the tension sidereaches the ultimate tension strain, esu.

370 Y. Lu, X. Gu / Structural Safety 26 (2004) 367–389
3. Basic random variables and Monte Carlo simulation of RC member behaviour
3.1. Basic random variables influencing RC member behaviour
Two major types of uncertainties exist concerning RC member behaviour, namely physicaluncertainty, and model uncertainty. The physical uncertainty refers to actual variability ofphysical quantities, such as loads, material properties and dimensions. This variability can bedescribed in terms of probability distributions or stochastic processes. The model uncertaintyrefers to the uncertainty that is associated with the mathematical models relating the parameterconcerned (e.g. the confined concrete ultimate strain) to a set of basic variables (e.g. the amountand pattern of confining reinforcement). In the work of Chavez and De Leon [10], a ‘‘formulaerror parameter’’ was included as well as the material properties and member stiffness for theevaluation of the probabilistic characteristics of structural effects. Luo et al. [11] introduced amodel uncertainty factor to randomly account for the uncertainty involved in the prediction ofpunching failure at the interior connections of RC flat-slab buildings. In general, the modeluncertainty occurs as a result of simplifying the unknown effects of other variables and theirinteractions that are not included in the model. The model uncertainty associated with a particularmathematical model may be expressed in terms of the probabilistic distribution of a variable vmdefined as
vm ¼ Actual response
Predicted response using model: ð1Þ
The RC member behaviour at different response levels depends on different aspects and combi-nation of material properties and other variables. Fig. 1 shows a typical analytical model for theRC sectional response, from which it can be understood that the main random variables thatcontribute in the actual probabilistic performance of an RC member include the constitutivebehaviour of unconfined and confined concrete, of the reinforcement, as well as the distribution ofthe inelastic deformation along the member length (plastic hinge length). The probabilisticproperties of the random variables affecting the variability of the RC member behaviour areenumerated in what follows.
3.1.1. Cylinder compressive strength and modulus of elasticityAccording to Mirza et al. [12], a normal distribution can be used to approximate the proba-
bilistic property of the compressive strength of concrete. The coefficient of variation (COV) can betaken as roughly constant at 10%, 15%, and 20% for strength level below 4000 psi (27.6 MPa) forexcellent, average, and poor quality control, respectively. For concrete with an average strengthabove 4000 psi (27.6 MPa), the standard deviation remains approximately constant and equal to400 psi (2.76 MPa), 600 psi (4.14 MPa), and 800 psi (5.52 MPa) for the three levels of controllisted above, respectively.
Class C25 concrete is considered in the examples of the present study. The C25 concretehas a characteristic value of cylinder compressive strength (fck) equal to 25 MPa, corre-sponding to a 95% chance of being exceeded. Assuming an average quality control, thestatistical property of its compressive strength can be described as normal distribution, and itsmean compressive strength is equal to (25þ 1:645� 4:14Þ ¼ 31:8 MPa. The modulus of

εc cε'
εs
N
M
Confined Concrete
Top cover
Bottom cover
Side cover
Strain Stress
cc
σsAs
sA s
(a)
Confined
Strain
Str
ess
fcc
fc
0.85fc
0 εc,85 εcu
Unconfined
(b)
σ
σ´
Fig. 1. Analytical model for RC sectional analysis: (a) fiber model for RC sectional analysis and (b) stress–strain
behaviour of confined and unconfined concrete.
Y. Lu, X. Gu / Structural Safety 26 (2004) 367–389 371
elasticity is defined as the initial tangent modulus, Ec, which may be related to the cylindercompressive strength as [12]
Ec ¼ 5017f 1=2c ðin MPaÞ: ð2Þ
3.1.2. Ultimate compressive strain of unconfined and confined concrete
Typical stress–strain curves of unconfined and confined concrete are depicted in Fig. 1(b). Themaximum strain ec;85 of unconfined concrete is defined to correspond to the stress of 0:85fc on thedescending branch of the unconfined stress–strain curve. In the present study, the variation of ec;85is assumed to follow a normal distribution with the mean value equal to 0.0035 and a standarddeviation equal to 0.0005, corresponding to a COV of 15% [2].
In seismic design, concrete is usually confined by transverse reinforcement commonly in theform of closely spaced steel spirals or hoops. At low levels of stress in the concrete, the transversereinforcement is hardly stressed; hence the concrete is unconfined. The concrete becomes confinedwhen the stress approaches the uniaxial strength, at which stage the transverse strain becomesvery high because of progressive internal cracking and the concrete bears out against the trans-verse reinforcement, which then applies a confining reaction to the concrete.
There exist various models for the ultimate compressive strain of confined concrete, ecu. Thediversity of predictions using these individual models testifies a considerable inherent variability ofthis crucial parameter, and a complete description of it thus requires an expressive model inconjunction with a model uncertainty factor. Dymiotis [6] investigated several prevailing modelsfor the confined concrete stress–strain behaviour and provided a probabilistic evaluation of therespective model uncertainty. Based on the results from various experimental programmes, 56
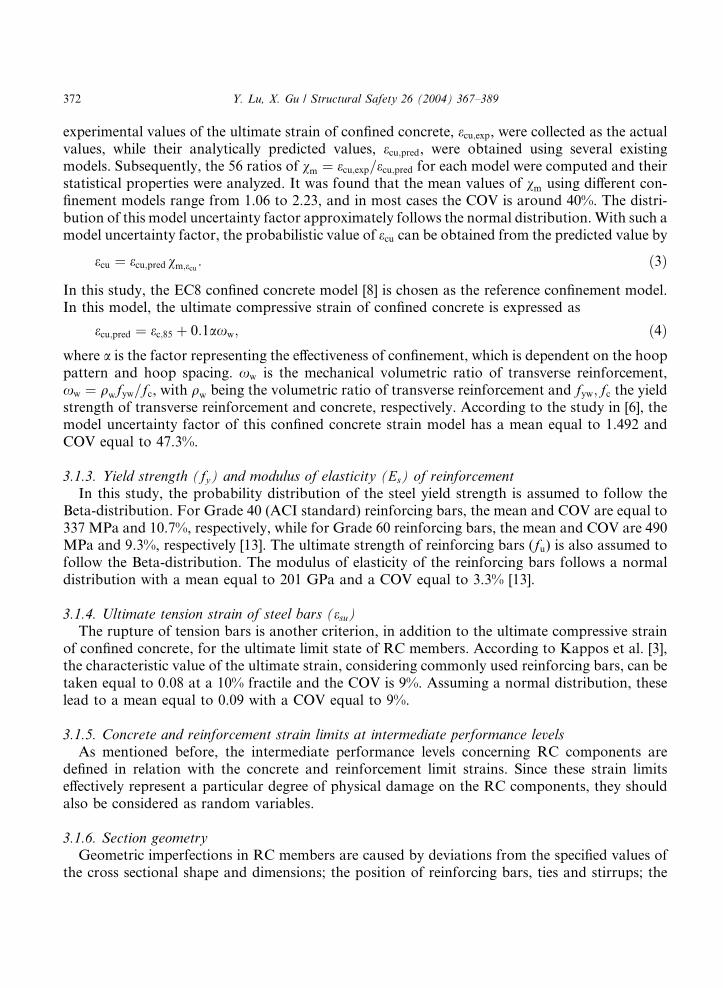
372 Y. Lu, X. Gu / Structural Safety 26 (2004) 367–389
experimental values of the ultimate strain of confined concrete, ecu;exp, were collected as the actualvalues, while their analytically predicted values, ecu;pred, were obtained using several existingmodels. Subsequently, the 56 ratios of vm ¼ ecu;exp=ecu;pred for each model were computed and theirstatistical properties were analyzed. It was found that the mean values of vm using different con-finement models range from 1.06 to 2.23, and in most cases the COV is around 40%. The distri-bution of this model uncertainty factor approximately follows the normal distribution. With such amodel uncertainty factor, the probabilistic value of ecu can be obtained from the predicted value by
ecu ¼ ecu;pred vm;ecu : ð3Þ
In this study, the EC8 confined concrete model [8] is chosen as the reference confinement model.In this model, the ultimate compressive strain of confined concrete is expressed as
ecu;pred ¼ ec;85 þ 0:1axw; ð4Þ
where a is the factor representing the effectiveness of confinement, which is dependent on the hooppattern and hoop spacing. xw is the mechanical volumetric ratio of transverse reinforcement,xw ¼ qwfyw=fc, with qw being the volumetric ratio of transverse reinforcement and fyw; fc the yieldstrength of transverse reinforcement and concrete, respectively. According to the study in [6], themodel uncertainty factor of this confined concrete strain model has a mean equal to 1.492 andCOV equal to 47.3%.3.1.3. Yield strength (fy) and modulus of elasticity (Es) of reinforcement
In this study, the probability distribution of the steel yield strength is assumed to follow theBeta-distribution. For Grade 40 (ACI standard) reinforcing bars, the mean and COV are equal to337 MPa and 10.7%, respectively, while for Grade 60 reinforcing bars, the mean and COV are 490MPa and 9.3%, respectively [13]. The ultimate strength of reinforcing bars (fu) is also assumed tofollow the Beta-distribution. The modulus of elasticity of the reinforcing bars follows a normaldistribution with a mean equal to 201 GPa and a COV equal to 3.3% [13].
3.1.4. Ultimate tension strain of steel bars (esu)The rupture of tension bars is another criterion, in addition to the ultimate compressive strain
of confined concrete, for the ultimate limit state of RC members. According to Kappos et al. [3],the characteristic value of the ultimate strain, considering commonly used reinforcing bars, can betaken equal to 0.08 at a 10% fractile and the COV is 9%. Assuming a normal distribution, theselead to a mean equal to 0.09 with a COV equal to 9%.
3.1.5. Concrete and reinforcement strain limits at intermediate performance levels
As mentioned before, the intermediate performance levels concerning RC components aredefined in relation with the concrete and reinforcement limit strains. Since these strain limitseffectively represent a particular degree of physical damage on the RC components, they shouldalso be considered as random variables.
3.1.6. Section geometryGeometric imperfections in RC members are caused by deviations from the specified values of
the cross sectional shape and dimensions; the position of reinforcing bars, ties and stirrups; the

Y. Lu, X. Gu / Structural Safety 26 (2004) 367–389 373
horizontality and verticality of concrete lines; the alignment of columns and beams, and so on.Among all the factors, the uncertainty of the section size is the most important one. Based onMirza and MacGregor [14], for a rectangular section, the height and width of the cross section canbe assumed to follow normal distribution with a mean value equal to the nominal value plus 1.6mm and a constant standard deviation equal to 6.4 mm to represent the in situ cast conditions.
3.1.7. Uncertainty in modelling plastic hinge length
When a RC member responds into inelastic stage, the inelastic rotation occurs over a lengthnear the critical section where the bending moment exceeds the yield moment of the section. Thisinelastic rotation is customarily represented by the product of the inelastic curvature at the criticalsection and an equivalent plastic length, Lp. Using elementary slope-deflection analysis, themember lateral drift ratio (in a sense representing the inter-storey drift ratio) can be expressed as
d ¼ 1
3uyZ þ u
�� uy
�Lp
Z � Lp=2
Z; ð5Þ
where / is the inelastic curvature at the response level concerned, /y is the yield curvature, and Zis the length measuring from the fixed end to the contra flexure of the member.
Most of the available data in the literature regarding Lp refers to the plastic hinge length at theultimate stage. Studies [15,16] tend to suggest that the equivalent plastic hinge length is almostindependent of variables such as the steel configuration, axial load level, amount of longitudinaland confining reinforcement, yield stress of longitudinal reinforcement, and concrete strength.Most of existing models for the calculation of the plastic hinge length relate Lp to the effectivedepth of cross section, d [15–17], or in a combined manner with the contra-flexure point height, Z[18–20]. Priestley and Park [16] also suggested that Lp be a function of Z and the maximum di-ameter of longitudinal bars, which to some extent represents the effect of slip of longitudinalreinforcement relative to the member fixed end (fixed-end rotation).
Combining the experimental data from [15–17] which were concerned about the RC memberinelastic response under cyclic/seismic conditions, the ‘‘measured’’ plastic hinge length (Lp) isplotted against D and Z, respectively, in Fig. 2(a) and (b). It can be observed that, in general, Lp
has a better correlation with Z than with D. Considering the physical implication of including therebar diameter to reflect the contribution of the fixed-end rotation in the total inelastic memberdeformation, a linear regression is performed to express the plastic hinge length as a function ofthe contra-flexure point height, Z, and the maximum diameter of longitudinal bars, db, as
Lp ¼ 0:077Z þ 8:16db: ð6Þ
Fig. 2(c) shows a comparison between the predicted Lp using the above formula and the exper-imental data. An improved correlation is observed despite the inherent scatter of the data. Inorder to account for the uncertainty arising from the modeling of Lp, a model uncertainty factor issubsequently introduced (denoted as vm;Lp). Based on the results shown in Fig. 2(c), the modeluncertainty factor associated with the use of Eq. (6) has a mean equal to unity and a COV equal to19.8%. By hypothesis test at a significance level of 5%, this model uncertainty factor can be de-scribed by a normal distribution. Thus, during the simulation analysis, each sample of Lp is takento be the value calculated from Eq. (6) multiplied by a randomly sampled Xm;Lp according to theabove distribution.
Pla
stic
hin
ge
len
gth
Lp
(m
m)
800 800
Pla
stic
hin
ge
len
gth
Lp
(m
m)
ExperimentalExperimental
Lp=0.5d600 600 Lp=0.168ZLp=1.0d
400 400
200 200
0 00 200 400 600 800 1000 2000 3000 40000
Section depth d (mm) Contra-flexure height Z (mm)
0
100
200
300
400
500
600
0 100 200 300 400 500 600
Predicted (Eq. 6) (mm)
Exp
erim
enta
l Lp
(mm
)
(a) (b)
(c)
Fig. 2. Comparison of experimental and predicted plastic hinge lengths: (a) Lp versus d, (b) Lp versus Z, and (c) Lp
predicted using Eq. (6).
374 Y. Lu, X. Gu / Structural Safety 26 (2004) 367–389
To obtain drift limits for intermediate performance levels according to Eq. (5), it is necessary todetermine the plastic hinge length at these performance levels. Considering the fact that the plastichinge zone develops with the increase of the level of the inelastic deformation, it is deemed ap-propriate to use a variable plastic hinge length for different performance levels. Because of lackingpertinent experimental data, and taking into account the ‘‘fixed-end rotation’’ contribution whichstarts to cumulate immediately following the occurrence of cracking at the ‘‘fixed end’’, anequivalent plastic hinge length of 0:5Lp is assumed for the yielding stage. A linear interpolationthen applies between the yield and ultimate stages
Lp;PL ¼ 1
2Lp þ
uPL � uy
uu � uy
!1
2Lp ¼
0:5 uu þ uPLð Þ � uy
uu � uyLp; ð7Þ
where Lp;PL denotes the plastic hinge length at a particular performance level; uPL is the corre-sponding section curvature.
3.2. Monte Carlo simulation of RC member behaviour
The behaviour of RC members can be predicted by means of structural analysis based on thematerial properties and member geometry. As the main variables are random in nature, the RC

Y. Lu, X. Gu / Structural Safety 26 (2004) 367–389 375
member behavioural parameters are probabilistic and their distributions can be simulated bymeans of Monte Carlo simulation. For randomly sampled values of the member properties, thesectional analysis is carried out using a computer program to obtain the response limits at dif-ferent performance levels. Subsequently, the statistical property of the system response can bederived based on the simulation results.
3.2.1. Section analysis
A computer program [4] for cyclic andmonotonic analysis of RC sections is adapted to carry outthe analysis in the simulation. The program is based on the fibre-element method, which is sche-matically shown in Fig. 1(a). An RC cross-section is divided into five groups (regions), in which thefirst and second groups are the bottom and top cover areas respectively, the third group is theconfined concrete area, the fourth group includes the remaining side cover areas, and the fifth groupconsists of all steel layers. For a given curvature, iteration is carried out until equilibrium is satisfiedconsidering individual material stress–strain constitutive relations. Different stress–strain modelsare applied for the confined concrete core and the unconfined concrete cover of the section.
Table 1
Details of specimens
Specimen A B C
Group 1: Varying geometry
Dimensions (mm) 300 · 300 400 · 400 500 · 500Concrete grade C25 C25 C25
Rebars 8D12.7 12D12.7 12D15.9
Rebar grade Grade 60 Grade 60 Grade 60
q‘ (%) 1.00 0.95 0.96
Hoops D9.5@150 D9.5@150 D9.5@140
Hoop grade Grade 40 Grade 40 Grade 40
qs (%) 1.23 0.81 0.78
axw 0.042 0.043 0.044
Confinement pattern
B D E F G
Group 2 (varying longi. reinforcement)& Group 3 (varying trans. reinforcement)
Section (mm) 400 · 400 400 · 400 400 · 400 400 · 400 400 · 400Concrete grade C25 C25 C25 C25 C25
Rebar grade Grade 60 Grade 60 Grade 60 Grade 60 Grade 60
Rebars 12D12.7 12D19.1 12D25.4 12D19.1 12D19.1
q‘ (%) 0.95 2.15 3.80 2.15 2.15
Hoops (mm) D9.5@150 D9.5@150 D9.5@150 D9.5@90 D12.7@90
Hoop bar grade Grade 40 Grade 40 Grade 40 Grade 40 Grade 40
qs (%) 0.81 0.81 0.81 1.34 2.09
axw 0.043 0.043 0.043 0.084 0.131
Confinement pattern
q is the reinforcement ratio while axw is the mechanical confinement ratio. Bar diameter of 9.5, 12.7 mm, 15.9 and
19.1 mm corresponds, respectively, to No. 3, No. 4, No. 5, and No. 6 reinforcing bars in ACI standard.

376 Y. Lu, X. Gu / Structural Safety 26 (2004) 367–389
3.2.2. Representative specimensThree groups of RC column specimens are selected to represent typical design details seen in
practice. Table 1 summarizes the details of the specimens.Group 1 consists of specimensA,B, andC,which have the same longitudinal reinforcement ratio and effective confinement (represented byaxw) but varying section dimensions; Group 2 includes specimens B, D, and E which have the sameconfining reinforcement (0.81%) but different longitudinal reinforcement ratios ranging from 0.95%to 3.8%. Group 3 includes specimens D, F, and G which have the same longitudinal reinforcement(2.15%) but different confining reinforcement ratios ranging from 0.81% to 2.09%.
Three axial force levels, with the axial force ratio (m) equal to 0.1, 0.2, and 0.4, respectively, areconsidered. The axial force ratio is defined as m ¼ N=fcbh, where N is the axial force, fc is theconcrete compressive strength, and bh denotes the sectional area.
A sample size of 1200 is found appropriate for the simulation. Hence, 1200 simulation runs areperformed for each specimen under a given axial force level. The simulation results are summa-rized and discussed in what follows.
4. Probabilistic distributions of RC member behaviour at different performance levels fromsimulation results
4.1. Yield strength and yield curvature
The yield state is defined when the longitudinal reinforcement first reaches the yield strain. Thestatistics of the simulated yield curvature are summarized in Table 2 (columns 2 and 3). It can beobserved that the yield curvature exhibits a small variability, with a COV ranging from 7% to10%. The COV of the yield moment is slightly higher, in the range of 10–15%. The low variabilityof the yield level response apparently is attributable to the low variability in the yield strain andstress of the longitudinal reinforcing bars which play a governing role on the yield level response.The distribution of the yield curvature can be described as normal distribution.
4.2. Sectional response at ultimate stage
The ultimate level is considered to have been reached when either the concrete compressivestrain at the extreme edge of the confined core reaches the ultimate strain, ecu, or the outmosttension bars reach the ultimate strain, esu. Typical histograms of the simulated ultimate curvatureare shown in Fig. 3. A summary of the mean and COV of the ultimate curvature for differentspecimens and under different axial force ratios is given in Table 2.
The ultimate curvature exhibits a large variability with COV on an order around 50%. This isattributable to the high variability of the ultimate strain of confined concrete which is affected byseveral basic random variables, especially its model uncertainty factor. It is noteworthy that theCOV for low axial force cases is reduced to the order of 30–35% due to increased chances for thereinforcement ultimate strain, which has a relatively low variability, to govern the ultimate state.The histograms of ultimate curvature shown in Fig. 3 suggest that most of the ultimate curvatures,especially in cases of higher axial force levels, follow normal distribution, and this is also provedby a skewness–kurtosis test.

Table 2
Normalized sectional curvature (multiplied by section depth) at different performance levels
Specimens Axial force
ratio (m)Yield Functional Damage Control Ultimate
Mean COV (%) Mean COV (%) Mean COV (%) Mean COV (%)
A 0.1 0.0044 8.8 0.0217 17.0 0.0627 33.4 0.1022 31.8
0.2 0.0049 8.3 0.0181 26.3 0.0413 43.9 0.0599 49.3
0.4 0.0058 9.1 0.0107 21.0 0.0226 46.4 0.0337 44.2
B 0.1 0.0045 8.2 0.0195 14.5 0.0640 31.0 0.1044 28.9
0.2 0.0049 7.9 0.0168 20.7 0.0503 43.3 0.0769 43.2
0.4 0.0059 8.9 0.0105 21.1 0.0302 49.6 0.0470 46.3
C 0.1 0.0047 7.5 0.0195 14.5 0.0636 31.4 0.1032 29.9
0.2 0.0051 7.6 0.0174 20.3 0.0511 44.5 0.0789 42.3
0.4 0.0060 8.4 0.0114 19.9 0.0295 50.8 0.0466 45.9
D 0.1 0.0045 7.9 0.0190 18.1 0.0545 41.2 0.0838 41.4
0.2 0.0052 8.2 0.0146 20.1 0.0403 44.9 0.0597 44.1
0.4 0.0060 9.0 0.0101 20.0 0.0291 50.3 0.0452 47.6
E 0.1 0.0052 10.7 0.0157 18.3 0.0418 43.7 0.0607 43.1
0.2 0.0055 9.1 0.0132 19.0 0.0366 47.2 0.0549 45.8
0.4 0.0062 9.0 0.0098 18.0 0.0281 51.1 0.0438 50.9
F 0.2 0.0053 8.5 0.0147 19.9 0.0611 40.3 0.0937 41.3
0.4 0.0061 8.7 0.0103 20.0 0.0486 48.0 0.0754 46.7
G 0.2 0.0053 8.3 0.0148 19.4 0.0751 30.4 0.1189 31.0
0.4 0.0061 8.7 0.0104 19.9 0.0706 38.7 0.1114 39.3
Y. Lu, X. Gu / Structural Safety 26 (2004) 367–389 377
From Table 2, it can be observed that the cross-section dimension (comparing A, B and C) haslimited influence on the normalized section curvatures (actual curvature multiplied by the sectiondepth) as well as their probabilistic distributions under a given axial force level. The general effectsof the longitudinal and transverse reinforcement are illustrated in Fig. 4(a). Note that concerningthe confinement effect only the axial force ratios of 0.2 and 0.4 are shown, as at lower axial forcelevel the normal confining effect of the transverse reinforcement calculated with Eq. (4) maybecome questionable due to a small compression zone. From the figures it can be seen that theeffect of varying longitudinal reinforcement on the ultimate curvature becomes less significantwith increase of the axial force ratio. This is because with higher axial forces the neutral axisdepth, which directly affects the ultimate curvature, becomes less sensitive to the longitudinalreinforcement. On the other hand, increasing the transverse reinforcement exhibits a continuousenhancement on the ultimate curvature, due to increased ultimate confined concrete strain whichgoverns the ultimate curvature in most cases.
4.3. Curvature at functional performance level
Crushing of compressive unconfined concrete and unacceptable residual crack widths are usedto define the Functional performance level for which easy repairing work is possible. In the presentstudy, a concrete compressive strain limit of 0.004 and a tensile reinforcement strain limit of 0.015

0.00
0.10
0.20
0.30
0 0.130 0.246 0.362 0.478
Sectional curvature (1/m)
Re
lativ
e fr
equ
en
cy
0.00
0.10
0.20
0.30
0.40
0 0.091 0.178 0.265 0.352 0.439
Sectional curvature (1/m)
Re
lativ
e fr
equ
en
cy
0.00
0.10
0.20
0.30
0.40
0.000 0.088 0.184 0.280 0.376 0.472
Sectional curvature (1/m)
Re
lativ
e fr
equ
en
cy
Axial force ratio = 0.1
0.00
0.10
0.20
0.30
0.00 0.07 0.17 0.26 0.36 0.46
Sectional curvature (1/m)
Re
lativ
e fr
equ
en
cy
0.00
0.10
0.20
0.30
0.000 0.100 0.208 0.316 0.424
Sectional curvature (1/m)
Re
lativ
e fr
equ
en
cy
0.00
0.10
0.20
0.30
0.00 0.07 0.16 0.25 0.34 0.42
Sectional curvature (1/m)
Re
lativ
e fr
equ
en
cy
Axial force ratio = 0.2
0.00
0.10
0.20
0.30
0.000 0.096 0.205 0.314 0.423
Sectional curvature (1/m)
Re
lativ
e fr
equ
en
cy
0.00
0.10
0.20
0.30
0.000 0.098 0.210 0.322 0.434
Sectional curvature (1/m)
Re
lativ
e fr
equ
en
cy
0.00
0.10
0.20
0.30
0 0.077 0.165 0.253 0.341 0.429
Sectional curvature (1/m)
Re
lativ
e fr
equ
en
cy
Axial force ratio = 0.4
Specimen A Specimen B Specimen C
Specimen B Specimen CSpecimen A
Specimen A Specimen CSpecimen B
(a)
0.00
0.10
0.20
0.30
0 0.085 0.187 0.289 0.391 0.493
Sectional curvature (1/m)
Re
lativ
e fr
equ
en
cy
0.00
0.10
0.20
0.30
0 0.108 0.237 0.366 0.495
Sectional curvature (1/m)
Re
lativ
e fr
equ
en
cy
0.00
0.10
0.20
0.30
0 0.118 0.223 0.328 0.433
Sectional curvature (1/m)
Re
lativ
e fr
equ
en
cy
Axial force ratio = 0.2
0.00
0.10
0.20
0.30
0 0.091 0.195 0.299 0.403
Sectional curvature (1/m)
Re
lativ
e fr
equ
en
cy
0.00
0.10
0.20
0.30
0 0.103 0.226 0.349 0.472
Sectional curvature (1/m)
Re
lativ
e fr
equ
en
cy
0.00
0.10
0.20
0.30
0 0.075 0.175 0.275 0.375 0.475
Sectional curvature (1/m)
Re
lativ
e fr
equ
en
cy
Axial force ratio = 0.4
Specimen GSpecimen FSpecimen D
Specimen GSpecimen D Specimen F
(b)
Fig. 3. Typical histograms of sectional curvature for specimens with different geometry or reinforcement details at
Ultimate level: (a) Specimens A, B, C (different cross-section dimensions) and (b) Specimens D, F, G (different confining
reinforcement).
378 Y. Lu, X. Gu / Structural Safety 26 (2004) 367–389

0.00
0.05
0.10
0.15
0.20
0.0 1.0 2.0 3.0 4.0 5.0
Longitudinal reinforcement ratio (%)
Mea
n c
urv
atu
re (
x s
ecti
on
d.)
axial force ratio=0.1
axial force ratio=0.2
axial force ratio=0.4
r s ≡0.81%
0.00
0.05
0.10
0.15
0.20
0.5 1.0 1.5 2.0 2.5
Confining reinforcement ratio (%)
Mea
n c
urv
atu
re (
x se
ctio
n d
.)
axial force ratio=0.2
axial force ratio=0.4
r l ≡2.15%
0.00
0.01
0.02
0.03
0.04
0.0 1.0 2.0 3.0 4.0 5.0
Longitudinal reinforcement ratio (%)
Mea
n c
urv
atu
re (
x se
ctio
n d
.) axial force ratio=0.1
axial force ratio=0.2
axial force ratio=0.4
r s ≡0.81%
0.00
0.01
0.02
0.03
0.04
0.5 1.0 1.5 2.0 2.5
Confining reinforcement ratio (%)
Mea
n c
urv
atu
re (
x se
ctio
n d
.)
axial force ratio=0.2
axial force ratio=0.4
r l ≡2.15%
0.00
0.05
0.10
0.15
0.0 1.0 2.0 3.0 4.0 5.0
Longitudinal reinforcement ratio (%)
Mea
n c
urv
atu
re (
x se
ctio
n d
.) axial force ratio=0.1
axial force ratio=0.2
axial force ratio=0.4
r s ≡0.81%
0.00
0.05
0.10
0.15
0.5 1.0 1.5 2.0 2.5
Confining reinforcement ratio (%)
Mea
n c
urv
atu
re (
x se
ctio
n d
.)
axial force ratio=0.1
axial force ratio=0.2
axial force ratio=0.4
r l ≡2.15%
(a)
(b)
(c)
Fig. 4. Variation of mean normalized sectional curvature at different performance levels with reinforcement details and
axial force ratios: (a) Ultimate curvature, (b) Functional curvature, and (c) Damage Control curvature.
Y. Lu, X. Gu / Structural Safety 26 (2004) 367–389 379
are used as the Functional performance limit criteria. The uncertainties of these limit strains aredescri- bed by a normal distribution with a COV equal respectively to 15% and 9%. The COVvalues are sele- cted such that they are consistent with those of the unconfined concrete com-pressive strength and the reinforcement yield strength with which the uncertainty of the Functionallimit most closely correlate.
With the above probabilistic properties, the probabilistic sectional curvature at the Functional
performance level can be simulated. Fig. 5 shows the typical histograms of the Functional per-formance level curvatures. The statistics of the simulation results are included in Table 2. Ac-cording to the hypothesis test, almost all the simulation results of the Functional section curvatureunder different axial force levels satisfy the normal distribution. From Table 2 it can be observedthat, despite a wide variation of the mean Functional curvature for different specimens, the COV isrelatively stable and in a majority of cases it falls between 15% and 20%, which is slightly higherthan the assumed COV for the limit concrete compressive strain. Examining the section responsedetails confirms that most of the samples are governed by the limit concrete strain at this

0.00
0.10
0.20
0.30
0.40
0 0.016 0.032 0.048 0.064
Sectional curvature (1/m)
Re
lativ
e fr
equ
en
cy
0.00
0.10
0.20
0.30
0.40
0.000 0.019 0.039 0.058 0.078
Sectional curvature (1/m)
Re
lativ
e fr
equ
en
cy
0.00
0.10
0.20
0.30
0.40
0.000 0.017 0.032 0.047 0.062
Sectional curvature (1/m)
Re
lativ
e fr
equ
en
cy
Axial force = 0.1
0.00
0.10
0.20
0.30
0.002 0.014 0.026 0.038 0.05 0.062 0.074
Sectional curvature (1/m)
Re
lativ
e fr
equ
en
cy
0.00
0.10
0.20
0.30
0.000 0.013 0.027 0.041 0.055 0.069
Sectional curvature (1/m)
Re
lativ
e fr
equ
en
cy
0.00
0.10
0.20
0.30
0.000 0.018 0.034 0.050 0.066
Sectional curvature (1/m)
Re
lativ
e fr
equ
en
cy
Axial force = 0.2
0.00
0.10
0.20
0.30
0.000 0.016 0.032 0.048 0.064
Sectional curvature (1/m)
Re
lativ
e fr
equ
en
cy
0.00
0.10
0.20
0.30
0.000 0.016 0.030 0.044 0.058 0.072
Sectional curvature (1/m)
Re
lativ
e fr
equ
en
cy
0.00
0.10
0.20
0.30
0.000 0.013 0.026 0.038 0.051 0.064
Sectional curvature (1/m)
Re
lativ
e fr
equ
en
cy
Axial force = 0.4
Specimen B Specimen D Specimen E
Specimen DSpecimen B Specimen E
Specimen B Specimen D Specimen E
Fig. 5. Typical histograms of simulated Functional level curvature.
380 Y. Lu, X. Gu / Structural Safety 26 (2004) 367–389
performance level. As shown in Fig. 4(b), the nominal Functional curvature practically is not af-fected by the confinement but decrease slightly with the increase of the longitudinal reinforcement.
4.4. Curvature for Damage Control performance level
ForDCperformance level, the limit tensile strain of longitudinal reinforcement is taken as 60%ofthe ultimate reinforcement strain, and it has a mean equal to 0.054 and COV equal to 9%. The limitcompressive strain of confined concrete, ðecÞlim;DC, obtained directly from Eq. (4), has a model un-certainty factor with COV equal to 47.3%.With these probabilistic DC limit criteria, the simulationis carried out and the statistics of the simulatedDC level curvature are listed in Table 2. Fig. 6 showssome typical histograms. Hypothesis tests show that the DC level curvature fits well the normaldistribution. The effect of longitudinal and transverse reinforcement on the nominal DC level cur-vature, plotted in Fig. 4(c), shows similar trends as observed at the ultimate stage.
5. Deterministic calculations of limit curvatures and assessment of their reliability
Having established the probabilistic distributions of the limit curvature for the specimens atdifferent performance levels, it is now possible to assess the reliability of the deterministic limit

0.00
0.10
0.20
0.30
0.000 0.064 0.126 0.190 0.254
Sectional curvature (1/m)
Re
lativ
e fr
equ
en
cy
0.00
0.10
0.20
0.30
0.000 0.065 0.143 0.221 0.299
Sectional curvature (1/m)
Re
lativ
e fr
equ
en
cy
0.00
0.10
0.20
0.30
0.000 0.055 0.121 0.187 0.253
Sectional curvature (1/m)
Re
lativ
e fr
equ
en
cy
Axial force ratio = 0.1
0.00
0.10
0.20
0.30
0.000 0.059 0.130 0.201 0.271
Sectional curvature (1/m)
Re
lativ
e fr
equ
en
cy
0.00
0.10
0.20
0.30
0.000 0.055 0.121 0.187 0.253
Sectional curvature (1/m)
Re
lativ
e fr
equ
en
cy
0.00
0.10
0.20
0.30
0.000 0.055 0.120 0.185 0.251
Sectional curvature (1/m)
Re
lativ
e fr
equ
en
cy
0.00
0.10
0.20
0.30
0.000 0.042 0.098 0.154 0.210 0.266
Sectional curvature (1/m)
Re
lativ
e fr
equ
en
cy
0.00
0.10
0.20
0.30
0.40
0.000 0.103 0.147 0.190 0.234 0.278
Sectional curvature (1/m)
Re
lativ
e fr
eq
uen
cy
Axial force ratio = 0.2
0.00
0.10
0.20
0.30
0.000 0.045 0.098 0.151 0.205 0.258
Sectional curvature (1/m)
Re
lativ
e fr
equ
en
cy
0.00
0.10
0.20
0.30
0.000 0.060 0.129 0.199 0.268
Sectional curvature (1/m)
Re
lativ
e fr
equ
en
cy
0.00
0.10
0.20
0.30
0.000 0.059 0.127 0.194 0.262
Sectional curvature (1/m)
Re
lativ
e fr
equ
en
cy
0.00
0.10
0.20
0.30
0.000 0.042 0.098 0.154 0.210 0.266
Sectional curvature (1/m)
Re
lativ
e fr
equ
en
cy
0.00
0.10
0.20
0.30
0.000 0.054 0.113 0.172 0.231 0.290
Sectional curvature (1/m)
Re
lativ
e fr
equ
en
cy
Axial force ratio = 0.4
Specimen D Specimen ESpecimen B
Specimen B Specimen D Specimen E
Specimen F Specimen G
Specimen DSpecimen B Specimen E
Specimen F Specimen G
Fig. 6. Typical histograms of simulated Damage Control level curvature.
Y. Lu, X. Gu / Structural Safety 26 (2004) 367–389 381
curvatures calculated using deterministic values of the material properties and other variablesinvolved.
A common deterministic calculation of the RC member deformation capacities for designverifications is to use nominal (mean) values of the limit strain properties in conjunction with the

382 Y. Lu, X. Gu / Structural Safety 26 (2004) 367–389
design material strengths without safety factors (i.e., the characteristic strength) for concrete andreinforcement. Since at different performance levels (depending also on the reinforcement detailsand the axial force ratios) the relative importance of the various influencing parameters could bedifferent, it can be expected that the reliability of the deterministic calculations could also vary.
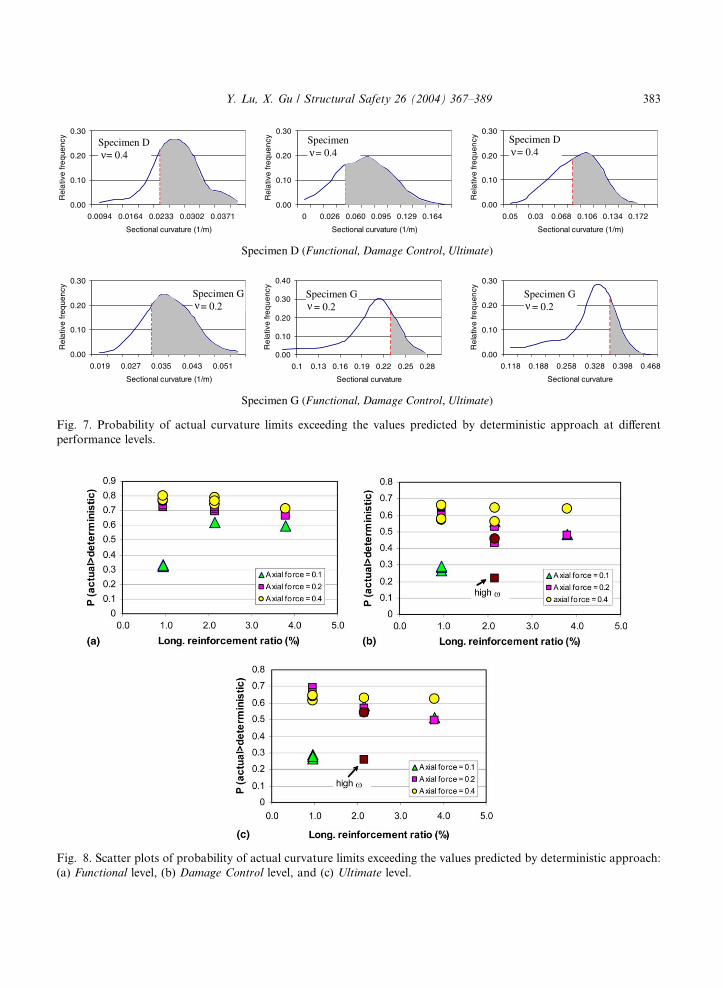
The deterministic limit curvature values calculated using the above-mentioned strain andstrength properties for the various specimens are tabulated in Table 3. By fitting the curvaturevalues onto the corresponding probability distributions as illustrated in Fig. 7, the probability ofthe deterministic predictions being exceeded by actual curvature limits can be obtained and theresults are summarized in Table 3. Fig. 8 depicts such probability results in the form of scatterplots.
As can be seen, the probability of the deterministic predictions being exceeded by the actualcurvature limits is not uniform. Whereas in most cases such probability is in the range of 50–70%,there are cases where the probability is only on the order of 30% for all performance levels.Further examination of the results reveals that these situations occur mainly at low axial forceratio and with low longitudinal reinforcement, or at medium axial force ratio (v ¼ 0:2) and with ahigh confinement. These are cases where the limit state is more likely to be governed by the re-inforcement limit strain. As the reduction ratio of the characteristic concrete strength from themean strength is markedly higher than that in the reinforcement strength due to a higher COV, a
Table 3
Predicted sectional curvature (multiplied by section depth) at different performance levels using deterministic approach
Specimens Axial force
ratio (m)Functional Damage Control Ultimate
Curvature
(·section d)
Probability
of being
exceeded (%)
Curvature
(·section d)
Probability
of being
exceeded (%)
Curvature
(·section d)
Probability
of being
exceeded (%)
A 0.1 0.0234 32.3 0.0762 26.3 0.1236 26.2
0.2 0.0145 77.5 0.0351 65.2 0.0492 68.1
0.4 0.0090 76.3 0.0214 56.9 0.0298 61.3
B 0.1 0.0207 33.3 0.0752 28.7 0.1216 29.1
0.2 0.0152 72.3 0.0456 60.3 0.0608 69.1
0.4 0.0093 77.1 0.0280 57.5 0.0397 64.1
C 0.1 0.0207 33.0 0.0750 28.9 0.1210 27.9
0.2 0.0151 73.8 0.0467 59.5 0.0655 66.0
0.4 0.0094 79.9 0.0241 65.8 0.0393 64.7
D 0.1 0.0173 62.1 0.0520 55.9 0.0772 58.2
0.2 0.0134 69.3 0.0399 52.8 0.0572 56.8
0.4 0.0091 74.4 0.0241 64.6 0.0386 63.2
E 0.1 0.0148 59.8 0.0432 48.2 0.0604 51.3
0.2 0.0121 66.9 0.0379 48.0 0.0556 49.3
0.4 0.0090 71.4 0.0235 63.9 0.0380 62.4
F 0.2 0.0134 71.5 0.0624 43.3 0.0908 54.0
0.4 0.0089 78.8 0.0460 56.2 0.0644 62.9
G 0.2 0.0134 72.7 0.0924 21.8 0.1432 25.7
0.4 0.0092 76.3 0.0744 45.8 0.1084 54.0
0.00
0.10
0.20
0.30
0.0094 0.0164 0.0233 0.0302 0.0371
Sectional curvature (1/m)
Re
lativ
e fr
eq
uen
cy
0.00
0.10
0.20
0.30
0 0.026 0.060 0.095 0.129 0.164
Sectional curvature (1/m)
Re
lativ
e fr
eq
uen
cy
0.00
0.10
0.20
0.30
0.05 0.03 0.068 0.106 0.134 0.172
Sectional curvature (1/m)
Re
lativ
e fr
equ
en
cy
Specimen D (Functional, Damage Control, Ultimate)
0.00
0.10
0.20
0.30
0.019 0.027 0.035 0.043 0.051
Sectional curvature (1/m)
Re
lativ
e fr
equ
en
cy
0.00
0.10
0.20
0.30
0.40
0.1 0.13 0.16 0.19 0.22 0.25 0.28
Sectional curvature
Re
lativ
e fr
eq
ue
ncy
0.00
0.10
0.20
0.30
0.118 0.188 0.258 0.328 0.398 0.468
Sectional curvature
Re
lativ
e fr
eq
uen
cy
Specimen G (Functional, Damage Control, Ultimate)
Specimen Dν = 0.4
Specimenν= 0.4
Specimen Dν = 0.4
Specimen G ν = 0.2
Specimen Gν = 0.2
Specimen Gν = 0.2
Fig. 7. Probability of actual curvature limits exceeding the values predicted by deterministic approach at different
performance levels.
Fig. 8. Scatter plots of probability of actual curvature limits exceeding the values predicted by deterministic approach:
(a) Functional level, (b) Damage Control level, and (c) Ultimate level.
Y. Lu, X. Gu / Structural Safety 26 (2004) 367–389 383

384 Y. Lu, X. Gu / Structural Safety 26 (2004) 367–389
larger compression zone depth is obtained in the deterministic calculation as compared to thatcorresponding to the mean material strength which should represent the average situation in thesimulation. Consequently, when the limit criteria turn to be governed by the reinforcement tensile
Fig. 9. Typical histograms of simulated drift limits at different performance levels.

Y. Lu, X. Gu / Structural Safety 26 (2004) 367–389 385
strain, the deterministic calculation of the curvature becomes higher than the average curvatureand hence a probability of being exceeded to be lower than 50%.
6. Probabilistic distribution of RC member drift and its deterministic calculation
With the establishment of the probabilistic models for the RC section curvature and the modeluncertainty for the plastic hinge length as described in the preceding sections, the probabilisticevaluation of the limit member drift ratios at different performance levels becomes straightfor-ward using Monte Carlo simulation based on Eqs. (5)–(7). For simplicity and without losinggenerality, the member length to the contra-flexure point, Z, is assumed to be half of a typicalstorey height (representing a frame column) and equal to 1600 mm.
Fig. 9 plots the typical histograms of the limit drift ratios at the three performance levels. Allthe probability distributions are tested to satisfy the normal distribution. A summary of the meanand COV of the limit drift ratios for all specimens are given in Table 4. Fig. 10 shows the variationof the mean drift ratios with the reinforcement details at different performance levels.
At the Functional performance level, the drift ratios are dominated by the elastic deformationwhile the plastic rotation is still insignificant; hence, the drift ratios exhibit a small COV (613.6%)and the mean value varies in a fairly narrow range from 1.03% to 1.34%. Thus, it appears to bereasonable to combine all results into a single group. The overall mean Functional drift ratio isfound equal 1.18% with a COV of 8.7%.
Due to large inelastic deformation, the limit drift ratios at DC performance level vary con-siderably among different specimens, with mean values in a range of 1.6–4.5% for axial force ratioequal to 0.2–0.4, while the COV vary between 30% to 40% in most cases. In general, the limit driftratio decreases with the increase of the axial force, and it increases progressively with the increase
Table 4
Drift ratios at different performance levels
Specimens Axial force
ratio (m)Functional Damage Control Ultimate
Mean COV (%) Mean COV (%) Mean COV (%)
B 0.1 0.0108 10.9 0.0327 31.8 0.0581 31.0
0.2 0.0106 12.2 0.0262 36.7 0.0438 42.8
0.4 0.0093 8.1 0.0174 32.9 0.0300 40.6
D 0.1 0.0113 13.3 0.0314 38.0 0.0557 40.7
0.2 0.0107 12.0 0.0250 37.4 0.0409 43.1
0.4 0.0096 8.4 0.0191 35.2 0.0336 42.5
E 0.1 0.0117 12.5 0.0292 38.9 0.0473 41.3
0.2 0.0109 11.3 0.0265 39.4 0.0432 44.6
0.4 0.0099 8.3 0.0206 37.3 0.0370 45.4
F 0.2 0.0106 11.5 0.0367 37.2 0.0622 42.8
0.4 0.0097 8.3 0.0298 39.3 0.0534 44.5
G 0.2 0.0106 11.1 0.0440 30.9 0.0782 34.9
0.4 0.0097 8.1 0.0410 35.4 0.0767 40.9

Fig. 10. Variation of mean drift ratios at different performance levels with reinforcement details and axial force ratios:
(a) Functional drift, (b) Damage Control drift, and (c) Ultimate drift.
386 Y. Lu, X. Gu / Structural Safety 26 (2004) 367–389
of the confining reinforcement. On the other hand, the variation of the longitudinal reinforcementratio appears to have less effect on the drift ratio, especially for higher axial force cases, for similarreasons as explained with the sectional curvature.
At the Ultimate performance level, the COV of the ultimate drift ratios slightly further in-creased from the DC level to a range of 30–45%. The mean ultimate drift ratios vary in the rangeof 3.0–8.0% for different specimens.
The drift ratios are also predicted using the aforementioned deterministic approach, with aplastic hinge length equal to the value calculated according to Eqs. (6) and (7) without consideringthe model uncertainty. Table 5 summarizes the deterministic calculation results and the

Table 5
Predicted drift ratio limits using deterministic approach and associated probability
Specimens Axial force
ratio (m)Functional
level
Probability of
being exceeded
(%)
Damage
Control
Probability of
being exceeded
(%)
Ultimate
level
Probability of
being exceeded
(%)
B 0.1 0.0113 31.5 0.0379 31.0 0.0679 29.5
0.2 0.0101 63.1 0.0240 60.3 0.0363 64.1
0.4 0.0095 42.0 0.0173 52.7 0.0262 63.5
D 0.1 0.0114 55.9 0.0305 55.4 0.0527 56.1
0.2 0.0103 62.2 0.0246 53.4 0.0402 52.2
0.4 0.0097 45.3 0.0173 61.7 0.0292 63.3
E 0.1 0.0114 56.5 0.0298 48.4 0.0479 49.3
0.2 0.0105 61.6 0.0270 49.1 0.0446 47.8
0.4 0.0099 47.7 0.0186 61.8 0.0321 62.9
F 0.2 0.0102 65.0 0.0370 50.3 0.0616 52.0
0.4 0.0097 52.2 0.0292 53.7 0.0456 63.3
G 0.2 0.0106 65.8 0.0528 25.7 0.0950 27.4
0.4 0.0098 48.2 0.0437 43.6 0.0737 54.8
Fig. 11. Scatter plots of probability of actual drift limits exceeding the values predicted by deterministic approach: (a)
Functional level, (b) Damage Control level, and (c) Ultimate level.
Y. Lu, X. Gu / Structural Safety 26 (2004) 367–389 387

388 Y. Lu, X. Gu / Structural Safety 26 (2004) 367–389
corresponding probability of being exceeded by the actual limit drift ratios. The above probabilityresults are also plotted in Fig. 11 to show their scatter.
Similar to the observation from the curvature calculations, the probability of the deterministiclimit drift ratios being exceeded by the actual limit values are not uniform under different designconditions, even at the same performance level. In most cases, such probability falls in the rangeof 45–65%; however, for cases where the performance limit is more likely to be governed by thereinforcement strain, the above probability drops to only about 25% for reasons explained before.
7. Conclusions
The probabilistic distributions of the RCmember behaviour at both sectional andmember levelsare investigated for different performance levels. The mean values and the COV for the perfor-mance limit curvatures and drift ratios for various member design details and under different levelsof axial force are obtained. On this basis, the reliability of the deterministic calculations of therespective limits is assessed. Based on the results, the following conclusions may be drawn:(a) The RC member behaviour at the Yield level has a small variability. The COV of the yield
curvature and yield moment is in the range of 7–10% and 10–15%, respectively. The COVof the limit curvature at the Functional performance level slightly increases to about 15–20%. The Functional drift ratio, after combining the results from all specimens, gives a meanof 1.18% and a low COV equal to 8.7%.
(b) Due to the involvement of confined concrete, the variability of the sectional curvature andmember drift at the Damage Control level increase considerably. The COV is in the rangeof 40–45% for higher axial force cases (m¼ 0.2–0.4), and it reduces to the order of 30% atlow axial force ratio (m¼ 0.1). The variability of the limit curvature and drift increases slightlyfurther at the Ultimate level. The limit curvature and drift at both DC and Ultimate levels canbe approximated by the normal distribution.
(c) The predicted limit curvature and drift values using the deterministic approach with charac-teristic material strengths and nominal limit strain values are shown to have a probability ofbeing exceeded by the respective actual capacities in a range of 50–70% for most cases at allperformance levels. However, care should be exercised in predicting the limit curvature anddrift using the above deterministic approach for cases where the state is likely to be governedby the reinforcement strain, for example with a low longitudinal reinforcement ratio (e.g.,0.81%) and at low axial force level (e.g., m ¼ 0:1), or at relatively lower axial force (e.g.,m ¼ 0:2) but the confining reinforcement ratio is high. The results indicate that the determin-istic calculations in these cases could result in only 25–30% probability of being exceeded bythe actual limit capacities. In such cases, a reduction factor may have to be considered on thedeterministic predictions in order to maintain a consistent reliability level.
References
[1] Priestley MJN. Performance based seismic design. In: Proceedings of the 12th World Conference of Earthquake
Engineering, Auckland, New Zealand, January 31 –February 4, 2000 (in CD-ROM).
Y. Lu, X. Gu / Structural Safety 26 (2004) 367–389 389
[2] Trezos CG. Reliability considerations on the confinement of RC columns for ductility. Soil Dyn Earthquake Eng
1997;16:1–8.
[3] Kappos AJ, Chryssanthopoulos MK, Dymiotis C. Uncertainty analysis of strength and ductility of confined
reinforced concrete members. Eng Struct 1999;21:195–208.
[4] Zhang G, Lu Y. CABAC: A fibre-element based program for cyclic analysis of RC beam-column members. Project
Report 93-1, Laboratory of Concrete Structures, National Technical University of Athens, Greece, 1993.
[5] OES California Office of Emergency Services. Vision 2000: Performance based seismic engineering of buildings.
Structural Engineers Association of California, Sacramento, CA, 1995.
[6] Dymiotis C. Probability seismic assessment of reinforced concrete buildings with and without masonry infills.
Ph.D. Thesis, Imperial College of Science, Technology and Medicine, 1999.
[7] Tassios TP. Response of RC critical regions under large amplitude reversed actions. Bulletin D�Information, No.
161, Cometi Euro-International Du Beton, 1993.
[8] Eurocode 8 Background Document, Justification note No. 13: Confined concrete constitutive law. CEC DG III/
8076/89 EN, 1989, p. 104–16.
[9] Kowalsky MJ. Deformation limit states of circular reinforced concrete bridge columns. J Struct Eng, ASCE
2000;126(8):869–78.
[10] Chavez M, De Leon D. Reliability of nonlinear systems with uncertain parameters and random seismic excitation.
In: Proceedings of the 8th World Conference on Earthquake Engineering, San Francisco, July 4, 1984, p. 435–41.
[11] Luo YH, Durrani A, Conte J. Seismic reliability assessment of existing RC flat-slab buildings. J Struct Eng, ASCE
1995;121(10):1522–30.
[12] Mirza SA, Hatzinkolas M, MacGregor JG. Statistical description of strength of concrete. J Struct Div, ASCE
1979;105(6):1021–37.
[13] Mirza SA, MacGregor JG. Variability of the mechanical properties of reinforcing bars. J Struct Div, ASCE
1979;105(5):921–37.
[14] Mirza SA, MacGregor JG. Variation in dimensions of reinforced concrete. J Struct Div, ASCE 1979;105(4):751–
66.
[15] Sheikh SA, Shah DV, Khoury SS. Confinement of high-strength concrete columns. ACI Struct J 1994;91(1):100–
11.
[16] Priestley MJN, Park R. Strength and ductility of concrete bridge columns under seismic loading. ACI Struct J
1987;84(1):61–76.
[17] Oguzhan B. Seismic performance of rectilinearly confined high strength concrete columns. Ph.D. Thesis, University
of Toronto, 1999.
[18] Sawyer HA. Design of concrete frames for two failure states. In: Proceedings of the International Symposium on
the Flexural Mechanics of Reinforced Concrete, ASCE–ACI, Miami, November 1964, p. 439–56.
[19] Corley WG. Rotational capacity of reinforced concrete beams. J Struct Div, ASCE 1966;92(5):121–46.
[20] Mattock AH. Discussion of ‘‘Rotational capacity of reinforced concrete beams’’ by Corley WG. J Struct Div,
ASCE 1967;93(2):519–22.