Embed Size (px)
Citation preview

Probability Probability & Odds& Odds
Surveys & Surveys & SamplesSamples
Measures of Measures of central central tendencytendency
Stem-and-Stem-and-Leaf Plots & Leaf Plots & HistogramsHistograms
Box-and-Box-and-whisker Plotswhisker Plots
100 100 100 100 100
200 200 200 200 200
300 300 300 300 300
400 400 400 400 400
500 500 500 500 500

Probability & Odds
• What is the probability of rolling a dice and getting a number less than 5?
Back
100

Probability & Odds
• You spin the spinner 20 times. It stops on an odd number 8 times. What is the experimental probability of stopping on an odd number?
Back
200

Probability & Odds
• What are the odds in favor or picking a blue ball from the box?
Back
300

Probability & Odds
• What is the probability of spinning a multiple of 2?
Back
400

Probability & Odds
• What are the odds against drawing a face card in a standard deck of cards?(Face cards are jack, queen, king)
Back
500
Surveys & Samples
• “Do you prefer creamy macaroni and cheese or bland rice?”Is this question bias? Justify your answer.
Back
100
Surveys & Samples
• In an effort to reduce the occurrence of late payments, a credit card company wants to gather information. Every 20th customer in their database is called.What is the sampling method?
Back
200
Surveys & Samples
• A community hospital conducts a survey to determine patient satisfaction. One hundred patients are randomly selected to complete the survey.Identify the population and sample.
Back
300
Surveys & Samples
• Your school is conducting a survey on a proposed dress code. The first 20 students entering the school in the morning are surveyed. What type of sampling method is used?
Back
400
Surveys & Samples
• In a survey about the need to improve driver safety, 50 randomly selected adults at a senior-citizen resident facility were asked, “Do you think driver safety would improve if drivers were required to pass a driving test every ten years when renewing a driver’s license?”Is the sampling method likely to result in a biased sample? Explain your reasoning.
Back
500

Measures of Central Tendency
• What is the range of the data set?
4, 9, 13, 6, 2, 5, 8, 3, 15, 6, 18, 15, 14
Back
100
Measures of Central Tendency
• What is the mode of the data set?
43, 32, 55, 44, 41, 32, 55, 57, 62, 55, 61
Back
200

Measures of Central Tendency
• What is the sum of the median and mode of the data set?
43, 32, 55, 44, 41, 32, 55, 57, 62, 55, 61
Back
300

Measures of Central Tendency
• You have scored 67, 89, 75, and 91 on four of your five tests for the semester. You have set the goal of having a test average of 82 or better. What is the lowest test score you can get and still meet your goal?
Back
400
Measures of Central Tendency
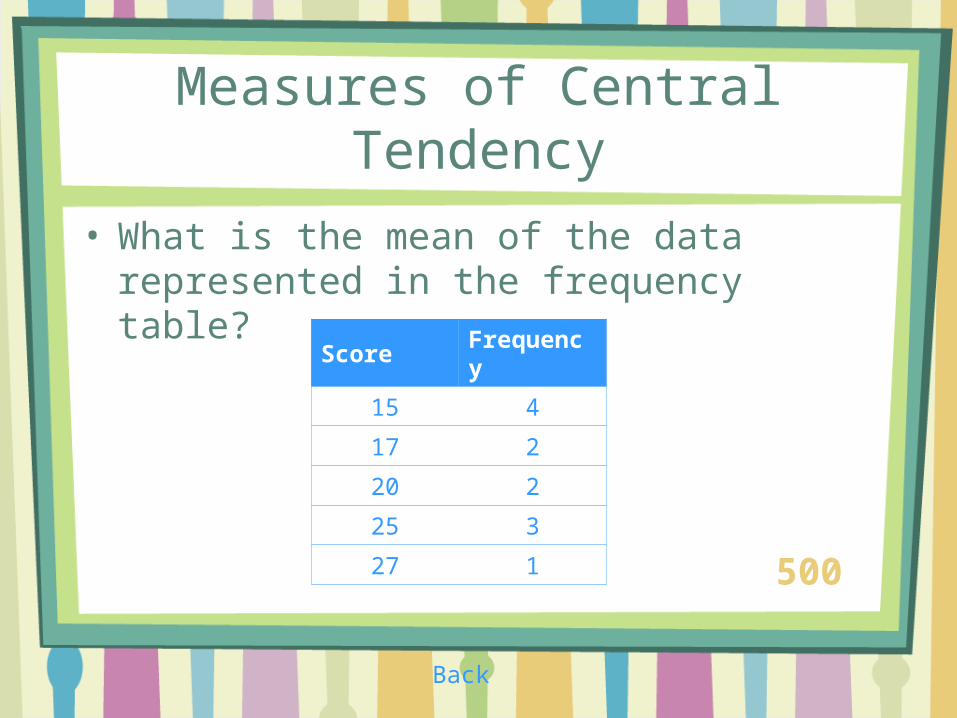
• What is the mean of the data represented in the frequency table?
Back
500
ScoreFrequency
15 4
17 2
20 2
25 3
27 1

S-&-L and Histograms
• Describe the distribution of the stem-and-leaf plot.
Back
100

S-&-L and Histograms
• What is the range of the data set represented in the stem-and-leaf plot?
Back
200

S-&-L and Histograms
• How many babies weighed less than 120 ounces?
Back
300

S-&-L and Histograms
• What is the sum of the range of data set A and the range of data set B?
Back
400
SET A SET B

S-&-L and Histograms
• Give an example of intervals that you could use when making a histogram from the data set.47, 45, 53, 56, 54, 43, 47, 55, 50, 42, 53, 41
Back
500

Box-and-Whisker Plots
• Approximately what percent of the data is greater than 39?
100
Back

Box-and-Whisker Plots
• Identify the lower quartile, upper quartile, and median from the box-and-whisker plot.
200
Back

Box-and-Whisker Plots
• What is the interquartile range?
300
Back

Box-and-Whisker Plots
• Identify any outliers.
400
Back

Box-and-Whisker Plots
• Identify any outliers.
500
Back