Embed Size (px)
Citation preview
Performance Tuning: What Every WebFOCUS Customer Should Know
Part 2: WebFOCUS Client
Lori PieperInformation Builders
Information Builders Summit 2016 User ConferenceJune 13 - 17, 2016
Author: Lori Pieper
Company: Information BuildersPresentation Title: Performance Tuning: What Every WebFOCUS Customer Should Know – Part 2: WebFOCUS Client
Presentation Abstract: WebFOCUS depends upon many other systems and databases, so when things begin to slow down, how do you know where to start? In Part 1, we looked at how to use the Web Console to monitor the usage and performance of the WebFOCUS Reporting Server. In Part 2, we’ll extend what we learned, and see how the Session Monitor on the WebFOCUS Client can be used in conjunction with the Web Console. We’ll then explore a couple of other topics that can help improve performance.
Business Need: Your developers and/or users come to you and say, “WebFOCUS is slow.” What do you do? Where do you begin? This presentation will give you several steps you can take to monitor the current usage level of the WebFOCUS Client, and show you some quick hit techniques to alleviate some common bottlenecks.
Performance Tuning Page 1 of 72 5/9/2023Copyright © 2015 Information Builders

Table of Contents
First Step: Do Some Investigative Work................................................................3Understanding the WebFOCUS Architecture........................................................4
Development and User Tier...............................................................................4Performance Considerations..........................................................................5
Web Tier............................................................................................................6Performance Considerations..........................................................................7
Data Access Tier...............................................................................................7Performance Considerations........................................................................10
WebFOCUS Client Performance Tuning Lab......................................................11Step 1 – Sign into WebFOCUS and access the WebFOCUS Client Session Monitor.............................................................................................................11Step 2 – Explore how the Session Monitor works in general...........................15Step 3 – Using the Session Monitor to monitor usage.....................................21Step 4 – The Session Viewer...........................................................................26
A closer look at the Session Viewer.............................................................27Additional information that can help you navigate the Session Viewer........31
Step 5 – Using the Client Session Monitor in conjunction with the WebFOCUS Reporting Server Agent Monitor......................................................................34Step 6 – Run with multiple user sessions........................................................49Step 6 – Explore other WebFOCUS Client performance tidbits.......................57
SQL Tracing.................................................................................................57On-Demand Paging.........................................................................................61
Appendix – Miscellaneous Performance Tidbits..................................................67View Generated SQL.......................................................................................67
The SQL tracing option................................................................................67The Developer Studio Option.......................................................................68
Run Deferred Option........................................................................................70WebFOCUS Hyperstage..................................................................................72
Performance Tuning Page 2 of 72 5/9/2023Copyright © 2015 Information Builders

First Step: Do Some Investigative Work
You will see that there are many aspects to the WebFOCUS architecture and there are many factors in the environment that can improve overall performance or hinder that performance. Your first step in identifying a performance bottleneck is to do some investigative work to narrow the scope. These are questions based upon examples of real life performance bottlenecks that I have seen at customer sites:
Is everyone having issues or is it a subset of users? If it is a subset of users:o Are the users who are experiencing issues accessing WebFOCUS from
inside the firewall or outside? This could indicate a network issue.
o Are they using wired internet access or wireless?This could indicate an issue between wired and wireless.
o Are they on location or off site in the field, maybe using VPN.This could indicate an issue with off-site networking.
o Is it just the developers?This could be an issue with the development environment, which is sometimes set up on a smaller, less robust machine.
o Is it just the advanced ad hoc users using web-based tools like InfoAssist?This could point to an issue on the WebFOCUS Client tier.
Are all reports running slow or is it just a few reports? If it is just a few reports:o Are the slow reports running against a specific data source?
This could indicate the data source needs tuning or maybe the data source is your transaction system and you need to set up a data mart.
o Are the reports being run at a specific time?Maybe they are running at peak periods and they need to run in deferred mode. Maybe they need to be scheduled using ReportCaster to run once overnight, and then distributed to all those users who need it.
o Is it the actual report running slowly or are the launch pages controlling the user-entered selection criteria slow?If it’s the launch pages, then the HTML pages need to be investigated, not the report itself.
o Is the individual report slow or is it only slow when running in the BI Portal?This could indicate a bottleneck in the design of the Portal or on the WebFOCUS Client tier.
Performance Tuning Page 3 of 72 5/9/2023Copyright © 2015 Information Builders

Once you have some basic information, you can narrow your search for the performance bottleneck, as we will see.
Understanding the WebFOCUS Architecture
Nothing we do in this lab will make sense without an understanding of the WebFOCUS architecture.
WebFOCUS has three main components:1) Development and User Tier:
a. For developers - App Studio or Developer Studiob. For all other users – web browser
2) Web Tier - WebFOCUS Client, web server (optional), and web application server
3) Data Access Tier - WebFOCUS Reporting Server (WFRS) and the data source
We’ll briefly look at each one from a performance point of view.
Development and User TierDevelopers use App Studio (WebFOCUS Release 8.0 Version 08 and higher) or Developer Studio (WebFOCUS versions prior to 8.2.x) for WebFOCUS development. A web browser is also needed to build and test the BI Portal, to
Performance Tuning Page 4 of 72 5/9/2023Copyright © 2015 Information Builders

access the Web Console, and to test the user experience. Most work will likely be done in the development tools.
Basic (run only) and Advanced (InfoAssist) users will only need a browser on their desktops. Supported browser versions vary by WebFOCUS version. Use the Technical Support site to check browser version support: https://techsupport.informationbuilders.com/tech/wbf/wbf_release_information.html You will be required to sign into the Information Builders Technical Support site to access this information.
Performance Considerations In general, on the development/user tier, the users’ machines will be a factor in performance, as will the network speed and capacity. The developers will require a faster machine with more CPU and memory than the basic or advanced users. Users using InfoAssist will need more memory than a basic user.
If the machine itself appears to have sufficient capacity, then look at the network for performance bottlenecks. Also compare wired internet performance to wireless internet; inside the firewall versus outside the firewall, etc. I have seen as large as a 30 second delay at some customer sites between the wired and the wireless network.
If a specific user is having performance issues, look at what else they are running on their machines when they experience slowness. Use tools like Task Manager on Windows® to see available machine capacity. The user/developer may have a high performance machine, but depending upon what else they are running on that machine, they may still have limited machine capacity available for reporting/development.
WebFOCUS allows you to create reports that will output to third-party tools, such as Excel®, PowerPoint®, and Adobe® PDF. These may require additional machine capacity. Even the browser itself may prove to be a bottleneck if the report returns excessive amounts of data, which we’ll talk more about later.
NOTE: I usually only look at the users’ machine capacity when the perceived performance issue is isolated to a couple of users. Similarly, if there are only a couple of users having issues, I usually look at their specific network connection for performance bottlenecks. If the overall network was slow, slow performance would be more widespread.
Performance Tuning Page 5 of 72 5/9/2023Copyright © 2015 Information Builders

Web TierWhen referring to the web tier here, I am referring to the web servers, the web application servers, as well as the WebFOCUS Client. There are many possible configurations with these components, including the use of reverse proxies and web servers outside the firewall, network routing, etc. Any one of these could be the source of a bottleneck. So in order to not rule anything out, I lump them all into the web tier.
The WebFOCUS Client, as the name infers, is a web application and is hosted in a web application server. The web and web application servers supported are varied, but we test and certify versions of IIS/Tomcat™, Tomcat stand-alone, WebLogic®, WebSphere®, and JBoss®. Please refer to the Information Builders Technical Support site for the latest information on web application server support for the various versions of WebFOCUS.
The WebFOCUS Client provides you with: Managed Reporting so you can easily organize your reporting content
into a folder structure and apply the necessary security that makes sense for your business. The environment is inherently secured. You cannot access it without some form of identity authentication. You have complete flexibility in defining the security policy you choose to use.
InfoAssist to provide a way for business users and advanced users to do their own ad hoc report development and information discovery.
BI Portal so you can organize your reporting content into a portal, making it easy for your users to find the information they need to do their day-to-day jobs.
ReportCaster to allow you to schedule your reports to run at developer/user defined intervals and be distributed to your users via email, ftp, printer, back to the Managed Reporting content, or to the Report Library.
Report Library provides a way to take the report output from ReportCaster and store it in the WebFOCUS repository for users to view. This can provide a more secure method of distributing report output than email. By default, the Library will retain multiple versions of the output. What you see in the Library is the way the data looked when the report was run, not as the data appears if the report were run again today. This is very useful for auditing purposes.
The WebFOCUS Client Repository contains the above content plus the security information. This is all stored in a relational database. The WebFOCUS Client Repository is accessed via a JDBC connection and is accessed directly by the
Performance Tuning Page 6 of 72 5/9/2023Copyright © 2015 Information Builders

WebFOCUS Client application. In other words, the connectivity between the WebFOCUS Client and the repository RDBMS is direct and does not go through WebFOCUS Reporting Server.
Other than the ReportCaster process, the WebFOCUS Client has no process that runs standalone. The WebFOCUS Client is a web application and is therefore deployed to, and runs under, your web application server. You start and stop the WebFOCUS Client application through the web application server.
Performance ConsiderationsThe web and web application server need to be tuned for maximum performance. Sluggish response time in the BI Portal, while running a report, and most notably in InfoAssist, can be an indication of a performance bottleneck in the web application server. It is often memory related. Work with your web application server administrator to tune the web application server to support the WebFOCUS usage at your site.
The RDBMS used for the WebFOCUS Repository should be able to return the WebFOCUS content quickly. Delays in WebFOCUS when you are retrieving content information from or saving content to the repository can be a reflection of database performance. Test the access from the WebFOCUS Client machine to the RDBMS machine independent of WebFOCUS to ensure sufficient response time. Slow response time between the WebFOCUS Client machine and the RDBMS may indicate a need for RDBMS tuning, or it could indicate a sluggish network.
It is not recommended that the RDBMS reside on the same machine as the web and web application servers, as they may compete for machine capacity. However, if the machine has been sufficiently sized to accommodate the needs of the RDBMS, as well as the web and web application server, then you may be okay.
Data Access TierWhen referring to the data access tier, I am including the WebFOCUS Reporting Server as well as the data source, as either of these could be the source of a performance bottleneck.
The WebFOCUS Reporting Server can reside on the same machine as the WebFOCUS Client or on a separate machine.
Performance Tuning Page 7 of 72 5/9/2023Copyright © 2015 Information Builders

The benefits of them residing on the same machine are: They can share the same APP folder structure. You have only one machine to maintain. This will eliminate any impact of poor performance because of network
latency between the WebFOCUS Client and Reporting Server machines.
The benefits of them residing on separate machines are: The needs of the WebFOCUS Client processing will not compete with the
needs of the WebFOCUS Reporting Server processing. The machines can be independently tuned and sized for the specific
needs of each component. The WebFOCUS Reporting Server may be licensed by machine cores.
You can reserve all core capacity for the Reporting Server if the components are on separate machines.
The WebFOCUS Client is not licensed by machine size, so you can add cores and memory as needed.
We will assume they are on separate machines for the purposes of this discussion.
The WebFOCUS Reporting Server (WFRS) accepts the request from the WebFOCUS Client, at which point an agent on the WebFOCUS Reporting Server is started or activated. Each agent requires machine capacity, in terms of CPU, memory, and disk space. The amount of CPU, memory, and disk space is dependent upon the report request itself. There is a minimum amount of memory required to simply start up the agent and this minimum will vary by platform and version of WebFOCUS, but it’s usually around 15MB per agent.
The image below shows the Workspace tab from the WebFOCUS Reporting Server web console, showing the WFRS agent activity. This will be our primary tool for identifying performance bottlenecks in Part 1 of the lab. (The agents can also be referred to as threads into the Reporting Server.)
Performance Tuning Page 8 of 72 5/9/2023Copyright © 2015 Information Builders

For each request, the WFRS parses the request and then passes the data request to the appropriate data adapter. The data adapter translates the request into an optimized request using the appropriate language for the data source. For instance, a request to Microsoft SQL Server® will generate SQL using any SQL extensions specific to Microsoft SQL Server, thus providing an optimized request for Microsoft SQL Server. Similarly, a request to SAP BW® will translate the data request into SAP certified MDX query requests, and a request to Salesforce.com® will create the appropriate Partner WSDL web service request, using the approved Salesforce.com API, etc.
Even just considering the primary RDBMS databases, like Microsoft SQL Server, Oracle®, and DB2®, you may see different SQL generated, because the WebFOCUS data adapters will take advantage of the database-specific SQL extensions in order to optimize the data request sent to the database.
Once data is returned from the data source, WebFOCUS will do any additional processing needed, like:
Adding additional business logic through creating virtual columns, creating a matrix report, applying totals and subtotals, etc.
Applying any sorting or selection criteria that the database couldn’t do. Adding styling, like headers, footers, titles, etc. Preparing the results to be viewed in the selected output format, e.g.,
HTML, Excel, PDF, etc.
Performance Tuning Page 9 of 72 5/9/2023Copyright © 2015 Information Builders

Once this is all complete, WebFOCUS will send the data back to the WebFOCUS Client application for presentation to the user.
Performance ConsiderationsThe primary area for overall WebFOCUS performance bottlenecks is in the data access tier, since it is usually doing the most work. There are many areas that can cause performance bottlenecks:
• WFRS may need to be tuned for optimal performance. Use a load/stress testing tool to determine the best reporting server settings (See the Appendix for more information on the WebFOCUS stress test tool.):
• Should you limit the maximum number of agents and allow queuing?• Do you need to set a separate service for long running reports and
give them a lower priority?• Can you allow more agents to run simultaneously?
• WFRS sends the data request to the data source. The data source itself may need tuning.
• The request provided to WebFOCUS by the developer/user may need to be tweaked to be more efficient.
• Excessive use of virtual columns can cause the data request to be slow.
• Requesting data from disparate data sources will cause WebFOCUS to manage the join instead of the database.
• Processes like ReportCaster jobs may be competing for resources and should be run overnight or during non-peak hours.
• Excessive use of WebFOCUS internal databases (HOLD files) may be competing for machine power. Consider holding the data to the data source itself, e.g., by using the SameDB output option.
• The WFRS itself may need more machine capacity, memory, and/or cores to support the reporting needs.
Performance Tuning Page 10 of 72 5/9/2023Copyright © 2015 Information Builders

WebFOCUS Client Performance Tuning LabIn Part 1 of this lab series, we looked at how we identify bottlenecks in the WebFOCUS Reporting Server. Let’s now look at monitoring the WebFOCUS Client activity to see what it can tell us.
Business Scenario: You have gotten a few complaints from users that WebFOCUS is slow. You have asked the investigative questions to help you identify if this is user-machine specific, web-tier specific, server specific, or report specific. You have already looked at performance on the reporting server and now you are ready to investigate on the WebFOCUS Client.
Step 1 – Sign into WebFOCUS and access the WebFOCUS Client Session Monitor
1. From the lower left-hand corner of the desktop task bar, select the Internet Explorer icon:
This will open an IE Browser window and the default home page will be the WebFOCUS Portal Sign In page. We will be able to access the Client Administration console and the Client Session Monitor from this new browser window.
Note: We use Internet Explorer so we can log in as different users and keep the session IDs separate.
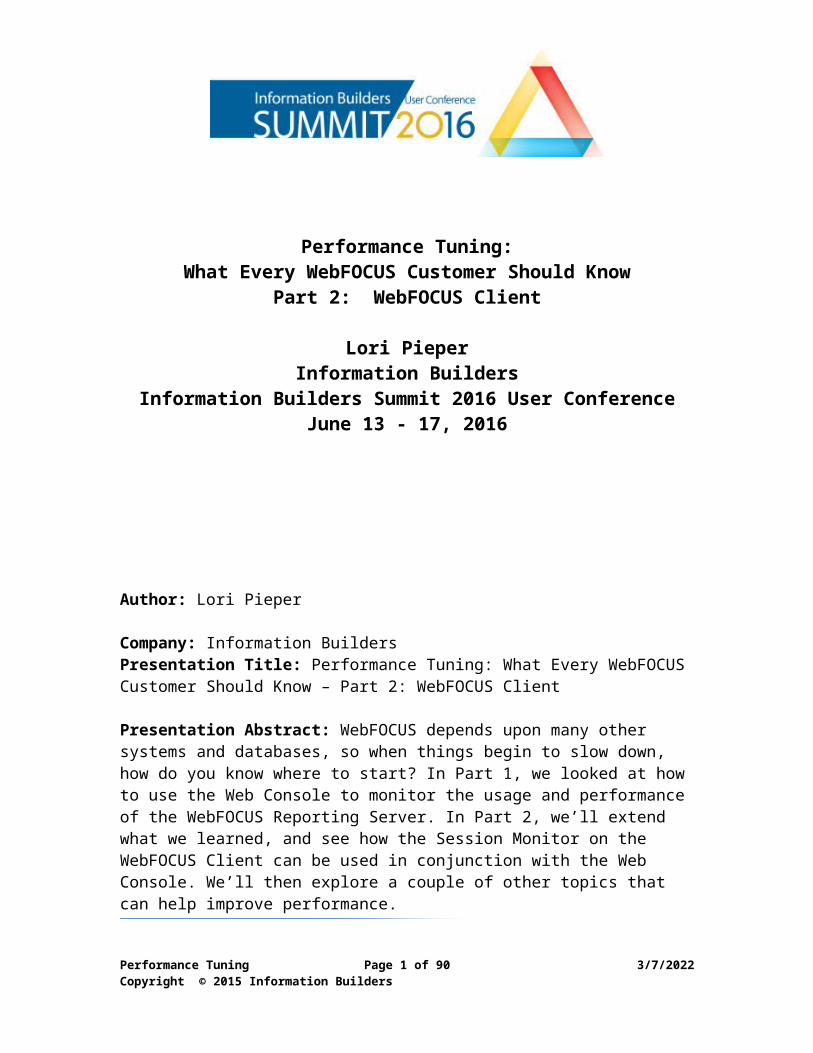
2. Sign in to the WebFOCUS Portal as an administrator:User ID: adminPassword: admin
Performance Tuning Page 11 of 72 5/9/2023Copyright © 2015 Information Builders

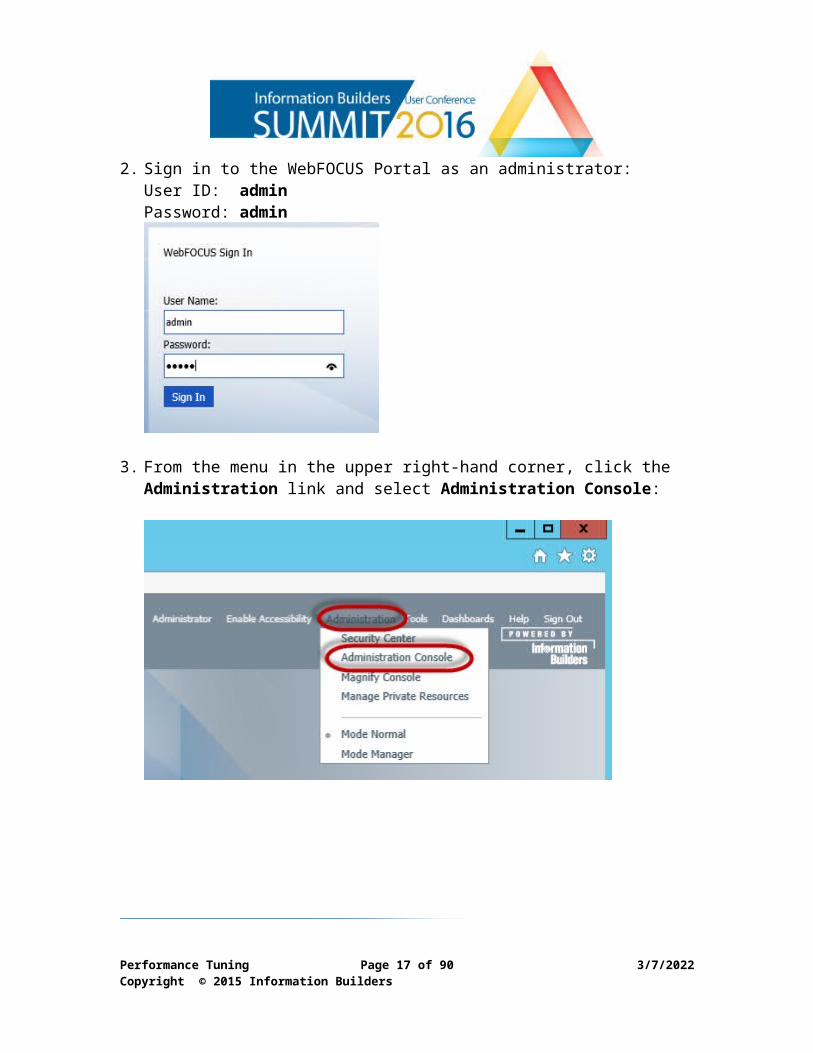
3. From the menu in the upper right-hand corner, click the Administration link and select Administration Console:
Performance Tuning Page 12 of 72 5/9/2023Copyright © 2015 Information Builders

4. From the menu along the left-hand side of the administration console, expand Diagnostics and select Session Monitor:
The Session Monitor opens:
Performance Tuning Page 13 of 72 5/9/2023Copyright © 2015 Information Builders

Note: As an administrator, the number of sessions you see will be dependent upon the number of active sessions. In the lab you will initially only see one session, but in the image below, there are two sessions:
When you see a session with the Client User of Public, this indicates that a user had logged into the WebFOCUS portal and then signed out, and this sets up a public session, which is simply the login page:
If a user logs in again using this same browser session, the public session you see in the session monitor reflects the name of the user who just logged in. If, however, the user opens a new browser session, the public session will remain there until the session expires, or until the WebFOCUS application in the web application server is restarted. Let’s see this in action.
Performance Tuning Page 14 of 72 5/9/2023Copyright © 2015 Information Builders

Step 2 – Explore how the Session Monitor works in generalIn order to make the best use of the Session Monitor, it helps to understand how it works. We have logged in as an administrator (admin/admin), and since the web application server (Tomcat) was just restarted, all we see is our own session. The session ID here will match the user session ID in the audit.log file. Let’s verify this.
1. From the lower left-hand corner of the desktop task bar, select the Windows File Explorer icon:
2. When the Windows File Explorer opens, navigate to: d:\ibi\WebFOCUS81\logs to find the audit.log file:
3. Double-click the audit.log to open it in Notepad and scroll to the bottom. In the lab environment, you will only see a line indicating the System Startup and your current sign in session:
Performance Tuning Page 15 of 72 5/9/2023Copyright © 2015 Information Builders

However, the log will contain all auditable activity for the day, even if the WebFOCUS application has been restarted during the day. For example, in the following image, I had restarted the WebFOCUS application multiple times (notice the System Startup messages) and the log shows all activity for the day, not just the activity since the application was started.
4. Just after the INFO signIn, you should see the Monitor ID and then:
… admin signIn SUCCESS user:admin …
and then the Monitor ID from the Session Monitor again.
Performance Tuning Page 16 of 72 5/9/2023Copyright © 2015 Information Builders
In a moment, we will see that this is the same ID that we will see in the Reporting Server Agent Monitor when we run a report. But first, let’s see what happens when other users log in and out.
5. Close the audit.log and minimize Windows File Explorer.
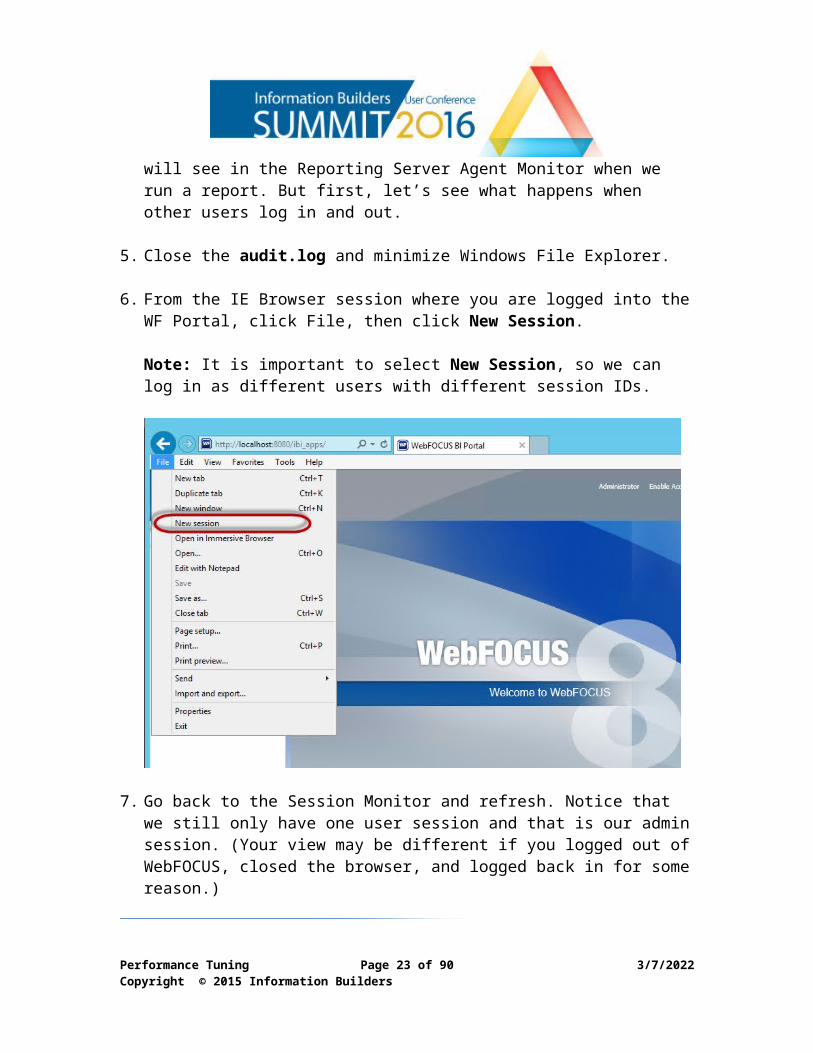
6. From the IE Browser session where you are logged into the WF Portal, click File, then click New Session.
Note: It is important to select New Session, so we can log in as different users with different session IDs.
Performance Tuning Page 17 of 72 5/9/2023Copyright © 2015 Information Builders

7. Go back to the Session Monitor and refresh. Notice that we still only have one user session and that is our admin session. (Your view may be different if you logged out of WebFOCUS, closed the browser, and logged back in for some reason.)
8. Using the new browser session, log in as David Liu, a developer for the WF Performance Tuning domain.
User ID: dl139Password: train1
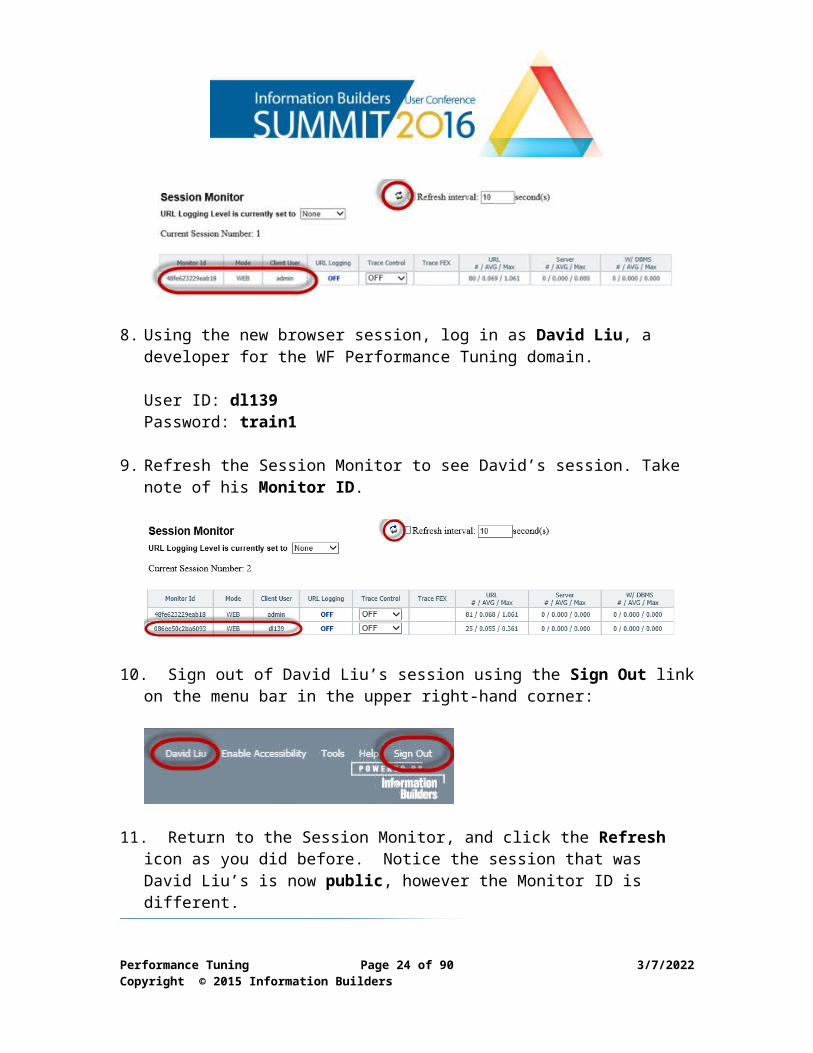
9. Refresh the Session Monitor to see David’s session. Take note of his Monitor ID.
Performance Tuning Page 18 of 72 5/9/2023Copyright © 2015 Information Builders

10.Sign out of David Liu’s session using the Sign Out link on the menu bar in the upper right-hand corner:
11.Return to the Session Monitor, and click the Refresh icon as you did before. Notice the session that was David Liu’s is now public, however the Monitor ID is different.
David’s session ID was: 086ee50c2ba6093public’s session ID is now: f4b4eef77760a47
12.Using David’s browser session, sign in as David and refresh the Session Monitor again.
User ID: dl139Password: train1
Performance Tuning Page 19 of 72 5/9/2023Copyright © 2015 Information Builders

Notice the session gets reused and again the Monitor ID is changed.
13.On your own, take a minute to:o Sign out as David.o Close the browser.
Refresh the Session Monitor.o Click File, then click New Session from the admin’s WF Portal
session.o Sign in as David Liu (dl139 / train1).o Refresh the Session Monitor and see that you now have three
sessions for the three different users: admin, public, and dl139.
Go back to Windows Explorer and open the audit.log file again and see your recent activity:
Close the audit log and Minimize Windows File Explorer.
Performance Tuning Page 20 of 72 5/9/2023Copyright © 2015 Information Builders

Step 3 – Using the Session Monitor to monitor usageThe Session Monitor can provide you with a lot of information about usage, as well as session tracing. We’ll log in as different users and run requests and explore the information we get from the Session Monitor.
At this point we should see three users in our Session Monitor: admin, dl139, and public. But we have not actually run any requests, and the monitor will reflect that.
Refresh the Session Monitor, as you did before, and notice the columns that are available. Take particular notice of the last three columns:
The last three columns are as follows:URL - # / AVG / Max – This tracks the total number of URLs run from the WebFOCUS Portal, as well as the average and maximum time needed for each request.
Server - # / AVG / Max – This tracks the URL requests that were sent to the reporting server, as well as the average and maximum time needed for each request.
W/DBMS - # / AVG / Max – This tracks the number of requests that were sent to the DBMS, as well as the average and maximum time needed for each request.
Notice that the URL column shows activity, but the other two columns do not. This is how we can tell these users have been active in the WebFOCUS Portal, but have not run any report or chart requests.
The other columns are as follows:Monitor ID – This is the unique ID associated with this session. The ID will change if the user logs out and logs back into their session, as we saw above.
Mode – This tells us from where the user connected. Web indicates a web
Performance Tuning Page 21 of 72 5/9/2023Copyright © 2015 Information Builders

browser session, and WFDT indicates a session initiated from App Studio. Other settings can be found in the WebFOCUS Security and Administration Guide.
Client User – The ID used to sign in to WebFOCUS. As we have seen, public appears when a user signs out of WebFOCUS, or if there is a user connected via the public or anonymous access.
URL Logging – This will turn URL logging on and off for individual sessions. This can also be controlled from the drop-down box at the top of the Session Monitor:
Selecting None or All from the drop-down box will apply to all sessions. When you change the option in the URL Logging column for an individual session, this drop-down will show Selective.
Trace Control – This is where you can set the trace levels by individual sessions. The trace options are shown below, and each option will be in addition to the options above it. In other words, selecting Output would also include Basic tracing as well.- OFF: No tracing- Basic: Traces each URL, IBFS traces, and Procedures.- Output: Traces the output of each server request and URL. - DETAIL: Comparable to what we historically called servlet traces.- Server: Traces on the reporting server will be turned on.
Trace FEX – If traces are turned on, you will see an icon that you can click in order to show those traces.
1. Go to David’s browser session. You can verify the sessions by looking in the upper right-hand corner of the WebFOCUS Portal:
Performance Tuning Page 22 of 72 5/9/2023Copyright © 2015 Information Builders
After verifying you are in David’s session:o Expand the WF Performance Lab folder under the Content tree.o Right-click 1 Customer Trends Across Year.o Select Run.
o Close the report output window.
2. Return to the Session Monitor and Refresh.Notice that the dl139 session now shows activity in the last two columns, indicating that a request was run that required access to the DBMS. You can also see the last request executed.
Performance Tuning Page 23 of 72 5/9/2023Copyright © 2015 Information Builders
The values did not change in those last two columns for the other two sessions, however the URL column did change for the admin session, which was our Refresh request.
Click Refresh again and see the URL # increase for the admin session:
3. Set Trace Control to Basic for both the admin’s and David’s sessions. Click the down arrow under the Trace Control column for both sessions and select Basic. Basic tracing should be sufficient for identifying performance bottlenecks. The other options provide more tracing options, which are better suited to troubleshooting.
After turning on tracing, you will see the informational icons in the Trace FEX column for both sessions.
If you rest the mouse on the icons in the Trace FEX column you will see the first one is View Trace, to view the trace, and the second is View FEX Trace, to view the procedure trace. In order to see how this works, we’ll run the request again from David’s browser session.
4. Go back to David’s browser session. o Expand the WF Performance Lab folder under the Content tree.o Right-click 1 Customer Trends Across Year procedure.
Performance Tuning Page 24 of 72 5/9/2023Copyright © 2015 Information Builders

o Select Run.
o Close the report output window.
5. Return to the Session Monitor.o Click Refresh.o Click the first informational icon for David:
The Session Viewer for David’s session opens, breaking down the request. Let’s look at the Session Viewer a little more closely.
Step 4 – The Session ViewerThe Session Viewer is only available if traces have been turned on, or if you have access to it from the Tools menu in the WebFOCUS Portal.
Performance Tuning Page 25 of 72 5/9/2023Copyright © 2015 Information Builders

Users with the opDevTraces privilege will see this Session Viewer, allowing them to view their individual session information. Note: From within the Security Center, the opDevTraces privilege can be found as follows:
Click the Roles tab. Double-click any of the roles (I chose the Domain Developer role.) Under the Application Development section, you will see this privilege
listed as either Development Traces or Session Traces, depending upon your WebFOCUS version. It will be Development Traces for versions prior to 8.2, and Session Traces thereafter.
Now we will explore what this Session Monitor gives us.
Performance Tuning Page 26 of 72 5/9/2023Copyright © 2015 Information Builders

A closer look at the Session Viewer
Note: We would see more information here if we selected a trace level higher than Basic.
A few things to notice:1. The Session Viewer is specific to one session. The 160414/dl139_154558
tells us the location and name of the trace files. It also tells us that the trace was gathered on April 14, 2016 (which is the folder name), and the trace file is for user dl139 and it was taken at 3:45:55pm on that day. Note: Trace files are retained in the \ibi\WebFOCUS81\traces folder and are kept until they are deleted.
2. The Session Viewer breaks down the activity for that session.3. There is a list of URLS from that session. The URLs listed are determined by
the trace level and what is selected in the View drop-down list.
The View drop-down list will also reflect the informational icon you selected. We selected View Trace so our default view here is Work URLS.
4. The session viewer will show the User Build and client build information.5. Other traces in the \ibi\WebFOCUS81\traces folder will be listed if you have
the security privileges to see other traces.
More details can be found in the WebFOCUS Security and Administration documentation.
The Session Viewer is very useful for troubleshooting, however we want to explore more of the performance metrics it provides.
Performance Tuning Page 27 of 72 5/9/2023Copyright © 2015 Information Builders

1. Click the plus sign (+) in front of the URL request to see the detail.
Notice the Start and End columns, giving the start and end times in Hour:Minute:Seconds format for the specific request shown in the trace. In the expanded view, you have the timings in milliseconds for each detailed item. This helps to isolate where any bottlenecks may be occurring.
In the column to the right of the IBFS, you may see a +, -, * or X, indicating, the start of a trace, the end of a trace, an error, or administrator only information, respectively:
If you look at the trace, you can see where WebFOCUS:o gets the properties for the procedure, o sends the request to the server, and o when it returns.
This one ran pretty quickly. We’ll run another request that takes a little longer.
2. Return to David’s browser session and run the second request.
Performance Tuning Page 28 of 72 5/9/2023Copyright © 2015 Information Builders

o Right-click 2 Revenue by Customer Across Discount Levels.o Select Run.
3. Close the report output when it completes.
4. Refresh the Session Viewer by clicking the Refresh link or the Refresh icon directly in front of it. There is a Refresh link at the top and bottom of the list:
Performance Tuning Page 29 of 72 5/9/2023Copyright © 2015 Information Builders

5. We can see this request took a little longer, just by looking at the difference between the data bars for the two requests:
6. Expand the second request trace and we can clearly see the jump in time once the request gets sent to the reporting server. If we look closely, we can see that the total server time used is 20,000 milliseconds, of which 18,688 milliseconds was in the database.
Meanwhile the Session Viewer is maintaining general information about the user’s total session, including the number of requests, and the average timing of the requests.
Note: If you wanted to get back to earlier session trace information, you can use the “Existing Session Traces” grid at the bottom of the Session View and select the trace you want, assuming there are earlier traces available.
If I click dl139_154558, I get:
Performance Tuning Page 30 of 72 5/9/2023Copyright © 2015 Information Builders

Additional information that can help you navigate the Session Viewer.
The icon showing you the total length of time for a particular session URL is color-coded. It shows the time used for each stage of processing, relative to the total time:
o Thick Blue line = Client CPU timeo Thin Blue Line = Client CPU wait timeo Orange = Server timeo Black = DBMS timeo Green = Running
If you rest the mouse on any part of the line, a ScreenTip will tell you the amount of time, as well as what that line represents.
If you click one line and then click a second line, the Session Viewer will show you the relative amount of time in between the tasks. This can help you identify timing of the requests. In the following example, when I click the last line and then click the line just above it:
I see the following:
Performance Tuning Page 31 of 72 5/9/2023Copyright © 2015 Information Builders

Again you can rest the mouse on the line to get more information about that portion of the timeline.I can click one of the lines to get the prior view.
1. Close the Session Viewer and return to the Session Monitor.
2. Click the other informational icon for View Fex Trace for David’s session:
3. Although the Session Viewer appears to be the same, notice that the View is now for Server Requests versus Work URLS:
4. Expand the second trace as you did before. You are now seeing the details behind the procedure request instead of the work URLS.Note: This is not showing the actual code, but what WebFOCUS is doing behind the scenes based upon the request.
Performance Tuning Page 32 of 72 5/9/2023Copyright © 2015 Information Builders

5. Close the Session Viewer.
6. Click View Fex Trace for the admin session. Since the admin did not run any procedures, we will get a message saying there are no traces.
Performance Tuning Page 33 of 72 5/9/2023Copyright © 2015 Information Builders

7. Close the Session Viewer.
8. Change Trace Control to OFF for both users.
Note: The information icons are still visible because there are traces available for this date to view. Remember traces for prior dates would be listed at the bottom of the Session Viewer.
Step 5 – Using the Client Session Monitor in conjunction with the WebFOCUS Reporting Server Agent Monitor.
1. Minimize the browsers that are currently open. Close any report output browser windows that may be open.
2. Double-click the Web Console icon on the desktop:
Performance Tuning Page 34 of 72 5/9/2023Copyright © 2015 Information Builders

3. Click the Workspace tab. This is where you can monitor the active agents:
Performance Tuning Page 35 of 72 5/9/2023Copyright © 2015 Information Builders

In Part I of this series, we saw that there is a lot of information here about performance and we can modify what columns are visible to us as we monitor the sessions. For Part 2 we will only make minor adjustments, so we can see the Client Session ID.
4. Click the Choose Columns button.
Here you can select the columns you want to see in the Data Services Agents view. You can choose the columns you need based upon what you are looking for.
Performance Tuning Page 36 of 72 5/9/2023Copyright © 2015 Information Builders

You should see something similar to the following:
For this lab, we want to see how our WebFOCUS Client Session Monitor works in conjunction with the Reporting Server Agents monitor, so we’ll select the columns that are most useful for that.
5. Under Client Information: o Clear the following check boxes:
Group Client Address Scheduler Job ID
o Check the following box: Client Session
Your final selections should look like the image below:
Performance Tuning Page 37 of 72 5/9/2023Copyright © 2015 Information Builders

Note: Because security is turned off, if you close the reporting server web console and open it again, you may see the default columns and not the columns you just chose.
The columns you ultimately choose when you do this at your site may be different depending upon the circumstances and what you are hoping to learn. For instance, you might clear the Service column, since you already know the agents at the top of the list are the agents for the Default Service anyway. Or you may want to select Defer ID, if the performance issue is related to a report when it is run in deferred mode.
6. Click the OK button at the top to save your settings.
Performance Tuning Page 38 of 72 5/9/2023Copyright © 2015 Information Builders

Your Data Services Agents view should now look like the following:
Size the browser window so that you can see most of the columns without scrolling to the right. If this is not possible, the important thing here in Part 2 is to be able to see the Client Session, so you see how the client monitor ties to the server monitor. It is nice, although not critical, for you to also see the DBMS I/O and DBMS Time columns as well.
If any of the columns you want to see are not fully visible, you can change the size of the column.In the image below, DBMS I/O is not fully visible:
You can expand the column width by resting the cursor on the column border until the cursor becomes a double arrow, then click the column edge and drag it to expand it.
Performance Tuning Page 39 of 72 5/9/2023Copyright © 2015 Information Builders

NOTE: If you need to see more columns than what can be easily viewed without scrolling, you can also hide the tree panel on the left hand side of the web console to get more real estate. Click the X in the upper right hand corner of the panel to hide it:
You can also use the Show/Hide Tree button in the Quick Access Toolbar to unhide the left panel. This icon is actually a toggle, and will restore the tree panel if it is hidden, and hide the tree panel if it is visible.
Let’s set the Data Services Agents view to automatically refresh every five seconds, so we can see the activity as it changes.
7. Find the settings in the upper right-hand corner of the Data Services Agents panel.
Performance Tuning Page 40 of 72 5/9/2023Copyright © 2015 Information Builders

8. Type 5 in the second(s) box.
Select the Refresh interval check box.
9. It should begin refreshing every five seconds. If it doesn’t refresh every five seconds, click the Refresh button to the left of the check box to set the refresh settings.
Performance Tuning Page 41 of 72 5/9/2023Copyright © 2015 Information Builders

You should now see the following in the upper-right corner of the Data Services Agents window, and your agent view should refresh every five seconds:
Note: You can still manually use the Refresh button as needed, and you may want to do so in order to monitor the database I/O changing.
Now we can easily watch the server activity as the procedures run. The Data Services Agents monitoring view gives us a lot of information, which was covered in Performance Tuning Part 1 – WebFOCUS Reporting Server. Refer to that lab material or the WebFOCUS Server Administration Guide for more detail.
During this session we will be looking primarily at the Client Session ID, and simply getting a feel for how the WebFOCUS Client Session Monitor and the reporting server Data Services Agents monitor work together.
Performance Tuning Page 42 of 72 5/9/2023Copyright © 2015 Information Builders

We should already be signed in to WebFOCUS as David Liu and admin. We’re going to set up the environment so that we can watch the Client Session Monitor and the reporting server Agent Monitor at the same time.
1. Return to the Client Session Monitor and set it to refresh automatically: o Change the second(s) to 5.o Select the Refresh check box.o Click the Refresh icon.
Once you click the Refresh icon, you will see the Page refreshing… message:
2. Position the reporting server browser and the Session Monitor browser so you can see both monitors at the same time.
Performance Tuning Page 43 of 72 5/9/2023Copyright © 2015 Information Builders

3. Open David Liu’s session and position it so you can easily run requests while still viewing the monitors:
4. Right-click 2 Revenue by Customer Across Discount Levels and select Run.
Performance Tuning Page 44 of 72 5/9/2023Copyright © 2015 Information Builders

5. Observe both monitors, taking note of how they both change.You may want to occasionally refresh these manually to increase the speed at which they are refreshing.
Performance Tuning Page 45 of 72 5/9/2023Copyright © 2015 Information Builders

6. Notice that the Monitor ID from the Session Monitor matches the value in the Client Session column of the running request in the Agents Monitor:
7. We can see the CPU and DBMS time on the server, but without tracing, we cannot see the details on the Session Monitor because the Session Monitor only shows the average and maximum values for all requests for a session.
That’s okay. The admin session hasn’t run any requests yet, so we will run that same request from the admin session and see if we can’t see the
Performance Tuning Page 46 of 72 5/9/2023Copyright © 2015 Information Builders

correlation between the Agent Monitor information and the Session Monitor.
8. Close the Report Output and minimize David’s session.
9. Open the admin session and run the same report:
Performance Tuning Page 47 of 72 5/9/2023Copyright © 2015 Information Builders

10.Observe the monitors:
11.Compare the statistics of the run between the two monitors:
Session Monitor:
Agent Monitor:
o The Server Max time on the Session Monitor is 26.022. Since we only ran this once, the AVG and MAX are the same and they reflect the actual time.The Response Time on the Agent Monitor is 25.991. This is very close, allowing a few milliseconds for communication to the client.
o The W/ DBMS Max time on the Session Monitor is 25.758.The DBMS Time on the Agent Monitor is 25.758.They are exactly the same because this gets passed back to the Client.
12.Close the Report Output window.
Performance Tuning Page 48 of 72 5/9/2023Copyright © 2015 Information Builders

Step 6 – Run with multiple user sessions.We’ve explored the basics of the Session Monitor and Data Services Agent Monitor, so now let’s see what they can tell us with respect to connected users and performance monitoring. Here we will sign in as multiple users in order to mimic what this might look like when you use this at your site.
Right now we should be logged in as David Liu and admin. Let us also log in as Mary Dempsey (md272 / train1) and Peter Connelly (pc188 / train1).
2. Click File from the browser menu bar and select New Session.
3. Sign in to the WebFOCUS Portal as Mary Dempsey. User ID: md272 Password: train1
4. Repeat step 1 to open another browser session and this time log in as Peter Connelly:User ID: pc188Password: train1
5. Arrange the browser windows so we can easily see what’s going on. We don’t need a lot of room for our user sessions, but we do want plenty of space to see the Session Monitor. (We’ll look at the reporting server Agents monitor with respect to multiple users in a minute.) A suggested layout:
Performance Tuning Page 49 of 72 5/9/2023Copyright © 2015 Information Builders

6. The Session Monitor should already be set to refresh automatically, but if it is not, please set the Session Monitor to refresh automatically:
o Change the second(s) to 5.o Check the Refresh check box.o Click the Refresh icon.
Once you click the Refresh icon, you will see the Page refreshing… message:
7. In David’s and the admin’s WebFOCUS Portal session, collapse the WF Performance Lab content folder. This allows us to easily see the BI Portal tree.
8. Run the WF Performance Lab BI portal from each user session, by doing the following in each users’ session. Do this quickly to maximize the activity in the Session Monitor.
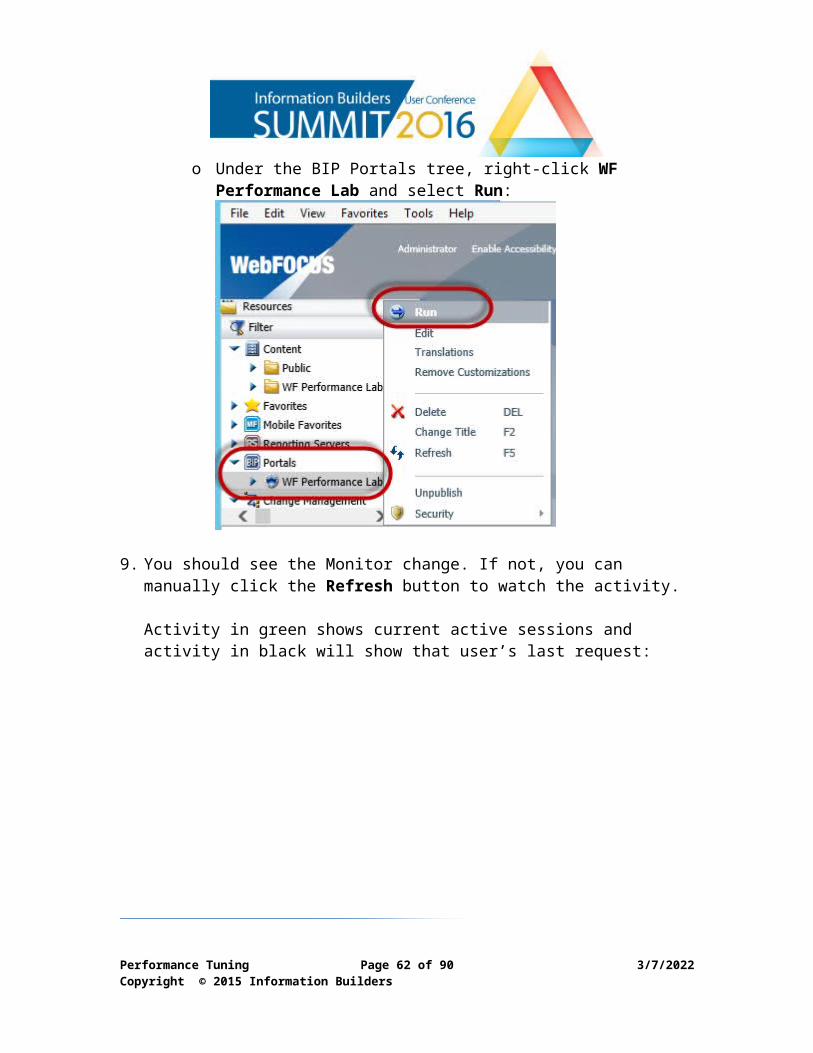
o Under the BIP Portals tree, right-click WF Performance Lab and select Run:
Performance Tuning Page 50 of 72 5/9/2023Copyright © 2015 Information Builders

9. You should see the Monitor change. If not, you can manually click the Refresh button to watch the activity. Activity in green shows current active sessions and activity in black will show that user’s last request:
If you catch the Session Monitor at the right moment, you will see that there are multiple active sessions per user. This is because the BI Portal page we ran has one report and three charts on it. WebFOCUS will run all of these
Performance Tuning Page 51 of 72 5/9/2023Copyright © 2015 Information Builders

simultaneously, as long as there is machine capacity on the reporting server. Even though all users ran the same portal, you may see that not all users in the Session Monitor ended with the same Last Req: listed. This last request is based upon which report or chart ran to completion last.
If these are all running simultaneously, what does that activity look like on the reporting server?
10.Minimize the Session Monitor and restore your reporting server web console browser session. Position this browser where the Session Monitor was, so we have plenty of room to see the agents as they run.
11. In order to get enough space down the page to see all of the agents as new agents start, minimize the ribbon by clicking on the up arrow on the Quick Access Toolbar:
Note: To restore the ribbon, click the down arrow from the Quick Access Toolbar. We will leave it hidden for now.
Performance Tuning Page 52 of 72 5/9/2023Copyright © 2015 Information Builders

12.Notice there are only five DEFAULT agents started at this time.
Observe how this changes as we rerun the BI Portal page for each user.
13.Rerun the Sales portal page by clicking on the page tab in each users’ browser session. (The Sales portal page is set to Refresh on Click.)
Performance Tuning Page 53 of 72 5/9/2023Copyright © 2015 Information Builders

14.Watch the reporting server web console. Manually refresh the server Agents view as needed. Notice that additional agents will be started as needed to accommodate the work load.
Also notice that you can tell by the Client Session that more than one request is being run by each client session.
Compare the Client Session IDs in the reporting server monitor to the Monitor ID in the Client Session Monitor.Note: If security was turned on in the reporting server we would also see the user’s ID in the User column.
Reporting Server Agents Monitor:
Performance Tuning Page 54 of 72 5/9/2023Copyright © 2015 Information Builders

Client Session Monitor:
15.Sign out and close the WF Portal sessions for Mary and Peter and close their browser sessions.
16.For both David’s and the admin’s session do the following:o From the menu in the upper right-hand corner of the BI Portal, click
More and then click Close:
17.Turn off the automatic refresh in the Session Monitor:o Remove the check from the Refresh option and o Click the Refresh icon:
The number of seconds will automatically go back to the default of ten.
Performance Tuning Page 55 of 72 5/9/2023Copyright © 2015 Information Builders

18.Turn off the automatic refresh in the Data Services Agents Monitor:o Remove the check from the Refresh option and o Click the Refresh icon:
19.Minimize the Reporting Server web console and the Session Monitor.
Performance Tuning Page 56 of 72 5/9/2023Copyright © 2015 Information Builders

Step 6 – Explore other WebFOCUS Client performance tidbits
SQL TracingThere are many tracing options, but we will just be looking at options for SQL tracing, which can help the developers to optimize their procedures as they develop.
1. From David’s session, expand the WF Performance Lab content tree.
2. Right-click 1 Customer Trends Across Year and select Run with SQL Traces:Note: This option is only available when the procedure is going against data sources that use SQL to retrieve data.
When the report runs, you will see the report as well as the SQL used to generate that output.
Note: There is another useful option here for the user: Run Deferred. We will not talk about this during the lab, but there is more information in the Appendix on running reports in deferred mode.
Performance Tuning Page 57 of 72 5/9/2023Copyright © 2015 Information Builders

3. Expand the lower window to show the entire SQL:
4. Notice that in the SQL:o Aggregation is done.o There is only one Select statement.o Joins were done.o Selection criteria was done.o Grouping was done.o Sorting was done.
This indicates that the majority of the data work was done by the
Performance Tuning Page 58 of 72 5/9/2023Copyright © 2015 Information Builders

SQL in the database, which usually points to optimal performance.
5. Notice the last entry shows the number of records returned by both the database and by WebFOCUS:
o TABLE= indicates the number of rows returned by the database.o LINES= indicates the number of data rows returned by
WebFOCUS.This number does not include total lines, headings, footings, etc.
6. Close the Report Output.
This is great, but that report ran fast. What if I don’t want to wait for the report to fully run in order to see the SQL that WebFOCUS will generate in order to process the data request? There is another option.
1. From the Desktop, double-click the App Studio icon.This may take 30 seconds or so.
2. Sign in as David Liu:User ID: dl139Password: train1
3. App Studio will present you with the Environments Tree on the left side of the canvas. Since we’re already logged in as David from the browser, the Content tree should already be open with the WF Performance Lab folder expanded. If not, please expand the WF Performance Lab folder.
4. Double-click 1 Customer Trends Across Year to open it in the report canvas.
5. From the ribbon, select the View tab and click the View Generated SQL icon:
Performance Tuning Page 59 of 72 5/9/2023Copyright © 2015 Information Builders

6. This will show you the SQL that will be generated without running the actual request.
Since the request is not sent to the database you will not see the Aggregation done… message, nor will you see the TABLE= or LINES= messages.
However you will still see the Select statement as well as the Joins, selection criteria, and any grouping and sorting commands.
Note: The View Generated SQL icon will only be active if the procedure is accessing a data source that uses SQL.
7. Close the SQL Output Window.
8. Close the Report Canvas by clicking on the X from the procedure tab:
Performance Tuning Page 60 of 72 5/9/2023Copyright © 2015 Information Builders

Please do not save any changes.
Remain in App Studio.
On-Demand PagingIf you attended Part 1 of the Performance tuning lab series, you heard us mention On-Demand Paging. Let us see how to turn that on.
1. Double-click the ‘3 Customer Detail’ procedure. This report runs a long time, but most of the time is in returning data to the user. By using on-demand paging, we can improve performance, as well as the user experience.
2. Open the Session Monitor.
3. Click the Refresh icon. Notice there are two sessions for David: one from Mode WEB and one from Mode WFDT:
This also shows two separate Monitor IDs for David. This is good and we won’t have issues, because the default setting in App Studio when you run
Performance Tuning Page 61 of 72 5/9/2023Copyright © 2015 Information Builders
a report is to use the App Studio Viewer to view report output, not Internet Explorer. When using Internet Explorer (or any browser) for both App Studio report runs and running reports from outside of App Studio, you may experience what I call session identity crisis, where you will be prompted to log in again and again because you are using the same browser session from two different places.
4. Turn Basic tracing on for David’s (dl139) WFDT session.
This will be the session without the informational icons at this point:
As we have seen before, once you turn tracing on, you will see the informational icons:
5. Return to App Studio.
6. Run the report.
Notice it takes quite some time to return the data. If we were to view the activity in the reporting server Agent monitoring view, we’d see that the database returned the data quickly, but because of the volume of data, it takes a while to return the data to the user.
7. Close the report output viewer.
Performance Tuning Page 62 of 72 5/9/2023Copyright © 2015 Information Builders

8. Open the Session Monitor and click Refresh.
9. Click the View Trace information icon for David’s App Studio session.
10. In the Session Viewer, expand the request for the report we just ran. You can see by the data bars that it’s the longest request. If you look at Start and End times, you can see the request itself only took nine seconds, yet it took much longer for the data to be returned to the user.
11.Expand the trace file and find the server and database times.
The total server time took 8.14 seconds with the database using only .649 seconds of that time.
What was taking all the time? The additional time was due to formatting and returning the data back to the user.
12.Close the Session Viewer. Close the report output.Keep the Session Monitor open.
13.Return to App Studio.
14.Click the Format tab. In the Navigation group, select On-Demand Paging:
Performance Tuning Page 63 of 72 5/9/2023Copyright © 2015 Information Builders

15.Run the report. You should get results in a few seconds, because WebFOCUS is paginating the report results on the server and only sending the user the first page. The On-Demand Paging viewer provides you with options to navigate the report output:
You can find more information about this and other output options in the App Studio Reference Guide.
16.Return to the Session Monitor and click the View Traces icon.
17.Compare the two requests:
The second request clearly took less server time and the data was presented to the user a lot faster.
18.Close:o the Report Output Viewero App Studio – Please do not save changes.o the Session Viewer and Session Monitor
Performance Tuning Page 64 of 72 5/9/2023Copyright © 2015 Information Builders

19.Sign out of the WebFOCUS Portal sessions and close the browsers.
Performance Tuning Page 65 of 72 5/9/2023Copyright © 2015 Information Builders

Congratulations! You’re done!
Q&A
Performance Tuning Page 66 of 72 5/9/2023Copyright © 2015 Information Builders

Appendix – Miscellaneous Performance Tidbits
View Generated SQLHow does a developer know if the SQL that WebFOCUS sends to the RDBMS is going to be optimized? There are two ways: They can include the below tracing commands. From within Developer Studio or App Studio, they can click on the Show
Generated SQL option.
NOTE: Tracing the generated SQL only applies when the data request will actually generate SQL or MDX. This will not work for reports going against non-SQL/MDX databases, e.g., when going against FOCUS databases or flat files.
The SQL tracing optionBelow is an example of the trace commands you can use, with a general description of what the command does:
SET TRACEOFF=ALL turns all current tracing settings offSET TRACEUSER=CLIENT sends tracing output to the screenSET TRACEON=SQLAGGR//CLIENT SQL aggregation traceSET TRACEON=STMTRACE//CLIENT SQL/MDX generated statements traceSET TRACESTAMP=OFF suppresses the display of the trace stampSET XRETRIEVAL=OFF translates the data request without retrieving data
Usually the trace commands above are added to a specific report that you want to trace. A technique I like to use is to put the trace commands into a separate WebFOCUS procedure called TraceSQL.fex, and then when I need this, I can simply add the below command to the top of my procedure in order to incorporate these trace statements into my report.
-INCLUDE TraceSQL
Performance Tuning Page 67 of 72 5/9/2023Copyright © 2015 Information Builders

The results of running a report with the above lines would be similar to:
It will explain why aggregation and/or optimization is or is not done.
The Developer Studio OptionIf you are using Developer Studio or App Studio, this is an option you can use from within these tools without having to manually include the trace statements above. The process is similar, but in Developer Studio you have the menu bars, and in App Studio you have the ribbon.
Performance Tuning Page 68 of 72 5/9/2023Copyright © 2015 Information Builders

From within Developer Studio:
Results:
Performance Tuning Page 69 of 72 5/9/2023Copyright © 2015 Information Builders

Run Deferred OptionWe mentioned run deferred as an option for running reports that you know will take a while to run. The Run Deferred option is available when you right-click a procedure from the WebFOCUS Client:
When choosing this option, the user will be notified that the report has been submitted. Meanwhile their browser is free for them to do additional work.
The user can then go to the deferred output status view to see the status and to view the final report results.
Performance Tuning Page 70 of 72 5/9/2023Copyright © 2015 Information Builders

The options on the far right are:
Click View to see the output:
WebFOCUS HyperstageWebFOCUS Hyperstage is an embedded data store that allows customers to dramatically improve the performance of their BI environment. Combining a column-oriented data store and Knowledge Grid architecture with Information
Performance Tuning Page 71 of 72 5/9/2023Copyright © 2015 Information Builders

Builders WebFOCUS BI platform, Hyperstage delivers a self-managing environment that is optimized for reporting and analytics.
WebFOCUS Hyperstage is an OLAP database replacement. Instead of creating a cube in a physical OLAP database, Hyperstage aggregates the answer without the time-consuming process of loading the cube.
WebFOCUS Hyperstage uses a hybrid approach that combines the I/O advantage of in-memory analytics with an intelligent architecture that allows data to be stored on disk without sacrificing performance. It eliminates the need to create, build, and maintain indexes; partition data; or perform manual tuning. Instead, the built-in Knowledge Grid creates and maintains information about the data as it is being loaded and as queries are run.
Sample performance results:
For more information contact your local Information Builders office, or go to: http://www.informationbuilders.com
Performance Tuning Page 72 of 72 5/9/2023Copyright © 2015 Information Builders