Embed Size (px)
Citation preview
PROCEDURES FOR INITIALIZING TIPSY
WITH SILVICULTURE SURVEY DATA,
VERSION 1.0
March 2013
Prepared for:
Ralph Winter and Frank Barber
Allan Powelson, contract admin
Resource Practices Branch
BC Ministry of Forests, Lands and Natural Resource Operations
Prepared by:
Stephen C. Stearns-Smith, RPF
TASS-CC Problem Analysis Page 2 of 12
TABLE OF CONTENTS
Table of Contents................................................................................................................................. 2
1.0 Introduction ............................................................................................................................... 3
1.1 Project Background................................................................................................................ 3
1.2 Project Goals and Scope ....................................................................................................... 3
2.0 Limitations and Caveats ............................................................................................................ 4
2.1 This Project ............................................................................................................................ 4
2.2 TIPSY .................................................................................................................................... 4
2.3 Silviculture Surveys................................................................................................................ 5
3.0 Procedures ................................................................................................................................ 6
3.1 Determine regeneration method and regen delay .................................................................. 6
3.2 Determine species composition ............................................................................................. 7
3.3 Determine site index .............................................................................................................. 7
3.4 Select a spatial distribution .................................................................................................... 7
3.5 Determine initial density ......................................................................................................... 9
3.6 Apply Operational Adjustment Factors (OAFs) ..................................................................... 10
The project was a collaborative effort with Stephen C. Stearns-Smith, RPF, providing growth and yield input and operational application documentation (this report) and Wendy Bergerud providing statistical analysis and analytical documentation (separate contract and report) . The following MFLNRO staff provided advice and guidance: Dave Weaver, Ralph Winter, and Frank Barber, Resource Practices Branch; Barry Snowdon and Mario Di Lucca, Forest Analysis and Inventory Branch.
Initializing TIPSY with SilvSurvey Data Page 3 of 12
1.0 INTRODUCTION
1.1 Project Background
The BC Ministry of Forests, Lands and Natural Resource Operations (MFLNRO) maintains the RESULTS (Reporting Silviculture Updates and Land status Tracking System) database to track reforestation and other silviculture information and manage the submission of Openings, Disturbances, Silviculture activities and Obligation (free-growing) declarations as required by the Forest and Range Practices Act. As of 2007, annual submissions to RESULTS represented over 7,800 openings and 220,000 hectares. The silviculture survey data in RESULTS include stocking estimates for every opening.
MFLNRO also conducts regular timber supply reviews (TSR) to update allowable annual cut (AAC) determinations by the Chief Forester. TSR uses the Ministry’s Table Interpolation Program for Stand Yields (TIPSY) software, based on the Tree and Stand Simulator (TASS) model, to predict future managed stand yields for post-harvest regenerated stands, including those in RESULTS. Historically, the provincial forest inventory lacked the necessary information to initialize TIPSY, so other more subjective information sources were used. RESULTS has now been linked with the inventory to take advantage of this additional data.
The Ministry is also monitoring post-free-growing stand productivity through its Forest and Range Evaluation Program (FREP). The objective is to compare future TIPSY yields from monitoring plot data against TSR yield expectations for similar stands (analysis units). Sampling procedures resemble silviculture surveys and generate similar stocking estimates.
Consequently, TSR and FREP staff decided to develop common procedures for using stocking estimates from silviculture surveys to initialize TIPSY. Wendy Bergerud was contracted to further develop statistical relationships based on her previous work. Stephen Stearns-Smith was contracted independently to provide growth and yield (e.g., TIPSY) input and draft operational procedures. The resulting collaborative effort has been documented in separate reports by each consultant.1
1.2 Project Goals and Scope
The project’s overarching goal was to develop standard operating procedures (best practices) for initializing TIPSY with silviculture survey data. Supporting analyses were undertaken by Bergerud on a limited subset of priority topics to ensure the project could be completed in the available timeframe. The analytical component focused on developing models to predict two key density-related TIPSY inputs: initial density (stems per hectare) and spatial distribution (planted, natural, clumped) from two key silv-survey density measures at various stand ages: well-spaced and total stems per hectare.
1 Bergerud, Wendy. March 2013. Predicting TIPSY spatial distribution and initial density
using current well-spaced and total density. Unpublished report for Resources Practices Branch, BC MFLNRO. With separate graphs.
Initializing TIPSY with SilvSurvey Data Page 4 of 12
2.0 LIMITATIONS AND CAVEATS
2.1 This Project
The project was intended to be a first approximation. These procedures are intended to evolve with further experience and research. Issues in need of further study have been highlighted. Key concepts and logic have been documented to provide a basis for informed deviation where appropriate.
Only the density-related procedures have an analytical foundation, the rest are largely conceptual, based on knowledge of survey practices and TIPSY.
The scope of both project components (analytical and procedural) was purposefully constrained to the scope of TIPSY 4.3 (features, database, etc) in order to ensure operationally compatible solutions. These procedures should be reviewed before applying them to future TIPSY versions.
The procedures in this report should not be applied to stands that have received incremental silviculture treatments that affect stocking (i.e., thinning) or temporarily affect site index estimates (i.e., fertilization), until methods are devised to account for these effects.
2.2 TIPSY
The following general characteristics are important to understand for any application of TIPSY.
TIPSY was not designed to be an “inventory” projection tool, i.e., accept data from existing established stands. It functions as a bare-ground model, i.e., its inputs represent stand establishment specifications. Data from existing established stands must be translated into stand establishment specifications before running TIPSY. This is the focus of the procedures in this report. Note: Oscar Garcia (UNBC) has developed a meta-model from TIPSY called TADAM (currently Fdc only). Superficially, its structure seems to support “inventory” projection more efficiently than TIPSY. Further investigation may be warranted.
TIPSY only produces even-age, single-species yields tables.
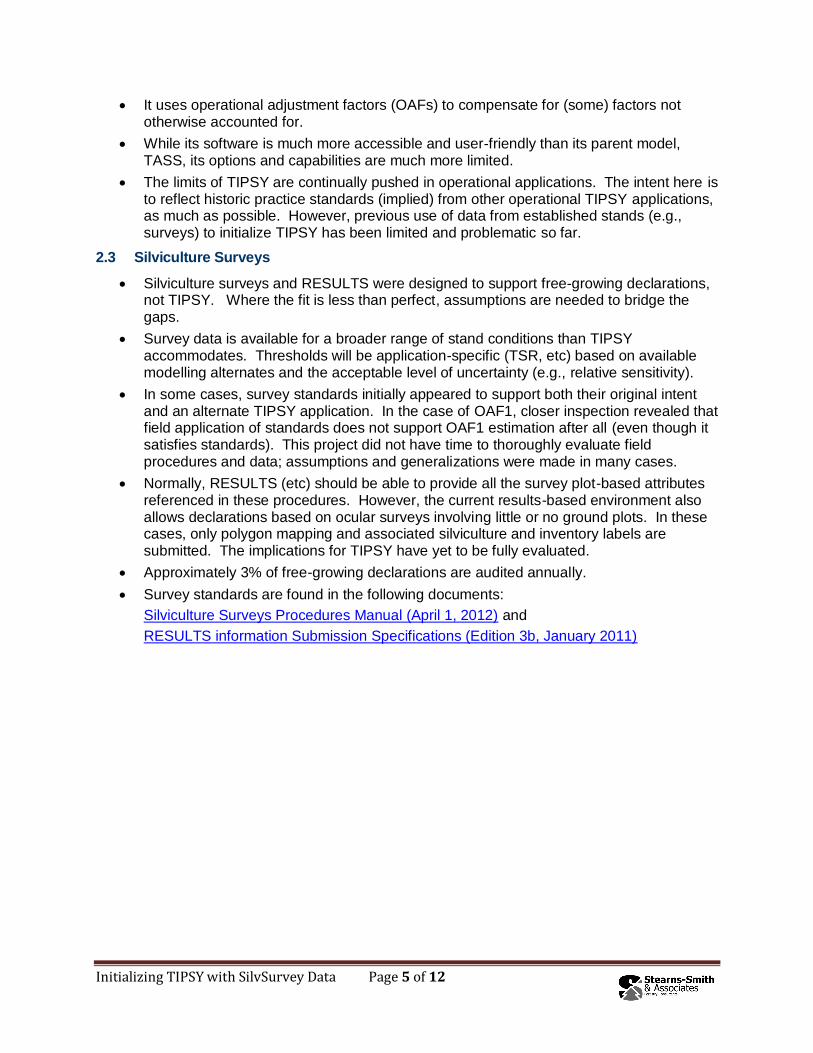
The mixed-species option does not reflect species dynamics or succession; species composition remains fixed over time.
This diagram conceptually illustrates how a mixed-species yield table is compiled from multiple single-species yield tables. In this example, the per hectare values in the mixed-species yield table will equal the sum of 0.75ha of pure Douglas-fir plus 0.25ha of pure pine. Site indexes are adjusted relative to the leading species. The same initial density and spatial distribution is applied to each species.
Growth and mortality in TIPSY are sensitive to inter-tree competition (both density and spatial distribution), but not overstory shading or competition from other species (trees, brush, forbs and grass).
TIPSY does not predict or anticipate ingress or natural disturbance events (insects, disease, fire, wind, etc) or the associated yield impacts.
Initializing TIPSY with SilvSurvey Data Page 5 of 12
It uses operational adjustment factors (OAFs) to compensate for (some) factors not otherwise accounted for.
While its software is much more accessible and user-friendly than its parent model, TASS, its options and capabilities are much more limited.
The limits of TIPSY are continually pushed in operational applications. The intent here is to reflect historic practice standards (implied) from other operational TIPSY applications, as much as possible. However, previous use of data from established stands (e.g., surveys) to initialize TIPSY has been limited and problematic so far.
2.3 Silviculture Surveys
Silviculture surveys and RESULTS were designed to support free-growing declarations, not TIPSY. Where the fit is less than perfect, assumptions are needed to bridge the gaps.
Survey data is available for a broader range of stand conditions than TIPSY accommodates. Thresholds will be application-specific (TSR, etc) based on available modelling alternates and the acceptable level of uncertainty (e.g., relative sensitivity).
In some cases, survey standards initially appeared to support both their original intent and an alternate TIPSY application. In the case of OAF1, closer inspection revealed that field application of standards does not support OAF1 estimation after all (even though it satisfies standards). This project did not have time to thoroughly evaluate field procedures and data; assumptions and generalizations were made in many cases.
Normally, RESULTS (etc) should be able to provide all the survey plot-based attributes referenced in these procedures. However, the current results-based environment also allows declarations based on ocular surveys involving little or no ground plots. In these cases, only polygon mapping and associated silviculture and inventory labels are submitted. The implications for TIPSY have yet to be fully evaluated.
Approximately 3% of free-growing declarations are audited annually.
Survey standards are found in the following documents:
Silviculture Surveys Procedures Manual (April 1, 2012) and
RESULTS information Submission Specifications (Edition 3b, January 2011)
Initializing TIPSY with SilvSurvey Data Page 6 of 12
3.0 PROCEDURES
In order to recreate stand establishment settings for TIPSY, one works backwards from the survey data. The following steps are not necessarily in order of operation, but pre-requisites are identified. Analysts are expected to rearrange these steps to capture efficiencies in their own systems.
3.1 Determine regeneration method and regen delay
Actual regeneration method needs to be tracked separately from the 3 TIPSY spatial distributions which are named after regeneration methods (i.e., planted, natural, clumped). The reason for this will be addressed later. For this step, actual regeneration method is needed to clarify regen delay.
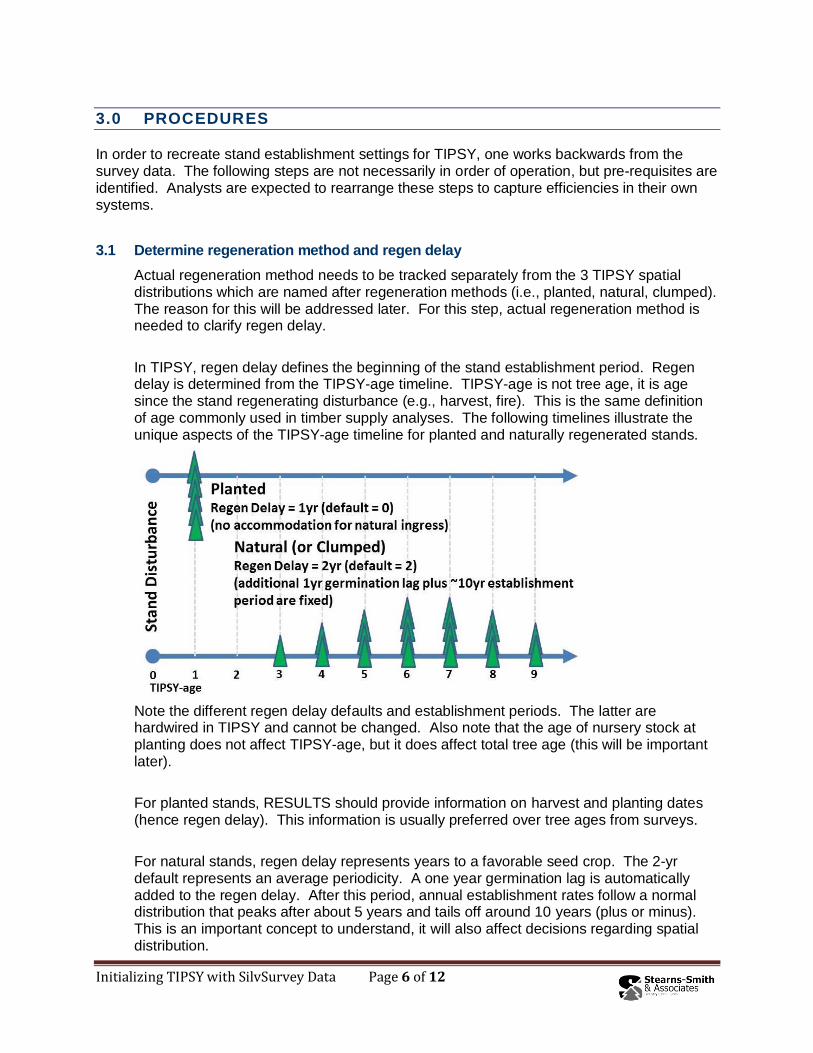
In TIPSY, regen delay defines the beginning of the stand establishment period. Regen delay is determined from the TIPSY-age timeline. TIPSY-age is not tree age, it is age since the stand regenerating disturbance (e.g., harvest, fire). This is the same definition of age commonly used in timber supply analyses. The following timelines illustrate the unique aspects of the TIPSY-age timeline for planted and naturally regenerated stands.
Note the different regen delay defaults and establishment periods. The latter are hardwired in TIPSY and cannot be changed. Also note that the age of nursery stock at planting does not affect TIPSY-age, but it does affect total tree age (this will be important later).
For planted stands, RESULTS should provide information on harvest and planting dates (hence regen delay). This information is usually preferred over tree ages from surveys.
For natural stands, regen delay represents years to a favorable seed crop. The 2-yr default represents an average periodicity. A one year germination lag is automatically added to the regen delay. After this period, annual establishment rates follow a normal distribution that peaks after about 5 years and tails off around 10 years (plus or minus). This is an important concept to understand, it will also affect decisions regarding spatial distribution.
Initializing TIPSY with SilvSurvey Data Page 7 of 12
To estimate regen delay in natural stands, analysts have three choices depending on data availability and policy:
1. First check for existing policy regarding regen delay defaults. If none exists, then:
2. If RESULTS does not provide a disturbance date (e.g., harvest, fire), then use TIPSY’s 2yr default.
3. If RESULTS provides a disturbance date, then tree ages from surveys may provide an estimate of regen delay, with a few assumptions. If one assumes the aged trees were dominants or co-dominants, then they were probably early germinates, i.e., within the first 5 years of the establishment period. For example, if we assume they were third year germinates, then the regen delay period ended (tree age + 3) years before the survey took place.
3.2 Determine species composition
Species composition percentages can be gleaned from RESULTS or associated map labels.2 TIPSY is calibrated for 10 of the most common commercial trees species in BC. It can also be applied to other species through its species substitution feature. Standard species codes will activate substitution automatically in Batch TIPSY. All possible species are listed in the interactive version of TIPSY. The species substitutions are documented in HELP.
Follow species composition guidelines for the intended application (TSR, etc).
3.3 Determine site index
TIPSY yields are very sensitive to site index, so good estimates are important.
Survey procedures include height and age measurements on a small subset of trees for site index determination. Roughly 3 samples per stratum is considered standard practice, although more are encouraged. There are usually other sources of site index estimates available (e.g., SIBEC, etc). However, measurements from existing managed stands normally take precedence over all others.
If site index is only available for the leading species (or questionable for others), TIPSY can estimate the other species relative to the leading species, using its species conversions equations.
3.4 Select a spatial distribution
Surveys do not directly measure or otherwise estimate spatial distribution. Spatial distribution and density were the focus of Bergerud’s analytical component of this project. Her analyses formed the foundation for the procedures in this section.
2 Label content is summarized on p33 of:
http://www.for.gov.bc.ca/hfp/silviculture/Surveys/FS660final2011.pdf
Initializing TIPSY with SilvSurvey Data Page 8 of 12
TASS is capable of modelling the entire range of spatial distributions found in nature, but only three are included in TIPSY 4.3. Their names refer to the regeneration method reflected in their associated assumptions regarding regen delay and establishment period, as follows:
TIPSY 4.3 name
Spatial distribution
Species availability
(TIPSY 4.3)
Regen delay default (yrs)
Fixed establishment period
Planted Square spacing
(with small random variation)
All but At 0 All at the same time.
Natural Random spacing All
2
Following an initial 1-yr germination lag, annual establishment rates follow a normal distribution that peaks around 5 years and tails off around 10 years (plus or minus).
Clumped (natural)
Clumped random spacing
Only: Hwc1, At,
Fdi, Pli, Sw
1 TIPSY 4.3 uses a different (more clumpy) distribution pattern for Hwc.
Selection process:
Bergerud’s companion analysis report documents strong relationships between TIPSY’s three spatial distributions and the ratio of Trees (#/ha) to WS All MITD.* within the TIPSY
database itself. These relationships can then be used to assign one of TIPSY’s 3 spatial distributions to the RESULTS polygon using the equivalent parameters from surveys: total trees/ha and total well-spaced trees/ha. (Refer to the next section on initial density for more detail on these density measures.) Bergerud’s report documents these relationships in graphs and regression perimeter tables. Separate functions are documented at 6-8 heights for TIPSY’s 8 conifer species, and for 3 MITD values. Analysts must determine how best to implement this suite of functions in their own systems. This process requires determination of species, age, and site index prior to spatial distribution, and spatial distribution precedes initial density.
Important Considerations:
The prediction of spatial distribution and initial density (in the next section) are applied to survey densities for all commercial species combined, because TIPSY must apply the same spatial distribution and initial density to all species when generating mixed-species yield tables.
All else being equal, the planted (square) distribution produces the greatest volume, followed by natural (random), and then clumped. The planted distribution is very close to the upper limit of spatial productivity (growing space utilization), but there are likely many stands in nature that are much more clumped than what TIPSY produces. The latter needs more investigation, possibly leading to the addition of additional clumped options in TIPSY.
Survey data from plantations may reflect the normal trend toward random or clumped distributions over time due to normal (random) mortality patterns and natural ingress.
Initializing TIPSY with SilvSurvey Data Page 9 of 12
However, the genetic worth (genetic gain) feature in TIPSY 4.3 only functions with the planted distribution. More discussion will be needed to determine how best to model plantations expressing random or clumped distributions, since spatial distribution also has a strong effect on volume production.
In FY12-13, a separate proof-of-concept project by FAIB’s Stand Development Modelling Group (SDMG, TIPSY stewards) successfully demonstrated that a system based on Bergerud’s ratio-based model can be implemented via table interpolation within the TIPSY database itself. SDMG will seek funds in FY13-14 for its addition to TIPSY’s existing stand start-up routine, including implementation in BatchTIPSY. This system would predict both spatial distribution and initial density and also adjust for OAFs and select other factors. The method also self-adapts to new TIPSY databases, eliminating the need to refit Bergerud’s equations or reprogram TIPSY.
3.5 Determine initial density
TIPSY Density (input): Input density represents the stand’s establishment density in
TIPSY. TIPSY 4.3 supports a maximum initial density of 10,000 trees/ha for natural stands (250,000 lodgepole pine and western hemlock) and 4444 trees/ha for planted stands. The minimum density is 69 trees/ha (494 for alder and 1111 for aspen). Survey-derived densities outside these bounds must be adjusted to fit within them.
TIPSY Density (outputs): TIPSY generates several future density predictions. Species
and ingress caveats apply. The following outputs are of particular relevance in the silviculture survey context:
1) Trees (#/ha): refers to live trees per hectare at a particular stand age or height. Custom Tables report this same value as Total Tree Count 0.0+, with 0.0+ referring to the minimum diameter (DBH) threshold for the trees counted.
2) WS (Well-spaced trees/ha): TIPSY reports 18 different variations on well-spaced density. These were generated by TASS by establishing virtual survey plots in all the stands in the TIPSY database. The following 18 well-spaced tree counts are available through Custom Tables: 6 Minimum Countable Heights (All; Ht 1.0m+, 1.5m+, 2.0m+, 2.5m+, 3.0m+) X 3 Minimum Inter-Tree Distances (MITD 1.5m+, 1.6m+, 2.0m+) NOTE: Bergerud’s functions use Trees (#/ha) as the surrogate for surveyed total tree density. Three TIPSY well-spaced values, WS All MITD (1.5m+, 1.6m+, 2.0m+) functioned as surrogates for surveyed total well-spaced
density.
Survey Density: Surveys collect several density measures during the regeneration delay
survey and again at the free-growing survey. The following density measures are relevant to TIPSY:
Initializing TIPSY with SilvSurvey Data Page 10 of 12
1) Total Trees/ha: total number of live coniferous and broadleaf trees, regardless of size, including both acceptable and unacceptable quality trees, but not non-commercial tree species. Normally, total trees/ha is preferable to total conifers/ha for TIPSY use, especially if there are commercial broadleaved species involved.
2) Total Well Spaced Trees/ha (uncapped): may include both preferred and acceptable species. Minimum Inter-Tree Distance (MITD) varies between surveys. The applicable MITD value is required for TIPSY use. For TIPSY purposes, avoid “capped” versions of well- spaced density, this includes both M-capped and height-capped, the latter includes free-growing well-spaced. Uncapped values are better predictors of spatial distribution and less influenced by regulatory thresholds.
Selection Process:
Bergerud’s companion report also documents models for predicting TIPSY initial density from surveyed total trees/ha based on spatial distribution.
Important Considerations:
Bergerud’s initial density method is conceptually identical to that in TIPSY’s existing stand start-up routine. See the previous section for a description of SDMG’s proposed upgrade of this TIPSY routine.
Both prediction models share TIPSY’s limitations.
3.6 Apply Operational Adjustment Factors (OAFs)
Operational Adjustment Factors (OAFs) are perhaps TIPSY’s most misunderstood concept. TASS (and therefore TIPSY) assumes the entire hectare is capable of growing trees (i.e., no bare rock, swamps, etc). It also assumes very little interference from non-commercial species, brush, and forest health impacts. By avoiding all these sources of unquantified variation, TASS (and TIPSY) generates a potential yield prediction. Potential yield provides a much more consistent and predictable baseline for subsequent response predictions and yield adjustments, than so-called average yields.
OAFs are used to adjust potential yields for abiotic and biotic factors that are not otherwise accounted for in TIPSY (TASS). Two types of OAFs are used routinely in most analyses (TSR, etc): OAF1 and OAF2.
OAF1 (default 0.85) is a simple, constant yield multiplier (i.e., 0.85 produces a 15%
reduction in stocking and yield at all ages). Nussbaum3 partitioned OAF1 into four factors:
a. Non-productive (NP) ‘holes’ within the stand that are too small to type out [delineate] in
a conventional inventory (4% reduction).
3 Nussbaum, Albert. 2001. Default Operational Adjustment Factors used In Allowable Annual Cut
Determinations in B.C. Unpublished draft discussion paper. BC Ministry of Forests and Range.
Initializing TIPSY with SilvSurvey Data Page 11 of 12
b. Holes in a stand caused by irregular stand establishment, competition from non-
commercial brush and elements that cause trees to be more irregularly spaced then is assumed in TIPSY (4% reduction).
c. Endemic disease and insect losses over the life of the stand such as spruce weevil, rusts
and needle casts (4% reduction).
d. Other random risk factors such as windthrow, top damage and snow press (3% reduction).
OAF2 (default 0.95) is a progressive yield multiplier, its impact increases with age. OAF2 is indexed to age 100. OAF2 increases by 1% each year reaching its assigned value at age 100, and continues to increase by 1% each year thereafter. Nussbaum narrowly defines OAF2 as accounting only for decay, waste, and breakage (DWB) as it is defined and applied in the provincial forest inventory and VDYP. TIPSY HELP confirms this was the original intent for OAF2, but these same DWB adjustments have since been implemented in TIPSY (incl. Batch) as a separate optional DWB adjustment independent from OAF2. TIPSY HELP also indicates that OAF2 can be used for forest health impacts that manifest slowly over time.
Custom OAFs can also be defined in TIPSY, but are rarely used in TSR (etc). With input from forest health experts, they can be used to model complex forest health impacts. Custom OAFs for Armillaria root rot are included in TIPSY for Douglas-fir in the ICH.
Related silviculture survey standards:
Survey standards require contiguous non-productive (NP) areas >0.25ha to be delineated (i.e., mapped out) prior to stocking assessment. NP includes both natural (e.g., rock and swamp) and unnatural landbase features (e.g., roads and landings).
Survey standards allow the polygons subject to stocking assessments to include small areas (<0.25ha in size) of unmapped NP. The productive area (non-NP) of each polygon is referred to as the net area to be reforested (NAR). Because stocking standards only apply to NAR, the unmapped NP is intentionally avoided when sampling (i.e., plots are offset or dropped)4. Survey mapping standards5 provide for the estimation of unmapped NP area (ha). However in practice, the consistency and resolution appear to be sufficient for declaration purposes, but not for OAF estimation.6 Furthermore, given the long contentious history of OAF1 estimation technics and projects in BC, it is unlikely that survey practices could be easily modified to accommodate this satisfactorily.
NAR stocking estimates are intended to reflect the negative impacts of past and present biotic factors (e.g., forest health and non-commercial stocking) on stocking targets and free-growing declarations. However, it is unlikely that all these biotic agents will have
4 page 50, Silviculture Surveys Procedures Manual (April 1, 2012)
5 page 30, RESULTS Information Submission Specifications (Edition 3b, January 2011) 6 Pers. Comm., Dave Weaver, Silviculture Performance Assessment Specialist,RPB, MFLNRO
Initializing TIPSY with SilvSurvey Data Page 12 of 12
expressed their full impact on young stand stocking levels. The OAF1a abiotic factors are the only truly constant impacts.
OAF recommendations:
Summary: It appears the application of current OAF1 and OAF2 defaults would still be appropriate, were it not for the OAF1b-d issue noted below.
OAF1a: Survey stocking estimates are net NP, similar to TIPSY densities without OAFs. Therefore, the NP portion of OAF1 (OAF1a) should still be applied in TIPSY to adjust polygon yields to a gross-area basis for TSR (etc). The current default OAF1a (e.g., Nussbaum’s 4%) should still be appropriate.
OAF1b-d: The remaining components of OAF1 (biotic factors b-d) are already
incorporated to a limited extent in survey stocking estimates. However, since it is unlikely that stocking estimates in young stands express the full impact of these dynamic factors on future stocking and yield, some (reduced) level of OAF1b-d is still need. A possible interim solution would be to reduce Nussbaum’s default OAF1b-d value (11) by some proportion (e.g., 50%). Further discussion is needed.
OAF2: TSR still use OAF2 for DWB.7 Consideration should be given to switching to the
TIPSY DWB OAF and eliminating all or part of OAF2. Surveys do not provide supporting information to modify DWB-related OAFs, so the existing ones remain appropriate. If OAF2 is used to reflect forest health impacts that manifest slowly over time, then OAF1c may need to be reduced accordingly to avoid double counting.
7 Pers. Comm., Barry Snowdon, Timber Supply Analyst, FAIB, MFLNRO