Embed Size (px)
Citation preview

Numerical simulation of the airflow-rivulet interaction associated
with the rain-wind induced vibration phenomenon.
Ian J. Taylor 1,*, Andrew C. Robertson 2
1 Department of Mechanical Engineering, University of Strathclyde, Glasgow, G1 1XJ,
UK
2 Doosan Babcock Energy Limited, Porterfield Road, Renfrew, PA4 8DJ, UK
ABSTRACT
Rain-wind induced vibration is an aeroelastic phenomenon that occurs on the
inclined cables of cable-stayed bridges. The vibrations are believed to be caused by a
complicated nonlinear interaction between rivulets of rain water that run down the
cables and the wind loading on the cables due to the unsteady aerodynamic flow field.
Recent research at the University of Strathclyde has been to develop a numerical
method to simulate the influence of the external air flow on the rivulet dynamics and
vice versa, the results of which can be used to assess the importance of the water
rivulets on the instability. The numerical approach for the first time couples a Discrete
Vortex Method solver to determine the external flow field and unsteady aerodynamic
loading, and a pseudo-spectral solver based on lubrication theory to model the evolution
and growth of the water rivulets on the cable surface under external loading. The results
of the coupled model are used to assess the effects of various loading combinations, and
importantly are consistent with previous full scale and experimental observations of
*Corresponding author : Department of Mechanical Engineering, James Weir Building,
Montrose Street, University of Strathclyde, Glasgow, G1 1XJ, UK.
Tel.: +44 (0)141 548 3753; Fax: +44 (0)141 552 5105 Email address : [email protected]

rain-wind induced vibration, providing new information about the underlying physical
mechanisms of the instability.
1 INTRODUCTION
On wet and windy days, the inclined cables of cable-stayed bridges can experience
large amplitude oscillations known as Rain-Wind Induced Vibration (RWIV), a
phenomenon which is now accepted as a distinct aeroelastic problem. RWIV was first
formally reported by Hikami and Shiraishi (1988), who recorded the strong influence of
rain on large amplitude cable oscillations during the construction period for the
Meikonishi Bridge, near Nagoya, Japan. Since this initial event, the phenomenon has
been the focus of a considerable amount of research activity in the international wind-
and bridge-engineering communities. Typically RWIV involves large amplitude
oscillations and is thought to occur due to the three way interaction between unsteady
aerodynamic loading, rivulets of rain water running down the surface of the cable and
the structural dynamics of the cable. Despite the significant research effort, a full
understanding of RWIV has yet to be obtained due to the complexity of the aeroelastic
phenomenon.
A range of techniques have been used to investigate RWIV in an attempt to gain a
satisfactory understanding of the instability. To date there have been numerous wind
tunnel experiments to ascertain particular aspects of the phenomenon (Cosentino et al.,
2003; Matsumoto et al., 2001; Wang et al., 2005; Verwiebe and Ruscheweyh, 1998;
Bosdogianni and Olivari, 1996; Gu and Du, 2005), as well as full scale investigations of
RWIV events on bridges that have been observed since the initial report of Hikami and
Shiraishi (1988). Notable examples of bridges on which RWIV have been investigated
are the Erasmus Bridge, Rotterdam, The Netherlands (Geurts et al., 1998), the Fred
Page 2 of 47

Hartman Bridge, Baytown, Texas (Zuo et al., 2008), and the Dongting Lake Bridge,
Hunan Province, China (Ni et al., 2007).
The collective data obtained thus far from the research studies highlighted above has
determined a range of conditions under which the RWIV phenomenon is most likely to
occur. Typically, wind speeds are between 5 and 15 m/s, corresponding to Reynolds
numbers between 0.5×10⁵ to 1.5×10⁵ and reduced velocities 20 ≤ UR ≤ 90 (Cosentino et
al., 2003), where Re is based on the wind speed normal to the cable and the cable
diameter, and UR is defined UR = U∞/fD. Using the angles of inclination in the cable
pylon plane, α, and yaw angle, β, as displayed in the configuration of stay cable
geometry in Fig. 1, it can be said that RWIV typically occurs in cables which descend in
the windward direction at angles of inclination between 20° ≤ ≤ 45° and at yaw angles
between 20° ≤ ≤ 60° (Cosentino et al., 2003; Flamand, 1995; Gu and Huang, 2008).
FIGURE 1: DEFINITION OF ORIENTATION OF STAY CABLE SYSTEM GEO-
METRY.
The cables which undergo vibration are typically found to fall within the diameter
range 100mm ≤ D ≤ 250mm (Cosentino et al., 2003) and to have low structural
damping typically ≤ 0.5% (Gu and Du, 2005), where is the damping ratio of the
cable. The response has typically been found to occur in the 0.6 to 3 Hz frequency
range (Hikami and Shiraishi, 1998; Matsumoto et al., 1992), to occur in more than one
mode (Zuo et al., 2008) and to vibrate at an angle aligned to the cable-pylon plane,
where the cable pylon plane is parallel to the cable axis and contains the inclined cable
as illustrated in Fig. 1. The magnitude of this vibration, although amplitude limited, is
significant with peak to peak responses of up to 2 m being reported, corresponding
Page 3 of 47

typically to amplitude to diameter ratios, a/D, of between 1.0 and 2.0 (Matsumoto et al.,
1992).
One of the key aspects of the RWIV instability is the presence and location of the
rivulets of rain water on the surface of the cable. In experiments, it has been observed
and is now generally accepted, that under most conditions causing RWIV the thin film
of rain water present on the cable normally accumulates to form two rivulets, one on the
upper leeward side and one on the lower windward side, and that the former is largely
responsible for the vibration (Bosdogianni and Olivari, 1996; Flamand, 1995).
Numerous studies have investigated how the location and dynamics of the rivulet affect
the external aerodynamic field and vice versa. These investigations can be broadly
separated into two distinct classes, namely those where the rivulet is replaced by a fixed,
static, rigid protuberance, i.e. an ‘artificial rivulet’ (Gu and Huang, 2008; Matsumoto et
al., 2007) and those where a film of water is sprayed onto the surface of the cable and
the rivulets are allowed to form ‘naturally’ (Wang et al., 2005; Cosentino et al., 2003;
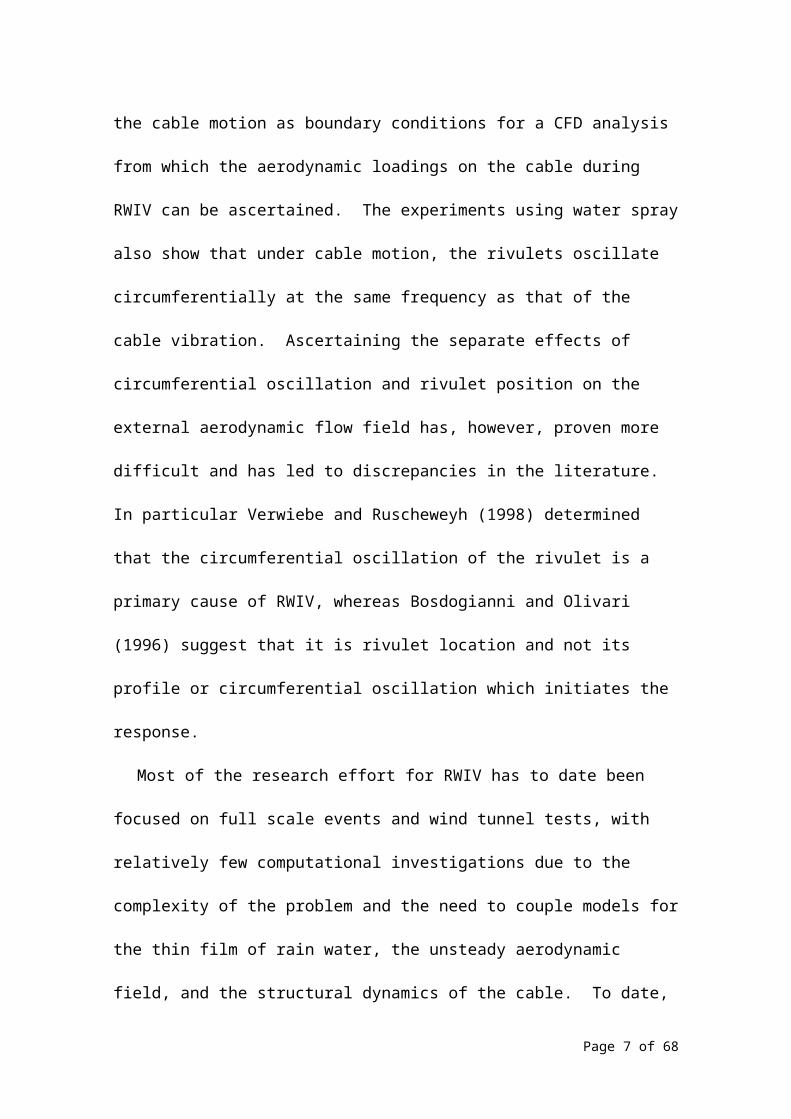
Verwiebe and Ruscheweyh, 1998; Flamand, 1995). Li et al. (2010), also conducted
wind tunnel tests using water spray to create “artificial rainfall” and use the
measurements of the cable motion as boundary conditions for a CFD analysis from
which the aerodynamic loadings on the cable during RWIV can be ascertained. The
experiments using water spray also show that under cable motion, the rivulets oscillate
circumferentially at the same frequency as that of the cable vibration. Ascertaining the
separate effects of circumferential oscillation and rivulet position on the external
aerodynamic flow field has, however, proven more difficult and has led to discrepancies
in the literature. In particular Verwiebe and Ruscheweyh (1998) determined that the
circumferential oscillation of the rivulet is a primary cause of RWIV, whereas
Page 4 of 47

Bosdogianni and Olivari (1996) suggest that it is rivulet location and not its profile or
circumferential oscillation which initiates the response.
Most of the research effort for RWIV has to date been focused on full scale events
and wind tunnel tests, with relatively few computational investigations due to the
complexity of the problem and the need to couple models for the thin film of rain water,
the unsteady aerodynamic field, and the structural dynamics of the cable. To date, the
majority of the numerical investigations of RWIV have focused on fixed rigid artificial
rivulets, with 2D and 3D large eddy simulations (LES) examining the effect that static
rivulets have on the overall flow field (Li and Gu, 2006). Lemaitre et al. (2007)
however presented a different approach using lubrication theory and the time averaged
aerodynamic flow-field over a circular cylinder to ascertain the evolution of the rain
water rivulets.
Research in the Department of Mechanical Engineering at the University of
Strathclyde has focused on developing a numerical model to investigate aspects of
RWIV. The approach adopted is to couple a modified pre-existing unsteady
aerodynamic solver for the external aerodynamic flow field with a solver based on a
thin-film model for the evolution and deformation of the water rivulets. The
development of the thin-film model for the rivulets, and the results from the validation
of the method are presented in detail in Robertson et al. (2010), with results from the
unsteady aerodynamic solver summarized in Robertson and Taylor (2007) and Taylor et
al. (2010).
The research presented herein summarizes the development of a coupled method,
where the unsteady aerodynamic field determines the evolutionary response of the
rivulets, which in turn modifies the aerodynamics due to the change in effective shape
Page 5 of 47

of the body. Results for various loading configurations are summarized, along with key
findings in relation to the underlying mechanism for RWIV, with all the configurations
discussed herein being for a horizontal cable with the freestream flow being orthogonal
to the component of gravity, that is for inclination and yaw angles = = 0° (Fig. 1).
RWIV is a highly complex, non-linear, three-dimensional aeroelastic instability
which to date has undergone only limited numerical modelling. Due to the complexity
of the problem, the creation of a solver capable of fully simulating this phenomenon has
numerous problems to overcome and will require a series of incremental steps, each of
increasing complexity and gradually bearing more resemblance to the full fluid structure
interaction. This research investigation is focussed on one particular aspect of the in-
stability, rivulet formation which is thought to be central to the underlying governing
mechanism. The initial step towards this objective is to simulate a simplified problem,
in two dimensions, to investigate the formation and evolution of rivulets from a thin
film of fluid on the outer surface of a circular cylinder in a uniform flow and gravity
field. Through examination of this simplified representation, the research presented
highlights features associated with the coupled evolution of rivulets which have not pre-
viously been investigated or reported. As well as providing useful information on the
potential underlying physical mechanisms, the coupled model acts as a proof of concept
of both the solver and the methodology and in turn allows the present work to act as the
basis for subsequent development of a more complete numerical method. Despite the
limitations of the two-dimensional approach, it is thought that this novel numerical ap-
proach provides the most advanced model to date for assessing the RWIV instability.
2 AERODYNAMIC MODEL
Page 6 of 47
The two-dimensional discrete vortex method used for this analysis is a modified ver-
sion of the DIVEX code developed at the Universities of Strathclyde and Glasgow
(Taylor and Vezza, 1999, 2001). DIVEX has previously proven successful with un-
steady, incompressible, highly separated flows such as those under investigation (Taylor
and Vezza, 1999) and for related problems involving other aeroelastic phenomenon, a
number of which were examined during the early stages of development (Robertson and
Taylor, 2006). For the RWIV phenomenon in particular, an extensive investigation into
the effects of artificial rivulets on the unsteady aerodynamic flow field, similar to exper-
imental investigations (Matsumoto et al., 2007), has been successfully undertaken. The
results highlighted the importance of the location of the rivulet on the cylinder surface,
and the potential for galloping instabilities for certain configurations (Taylor et al.,
2010).
The numerical technique utilised by vortex methods is based on the discretisation of
the vorticity field rather than the velocity field, into a series of vortex particles (Taylor
and Vezza, 1999; Lin et al., 1997). These particles, of finite core size, each carry a cer-
tain amount of circulation, and are tracked throughout the flow field they collectively
induce. As such, the model does not require a calculation mesh providing a very differ-
ent approach to more traditional grid based computational fluid dynamics methods.
One of the main advantages of such vortex methods over grid based approaches, how-
ever, is that their Lagrangian nature significantly reduces some of the problems associ-
ated with grid methods, such as numerical diffusion and difficulties in achieving resolu-
tion of small scale vortical structures in the flow. Vortex particles are naturally concen-
trated into areas of non-zero vorticity and enable vortex methods to capture these small
scale flow structures in more detail. This aspect of the numerical approach make it
Page 7 of 47

ideally suited to the analysis of the effects of artificial rivulets both locally and on the
overall flow field. A detailed review of the numerical aspects of vortex methods is
provided by Sarpkaya (1989).
2.1 Mathematical Formulation
Two dimensional incompressible viscous flow is governed by the vorticity-stream
function form of the continuity and Navier-Stokes equations (1) and (2) :
Continuity equation :
∇2 Ψ =−ω (1)
Vorticity transport equation :
∂ω∂ t
+(U .∇ ) ω=ν ∇ 2ω(2)
where the vorticity vector, , is defined as the curl of the velocity (3) and is a vector
potential defined by (4)
ω=∇×U with ω=ω k (3)
U =∇×Ψ , ∇ . Ψ =0 with Ψ=Ψk (4)
The vorticity transport equation (2) defines the motion of vorticity in the flow due to
convection and diffusion. As the pressure field is not explicitly defined in (2), the vari-
ation of vorticity at a point in the flow is therefore influenced by the surrounding flow
velocity and vorticity.
The calculations are subject to the far field boundary conditions (5) and the no-slip
and no-penetration conditions at the surface of the body (6).
U =U∞ or ∇ Ψ=∇ Ψ∞ on S∞ (5)
U =U i or ∇ Ψ =∇ Ψ i on S i (6)
Page 8 of 47

The velocity at a point r on the surface or within body i is described by :
U i=U ic+Ω×(r p−ric ) (7)
where ric is a fixed reference point on the body. This may also be represented in stream
function form by
∇2Ψ =−2Ωi in body Bi (8)
To enable the evaluation of the velocity influence on the flow due to the moving
body, the solenoidal velocity field is also applied within body Bi. The solenoidal prop-
erty of the velocity indicates that the stream function, i, is a solution of (4) and satis-
fies both the normal and tangential boundary conditions at the body surface. Hence,
proper definition of the problem allows for only one of the normal and tangential
boundary conditions surface to be explicitly applied. In the current formulation, the
normal component or no-penetration condition is used as the boundary condition and
the tangential, no-slip condition is implicitly satisfied due to the representation of the in-
ternal kinematics of each solid body.
The relationship between the velocity and the vorticity is derived by the application
of Green's Theorem to (1) for the flow region, F, and to (8) for the body region, Bi,
combined through the boundary conditions (5) and (6). From this, the velocity field is
calculated using the Biot-Savart law, which expresses the velocity in terms of the vorti-
city field. For a point p in the flow field, outside the solid region, the velocity is given
by :
U p=U ∞+1
2 π∫Fω
k×(r p−r )‖r p−r‖2 dF+∫Bi
2Ωi
k×(r p−r )‖r p−r‖2 dB i
(9)
where the first term on the RHS represents the freestream velocity influence on the ve-
locity at point p and the second term represents the influence of the vorticity in the flow
Page 9 of 47

field. The third term on the RHS is the induced velocity at point p by a velocity field
with constant vorticity 2Ωi, occupying the solid region Bi. This integral can be trans-
formed into a surface integral along the boundary of the body, Si, rather than an area in-
tegral (with respect to the body area dBi), which enables a simplified evaluation of the
moving boundary condition. This contribution to the velocity is due to the rotational
motion of the body and is zero for the stationary objects considered in the present in-
vestigation.
The pressure distribution on the body surface can be evaluated by integrating the
pressure gradient along the body contour. The pressure gradient at a point on the body
surface is given by equation (10)
1ρ
∂ P∂ s
=−s .DU c
Dt−n . (r−rc ) DΩ
Dt+s . (r−rc ) Ω2+ν ∂ ω
∂ n (10)
where s and n are the tangential and normal vectors to the body surface. The first three
terms on the RHS of (10) are due to the body motion and respectively represent the sur-
face tangential components of the body reference point acceleration, the rotational ac-
celeration and the centripetal acceleration. The final term is the negative rate of vorti-
city creation at the body surface and is calculated from the vorticity distribution created
in the control zone between time t-t and t (Sarpkaya, 1989). The resulting pressure
distribution is integrated around the body surface to calculate the aerodynamic forces on
the body and the moment about the body reference point at a particular timestep.
2.2 Investigation of artificial rivulets
A numerical investigation to ascertain the effect of the circumferential location of
artificial rivulets on the overall flow field was undertaken. As Robertson and Taylor
(2007) describe in more detail, the artificial rivulet used is a trapezoidal profile and is a
Page 10 of 47

similar size and shape to those used in recent wind tunnel studies (Fig. 2). In all cases, a
sub-critical Reynolds number, Re = 2104 (based on the cable diameter), was used and
is consistent with the lower wind speed range for RWIV.
FIGURE 2: MODELLING OF ARTIFICIAL RIVULETS – PROFILE AND DIMENSIONS
OF THE ARTIFICIAL RIVULET.
A full discussion of the artificial rivulet analysis is given in Robertson and Taylor
(2007) and Taylor et al. (2010) with only the single rivulet case presented here. The
upper rivulet is thought to play the greatest role in RWIV. The study investigated the
variation of aerodynamic force coefficients on the cylinder, when the rivulet is located
at various positions on the surface of the cylinder, with the circumferential position of
the rivulet determined by the angle with the freesteam flow, (Fig. 2). The variation of
predicted time-averaged mean aerodynamic force coefficients, lift and drag, C̄L and
C̄D with rivulet location is shown in Fig. 3, where the lift shows good agreement with
results from experimental data (Matsumoto et al., 2007). For comparison, the plain
cylinder (no rivulet) C̄L and C̄D are included (ESDU 1986).
FIGURE 3: VARIATION OF C̄D AND C̄L WITH RIVULET ANGLE FOR THE SIN-
GLE ARTIFICIAL RIVULET CASE, COMPARED WITH EXPERIMENTAL DATA FROM
MATSUMOTO ET AL. (2007). PLAIN CYLINDER MEAN LIFT AND DRAG TAKEN
FROM ESDU (1986).
The presence of the rivulet on the cable surface leads to four distinct flow regimes
which can be clearly identified in the aerodynamic force results. These four flow
regimes and their key features described in the following discussion have been
Page 11 of 47

ascertained mainly from the numerical results from this study, a fuller description of
which is given in Robertson and Taylor (2007) and Taylor et al. (2010). These
observations are however, consistent with those of Matsumoto et al. (2007). At angles
< 45° the attached rivulet has little effect on either of the mean aerodynamic coefficients
(lift C̄L and drag C̄D ) in comparison to the dry cylinder case, as the rivulet is located
too close to the front of the cylinder for it to have a significant effect on the separation
of the shear layers and wake formation. The rivulet does cause a local separation of the
shear layer, though at these low angles the flow almost immediately reattaches to the
cylinder, with full separation occurring only at the same location as a dry cylinder.
Hence the overall mean loadings are not strongly affected, as is also demonstrated by
the experimental results, where the lift is determined to be zero until approximately 35°.
The experiments data was obtained using a slightly higher Reynolds number of 2.6104
(Matsumoto et al., 2007), which may give some explanation for the increase in lift
occurring at a slightly lower angle due to the effect of Re on the boundary-layer
formation.
At 45° a sudden change in flow regime occurs, with a rapid increase in time-
averaged mean lift coefficient and a corresponding but much smaller decrease in time-
averaged mean drag coefficient. This occurs because the rivulet is now sufficiently far
from the stagnation point that it causes the boundary layer to trip, thus influencing the
location of the separation point on the upper side of the cylinder. This transition to
turbulent flow on the upper side causes the flow to detach at a greater angle from
incidence than the laminar flow on the lower (non-rivulet) side, which results in an
asymmetric flow field generating a positive lift force, towards the side of the rivulet.
Page 12 of 47

At angles above 60° the tripped flow on the upper surface detaches from the
cylinder at the rivulet location, and this probably occurs earlier than on the lower
surface. The resulting asymmetric flow with negative lift (towards the opposite side
from the rivulet) and the increase in cross-flow wake size are caused by the detachment
of the flow, which also results in an increase in the drag.
When the angle is greater than 100°, the rivulet is located sufficiently far past
the separation point to ensure that it is in the region of the cylinder surface that is
immersed in the wake and thus has a negligible impact on the aerodynamic properties of
the body itself.
Crucially in the second of these regimes, 50° < < 60°, unlike at any other angular
position, Karman vortex shedding is suppressed and no clear Strouhal frequency can be
detected (Fig. 4). Spectral analysis of the lift coefficient highlights that for rivulets
located at angles < 50° or > 60°, a single dominant peak was present in the power
spectral density (PSD) corresponding to a non-dimensional frequency of around 0.21, as
would be expected when Karman vortex shedding is present for a circular cylinder. For
rivulets in the angle range 50° < < 60°, the magnitude of the PSD was substantially
reduced and a broadband frequency response was obtained, with no dominant frequency
being discernable, highlighting that vortex shedding has been suppressed (Fig. 4). The
negative lift curve slope in this range of angles (Fig. 3) suggests that this could lead to a
potential galloping instability, and at these angles the Den Hartog criterion,
dCL
dθ+C D<0
, was found to be valid.
FIGURE 4: SPECTRAL ANALYSIS WITHIN AND OUTSIDE ANGLE RANGE 50° < <
60° : a) WITHIN ANGLE RANGE, = 50°; b) OUTSIDE ANGLE RANGE, = 20°.
Page 13 of 47

3 NUMERICAL MODELLING OF WATER RIVULET
3.1 Mathematical modeling of the rivulet dynamics
Two-dimensional, unsteady flow of a thin film of incompressible viscous fluid with
uniform dynamic viscosity, , and density, , on the outer surface of a stationary
horizontal circular cylinder of radius R is considered. This restricts all loading to act
purely within the two-dimensional system defined and is in line with the previous
numerical and analytical studies into aspects of RWIV (Matsumoto et al., 1992; Li and
Gu, 2006; Lemaitre et al., 2007). Should an inclined cylinder be considered, then the
effective component of gravity would be reduced; however, this would introduce a
gravity-driven flow down the cylinder, and would also introduce uncertainties regarding
the effective cylinder cross-section and the resulting aerodynamic loading. For this
analysis, the only configuration considered is for the case when the windward direction
is orthogonal to the component of gravity.
FIGURE 5 : A THIN FLUID FILM ON A HORIZONTAL CYLINDER.
As illustrated in Fig. 5, the free surface of this film is subject to a prescribed
pressure, P = P(, t), and a prescribed shear, T = T(, t), exerted by the external
aerodynamic field, which are both functions of clockwise angle from the windward
(left-hand) horizontal, (0° ≤ ≤ 360°) and time t. The evolution equation for the water
thickness on the cylinder surface, h(, t), is given by
ht+[− 13 μR (ρg cosθ−
γR3 (h+hθθ )θ+
Pθ
R ) h3+Th2
2 μR ]θ=0 , (11)
the full derivation of which is given in Robertson et al. (2010) and where the subscripts
in (11) denote differentiation. This equation is to be solved subject to an initial condition
Page 14 of 47

of the form h(, 0) = h0(), where h0() is the initial thickness of the film. For
definiteness in the present work we have chosen an initially uniform film h0 = constant,
and allow the film to evolve according to (11), to see if two-dimensional ‘rivulets’
develop. This evolution equation (11) is consistent with the corresponding equation
given by Lemaitre et al. (2007) in the case of flow on a static cylinder and with an
earlier equation (Reisfeld and Bankoff, 1992) for the case without aerodynamic loading.
Given the nature of the problem, the same assumptions regarding the thin film and the
boundary conditions were made here as were made in Lemaitre et al. (2007), and so the
evolution equation (11) is essentially the same; however, unlike in the previous work,
we present (11) in a dimensional rather than non-dimensional format, this being done to
facilitate the coupling to the unsteady aerodynamic solver.
3.2 Numerical Solver
As the evolution equation (11) is a fourth order, non-linear, non-constant coefficient
partial differential equation, it cannot, in general, be solved analytically. Therefore, a
pseudo-spectral (or collocation) method solver using an N-point Fourier spectral mode
in space and a fourth order Adams–Bashforth time-marching algorithm was constructed.
This numerical method was chosen specifically because of the periodic, continuous
nature of the problem over the interval [0°, 360°) and the rapid rate of convergence it
provides to the solution, given the presumed smoothness of the final result.
As with the mathematical formulation there are again distinct similarities between
the present numerical solver and those presented in previous research (Lemaitre et al.,
2007; Reisfeld and Bankoff, 1992), reflecting the fact that the Fourier pseudo-spectral
method is well suited to the problem under examination.
Page 15 of 47

The development of the numerical model and the results of a detailed validation and
verification study investigating the effects of a static aerodynamic field on the rivulet
evolution are presented in Robertson et al. (2010). The static aerodynamic field implies
that the distributions of pressure and shear are fixed throughout the calculation. Hence,
the pressure and shear only vary with circumferential location on the cylinder, , and do
not vary with time, (P = P() and T = T()). Likewise, as rivulets are formed in the thin
film, their effect is not accounted for in the pressure and shear distributions which
remain unchanged during the calculation.
Results from this analysis found that rivulets form at locations on the cylinder that
correspond to the separation points on a dry cylinder at the same Re. For the full loading
case (pressure, shear, surface tension and gravity) two distinct rivulets can be seen to
form, though due to the effect of gravity (Fig. 6), the rivulets form asymmetrically with
the upper rivulet forming at ≈ 59° and the lower rivulet forming at ≈ 282° (rivulet
location being defined as the point of maximum film thickness clockwise from the
windward horizontal ). Also, the gravitational loading causes the rivulets to be thicker
on the lower surface and thinner on the upper surface, as would be expected. Under the
constant aerodynamic loading, the rivulets continue to grow in thickness, with no
maximum value reached by the end of the calculation. A full discussion of these results
is provided in Robertson et al. (2010).
FIGURE 6. NUMERICAL PREDICTION OF TEMPORAL EVOLUTION OF FILM
THICKNESS UNDER FULL LOADING CONDITIONS : UNCOUPLED SOLUTION
WITH CONSTANT PRESSURE AND SHEAR.
4 COUPLING AERODYNAMIC AND RIVULET NUMERICAL MODELS
Page 16 of 47

The unsteady aerodynamic solver, and the pseudo-spectral method solver for the
water rivulet have been combined to form a coupled solver capable of predicting rivulet
formation and evolution subject to an external aerodynamic field which they in turn in-
fluence.
Experimental studies which consider the evolution of ‘natural’ rivulets have gener-
ally concentrated on ascertaining the conditions under which RWIV occurs and not on
the exact form of these rivulets (Verwiebe and Ruscheweyh, 1998; Gu and Du, 2005;
Flamand, 1995), though recent studies are beginning to provide more detailed informa-
tion on the rivulet dynamics (Cosentino et al., 2003; Li et al., 2010). Likewise, this is
the first time such a solver has been created. Therefore specific data against which to
quantitatively verify either the coupled solver, or the results it predicts is unavailable,
although qualitative comparison with experimental observations is possible. That said,
both of the individual solvers combined to create this coupled solver have been inde-
pendently validated for related problems as discussed above (Robertson et al., 2010;
Taylor et al., 2010), which thereby generates a significant level of confidence in the
coupled solver.
4.1 Construction of coupled solver
A flowchart displaying the basic operation of the coupled solver is displayed in Fig.
7, where DVM denotes the discrete vortex method aerodynamic solver. One inherent as-
pect of vortex methods, particularly those which employ an operator splitting scheme
for the convection and diffusion of the flow, is that “the statistical nature of the results
requires the averaging or smoothing of the velocity and pressure distributions and integ-
rated quantities” (Sarpkaya, 1989). Therefore while the mean pressure and shear distri-
butions, C̄ p and C̄F calculated by DIVEX were smooth, at a specific instant of time
Page 17 of 47

there may be significant noise within a given distribution, Cp and CF. Consequently after
interpolating the transient aerodynamic loading determined by DIVEX, such that it can
be passed to the thin film solver, this was subjected to smoothing algorithm to reduce
any such noise.
FIGURE 7: SIMPLIFIED FLOWCHART OF THE FINAL COUPLED SOLVER.
4.2 Results
The values of the physical parameters used in the study are summarised below in
Table 1. The Reynolds number was selected to be 1×10⁵, chosen as it represented the
mid-point of the typical range for RWIV, 0.5×10⁵ < Re < 1.5 × 10⁵, as outlined earlier in
the introduction. The cylinder is initially considered to be fully wetted with a film of
equal thickness, with an initial film thickness, h0, of 0.25×10⁻³ m. This particular value
This particular value of the film thickness has been chosen to be consistent with the ob-
servations from experiments (Cosentino et al., 2003).
TABLE 1. VALUES OF THE STANDARD PARAMETERS USED IN THE NUMERICAL
CALCULATION.
In the coupled method, the distributions of pressure and shear vary in time and are
determined from the unsteady aerodynamic solver. For a particular time instant, the
pressure and shear are used as input to the pseudo-spectral solver for the thin water film
on the cable surface to determine the variation of water thickness. The new distribution
of film thickness around the surface is then used to determine the new effective body
geometry in the aerodynamic solver, which in turn calculates the flow field and new
Page 18 of 47

pressure and shear distributions for the next time instant. Thus, the aerodynamic flow
field determines the rivulet evolution and growth and vice versa.
To ascertain whether rivulets do indeed form using distributions of Cp and CF based
upon the evolving cross-section geometry and to determine the differences between
these results and those for fixed aerodynamic loading, four combinations of loading
were examined. These differed by means of which loads (pressure, shear, surface ten-
sion and gravity) were passed between the pseudo-spectral and the aerodynamic solvers
and were chosen to match the combinations studied previously (Robertson et al., 2010).
Specifically these were:
1: Shear and surface tension (P ≡ 0 and g = 0)
2: Pressure and surface tension (T ≡ 0 and g = 0)
3: Shear, pressure and surface tension (g = 0)
4: Full loading (P, T, g and γ ≠ 0)
By choosing these cases the individual effects of shear and pressure loading on
coupled rivulet formation could be studied independently, before the combined effect
along with gravitational loading was considered.
4.2.1 Shear and Surface Tension Loading.
Figs. 8 and 9 display the temporal evolution of film thickness under the combination
of shear and surface tension loading. From these results, three points become apparent.
First, as was found previously when this combination of loading was examined for a
fixed CF distribution (Robertson et al., 2010), two large rivulets formed quickly at
approximately the separation points of a dry circular cylinder, one each on the upper
and lower surface, with the initial locations of these being ≃ 83° and ≃ 277° on the
upper and lower surface respectively.
Page 19 of 47

FIGURE 8: NUMERICAL PREDICTION OF RIVULET EVOLUTION UNDER SHEAR
AND SURFACE TENSION LOADING.
FIGURE 9: COMPARISON OF TEMPORAL EVOLUTION OF NORMALISED FILM
THICKNESS FOR UPPER AND LOWER RIVULET UNDER SHEAR AND SURFACE
TENSION LOADING.
FIGURE 10: COMPARISON OF TEMPORAL EVOLUTION OF RIVULET LOCATION
OF THE UPPER AND LOWER RIVULETS FROM THE WINDWARD HORIZONTAL
UNDER SHEAR AND SURFACE TENSION LOADING. UPPER RIVULET, CLOCK-
WISE FROM THIS POINT, LOWER RIVULET ANTI-CLOCKWISE (ac) FROM THIS
POINT. VARIATION OF AND ac WITH t.
Secondly the growth rate, maximum thickness and form of both the upper and lower
of these larger rivulets are approximately equal, (Fig. 9). Even the temporal movement
leeward of the points of maximum thickness does so symmetrically with respect to the
mean stagnation point of the incident flow, (Figs. 8 and 10), with this leeward progres-
sion occurring as the shear load acts tangentially to the surface. As such, once rivulets
form they are continually ‘pushed’ away from the stagnation point of the incident flow,
which causes the point of maximum thickness to move from ≃ 83° to ≃ 93° on the
upper surface and from ≃ 277° to ≃ 267° on the lower surface (Fig. 10). Whilst
there are small temporal variations in both the thickness and location of the upper and
lower rivulets, the evolution of two rivulets can be said to occur in a symmetric manner.
Importantly, the height of the rivulet appears to oscillate slightly, with a period of
around 0.075 to 0.08 s, which for the parameters chosen in the analysis, corresponds to
Page 20 of 47

the Strouhal frequency for vortex shedding (Fig. 9). This indicates an interaction
between the water rivulet and the external aerodynamic field. Similar oscillations,
though much smaller and not as prevalent are noticeable in the rivulet location (Fig. 10).
These observations are consistent with previous experimental observations (Cosentino
et al., 2003; Verwiebe and Ruscheweyh, 1998), though the oscillation of rivulet location
is not as noticeable in our simulations and further work is required to determine the
reason for this discrepancy.
Finally and most importantly, as can be seen from Fig. 9, the maximum thickness of
both of the rivulets is self limiting. This is in direct contrast to the previous results
(Robertson et al., 2010) when the same combination of loading was examined and
where rivulet thickness continued to increase until the thin film approximation was viol-
ated. Unlike the previous study and as discussed above, the distribution of CF used in
the coupled approach does account for the growth of the rivulet and therefore does
change with time. As a result the rivulets which develop under an external aerodynamic
field grow rapidly to a thickness of h ≃ 0.65 × 10⁻³ m before remaining of approxim-
ately constant thickness. This is a major finding and better reflects the real rivulets of
limited thickness which have been found ‘in-situ’ under RWIV conditions and those
which have been found experimentally in the wind-tunnel. The thickness of the rivulet
was measured experimentally under full loading conditions, using a non-fully wetted
cable by Cosentino et al. (2003) and was found to vary in the range h ≃ 0.2 - 0.55 × 10⁻³
m, which is qualitatively in-line with that determined here. However, the different con-
figurations between the experiments (inclined cable, non fully wetted) and numerical
predictions (horizontal cylinder, fully wetted) mean that not too much can be read into
Page 21 of 47

this result, though the as the predicted thickness is consistent with previous observa-
tions, it provides some verification of the numerical approach being used.
4.2.2 Pressure and Surface Tension Loading.
The temporal evolution of film thickness for a combination of pressure and surface
tension loading can be seen in Figs. 11 and 12. The results of this test case highlight
many of the same features of the previous shear loading case. Most notably that two
symmetric rivulets of self limiting thickness were found to form marginally windward
of the separation points of the dry cylinder, at ≃ 73° and 287° respectively, although
two other rivulets were also found in the wake (Fig 11 and 13). That said however, the
rivulets formed at approximately the separation points under pressure loading were
found to be located just windward of those formed from shear loading, consistent with
previous results (Robertson et al., 2010).
FIGURE 11: NUMERICAL PREDICTION OF TEMPORAL EVOLUTION OF FILM
THICKNESS IN REAL TIME, UNDER PRESSURE AND SURFACE TENSION
LOADING.
FIGURE 12: COMPARISON OF TEMPORAL EVOLUTION OF NORMALISED FILM
THICKNESS OF UPPER AND LOWER RIVULET UNDER PRESSURE AND
SURFACE TENSION LOADING.
FIGURE 13: COMPARISON OF TEMPORAL EVOLUTION OF RIVULET LOCATION
OF THE UPPER AND LOWER RIVULETS FROM THE WINDWARD HORIZONTAL
UNDER PRESSURE AND SURFACE TENSION LOADING. UPPER RIVULET,
Page 22 of 47

CLOCKWISE FROM THIS POINT, LOWER RIVULET ANTI-CLOCKWISE (ac) FROM
THIS POINT. VARIATION OF AND ac WITH t.
Studies into the location, growth rate and thickness of the two rivulets at approxim-
ately the separation points of the dry circular cylinder confirmed that those present on
the upper and lower surfaces were once again symmetric images of one another. Com-
paring the temporal evolution of the maximum thickness of the rivulets in this case with
those from the previous case with shear loading (Figs. 9 and 12), it can be established
that while the magnitude of the rivulets’ self limiting thickness are similar, h ≃ 0.72 ×
10−3 m from pressure loading as opposed to h ≃ 0.65 × 10⁻³ m from shear loading, the
rates at which these evolve are not. The maximum thickness of the rivulets which
evolve due to pressure loading from the external aerodynamic field is reached consider-
ably faster than the maximum thickness of those forming due to the shear loading (≈ 0.6
s compared to ≈ 0.25 s). This is again in good agreement with previous results for fixed
pressure and shear distributions (Robertson et al., 2010) and likewise, the maximum
thickness is comparable to experimental results (Cosentino et al., 2003).
Unlike the shear loading case however while the upper and lower rivulets do form at
approximately the same angle from the windward horizontal, clockwise and anti-clock-
wise respectively, the location of maximum film thickness does not vary significantly
with time; remaining approximately constant at ≃ 73° (Fig. 13). Where because pres-
sure acts normal to the surface, despite some local movement of fluid to allow for the
changes in film thickness, there is not the same net flow from the windward to the lee-
ward face that was found in the shear case. As in the shear loading case, the height and
location of the rivulet fluctuates with a frequency similar to the Strouhal frequency
though the variation is small. This is in a slight contrast to experimental observations
Page 23 of 47
where the rivulet location also oscillates and further work is required to understand the
differences.
The mean pressure coefficient around the cylinder, once the rivulet has reached its
maximum thickness is illustrated in Fig. 14, compared with the pressure distribution for
a plain cylinder predicted using the DVM aerodynamic solver.
FIGURE 14: COMPARISON OF THE DISTRIBUTIONS OF TIME AVERAGED MEAN
PRESSURE COEFFICIENT DETERMINED UNDER PRESSURE AND SURFACE
TENSION LOADING BY THE COUPLED SOLVER LOADING WITH PREDICTED
PRESSURE COEFFICIENT FOR A PLAIN CIRCULAR CYLINDER USING THE DVM
SOLVER.
The reduction in the minimum mean pressure coefficient is attributable to the forma-
tion of the main rivulet at this circumferential location. The reduced minimum pressure
is likely to be caused by a local acceleration of the flow around the profile of the rivulet.
The formation of the secondary smaller rivulet, discernable in Fig. 14, likewise causes a
second, smaller, minimum in the pressure coefficient whose location corresponds to this
rivulet. From the available results in this investigation, the smaller downstream rivulets
are felt to be caused by secondary vortices in the flow due to vortex shedding, and are
present in these results due to the coupled nature of the model, where the rivulet shape
influences the unsteady pressure distribution and vice versa. However, no experimental
data is currently available to determine whether this is a real or numerical effect, and at
present this is a tentative interpretation. It also appears that this second minimum in the
pressure causes a reduced base pressure region and lower base suction pressure and
hence lower mean drag coefficient, C̄D .
Page 24 of 47

4.2.3 Combined Pressure and Shear Loading.
Having studied the effects of both shear and pressure loading separately, a study for
both loadings acting in combination with surface tension was undertaken, with the res-
ults found to be similar to the previous two independent cases.
FIGURE 15: NUMERICAL PREDICTION OF TEMPORAL EVOLUTION OF FILM
THICKNESS, UNDER PRESSURE, SHEAR AND SURFACE TENSION LOADING.
FIGURE 16: COMPARISON OF THE TEMPORAL EVOLUTION OF NORMALISED
FILM THICKNESS OF THE UPPER RIVULET FOR VARIOUS LOADING
CONDITIONS.
As expected given the symmetry of the rivulets which formed in the individual load-
ing cases, the rivulets which formed under a combination of pressure and shear were
again found to be approximately symmetric with respect to the incoming flow (Fig. 15).
Furthermore the rivulets formed were once again found to be of self limiting thickness;
the maximum magnitudes of which were very similar to the pressure loading case (Fig.
16). The initial growth rate of these rivulets however was marginally quicker than the
corresponding growth rate for the independent pressure case as shear loading now
works in combination with this to form the rivulet and as such the rivulets under com-
bined loading evolve more quickly. Likewise these rivulets were found to occur at an
intermediate location between where the rivulets were found to form in the independent
pressure and shear cases (Fig. 17). That said the exact locations of these rivulets at ≃
77° and ≃ 283°, were once again found to be closer to the locations of those formed
under only pressure and surface tension loading. These locations of maximum rivulet
thickness were also found to remain approximately constant with time, which is also in
Page 25 of 47

closer agreement with the pressure loading case than the shear loading case. Therefore
while it can be said that both pressure and shear loading play a role in the evolution of
these rivulets, it appears that pressure has greater influence. Once more, the height and
location of the rivulets oscillate slightly with a frequency similar to the Strouhal fre-
quency though the effect is not as large as previous observations from experiments. It
does appear from the results in Fig. 17 that the effect is larger in the cases that include
pressure, though further investigation is required to understand these results more com-
pletely.
FIGURE 17: COMPARISON OF THE TEMPORAL EVOLUTION OF RIVULET
LOCATION OF THE UPPER RIVULET FOR VARIOUS LOADING CONDITIONS.
4.2.4 Full Loading.
Given that the coupled solver is two-dimensional and that the governing evolution
equation (11) was derived for a horizontal cylinder, the full loading case to be examined
here essentially represents the physical loading on a horizontal cable perpendicular to
the incoming flow, i.e. = = 0° (Fig. 1). By comparing the evolutionary profile of
film thickness for the present case (Fig. 18 and 19), with those from the previous load-
ing combinations, significant differences become apparent.
FIGURE 18: NUMERICAL PREDICTION OF TEMPORAL EVOLUTION OF FILM
THICKNESS IN REAL TIME, UNDER FULL LOADING.
Page 26 of 47

FIGURE 19: NUMERICAL PREDICTION OF TEMPORAL EVOLUTION OF FILM
THICKNESS CLOSE TO THE REGION OF THE UPPER RIVULET IN REAL TIME,
UNDER FULL LOADING.
The most noticeable of these differences being that, as expected, the symmetry of
the two previous cases examined is lost due to the effect of gravity. The ‘noise’ present
when pressure loading was considered is also considerably lessened. In combination
with the lack of symmetry, this indicates that gravity has a stronger influence than either
of the loadings due to the external aerodynamic field (pressure and shear) for the present
conditions, although these do still play a role. Therefore while a distinct rivulet can be
seen to form on the lower surface at approximately the lowest point on the cylinder, ≃ 277°, the temporal evolution of the upper surface is more complicated and necessitates
more detailed review. These two surfaces are therefore discussed separately.
The thickness of this lower rivulet, like those of the previous loading cases investig-
ated, is self limiting. In this instance at approximately 0.68 × 10⁻³ m, which is consist-
ent with previous results and is quantitatively in-line with the upper rivulet measured
experimentally (Cosentino et al., 2003). Furthermore as this rivulet forms on the lower
surface, due to the additional effect of gravity this evolves more quickly than either of
the previous loading combinations examined. The location of this rivulet as defined by
the point of maximum thickness has likewise moved leeward (towards the lowest point)
due to the effect of gravity.
While the lower rivulet is easy to distinguish, the evolution of the thin film on the
upper surface is considerably more complicated. A small rivulet does periodically form
on the upper surface at approximately = 67° (Figs. 18 & 19), before moving away in a
‘rippling’ motion due to the combination of aerodynamic and gravitational loading. A
similar effect of rivulets periodically forming on the cable surface is observed by Li et
Page 27 of 47

al. (2010) in recent wind tunnel experiments. The location at which rivulets are forming,
= 67°, is in the region previously determined to be danger for RWIV. From the artifi-
cial rivulets studies (Taylor et al., 2010; Matsumoto et al., 2007), this location is within
the range of negative lift slope and may increase susceptibility to galloping and like-
wise, previous experimental studies have shown that rivulets in this location cause the
largest cable response (Bosdogianni and Olivari, 1996; Gu and Du, 2005). The thick-
ness and location of this rivulet therefore vary with time and Fig. 20 illustrates this peri-
odic formation of rivulets by tracking the variation in film thickness at = 67°, from
which the period of formation can also be determined as approximately 0.23 s. Interest-
ingly this is three times the period of Karman vortex shedding for this body, which is
the same value that was found by Matsumoto et al. (2001) to play an important role in a
high reduced velocity vortex-induced vibration (HSV) phenomenon. Matsumoto et al.
(2001) also indicates that the presence of rivulets on the cable surface seems to enhance
the instability, illustrating some as yet undetermined link between HSV and the rivulets.
Hence, the periodic appearance of this rivulet at an angular location that, as discussed
above, is in the range that may cause instabilities, could prove to be a contributory
factor to the underlying cause of the HSV phenomenon. As both flow features occur at
the same frequency of 1/3fs, this observation may lead to an insight into the underlying
mechanism that could link HSV to RWIV. However, this is only an initial observation
and as the axial vortex previously identified (Matsumoto et al., 2001) as being of central
importance to this is a three-dimensional flow feature it cannot be captured in the
present 2D work. As such this conjectured link is very tentative. Further work to invest-
igate any such link is a subject of future research projects and would require a fully 3D
numerical approach.
Page 28 of 47

FIGURE 20: TEMPORAL EVOLUTION OF FILM THICKNESS AT A LOCATION 67°
CLOCKWISE FROM THE WINDWARD HORIZONTAL UNDER FULL LOADING
CONDITIONS.
5 CONCLUSIONS
A coupled model to investigate the Rain-Wind-Induced Vibration of cables has been
developed. This utilizes an unsteady aerodynamic solver utilizing a vortex method
approach together with a pseudo-spectral model to solve the evolution equation, for the
water rivulet. This novel approach provides the most detailed simulations of the RWIV
phenomenon to date.
Three combinations of loading were investigated, to examine the independent
effects of shear and pressure, before combining these along with gravitational loading to
ascertain the effects of the full physical loading on the rivulet dynamics.
The location and growth rates of the rivulets formed in each case agree well with
previous investigations using fixed aerodynamic loading and with each other. These
were located marginally windward of the separation points of the dry cable and
symmetric with respect to the incident flow when gravity was not considered.
For the first time the thickness of the rivulets were found to be self limiting as a
result of varying aerodynamic load due to rivulet growth. The thickness of the rivulets
was found to be consistent with previous experimental results.
When gravitational loading was considered, this symmetry was lost with a larger
lower rivulet found to evolve with approximately the same growth rate and the thick-
ness as those under previous loading conditions. This was once again of self-limiting
thickness. On the upper surface a small single rivulet was found to form periodically,
Page 29 of 47

before moving to join the lower rivulet under the actions of combined loading. The
periodic nature of this rivulet is consistent with key mechanisms for RWIV previously
identified.
NOMENCLATURE
a amplitude of cable vibration
B solid body in unsteady aerodynamic solver
CD coefficient of drag
C̄D mean (time averaged) coefficient of drag
CF coefficient of friction
C̄F mean (time averaged) coefficient of friction
CL coefficient of lift
C̄L mean (time averaged) coefficient of lift
C p coefficient of pressure
C̄ p mean (time averaged) coefficient of pressure
D diameter of cable / cylinder
F flow field in unsteady aerodynamic solver
f body oscillation frequency
g acceleration due to gravity
h thickness of water film on surface of cylinder
i, j, k unit orthogonal vectors
n, n unit vector and distance normal to body surface
P pressure distribution
Page 30 of 47

R radius of cylinder
Re Reynolds number = UD/
r position vector
S surface of body in unsteady aerodynamic solver
s, s unit vector and distance tangential to body surface
T shear distribution
t time
U, U velocity vector and magnitude
UR reduced velocity ( = U∞/fD )
cable inclination angle
cable yaw angle (angle of cable to wind direction)
surface tension of water
damping ratio
angle around circumference of cylinder
dynamic viscosity of fluid
kinematic viscosity of fluid
density of fluid
vector potential and stream function
ΩΩ rotational velocity of solid body, vector and magnitude
vorticity vector and magnitude
Subscripts
∞ freestream; far field
Page 31 of 47

i denotes number of the body under consideration (for this study with a single
body, will always ≡ 1)
ic Denotes reference point for the body.
p point within flow or on body surface.
ac anti-clockwise around cylinder surface
DxDt
=∂ x∂ t
+( x .∇ ) xMaterial derivative of vector x
ACKNOWLEDGMENTS
The first author, Andrew Robertson, gratefully acknowledges the support of the UK
Engineering and Physical Sciences Research Council (EPSRC) via a Doctoral Training
Account studentships. The support and collaboration of Prof. Stephen Wilson, Dr Brian
Duffy and Dr Julie Sullivan, Department of Mathematics, University of Strathclyde, in
deriving the evolution equation is gratefully acknowledged.
REFERENCES
Bosdogianni, A., Olivari, D., 1996. Wind and rain induced oscillations of cables of
stayed bridges. J. Wind Eng. Ind. Aerod. 64(2-3), 171-185.
Cosentino, N., Flamand, O., Ceccoli, C., 2003. Rain-wind induced vibration of inclined
stay cables. Part I: Experimental investigation and physical explanation. Wind Struct.
6(6), 471-484.
ESDU, 1986. Mean forces, pressures and flow field velocities for circular cylindrical
structures: single cylinder with two-dimensional flow. Engineering Sciences Data Unit
International, Item 80025, Amendment C.
Page 32 of 47

Flamand, O., 1995. Rain-wind induced vibration of cables. J. Wind Eng. Ind. Aerod.
57(2-3), 353-362.
Geurts, C., Vrouwenvelder, T., Van Staalduinen, P., Reusink, J., 1998. Numerical mod-
elling of rain-wind-induced vibration : Erasmus Bridge, Rotterdam. Struct. Eng. Int.,
IABSE 8(2), 129-135.
Gu, M., Du, X., 2005. Experimental investigation of rain-wind-induced vibration of
cables in cable stayed bridges and its mitigation. J. Wind Eng. Ind. Aerod. 93(1), 79-
95.
Gu, M., Huang, L., 2008. Theoretical and experimental studies on the aerodynamic
instability of a two-dimensional circular cylinder with a moving attachment. J. Fluid.
Struct. 24(2), 200-211.
Hikami, Y., Shiraishi, N., 1988. Rain-wind induced vibrations of cables in cable stayed
bridges. J. Wind Eng. Ind. Aerod. 29(1-3), 409-418.
Lemaitre, C., Hemon, P., De Langre, E., 2007. Thin water film around a cable subject
to wind. J. Wind Eng. Ind. Aerod. 95(9-11), 1259-1271.
Li, H., Chen, W.-L., Xu, F., Li, F.-C., Ou, J.-P., 2010. A numerical and experimental
hybrid approach for the investigation of aerodynamic forces on stay cables suffering
from rain-wind induced vibrations. J. Fluid. Struct. 26(7-8), 1195-1215.
Li, S.Y., Gu, M., 2006. Numerical simulations of flow around stay cables with and
without fixed artificial rivulets. Proc. 4th Int. Symp. Comp. Wind Eng. (CWE2006),
Yokohama, Japan, 307-310.
Lin, H., Vezza, M., Galbraith, R.A.McD., 1997. Discrete vortex method for simulating
unsteady flow around pitching aerofoils. AIAA J. 35(3), 494-499.
Page 33 of 47

Matsumoto, M., Shiraishi, N., Shirato, H., 1992. Rain-wind induced vibration of cables
of cable-stayed bridges. J. Wind Eng. Ind. Aerod. 41-44, 2011-2022.
Matsumoto, M., Yagi, T., Shigemura, Y., Tsushima, D., 2001. Vortex-induced cable
vibration of cable-stayed bridges at high reduced wind velocity. J. Wind Eng. Ind.
Aerod. 89(7-8), 633-647.
Matsumoto, M., Yagi, T., Adachi, Y., Hatsuda, H., Shima, T., 2007. Karman vortex ef-
fects on aerodynamic instabilities of inclined stay-cables. Proc. 12th Int. Conf. Wind
Eng. Cairns, Australia, 175–182.
Ni, Y.Q., Wang, X.Y., Chen, Z.Q., Ko, J.M., 2007. Field observations of rain-wind-in-
duced cable vibration in cable-stayed Dongting Lake Bridge. J. Wind Eng. Ind. Aerod.,
95(5), 303-328.
Reisfeld, B., Bankoff, S.G., 1992. Non-isothermal flow of a liquid film on a horizontal
cylinder. J. Fluid Mech. 236, 167-196.
Robertson, A.C., Taylor, I.J., 2006. Numerical analysis of forced oscillations of a
circular cylinder using a discrete vortex method. Proc. 7th UK Conf. on Wind Eng.,
Glasgow, UK, 135-138.
Robertson, A., Taylor, I.J., 2007. Effect of rivulets on a circular cylinder using a 2D dis-
crete vortex method. Proc. 12th Int. Conf. Wind Eng. Cairns, Australia, 863-870.
Robertson, A.C., Taylor, I.J., Wilson, S.K., Duffy, B.R., Sullivan, J.M., 2010.
Numerical simulation of rivulet evolution on a horizontal cable subject to an external
aerodynamic field. J. Fluid. Struct. 26(1), 50-73.
Sarpkaya, T., 1989. Computational Methods with Vortices - The 1988 Freeman Scholar
Lecture. J. Fluid. Eng. – T. ASME 111(1), 5-52.
Page 34 of 47

Taylor, I.J., Vezza, M., 1999. Prediction of unsteady flow around square and
rectangular cylinders using a discrete vortex method. J. Wind Eng. Ind. Aerod. 82(1-3),
247-269.
Taylor, I.J., Vezza, M., 2001. Application of a discrete vortex method for the analysis of
suspension bridge deck sections. Wind Struct. 4(4), 333-352.
Taylor, I.J, Robertson, A.C., Wilson, S.K., Duffy, B.R., Sullivan, J.M., 2010. New de-
velopments in rain-wind induced vibrations of cables. P. I. Civil Eng. Str. B. 163(2),
73-86.
Verwiebe, C., Ruscheweyh, H., 1998. Recent research results concerning the exciting
mechanism of rain-wind-induced vibrations. J. Wind Eng. Ind. Aerod. 74-76, 1005-
1013.
Wang, Z.J., Zhou, Y., Huang, J.F., Xu, Y.L., 2005. Fluid dynamics around an inclined
cylinder with running water rivulets. J. Fluid. Struc. 21(1), 49-64.
Zuo, D., Jones, N.P., Main, J.A., 2008. Field observation of vortex- and rain-wind-
induced stay-cable vibrations in a three-dimensional environment. J. Wind Eng. Ind.
Aerod. 96(6-7), 1124-1133.
Page 35 of 47

TABLE 1. VALUES OF THE STANDARD PARAMETERS USED IN THE NU-
MERICAL CALCULATION.
Parameter Value
Cylinder radius, R 0.08 m
Initial film thickness, h0 2.5 × 10⁻⁴ m
Gravity, g 9.806 m/s2
Density of water, w 1000 kg/m3
Dynamic viscosity of water, w 1.002 × 10⁻³ Ns/m
Surface tension of water, 72 × 10-3 N/m
Density of air, 1.19 kg/m3
Dynamic viscosity of air, 1.82 × 10⁻⁵ Ns/m
Page 36 of 47

Figure 1: Definition of orientation of stay cable system geometry.
Figure 2: Modelling of artificial rivulets – Profile and dimensions of the artificial rivulet.
Page 37 of 47

Figure 3: Variation of C̄D and C̄L with rivulet angle for the single artificial rivulet case, compared with experimental data from Matsumoto et al. (2007). Plain cylinder
mean lift and drag taken from ESDU (1986).
a) b)Figure 4: Spectral analysis within and outside angle range 50° < < 60° : a) Within
angle range, = 50°; b) Outside angle range, = 20°.
Page 38 of 47

Figure 5: A thin fluid film on a horizontal cylinder.
Figure 6. Numerical prediction of temporal evolution of film thickness under full load-ing conditions : Uncoupled solution with constant pressure and shear.
Page 39 of 47

Figure 7: Simplified flowchart of the final coupled solver.
Page 40 of 47

Figure 8: Numerical prediction of rivulet evolution under shear and surface tension loading.
Figure 9: Comparison of temporal evolution of normalised film thickness for upper and lower rivulet under shear and surface tension loading.
Page 41 of 47

Figure 10: Comparison of temporal evolution of rivulet location of the upper and lower rivulets from the windward horizontal under shear and surface tension loading. Upper
rivulet, clockwise from this point, lower rivulet anti-clockwise (ac) from this point. Variation of and ac with t.
Figure 11: Numerical prediction of rivulet evolution under pressure and surface tension loading.
Page 42 of 47

Figure 12: Comparison of temporal evolution of normalised film thickness of upper and lower rivulet under pressure and surface tension loading.
Figure 13: Comparison of temporal evolution of rivulet location of the upper and lower rivulets from the windward horizontal under pressure and surface tension loading.
Upper rivulet, clockwise from this point, lower rivulet anti-clockwise (ac) from this point. Variation of and ac with t.
Page 43 of 47

Figure 14: Comparison of the distributions of time averaged mean pressure coefficient determined under pressure and surface tension loading by the coupled solver loading with predicted pressure coefficient for a plain circular cylinder using the dvm solver.
Figure 15: Numerical prediction of temporal evolution of film thickness, under pressure, shear and surface tension loading.
Page 44 of 47

Figure 16: Comparison of the temporal evolution of normalised film thickness of the upper rivulet for various loading conditions.
Figure 17: Comparison of the temporal evolution of rivulet location of the upper rivulet for various loading conditions.
Page 45 of 47

Figure 18: Numerical prediction of temporal evolution of film thickness in real time, under full loading.
Figure 19: Numerical prediction of temporal evolution of film thickness close to the region of the upper rivulet in real time, under full loading.
Page 46 of 47

Figure 20: Temporal evolution of film thickness at a location 67° clockwise from the windward horizontal under full loading conditions.
Page 47 of 47