Embed Size (px)
Citation preview

Proceedings of the Second All-USGS Modeling Conference, February 11–14, 2008: Painting the Big Picture
Scientific Investigations Report 2009–5013
U.S. Department of the InteriorU.S. Geological Survey

Cover: Graphic depicting the four U.S. Geological Survey (USGS) science disciplines (Water, Geology, Geography, and Biology) was taken from the Second All-USGS Modeling Conference logo.

Proceedings of the Second All-USGS Modeling Conference, February 11–14, 2008: Painting the Big Picture
Edited by Shailaja R. Brady
Scientific Investigations Report 2008–5013
U.S. Department of the InteriorU.S. Geological Survey
U.S. Department of the InteriorKEN SALAZAR, Secretary
U.S. Geological SurveySuzette M. Kimball, Acting Director
U.S. Geological Survey, Reston, Virginia: 2009
For more information on the USGS—the Federal source for science about the Earth, its natural and living resources, natural hazards, and the environment, visit http://www.usgs.gov or call 1-888-ASK-USGS
For an overview of USGS information products, including maps, imagery, and publications, visit http://www.usgs.gov/pubprod
To order this and other USGS information products, visit http://store.usgs.gov
Any use of trade, product, or firm names is for descriptive purposes only and does not imply endorsement by the U.S. Government.
Although this report is in the public domain, permission must be secured from the individual copyright owners to reproduce any copyrighted materials contained within this report.
Abstracts in this volume written by U.S. Geological Survey authors have been reviewed and approved for publication by the USGS. Abstracts submitted by researchers from academia and from other State, Federal, and international agencies are published as part of these proceedings but do not necessarily reflect the Survey’s policies and views.
Suggested citation:Brady, S.R., ed.., 2009, Proceedings of the Second All-USGS Modeling Conference, February 11–14, 2008—Painting the Big Picture: U.S. Geological Survey Scientific Investigations Report 2009–5013, 70 p., available only online at http://pubs.usgs.gov/sir/2009/5013.

iii
Preface
The Second USGS Modeling Conference was held February 11–14, 2008, in Orange Beach, Ala. Participants at the conference came from all U.S. Geological Survey (USGS) regions and represented all four science disciplines—Biology, Geography, Geology, and Water. Representatives from other Department of the Interior (DOI) agencies and partners from the academic community also participated. The conference, which was focused on “painting the big picture,” emphasized the following themes: Integrated Landscape Monitoring, Global Climate Change, Ecosystem Modeling, and Hazards and Risks. The conference centered on providing a forum for modelers to meet, exchange information on current approaches, identify specific opportunities to share existing models and develop more linked and integrated models to address complex science questions, and increase collaboration across disciplines and with other organizations. Abstracts for the 31 oral presentations and more than 60 posters presented at the conference are included here.
The conference also featured a field trip to review scientific modeling issues along the Gulf of Mexico. The field trip included visits to Mississippi Sandhill Crane National Wildlife Refuge, Grand Bay National Estuarine Research Reserve, the 5 Rivers Delta Resource Cen-ter, and Bon Secour National Wildlife Refuge. On behalf of all the participants of the Second All-USGS Modeling Conference, the conference organizing committee expresses our sincere appreciation for the support of field trip organizers and leaders, including the managers from the various Reserves and Refuges.
The organizing committee for the conference included Jenifer Bracewell, Sally Brady, Jacoby Carter, Thomas Casadevall, Linda Gundersen, Tom Gunther, Heather Henkel, Lauren Hay, Pat Jellison, K. Bruce Jones, Kenneth Odom, and Mark Wildhaber.

This page intentionally left blank.

v
Contents
Preface ...........................................................................................................................................................iiiMonitoring Snow Water Status With a Distributed Snowmelt Model (Poster) ...................................1Three-Dimensional Circulation and Transport Modeling in Devils Lake, North Dakota
(Oral Presentation) ...........................................................................................................................1Addressing the Vulnerability of Western Mountain Ecosystems and Water Resources to
Climate Change With RHESSys, the Regional Hydro-Ecological Simulation System (Oral Presentation) ..........................................................................................................................2
The Puget Sound Integrated Landscape Monitoring Project (Poster) .................................................2A New Method of Multiscale Topographic Analysis: Extracting Landforms (Poster) ........................3Taking SPARROW Predictions to the Web: A Tool For Research and Resource Management
(Poster) ..............................................................................................................................................3Strategic Habitat Conservation (SHC) and the Importance of Ecosystem Models
(Oral Presentation) ...........................................................................................................................4Numerical Simulation of Ground-Water Flow Within the Atlantic Coastal Plain Aquifers
of North Carolina and South Carolina (Poster) ...........................................................................4MOAB: Modeling Individual Movement and Behavior Using an Expert System Approach
(Poster) ..............................................................................................................................................5Modeling Nutria (Myocastor coypus) Invasions Across Regional and National Landscapes
(Poster) ...............................................................................................................................................5Communicating Remote Sensing Requirements and Working Together to Satisfy
Project Needs (Poster) ....................................................................................................................6Data Management and Interoperability in the USGS Volcano Hazards Program
(Oral Presentation) ...........................................................................................................................6Cost-Benefit Analysis of Computer Resources for Machine Learning (Poster) .................................7EdGCM: An Interactive Climate Modeling Framework for Educators and Scientists
(Oral Presentation) ..........................................................................................................................7Mutually Interactive State-Parameter Estimation of a Carbon Cycle Model Using a
Smoothed Ensemble Kalman Filter (Poster) ...............................................................................7Hydrodynamic and Water Quality Modeling of the A.R.M. Loxahatchee National Wildlife
Refuge, North Everglades, Florida (Poster) .................................................................................8Toward a National Land-Change Community Model (Oral Presentation) ............................................8Application of a Multimodeling Framework to Linking Ecosystem Pattern and Process
Across Scales: A Tale of Two Ecosystem Models (Oral Presentation) ...................................9Modeling Natural Resource Management Decision Scenarios Using Decision Analysis:
The Flow of Selenium in Appalachian Watersheds from Rocks to Ducks (Oral Presentation) ..........................................................................................................................9
A Proposed Ecosystem Simulation Model to Predict the Effects of Common Carp and Zebra Mussels in Shallow Lake Ecosystems (Poster) ........................................................................10
Integrating 3-D Hydrodynamic Transport and Ecological Plant Models of the Savannah River Estuary Using Artificial Neural Network Models (Poster) .....................................................10
Using Data Mining Techniques and Artificial Neural Network Models to Integrate Hydrology, Ecology, and Biology—Two Case Studies (Oral Presentation) ..........................10
Animation and Publication of Three-Dimensional and Four-Dimensional Physical Models (Poster) ............................................................................................................................................11

vi
Modeling an Aquatic Trophic Chain in a Two-Dimensional Topography in a Seasonally Varying Wetland (Poster) ..............................................................................................................12
The Land Use Portfolio Model: A Tool for Natural-Hazards Risk Analysis (Oral Presentation) ......12Forecasting the 21st Century World-Wide Status of Polar Bears Using a Bayesian Network
Modeling Approach (Poster) ........................................................................................................13Modeling Past, Present, and Future Polar Bear Habitats (Oral Presentation) .................................13HURASIM: Hurricane Simulation Model for Reconstructing Wind Fields and Landfall
Frequencies of Historic Storms (Poster) ....................................................................................14Landscape Simulation Model for Invasive Species Spread and Detection (Poster) .......................14SELVA-MANGRO: Landscape Model for South Florida Mangrove Ecosystems (Poster) ..............14SLRRP: Sea-Level Rise Rectification Program and Seawater Inundation Model Under
Climate Change (Poster) ..............................................................................................................15Reference Cited...................................................................................................................................15
CONGFLO: Floodplain Inundation Model of Congaree National Park (Poster) ..................................15Conceptual and Rapid Prototype Models for Evaluating the Effects of Land-Use
and Land-Cover Changes on Ecosystem Services in the Lower Mississippi Valley (LMV) (Oral Presentation) ........................................................................................................................16
Implementation of a Bayesian Geostatistical Parameter Estimation Module into PEST (Poster) .............................................................................................................................................17
Joint Inverse Modeling to Estimate Flood-Flow Depths and Their Uncertainty in Ungaged Coastal Basins, El Salvador, Central America (Poster) ............................................................17
Joint Inverse Modeling to Estimate Extreme Rainfall Events and Their Uncertainty in Ungaged Coastal Basins, El Salvador, Central America (Poster) ...........................................................18
Application of Stochastic Modeling to Forecast Likely Urbanization Effects on Ecological Integrity in the Upper Illinois River Basin (Poster) ..................................................................18
Stochastic Modeling to Forecast Likely Effects of a Proposed Reservoir on Colorado River Quantity and Quality Near Grand Junction, Colorado (Poster) .............................................19
CASCaDE: Computational Assessments of Scenarios of Change for the San Francisco Bay-Delta Ecosystem (Oral Presentation) ................................................................................20
Modeling the Hydrodynamic and Morphologic Response of an Estuary Restoration (Oral Presentation) .........................................................................................................................20
Addressing Among-Group Variation in Covariate Effects Using Multilevel Modeling Approaches With Emphasis on Multilevel Count Models (Poster) .....................21
Spatial and Age-Structured Population Model of the American Crocodile for Comparisons of CERP Restoration Alternatives (Poster) .......................................................21
The Future: Data-Driven Lake and Reservoir Monitoring Using Real-Time 3-D Hydrodynamic and Water-Quality Simulations (Oral Presentation) .....................................22
Using Such Web Services as StreamStats to Increase Your Modeling Productivity (Poster) .......22Using a Coupled Ecosystem-Geochemical Model to Assess Ecological,
Biogeochemical, and Hydrological Processes and Their Responses to Atmospheric Deposition and Climate Change for Diverse Ecosystems Within the United States (Oral Presentation) .........................................................................................................................23
Using GIS/Remote Sensing Models to Quantify and Monitor Southwestern Willow Flycatcher Breeding Habitat (Poster) ...........................................................................23
Hydrologic Effects of Climate Change in the Yukon River Basin (Oral Presentation) ......................24Evaluation of Environmental Flow Components Produced Using a Distributed Watershed
Model of the Flint River Basin, Georgia (Poster) ......................................................................24Hydrologic Climate Change From a Deterministic View: Using GSFLOW to Simulate Climate
Change in a Northern Temperate Climate (Oral Presentation) ..............................................24

vii
Advanced Species Modeling (Poster) ....................................................................................................25Spatial and Temporal Modeling of Metal Transport Through Ground Water and Surface
Water in Watersheds With Abandoned Mine Lands (Oral Presentation) ...........................25Modeling Species Responses to Historical Climate Change: From Molecules to
Continental Landscapes (Oral Presentation) .............................................................................26Limitations to Modeling Nonnative Plant Species Distributions for Early Detection
Monitoring in Arid Environments (Poster) .................................................................................27The South Florida Ecosystem Portfolio Model: Integrating Ecological, Community,
and Economic Values for Decision Support (Oral Presentation) ...........................................27Developing an Infrastructure for Knowledge-Based, Spatially Explicit Population
Modeling of Multiple Species (Poster) ......................................................................................28Regional Modeling of Carbon Dynamics Change in the Green River Basin, Wyoming,
Based on Remotely Sensed Data (Poster) ................................................................................28Modeling Terrestrial Carbon Dynamics in the Eastern United States (Poster) .................................29Modeling With Stakeholders: When the Process is as Valuable as the Product (Poster) ..............29Use of Operational and Research Models to Assess Volcanic Tephra Hazards (Oral
Presentation) ..................................................................................................................................30Extirpations and Elevational-Range Changes of the American Pika Linked to Climate
Warming Through Climate-Envelope Modeling (Poster) ........................................................30Delineation of Vegetation Communities Using Airborne Lidar Data at Jean Lafitte
National Park, Louisiana (Poster) ...............................................................................................31Spatially Continuous Interpolation of Water Stage and Water Depths Using the Everglades
Depth Estimation Network (EDEN) (Poster) ..............................................................................32Modeling Nonlinear Time Sequences in Earth Change and Human Disease Pandemics
(Poster) ............................................................................................................................................32Elevation Derivatives for Modeling Postwildfire Debris Flows (Poster) ............................................33GSFLOW—Coupled Ground-Water and Surface-Water Flow Model (Poster) ................................33De-Trending for Climatic Variations to Reveal Stressed Ecosystems (Poster) .................................33An Integrated Modeling Approach for Analyzing fhe Effects of an Expanding
Biomass-for-Biofuel Economy in the Northern Great Plains (Oral Presentation) ..............34Modeling Standardized, Meso-Scale Ecosystem Distributions for the United States and the
Planet (Oral Presentation) ............................................................................................................34Utilizing Structural Equation Modeling Techniques to Model Watershed Structure
and Land Use Effects on Stream Geochemistry and Ecological Responses (Oral Presentation) .........................................................................................................................35
Landscape Evapotranspiration Estimation Using a Simplified Surface Energy Balance Approach for Watershed Water-Balance Modeling (Poster) .................................................35
Community Sediment-Transport Modeling Project (Poster) ................................................................36A Spatially Explicit Stage-Based Population Model of American Alligators in Support of
Everglades Restoration (Poster) .................................................................................................36The Delta Research and Global Observation Network (Oral Presentation) ......................................36Integrating Hydrology and Individual-Based Models: Issues and General Approaches to
Simulating Animal Movement Using Artificial Intelligence and Navigation Theory (Poster) ............................................................................................................................................37
Modeling the Historical Influence of Soil and Water Management on Sediment and Carbon Budgets in the United States (Oral Presentation) .......................................................37
Applications of the FTLOADDS Coupled Code and Linkages to Hydrologic and Ecological Models (Oral Presentation) ......................................................................................38

viii
Ecosystem Carbon Budgets and Crop Yields in a Tropical Savanna Ecosystem as Related to Changes in Climate and Management (Poster) .....................................................39
Seeing the Forest Fire Through the Trees: Integrating Multiple Data Streams to Model the Presettlement Fire Regime in the Longleaf Pine Ecosystem (Poster) ................39
Predictive Models of Suitable Habitat for the Mojave Desert Tortoise: “Truthiness” in Pseudo-Absence (Poster) ............................................................................................................40
A Knowledge Management Approach for Complex Regional Ecosystem Modeling (Poster) .......40Linking Plots to Landscapes: A Synthetic Framework for Monitoring Change in the
Great Basin Ecosystem (Oral Presentation) .............................................................................40Credibility and Acceptability of Land Use Planning Approaches: A Case Study in the
Coastal Area of the Mekong Delta, Vietnam (Poster) .............................................................41The FRAME (Framing Research in Support of the Adaptive Management of Ecosystems)
Project: A Collaborative Modeling Approach to Natural Resource Management (Oral Presentation) .........................................................................................................................41
Elements of a Global Model: An Example of Sea Level Rise and Human Populations at Risk (Oral Presentation) .........................................................................................................................42
Modeling and Generalizing Population Pressure at the Regional Scale by Interpolating a Kriging Surface (Poster) ...............................................................................................................43
Formalizing Model-Specific GIS Methodology With the GIS Weasel (Poster) ................................43The Integration of Environmental Simulation Models and GIS Using Metadata (Poster) ...............43Processing Time-Series Data to Calibrate the GSFLOW Coupled Ground-Water/
Surface-Water Model in the Trout Lake Watershed, Northern Wisconsin (Poster) ..........44Modeling Surface-Water Sulfate Dynamics in a Northern Everglades Wetland (Poster) ..............44Variations in Pesticide Leaching Related to Land Use, Pesticide Properties, and
Unsaturated Zone Thickness in an Agricultural Watershed (Poster) ..................................45The USA National Phenology Network: Towards an Integrative Assessment of Global
Change Impacts at the National Scale (Poster) ........................................................................45Application of Bayesian Hierarchical and Information Theoretic Approaches in Model-
Facilitated Recovery of Endangered Fish Populations Based on Behavior and Physiology as Part of an Individual-Based Spatially Explicit Model (Poster) .....................46
Designing Sustainable Landscapes for Bird Populations in the Eastern United States: A Collaborative Approach (Poster) ................................................................................................46
Geospatial Modeling to Assess the Risk of American Ginseng Poaching in Shenandoah National Park (Poster)....................................................................................................................47
Empirically Modeling Carbon Fluxes in the Northern Great Plains Grasslands (Poster) ...............48Appendix 1. Conference Agenda .............................................................................................................49Appendix II. List of Conference Participants ........................................................................................56Appendix III. Acronyms .............................................................................................................................65

ix
Conversion Factors
Multiply By To obtainLength
foot (ft) 0.3048 meter (m)mile (mi) 1.609 kilometer (km)
Areaacre 0.4047 hectare (ha)square mile (mi2) 2.590 square kilometer (km2)
Volumeacre-foot (acre-ft) 1,233 cubic meter (m3)
Flow ratecubic foot per second (ft3/s) 0.02832 cubic meter per second (m3/s)mile per hour (mi/h) 1.609 kilometer per hour (km/h)
Concentrations of chemical constituents in water are given either in milligrams per liter (mg/L) or micrograms per liter (μg/L).
Multiply By To obtainLength
centimeter (cm) 0.3937 inch (in.)kilometer (km) 0.6214 mile (mi)meter (m) 1.094 yard (yd)
Areasquare kilometer (km2) 247.1 acre hectare (ha) 0.003861 square mile (mi2) square kilometer (km2) 0.3861 square mile (mi2)

This page intentionally left blank.

Proceedings of the Second All-USGS Modeling Conference, February 11–14, 2008: Painting the Big Picture
Edited by Shailaja R. Brady
Monitoring Snow Water Status With a Distributed Snowmelt Model (Poster)
Verdin2
1Science Applications International Corporation, Sioux Falls, S. Dak. 2U.S. Geological Survey, Sioux Falls, S. Dak.
A large amount of the Afghanistan water supply comes from reservoirs fed by snowmelt; therefore, monitoring the status of snow water in key areas during the winter and spring is an important function of the water resources and disaster management entities of the country. In this study, we illustrate the utility of monitoring the status of the snow across Afghanistan by employing a spatially distributed snow accumulation and ablation model forced solely with remotely sensed data, weather model assimilation fields, and globally available meteorological data in near-real time. The snowmelt model we used was a spatially distributed version of the Utah Energy Balance model. The model calculates the melt and accumulation of snow using physically based calculations of advective, latent, sensible, and radiative heat exchange. The Utah Energy Balance is forced by air temperature, aver-age horizontal wind speed, humidity, precipitation, and total incoming solar radiation recorded at a standard height. The model time step can vary from 1 to 6 hours. The model state variables are liquid water equivalent content, snow energy content, and snow surface age. We also tested the model uncertainty decrease accrued by using a dynamic Moderate Resolution Imaging Spectroradiometer (MODIS)-based albedo product instead of a simple parameterization. The MODIS-based snow albedo we used was an integrated 8-day running- average value calculated for areas that were established to be cloud-free by the MODIS cloud mask and snow-covered by the MODIS snow algorithm. Model input meteorological data were estimated from satellite or weather-model output. We downscaled the grid resolution of Mesoscale Model, version 5 (MM5) model fields of air temperature, air relative humid-ity, and solar radiation variables to 10 kilometers (km) from 45 km. The downscaling algorithms rely on the topographic data to downscale the coarse weather-forecasting model’s
By Guleid A. Artan1, Jodie L. Smith1, and James P.
output fields to the higher resolution. The meteorological data that we used, except for the rainfall, have a 6-hour time step, which is sufficient to resolve the diurnal cycle. The spatial distribution of the simulated snow-water equivalent compared well with MODIS-observed snow cover. Furthermore, mod-eled snow-water equivalent provided a good early indication of the relative magnitude of the water available for irrigation in the upcoming summer. The modeled snow-water maps were also useful in mapping basins that were likely to experience a higher risk for floods after anomalously high snowmelt.
Three-Dimensional Circulation and Transport Modeling in Devils Lake, North Dakota (Oral Presentation)
By Jerad Bales1 and Rochelle A. Nustad1
1U.S. Geological Survey, Raleigh, N.C.
The Devils Lake basin is a 3,810-square-mile (mi2) subbasin of the Red River of the North. The basin is closed at Devils Lake levels of less than 1,446.5 feet (ft) above sea level (asl), but spills into Stump Lake at higher levels, and subse-quently spills into a tributary of the Red River of the North at elevations greater than 1,450 ft asl. As a result of generally greater than normal precipitation, the Devils Lake water level has exceeded 1,446 ft asl more or less continuously, and the surface area of the lake has essentially doubled to the current area of 128,600 acres. In the same time, the volume of the lake has increased by 107 percent to 2,512,000 acre-ft. Hundreds of homes and businesses and thousands of acres of productive farmland have been lost as a result of the lake-level rise. More than $450 million has been spent relocating roads and bridges and building levees, and additional work is planned.
Most of the inflow to the lake occurs in the late spring during snowmelt. The inflow may take as long as 1 month to move through the lake. Following the inflow period, circula-tion in Devils Lake is driven primarily by wind, which sets up fairly large water-level gradients across the lake. The lake has a complex morphometry, with large bays separated by
2 Proceedings of the Second All-USGS Modeling Conference, February 11-14, 2008
narrow passes, and bridges cross the lake at several locations. The water at the downstream (eastern) end of the lake is poor in quality and has high solute concentrations, and there is concern that the solutes are moving west.
In this study, the magnitude of the differential lake levels and their effects on flooding, water circulation, and solute transport have been simulated by using the three-dimensional model UnTRIM. An extensive campaign was conducted to collect synchronous data throughout the lake, includ-ing streamflow at all the major inflows and at the outflow to Stump Lake. Weather data were measured at three sites around the lake; the lake level was recorded at eight sites; and an Acoustic Doppler Current Profiler (ADCP) was deployed at one site in the lake. The model grid was developed up to a shoreline elevation of 1,453 ft asl to account for possible future flooding. The unstructured grid contains five vertical layers and more than 10,000 computational cells. The model was calibrated for existing conditions and will be applied using stochastically generated inflow to investigate the effects of various inflow and wind conditions on flooding and solute transport.
Addressing the Vulnerability of Western Mountain Ecosystems and Water Resources to Climate Change With RHESSys, the Regional Hydro-Ecological Simulation System (Oral Presentation)
By Jill S. Baron1, Christina Tague2, Lindsey Christensen3, Nate Stephenson4, Craig Allen5, Dan Fagre6, David Peterson7, and Donald McKenzie7
1U.S. Geological Survey, Fort Collins, Colo.2University of California, Santa Barbara, Calif.3Colorado State University, Fort Collins, Colo.4U.S. Geological Survey, Three Rivers, Calif.5U.S. Geological Survey, Los Alamos, N. Mex.6U.S. Geological Survey, West Glacier, Mont.7U.S. Forest Service, Seattle, Wash.
Western mountain ecosystems are changing rapidly in response to climate change. Earlier onset of snowmelt, larger forest areas affected by wildfire and insect outbreaks, and increasing rates of evapotranspiration are beginning to strain the ability of mountain environments to provide water, wood products, carbon sequestration, biodiversity, and recreational opportunities. The Western Mountain Ini-tiative, a U.S. Geological Survey (USGS) global change program, uses the Regional Hydro-Ecological Simulation System (RHESSys) model in conjunction with long-term
monitoring, regional assessments, paleoclimate and paleoeco-logical reconstructions, and synthesis workshops to under-stand the sensitivities, thresholds, resistance, and resilience of Western mountain ecosystems to climatic variability and change. RHESSys is a geographic information system (GIS)-based hydro-ecological modeling framework designed to simulate carbon, nutrient, and water fluxes. By combining a set of physically based process models and a methodology for partitioning and parameterizing the landscape, RHESSys is capable of modeling the spatial distribution and temporal interactions between different processes at the watershed scale.
We applied RHESSys to catchments in Glacier, North Cascades, Rocky Mountain, and Yosemite National Parks to examine how ecosystem properties, including ecosystem water use (evapotranspiration, or ET), productivity or net primary production (NPP), and stream runoff, are affected by climate variability, and where these effects are most pronounced on the landscape. The sites were selected because of the extensive databases associated with them. Annual precipitation was positively correlated with ET, NPP, and runoff at all the sites. Temperature, however, was negatively correlated with ET, NPP, and runoff at the Mount Rainier catchment, and had no relation to ET, NPP, and runoff at the Glacier and Rocky Mountain National Park catchments.
There was a positive correlation with ET and NPP but a negative correlation with runoff at the Yosemite catchment, suggesting a tradeoff between ecosystem and stream pro-cesses. The middle elevations at Yosemite were most respon-sive to changes in precipitation and temperature, similar to many empirical studies. Topographic complexity in the West reduces our ability to generalize from the four sites to other Western catchments at different elevations and aspects, but we are beginning to see what may be regional and elevational differences in ecosystem response. Future work will place the National Park watersheds in a West-wide vulnerability context by coupling model output that identifies the processes most responsive to climate change, including forecasts, with climate and geographic filters.
The Puget Sound Integrated Landscape Monitoring Project (Poster)
By Susan Benjamin1
1U.S. Geological Survey, Menlo Park, Calif.
The deteriorating environmental quality of the waters of Puget Sound has raised alarms at private, local, State, and Federal levels. The U.S. Geological Survey (USGS) is working with many partners in the Sound to understand the effects that a changing landscape has had on the second larg-est estuary in the United States. Determining the impacts of natural processes and human actions, predicting their effects,

Proceedings of the Second All-USGS Modeling Conference, February 11-14, 2008 3
and developing models and tools to evaluate different actions as expressed through changes in the landscape are critical to ensuring a sustainable future for all, both ecologically and economically. In the Puget Sound Integrated Landscape Monitoring Project (PS-ILM), a conceptual model of the landscape is being developed to describe the components of the landscape (structure) and the interactions among those components (function). This conceptual model will also be used to develop an interdisciplinary approach to measuring and evaluating potential indicators of landscape condition and change at scales necessary to understand management issues and develop successful management practices. Providing this information to partners with regulatory and advisory responsi-bility may assist efforts to restore the environmental health of Puget Sound.
A New Method of Multiscale Topographic Analysis: Extracting Landforms (Poster)
By Norman B. Bliss1
1Science Applications International Corporation, Sioux Falls, S. Dak.
Most existing algorithms for topographic analysis make use of moving windows (for example, for slope or aspect) or accumulate statistics on upstream areas (for example, flow accumulation). This poster introduces a new method of analysis that uses the standard flow direction and streamline calculations to create a vector dataset of flowpaths. Using the nodes of the streamline vector dataset, a new data struc-ture of pointers relates each node to the nodes upstream and downstream. The current implementation creates pointers to nodes at distances away on the network for each power of 2 (for example 1, 2, 4, 8, 16 nodes away). It is then possible to calculate slopes and curvatures on actual flowpaths and to identify areas of concavity and convexity on the landscape at multiple scales.
I anticipate applications of this method for delineating landforms with great precision. Such features as floodplains, low hills, and steep mountains can be identified using criteria at generalized scales (for example, over distances of hundreds of meters), and yet boundaries for the features can be delin-eated near the resolution of the digital elevation model (for example, 30 meters).
The customized landform delineations will have applica-tions in many areas of integrated landscape monitoring (for example, vegetation productivity and phenology), climate change (for example, the influence of soil wetness on soil carbon storage or release to the atmosphere), and hazards and risks (for example, locating the probability of debris flows fol-lowing wildfires and heavy rains).
Taking SPARROW Predictions to the Web: A Tool For Research and Resource Management (Poster)
By Nate Booth1 and Eric Everman1
1U.S. Geological Survey, Middleton, Wis.
The U.S. Geological Survey (USGS) National Water Quality Assessment Program (NAWQA) is developing water-quality predictive models for eight major river basins of the conterminous United States. In addition to extrapolating mea-sured water-quality conditions to unmonitored areas to help assess water-quality status, a calibrated Spatially Referenced Regressions On Watershed Attributes (SPARROW) model can be used to produce statistically defensible estimates of load, flow-weighted concentration, or yield of any modeled constit-uent under different land use and management scenarios.
A decision support infrastructure is being developed to offer sophisticated prediction capabilities for research and resource management. The intention is to provide users of the system with these capabilities through a standard web browser without the need for proprietary software licenses or significant training. Development and operations costs of the system will be mitigated by defining a common data storage format for large geographic information system (GIS) datasets (for example, river networks) and by centralizing the data processing function in a set of industry-standard database and web-application servers.
Based on previous SPARROW modeling products and current work by the USGS Geography and Water in the Chesapeake Bay Program, the following four general areas of predictions are planned: (1) Estimate load or concentra-tion for river reaches of interest for specified source input or land use changes. Users can adjust source terms in upstream basins individually or across source categories (for example, waste-water treatment facilities) and view maps of source allocations, model prediction metrics, and changes from model baseline; (2) Investigate reaches in nonattainment (305b/303d reporting) to allow users to rank and map nonat-tainment reaches and produce summary reports for river miles impacted; (3) Rank incremental delivered yield by catchment to show reaches that contribute the most significant load to a targeted downstream reach of interest; and (4) Develop cost optimization procedures for either (a) targeted load reduction or (b) defined amount of available treatment resources to allow users to choose reaches on which to focus treatment dollars based on incremental delivered yield and treatment cost esti-mates by input source type.

4 Proceedings of the Second All-USGS Modeling Conference, February 11-14, 2008
Strategic Habitat Conservation (SHC) and the Importance of Ecosystem Models (Oral Presentation)
By Laura A. Brandt1
1U.S. Fish and Wildlife Service, Davie, Fla.
The U.S. Fish and Wildlife Service (FWS) bears the Federal Government’s final legislative accountability for realizing the public trust interests in sustaining migratory birds, threatened and endangered species, interjurisdictional fisheries, and some marine mammals. That responsibil-ity is shared legislatively by State governments as well as other Federal agencies and voluntarily by nongovernmen-tal organizations. Strategic Habitat Conservation (SHC) is an approach to conservation that focuses on the Fed-eral Government’s responsibility to assess, monitor, and predict the ability of landscapes to sustain populations of public trust species and work in partnership with organiza-tions to implement necessary actions to achieve desired outcomes. The achievement of sustainable populations of trust species is how the FWS will measure progress toward its mission of working with others to conserve, protect, and enhance fish, wildlife, and plants and their habitats for the continuing benefit of the American people. The SHC framework is a science-based, iterative, adaptive frame-work that includes biological planning, conservation design, conservation delivery, monitoring, and research. Key elements of SHC are (1) setting explicit biological objectives, (2) identifying factors that limit the population or ecosys-tem function, and (3) developing models and decision sup-port tools. Modeling at population and ecosystem scales and making that information available to managers is a component in developing the information needed to make decisions on where and how much habitat is necessary to ensure popula-tion and landscape sustainability and to forecast effects of alternative land use scenarios. Ecosystem models will be particularly important in projecting the effects of climate change on species and habitats. Having such information will put the FWS in a better position to respond proactively. The FWS has limited capacity to develop ecosystem models and will look to expertise within the U.S. Geological Survey (USGS) to assist in meeting those needs. This effort will require a stronger and expanded relationship between the management functions of the FWS and the science expertise of the USGS. One step in expanding the relationship between the FWS and the USGS is to go beyond the traditional com-munications “need-response model” toward a more function-based relationship that is built around the elements of SHC. This presentation will highlight how the science anticipated by an SHC approach to conservation calls for a closer work-ing relationship between science (USGS) and management (FWS) if the Public Trust Doctrine is to be realized for future generations of Americans.
Numerical Simulation of Ground-Water Flow Within the Atlantic Coastal Plain Aquifers of North Carolina and South Carolina (Poster)
By Bruce Campbell1
1U.S. Geological Survey, Columbia, S.C.
The Atlantic Coastal Plain aquifer system of North Carolina and South Carolina is an important source of potable water for a growing population. The 2000 Census reported that the combined populations of Coastal Plain counties in North Carolina and South Carolina totaled nearly 6 million people, with 3.2 million located in North Carolina and 2.5 million located in South Carolina. In North Carolina, the population grew by 21 percent from 1990 to 2000. The population is projected to grow by another 13 percent by the year 2015. The numbers are similar in South Carolina, which had a population increase of 15 percent from 1990 to 2000 and whose popula-tion is projected to grow by 13 percent by 2015. The Atlantic Coastal Plain aquifer system has a large aerial extent, cover-ing approximately 25,000 square miles in North Carolina and approximately 20,000 square miles in South Carolina. Most of the Coastal Plain is underlain by at least one, and in some areas, several highly productive aquifers. Although ground-water resources have been intensively developed in some areas of the Atlantic Coastal Plain, large areas remain relatively undeveloped. Some municipalities, such as Myrtle Beach and Charleston, S.C., which developed the Atlantic Coastal Plain aquifers in previous years and created large cones of depression in aquifer potentiometric surfaces, have switched to surface-water sources, thus allowing ground-water levels to recover partially.
Saltwater encroachment is occurring in several places within the Atlantic Coastal Plain aquifers in North Caro-lina and South Carolina in response to the lowering of these potentiometric surfaces. Most of the onshore parts of the North Carolina and South Carolina Atlantic Coastal Plain aquifers contain freshwater (total dissolved solids are less than 1,000 milligrams per liter); however, brackish water and saltwater are present in the aquifer system, especially near the coast. Even these brackish ground-water resources, however, are being used by some communities because the cost and effi-ciency of desalination technology have improved.
The complicated history of water use, along with substantial areal variations in aquifer properties, pose chal-lenges for the State agencies who are charged with manag-ing these important resources. As more users demand more water, the need for scientifically based management tools has increased. A numerical ground-water-flow model is such a tool; it can be used to integrate and evaluate large volumes of ground-water data to assist in the management of these important ground-water resources. To help State agencies

Proceedings of the Second All-USGS Modeling Conference, February 11-14, 2008 5
address issues concerning the management and development of the Atlantic Coastal Plain aquifers in North Carolina and South Carolina, steady-state and transient ground-water flow models are being developed by the U.S. Geological Survey (USGS) using the USGS finite-difference ground-water flow model, MODFLOW-2000.
The steady-state model consists of 16 layers and contains 130 rows by 275 columns of 2-square-mile grid cells. Net recharge, upper Coastal Plain rivers, and numerous wells are simulated as fluxes within the model. Specified-head model boundaries are set laterally at the James River in Virginia and the Oconee River in Georgia. No-flow model boundaries are set at the Fall Zone and at the freshwater/saltwater interface. The upper boundary of the model is simulated mostly as a specified-head boundary to represent the water table, except in the higher elevations of the upper Coastal Plain, which are actively modeled and where direct net recharge is applied. Model calibration criteria include predevelopment water levels and synoptic water levels for the study area collected in 1980, 1982, 1989, and 2004. Analysis of the baseflow of selected upper Coastal Plain streams using hydrograph separation tech-niques also are being used to constrain the model solutions.
MOAB: Modeling Individual Movement and Behavior Using an Expert System Approach (Poster)
By Jacoby Carter1
1U.S. Geological Survey, Lafayette, La.
There are three general approaches to modeling individ-ual behavior. One is to use a stochastic model whereby indi-viduals move across the landscape in a random walk. These walks can be modified by using different probabilities for different states. A second approach is to use a rigid rule-based system, such as a decision tree or a decision matrix. A third approach is to use techniques from artificial intelligence, such as neural nets or heuristic approaches. The neural net approach works by comparing the behavior of the model with measured behavior of the observed system and adjusting the weights of the neurons until the model approximates the observed result. A rule-based approach uses “rules of thumb” to determine behavior. This approach differs from a decision tree or a decision matrix approach in that the rules can be unstructured and state-dependent, rather than fixed. The Model of Animal Behavior (MOAB) model allows the user to simulate move-ment and foraging behavior across a landscape using either a random walk model that can be modified to approach that of a structured rules system, or an expert system mode that uses rules of thumb provided by the user. By allowing both approaches in MOAB, a rule-based approach can be compared to a “null” model. Individual movement is determined by a suite of variables, including habitat type; the presence, type,
and quantity of food; the internal state of the animal with respect to energy, sex, and anxiety levels; the recent history of surrounding cells; the recent history of the animal; and the ani-mal’s ability to detect its surrounding environment. Because the model is spatially explicit and updates the landscape in response to animal behavior, it can be used to predict indi-vidual responses to landscape change.
Modeling Nutria (Myocastor coypus) Invasions Across Regional and National Landscapes (Poster)
By Jacoby Carter1
1U.S. Geological Survey, Lafayette, La.
Nutrias (Myocastor coypus) are aquatic rodents native to the southern half of the South American continent. They are highly valued for their fur. Originally introduced to North America by fur farmers, they have escaped or were released in more than 30 states. Their populations flourished in some regions; in other areas, they became locally extinct. The most common reasons given for local extinction are weather related. Nutria can be an important pest species for several reasons. First, through their feeding activities, they can destroy a marsh when their population densities get too high. Second, they can cause damage to water control and retention structures with their burrowing activities. They have also been implicated as a disease vector and seem to out-compete the native muskrat (Ondatra zibethicus). A general prediction of climate change models is that winters will generally become milder and there will be lesser differences between nighttime and daytime tem-peratures. If these predictions are correct, we should expect nutrias to expand their range to areas where they were for-merly weather limited. Prevention of this range expansion will require both monitoring of current distributions and modeling to predict where they are likely to move. Predictive models will assist in early detection and control. This talk will review how the U.S. Geological Survey nutria research program is developing and integrating multiple approaches to understand-ing this problem. Lines of attack include geographic informa-tion systems modeling and development of habitat suitability models; development of movement models; and understanding how other species (for example, beaver, alligators, muskrats, and domestic dogs) may also play a role in the ability of nutria to become established in new areas.
6 Proceedings of the Second All-USGS Modeling Conference, February 11-14, 2008
Communicating Remote Sensing Requirements and Working Together to Satisfy Project Needs (Poster)
By Thomas H. Cecere1
1U.S. Geological Survey, Reston, Va.
Historically, Government users of remotely sensed data have not been effective in communicating their requirements and data holdings to others within the Government and often have had difficulty finding suitable data to meet their needs. Through the efforts of the President’s 2003 Commercial Remote Sensing Space Policy’s (CRSSP’s) Requirements and Shared Execution teams, Federal agencies are partnering to make their requirements known to Government and industry, to leverage established infrastructures for data archiving and distribution, and to utilize existing contract mechanisms and consortiums to help get data into the hands of those who need them.
The first goal of this exhibit is to introduce the CRSSP Imagery-Derived Requirements (CIDR) tool that was devel-oped by the CRSSP Requirements team. The purpose of the CIDR tool is to capture specifics regarding agency remote sensing needs so these needs can be analyzed and shared eas-ily throughout the appropriate communities of interest. The second goal of this exhibit is to show the analysis process, which incorporates knowledge of multiple agency holdings and vendor archives. The third goal is to show that our efforts are resulting in Government users having greater access to high-resolution commercial remote sensing data and other sources of remotely sensed data and that the key lies in the communication process.
The process of sharing and gaining improved under-standing of all Federal agency remote-sensing requirements [including electro-optical, light detection and ranging (lidar), and synthetic aperture radar (SAR)], can ultimately stimulate ideas as to how Government agencies can work together to use existing and future technologies to help save lives, improve the environment, and increase the efficiency and accuracy of day-to-day tasks.
Data Management and Interoperability in the USGS Volcano Hazards Program (Oral Presentation)
By Peter F. Cervelli1
1U.S. Geological Survey, Anchorage, Alaska
During the past 5 years, the U.S. Geological Survey (USGS) Volcano Hazards Program (VHP) has made a substantial investment in data management. The key results of this
investment are the widespread adoption within the VHP of Structured Query Language (SQL) databases for storing and managing geophysical data streams, and the development of web services that enable both the distribution of data to outside partners and seamless interoperability among the volcano observatories. We have also developed and deployed specialized client applications for the visualization and analysis of data available via web services. Our development strategy has been to adopt and extend existing protocols and schema where available, so as to permit backwards compatibility with legacy applications. The web services also answer queries for metadata that describe the geospatial context and instrumentation details associated with the primary data.
The rationale for our investment in data management is threefold. First, the quantity of data collected by the VHP currently exceeds 10 gigabytes per day; we require a modern system for storing and serving this large and growing data stream. Second, the VHP collects data from a variety of different sources, including ground-based instrumentation, field observations and measurements, and satellite imagery. We require a fast and simple means for interpreting these disparate data. This leads to the requirement of a system that can quickly depict many different data types on a common map-base or timescale. Finally, we require the capability for offsite analysis—that is, we wish to leverage all the intellec-tual resources of the VHP, whether those resources are local or remote.
Though incomplete, the investment has resulted in several production systems, which are in use throughout the VHP and at other volcano observatories worldwide. The Volcano Analysis Visualization Environment (VALVE) system stores, generic data streams and geographical information in an SQL database and implements a web service for their distribution. The WINSTON system follows an identical storage and presentation model but is specially tailored for seismic data, which is characterized by high data rates (100 Hz or greater). The Seismic Wave Analysis and Real-time Monitor (SWARM) application connects to a WINSTON (or other legacy) server and enables rapid interactive visualization and interpretation of seismic data. All these systems have been ”battle-tested“ in that they have been repeatedly used for the short-term forecast of volcanic hazards. Each of these systems and applications are written in the Java programming language, are open source, and are freely available to all.

Proceedings of the Second All-USGS Modeling Conference, February 11-14, 2008 7
Cost-Benefit Analysis of Computer Resources for Machine Learning (Poster)
By Richard A. Champion1
1U.S. Geological Survey, Menlo Park, Calif.
Machine learning describes pattern-recognition algo-rithms—in this case, probabilistic neural networks (PNNs). These can be computationally intensive, in part because of the nonlinear optimizer, a numerical process that calibrates the PNN by minimizing a sum of squared errors. This poster suggests efficiencies that are expressed as cost and benefit. The cost is computer time needed to calibrate the PNN, and the benefit is “goodness-of-fit,” or how well the PNN learns the pattern in the data. There may be a point of diminishing returns where a further expenditure of computer resources does not produce additional benefits. Sampling is suggested as a cost-reduction strategy. One consideration is how many points to select for calibration and another is the geometric distribution of the points. The data points may be nonuni-formly distributed across space, so that sampling at some locations provides additional benefit while sampling at other locations does not. A stratified sampling strategy can be designed to select more points in regions where they reduce the calibration error and fewer points in regions where they do not. Goodness-of-fit tests ensure that the sampling does not introduce bias. This approach is illustrated by statistical experiments for computing correlations between measures of roadless area and population density for the San Francisco Bay area. The alternative to training efficiencies is to rely on high-performance computer systems. These may require specialized programming and algorithms that are optimized for parallel performance.
EdGCM: An Interactive Climate Modeling Framework for Educators and Scientists (Oral Presentation)
By Mark A. Chandler1
1Columbia University, NASA/GISS, Madison, Wis.
Most climate researchers believe that climate change will profoundly impact both our planet’s environment and the world’s economic and geopolitical landscape in the coming decades. Because these impacts have the potential to affect everyone, a basic knowledge of Earth’s climate system is critical to making informed judgments about climate-related issues. To achieve that goal, educators and scientists who are not necessarily climate specialists need accessibility to scien-tific and technological tools used to forecast climate change.
Computer-driven general circulation models (GCMs) are the primary tool used today in climate research, but until now they have been little more than black boxes to most people. As a practical matter, few educators or researchers have had access to GCMs because they typically require supercomput-ing facilities and skilled programmers to operate. The resulting lack of familiarity with climate modeling techniques has often engendered public distrust of important scientific findings based on such methodologies and has kept many researchers from using these important simulation capabilities. Education Global Climate Modeling (EdGCM) addresses this problem by providing a research-grade GCM within a user-friendly interactive framework that can be run on desktop computers. Our primary goal is to improve the quality of teaching and learning of climate-change science through broader access to GCMs, and to provide appropriate technology and materials to help educators use these models effectively. However, second-arily, we hope to increase greatly the number of scientists who have access to the tools that form the backbone of the global climate forecasting system. With research-quality resources in place, linking educational institutions to actual research and development labs is not only possible, but will be beneficial to both the education and research communities alike.
Mutually Interactive State-Parameter Estimation of a Carbon Cycle Model Using a Smoothed Ensemble Kalman Filter (Poster)
By Mingshi Chen1, Shuguang Liu¹, and Larry L. Tieszen2
1Science Applications International Corporation, Sioux Falls, S. Dak.2U.S. Geological Survey, Sioux Falls, S. Dak.
The General Ensemble Biogeochemical Modeling System (GEMS) is designed to simulate terrestrial carbon dynamic processes and predict carbon trends from plot to regional scale. Accurate forecasts by GEMS rely on a fairly accurate estimation of the state variables and parameters and proper treatment of various sources of uncertainties stemming from inputs, outputs, and parameters. In this study, we used a Smoothed Ensemble Kalman Filter (SEnKF) to sequentially assimilate measurements from eddy covariance tower sites and from a Moderate Resolution Imaging Spectroradiome-ter (MODIS) into GEMS over a mixed forest area of 10 kilometers (km) × 10 km surrounding the Howland, Maine, site to estimate state variables and parameters simultaneously. Measurements, field estimates, and satellite observations included half-hourly net ecosystem exchange (NEE), daily gross primary production (GPP), and ecosystem respiration (Re) at the Howland site and monthly net primary produc-tion (NPP) from MODIS. All measurements were scaled up

8 Proceedings of the Second All-USGS Modeling Conference, February 11-14, 2008
to monthly data to match GEMS. Our analyses demonstrate that important parameters, such as the maximum ecosystem-specific net production rate, varied with time, although it was traditionally treated as a static parameter in GEMS. Results also show that model predictions with parameters modified by the SEnKF were remarkably improved compared with those without progressive data assimilation. Furthermore, the SEnKF dramatically reduced the variances of state variables stemming from uncertainties of parameters and driving variables.
Hydrodynamic and Water Quality Modeling of the A.R.M. Loxahatchee National Wildlife Refuge, North Everglades, Florida (Poster)
By Chunfang Chen1, Michael G. Waldon1, Hongqing Wang2, Matthew C. Harwell3, Alonso G. Griborio3, Ehab A. Meselhe2
1U.S. Fish and Wildlife Service, Lafayette, La.2University of Louisiana at Lafayette, Lafayette, La.3U.S. Fish and Wildlife Service, Vero Beach, La.4Hazen and Sawyer, Hollywood, Calif.
The Arthur R. Marshall Loxahatchee National Wild-life Refuge (Refuge) is a 58,000 hectare (ha) remnant of the Northern Everglades in Palm Beach County, Fla. The U.S. Fish and Wildlife Service has determined that changes in water quality, quantity, and timing are introducing negative impacts to the Refuge’s ecosystem. A priority of the Refuge is to ensure appropriate water quality and quantity that maximize benefits for fish and wildlife, flood control, and water supply. To this end, a better understanding of the impacts of contami-nants and excessive nutrient loading is needed.
Hydrodynamic and hydrologic models coupled with water-quality models are valuable tools to provide projections of water movement and water-quality constituent concentra-tions. To study the water budget and water quality of the Refuge, two modeling approaches were employed. The first approach, named the Completely Mixed Flow (CMF) model, uses a compartment-based model to study water budget and water constituent transport. The model was developed using Microsoft Excel and the U.S. Environmental Protection Agency’s Water Quality Analysis Simulation Program (WASP).
A complex spatially explicit set of linked models has also been developed using the MIKE_FLOOD and ECO Lab modeling frameworks (DHI, formerly the Danish Hydrau-lic Insitute) to provide fully dynamic hydrodynamic and water-quality models. These models link a one-dimensional channel model with a 400 meter regular grid marsh model. In
addition to water stage and flow, constituent transport through advection and dispersion, and transformation through reac-tive processes are modeled. The models simulate chloride, sulfate, and total phosphorus. These models were calibrated for a 5-year period and validated for two other periods. Results show good agreement between observed and predicted stages and concentrations at specific locations. Statistical analyses demonstrate the applicability of these models for temporal and spatial prediction of water levels and water quality concentra-tions. This project illustrates the linkage and use of models at different levels of spatial complexity.
Toward a National Land-Change Community Model (Oral Presentation)
By Peter R. Claggett1, Michael E. Colvin2, and David I. Donato3
1U.S. Geological Survey, Annapolis, Md.2Iowa State University Coop Unit, Ames, Iowa3U.S. Geological Survey, Reston, Va.
In the U.S. Geologica Survey (USGS), as in the Nation at large, the impact of land-change modeling on public policy has—so far—fallen short of its promise and potential. Among the many reasons, two stand out: first, the research has been fragmented, leading to specialized models that cannot inter-operate; and second, the disproportionate share of research has been directed to local extents and too little to regional and national extents. The USGS Geographic Analysis and Monitoring program, among others, recognizes the need for improving the effectiveness of ecological and environmental modeling by addressing the neglected regional scale, and for improving the generality and robustness of land-change models by fostering a vibrant, interactive national community of modelers.
The National Land-Change Community Model, or NLCCM, will be eclectic and inclusive. By developing software toolkits along with standards for integrating land-change models within and across spatial and temporal scales, the national land-change modeling community will make it possible for modelers to select the best features from various existing models; to build progressively refined and increasingly credible and widely accepted models; and thus to inject believable alternative futures into the formation of public policy at all levels of government. Perhaps operating much like open-source software development projects, the NLCCM, as envisioned, will be collaboratively developed by geographically and organizationally dispersed researchers and modeling-software developers drawn from all levels of government, the academic community, and nongovernmental organizations. Because of the variety of land-change modeling applications, drivers, and consequences, and the complexity of land-change processes, the NLCCM can also be viewed as

Proceedings of the Second All-USGS Modeling Conference, February 11-14, 2008 9
a national-extent model of national and global drivers and as a mosaic of regional models that serve to integrate and bridge the output from global and national process models with local micro-simulation and agent-based models.
The authors are developing the Chesapeake Bay Land-Change Model (CBLCM), a model that covers the entire Chesapeake Bay Watershed, which crosses six States. This model will serve as a prototype of a regional-scale model developed by integrating and adapting two models (the New Jersey Growth Allocation Model and the Slope, Land cover, Exclusions, Urban areas, Transportation, Hydrologic (SLEUTH) cellular-automaton urban-growth model), which were originally addressed to only local extent. To promote the kind of standards-based integration needed to fulfill the promise of land-change modeling, the authors are developing a USGS-hosted NLCCM web site and sponsoring a com-petitive land-change modeling intercomparison to catalyze national interest and collaboration.
Application of a Multimodeling Framework to Linking Ecosystem Pattern and Process Across Scales: A Tale of Two Ecosystem Models (Oral Presentation)
By Jon C. Cline1 and Joseph Koonce1
1Department of Biology, Case Western Reserve University, Cleveland, Ohio
This poster reports on recent advances in the develop-ment of a generic multilevel modeling framework for ecologi-cal modeling. The model framework includes an Extensible Markup Language (XML)-based metadata format, support for a model repository that allows dynamic loading of model components specified by metadata, and a simulation server that provides a Discrete Event System Specifications (DEVS) environment for assembling and running hierarchical modular models. An object model that includes support for open geo-spatial data standards for grid coverages and simple features is used to exchange model state information between model components and between the simulation server and a user-friendly geographic information system (GIS) client.
To demonstrate the generality of the modeling approach, we present two applications of the framework to modeling ecosystem process across scales. The first is an implementa-tion of a regional-scale stressor-response model for the management of the Lake Erie ecosystem. The second is implementation of the ALFISHES model, which is one of a suite of Across Trophic Levels System Simulation (ATLSS) models designed to assess the impact of changes in hydrology on a suite of higher trophic-level species of the southern Florida ecosystem. The ALFISHES model combines field data with hydrologic data from the Southern Inland and Coastal
System (SICS) model to assess the impact of salinity on fish biomass. The model output may be used to assess the impact of changes in hydrology on fish biomass and its availability to the Roseate Spoonbill (Ajaia ajaja), which is a key indicator species, and other wading birds.
Modeling Natural Resource Management Decision Scenarios Using Decision Analysis: The Flow of Selenium in Appalachian Watersheds from Rocks to Ducks (Oral Presentation)
By James L. Coleman1, Karen Jenni2, Tim Nieman3 and Ione L. Taylor1
1U.S. Geological Survey, Reston, Va.2Insight Decisions LLC, Reston, Va.3Decision Applications, Inc., Reston, Va.
Through the use of decision analysis principles, tech-niques, and tools, the U.S. Geological Survey (USGS) Eastern Energy Resources Team, in collaboration with other USGS, Federal, and State partners, developed a computer model to examine the potential generation of bioavailable selenium in Appalachian watersheds as a result of large-scale earth-mov-ing and construction projects. Selenium is present naturally in the Earth’s crust and is frequently concentrated in coal and organic-rich shales, such as those found in the Appalachian coal fields of the eastern United States. Without special han-dling at the project site, selenium may be concentrated through physical and (or) biological processes in the watersheds below the project areas, where it may reach toxic levels in fish before it is sufficiently diluted downstream where it is no longer an environmental concern.
Our model was created to characterize the flow of selenium from the host rocks into the initial drainage basin, through a holding or settling pond, and finally into the natural watershed. Biological, engineering, geologic, and hydrologic constants, factors, and transformation equations were used where known, or approximated where unknown. Uncertainty in those factors was modeled explicitly, and various scenarios representing alternative decisions and site conditions were included. The end result is a model that projects selenium concentrations (with uncertainty) at various locations down-stream from a disturbance. The use of alternative scenarios in the model leads to postulated outcomes within a specific context that can be used to help decisionmakers understand and use USGS data and interpretations to make more informed natural resource and environmental management decisions.
Because the model architecture is modular, the overall model could be extended further to include components to

10 Proceedings of the Second All-USGS Modeling Conference, February 11-14, 2008
estimate social or economic tradeoffs that might also be of interest to decisionmakers. Because of its modular approach, it can also be scaled up to address all the acreage under potential effect from large-scale projects.
As a final outgrowth of this effort, it became clear that scientists from various disciplines enjoy working together on an issue of mutual interest and concern. This particular model-ing effort was successful because we had access to profes-sional decision analysts to help frame, guide, and motivate the effort; highly knowledgeable scientists who accepted the decision analysis process and shared their data, uncertainties, and concerns in a free and open environment; and the strong support and encouragement of USGS Eastern Region manage-ment to undertake this experiment.
A Proposed Ecosystem Simulation Model to Predict the Effects of Common Carp and Zebra Mussels in Shallow Lake Ecosystems (Poster)
By Michael E. Colvin1
1Iowa State University Coop Unit, Ames, Iowa
The management of water quality in shallow lakes is a tradeoff between biological productivity and water clarity. Invasive species can have both negative and positive effects on the ecosystem. Common carp are known to have a nega-tive effect on water quality by uprooting aquatic vegetation and suspending sediment and nutrients sequestered in the lake benthos, possibly resulting in a hypereutrophic state. Zebra mussels have been shown to have a positive effect on water quality in eutrophic aquatic ecosystems over the short term by filtering and sequestering nutrients from the water column. As zebra mussel populations grow over time, however, the amount of nutrients removed and sequested from the water column increases, potentially limiting the biological produc-tivity of the ecosystem. In the short term, zebra mussels have the potential to mediate the negative effects of common carp on water quality in shallow lake ecosystems. Whether zebra mussels in the long term will have a negative or positive effect on the water quality of shallow lake ecosystems is uncertain. In light of the recent introduction of zebra mussels and the possible mediation of the effect of common carp on water quality in Clear Lake, Iowa, an ecosystem simulation model has been proposed to evaluate the effect of invasive species on future water quality and the aquatic community. Our poster will address the mechanics of the proposed ecosystem simula-tion model that will evaluate the effect of invasive aquatic species in shallow lake ecosystems.
Integrating 3-D Hydrodynamic Transport and Ecological Plant Models of the Savannah River Estuary Using Artificial Neural Network Models (Poster)
By Paul A. Conrads1 and Wiley Kitchens1
1U.S. Geological Survey, Columbia, S.C.
To assess the environmental impacts of a potential deepening of the Savannah Harbor and to evaluate various mitigation options, a three-dimensional (3-D) hydrodynamic model and a marsh succession model (MSM) were developed. The 3-D model predicts changes in water levels and salinity in the system in response to potential harbor geometry changes. The MSM predicts plant distribution in the tidal marshes in response to changes in the salinity conditions in the marsh. To link the 3-D hydrodynamic and marsh-succession model-ing studies, data-mining techniques, including artificial neural network (ANN) models, were applied to integrate the riverine predictions from the 3-D model to the MSM.
The riverine and marsh databases, the riverine and marsh ANN models, model control, 3-D hydrodynamic model input, and simulation output were integrated into a spreadsheet application. The application allows users to use the predicted water level and salinity values from the 3-D model to predict changes in the tidal marshes. Output from the application is a 10- or 100-meter grid of the marsh system to be used as input to the MSM. The salinity values and grid parameters can be exported as an American Standard Code for Information Inter-change (ASCII) file for input into a geographic information system (GIS).
Using Data Mining Techniques and Artificial Neural Network Models to Integrate Hydrology, Ecology, and Biology—Two Case Studies (Oral Presentation)
By Paul A. Conrads1 and Wiley Kitchens1
1U.S. Geological Survey, Columbia, S.C.
U.S. Geological Survey (USGS) hydrologists and ecolo-gists have been working on integrating a long-term hydrologic data network and a short-term ecological database to support ecological models for the Savannah Harbor tidal marshes and the snail kite habitat in the Everglades. The two applications demonstrate how very accurate empirical models can be built
Proceedings of the Second All-USGS Modeling Conference, February 11-14, 2008 11
directly from the data to fully utilize historical databases in support of current interdisciplinary studies.
Ecologists are studying tidal wetlands of the Savannah River watershed in response to the potential deepening of the Savannah Harbor. The linkage between freshwater inflows, tidal water levels, and specific conductance is critical to enhancing the predictive capabilities of a successful marsh succession model. The USGS has maintained a riverine water-level and specific conductance data-collection network since the 1980s and a network of continuous marsh water-level and pore-water salinity gages in the tidal marsh since 1999. Data-mining techniques, including artificial neural network (ANN) models, were applied to address various needs of the ecology study. ANN models were developed to simulate riverine water levels and specific conductance in the vicinity of the tidal marshes for the full range of historical conditions. ANN mod-els also were developed to simulate the marsh water levels and pore-water salinities using inputs from the long-term USGS data network. Using the marsh ANN models, the continu-ous marsh network was hindcasted to be concurrent with the long-term riverine network. The databases, ANN river and marsh models, simulation controls for the models, streaming graphics, and model output were integrated into a Microsoft Excel application. The application is easy to disseminate and allows ecologists and engineers to evaluate river and marsh response to user-defined streamflow conditions easily.
A similar approach was applied to evaluating the hydrol-ogy of the snail kite habitat in Water Conservation Area 3 of the Everglades. Hydroperiods have a substantial effect on the nesting and foraging of the threatened and endangered snail kite. Seventeen water-depth recorders are colocated at tran-sects where extensive plant samples are collected. These con-tinuous recorders, maintained by the USGS, were established in 2003. The USGS has maintained a network of three water-level recorders since 1991. ANN models were developed using the three long-term gages as input to simulate the water levels at the 17 short-term sites and to hindcast water levels to 1991. The hindcasted water-level record will increase the predictive capabilities for evaluating the snail kite habitat to changing hydrology. The databases, ANN models, simulation controls for the models, streaming graphics, and model output were integrated into a Microsoft Excel application. As part of the Everglades restoration, Interim Operating Plan (IOP) water levels are generated that characterize modified flow regulation. The application will allow ecologists to evaluate IOP water levels for the long-term gages and the hydrology critical to the snail kite habitat.
Animation and Publication of Three-Dimensional and Four-Dimensional Physical Models (Poster)
By Christopher Polloni1, Michael Pantea2, Michael Kelly3, and Brian N. Davis4
1U.S. Geological Survey, Woods Hole, Mass.2U.S. Geological Survey, Denver, Colo.3University of Northern Arizona 4Science Applications International Corporation, Sioux Falls, S. Dak.
Scientists developing earth science models must also convey the scientific information and interpretations to audi-ences of colleagues, decisionmakers, policymakers, nonex-perts, students, and the general public. Because most human understanding is attained through visual interpretation of our surroundings, visualization of scientific information can help portray models more effectively in the context of larger societal implications. Development of three-dimensional (3-D) and four-dimensional (4-D) visualizations of earth science models can help integrate geoscience information from mul-tiple sources, providing insight into complex interdisciplinary studies. These visual communication tools are essential to the understanding of complex scientific issues by nonexperts.
Common software applications can now be used to visually interpret results of earth science models and aid their integration with other earth science data. Use of interactive 3-D and 4-D visual display tools can facilitate the common understanding of the scientific information contained within models and can be incorporated into all phases of earth science research. Visualization of results is often treated as an after-thought instead of as an interpretive tool. The development of self-contained, digital interactive visual publications would incorporate necessary data and visualization software tools into the publication of results.
We will show model results in 3-D and 4-D interactive displays using commercial geographic information system (GIS) software and commodity hardware, which contrast with the expensive virtual reality (VR) systems of the past and enable broader use. We will show scientific models in 3-D and 4-D animations and present tutorial information on how scientists can present model results using these tools. In many cases, model results are produced in other software packages, such as Matlab. Such robust visualization tools are necessary to integrate multiple models into a common geospatial view.
Portable display systems of commodity components are becoming commonplace, making data visualization more affordable. A portable GeoWall display system will be used to highlight some of the capabilities described. Also, new laptop displays are now capable of stereo display and may be available for demonstration. Software demonstrated will be ArcGIS, EarthVision, Fledermaus, Google Earth, and ROMA. Other packages, such as GeoModeller, are being reviewed and can be discussed.

12 Proceedings of the Second All-USGS Modeling Conference, February 11-14, 2008
Modeling an Aquatic Trophic Chain in a Two-Dimensional Topography in a Seasonally Varying Wetland (Poster)
By Donald L. DeAngelis1, Joel C. Trexler2, and Douglas D. Donalson3
1U.S. Geological Survey, Coral Gables, Fla.2Florida International University, Miami, Fla.
3U.S. National Park Service, Homestead, Fla.
Real food webs occur in a spatially and temporally varying environment. An extreme example of a food web subject to changes in space and time is the aquatic food web of the Everglades. Seasonal variation in rainfall leads to con-tinual changes in the extent of flooded area. As areas become wet, aquatic species invade and, conversely, as areas dry, aquatic species emigrate or become stranded and die. Because species invade (or dormant species recover) at different rates, the structure of the aquatic food web is continually chang-ing, leading to continual changes in the direction of control (resource limitation or predator limitation) within the food web. Understanding these changes and how they affect the abundance of fish species, particularly the small fishes, is criti-cally important because the small fishes are the most abun-dant vertebrates in the Everglades and Big Cypress wetland ecosystems of southern Florida. Small-bodied species, made up primarily of about 10 species of livebearers (poeciliids) and killifishes (cyprinodontids and rivulids), having similar life cycles and resource use, dominate the community by numbers. They constitute an ecosystem component whose biomass is the major energy resource for higher trophic levels, especially wintering and breeding wading birds. Systematic human-induced changes in hydrology over the past several decades have altered hydroperiods in most wetland areas, thereby diminishing this fish forage-base or changing the pattern of its availability. Lack of sufficient biomass and availability of prey are hypothesized to have been major factors in the decline of wading bird nesting at traditional Everglades’ rookeries. Recovery of historic fish patterns is a primary goal for restora-tion of southern Florida wetlands.
To help understand the dynamics of the aquatic food web, and especially the small fishes, the model GEFISH (Greater Everglades Fish) was created under the Across Trophic Levels System Simulation (ATLSS) program of the U.S. Geological Survey (USGS). Its purpose is to describe fish functional groups in freshwater marshes of the greater Everglades area of southern Florida. In particular, it is intended to assess the spatial pattern of fish densities through time across freshwater marshes and to help inter-pret and extrapolate monitoring data. This model has the capability of providing a dynamic measure of the spatially explicit food resources available to wading birds. The cur-rent version of GEFISH (GEFISH 1.1) simulates three
functional groups of small fishes, as well as crayfish, the trophic base of the fish, and a generalist piscivorous fish that can feed on the smaller ones. The marsh landscape is mod-eled as 100-meter (m) × 100-m spatial cells on a grid across the southern Everglades. The model is being used, in particu-lar, to indicate the impact of canals (which provide a perma-nent habitat for the large piscivorous fish) on the small fish community.
The Land Use Portfolio Model: A Tool for Natural-Hazards Risk Analysis (Oral Presentation)
By Laura Dinitz1 and Peter Ng1
1U.S. Geological Survey, Menlo Park, Calif.
We will describe and demonstrate the Land Use Portfolio Model (LUPM), a tool that U.S. Geological Survey (USGS) researchers developed to guide funding decisions for effec-tive reduction of natural-disaster losses. The model, based on financial portfolio theory, offers an approach to compare loss-reduction measures in terms of expected return on the investment and financial risk. Required model inputs are hazard-event probabilities, planning-time horizons, com-munity assets at risk, dollar values and (or) vulnerability of assets, spatial-damage probabilities, and costs and effective-ness of risk-reduction measures. To run the LUPM, the user defines a hazard scenario and selects a portfolio of locations or mitigation measures, or both, in which to invest. This selection may be guided by such policies as mitigating losses in schools, high-hazard locations, or other criteria. The LUPM estimates total cost, number of locations selected, expected loss, and the mean and standard deviation of return-on-investment and community wealth retained. Users can apply the LUPM to any natural hazard and location for which they have avail-able the required input data. Two case studies that have been done include earthquake-triggered liquefaction in Watsonville, Calif., and flooding in Squamish, British Columbia, Canada. The software we are developing to calculate the LUPM equa-tions is designed to work within ArcGIS desktop applications. Two versions will be available: (1) an ArcGIS tool extension, and (2) an ArcGIS Model Builder tool accessible through ArcGIS Toolbox. They will be packaged together and released in 2008 to internal USGS researchers and partners. Ongoing research includes developing better measures of uncertainty, expanding to multiple hazards, analyzing spatial autocorrela-tion, and combining the LUPM software with other tools, such as the Federal Emergency Management Agency’s Hazards US Multi-Hazard (HAZUS-MH) loss estimation software.

Proceedings of the Second All-USGS Modeling Conference, February 11-14, 2008 13
Forecasting the 21st Century World-Wide Status of Polar Bears Using a Bayesian Network Modeling Approach (Poster)
By Dave Douglas1, Steve Amstrup2, and Karen Oakley2
1U.S. Geological Survey, Juneau, Alaska2U.S. Geological Survey, Anchorage, Alaska
To inform the U.S. Fish and Wildlife Service decision on whether or not to list polar bears as threatened under the Endangered Species Act (ESA), we forecast the status of the world’s polar bear (Ursus maritimus) populations 45, 75, and 100 years into the future. We combined the world’s 19 polar bear subpopulations into four ecological regions on the basis of current and projected sea ice conditions: (1) the Seasonal Ice Ecoregion, which occurs mainly at the southern extreme of the polar bear range; (2) the Archipelago Ecoregion of the Canadian Arctic; (3) the Polar Basin Divergent Ecoregion, where ice is formed and then advected away from near-shore areas; and (4) the Polar Basin Convergent Ecoregion, where sea ice formed elsewhere tends to collect against the shore. We incorporated projections of future sea ice in each ecoregion from 10 Intergovernmental Panel on Climate Change (IPCC) general circulation models into a Bayesian network (BN) model structured around population stressors that could affect the factors considered in ESA decisions. The BN model com-bined empirical data, interpretations of data, and professional judgment into a probabilistic framework. The BN model forecasted extinction of polar bear populations in the seasonal ice and polar basin divergent ecoregions by 45 years from the present. These two areas currently are home to approximately two-thirds of the world’s polar bears. The BN model projected high nonzero probabilities that Archipelago polar bears could occur in smaller numbers through the end of the century, and in the Polar Basin Convergent Ecoregion through midcentury. Decline in ice habitat was the overriding factor driving the model outcomes. Sensitivity analyses of the BN model indi-cated that habitat loss was the overarching stressor responsible for the population declines. That is, the BN model outcomes were not qualitatively different when the effects of stressors other than sea ice decline (such as hunting pressure or industri-alization) were controlled. The outcomes were also not quali-tatively different when we applied only the general circulation models that projected the smallest decline in sea ice.
Modeling Past, Present, and Future Polar Bear Habitats (Oral Presentation)
By Dave Douglas1, Steve Amstrup2, George Michael Durner2, and Karen Oakley2
1U.S. Geological Survey, Juneau, Alaska2U.S. Geological Survey, Anchorage, Alaska
Diminishing sea ice is one of the strongest and most visible signals of contemporary change in the Earth’s climate system. The dependence of polar bears (Ursus maritimus) on hunting at the sea ice surface raises concern about the implica-tions of habitat loss on present and future polar bear popula-tions worldwide. In this study, we used resource selection functions (RSFs) to document changes in polar bear habitat over the past two decades and to forecast future habitat condi-tions through the end of the century. RSFs are quantitative expressions of the habitats animals choose to use, relative to the habitats that are available to them. We constructed RSFs with location data for 1985 to1995 from 333 satellite radio-tagged female polar bears, monthly passive-microwave sea ice concentration maps, and digital bathymetry and coastline maps. Satellite imagery documented the available habitat, and satellite telemetry revealed the choices bears made. We used discrete-choice modeling to distinguish between the avail-able and chosen habitats based on six environmental covari-ates: ocean depth, distance to land, ice concentration, and distances to the 15%, 50% and 75% ice edges. We used the 1985 to 1995 period to establish a baseline of preferred polar bear habitat selection criteria because during this early period of our study, year-round polar bear movements were less restricted and hence more likely to represent preferences than during the more recent years of reduced sea ice extent. The RSF models showed that polar bears have a strong preference for sea ice habitats that were near the periphery of the ice pack and over the shallow waters of the continental shelf. When extrapolated to the ice conditions of 1996 to 2006, the models revealed that preferred habitats had already started to decline, especially in spring and summer, and with greatest losses in the Barents, Chukchi, Greenland, and Southern Beaufort seas. To assess 21st century habitat changes, we extrapolated the RSF models to sea ice projections from 10 Intergovernmental Panel on Climate Change (IPCC) general circulation models (GCMs) forced with the “business as usual” Special Report on Emissions Scenarios (SRES-A1B) greenhouse gas emissions scenario. Results from the 21st century-based projections exacerbated the observed trends in habitat losses and added losses throughout all regions bordering Russia. Average annual habitat loss for the full Arctic basin was projected upwards of 35% by the end of the century, with summer losses of nearly 80% for the Alaska-Eurasia portions of the basin. In contrast, polar bear habitats were projected to be relatively stable during the 21st century in the high-latitude regions along the northwestern Canadian Archipelago and northern Greenland.

14 Proceedings of the Second All-USGS Modeling Conference, February 11-14, 2008
These results are consistent with the general observation that most GCMs project modest ice declines in winter but very strong declines in summer, resulting in either ice-free summers or remnant summer ice at the northernmost latitudes of North America.
HURASIM: Hurricane Simulation Model for Reconstructing Wind Fields and Landfall Frequencies of Historic Storms (Poster)
By Thomas W Doyle1 and Randy Westbrooks2
1U.S. Geological Survey, Lafayette, La.2U.S. Geological Survey, Whiteville, N.C.
The Hurricane Simulation Model (HURASIM) is a spatial simulation model of hurricane structure and circulation for reconstructing chronologies of estimated windforce and vectors of past hurricanes. The model uses historical track-ing and meteorological data of dated North Atlantic tropical storms from 1851 to the present. The model generates a matrix of storm characteristics (that is, direction, quadrant, and wind speed) within discrete spatial units and time intervals specified by the user for any specific storm or set of storms. HURASIM recreates the spatial structure of past hurricanes based on a tangential wind function, inflow angle offset, forward speed, and radius of maximum winds. Data input for the model includes tracking information of the storm’s position (latitude and longitude) every 6 hours or less and the maximum sus-tained wind speed. HURASIM model output from Hurricane Andrew (1992) was correlated with field data to construct data tables of damage probabilities by site and species and to deter-mine critical wind speeds and vectors of tree mortality and injury. HURASIM has also been applied to reconstruct prob-able wind fields of past hurricanes for remote field locations and correlated with tree ring growth patterns and direction of leaning trees and downed logs. HURASIM is also used to con-struct landscape templates of past hurricane activity that are linked with landscape simulation models of coastal habitat for predicting the effects of climate past and future on the growth and succession of important wetland communities.
Landscape Simulation Model for Invasive Species Spread and Detection (Poster)
By Thomas W. Doyle1, Randy Westbrooks2, and Ken Krauss1
1U.S. Geological Survey, Lafayette, La.2U.S. Geological Survey, Whiteville, N.C.
A landscape simulation model of Federal lands across the southeastern United States has been developed to foster early detection of and rapid response to the translocation and movement of invasive species. The model documents known population loci of invasive plants and insects and predicts their potential spread by generational patterns and rates combined with probabilities for rapid relocation of viable progeny by tropical storms making landfall. The counterclockwise circula-tion of tropical storms and hurricanes in the northern hemi-sphere may hasten the western and northern spread of spores, seeds, and reproducing adults across the Gulf coastal plain. The landscape model works in concert with another physical model, the Hurricane Simulation Model (HURASIM), which tracks hurricane paths, historical and hypothetical, to investi-gate the role tropical storms may have on invasive spread. The ultimate goal is to monitor the paths of tropical storms across coastal areas where particular invaders are known to occur, and to simulate translocation across impacted inland areas. In this project, we modeled the potential spread of the South American Cactus Moth (Cactoblastis cactorum) by Hurri-cane Dennis in July 2005 from infested areas along the Gulf Coast of Alabama to inland areas where prickly pear cacti (Opuntia spp.—the only host of the Cactus Moth) are known to occur. With such a system, conservation land managers in impacted areas could be alerted soon after a storm event and thus be able to implement appropriate actions to prevent the establishment and spread of target species. In the future, the system will be expanded by adding distribution information on high profile invasive plants of concern, such as cogongrass (Imperata cylindrica) and old world climbing fern (Lygodium microphyllum).
SELVA-MANGRO: Landscape Model for South Florida Mangrove Ecosystems (Poster)
By Thomas W. Doyle1 and Ken Krauss1
1U.S. Geological Survey, Lafayette, La.
A landscape simulation model, SELVA-MANGRO, was developed for mangrove forests of south Florida to investi-gate the potential impacts of climate change on the quality

Proceedings of the Second All-USGS Modeling Conference, February 11-14, 2008 15
and distribution of mangrove habitat. The SELVA-MANGRO model represents a hierarchically integrated landscape model that manages the exchange of system parameters up, down, and across scale between linked simulation models SELVA and MANGRO. The Spatially Explicit Landscape Vegetation Analysis (SELVA) model tracks predicted changes in the biotic and abiotic conditions of each land unit (1 square hectare) on an annual basis for the entire simulated landscape. The SELVA model administers the spatial articulation of landscape units composed of habitat classifications (forest, marsh, and aquatic) and any forcing functions that predict changes in hurricane activity, sea-level rise, and freshwa-ter runoff. Intertidal forest units are then simulated with the MANGRO model based on unique sets of environmental factors and forest history. MANGRO is an individual (agent)-based, spatially explicit stand-simulation model constructed for mangrove forests of the neotropics. It is composed of a set of species-based functions for predicting the growth, establishment, and death of individual trees. MANGRO predicts the tree and gap replacement process of natural forest succession as influenced by stand structure and environmental conditions. SELVA-MANGRO has been used to evaluate the role of hurricane history and frequency on forest structure and composition and to predict mangrove migration upslope and displacement of freshwater habitats under rising sea levels projections from climate change.
SLRRP: Sea-Level Rise Rectification Program and Seawater Inundation Model Under Climate Change (Poster)
By Thomas W. Doyle1
1U.S. Geological Survey, Lafayette, La.
The Sea-Level Rise Rectification Program (SLRRP) is a software program designed with a user-friendly interface to generate a suite of future sea-level projections from vari-ous global circulation models (GCM) and emission scenario options obtained from the Intergovernmental Panel on ClimateChange (IPCC) (2001). The SLRRP model allows the user to select a region-based tide station, GCM model, and emission scenario to generate a graph and output file of future sea-level change. Sea-level rise was modeled as a function of historic sea-level conditions at long-term tide stations based on mean monthly tide records projected into the 21st century with the addition of curvilinear rates of eustatic sea-level rise expected from climate change. The historical record was retained to mimic the natural cycle of high and low tidal variation attributed to astronomical and meteorological causes. The datarecord was extended into the next 100 years with the addi-tion of eustatic rates of sea-level rise based on IPCC (2001) low, mid, and high projections obtained from various global climate change models. Model simulations were achieved for
each of seven climate change models and six emission sce-narios included in the IPCC (2001) dataset. SLRRP rectifies the historic tide record and future eustatic sea-level rise into a common datum [default = North American Vertical Datum of 1988 (NAVD88)] to facilitate comparison with landbase fea-tures and elevations. The SLRRP model generates a sea-level prediction by wrapping the historic mean monthly records for the period of record for all future years up to year 2100. A series of sequential popup windows is used to facilitate user selection of GCM models, scenarios, and manual entries for projecting future sea levels. The SLRRP model allows the user to manually enter a local subsidence rate and a eustatic rise by the year 2100 in lieu of model defaults. After selecting a GCM model and emission scenario, the user can specify the actual effects and components of the GCM results that include degree of glaciation and thermal expansion. The program gives the user options for saving graphical and digital formats of SLRRP predictions and generating a supplemental graph to visualize the timing and extent of yearly flooding potential for a given elevation (NAVD88). In effect, the model shows the prospective data and time period for which sea level will over-top a given landscape feature under a future changing climate. Flooding potential is the percentage of months within a year when there is inundation by seawater at a select land elevation determined by the user.
Reference Cited
Intergovernmental Panel on Climate Change, 2001, Climate change 2001—The scientific basis—Contribution of Working Group I to the Third Assessment Report of the Inter-governmental Panel on Climate Change: Geneva, Switzerland, Intergovernmental Panel on Climate Change, 563 p.
CONGFLO: Floodplain Inundation Model of Congaree National Park (Poster)
By Thomas W. Doyle1
1U.S. Geological Survey, Lafayette, La.
A floodplain hydrology study of Congaree National Park was conducted to determine the flood relations of back-swamp forests and park trails as influenced by river stage and floodplain elevation using an integrated field and modeling approach. Water-level gages were spread across the length and width of a 5-kilometer (km) × 16-km floodplain to capture the lag and peak flood relations to river stage and were moni-tored over a period of years. Historical water-level stage and discharge data from the Congaree River have been digitized from published sources and U.S. Geological Survey (USGS) archives to obtain long-term daily averages for an upstream

16 Proceedings of the Second All-USGS Modeling Conference, February 11-14, 2008
gage at Columbia, S.C. Elevation surveys were completed for all park trails and for additional circuits of roads and boundar-ies. All elevation surveys were then processed and rectified into a geographic information system (GIS) and predictive flood inundation model. Regression models have been applied to establish time lags and stage relations between gages at Columbia, S.C., and in the upper, middle, and lower reaches of the river and backswamp within the park. Flood relations among backswamp gages show the retention and recession behavior between floodplain reaches with greater hydroperiod in the lower reaches than in the upper and middle reaches of the Congaree Swamp. A “flood alert” program has been devel-oped to predict critical river stages and potential inundation of hiking trails. Development of the Congaree landscape simula-tion model has been upgraded with a three-dimensional (3-D) interactive user interface that is web accessible on a dedicated USGS data server. A flood inundation model has been devel-oped to predict critical river stages and potential inundation of hiking trails on a real-time basis and 24-hour forecast.
Conceptual and Rapid Prototype Models for Evaluating the Effects of Land-Use and Land-Cover Changes on Ecosystem Services in the Lower Mississippi Valley (LMV) (Oral Presentation)
By Bogdan Chivoiu1, Stephen P. Faulkner2, Wylie Barrow2, and Susan Walls3
1ASci Corporation, Lafayette, La.2U.S. Geological Survey, Lafayette, La.3U.S. Geological Survey, Gainesville, Fla.
The landscape-scale alteration and resulting loss of hydrologic, biotic, and biogeochemical functions in the Lower Mississippi Valley (LMV) require an integrated, landscape-scale restoration and monitoring approach to replace those lost functions. Large-scale efforts are under way to restore former riparian forest habitats on both public and private lands in the LMV with explicit goals to restore wildlife habitat, improve water quality, and increase flood storage and reten-tion. However, the success of these restoration efforts in achieving these goals is not clear. In addition to field research, the use of conceptual and rapid prototype models (RPMs) can help identify the underlying natural processes that control ecosystem structure and function and the response to stressors and disturbance. These models will help provide a framework for developing appropriate performance standards, monitor-
ing approaches, and decision support tools to guide resource management decisions.
We are combining patch- and landscape-scale field research with modeling to quantify the ecological services of restored wetlands in the LMV. The interdisciplinary research team collected a variety of edaphic, vegetative, and morpho-logic characteristics on restored wetlands, active cropland, and native forested wetland sites in two LMV watersheds located in Arkansas and Louisiana. The species richness of migratory and breeding birds and amphibians was measured at each site. Various landscape variables were calculated at different scales from geographic information system layers.
A frame-based RPM was selected to explore the relation-ships between site and landscape variables and the response variables (species richness and abundance). The RPM param-eters were chosen based on expert-designed conceptual models, analysis of field data and existing literature. The RPM was designed using a spreadsheet application to simulate a 10-kilometer (km) × 10-km land use map (landscape) sur-rounding a restored wetland. The land use classes are rep-resented by different cell values and several landscapes are depicted on the same spreadsheet to illustrate the impact of different landscape patterns on the response variables. The response variable value is automatically updated as the input variables are changed to reflect spatial and temporal effects. The temporal change at the site level could be a change in forest structure representing a mature native-forested wetland. Changes in the size or number of restored wetland patches, or the connecting of restored wetland patches, reflect the spatial changes in the landscape at discrete steps in time.
The RPM approach has several advantages. The simple structure of the RPM leads to fast model development and allows for testing of various scenarios. Sensitivity analysis helps identify the variables that should be targeted by moni-toring. New variables from monitoring can be added later to refine the model or to develop it into a more complex type of model. The design transparency and simplicity also make the RPM an effective way of presenting the modeled processes and their outcomes to various stakeholders. We will discuss the results of the model runs under various management and land use alternatives and the applicability of this approach to integrated landscape science and monitoring.

Proceedings of the Second All-USGS Modeling Conference, February 11-14, 2008 17
Implementation of a Bayesian Geostatistical Parameter Estimation Module into PEST (Poster)
By Michael Fienen1, Randy Hunt1, John Doherty2, Tom Clemo3, and Wolfgang Nowak4
1U.S. Geological Survey, Middleton, Wis.2 Watermark Numerical Computing, Brisbane, Queensland, Australia3Center for Geophysical Investigation of the Shallow Subsurface, Boise
State University4 University of California Berkeley, Calif.
For this poster, researchers have approached parameter estimation for environmental models from several perspec-tives. Reducing problem complexity such that the problem is overdetermined—more data than parameters—allows for traditional regression methods, such as computer code for universal inverse modeling (UCODE) and Parameter Estima-tion code (PEST), to perform the estimation. In many cases, it is beneficial to allow a problem to remain underdetermined—more parameters than data—and regularization techniques, such as Tikhonov and pilot points are applied to make the inverse parameter estimation problem tractable. Regularization allows more freedom for the parameter field to be explored and is less tied to initial decisions on simplification that are required up front by the user. PEST is the most commonly used tool available for general regularized inversion.
What if one could look at the most probable parameter set in addition to the “best fit” parameter set? The Bayesian geo-statistical parameter estimation method is one such method of regularized inversion that allows this type of analysis through probability theory. When properly applied, this technique pro-vides the most likely and minimum variance set of parameters given the data and conceptual model. Posterior covariance—a measure of uncertainty in the estimated parameter field—can also be calculated. A major roadblock to the widespread appli-cation of Bayesian parameter estimation has been the lack of a practical tool that is readily available to the modeling com-munity. The focus of this work is to incorporate the Bayesian approach into PEST in the form of a module. In this way, users may learn the general framework of PEST and perform Bayes-ian inversion as an extension of the currently available tools in PEST rather than needing to learn a completely separate software package.
While PEST and the Bayesian extension are model-independent, a coupled ground-water flow and transport model [U.S. Geological Survey Modular Ground-Water Flow Model (MODFLOW) and Modular Three-Dimensional Transport Model (MT3D)] for the Trout Lake Water, Energy and Bio-geochemical Budgets (WEBB) project in northern Wisconsin served as both motivation and proving ground for develop-ment of this module. The cross-sectional model simulates flow and transport across an isthmus consisting of sandy glacial
sediments enveloping a laterally continuous thin layer of silt (a pattern typical of ice-block lake formation in continental glaci-ated terrain). Head and head-difference data were augmented with 18O/16O isotope transport data to distinguish provenance between lake water and terrestrial recharge. Tritium isotope data provide time-of-travel and residence-time information.
Underdetermined problems are most always character-ized by a very large number of parameters; for example, this problem estimates about 2,400 parameters based on about 120 observations. In the specific case of MODFLOW and MT3D, adjoint state sensitivity matrix calculations are critical for reducing the massive computational time burdens for calcu-lation of sensitivity that is needed to perform the parameter estimation. Other computational challenges related to prior covariance and algorithmic stability are also important to con-sider, and their implementation is discussed.
Joint Inverse Modeling to Estimate Flood-Flow Depths and Their Uncertainty in Ungaged Coastal Basins, El Salvador, Central America (Poster)
By Michael J. Friedel1
1U.S. Geological Survey, Lakewood, Colo.
This poster presents a regionalization procedure that was used to predict probable flooding in four ungaged coastal river basins of El Salvador, including Goascoran, Grande de San Miguel, Jiboa, and Paz. The flood-prediction problem is sequentially solved for two regions: upstream mountains and downstream alluvial plains. In the upstream mountains, a set of rainfall-runoff parameter values and recurrent peak-flow discharge hydrographs are simultaneously estimated for 20 tributary-basin models. Application of dissimilarity equations among tributary basins (soft prior information) permitted development of a parsimonious parameter struc-ture constrained by measurement information in the recurrent peak-flow discharge values derived using regression equa-tions based on measurements recorded outside the ungaged study basins. The estimated joint set of parameter values gave estimates of probable minimum and maximum peak-flow discharge; limits were then estimated, revealing that predic-tion uncertainty increases with basin size. In the downstream alluvial plain, model application of the estimated minimum and maximum peak-flow hydrographs facilitated simulation of probable 100-year flood-flow depths in confined canyons and across unconfined coastal alluvial plains. The regionalization procedure provides a tool for hydrologic risk assessment and flood protection planning that can be applied elsewhere.

18 Proceedings of the Second All-USGS Modeling Conference, February 11-14, 2008
Joint Inverse Modeling to Estimate Extreme Rainfall Events and Their Uncertainty in Ungaged Coastal Basins, El Salvador, Central America (Poster)
By Michael J. Friedel1
1U.S. Geological Survey, Lakewood, Colo.
This poster presents a regularized joint inverse pro-cedure that was used to estimate the magnitude of extreme rainfall events in ungaged coastal river basins of El Salvador, including, Goascoran, Grande de San Miguel, Jiboa, and Paz. Because streamflow measurements reflect temporal and spatialrainfall information, peak-flow discharge is hypothesized to represent a similarity measure suitable for regionalization. To test this hypothesis, peak-flow discharge values determined from streamflow recurrence information (10-year, 25-year, and 100-year) collected outside the study basins were used to develop country-wide regression equations. Peak-flow dis-charge derived from these equations, together with preferred spatial parameter relations as soft prior information, were used to constrain the simultaneous calibration of 20 tributary basin models. The nonlinear range of uncertainty in estimated parameter values (1 curve number and 3 recurrent rainfall amounts for each model) was determined using an inverse calibration-constrained Monte Carlo approach. Cumulative probability distributions for rainfall amounts indicate differ-ences among basins for a given return period and an increase in rainfall magnitude and range among basins with increasing return interval. The estimated median rainfall amounts for all return periods were reasonable but larger (by 3.2 percent to 26 percent) than rainfall estimates computed using the frequency-duration (traditional) approach and individual rain gage data. The observed 25-year recurrence rainfall amount at La Hachadura in the Paz River basin during Hurricane Mitch (1998) is close to the estimated rainfall confidence limits. The similarity between joint inverse and traditionally computed rainfall events, however, suggests that the rainfall observation may likely be the result of under-catch and not model bias.
Application of Stochastic Modeling to Forecast Likely Urbanization Effects on Ecological Integrity in the Upper Illinois River Basin (Poster)
By Michael J. Friedel1
1U.S. Geological Survey, Lakewood, Colo.
This poster presents the results of a study that was under-taken to predict the probable effects of future urbanization on the ecological integrity of the Upper Illinois River Basin (Chicago area). Biotic indices and sediment trace-element concentrations for 43 streams, determined by Illinois State agencies and as part of the U.S. Geological Survey’s National Water Quality Assessment program, were examined along an agricultural-to-urban land use gradient. Relations among biotic integrity, sediment chemistry, and urbanization were derived from annual samples collected from 1982 through 1993. Because these annual samples were from different tributary basins with different urban percentages and geologic settings, the trends along the gradient suggest the absence of bias. Ana-lytical equations were fit to bivariate relations, and probability density functions were fit to residuals for use with the Monte Carlo technique so that stochastic modeling could be per-formed. Stability of stochastic modeling required 1,500 Monte Carlo trials; reliability of stochastic modeling was evaluated by comparing statistical summaries of measured to simulated biotic indices, and future predictions were validated against an independent Alternate Index of Biotic Integrity (AIBI) score for Long Run Creek. Stochastic modeling of future urbaniza-tion-induced changes in ecological integrity for basins (Big Rock Creek, Des Plaines River, Mill Creek, and Flag Creek) along an urban gradient (1990 percent urban land use of 1, 5, 10, and 87 percent, respectively) resulted in a broad range of probable biotic resource quality (excellent to very poor). Pre-dictors used to simulate changes in basin ecological integrity from 1990 to 2000 and from 2000 to 2010 included fish and invertebrate biotic indices and streambed sediment nickel concentration. These predictors suggest that the degradation of ecological integrity in tributary basins occurred at differential rates and with a probable distribution of likely outcomes. For example, the AIBI median predictions of ecological integrity from 1990 and 2010 was two quality classes (good to poor) in the Big Rock Creek and Des Plaines River tributary basins, and one quality class (poor to very poor) in the Flag Creek and Mill Creek tributary basins. A scale was devised for convert-ing Marcoinvertebrate Index scores to biotic resource quality classes for interchanging results with AIBI scores. This cali-brated scale is likely to be useful in more urbanized streams where it is not always possible to compute AIBI scores, and for comparison between biotic indices in other studies. Bed sediment nickel concentration was a useful predictor of eco-logical integrity and percent urban land use (and population

Proceedings of the Second All-USGS Modeling Conference, February 11-14, 2008 19
density) in the basin. Because the time and costs for determin-ing nickel concentrations are much less than for determining biotic integrity scores, future studies could use this scale or other correlated variables as predictors.
Stochastic Modeling to Forecast Likely Effects of a Proposed Reservoir on Colorado River Quantity and Quality Near Grand Junction, Colorado (Poster)
By Michael J. Friedel1
1U.S. Geological Survey, Lakewood, Colo.
A proposed 16,000 acre-foot reservoir would be located about 25 miles east of Grand Junction, Colo., on a tributary of the Colorado River that drains into the Sulphur Gulch watershed between De Beque and Cameo, Colorado. The proposed Sulphur Gulch Reservoir, which would be filled by pumping water from the Colorado River, is intended to provide the Colorado River with at least 5,412.5 acre-feet of water during low-flow conditions to meet the East Slope’s portion of the 10,825 acre-feet of water required under the December 20, 1999, Final Programmatic Biological Opinion for the Upper Colorado River. The reservoir also may provide additional water in the low-flow period and as much as 10,000 acre-feet of water to supplement peak flows when flows in the Colorado River are between 12,900 and 26,600 cubic feet per second. For this study, an annual stochastic mixing model with a daily time step and 1,500 Monte Carlo trials was used to evaluate the probable effect that reservoir operations may have on water quality in the Colorado River at the Government Highline Canal and the Grand Valley Irrigation Canal.
Simulations of the divertible flow (ambient background streamflow), which takes into account demands of down-stream water rights, indicate that divertible flow will range from 621,860 acre-feet of water in the driest year to 4,822,732 acre-feet of water in the wettest year. Because of pumping limitations, pumpable flow (the amount of streamflow avail-able after considering divertible flow and subsequent pump-ing constraints) will be less than divertible flow. Assuming a pumping capacity of 150 cubic feet per second and year-round pumping, except during reservoir release periods, the simula-tions indicate that there is sufficient streamflow to fill a 16,000 acre-feet reservoir 100 percent of the time. Simulated pump-able flows in the driest year are 91,669 acre-feet and in the wettest year are 109,500 acre-feet. Simulations of carryover storage together with year-round pumping indicate that there will be sufficient pumpable flow available to refill the reser-voir to capacity each year following peak-flow releases of as much as 10,000 acre-feet and low-flow releases of 5,412.5 acre-feet of water.
Simulations also indicate that peak-flow release condi-tions (flows of between 12,900 and 26,600 cubic feet per second) would occur in about 50 percent of the years to allow release of 10,000 acre-feet of stored water in the spring. Under typical (5 of 10 years) to moderately dry (3 of 10 years) hydro-logic conditions, the duration of the peak-flow conditions will not allow the full 10,000 acre-feet to be released from storage to supplement peak flows. During moderate to extremely dry (2 of 10 years) hydrologic conditions, the peak-flow release conditions will not exist, and there will be no opportunity to release water from storage to supplement peak flows.
In general, the simulated daily background dissolved-sol-ids concentrations (salinity) at the Government Highline Canal increase because of the reservoir releases as annual hydrologic conditions go from wet to dry. The simulated median concen-trations during the low-flow period range from 417 milligrams per liter (wet year) to 723 milligrams per liter (dry year), whereas the simulated median concentrations observed dur-ing the peak-flow period range from 114 milligrams per liter (wet year) to 698 milligrams per liter (dry year). Background concentration values at the Grand Valley Irrigation Canal are generally only a few percent less than those at the Government Highline Canal, except during dry years.
Low-flow reservoir releases of 5,412.5 acre-feet and 10,825 acre-feet were simulated for a 30-day period in Sep-tember, and low-flow releases of 5,412.5 acre-feet were simu-lated for a 78-day period in August through October. In gen-eral, these low-flow reservoir releases resulted in changes to salinity concentrations ranging from slight decreases to slight increases in dissolved-solids concentrations over the range of hydrologic conditions simulated. Low-flow releases of 5,412.5 acre-feet of water over the 78-day period resulted in increases in salinity greater than the salinity measurement error for fewer than 10 percent of the driest years simulated. Low-flow releases of 5,412.5 acre-feet of water over the 30-day period coupled with peak-flow releases of as much as 10,000 acre-feet of water also resulted in increases in salinity greater than the salinity measurement error in fewer than 10 percent of the driest years simulated. Observed trends in stream dissolved-solids concentrations at the Grand Valley Irrigation Canal are similar to those observed at the Government Highline Canal; however, the magnitude of the percent change and the absolute change is less, except under very dry hydrologic conditions.
Understanding instream changes in selenium concentra-tion following reservoir releases also are of concern because selenium can be toxic to fish and other biota. Instream selenium concentrations are an order of magnitude greater in tributary creeks like Sulphur Gulch (1 to 25 micrograms per liter) than in the Colorado River (0.3 to 0.7 microgram per liter). Simulations indicate that random sampling may result in a 1 percent and 35 percent chance, respectively, of exceed-ing Colorado instream acute (18.4 micrograms per liter) and chronic (4.6 micrograms per liter) water quality standards in Sulphur Gulch runoff. The lack of selenium in water pumped from the Colorado River to storage likely will result in dilut-ing reservoir concentrations to a range of 0.37 micrograms

20 Proceedings of the Second All-USGS Modeling Conference, February 11-14, 2008
per liter (wet conditions) to 1.48 micrograms per liter (dry conditions). Therefore, based on the simulations and inher-ent assumptions, selenium concentrations in the proposed reservoir are expected to be less than the acute and chronic standards.
CASCaDE: Computational Assessments of Scenarios of Change for the San Francisco Bay-Delta Ecosystem (Oral Presentation)
By Neil K. Ganju1, Lisa V. Lucas2, James E. Cloern2, Noah Knowles2, Michael Dettinger3, Dan Cayan3, and David Schoellhamer1
1U.S. Geological Survey, Sacramento, Calif.2U.S. Geological Survey, Menlo Park, Calif.3U.S. Geological Survey, La Jolla, Calif.
Design of this modeling study is built on the following hypotheses: (1) California’s hydrology will change during the 21st century in response to global warming; (2) water manage-ment and ecosystem structure and function will respond to changes in California’s water supply, land use, sea level, and efforts to restore many ecosystem services; (3) information is available to project plausible examples of change in each of these forcings; (4) climatic, hydrologic, hydrodynamic, water quality, geomorphic, and ecosystem processes are linked in the San Francisco Bay-Delta River Watershed (BDRW) system, and thus models to project future conditions must also be linked; and (5) strategic planning by ecosystem managers will benefit from mechanistic, ecosystem-scale projections of future forcings and responses, posed as plausible scenarios of system change. We are in the process of linking output from climate, streamflow, estuarine, geomorphic, and ecosystem models to generate scenarios of ecological change for the BDRW. Global climate models are run under selected scenar-ios of future greenhouse gas emissions, and resulting precipi-tation and temperature projections are downscaled for use in the hydrologic model, which provides input for the estuarine models. The estuarine models simulate transport of water, salt, and suspended sediment for use in projecting changes in geomorphology and water quality within the estuarine regions of the BDRW. Throughout this interaction of physical models, ecological models of phytoplankton, benthic organisms, and fish utilize physical model output, such as water temperature, salinity, light attenuation, and depth. The final outcome is a range of scenarios of ecosystem function under specified sce-narios of future climate. Each model functions independently; output from a “producing” model is translated into an appro-priate input that can be used by the “receiving” model in the necessary format. We have completed a preliminary example
of model interaction, demonstrating a “cascade” from climate change to estuarine geomorphology to primary productivity. One scenario of precipitation and warming is passed through the hydrologic model to generate altered conditions for the year 2030 (in terms of streamflow timing and magnitude), which then cascades to an estuarine geomorphic model. This model is also provided with an estimate of sea-level rise and watershed sediment supply in the year 2030. The model calcu-lates changes in sediment transport and bathymetry, yielding future estimates of turbidity and depth. Overall, the estuary becomes deeper and less turbid as sea-level rises and sediment supply continue to decrease. The effects of these changes on phytoplankton biomass and productivity are estimated by a model of phytoplankton growth and loss under the prescribed scenario. The structure of this modeling endeavor, in terms of linking models and output, is suited for interdisciplinary stud-ies, where spatial and temporal scales may differ substantially.
Modeling the Hydrodynamic and Morphologic Response of an Estuary Restoration (Oral Presentation)
By Guy Gelfenbaum1, Curtis Tanner2, and Doug George1
1U.S. Geological Survey, Menlo Park, Calif.2Washington Department of Fish and Wildlife, Olympia, Wash.
Fifty years of sediment infilling of Capitol Lake, Olympia, Wash., which is an artificial lake created by a tide gate across an estuary mouth, prompted researchers for the Deschutes Estuary Feasibility Study (DEFS) to evaluate the possibility of a restored estuary as an alternative to lake management. The researchers are is investigating removing the dam and allowing tidal processes to return to the historic predam basin. Numerical modeling of the hydrodynamics and morphological evolution of four restored estuary scenarios provides predictions of physical habitat, scour potential, and sediment accumulation rates to the other components of this multidisciplinary study, which also encompasses predictions of biological colonization, assessment of threats to existing infrastructure, and appraisal of how restoration would affect the surrounding communities. A morphodynamic model, Delft3D, is used to predict the flow, wetting and drying, salin-ity regime, sediment transport, and morphological change that would occur under several restoration scenarios. Hydrodynam-ics were modeled in three dimensions to explore the extent of estuarine circulation processes, and sediment transport and morphological change were modeled in two dimensions. The development of long-term (10-year) morphological simula-tions of the restored estuary required simplifying several data inputs and implementing a time-scale acceleration technique. A river sediment discharge climatology was developed to

Proceedings of the Second All-USGS Modeling Conference, February 11-14, 2008 21
characterize the Deschutes River sediment discharge to the estuary and a representative tide was selected from the 4-meter (m) semidiurnal tidal range. To reduce the computa-tional time of the simulations, a variable morphological factor was employed to scale hydrodynamic time up to the longer morphological time scales. Four sediment classes (2µm, 31µm, 200µm and 2,000µm) were modeled to represent the observed mixed bed and fluvial sediment. A range of erosion parameters obtained from the literature was utilized for the mud fractions because no field data were collected to param-eterize the erodibility.
Model simulations reveal that the changing estu-ary morphology would have a strong impact on the physical habitat (bathymetry, substrate, inundation frequency, mean salinity, salinity range, and circulation) causing it to evolve over time. According to the model, the estuary would transi-tion through multiple phases and approach a dynamic equi-librium within several years of restored tidal processes. The evolved estuary showed many bathymetric similarities with the predam estuary, including a deep central channel and broad mud flats. The rate of erosion of the channel and amount of sediment deposited near the port and marina, which are located seaward of the current tide gate, depend on the values used for the mud erodibility parameters. The uncertainty in erodibility of mud introduced more variability in the results for the restored estuary than any of the alternate restoration scenarios.
Addressing Among-Group Variation in Covariate Effects Using Multilevel Modeling Approaches With Emphasis on Multilevel Count Models (Poster)
By Brian R. Gray1, Jim Rogala1, and Roger Haro2
1U.S. Geological Survey, La Crosse, Wis.2University of Wisconsin, La Crosse, Wis.
Multilevel or hierarchical models are used to analyze data that may be hierarchically structured in space, time, or both. Such structure may arise because of natural processes or by human design. For example, multiple observations from each of multiple lakes are nested within groups (lakes)—whether by design or otherwise. An advantage of using multilevel models with hierarchically structured data is that they offer insights into whether covariate effects vary by group (for example, by lake), by scale (for example, whether effects arise from sampling- or lake-level processes), or both. In this poster, we illustrate inferences on variation in covari-ate effects using counts of mayfly larvae with a continuous covariate water depth. Counts were modeled under negative binomial (NB) and zero-modified NB distributional assump-tions. The estimated number of covariate associations varied
substantially across groups under both NB and zero-modified NB models. The effects of acknowledging this among-group variation were (1) wider confidence interval estimates on the mean covariate association (intervals increased in width by 35% to 55%) and (2) the implication that covariate associa-tions varied substantially across groups (a 95% credible interval on depth associations from the zero-modified NB model included decreases of up to 27% and increases of up to 224%). The latter inference has important general implications for study design: When the study includes inferences that span groups and where covariate effects may vary among those groups, the study design should address numbers of groups and numbers of samples within groups. Regarding questions of variation by scale, the mayfly-depth covariate association would not have been inferred had the covariate been mod-eled as its mean (that is, by the annual sample means of the covariate). This finding illustrates that the common practice of substituting group means for measured covariate values may yield incorrect inferences in the presence of nonlinearities, unmodeled interactions, or contextual effects (that is, effects that arise at the group scale). Study inferences were derived by collaboration among a physical scientist and a statistician from the U.S Geological Survey, and a macroinvertebrate ecologist from the University of Wisconsin-La Crosse.
Spatial and Age-Structured Population Model of the American Crocodile for Comparisons of CERP Restoration Alternatives (Poster)
By Timothy Green1
1U.S. Geological Survey, Gainesville, Fla.
The Comprehensive Everglades Restoration Plan (CERP) has been described as the world’s largest ecosystem restoration effort. Interim goals designed to measure progress toward ecological benefits have been set by the Restoration Coordination and Verification (RECOVER) component of CERP. A list of indicators was created by the RECOVER team to help determine the success of interim goals in achieving restoration of the natural system. One of these indicators is the American crocodile (Crocodylus acutus).
The American crocodile has been identified as having the potential to provide a quantifiable measure of restoration success. The crocodile is considered to be a useful indica-tor of the ecological condition of mangrove estuaries under the CERP owing to its reliance upon estuarine environments characterized by appropriate salinity regimes and freshwater inflow. Several laboratory and field studies have reported a negative relationship between salinity and the growth rate in hatchling and juvenile crocodiles in Florida. Increased growth rates are hypothesized to result in increased survival
22 Proceedings of the Second All-USGS Modeling Conference, February 11-14, 2008
rates of hatchling crocodiles by reducing their vulnerability to predators. Therefore, CERP plans to take measures to reduce the salinity in habitats occupied by crocodiles in Everglades National Park and Florida Bay. Reduced salinity is expected toenhance hatchling and juvenile survival and growth, stimulate food production, and reduce dispersal distance.
To more fully understand the long-term impacts of vari-ous CERP restoration alternatives, a spatial and age-structured population model for the American crocodile is being created. This model will be based on code from the recently developed landscape-level Alligator Population Model. The crocodile model will couple local age-structured models into a spatial dispersal model that incorporates crocodile movement behav-ior using two-dimensional (2-D) spatial convolution. Spatial parameter maps from the Florida Everglades that reflect salin-ity and water levels and the crocodile habitat suitability index will be the driving functions of the spatially structured model. State variables and drivers will include hatchling growth and survival, forage production, forage availability (at times of both high and low water levels), and proximity to known nest-ing locations.
The model will be integrated with the U.S. Geological Survey Southern Inland and Coastal System (SICS) salinity and hydrology models. Daily salinity and hydrology model output will be integrated into the crocodile population model to produce monthly crocodile maps that show changes in pop-ulation densities across the landscape in response to various restoration alternatives. As an ecosystem-level hydrologically based tool, this model will also be useful for predicting croco-dile population shifts in response to possible increases in waterlevels and changing salinity as a result of climate change.
The Future: Data-Driven Lake and Reservoir Monitoring Using Real-Time 3-D Hydrodynamic and Water-Quality Simulations (Oral Presentation)
By William R. Green1
1U.S. Geological Survey, Little Rock, Ark.
Recent advances in sensor technology and data telemetry allow a range of surface meteorological and vertical water-column data to be collected simultaneously, in real time, for lakes and reservoirs. With recent advancements in computer technology, three-dimensional lake and reservoir models can be run in much shorter timeframes, allowing for real-time simulations of hydrodynamics and water quality. Together, these advances allow for the development of quasi-real-time decision-support systems for water quality management of individual lakes and reservoir systems. Using real-time instrumentation, the models can “learn” from the data and continuously check their predictive capabilities. Real-time
model simulations will provide necessary information for data-driven monitoring schemes designed to examine current biological, chemical, and physical conditions that impair the water quality of a lake or reservoir, such as algal blooms. For example, real-time model simulations and the resultant anima-tions of algal patch development (to include functional groups, such as nitrogen-fixing cyanobacteria or even such species as Microcystis aeruginosa)—which may be responsible for taste and odor or toxin problems in drinking water—will provide up-to-date information that can be used by monitoring teams to cost-effectively target data collection to specific locations in the lake or reservoir and to collect data throughout the growth phase and subsequent crash of the algal population. Until recently, recognition of an algal bloom in a lake or reservoir did not happen until after the bloom peaked or crashed, and then it is too late to collect information about the conditions that propagated the bloom. Understanding the processes that lead to an algal bloom and water quality impairment will aid in the design of in-lake or landscape engineering or manage-ment solutions to reduce or eliminate future impairments. Examples of applications of the recent technology (using idealized conditions) include two reservoir systems: Beaver Lake, which is an impounded mountain valley reservoir in the Ozarks of northwestern Arkansas, and Lake Houston, which is an impounded flood plain reservoir located near the Gulf Coast of Texas.
Using Such Web Services as StreamStats to Increase Your Modeling Productivity (Poster)
By John D. Guthrie1
1U.S. Geological Survey, Denver, Colo.
StreamStats is a web-based tool (available at http://streamstats.usgs.gov) that provides streamflow statistics, drainage-basin characteristics, and other informa-tion for U.S. Geological Survey streamgaging stations and for user-selected ungaged sites on streams. When users select the location of a streamgaging station, StreamStats provides previously published information from a database. When users select a site on an ungaged stream, StreamStats determines the drainage-basin boundary for the site, computes a variety of drainage-basin characteristics, and solves regression equations to estimate streamflow statistics for the site. The informa-tion provided by StreamStats is used by engineers, land and water-resource managers, biologists, and many others to help guide decisions in their everyday work.
Some functions accessible through the StreamStats user interface are also available as web services, meaning that other remote computer applications can initiate a request for a par-ticular function over the Internet, and StreamStats can perform that function and deliver the result back to the remote user.
Proceedings of the Second All-USGS Modeling Conference, February 11-14, 2008 23
The use of such web services promotes collaboration among modelers and allows them to take advantage of work that has been previously done.
Using a Coupled Ecosystem-Geochemical Model to Assess Ecological, Biogeochemical, and Hydrological Processes and Their Responses to Atmospheric Deposition and Climate Change for Diverse Ecosystems Within the United States (Oral Presentation)
By Melannie D. Hartman1, and Jill S. Baron2
1Colorado State University, Fort Collins, Colo.2U.S. Geological Survey, Fort Collins, Colo.
Ecological and hydrochemical responses to atmospheric deposition and climate change are of interest to regulatory and land management agencies. Models can be excellent heuristic tools that can reveal what is understood and not understood about how ecosystems function. As investigative tools, models are also useful for solving the inverse problem of describing the processes and parameters that account for empirical evi-dence. This may be particularly useful where there are limited field measurements, experimental studies, or spatial cover-age. Additionally, because such long-term events as gradual warming and changes in atmospheric deposition occur over timescales not measurable within the duration of most field experiments, models can be used to create myraid scenarios to examine the potential range of dynamic ecosystem responses.
DayCent-Chem is a nonspatial, daily time step, ecosys-tem, and geochemical model for investigating and predicting how ecosystems respond to atmospheric deposition, climate change, and extreme events. The model links two widely used and tested models, one of daily biogeochemistry, DayCent, and the other of soil and water geochemical equilibrium, PHREEQC. DayCent-Chem predicts plant growth, soil organic matter and nutrient cycling, hydrologic fluxes, stream and soil water chemistry, cation exchange, and sulfate adsorp-tion. The model can simulate short-term events, such as epi-sodic acidification, as well as long-term ecosystem dynamics.
With collaborators among government agencies and other research institutions, we modeled seven small water-sheds—three at national parks and four at long-term ecologi-cal research (LTER) sites. The sites were selected to represent a range of ecosystem types, climates, and nitrogen (N) and sulphur (S) deposition rates. The sites included a temperate deciduous forest (Coweeta), two maritime coniferous forests (Acadia and HJ Andrews), a northern hardwood mixed forest
(Hubbard Brook), a temperate coniferous forest (Great Smoky Mountains), a subalpine forest (Mount Rainier), and an alpine tundra (Niwot Ridge).
We explored how these ecosystems process both nutrients and pollutants under current and potential future climates. Model performance was evaluated by comparing model results to multiple types of observations at each site. We describe what we learned about the sites, including the relative impor-tance of abiotic and biologic controls at each location, and we describe what we learned about the model by contrasting its performance between sites. The gaps in empirical data that we determined would be helpful to understanding processes that regulate stream chemistry at each site include mineral denuda-tion rates; time series exchangeable cation measurements; and dry and fog deposition, particularly for base cations.
Our modeling exercises lay the foundation for future work. With the model calibrated for this diverse set of ecosys-tems, we plan to use it to predict ecosystem response, includ-ing carbon storage, trace gas emissions, and stream chemistry, to scenarios of future potential climate and atmospheric deposition.
Using GIS/Remote Sensing Models to Quantify and Monitor Southwestern Willow Flycatcher Breeding Habitat (Poster)
By James R. Hatten1, Eben H. Paxton2, and Mark Sogge2
1U.S. Geological Survey, Cook, Wash.2U.S. Geological Survey, Flagstaff, Ariz.
The Southwestern Willow Flycatcher (SWFL) (Empi-donax traillii extimus) is an endangered migratory passerine that breeds exclusively in riparian habitats scattered through-out portions of the southwestern United States. The riparian habitat that SWFLs depend on is constantly shifting across the landscape, making the determination and protection of such habitats difficult. To construct a set of predictive models of the SWFL’s breeding habitat, a team of interdisciplinary scientists compared vegetation and floodplain characteristics surrounding breeding and nonuse locations at multiple spatial and temporal scales. Our study site, Roosevelt Lake, Ariz., contains one of the largest known SWFL breeding popula-tions. Extensive survey efforts have been conducted through-out the breeding season to detect all territorial flycatchers at Roosevelt Lake between 1995 and 2004. The breeding habitat at Roosevelt Lake consists of a heterogeneous mosaic of discrete riparian forest patches composed of native, exotic, or mixed tree species. The spatial variables we examined were extracted from Landsat Thematic Mapper (TM) imagery and digital elevation models, plus some geographic information

24 Proceedings of the Second All-USGS Modeling Conference, February 11-14, 2008
system (GIS)-derived proximity variables. In addition to spatial variables that were created from a single year of vegetation data, we created a temporal class of variables that characterized the variability, stability, and changes in predicted flycatcher breeding habitat over a range of years. We accom-plished this by running the spatial models in successive years and populating them with TM imagery data specific to each year modeled. The temporal variables allowed us to examine the influence of habitat stability and quality on breeding site selection over a range of years. We examined more than one dozen spatial and spatial-temporal models. Our best model was spatial-temporal, containing two spatial variables that quantified the density of vegetation at the site (30-meter cell) and the variability in vegetation density within a 120-meter radius, plus two temporal variables that characterized the stability and variability of habitat over a 5-year period. Our models explained up to 68% of the variability in territory occurrence in a given year and up to 82% of the fluctuation in territory numbers between 1995 and 2004. Dense, vigorous riparian vegetation is the most critical feature of SWFL breed-ing habitat, and land use practices need to be carefully moni-tored to maximize this valuable resource. Our models indicate that SWFL habitat can form in less than 5 years and that reservoir management at Roosevelt Lake appears beneficial to SWFL habitat formation during prolonged drawdown periods. We expect our GIS remote sensing models to be applicable to a broad range of riparian obligate species and to be an effec-tive monitoring tool for the health of riparian ecosystems.
Hydrologic Effects of Climate Change in the Yukon River Basin (Oral Presentation)
By Lauren E. Hay1 and Gregory J. McCabe1
1U.S. Geological Survey, Denver, Colo.
A monthly water balance (WB) model was developed for the Yukon River basin (Pilot Station in Alaska, with a drainage area of 831,390 square kilometers). The WB model was calibrated using monthly precipitation and temperature climatology inputs derived from the Parameter-Elevation Regressions on Independent Slopes Model (PRISM) model of the Yukon. Potential hydrologic effects of climate change were assessed for the basin by imposing changes in precipita-tion and temperature derived from Intergovernmental Panel on Climate Change (IPCC) climate simulations. Two sce-narios from the IPCC were chosen that represent a range of future possible emissions of greenhouse gases. The range in outcomes shows a large amount of uncertainty in projected future hydroclimate in the Yukon basin.
Evaluation of Environmental Flow Components Produced Using a Distributed Watershed Model of the Flint River Basin, Georgia (Poster)
By Lauren E. Hay1
1U.S. Geological Survey, Denver, Colo.
Environmental flow components (EFCs) are components of daily flow that have been identified as important to river ecosystem health in a large range of hydro-climatic regions. The EFCs are classified as extreme low flows, low flows, high-flow pulses, small floods, and large floods. This poster presents a multiple-objective, step-wise, automated proce-dure for hydrologic model calibration using the EFCs. This procedure includes the sequential calibration of a model’s simulation of solar radiation and potential evapotranspiration followed by the annual water balance and daily runoff, evalu-ated by EFCs. The Shuffled Complex Evolution global search algorithm is used to calibrate the U.S. Geological Survey’s (USGS) Precipitation Runoff Modeling System (PRMS) at the outlet of the Upper Flint River basin of Georgia and selected subbasins. This process assures that intermediate states of the model, as well as the annual water balance, daily runoff, and EFCs are properly simulated for flow at the outlet and within the basin. As part of the USGS Water Availability Thrust in the Upper Flint River project, the calibrated model can be used to study the effects of urbanization and climate change on the EFCs. Finally, the results of this evaluation will provide a transferable procedure to support multidisciplinary modeling efforts for evaluating water availability and ecological flows in other watersheds of the United States and abroad.
Hydrologic Climate Change From a Deterministic View: Using GSFLOW to Simulate Climate Change in a Northern Temperate Climate (Oral Presentation)
By Randy Hunt1, John F. Walker1, Steve Westenbroek1, and John Doherty2
1U.S. Geological Survey, Middleton, Wis.2Watermark Numerical Computing, Brisbane, Queensland, Australia
Simulations of climate change effects on hydrologic systems have often been coarse, utilizing an approach such as “X percent reduction in recharge.” More encompassing simulations of the hydrologic system historically have been difficult because of differences in temporal and spatial scales and system boundary conditions. The recently developed

Proceedings of the Second All-USGS Modeling Conference, February 11-14, 2008 25
Ground-Water and Surface-Water Flow model (GSFLOW) (Markstrom et al., in press) that couples two widely used U.S. Geological Survey models: the Precipitation Runoff Modeling System (PRMS) and the Modular Ground-Water Flow Model (MODFLOW). The advantage of this coupled approach is that common outputs of climate change models [for example, changes to temperature and (or) precipitation intensity] can be directly input into the model, which in turn can be applied to the hydrologic system in a physically based, consistent, and transparent manner.
In this presentation, two examples of GSFLOW are contrasted: a lake-dominated system in northern Wisconsin simulated as part of the Trout Lake Water, Energy, and Bio-geochemical Budgets (WEBB) program and a trout stream in southcentral Wisconsin simulated as part of the reimbursable Water Cooperative Program. Two relatively simple climate scenarios were examined. The first evaluated a uniform 4.4°C increase in air temperature that represented a possible year 2100 average air temperature. The second evaluated the same uniform increase in air temperature but added the effects of additional extreme precipitation events by binning weekly precipitation into a single day in that week, which results in changes to precipitation timing, but not in the total annual rates.
The results of the heuristic simulations of increased average air temperature showed expected decreases in lake stage and stream flow. More interesting, results suggested that climate change can result in changes in dominant sources of water to ecosystems, as illustrated by a rain-dominated soft-water lake changing to a ground-water-dominated flow-through lake in the Trout Lake WEBB watershed with only an increase in temperature. In addition, when extreme events were added to a temperature increase, the changes to the southcentral Wisconsin trout stream system dynamics (decreased baseflow and increased flood peaks) suggest that the system may not be able to continue to support trout if such a climate change came to pass. Even though the simulations could be improved by including more climate sophistication, the results demonstrate a potential utility for GSFLOW model-ing for today’s resource managers, especially given their need to prioritize activities according to the funding available.
Reference Cited
Markstrom, S.L., Niswonger, R.G., Regan, R.S., Prudic, D.E., and Barlow, P.M., in press, GSFLOW- Coupled Ground-Water and Surface-Water Flow Model based on the integration of the Precipitation-Runoff Modeling System (PRMS) and the Modular Ground-Water Flow Model (MODFLOW-2005): U.S. Geological Survey Techniques and Methods 6-D1.
Advanced Species Modeling (Poster)
By Catherine S. Jarnevich1, Thomas J. Stohlgren1, and Tracy R. Davern1
1U.S. Geological Survey, Fort Collins, Colo.
Numerous modeling techniques are available to predict the potential distribution and abundance of invasive species in their invaded range and the distribution and abundance of any species under altered climate scenarios. These techniques may perform differently as spatial and temporal scales change, based on the taxa being examined and the data available for independent and dependent variables. We are examining differences between modeling techniques applied to plants, animals, and pathogens using datasets from various research-ers within the U.S. Geological Survey (USGS) for organisms as diverse as diatoms, Asian carp, and pythons. These tech-niques include the latest presence-only, presence-absence, and abundance modeling approaches reported in the literature, along with models derived for a particular species. Different predictor variables have been obtained from USGS research-ers and other sources and processed to be used to predict both current habitat suitability and habitat suitability under altered climate scenarios. Each different technique has very strict requirements for the format of input layers for both dependent and independent variables, making it difficult to learn the different techniques and prepare data for multiple techniques. The lessons we are learning about what works for a particu-lar situation can assist other researchers in determining the best approach(es) from the plethora of available ones. We are making this knowledge available through the development of an advanced species modeling center at Fort Collins Science Center. This center will provide capabilities for long-distance learning of the latest evaluated modeling techniques for spe-cies distributions, along with access to data layers for both present and future climate scenarios that are already processed to meet the requirements of each modeling technique.
Spatial and Temporal Modeling of Metal Transport Through Ground Water and Surface Water in Watersheds With Abandoned Mine Lands (Oral Presentation)
By Raymond H. Johnson1 and Michael J. Friedel1
1U.S. Geological Survey, Denver, Colo.
In the upper Animas River watershed, a 410-square-kilometer (km2) area in southwestern Colorado, metal loads from mining effects (acid mine drainage) degrade the surrounding ecosystem beyond the naturally occurring
26 Proceedings of the Second All-USGS Modeling Conference, February 11-14, 2008
metal loads (acid-rock drainage). Research in this watershed has been ongoing for 10 years as part of the U.S. Geological Survey Abandoned Mine Lands Initiative (AMLI) and the Process Studies of Contaminants Associated with Mineral Deposits (Contaminants Project) of the Mineral Resources Program. This research has been multidisciplinary from the beginning in an effort to integrate biologic, geochemical, geologic, and geophysical, information. The main objective of this research is to understand how mining has influenced ecosystem quality and in particular the fisheries in the upper Animas River. Understanding the health of the water is espe-cially important because the local area has recently converted from a mining-based to a tourism-based economy. This presentation examines the procedures and data requirements for modeling metal transport through the environment in a series of steps: (1) mining disturbance of the natural system, with initial metal release; (2) metal transport through colluvial material and fractured bedrock (flow and geochemistry); (3) locations of metal discharge from ground water and its effects on stream water quality; and (4) final metal concentrations in the stream water, spatially and temporally. Results from the Contaminants Project and the AMLI provide detailed informa-tion on stream-water quality (which is easier to collect than data on ground-water quality), and indicate the importance of ground-water discharge to streams as a significant pathway for surface-water metal loading from both acid-mine drainage and acid-rock drainage. As part of the U.S. Geological Survey’s Mendenhall Postdoctoral program, Prospect Gulch, a small (4.4-km2) alpine watershed within the upper Animas River watershed, was selected for further study of ground-water and surface-water quality. Data on the hydrogeology of the Prospect Gulch system include geochemistry of ground water and surface water, geologic mapping, geophysics, ground-water modeling, multilevel ground-water monitoring wells, rock-core analyses, and stream tracer-dilution studies. An integrated-science approach was taken to assemble these mul-tiple datasets and provide a detailed conceptual model of the controls on metal transport in ground water and surface water in and around Prospect Gulch. Data on the ground water and surface water collected in Prospect Gulch and the whole upper Animas River watershed will be presented and compared in terms of (1) data collection challenges, (2) identifying a con-ceptual model, (3) usefulness in understanding metal transport, and (4) scale issues. All these data assist in providing a model of metal transport through the environment. At this point, a holistic numerical model that describes metal transport from mine wastes through ground water through surface water through uptake in the ecosystem has not been developed. A current substitute is to join individual models, such as ground water models (MODFLOW), transport models (MT3DMS), surface water models (OTIS and OTEC), geochemical models (PHREEQC), and ecosystem uptake models (biotic ligand model). This “combined model” approach will be discussed as it applies to modeling metal transport at the small water-shed scale (Prospect Gulch) versus the larger watershed scale (upper Animas River). These methodologies must be
“calibrated” to existing abandoned mine land areas before they can be used in a predictive mode, such as evaluating remedial scenarios or evaluating impacts from future mining (which is a goal of the current Mineral Environment Assessment Project of the USGS Mineral Resources Program). Calibration difficulties and possible applications of the “combined model approach” to future land-use management will be highlighted.
Modeling Species Responses to Historical Climate Change: From Molecules to Continental Landscapes (Oral Presentation)
By K. Bruce Jones1, Timothy G. Wade2, and Brett R. Riddle3
1U.S. Geological Survey, Reston, Va.2Environmental Protection Agency, Research Triangle Park, N.C.3University of Las Vegas, Las Vegas, Nev.
Considerable concern has been raised over potential responses of biota to climate change and global warming. Of particular concern is how species might adapt to climate change, including shifting their ranges in response to geo-graphic shifts in suitable habitat. We compared and integrated approaches from phylogeography, historical biology, spe-cies habitat modeling, and landscape ecology to assess the responses of two widespread lizards, the short-horned lizard (Phrynosoma douglasi) and the desert horned lizard (Phryno-soma platyrhinos), to historical shifts in habitats associated with modeled climate change. We modeled historical habitat change using well-established relationships between tem-perature and elevation, and between temperature and species distribution. Habitat changes during glacial-interglacial cycles were modeled by changing habitat suitability along elevation gradients from digital elevation model data. Molecular mark-ers and phylogeographic analyses were used to independently establish relationships and diversification patterns within and among populations from across each species’ ranges through-out western North America. Phylogenetic patterns were then compared to modeled habitat change. We found remarkable concordance between each species’ pattern of diversification and connectivity and modeled habitat change. Additionally, phylogenetic signals of the short-horned lizard (P. douglasi) suggest a deep-history response to mountain building in the western United States. Patterns of dispersal and contraction in response to climate change reflected these lizards’ preference for open space and moderately disturbed sites (for example, along river basins rather than across neighboring terrestrial habitats), and contraction and expansion of habitat associ-ated with different scenarios of temperature change. The results of this paper demonstrate how multiple approaches and disciplines, ranging from molecular phylogenetics to

Proceedings of the Second All-USGS Modeling Conference, February 11-14, 2008 27
continental-scale landscape ecology, can be used to evalu-ate potential species responses to climate change. We discuss integration of these approaches and how they can be applied to other types of investigations.
Limitations to Modeling Nonnative Plant Species Distributions for Early Detection Monitoring in Arid Environments (Poster)
By Robert Klinger1, Leslie Smith2, and Matthew Brooks3
1U.S. Geological Survey, Bishop, Calif.2University of California at Davis3U.S. Geological Survey, Henderson, Nev.
The probability of eradicating populations of nonnative plant species decreases dramatically when infestations exceed several hectares; thus, early detection of incipient populations is considered to be a particularly useful strategy for preventing or managing impacts. We evaluated the use of species distri-bution models (SDMs) to help in the development of early detection programs for nonnative plants at three National Park Service (NPS) units in the Colorado Plateau biogeographic province. SDMs have been used increasingly to predict the likelihood of nonnative plants colonizing continental and bio-geographical regions, but their use at more local scales, such as in parks and reserves, has been limited. A potential draw-back of using SDMs at local scales is that the cost associated with collecting data for modeling individual species can be quite high. Therefore, our goal was to develop models based on pre-existing data from vegetation classification studies. Two groups of models were developed; those based on the incidence of nonnative plants at a plot, regardless of species identity (pooled models), and models developed for individual species (individual models). Our strategy was to conduct a comprehensive statistical analysis of distribution and abun-dance patterns of nonnative plants within each of the three NPS units, then to calibrate spatially explicit models using available geograpahic information system (GIS) data that best matched the variables with the greatest predictive ability from the statistical analysis. The SDMs were developed with maximum entropy methods (MAXENT) for three types of data; presence only, presence with site-specific data included, and presence-absence with site-specific data included. Overall, the pooled models were not helpful for use in an early detec-tion program. There were two primary reasons for the lack of usefulness of the models; problems with available GIS data and ecological distribution and abundance patterns. GIS data layers were not available for some important predictor vari-ables (for example, vegetation structure and soils), the types of data available among the units (for example, disturbance
types) were inconsistent, and the data were often incomplete or at an inappropriate scale for modeling local distribution patterns (for example, soils). Even without the data problems, the ecological distribution and abundance patterns would have limited the usefulness of the models. Nonnative plants were present in a large proportion of the plots at two of the units, so prediction surfaces of the pooled models were very broad. Models for individual species were more useful but still limited to a relatively small subset of those in the total species pool. Individual species tended to have either very broad or very narrow ranges, which resulted in either wide prediction surfaces or such restricted prediction surfaces that modeling was unnecessary. Models based on presence only or pres-ence with site-specific data underestimated the potential range compared with models based on presence-absence data. SDMs of nonnative species in the Colorado Plateau region would probably be most helpful when developed for high-priority species. Modeling at larger scales could be based on pre-exist-ing climate data, but finer-scale physiographic data would be required at the level of individual units.
The South Florida Ecosystem Portfolio Model: Integrating Ecological, Community, and Economic Values for Decision Support (Oral Presentation)
By William B. Labiosa1
1U.S. Geological Survey, Menlo Park, Calif.
Researchers from the U.S Geological Survey’s West-ern and Eastern Geographic Science Centers are refining the prototype for a web-enabled geospatial information tool [the South Florida Ecosystem Portfolio Model (EPM)] that uses an ecological-value model, quality-of-life indicators, and a market-land value model to screen possible future land use/land cover patterns in South Florida. The focus for this presentation is on the ecological-value model imple-mented for Miami-Dade County, an area that is facing intense development pressures on its remaining agricultural lands. The ecological-value model was created in close consulta-tion with Biscayne and Everglades National Parks and is designed to support their resource management responsibili-ties within the context of local land use decisionmaking. The ecological-value model scores land-use and land-cover patterns in terms of criteria specific to habitat protection, landscape fragmentation and patterns, water-quality buffer-ing, and ecological restoration potential. The scores for the individual criteria are based on appropriate models, includ-ing habitat models used in the Florida Gap Analysis Program (GAP) analysis, the Florida Natural Areas Inventory, and the U.S. Fish and Wildlife Service Multi-Species Recovery Plan, as well as land attribute-based contaminant loading models

28 Proceedings of the Second All-USGS Modeling Conference, February 11-14, 2008
and ecological-restoration-potential models. Criteria scores areintegrated in a multiattribute utility (MAU) model developed in consultation with Biscayne and Everglades National Park users. The approach combines natural science models, deci-sion science theory, collaborative model design, and infor-mation technology to yield a robust land-use and land-cover pattern evaluation tool. When integrated with community quality-of-life indicators and a market land-value model, the final web tool will be used to explore land use scenarios using criteria that are important to diverse stakeholders in the land use planning process in Southeastern Florida.
Developing an Infrastructure for Knowledge-Based, Spatially Explicit Population Modeling of Multiple Species (Poster)
By Edward J. Laurent1, Christina A. Drew1, and Jaime A. Collazo2
1North Carolina State University, Raleigh, N.C.2U.S. Geological Survey, Raleigh, N.C.
Anthropogenic changes to vegetation communities, climate, and landscape patterns are known to affect wildlife species’ distributions, abundances, and population viability. Hence, there is a need to understand these relationships bet-ter and to predict their consequences given various change scenarios. The development and application of data-driven predictive modeling approaches are limited, however, by the complexity of relationships between wildlife populations and their environments and by the resources necessary to strategi-cally sample and monitor this complexity over large areas for multiple species. Knowledge-driven modeling, whereby model structure and parameter values are based on a thorough review of the literature, offers a prudent alternative strategy for predicting and mapping population rates. These models can be tested with data when available and be extended to pre-dict changes under various scenarios. This knowledge-based approach may be optimized through an infrastructure that pro-motes collaboration and innovation by way of online access to information and tools. We present an infrastructure framework that includes three primary environments: (1) knowledge (collaboration and dissemination); (2) information (data); and (3) modeling (analysis). The knowledge environment enables collaboration and the dissemination of information, tools, and knowledge by way of Internet services with the goal of mini-mizing entropy (that is, disorder, inefficiency, and information loss) across partner actions. The information environment provides a structure for partners to describe species’ habitat associations, densities, and vital population rates under spa-tially explicit conditions. The modeling environment enables partners to design and share components of hierarchically
structured, spatially and temporally explicit models of species’ distributions and productivity.
As an example of synthesis and synergy among the three infrastructure environments, text descriptions of a species’ productivity in a specified spatial context may be atomized online using forms that allow partners to summarize them as records in a tabular format. The resulting records within the tables can be quantitatively summarized, along with records added by other partners, to derive parameter estimates of vital population rates and their statistical distributions under spa-tially explicit conditions. These parameter estimates and others describing the same rates given different spatial contexts can be used as informative priors in hierarchical empirical Bayes models that estimate the productivity of a specified area. Such models may be developed by using functions pulled from packages contributed by other partners or by writing new com-patible functions that are later shared. Data can be collected or acquired from partners to evaluate the models, and multi-model inferences can be employed for confirmatory analysis of competing model structures. Finally, the process and results of these analyses can be documented and used to inform new model structures, code new models, create multiauthor species wikis, provide guidance to other partners through web forums, and be published in the peer-reviewed literature. Combined, this infrastructure framework enables partners to increase their individual output and the efficiency of the collaboration through selfish actions. Entropy is reduced across partners by structuring individual actions within a broader, hierarchical context that removes redundancies, facilitates innovation, and enables the sharing of knowledge.
Regional Modeling of Carbon Dynamics Change in the Green River Basin, Wyoming, Based on Remotely Sensed Data (Poster)
By Zhengpeng Li1 and Zhengxi Tan1
1Science Applications International Corporation, Sioux Falls, S. Dak.
A regional model based on satellite observations was used to estimate long-term carbon dynamics in the Green River Basin, Wyo. Gross primary production (GPP) was pre-dicted using a eddy covariance-light use efficiency (EC-LUE) model derived from eddy flux measurements and remotely sensed data. The impacts of GPP on the dynamics of soil organic carbon (SOC) were quantified and evaluated using the Erosion Deposition Carbon Model (EDCM). The spatial and temporal changes of biophysical settings and land manage-ment practices were incorporated in the regional simulations of ecosystem changes using the General Ensemble Biogeo-chemical Modeling System (GEMS). Responses of ecosys-tem carbon stocks (including SOC) and fluxes to various

Proceedings of the Second All-USGS Modeling Conference, February 11-14, 2008 29
management scenarios were simulated. Results indicate that the sagebrush-dominated shrubland accumulated less soil car-bon than did the grass-dominated area. Grazing could lead to a greater decrease in net primary production (NPP) and SOC in shrubland than in grassland under the same grazing inten-sity. A grazing intensity of 0.03 animal units per hectare could reduce SOC at a rate of 3.1 gC m-2 yr-1 in shrubland, but SOC changed little in grassland during 30 years of simulation (1971 to 2000). Our model simulations also show that conversion of shrubland to grassland can enhance soil carbon sequestration in the Green River Basin.
Modeling Terrestrial Carbon Dynamics in the Eastern United States (Poster)
By Shuguang Liu1, Zhengpeng Li1, Thomas Loveland2, and Larry L. Tieszen2
1Science Applications International Corporation, Sioux Falls, S. Dak.2U.S. Geological Survey, Sioux Falls, S. Dak.
Estimating the dynamic evolution of the magnitude, spa-tial patterns, mechanisms, and uncertainty of carbon sources and sinks at the regional scale is challenging because of the spatial and temporal covariance of driving variables and the uncertainties in both the model and the input data. Although various modeling approaches have been developed to facilitate the upscaling process, few deal with error transfer from model input to output and error propagation in time and space. We developed the General Ensemble Biogeochemical Modeling System (GEMS) for upscaling carbon stocks and fluxes from sites to regions with measures of uncertainty. GEMS relies on well-tested site-scale biogeochemical models [for example, the Erosion Deposition Carbon Model (EDCM) and CENTURY)] to simulate the carbon dynamics at the site scale. The spatial deployment of the site-scale model in GEMS is based on the spatial and temporal joint frequency distribution of major driv-ing variables (for example, land cover and land use change, climate, soils, disturbances, and management). At the site scale, GEMS uses stochastic ensemble simulations to incor-porate input uncertainty and to quantify uncertainty transfer from input to output. Using data assimilation techniques, GEMS simulations can be constrained by field and satellite observations or census data, including estimates of net primary productivity from the Moderate Resolution Imaging Spectro-radiometer (MODIS), grain yield and cropping practices, and forest inventories.
We applied GEMS-EDCM to quantify the spatial and temporal distributions of the terrestrial carbon sources and sinks in the eastern United States. Results indicated that frequent land use change strongly affected the magnitude of carbon sources and sinks at the regional scale. Ignoring detailed land cover transitions and changes led to signifi-cant overestimation of carbon sink strength. The interannual
variability of regional carbon sources and sinks was strongly affected by climate variability and, to a lesser degree (at the local scale), by land use change. However, land use change often induced large instant changes in carbon stocks and fluxes at the local scale, followed by prolonged lagged impacts that affected the magnitude of carbon sources and sinks. We also found that the spatial and temporal changes of carbon stocks and fluxes at the local to regional scales must be quantified and analyzed. Equally important, the carbon sources and sinks must be correctly attributed to different sectors and processes (for example, croplands, forests, urbanization, and nitrogen deposition).
Modeling With Stakeholders: When the Process is as Valuable as the Product (Poster)
By Ken Lubinski1, Todd BenDor2, Bruce Hannon2, Sara Metcalf2, and Emily Wheeler2
1U.S. Geological Survey, La Crosse, Wis.2University of Illinois at Urbana-Champaign, Urbana, Ill.
We organized a workshop to explore the concept that collaborative learning among diverse stakeholders, through modeling, could nurture the common understanding required to promote mutually acceptable management decisions on the Upper Mississippi River. The exercise provided glimpses of often hidden communication barriers and the different value systems that exist between stakeholders and between scien-tists and managers. The three-day workshop was planned and executed in steps intended to attract, enlighten, and moti-vate nonscientists. We invited experienced and influential individuals; helped the participants select the workshop theme (seeking floodplain functionality in concert with develop-ment); secured onsite support from discipline and modeling experts and a professional facilitator; developed an agenda that captured individual participant knowledge in the model structures while allowing for regular feedback between the participants and the modelers; selected simple but real-time modeling tools; and distributed pre- and post-workshop participant surveys. With guidance, the participants prioritized questions that were vital to understanding the ecological and economic conditions, relationships, and values of the flood-plain system and for constructing focused models that were important as well as doable within the workshop’s timeframe. Interest in the causal factors driving floodplain land allocation led to two independent models, developed in parallel by par-ticipant subgroups, which simulated future changes in flood-plain composition. The major criticism of the process was that there was not enough time to develop models to the stage of verification and testing, and participants suggested that future efforts be structured as a series of workshops to first design, then test, then apply the models. While participants agreed

30 Proceedings of the Second All-USGS Modeling Conference, February 11-14, 2008
that the exchange of ideas was valuable, several expressed doubt that this academic exercise would impact their future behavior. These responses left open questions about the value of additional workshops on different themes, who would be responsible for the exercises, and if collaborative modeling needs to be instituted as a mandatory step in operational river management programs.
Use of Operational and Research Models to Assess Volcanic Tephra Hazards (Oral Presentation)
By Larry G.. Mastin1, John Ewert1, Robert Wardwell1, Evan Thoms2, and Roger Denlinger1
1U.S. Geological Survey, Vancouver, Wash.2U.S. Geological Survey, Anchorage, Alaska
Among the most widespread hazards posed by volcanic eruptions is the dispersal of tephra. Tephra that falls out of the atmosphere may reduce visibility to ground-based traffic, clog air filters, short electrical circuits, and cause breathing and respiratory problems. Fine ash that remains in the atmo-sphere poses a hazard to aircraft, abrading exterior surfaces and, in extreme cases, causing engines to stall. These two hazards (tephra fall and ash clouds) are both assessed through numerical models that have been verified by comparison with mapped deposits and satellite images. For tephra fall, the U.S. Geological Survey (USGS) forecasts hazards at volca-noes that are in a state of unrest (for example, Mount St. Hel-ens or, during the summer of 2007, Pavlof Volcano in Alaska) by generating daily maps showing areas that may receive tephra fall if an eruption were to occur in the upcoming 24 hours. Such maps are generated by a numerical model (ASH-FALL) developed by the Institute of Geological and Nuclear Sciences in New Zealand that uses as input a geologically reasonable erupted volume, plume height, vertical distribu-tion of tephra within the plume, and atmospheric wind vectors obtained from meteorological models for several elevations above the volcano. ASHFALL is a simple advection-diffusion model in which the rate of widening (in map view) of the tephra deposit with downwind distance is determined by an empirical diffusion coefficient that assumes outward spreadingof the ash cloud at a rate proportional to the tephra concentra-tion gradient. Comparison with mapped deposits of small- to medium-sized eruptions gives reasonable agreement; how-ever, the model does not consider spatial variation in wind, or effects of moisture or particle aggregation that could affect fallout patterns in larger eruptions or under moist conditions. Hazards to aviation from ash clouds are modeled in real time, during an eruption, not by the USGS, but by Volcano Ash Advisory Centers (VAACs), which are operated by the International Civil Aviation Organization. The VAACs use one of several Lagrangian particle- or cloud-tracking models
[Hybrid-Single Particle Lagrangian Integrated Trajectory (HYSPLIT), Puff Dispersion Model (PUFF), Canadian Emer-gency Response Model (CANERM), and the NAME disper-sion model], whose input includes global three-dimensional (3-D) wind data and volcanic “source parameters,” such as eruption rate, plume height, duration, and grain-size distribu-tion, estimated by the USGS or corresponding agencies in other countries. Estimates of plume height or duration can be obtained directly from observations, whereas eruption-rate estimates must be constrained from plume height through relationships based on theory, numerical models, or empirical observations. The USGS Volcano Hazards Program is working on several fronts to improve tephra hazard models and input parameters. Near-term improvements involve automating the process of generating tephra-fall maps and posting them on the web, and incorporating meteorological 3-D wind field forecasts to consider spatial and temporal variations in wind. Longer term goals include development of a 3-D tephra fall model that directly calculates ash diffusion from atmospheric turbulence and modeling projects to better constrain relation-ships between plume height and eruption rate under conditions that include atmospheric moisture and variable winds.
Extirpations and Elevational-Range Changes of the American Pika Linked to Climate Warming Through Climate-Envelope Modeling (Poster)
By Erik A. Beever1 and Karen Oakley1
1U.S. Geological Survey, Anchorage, Alaska
The American pika (Ochotona princeps) is a cold-adapted small mammal that resides in rocky montane habitats of western North America. In October 2007, The U.S. Fish and Wildlife Service was petitioned to list the species as threat-ened under the Endangered Species Act because of population declines thought to be related to climate warming. We used climate-envelope modeling to explain local extirpations and range changes of this species in the Great Basin region (for example, Nevada and Oregon). Surveys of pikas in montane taluses of the Great Basin during the 1990s and subsequent information-theoretic analyses suggested that population extirpations during the 20th century were best explained by a combination of climatic, biogeographic, and anthropogenic factors. Surveys during 2003 to 2007 documented additional extirpations and upslope migration of the minimum elevation of pikas at remaining sites. For both extirpations and upslope migrations, losses during the past decade occurred 3.8 times faster than during the 20th century.
To explore alternative hypotheses of thermal stress on pikas, we placed 236 temperature sensors (iButtons) within pika habitats for 30 months and performed vegetation surveys

Proceedings of the Second All-USGS Modeling Conference, February 11-14, 2008 31
in the vicinity of 25 sites with historical records of pikas in the Basin. We correlated our sensor data with data from the nearest weather stations and used this relationship, combined with long-term data from the same weather stations, to back-estimate temperatures within pika habitats at hundreds of locations each year between 1945 and 2006. We posited three alternative mechanisms of direct thermal stress: (1) winter-cold stress (indexed by number of days below 0°C and number of days below -5°C, which we predicted would be a novel stress, because most areas had previously been covered by an insulating layer of snow); (2) acute-heat stress (indexed by number of days above 28°C, an ambient temperature found to be lethal for pikas in previous studies); and (3) chronic-heat stress (indexed by average temperature during 1 June through 31 August). Magnitude of change was defined as change in our thermal metrics between 1945 to1975 and 1976 to 2006, to avoid climatic anomalies; recent stress was indexed by field conditions during 2005 to 2006. We compared the strength of evidence in support of competing multiple-logistic-regression models with different combinations of thermal predictors and temporal periods in an information-theoretic framework, using the corrected Akaike Information Criterion (AICc). Predictive accuracy of climate-envelope models, our most powerful tool for forecasting species’ responses to various climate scenarios, hinges critically on three elements that our work embodies: broad geographic domain of field-data collection; mechanis-tic understanding of climatic effects on focal organisms; and incorporation of biogeographic, climatic, and anthropogenic variables into models.
We expect future modeling efforts will increasingly mirror our approach. We molded the talents of a climatologist with extensive modeling skills, a vertebrate-population mod-eler, a quantitative ecologist, and three decades of field and literature-based experience. Although some disciplinary and logistical hurdles (for example, jargon, file transfer, or being located in different states) arose, these were minor and are now largely overcome. Conference calls, group e-mails, and file transfer using File Transfer Protocol (FTP) sites have been the primary modes of communication.
We will move now from site-based analyses to patch-based understanding of pika distributions relative to climate and other drivers within a hierarchical framework of analysis. In addition to the iButtons, we gained insights or fed into mod-els data from National Weather Service Cooperative Observer Program (COOP) stations, the Historical Climate Network, Parameter-Elevation Regressions on Independent Slopes Model (PRISM) data, and Hadley Center Climate Research Unit (CRU) records, essentially merging the strengths of each data source. Although precipitation may be important for this and other montane species, we did not model any aspect of it retrospectively, given that variability in those estimates would be comparatively much larger. We also found that our cold-season metrics were not estimable backward in time dur-ing periods of snow cover at iButton location, because these (stabilized) conditions had no correlation with data at weather stations, which are explicitly constructed to measure ambient
temperature above snow on the ground. Thus, our historical modeled data for days below threshold temperatures had to rely on trends during the ‘shoulder seasons’ of fall and spring, which exhibited results counter to our hypothesized cold-season mechanism and to the iButton results.
Biotic responses to climate change will vary among taxa and across latitudes, elevational gradients, and degrees of insularity. Ecological niche forecasting uses biotic and abiotic variables characterizing the existing geographical range of a species to predict how the species will respond to altered conditions, such as those resulting from global climate change. However, it remains poorly understood whether species losses would be greatest in populations experiencing the greatest climatic change or in populations living closest to the ‘edge of the bioclimatic envelope’. Our investigations provide an example of how to employ climate data to model biotic responses to climate change.
Delineation of Vegetation Communities Using Airborne Lidar Data at Jean Lafitte National Park, Louisiana (Poster)
By Monica Palaseanu-Lovejoy1, Amar Nayegandhi2, John C.Brock3, Wayne C. Wright4, and Robert Woodman5
1U.S. Geological Survey/Jacobs, St. Petersburg, Fla.2U.S. Geological Survey/ETI, St. Petersburg, Fla.3U.S. Geological Survey, St. Petersburg, Fla.4National Aeronautics and Space Administration, Wallops Island, Va.5U.S. National Park Service, Lafayette, La.
This study evaluates the capabilities of the National Aeronautics and Space Administration (NASA) Experimental Advanced Airborne Research Lidar (EAARL) to delineate vegetation communities in Jean Lafitte National Park, La. (JELA.), using a hierarchical approach. Five-meter-resolution grids of bare earth (BE), canopy height (CH), canopy-reflec-tion ratio (CRR), and height of the median energy (HOME) were derived from spatially dense EAARL data acquired in September 2005. The dataset comprises 35 tiles of 2 square kilometers for each metric. The unsupervised classification was carried out within the statistical open-source software R.
The first step of our hierarchical classification used a statistical-based approach to divide the CH into five distinct classes. Within each height class, a principal component analy-sis (PCA) and an independent component analysis (ICA) of all four different metrics were carried out. Lastly, for each height class, the principal components (PC), the independent compo-nents (IC), and the original metrics were classified into four groups either by the k-means or the neural-gas algorithms.

32 Proceedings of the Second All-USGS Modeling Conference, February 11-14, 2008
Unsupervised original metrics classifications and PCA- and ICA-based classifications were compared with JELA color infrared (CIR) aerial photography. Ground-truth data are being acquired at two test sites along specific transects to assess spe-cies composition and canopy cover and to identify biologically consistent vegetation patches. Our study reveals that neural-gas PCA- and ICA-based classifications performed better in categorizing different vegetation communities than direct unsupervised classification of the four metrics or k-means based classifications of PC and IC.
Spatially Continuous Interpolation of Water Stage and Water Depths Using the Everglades Depth Estimation Network (EDEN) (Poster)
By Leonard Pearlstine1, Monica Palaseanu-Lovejoy2, Pamela Telis3, Heather S. Henkel3, and Aaron Higer4
1U.S. National Park Service, Fort Lauderdale, Fla.2U.S. Geological Survey/Jacobs, St. Petersburg, Fla.3U.S. Geological Survey, Fort Lauderdale, Fla.4University of Florida, Davie, Fla.
The Everglades Depth Estimation Network (EDEN) is an information network that integrates real-time water-level monitoring with ground-elevation and water-surface modeling. EDEN provides scientists and managers with current (2000 to present), online water-stage and water-depth information for the entire freshwater portion of the Greater Everglades. Con-tinuous daily spatial distributions of the EDEN network stage data are interpolated on a 400-square-meter (m2) grid spacing. EDEN offers a consistent and documented dataset that can be used by scientists and managers to (1) guide large-scale field operations; (2) integrate hydrologic and ecological responses; and (3) support biological and ecological assessments that measure ecosystem responses to the implementation of the Comprehensive Everglades Restoration Plan (CERP). The target users are biologists and ecologists examining trophic-level responses to hydrologic changes in the Everglades. Water-stage interpolation uses daily median values from 240 water-level gages operated and maintained by four separate agencies: U.S. Geological Survey, Everglades National Park (ENP), South Florida Water Management District (SFWMD), and Big Cypress National Preserve (BCNP). All transmit-ted data are entered and stored in the USGS National Water Information System (NWIS) database. Hourly water-level data for the historical period 2000 to 2007 were compiled for all existing water-level gages in the study area and converted to the North American Vertical Datum of 1988 (NAVD88) using correction values obtained by global positioning system (GPS) differential, optical survey, or VERTCON.
The EDEN area is divided by canals and levees into eight distinct regions. Abrupt water-level discontinuities across the regions, owing to surface-water barriers, complicate interpo-lation across the entire area, and boundary conditions were simulated by linearly interpolating along both sides of levees using head- and tail-stage data. Radial-basis function interpo-lation with the multiquadric method was used to create a con-tinuous mathematical representation of the water surface that was sampled further on a 400 x 400 meter (m) grid spacing to record the interpolated values. These results are combined with a digital elevation model (DEM) to obtain daily water depth distribution. Only deterministic methods of interpola-tion were considered because the abrupt spatial discontinui-ties across the landscape cause statistical nonstationarity and because of the sparse number of gages that would be available if interpolation was subdivided into individual compartments. Multiquadric and kriging methods produce comparable results when semivariograms are developed using data from specific events. However, kriging requires data stationarity. Kriging also is reported to have inferior results when the semivario-gram parameters were developed from averaging data over a period of time.
Modeling Nonlinear Time Sequences in Earth Change and Human Disease Pandemics (Poster)
By Bruce H. Pugesek1
1U.S. Geological Survey, Bozeman, Mont.
The golden mean 1.6183, derived from the asymptotic solution of the division of progressive Fibonacci or Lucas numbers (Fibn+1 / Fibn or Lucn+1 / Luc1), is ubiquitous in nature. The ratio occurs in the complex mathematics of the shape of the universe, the spiral of galaxies, the shape and spiral of deoxyribonucleic acid (DNA), and the dimensions of plants and animals, to name a few. I have explored the golden mean and the Fibonacci and Lucas sequences as they relate to the element of time and have found significant connections to Earth change, namely volcanism, drought, weather-induced famines, and human disease pandemics. These changes may be associated with the 11-year solar cycle, the 18-year Saros cycle, and the 200-year solar cycle. Specific dates defined by these relationships are also highly correlated with warfare and commodity price rises that precede them. Both of these fac-tors may be associated with human disease resistance as well as demographic, emigration, and immigration shifts that are conducive to disease outbreak. Results indicate that the years 2008 and 2014 may be danger periods for disease pandemic outbreaks.
Proceedings of the Second All-USGS Modeling Conference, February 11-14, 2008 33
Elevation Derivatives for Modeling Postwildfire Debris Flows (Poster)
By Vivian R. Queija1, Bruce Worstell2, and Susan Greenlee2
1U.S. Geological Survey, Seattle, Wash.2U.S. Geological Survey, Sioux Falls, S. Dak.
Debris flows can be initiated by rainfall in areas of recent wildfires to create severe hazards for people and their property. Models to predict postwildfire debris flows are dependent on the ability to quantify independent basin parameters (such as total area, degree of slope, soil attributes, burn severity, and total rainfall). By applying the Elevation Derivatives for National Applications (EDNA) database, independent vari-ables are calculated continuously so that upstream variables are computed on a cell-by-cell basis. This process facilitates obtaining parameters at multiple resolutions for additional sample sites and, potentially, for applying models at unsam-pled locations. In this poster, we show an application of the approach in the Southern California Multi-Hazards Demon-stration Project.
GSFLOW—Coupled Ground-Water and Surface-Water Flow Model (Poster)
By Steve Markstrom1, Robert S. Regan1, Richard G. Niswonger2, David E. Prudic2, and Paul M. Barlow3
1U.S. Geological Survey, Denver, Colo.2U.S. Geological Survey, Carson City, Nev.3U.S. Geological Survey, Northborough, Mass.
An interdisciplinary approach is needed to assess the effects of variability in climate, biota, geology, and human activities on water availability and flow. The new Ground-Water and Surface-Water Flow model (GSFLOW) integrates the U.S. Geological Survey Precipitation Runoff Modeling System (PRMS) and the U.S. Geological Survey Modular Ground-Water Flow Model (MODFLOW-2005). GSFLOW builds on existing science and technology; is easily extensible; provides mechanisms for modeling over differ-ent spatial and temporal scales; and provides for integration between science and management objectives. Future versions of GSFLOW can include additional models to simulate other environmental and anthropogenic processes, such as cli-mate, water quality, ecology, geochemistry, and management strategies.
De-Trending for Climatic Variations to Reveal Stressed Ecosystems (Poster)
By Shuguang Liu1, Jennifer A. Rover1, Li Zhang1, Bruce K. Wylie1, Lei Ji1, and Norman B. Bliss1
1Science Applications International Corporation, Sioux Falls, S. Dak.
Short-term variation in climatic conditions results in dramatic fluctuations in ecosystem performance, particularly in water-limited ecosystems. These climatic-driven varia-tions confound the effects of management, insect infestations, and changing soil conditions, such as a thickening active soil layer in high latitudes. In this study, we presented a method to account for the influence of climatic variations on ecosys-tem performance, so that changes in the underlying ecologi-cal condition are emphasized. We adopted a growing season integration of coarse resolution, remotely sensed Normalized Difference Vegetation Index (NDVI) as a surrogate for actual ecosystem performance. Piecewise regression models were used to predict expected growing season performance. The models were developed using large samples of random pixels over multiple years from areas with the same land cover and within an ecoregion class. Independent variables in the models include seasonal (winter, spring, and summer) climate data (precipitation and temperature) and site potential or long-term historical performance. Model results were then used to construct annual maps representing the deviations, or perfor-mance anomalies, between expected ecosystem performance and actual ecosystem performance. Regression confidence limits were used to identify significant anomalies on the maps. Performance outside the confidence limits over multiple years indicates areas with consistent management, insect, fire, or ecosystem stress impacts. The trend in ecosystem anomalies over several years identifies areas where ecosystem stress is becoming more severe or less severe.
This approach has been applied to boreal forests and sagebrush lands in the western United States using both the 250-meter-resolution Moderate Resolution Imaging Spectro-radiometer and 1-kilometer-resolution Advanced Very High Resolution Radiometer Normalized Difference Vegetation Index. Piecewise regression R2 values have varied from 0.84 in the Yukon River Basin to 0.96 in Wyoming sagebrush regions, and from 0.86 to 0.95 for sagebrush and grasslands in a portion of southern Idaho. This approach holds promise for identifying stressed ecosystems that are vulnerable to chang-ing to a new ecological state.

34 Proceedings of the Second All-USGS Modeling Conference, February 11-14, 2008
An Integrated Modeling Approach for Analyzing fhe Effects of an Expanding Biomass-for-Biofuel Economy in the Northern Great Plains (Oral Presentation)
By Terry L. Sohl1 and Kristi L. Sayler2
1Science Applications International Corporation, Sioux Falls, S. Dak.2U.S. Geological Survey, Sioux Falls, S. Dak.
An understanding of potential future scenarios of land-use and land-cover change is essential to anticipate impacts on regional carbon dynamics, climate change, hydrology, and bio-diversity. The Forecasting Scenarios of change (FORE-SCE) model was developed to create high-resolution projections of land cover under multiple scenarios for large geographic regions. FORE-SCE applies a combination of theoretical, statistical, and deterministic modeling techniques to forecast plausible landscapes. Historical information on land-cover change is used to parameterize key components of the model. This information is obtained from ecoregional data on past rates, thematic categories, and spatial characteristics of change provided by the U.S. Geological Survey Land Cover Trends project.
Results from initial applications of FORE-SCE support analyses led by cooperator Roger Pielke, Sr., University of Colorado, to assess the effects of change on regional weather and climate variability. We have provided Dr. Pielke with maps for three scenarios of land-cover change for the western Plains (modeling period 1992 to 2020), two scenarios for the southeastern United States (1992 to 2050), and one scenario for the northeastern United States (1992 to 2050).
Research in FY2008 will focus on higher resolution applications covering four ecoregions in the northern Great Plains. This work will address the effects of an expanded agri-cultural base for biofuels and concurrent changes in climate on ecosystem sustainability. We will project alternative land-scapes at annual time steps through 2050, analyzing the results to estimate effects on ecosystem processes and services. We will incorporate socioeconomic drivers, such as national policy and programs, commodity prices, and biofuel demand, to develop multiple scenarios that variously emphasize the production of corn, soybeans, switchgrass, and mixed prairie species for biofuel conversion. FORE-SCE will be integrated with the General Ensemble Biogeochemical Modeling System (GEMS) model and the Better Assessment Science Integrating Point and Nonpoint Sources (BASINS) model to incorporate environmental feedbacks into the forecasting process. For each change scenario, we will assess environmental quality and sustainability based on levels of estimated carbon stocks, greenhouse gas emissions, sediment and nutrient loadings to water bodies, wildlife habitat availability, agricultural profit-ability, and energy costs and benefits.
Modeling Standardized, Meso-Scale Ecosystem Distributions for the United States and the Planet (Oral Presentation)
By Roger G. Sayre1
1U.S. Geological Survey, Reston, Va.
A variety of applications ranging from biodiversity conservation to economic valuation of ecosystem goods and services require spatially explicit maps of the distribution of ecosystem occurrences. Ecosystems exist at multiple scales and can be described and geospatially delineated at sizes rang-ing from a grain of soil to the entire Earth. While macro-scale (thousands to tens of thousands of hectares) ecosystems have been mapped for the Nation and the planet in a number of different ecoregional classifications, standardized ecosystem maps at finer scales are not yet available for the entire United States (Bailey, 1998; Olson et al., 2001). A new geospatial model has been developed to map standardized meso-scale (tens to thousands of hectares) ecosystems as unique abiotic environments and their associated land cover. The model combines national datalayers for land surface form, lithology, isobioclimate regions, and land cover in a geospatial union that produces unique ecosystem occurrences, or footprints, at management-appropriate scales.
This geospatial model has been prototyped for South America and is currently being implemented for the United States (Sayre et al., in press). The model is also being used for a U.S. Geological Survey-led standardized global ecosystem mapping under the Global Earth Observation System of Systems (GEOSS) intergovernmental protocol. The South America ecosystem modeling effort produced new continent-wide datalayers for elevation, landforms, lithology, climate regions, and land cover as inputs to the model, as well as a new meso-scale ecosystems map for the continent. The U.S. ecosystems modeling effort has produced new, contigu-ous U.S. datalayers for landforms, surficial materials lithology, and isobioclimates, which are now being combined with the recently released National Land Cover Database to produce standardized, robust, meso-scale ecosystem footprints for the Nation.

Proceedings of the Second All-USGS Modeling Conference, February 11-14, 2008 35
Utilizing Structural Equation Modeling Techniques to Model Watershed Structure and Land Use Effects on Stream Geochemistry and Ecological Responses (Oral Presentation)
By Travis S. Schmidt1, Richard B. Wanty1, Stanley E. Church1, Carma San Juan1, William H. Clements2, David Fey1, Philip L. Verplank1, James G. Crock1, Monique Adams1, and Michael W. Anthony1
1U.S. Geological Survey, Denver, Colo.2Colorado State University, Fort Collins, Colo.
Watersheds are complex systems composed of terrestrial and aquatic components that function together to determine local stream geochemistry and aquatic communities. Variance in geochemistry and aquatic community composition are influ-enced by both terrestrial landscape and longitudinal aquatic gradients. Most studies that investigate the linkages between aquatic and terrestrial interfaces do so by means of correlation. However, this approach does not fit the prevailing paradigm to which most watershed scientists subscribe: that watersheds are complex hierarchical systems. One of the primary objectives of the Central Colorado Assessment Project (U.S. Geological Survey Mineral Resources Program) is to assess the effects of catchment lithology on aquatic resources. To better describe the phenomena observed in this watershed assessment, we employed structural equation modeling (SEM) techniques. SEM relies upon a hypothesis developed from theory and expert knowledge expressed in the form of a conceptual diagram. This hypothesis is evaluated by determining to what degree it is supported by the empirical data. The advantage is that much thought is required before statistical analysis is done, which minimizes the risk of obtaining spurious results. SEM realistically models watershed interactions by including both direct and indirect interactions among model variables (for example, rock-type, aquatic communities). Correlation and covariances are explicitly accounted for, which minimizes the problem of colinearity among descriptors. SEM also allows for the inclusion of multiple descriptors of rock-type, which were necessary to describe terrestrial and aquatic com-munity responses. Results of this statistical evaluation were depicted as conceptual diagrams that could be easily under-stood by nontechnical resource managers. These advantages over traditional statistical models make SEM an alternative for ecosystem scientists who conduct observational field studies.
Landscape Evapotranspiration Estimation Using a Simplified Surface Energy Balance Approach for Watershed Water-Balance Modeling (Poster)
By Gabriel B. Senay1, Michael E. Budde1, and James P. Verdin1
1U.S. Geological Survey, Sioux Falls, S. Dak.
Large-scale regional water balance modeling is important for various hydrologic and environmental studies. Evapo-transpiration (ET) is a key component of the water balance equation. Regional-scale ET estimates can be made at various levels of complexity and accuracy, involving point-based field measurements and spatial modeling. We present the applica-tion of a simplified surface-energy balance (SSEB) approach for estimating landscape ET. These estimates are then used to compute watershed discharge using a water balance modeling approach that operates on a monthly timescale. Landscape ET was calculated at 1-kilometer (km) resolution using the SSEB model that integrates 8-day ET fractions and reference ET. The daily reference ET is computed from the Global Data Assimi-lation System (GDAS) dataset using the standardized Penman-Monteith equation at the U.S. Geological Survey (USGS) Center for Earth Resources Observation and Science (EROS). Eight-day ET fractions are derived at 1-km resolution from the Moderate Resolution Imaging Spectroradiometer (MODIS) land surface temperature (LST) dataset using a relative surface temperature difference with respect to the “hot” and “cold” pixels in each 8-day composite image. Watershed boundaries generated from the HYDRO1k dataset were used to determine watershed area. The study used gridded (5-km) daily rainfall data from the National Weather Service (NWS). The data is a blend of Next-Generation Radar (NEXRAD) and station rain gage data. Stream discharge data from the USGS will be used to evaluate and validate the discharge estimate from the watershed water balance model. The study is conducted over the Missouri River basin using 2006 data for the time period between April and October. The contribution of ground water toward the total watershed ET was estimated using irrigation maps and forest cover classes. ET estimates from the SSEB model captured both the spatial and temporal variability of ET within the watershed. Future efforts will include evaluat-ing discharge estimates from the water balance model against observed measurements. The model will also be evaluated by using multiple years of data at different spatial and temporal scales. The approach has a potential application for integrat-ing remotely derived estimates of ET for operational water balance modeling. Such modeling would provide the ability to monitor the availability of water for different uses as well as the onset and progress of drought at a watershed scale.

36 Proceedings of the Second All-USGS Modeling Conference, February 11-14, 2008
Community Sediment-Transport Modeling Project (Poster)
By Christopher R. Sherwood1, W. Rockwell Geyer2, John C. Warner1, Richard P. Signell1, and Bradford Butman1
1U.S. Geological Survey, Woods Hole, Mass.2Woods Hole Oceanographic Institution, Woods Hole, Mass.
The U.S. Geological Survey, Woods Hole Oceanographic Institution, and more than one dozen partner institutions have been funded by the National Oceanographic Partnership Program to develop a coastal ocean sediment-transport model. The Community Sediment-Transport Modeling (CSTM) project is entering its second year and has released an open-source model based on the Regional Oceanographic Model-ing System (ROMS). The model is interdisciplinary and is coupled with models for atmospheric forcing, waves, sea ice, and plankton ecology. The CSTM is intended for research and to help solve practical problems. Researchers are currently using the model to study the fate of sediment in coastal and estuarine environments, and we anticipate that the model will become a tool for addressing practical problems involving coastal geologic hazards (flooding and coastal erosion associ-ated with storms and sea-level rise) and hazards to the natural resources and ecosystems, including coastal pollution and habitat change. The model was developed using a community approach: open-source tools for source-code version con-trol and web-based issue tracking, and documentation. This poster provides an overview of the CSTM project, an update on the model capabilities, and information on the community development tools used to build the model. More information is available at http://www.cstms.org/.
A Spatially Explicit Stage-Based Population Model of American Alligators in Support of Everglades Restoration (Poster)
By Daniel H. Slone1 and Kenneth G. Rice1
1U.S. Geological Survey, Gainesville, Fla.
The Comprehensive Everglades Restoration Plan (CERP), which is available at http://www.evergladesplan.org, requires ecological models to assist in the evaluation of resto-ration project alternatives, formation of restoration targets, andevaluation of restoration success. The American alligator is a keystone predator in the Florida Everglades that is dependent on the success of water flow restoration efforts and is indica-tive of the restoration’s effect upon other species. Historically,
alligators were more abundant in prairie habitats of the eastern floodplain than in deep-water central sloughs. They are now concentrated in the deep central sloughs and canals, with relatively few individuals residing in the edge habitats because of the extremely short hydroperiod under managed conditions. The alligator model described in this poster supports the CERP by predicting alligator population densities and dynamics over time from hydrologic model output of historical, current, or projected flows from restoration alternatives. The alligator model is especially useful for identifying spatial differences among several alternatives. Using historical hydrologic data and baseline hydrology models, we compared the modeled population density to historical counts of alligators conducted along airboat trails at night with a spotlight. We also compared simulation results of alligator nesting to nesting site surveys and a body condition index in the model to body condition data collected from the region. Validation results from diverse locations throughout their range and implications for restora-tion and management decisions are discussed.
The Delta Research and Global Observation Network (Oral Presentation)
By Gregory J. Smith1
1U.S. Geological Survey, Lafayette, La.
The U.S. Geological Survey National Wetlands Research Center (NWRC) has initiated an effort to understand biologi-cal, geologic, and hydrologic processes and management outcomes for massive deltaic coastal systems like that of the Mississippi River Delta. The Delta Research and Global Observation Network (DRAGON) is a science framework initiated to establish an international community of practice, to develop new visualization tools and applications, and to com-pare and predict outcomes of various management scenarios.
Hurricanes Katrina and Rita have prompted the assess-ment, design, and new construction of flood and hurricane protection systems in the Mississippi River Delta. Now, more than ever, there is a critical need to share information and data from deltas around the world and to develop models that guide and inform decisions, management, and policy related to deltas and large river systems.
Massive public works engineering projects have been constructed in many large deltas around the world for flood protection, storm protection, navigation, and energy extrac-tion. These projects can change physical and biological processes that ultimately affect aquatic habitats, migratory bird habitats, wetlands, coastal ecosystems, and nutrient dynamics. Comparative studies with other large deltas can be a useful tool for understanding and predicting the effects of major engineering projects, land use change, hydrological change, and other anthropogenic impacts in these sensitive ecosystems.

Proceedings of the Second All-USGS Modeling Conference, February 11-14, 2008 37
The goal of the web-based DRAGON is to facilitate data and information sharing and predictive model development. The keystone of the network is the community of practice concept, which is envisioned as a framework that will build an association of researchers focusing on deltaic systems. The network will benefit the international community by providing tools for data integration and modeling, such as an extensive digital library focusing on 12 globally important deltas, a map viewer, a data repository, and a database of scientists involved in delta-related research to stimulate collaboration and infor-mation sharing. It will also provide a watershed comparison tool to identify deltas facing similar environmental challenges and to understand the intended and unintended results of man-agement decisions implemented in deltaic systems.
The community of practice concept is also applicable to scientists working along the Mississippi River. With monitor-ing and research activities occurring along the length of the Mississippi, there is a need to unify and integrate data analysis and dissemination across such systems as the Coastwide Ref-erence Monitoring System (CRMS) in southern Louisiana and the Long Term Resource Monitoring Program (LTRMP) in the upper Mississippi River. These long-term monitoring pro-grams have enormous amounts of data that, given the proper tools and approaches, scientists could use to model complex systems, such as the entire Mississippi River.
Integrating Hydrology and Individual-Based Models: Issues and General Approaches to Simulating Animal Movement Using Artificial Intelligence and Navigation Theory (Poster)
By Brad Stith 1
1U.S. Geological Survey/ASci, Gainesville, Fl.
The integration of regional-scale hydrologic and individ-ual-based species models provides a powerful framework for examining the response of organisms to complex temporal and spatial processes, including restoration activities, hurricanes, and climate change. Simulating animal movement in response to landscape level processes is a general problem faced by many spatially explicit models. Such diverse fields as artificial intelligence and navigation theory are transferable to eco-system modeling and are very helpful for simulating animal behavior and movement.
We present a general approach to modeling species with varying capabilities for learning, navigating, and responding to a changing environment. Many vertebrate species show simi-lar movement patterns that lead to the establishment of home ranges, which shift in response to changing environmental conditions. To simulate such movement behavior in a general modeling framework, we developed “intelligent agents” that
have long-term memories, learning abilities, and navigational skills. These intelligent agents perceive the simulated environ-ment, learn, and respond to changing conditions. Different types of organisms can be simulated by modifying the learning or navigating capabilities of the intelligent agents. We illus-trate some of these basic principles of animal movement and behavior using difficult-to-acquire telemetry data from tagged manatees. These and other data suggest that manatee behavior shows a high level of intelligence and a predictable response to water temperature and salinity.
We used the intelligent agent paradigm to develop an individual-based manatee model that is integrated with the Tides and Inflows in the Mangroves of the Everglades (TIME) model, a U.S. Geology Survey (USGS) hydrology model. This integration of models allows us to investigate how manatees in the Florida Everglades and Ten Thousand Islands may respond to ecosystem-level changes associated with hydrologic restora-tion. Collaboration between USGS biologists and hydrologists resulted in the identification of key output parameters from the hydrology model needed to adequately represent hydrologic factors important to such estuarine species as the manatee. An identified need to simulate water temperature led to the development of a new heat-transport module for the hydrology model. Actual linkage between the hydrology and individual-based model is made via a database of output hydrologic val-ues input to the individual-based model at specific time inter-vals and locations. To validate the individual-based model, we are comparing model output against field data from aerial survey “snapshots.” The data requirements for this integrated modeling study are enormous, but the hydrology model is transferable to other areas and is already being used for other species in South Florida. The individual-based model is likely to be adaptable to other species or localities as well.
Modeling the Historical Influence of Soil and Water Management on Sediment and Carbon Budgets in the United States (Oral Presentation)
By Eric T. Sundquist1, Kate Ackerman1, Robert F. Stallard2, and Norman B. Bliss3
1U.S. Geological Survey, Woods Hole, Mass.2U.S. Geological Survey, Boulder, Colo.3Science Applications International Corporation, Sioux Falls, S. Dak.
The documented history of U.S. soil and water manage-ment provides a unique opportunity to examine soil and sedi-ment carbon storage under conditions of changing manage-ment practices. Historical acceleration of erosion owing to cultivation has been moderated by improved soil management. Increased construction of dams and locks has expanded areas of aquatic sedimentation in reservoirs and ponds. Enhanced

38 Proceedings of the Second All-USGS Modeling Conference, February 11-14, 2008
historical sediment deposition rates have been documented in lakes and estuaries. All these changes have had an impact on terrestrial carbon storage and turnover. The present-day carbon budget associated with erosion and burial cannot be deter-mined without quantifying the time-dependent changes caused by past and present soil and water management.
We use existing datasets with geographic information system and modeling techniques to estimate sediment and carbon budget trends since the year 1700 in the conterminous United States. We begin by calculating historical sediment budget scenarios representing effects of soil- and water-management practices. We derive soil erosion estimates for recent decades from the U.S. National Resources Inventory (NRI). Using estimates of historical cropland erosion yields (erosion rates per unit area) and cropland areas and distribu-tions (derived from U.S. census data), we calculate simplistic “hindcast” erosion scenarios for the years prior to the NRI estimates. We use sedimentation rates compiled in the U.S. Reservoir Sedimentation Survey Information System. Sys-tematic relationships among these rates are applied to estimate historical sedimentation for the more-extensive U.S. National Inventory of Dams, and for lakes and ponds. Because our anal-ysis uses a combination of diverse existing datasets, we devote particular attention to methods of data integration that are consistent with the statistical character of the source data. Our analysis indicates that historical export of sediments to coastal areas is relatively insignificant, whereas substantial sediment deposition in upland areas is necessary to balance the histori-cal sediment budget. Relatively recent rates of sedimentation in lakes and impoundments appear to match or exceed rates of upland erosion, suggesting that only a fraction of recent sediment transport is derived from channel and bank erosion, including remobilization of historically deposited alluvium and colluvium.
For each historical sediment budget scenario, we apply models of carbon dynamics to time-dependent accounting of carbon in erosional and depositional environments. Our carbon calculations begin with estimates of the carbon content of soils at erosional and depositional sites based on the NRI soil data-base. Rates of soil carbon production, erosion, degradation, transport, and burial are constrained by both sediment and carbon mass-balance coupled to representations of landscape soil-carbon dynamics. Carbon burial in aquatic environments is calculated from estimates of composition and deposition rates of autochthonous and allochthonous sediment. We find that cumulative amounts of carbon translocated by historical erosion and deposition are comparable to amounts of cumula-tive soil carbon depletion estimated in previous studies that have not considered erosion and deposition.
Our historical sediment budget scenarios imply a large historical transient of eroded and redeposited terrestrial sediments. An improved understanding of non-steady-state carbon dynamics in these sediments and in eroding croplands is needed to estimate the net effect of erosion and deposition on the historical and present-day exchange of carbon between the land and the atmosphere. The transient sediment pulse and
accompanying biogeochemical and ecological responses have broader implications for management of water and ecosystems (for example, to address effects of sedimentation and nitrogen loading on riparian zones and wetlands). Continuing inves-tigation of these important topics will require more robust collaboration across disciplines and institutions.
Applications of the FTLOADDS Coupled Code and Linkages to Hydrologic and Ecological Models (Oral Presentation)
By Eric D. Swain1 and Melinda Lohmann1
1U.S. Geological Survey, Ft. Lauderdale, Fla.
To represent the complex hydrology of South Florida with its highly connected surface water and ground water, very low gradients, and dynamic coastal interfaces, the Flow and Transport in a Linked Overland/Aquifer Density-Dependent System (FTLOADDS) code was created. FTLOADDS combines the Surface Water Integrated Flow and Transport in 2 Dimensions (SWIFT2D) model and computer pro-gram for three-dimensional ground-water flow (SEAWAT) with multiple improvements in both the surface-water and ground-water representations. Numerous field studies were implemented to support hydrologic model development. Subsequent FTLOADDS applications use improved meth-ods of representing evapotranspiration, frictional resistance, barriers to flow, and heat transport. The code has been recently updated to make it applicable to most coastal estuarine areas. The following discussion illustrates a number of completed, ongoing, and planned linkages of FTLOADDS to other hydrologic and ecological models.
A comprehensive model is planned that utilizes two local-scale models previously developed with the FTLOADDS code—the established Tides and Inflows in the Mangroves of the Everglades (TIME) model application of the southern Everglades, and the Biscayne Bay model, which encompasses Biscayne National Park and most of Miami-Dade County. Combining these into a large sub-regional model will give an integrated comprehensive assessment of how different Comprehensive Everglades Restoration Program (CERP) scenarios will affect surface-water coastal discharge and stage, ground-water flow, and salinity in Everglades National Park and Biscayne National Park. Once the sub-regional model is calibrated, additional simulations will be performed to estimate predevelopment hydrologic conditions and predict hydrologic conditions under proposed restoration alternatives. These simulations include linkage with the South Florida Water Management District’s Natural Systems Model (NSM) and the South Florida Water Management Model (SFWMM). Because FTLOADDS simulates water levels and salinities, it can also be used to run simulations that can predict the poten-tial impacts of sea-level rise.

Proceedings of the Second All-USGS Modeling Conference, February 11-14, 2008 39
One purpose of developing such a complex model application is to provide necessary hydrologic information to develop predictive ecological models. The challenge is to pass the relevant information to ecological models in a configuration that yields a realistic response. This involves the complex issues of spatial and temporal averaging, cor-relating topographic features between the hydrologic and ecological models, and determining output uncertainty. The hydrologic model outputs a number of variables that are significant to the ecological models. Water depth and flow are the primary output of the FTLOADDS surface-water simula-tion, but transport components, such as salinity, temperature, and nutrients, may be required to link to ecological models. The TIME/Biscayne application simulates salinity transport needed for Across Trophic Levels System Simulation (ATLSS) fish, wading bird, crocodile, and alligator models. One ATLSS model, ALFISHES, uses gridded daily depth and salinity data from FTLOADDS to simulate fish population dynamics. FTLOADDS was modified to simulate heat transport and thus supplies temperature and salinity data along known manatee migration pathways to an individual-based manatee model for the Ten Thousand Islands area. Along with the TIME/Biscayne regional model, the FTLOADDS application to the Ten Thou-sand Islands area allows the entire southern coast of Florida to be covered.
Future development of FTLOADDS and its applications to linked hydrologic and ecological models will involve incor-porating nutrient-transport capabilities for phosphorous and nitrogen modeling. Hydrologic effects on invasive species, oyster beds, sharks, and other biota can be determined and the effects of regional restoration scenarios can be simulated. Linking hydrologic and ecological models provides an essen-tial set of tools that can be used to assess ecological restoration efforts in South Florida and elsewhere.
Ecosystem Carbon Budgets and Crop Yields in a Tropical Savanna Ecosystem as Related to Changes in Climate and Management (Poster)
By Zhengxi Tan1, Larry L. Tieszen2, and Emmanuel Tachie-Obeng3
1Science Applications International Corporation, Sioux Falls, S. Dak.2U.S. Geological Survey, Sioux Falls, S. Dak. 3Environmental Protection Agency, Accra, Ghana
The tropical savanna in West Africa is a critical ecosys-tem that provides products for people and livestock. It is, how-ever, vulnerable to land disturbances and sensitive to climate change. We selected the Bawku savanna ecoregion in northern Ghana to simulate the responses of both natural and managed ecosystems to climate change and management scenarios
using General Ensemble Biogeochemical Modeling System (GEMS), a biogeochemical model. Our results from this study show that the conversion of forest to agricultural use resulted in a substantial reduction in ecosystem carbon stocks across this ecoregion during the past century. Climate changes would lead to a continuous decline in soil carbon stock of the entire ecoregion through the 21st century; however, this result could be offset by increasing nitrogen fertilization of the cultivated lands. An increase in nitrogen fertilization could also signifi-cantly increase grain yields of all crops, except groundnut. The biomass production and soil carbon stocks within woodlands would depend heavily on cutting options and little on climate change. The model simulation results are fairly comparable with the field observations.
Seeing the Forest Fire Through the Trees: Integrating Multiple Data Streams to Model the Presettlement Fire Regime in the Longleaf Pine Ecosystem (Poster)
By Adam Terando1 and Alexa McKerrow1
1Southeast Gap Analysis Program, Raleigh, N.C.
Fire regimes are dependent on the local abiotic and biotic factors that regulate the probability and frequency of fire ignition and spread. Anthropogenic influences on these fire regimes, such as fire suppression or global warming, can be large and variable through time. Anthropogenic influences may even mask or decouple drivers of an area’s historical fire regime that developed through unique ecological, geologic, and climatic circumstances. For example, in the southeastern United States, prior to large-scale fire suppression efforts, the longleaf pine (Pinus palustris) ecosystem was charac-terized by high-frequency, low-intensity fires that impeded woody vegetation encroachment, replenished soil nutrients, and facilitated seed germination and growth. Understanding how abiotic and biotic (absent anthropogenic) factors influ-ence the intra- and inter-annual variability of the fire season is thus a critical step in gaging how current fire regimes differ from presuppression conditions or what could be expected given some scenario in the future (for example, anthropogenic climate change). To better understand the influences that affect fire in longleaf pine systems, we present a hierarchical spatio-temporal model depicting the pre-European settlement fire season across the entire known range of longleaf pine. Our model predicts presettlement fire ignition probabilities by modifying the U.S. Forest Service’s Fire Potential Index (FPI). Modified FPI values were calculated as a function of presettle-ment Normalized Difference Vegetation Index (NDVI) values and daily meteorological conditions to estimate live and dead fuel moistures. The pre-settlement NDVI values were

40 Proceedings of the Second All-USGS Modeling Conference, February 11-14, 2008
estimated by using point sample data from known healthy longleaf pine stands and meteorological data at those sites. Multimodel inference was used to evaluate the contribution of the local climate to the seasonal NDVI values. The coupling of climate and fire season within our model will allow for a better estimation of the impacts of past, present, and future anthropogenic effects on the amplitude, duration, and vari-ability of the fire season in this ecosystem. The study is an example of a successful integration of data at multiple scales from multiple agencies and research institutions into a model that is highly transferable and robust to alternative conditions and environments.
Predictive Models of Suitable Habitat for the Mojave Desert Tortoise: “Truthiness” in Pseudo-Absence (Poster)
By Kathryn A. Thomas1, Leila Gass1, Todd Esque2, and Ken Nussear2
1U.S. Geological Survey, Tucson, Ariz.2U.S. Geological Survey, Henderson, Nev.
Our team developed and assessed predictive models of suitable habitat for the Federally threatened Mojave popula-tion of the desert tortoise. In the development of these models, we made decisions regarding which modeling algorithms to use, how to parameterize the algorithms, which input data to select, and what methods to use to assess the resulting model output. While we had a robust sampling for tortoise presence data, we lacked input data of locations of tortoise absence and struggled with methods for creating data to represent absence locations. There are four modeling stages for which absence data are a consideration: (1) model building, (2) assessment of continuous model output, (3) determination of a threshold to convert continuous output to binary, and (4) accuracy assess-ment of the binary output. A general method to deal with the lack of absence data in modeling is to develop an artificial set of absence locations or “pseudo-absence” data. We developed pseudo-absence data using two methods: the random back-ground method and the Ecological Niche Factor Analysis (ENFA)-constrained method. While only one of the three modeling algorithms we applied required the use of pseudo-absence data in model building, the output of all three models required pseudo-absence data to assess the continuous output, develop a binary representation of the output, and assess the binary output. We found that by comparing the assessment metrics derived with the random background and with the ENFA pseudo-absence data, we improved our understanding of the types of potential errors, both of commission and omis-sion, in model output. Our approach and results illustrate that choices regarding structure and use of pseudo-absence data are
nontrivial. In addition, our methods allowed us to represent degrees of uncertainty in the prediction of suitable habitat graphically. This approach to model assessment also facilitates interpretation of model output by such users as the Desert Tortoise Science Advisory Committee.
A Knowledge Management Approach for Complex Regional Ecosystem Modeling (Poster)
By Alicia Torregrosa1, Danielle Aiello1, and Andrea Woodward2
1U.S. Geological Survey, Menlo Park, Calif.2U.S. Geological Survey, Seattle, Wash.
The Puget Sound Integrated Landscape Monitoring Pilot is approaching the complex task of integrating the human dimension as a component of the landscape-level ecosystem dynamics by using an innovative knowledge management sys-tem to conceptualize the interactions between various parts of the greater Puget Sound ecosystem. The knowledge manage-ment system software “Personal Brain” has been implemented to develop conceptual models of both human social systems and ecosystem processes. The framework that has been devel-oped is providing insights into the linkages and relationships between ecosystem processes at different scales and human-initiated programs to address and repair ecosystem damage. This session will provide a hands-on opportunity to investigate the computer-based system.
Linking Plots to Landscapes: A Synthetic Framework for Monitoring Change in the Great Basin Ecosystem (Oral Presentation)
By Alicia Torregrosa1, Andrea Woodward2, David Miller1, Marie Denn3, David Bedford1, Pierre D. Glynn4, and Sean Finn5
1U.S. Geological Survey, Menlo Park, Calif.2U.S. Geological Survey, Seattle, Wash.3U.S. National Park Service4U.S. Geological Survey, Reston, Va.5U.S. Geological Survey, Boise, Idaho
Questions asked by decisionmakers and policymak-ers are rarely answered at the same scale as the observations required to answer them. There is a growing recognition that ecosystem stressors and drivers accumulate across landscapes,
Proceedings of the Second All-USGS Modeling Conference, February 11-14, 2008 41
yet monitoring data collected by land management agencies are often limited to site-specific local plots. There is an urgent need to scale between plots and landscapes. The model we have developed integrates concepts from landscape ecology, ecosystem ecology, geostatistics, and geographic informa-tion science. The methodology shows the spatio-temporal linkages between subsystems, such as riparian, sagebrush steppe, pinyon-juniper, ground water, and springs, by using a hierarchical cross-scale approach. Ongoing work includes implementing the model as a spatially explicit framework to quantify the cumulative effects that are important to natural resource managers in the Great Basin.
Credibility and Acceptability of Land Use Planning Approaches: A Case Study in the Coastal Area of the Mekong Delta, Vietnam (Poster)
By Nguyen Hieu Trung1, Le Quang Tri1, M. E.F. van Mensvoort2, and A. K. Bregt2
1Can Tho University, Cantho City, Vietnam 2Wageningen University, The Netherlands
This poster compares three land use planning (LUP) approaches in the coastal areas of Bac Lieu Province, Mekong Delta, Vietnam. The selected LUP approaches represent three levels of complexity in land resources study, ranging from empirical and qualitative to mechanistic and quantitative. The three approaches are: (1) participatory LUP (PLUP), which takes into account the local people’s perception of land utilization; (2) guidelines for land use planning by the Food and Agriculture Organization of the United Nations (FAO) enhanced with multicriteria evaluation (FAO-MCE), and (3) the land use planning and analysis system (LUPAS), which uses interactive multiple-goal linear programming. By using the same planning goal and applying the three approaches in the same study area and at the same planning period, we were able to compare the pros and cons of these LUP approaches in terms of time, money, equipment, and human resource require-ments and genetic applicability and whether the approaches were acceptable in terms of their credibility, accuracy, and benefit to stakeholders.
MapInfo was used for spatial analysis, multicriteria evaluation, and mapping of the model’s results. GAMS (which was developed by GAMS Development Corporation) was used to build the interactive multiple-goal linear programming model. The approaches were applied at the village level (about 10,000 hectares). The land use in the study area is diverse, quickly shifting, and strongly contrasting. The contrast is not only in terms of resource use (for example, shrimp, mangrove forest or salt that demand brackish water, as opposed to rice or vegetables that require fresh water), but is also in terms of
social economic sustainability and profitability. Shrimp culti-vation, for instance, brings a very high income compared with rice production but it is not a very stable industry because of risks, such as shrimp diseases and water pollution.
The FRAME (Framing Research in Support of the Adaptive Management of Ecosystems) Project: A Collaborative Modeling Approach to Natural Resource Management (Oral Presentation)
By Christine E. Turner1, Jim Chew2, George Leavesley1, and George San Miguel3
1U.S. Geological Survey, Denver, Colo.2U.S. Forest Service, Missoula, Mt.3U.S. National Park Service, Mesa Verde, Colo.
Federal land managers are currently under siege. They are challenged to make science-based decisions and to optimize the management of multiple resources while minimizing nega-tive impacts of any given decision—all while under increased public scrutiny. Thus, there is considerable need for an adap-tive management framework that will accommodate changing conditions and meet multiple objectives. Through the interdis-ciplinary USGS Framing Research in Support of the Adap-tive Management of Ecosystems (FRAME) project, which includes partners from other agencies (including the National Park Service, Bureau of Land Management, Bureau of Indian Affairs , and U.S. Forest Service) and universities, our strategy is to couple the adaptive capabilities of an integrated model-ing approach with accepted principles of collaboration. Initial efforts within the project focused on natural resource and fire-management issues at Mesa Verde National Park (MVNP) in Colorado, where prolonged drought in the Western Interior is dramatically affecting vegetation patterns and the fire regime.
The knowledge to model a complex natural system is dis-tributed among resource managers, diverse scientific experts, and physical-process modelers. In our study, the scientists involved included hydrologists, ecologists, and experts in pinyon-juniper woodlands and cheatgrass. The distributed knowledge was elicited through the collective learning that is characteristic of collaborative problem-solving environments when all participants are continuously and actively engaged. The scientists brought their diverse expertise to the discussion, and modelers provided the means to capture this expertise in numerical models. The resource manager contributed knowl-edge of the ecosystem and also helped maintain the focus on the decision context so that pertinent science, not just “sound” science, was brought to bear on the resource management issues. Framing the science issues collaboratively not only

42 Proceedings of the Second All-USGS Modeling Conference, February 11-14, 2008
ensured that the pertinent science was brought to bear, but also promoted the interdisciplinary science approach necessary to address resource management needs.
The USGS’s Modular Modeling System (MMS), which can be accessed online at http://www.brr.cr.usgs.gov/mms, offers an ideal framework to facilitate the integration and link-ing of process models and the execution of them in a coupled manner. The framework also facilitates adaptive management approaches where alternative scenarios and model combina-tions can be applied and refined iteratively with new scientific understanding and observations from monitoring results. In our efforts, the principle models initially used are the Precipi-tation Runoff Modeling System (PRMS), and the Simulating Patterns and Processes at Landscape Scales (SIMPPLLE) landscape model. We also incorporated results from an empiri-cal sedimentation model related to post-fire runoff and ero-sion. Efforts are currently underway to downscale climate data for the modeling effort. Populating a model’s structure with both numerical values and logic relationships and then validat-ing its performance involved a process of iterative interaction with modelers working collaboratively with the scientists and resource managers.
The adaptability of the collaborative modeling approach is key. For example, during the course of the project, ongo-ing field studies by FRAME biologists revealed that the rapid spread of cheatgrass (Bromus tectorum) in the park posed an increasing threat with respect to fire frequency and spread. In collaboration with all project participants, a group con-sensus emerged: We decided that the spread of cheatgrass had become a priority because it significantly altered the fire regime and thus posed an increased threat to the pinyon-juni-per ecosystem.
A conceptual model developed by one of the project scientists served as the basis for incorporating the interactions of cheatgrass and its effect on the ecosystem into SIMPPLLE. The decision of the group to focus modeling efforts on the potential threat of cheatgrass to the ecosystem dynamics at MVNP illustrates the adaptive nature of the collaborative modeling approach. In resource management, it is typical for priorities to shift with time. The collaborative modeling approach is designed to accommodate these shifts.
The FRAME case study at MVNP is providing an oppor-tunity to implement and refine the principles and components of a collaborative modeling approach. By coupling the prin-ciples of collaboration with integrated modeling approaches, we are developing a transportable collaborative modeling framework to facilitate adaptive, multiobjective resource management that is applicable across a wide range of ecosys-tems. Recent trends in natural resource management—toward integrated science approaches, comanagement of public lands, adaptive management in the face of uncertainty, and public engagement in land use decisionmaking—are trends that developed in response to a greater appreciation of the inherent complexity, feedback mechanisms, and uncertainty in natural systems, plus increased public scrutiny of deci-sions on public lands. The FRAME collaborative modeling
approach was developed to address the challenges faced by natural resource management and provides a way to effec-tively link integrated science to natural resource management needs. Our initial effort in MVNP focused on the resource manager–modeler–scientist interactions, but the FRAME approach can also be used readily to engage the public in participatory natural resource management efforts. The future of resource management depends on the success of such col-laborative efforts.
Elements of a Global Model: An Example of Sea Level Rise and Human Populations at Risk (Oral Presentation)
By E. Lynn Usery1, Jinmu Choi2, and Michael P. Finn1
1U.S. Geological Survey, Rolla, Mo.2Mississippi State University, Miss.
Global and regional environmental models often rely on raster datasets of varying geometric and thematic properties to simulate geospatial processes and events. It usually is neces-sary to project the raster datasets to a common coordinate framework to support tabulation of statistical properties and visualizations, such as simulation and animation. Because projecting global raster datasets is subject to significant distor-tion, including pixel value gain and loss, and thus creates corresponding errors in the process or event model, effective methods of raster map projection and resampling are criti-cal to the accuracy of the models. In our research, we have developed effective raster transformation and resampling in a publicly available software package, MapImage or mapimg. We illustrate the methods using Global 30 Arc-second Elevation Data Set (GTOPO-30), land cover data (from the U.S. Geological Survey Global Land Cover Dataset), and population data (from LandScan Dataset) with 1-kilometer (km) resolution in a simulation and animation of worldwide sea-level rise. The simulation provides locations of high population densities in low-lying coastal areas that are subject to risk from sea-level rise and particularly from surges of sea water, such as from hurricanes and tsunamis. We also provide projection and resampling examples with regional simulations and animations of Maylasia and the United States using higher resolution [90-meter (m) elevation from the Shuttle Radar Topography Mission] geospatial data.

Proceedings of the Second All-USGS Modeling Conference, February 11-14, 2008 43
Modeling and Generalizing Population Pressure at the Regional Scale by Interpolating a Kriging Surface (Poster)
By Dalia E. Varanka1
1U.S. Geological Survey, Rolla, Mo.
Urbanization presently is generalized most commonly by census numbers or by impervious surface area. The purpose of this research is to expand the representation of the geographi-cal extent of urbanized areas to the degree that urbanization encompasses the environmental resources of the surrounding region that sustain cities, sometimes called the urban envi-ronmental “footprint.” The regional scale of urbanization is relevant to the integration of human population pressure on the landscape and affects change at other scales from local to global. A spatial model of generalized population pressure was interpolated using kriging of a variable combining popula-tion and wealth based on the U.S. Census Bureau data in a geographic information system. The outcome was adjusted by visualizing the interaction of urbanized activity between urban block groups and specific urban sites. The findings from the research will be organized into a conceptual model of urban-ization scale transformation. The extension of urbanization to the regional scale potentially may form the basis for integrat-ing generalized geospatial data of urbanized areas with other natural resource models and data.
Formalizing Model-Specific GIS Methodology With the GIS Weasel (Poster)
By Roland Viger1
1U.S. Geological Survey, Denver, Colo.
The U.S. Geological Survey geographic information system (GIS) Weasel is an extensive, stable interface to a GIS that facilitates execution of many of the common tasks needed to derive the geographic information used in an environmental simulation model (ESM). Despite bundling basic GIS func-tionality into methodological chunks that are more meaning-ful to modelers, the GIS Weasel still does not help new users lower the learning curve for using the GIS Weasel in their particular ESM. To allow the managers of an ESM to define and communicate their ideas in a formal way, the GIS Weasel has been designed to integrate software “plug-ins” that can be developed, published, and distributed independently of the GIS Weasel software package. Plug-ins may include writ-ten documents, data, or new software. Most plug-ins contain a configuration file that specifies the subset of GIS Weasel functionality that should be used. Regardless of the plug-in
content, this concept provides a way to formally specify how the geographic information consumed by an ESM should be prepared. This specification not only helps new users learn about an ESM and avoid inappropriate model usage but also can serve as documentation of an ESM that is much more specific than most forms of metadata.
The Integration of Environmental Simulation Models and GIS Using Metadata (Poster)
By Roland Viger1
1U.S. Geological Survey, Denver, Colo.
Geographic information systems (GIS) are powerful tools for the improved management of natural resources, notably by producing information used in environmental simulation models (ESM). The effectiveness of natural resources man-agement can be further enhanced by the improved integration of ESMs with GIS. Generic methods for carrying out such integration have been difficult to develop because ESMs fail to document or describe geographic information in a way that can be readily used in computational contexts external to the ESM. This paper will present research on the generic methods for integration of GIS services using formalized definitions of the geographic information used in ESMs. The defini-tions are specified using the geoprocessing methodologies used to derive the information. Geoprocessing methodology refers to the GIS operations performed to generate a piece of geographic information that will be used in an ESM. Defini-tions are encoded in a metadata scheme designed to improve the interoperability of an ESM with different GIS software, as well as that of the geographic information with other ESMs. This paper also presents a middleware infrastructure for handling communication between a GIS and an environmental model using this metadata. The direct result of this research is a more formalized specification of knowledge about method-ologies for the creation of geographic information used in an ESM. Further, these specifications allow for the systematic evaluation, comparison, and evolution of geographic informa-tion concepts used in modeling and, ultimately, the improve-ment of ESMs and natural resource management.

44 Proceedings of the Second All-USGS Modeling Conference, February 11-14, 2008
Processing Time-Series Data to Calibrate the GSFLOW Coupled Ground-Water/Surface-Water Model in the Trout Lake Watershed, Northern Wisconsin (Poster)
By John F. Walker1, Randy Hunt1, and John Doherty2
1U.S. Geological Survey, Middleton, Wis.2Watermark Numerical Computing, Brisbane, Queensland, Australia
A major focus of the U.S. Geological Survey’s Trout Lake Water, Energy and Biogeochemical Budgets (WEBB) project is the development of a watershed model to allow pre-dictions of hydrologic response to future conditions, including land use and climate change. Because of the highly conductive nature of the outwash sand aquifer and the topography of the watershed, stream flow is dominated by ground-water con-tributions; however, runoff does occur during intense rainfall periods and spring snowmelt. The coupled Ground-Water and Surface-Water Flow model (GSFLOW) was chosen because it could easily incorporate an existing ground-water flow model and it provides for simulation of surface-water processes.
Data collected from 1992 to 2006 in the study area include lake levels, ground-water levels, and streamflow. The frequency of data collection varies from monthly to daily; in general, the more frequent data was collected over a shorter period and during the latter portion of the period monitored. The time-series processing software (TSPROC) (Doherty, 2003) was used to distill the large time-series dataset to a smaller set of observations and summary statistics that cap-tured the salient hydrologic information. The TSPROC soft-ware was also used to process model output, thus providing equivalent comparisons of modeled and observed variables.
Calibration targets for lake and ground-water levels included the mean and range for the entire simulation period, as well as incremental differences in monthly measurements. For wells with daily water levels, the time series was first smoothed with a digital filter and then resampled at the middle of each month. Targets for streamflow included monthly volumes, comparison of points on the flow-duration curve, and total streamflow smoothed with a digital filter and then resampled at specific dates to capture the inherent variability of the observed time series. Baseflow separation was also car-ried out using a recursive digital filter to separate the quick-flow component from total streamflow; the smoothed baseflow values were resampled at specific dates to capture the seasonal variation in baseflow. The time-series processing reduced hun-dreds of thousands of observations to less than 5,000. Param-eter estimation was performed on the complete time-series dataset, as well as on the reduced set of calibration targets. The distilled set of calibration targets resulted in a more-robust calibration that effectively represented the components of the system response that are important for model prediction.
Reference Cited
Doherty, J., 2003, TSPROC— A time-series processor utility: Brisbane, Australia, Watermark Numerical Computing.
Modeling Surface-Water Sulfate Dynamics in a Northern Everglades Wetland (Poster)
By Hongqing Wang1, Michael G. Waldon2, Ehab A. Meselhe1, Jeanne C. Arceneaux1, Chunfang Chen2, and Matthew C. Harwell3
1University of Louisiana at Lafayette, Lafayette, La.2U.S. Fish and Wildlife Service, Lafayette, La.
3U.S. Fish and Wildlife Service, Vero Beach, Fla.
Sulfate contamination has been identified as a seri-ous environmental issue in the Everglades. However, it has received less attention compared with phosphorus enrich-ment. Sulfate enters the Arthur R. Marshall Loxahatchee National Wildlife Refuge (Refuge), a remnant of the historic Everglades, in pumped stormwater discharges with a mean concentration of approximately 50 mg L-1; marsh interior con-centrations at times fall below a detection limit of 0.1 mg L-1. There have been few studies of how patterns of flow and canal sulfate concentration affect sulfate concentrations and dynam-ics in the Refuge marsh. In this research, we developed a sulfate mass balance model, the Refuge Water Quality Model (RWQM), to examine the response of surface water sulfate in the Refuge to changes in sulfate loading and hydrologic pro-cesses. The Refuge was divided into four compartments along a gradient from rim canal to marsh interior: canal, perimeter marsh, transitional marsh, and interior marsh. The hydro-logic, meteorological, and water-quality data were obtained primarily from the South Florida Water Management District hydrologic online database (DBHYDRO). The RWQM is driven by a water budget model using historic inflow, outflow, and meteorological data. The RWQM was implemented using the U.S. Environmental Protection Agency’s Water Quality Analysis Simulation Program (WASP) model. Sulfate loss is modeled using a first-order apparent settling model. Apparent settling of sulfate from the marsh water column is not intended to imply an actual particulate settling process but rather is assumed to represent primarily loss by sulfate reduction. The RWQM has been calibrated and validated using long-term monitoring data (1995 to 2006). Model results show that the sulfate model is capable of capturing the spatial, inter-annual, and seasonal variations in sulfate concentrations in the Refuge. Our simulations indicate that sulfate-elevated canal water intrusion into the marsh determines the surface-water sulfate levels in the Refuge marsh areas. Our compartmental

Proceedings of the Second All-USGS Modeling Conference, February 11-14, 2008 45
hydrological and water-quality modeling approach is a useful tool for estimating sulfate reduction rates and understanding the implications of water management decisions on Refuge resources.
Variations in Pesticide Leaching Related to Land Use, Pesticide Properties, and Unsaturated Zone Thickness in an Agricultural Watershed (Poster)
By Richard Webb1
1U.S. Geological Survey, Denver, Colo.
Pesticide leaching through variably thick soils beneath agricultural fields in Morgan Creek, Md., was simulated for water years 1995 to 2004 using the Leaching Estima-tion and Chemistry Model (LEACHM). Fifteen individual models were constructed to simulate five depths and three crop rotations with associated pesticide applications. Unsatu-rated zone thickness averaged 4.7 meters (m) but reached a maximum of 18.7 m. The average annual recharge to ground water decreased from 15.9 centimeters (cm) to 11.1 cm as the unsaturated zone increased in thickness from 1 m to 10 m. These recharge estimates are at the lower end of previously published values, which indicate overestimates of surface runoff and (or) the importance of preferential flow paths not considered in the piston-flow models like LEACHM. The total amounts of applied and leached masses for five parent pesticide compounds and seven metabolites were estimated for the 32-square-kilometer (km²) Morgan Creek watershed by associating each hectare to the closest one-dimensional model analog of model depth and crop rotation scenario as determined from land use surveys. LEACHM parameters were set such that the branched, serial, first-order decay of pesti-cides and metabolites was realistically simulated. Leaching is predicted to be greatest for shallow soils and for persistent compounds with low sorptivity. Based on simulation results, percent parent compounds leached within the watershed can be described by a regression model of the form exp(-depth)(a ln(t½) - b ln(KOC)) where t½ is the degradation half-life in aerobic soils, KOC is the organic carbon normalized sorption coefficient, and a and b are fitted coefficients.
The USA National Phenology Network: Towards an Integrative Assessment of Global Change Impacts at the National Scale (Poster)
By Jake F. Weltzin1 and Mark Losleben1
1U.S. Geological Survey, Tucson, Ariz.
Phenology is the study of the timing of recurring biologi-cal phases, the causes of their timing with regard to biotic and abiotic forces, and the interrelation among phases of the same or different species. Although phenology is a far-reaching component of environmental science, it is poorly under-stood relative to other ecological patterns and processes. For example, it is unclear how climatic attributes affect the phe-nology of different organisms and how those attributes vary in importance on different spatial and temporal scales. We know that phenology affects the abundance and diversity of organ-isms and their function and interactions in the environment, especially their effects on fluxes in water, energy, and chemi-cal elements at various scales. With sufficient observations and understanding, phenology can be used as a predictor for other processes and variables of importance at local to global scales, and phenology could drive a variety of ecological forecast models with both scientific and practical applications.
The USA National Phenology Network (NPN) (which is accessible at http://www.usanpn.org) is a new enterprise—a national network of integrated phenological observations essential to evaluate ongoing environmental changes. The NPN will be integrated with other observation networks, including regional phenology networks, remote sensing products, emerging technologies, and data management capabilities, and will capitalize on myriad educational opportunities and a new readiness of the public to par-ticipate in investigations of nature on a national scale. This poster illustrates how phenology is an emerging integra-tive science for assessing impacts of global change, and for increasing citizen awareness and participation in understand-ing environmental impacts of human activities. Further, the poster highlights the need to develop tools, protocols, and models for the scaling of phenological data, from embed-ded sensors (for example, on an individual or in a particular habitat) to individuals, to patches and landscapes, to regions and the globe.

46 Proceedings of the Second All-USGS Modeling Conference, February 11-14, 2008
Application of Bayesian Hierarchical and Information Theoretic Approaches in Model-Facilitated Recovery of Endangered Fish Populations Based on Behavior and Physiology as Part of an Individual-Based Spatially Explicit Model (Poster)
By Mark L. Wildhaber1, Thomas W. Bonnot2, Ali Arab3, Scott H. Holan1, Joshua J. Millspaugh1, Christopher K. Wikle1, and Ginger M. Davis4
1U.S. Geological Survey, Columbia, Mo.2University of Missouri, Columbia, Mo.3Georgetown University, Washington, D.C.4University of Virginia, Charlottesville, Va.
Endangered fish species recovery efforts require detailed understanding of the life history of the species, the environ-ments in which it lives, and the aquatic community with whichit interacts. The ability of fish to meet requirements of differ-ent life stages determines the restrictive nature of potential ecological bottlenecks at each life stage. Individually based models used in conjunction with explicit models of space that incorporate spatial and temporal variation could be used to predict the physiology, behavior, growth, survival, and repro-duction of fishes under changing environmental conditions to estimate the restrictive nature of each bottleneck. One pos-sible approach is to integrate knowledge across disciplines to develop an individual-based spatially and temporally explicit forecasting tool based on an effective set of mathematical, statistical, and empirical models that describe fish community dynamics on the basis of fish physiological and behavioral responses and the physical environment in which these fish live. Such forecasting tools should provide an excellent source for understanding the dynamics of fish populations and com-munities and the nature of ecological bottlenecks. The ultimatevalue of this approach is a better understanding of the causes behind and an improved ability to predict the short-term and long-term distribution and population trends of fish in response to management decisions.
In developing such a model for sturgeon, we are apply-ing a combination of hierarchical Bayesian and information theoretic approaches to model behavior and spawning suc-cess of the gravid shovelnose sturgeon in the Lower Missouri River. We are developing a hybrid physical/statistical model of general fish movement based on an advection-diffusion partial differential equation in a hierarchical Bayesian mod-eling framework. We are also describing the selection of physical habitat by gravid shovelnose sturgeon during the breeding season by evaluating discrete choice models, based on telemetry data, within an information theoretic framework.
Using measurements of biological variables associated with readiness to spawn as well as longitudinal behavioral data collected using telemetry and data storage device sensors, we introduce a hierarchical Bayesian model for predicting spawn-ing success. This model uses an eigenvalue predictor from the transition probability matrix in a two-state Markov switching model with generalized autoregressive conditional heteroske-dasticity (GARCH) dynamics as a generated regressor in a linear regression model.
Designing Sustainable Landscapes for Bird Populations in the Eastern United States: A Collaborative Approach (Poster)
By James B. Grand1, Steven G. Williams2, Jaime A. Collazo3, Alexa McKerrow4, Andrew Milliken5, Craig Watson6, and Malcolm T. Jones7
1U.S. Geological Survey, Auburn, Ala.2North Carolina State University, Raleigh, N.C.3U.S. Geological Survey, Raleigh, N.C.4Southeast Gap Analysis Program, Raleigh, NC5U.S. Fish and Wildlife Service, Hadley, Mass.6U.S. Fish and Wildlife Service, Charleston, S.C.7U.S. Fish and Wildlife Service, Laurel, Md.
The overall objective of the proposal described in this poster is to develop a consistent methodology for—and to enhance the capacity of—States, joint ventures and other partners to assess and design sustainable landscape conserva-tion plans for birds and other wildlife in the eastern United States. Specifically, this project would develop and implement a framework and tools to (1) assess the current capability of habitats in ecoregions in the eastern United States to sup-port sustainable bird populations; (2) predict the impacts of landscape-level changes (for example, from urban growth, conservation programs, and climate change) on the future capability of these habitats to support bird populations; (3) target conservation programs to effectively and efficiently achieve objectives in State wildlife action plans and bird conservation plans and evaluate progress under these plans; and (4) enhance coordination among partners during the plan-ning, implementation, and evaluation of habitat conservation through conservation design.
Conservation planning for migratory birds has been occurring at the continental, national, regional and State scales for a number of years but, for the most part, conser-vation design tools that allow managers to determine how much, what type of and where specific habitats are needed on the landscape to sustain priority bird populations have not

Proceedings of the Second All-USGS Modeling Conference, February 11-14, 2008 47
been developed consistently and are not widely available, especially in the eastern United States. With the completion of national and regional bird conservation plans and of State wildlife action plans in each State, there is an immediate need for a consistent conservation design framework and set of tools at State and ecoregional scales that allow managers to make scientifically based decisions about habitat conservation and to evaluate progress relative to objectives stated in these plans. Current bird conservation planning does not allow for a quantitative assessment of the capability of landscapes to sustain populations at objective levels or of the net impact of land use change. Current bird conservation planning also is hampered by the inability to assess holistically (that is, for all species-habitat suites) the current or likely future landscape condition or its ability to support sustainable bird populations. In the eastern United States, bird conservation plans have been developed for several Bird Conservation Regions (BCRs) that have stepped down continental priorities and identified priority species and habitats, threats, limiting factors, population and habitat objectives, and coarse focus areas for bird conserva-tion. A U.S. Geological Survey Regional Gap Analysis project recently completed for the southeastern States and underway in the northeastern States will result in up-to-date, uniform, habitat classifications and maps. This proposed project would meet the need for consistent, widely available conservation design tools; draw from the priorities in continental, BCR, and State wildlife action plans: and use the Regional Gap Analy-sis habitat data layers to build a framework and specific tools for conservation design that can be applied across the eastern United States and, eventually, across the country.
This project would be a collaboration between two universities, the Atlantic Coast Joint Venture, and many Federal, State, and nongovernmental organization (NGO) partners involved in bird conservation in the eastern United States. The universities would be primarily responsible for the development of the models, maps, and decision support tools as described below, and the joint venture would be respon-sible primarily for collaborating with partners throughout the project.
The products developed though this project will build on several regional efforts that are currently developing or have recently completed spatial data, most notably the Gap Analy-sis Program (GAP), which will be delivering a land cover map of the southeastern United States based on ecological systems (Corner et al., 2003). This will be the most detailed land cover map to date at this resolution. GAP also will deliver interim mapping products for the northeastern United States to cooperators by 2009 and will have a consistent, seamless land cover product by 2011 for the entire eastern United States. The use of ecological systems has become a de facto standard for land cover classification for remote sensing specialists and a growing number of habitat modelers. This consistent approach is critical given the myriad habitat classification systems and descriptions across multiple States, Federal agencies, and NGOs). In addition to land cover, GAP products include pre-dicted habitat models for terrestrial vertebrate species that will
provide a solid foundation for the development of abundance/population models through the supporting ancillary datasets and extensive habitat relationship database used in their devel-opment (accessible at http://www.basic.ncsu.edu/segap). This project also will draw on other relevant bird habitat modeling efforts from the eastern United States.
Several other regional spatial analysis efforts will be inte-gral to the completion of this project. This project will build upon the single-habitat longleaf pine decision support tool being developed by the East Gulf Coastal Plain Joint Venture by integrating the needs of priority species across the suite of habitats they use, thereby incorporating the needs of such spe-cies as the Northern Bobwhite, which uses a variety of habitats that often occur as mosaics in the landscape. This project will also build upon the Northeast Association of Fish and Wildlife Agencies (NEAFWA) Northeast Habitat Classification and Mapping project that is developing a habitat classification that crosswalks classifications from wildlife action plans of the northeastern States with the ecological systems classification and is developing a common basis for habitat-species models and decision support tools.
Reference Cited
Corner, P., Faber-Langendoen, D., Evans, R., Gawler, S., Josse, C., Kittel, G., Menard, S., Pyne, M., Reid, M., Schulz, K., Snow, K., and Teugue, J., 2003, Ecological systems of the United States—A working classification of U.S. terrestrial systems: NatureServe; available online at http://www.natureserve.org/library/usEcologicalSystems.pdf.
Geospatial Modeling to Assess the Risk of American Ginseng Poaching in Shenandoah National Park (Poster)
By John A. Young1
1U.S. Geological Survey, Kearneysville, W.Va.
We used an expert-assisted model in combination with a geographic information system (GIS) to exam-ine potential geographic factors that could influence poaching of American ginseng (Panax quinquefolius) in Shenandoah National Park, Va. Following principles of the Analytic Hierarchy Process, we identified a hierarchy of 11 geographic risk factors deemed important to poaching and asked law enforcement personnel of the National Park Service to rank those factors in a series of pair-wise comparisons. We used those comparisons to determine the statistical weightings of each factor. We then standardized the weights to a common measurement scale and combined them using a weighted lin-ear function. Finally, we applied that linear function to the 11
48 Proceedings of the Second All-USGS Modeling Conference, February 11-14, 2008
spatial data layers to map the relative risk of poaching for each 0.01-hectare (ha) pixel within the study area. Experts ranked the quality of ginseng habitat as the most important variable, determining that it accounted for 73.4% of the weighting of the final model. Other factors that ranked high in the model were density of hiking trails, presence of geographic barriers, and proximity to park boundary. We tested the model based on 69 locations of previous American ginseng poaching incidents recorded by law enforcement personnel. The occurrence of those locations corresponded well with areas predicted by the model to have a high risk of poaching. The results of our study can be used to evaluate resource protection strategies and to target law enforcement activities. Given adequate spatial data and reliable expert opinion, similar models could be con-structed for other national parks and other species at risk of illegal exploitation.
Empirically Modeling Carbon Fluxes in the Northern Great Plains Grasslands (Poster)
By Li Zhang1, Bruce K. Wylie1, Lei Ji1, Tagir Gilmanov2, and Larry L. Tieszen3
1Science Applications International Corporation, Sioux Falls, S. Dak.2South Dakota State University, Sioux Falls, S. Dak.3U.S. Geological Survey, Sioux Falls, S. Dak.
The grassland ecosystem in the Great Plains occupies more than 1.5 million square kilometers of land area and is the primary resource for livestock production in North America. However, the contribution of grasslands to local and regional carbon budgets remains uncertain because of the lack of carbon flux data for the expansive grassland ecosys-tems that have various land management oversight, land uses, and climate variability. Understanding carbon fluxes across these systems is essential for developing regional, national, and global carbon budgets and providing guidance to policy-makers and managers when substantial biomass conversion to biofuels is implemented. We develop a remote-sensing-based Piecewise Regression (PWR) model to estimate the grassland carbon fluxes in the northern Great Plains using the 8-day, 500-meter (m) Moderate Resolution Imaging Spectroradiometer (MODIS) Normalized Difference Vegeta-tion Index (NDVI) data. We estimate the carbon fluxes using integrated spatial databases and extrapolations of flux tower data to regional scales. The PWR model is applied to derive an empirical relationship between environmental variables and tower-based measurements. The model equations are then applied to estimate spatio-temporal carbon fluxes across the study area. We incorporate the actual vegetation evapotrans-piration data derived from a vegetation evapotranspiration (VegET) model, which takes into account soil moisture and
land-surface phenology. We also consider the lag response of vegetation production to precipitation. We model and map 8-day and 500-m carbon fluxes for the years 2000 to 2006 in the northern Great Plains grasslands. These maps are then used to assess the regional and temporal trends of carbon fluxes in this region, identify carbon sink and source areas, and determine important transitions and environmental drivers of carbon sinks and sources. Carbon flux estimates will also pro-vide insights into how the grassland ecosystem will respond to future climate and what systems are sustainable and offer net carbon sinks.

Appendix 1. Conference Agenda 49
Appendix 1. Conference Agenda
Sunday, February 10, 2008
6:00–7:00 p.m. Registration
Monday, February 11, 2008
Noon–1:00 p.m. and 5:00–7:00 p.m. Registration8:30 a.m.–5:00 p.m. Working Group Leanne Hanson River Ecosystem Modeling in USGS: Where Are We and Where Should We Go?
U.S. Geological Survey
1:00–5:00 p.m. Optional Workshop(s) James Grace An Introduction to Structural Equation Modeling
U.S. Geological Survey
Kate Flynn MapWindow GIS—Integrating Modeling Into a Customizable, Open-Source GIS
U.S. Geological Survey
Alyssa M. Dausman An Introduction to Using PEST—A Model Independent Parameter Estimation and Uncertainty Analysis U.S. Geological Survey Code
Tuesday, February 12, 2008
7:30–8:00 a.m. Registration8:00–8:30 a.m. Welcome and Opening Remarks—Linda Gundersen and Thomas Casadevall8:30–9:50 a.m. Session 1: Integrated Landscape Monitoring—Oral Presentations A Chair: Kenneth Odom, U.S. Geological Survey 8:30–8:50 a.m. Peter R. Claggett Toward a National Land-Change Community Model
U.S. Geological Survey
8:50–9:10:00 a.m. Alicia Torregrosa Linking Plots to Landscapes: A Synthetic Framework for Monitoring Change in the
U.S. Geological Survey
9:10–9:30 a.m. Stephen P. Faulkner Great Basin Ecosystem
Conceptual and Rapid Prototype Models for Evaluating the Effects of Land-Use and
U.S. Geological Survey
9:30–9:50 a.m. Terry L. Sohl Land-Cover Changes on Ecosystem Services in the Lower Mississippi Valley (LMV)
An Integrated Modeling Approach for Analyzing the Effects of an EROS-SAIC Expanding Biomass-for-Biofuel Economy in the Northern Great Plains
9:50–10:00 a.m. BREAK
10:00–11:20 a.m. Session 1: Integrated Landscape Monitoring—Oral Presentations B Chair: Kenneth Odom, U.S. Geological Survey 10:00–10:20 a.m. Christine E. Turner The FRAME (Framing Research in Support of the Adaptive Management of Ecosys-
U.S. Geological Survey
10:20–10:40 a.m. Paul A. Conrads tems) Project: A Collaborative Modeling Approach to Natural Resource Management
Using Data Mining Techniques and Artificial Neural Network Models to Integrate
U.S. Geological Survey
10:40–11:00a.m. Eric D. Swain Hydrology, Ecology, and Biology—Two Case Studies
Applications of the FTLOADDS Coupled Code and Linkages to Hydrologic and U.S. Geological Survey Ecological Models
11:20 a.m.–2:20 p.m. Panel Discussion: Integrated Lanscape MonitoringPanel members will share their knowledge and apply their diverse expertise to address multifaceted modeling issues being faced in the four pilot areas of the Integrated Landscape Monitoring Thrust, discuss partnerships that have been developed, and highlight ongoing and proposed multidisciplinary modeling approaches. Chair: Paul Dresler, U.S. Geological Survey Panel Members Great Basin Alicia Torregrosa, U.S. Geological Survey Puget Sound Susan Benjamin, U.S. Geological Survey Lower Mississippi Valley Bogdan Chivoiu, ASci Corporation Prairie Potholes Shuguang Liu, EROS-SAIC

50 Proceedings of the Second All-USGS Modeling Conference, February 11-14, 2008
12:20–1:30 p.m. LUNCH
1:30–2:50 pm Session 2: Global Climate Change—Oral Presentations A Chair: Linda Gundersen, U.S. Geological Survey 1:30–1:50 p.m. K. Bruce Jones Modeling Species Responses to Historical Climate Change: From Molecules to
U.S. Geological Survey
1:50–2:10 p.m. Jill S. Baron Continental Landscapes
Addressing the Vulnerability of Western Mountain Ecosystems and Water Resources to
U.S. Geological Survey
2:10–2:30 p.m. Lauren E. Hay Climate Change with RHESSys, the Regional Hydro-Ecological Simulation System
Hydrologic Effects of Climate Change in the Yukon River Basin
U.S. Geological Survey
2:30–2:50 p.m. Dave Douglas Modeling Past, Present, and Future Polar Bear HabitatsU. S. Geological Survey
2:50–3:00 p.m. BREAK
3:00–4:20 p.m. Session 2: Global Climate Change—Oral Presentations B Chair: Linda Gundersen, U.S. Geological Survey 3:00–3:20 p.m. Eric T. Sundquist Modeling the Historical Influence of Soil and Water Management on Sediment and
U.S. Geological Survey Carbon Budgets in the United States
3:20–3:40 p.m. Neil K. Ganju CASCaDE: Computational Assessments of Scenarios of Change for the San Francisco
U.S. Geological Survey Bay-Delta Ecosystem
3:40–4:00 p.m. Mark A. Chandler EdGCM: An Interactive Climate Modeling Framework for Educators and Scientists
Columbia University
4:00–4:20 p.m. Randy Hunt Hydrologic Climate Change From a Deterministic View: Using GSFLOW to Simulate U.S. Geological Survey Climate Change in a Northern Temperate Climate
4:20–5:20 p.m. USGS Town Hall Meeting on Global Climate Change: Modeler’s Input Moderator: Lauren E. Hay, U.S. Geological Survey
The town hall forum encourages audience participation to address a series of questions with 20 minutes of discussion per question:1. What are the Global Climate Change (GCC) model inputs needed to address global climate change from the five USGS
disciplines (Water, Biology, Geology, Geography, and Geospatial Information)?
• If you were designing a data retrieval tool for global climate change application, what would be your highest data priori-ties for that tool (quality control, formats that feed directly into your model, or distributed and central source)?
• Does USGS have the expertise to handle the quality assurance and quality control (QA/QC), reformatting, and redistribution of the identified datasets (National Water Information System, National Map, Consortium of Universities for the Advancement of Hydrologic Science, Inc.)?
2. Do we need standardization of general circulation model (GCM) climate change scenarios for USGS modelers and should we be considering the same group of scenarios?
3. What model outputs are being produced that could be used by other GCC model applications?
5:30–7:00 p.m. DINNER

Appendix 1. Conference Agenda 51
7:00–9:30 p.m. Evening Poster Session I
Integrated Landscape Monitoring Theme
Presenter Title
Susan Benjamin The Puget Sound Integrated Landscape Monitoring Project
Norman B. Bliss A New Method of Multiscale Topographic Analysis: Extracting Landforms
Jacoby Carter MOAB: Modeling Individual Movement and Behavior Using an Expert System Approach
Thomas H. Cecere Communicating Remote Sensing Requirements and Working Together to Satisfy Project Needs
Richard A. Champion Cost Benefit Analysis of Computer Resources for Machine Learning
Paul A. Conrads Integrating 3-D Hydrodynamic Transport and Ecological Plant Models of the Savannah River Estuary Using Artificial Neural Network Models
Michael Fienen Implementation of a Bayesian Geostatistical Parameter Estimation Module into PEST
Michael J. Friedel
John D. Guthrie
Stochastic Modeling to Forecast Likely Effects of a Proposed Reservoir on Colorado River Quantity and Quality near Grand Junction, Colorado
Using Such Web Services as StreamStats to Increase Your Modeling Productivity
James R. Hatten Using GIS/Remote Sensing Models to Quantify and Monitor Southwestern Willow Flycatcher Breeding Habitat
Edward J. Laurent Developing an Infrastructure for Knowledge-Based, Spatially Explicit Population Modeling of Multiple Species
Steve Markstrom GSFLOW—Coupled Ground-Water and Surface-Water Flow Model
Leonard Pearlstine
Christopher Polloni
Spatially Continuous Interpolation of Water Stage and Water Depths Using the Everglades Depth Estimation Network (EDEN)
Animation and Publication of 3-D and 4-D Physical Models
Gabriel B. Senay
Kathryn A. Thomas
Landscape Evapotranspiration Estimation Using a Simplified Surface Energy Balance Approach for Watershed Water Balance Modeling
Predictive Models of Suitable Habitat for the Mojave Desert Tortoise: “Truthiness” in Pseudo-Absence
Nguyen Hieu Trung
Dalia E. Varanka
Credibility and Acceptability of Landuse Planning Approaches: A Case Study in the Coastal Area of the Mekong Delta, Vietnam
Modeling and Generalizing Population Pressure at the Regional Scale by Interpolating a Kriging Surface
Richard Webb Variations in Pesticide Leaching Related to Land Use, Pesticide Properties, and Unsaturated Zone Thickness in an Agricultural Watershed
Global Climate Change Theme
Presenter Title
Guleid A. Artan Monitoring Snow Water Status with a Distributed Snowmelt Model
Erik A. Beever Extirpations and Elevational-Range Changes of the American Pika Linked to Climate Warming through Climate-Envelope Modeling
Jacoby Carter Modeling Nutria (Myocastor coypus) Invasions Across Regional and National Landscapes

52 Proceedings of the Second All-USGS Modeling Conference, February 11-14, 2008
Dave Douglas Forecasting the 21st century World-Wide Status of Polar Bears Using a Bayesian Network Modeling Approach
Thomas W. Doyle SELVA-MANGRO: Landscape Model for South Florida Mangrove Ecosystems
Thomas W. Doyle SLRRP: Sea-Level Rise Rectification Program and Seawater Inundation Model under Climate Change
James B. Grand Designing Sustainable Landscapes for Bird Populations in the Eastern United States: A Collaborative Approach
Catherine S. Jarnevich Advanced Species Modeling
John F. Walker Processing Time-Series Data to Calibrate the GSFLOW (Coupled Ground-Water and Surface-Water Flow) Model in the Trout Lake Watershed, Northern Wisconsin
Wednesday, February 13, 2008
Field TripMississippi Sandhill Crane National Wildlife Refuge, Grand Bay, 5 Rivers Delta Resource Center and Bon Secour National Wildlife Refuge
The field trip will be conducted in two groups. Each group will spend 1 hour each at Mississippi Sandhill Crane, Grand Bay, and the 5 Rivers Delta Resource Center, and approximately 40 minutes each at the beach and in the upland forest of Bon Secour. One group will have an early lunch at the 5 Rivers Delta Resource Center and the second group will have a late lunch there.
DINNER
7:00–9:30 p.m. Evening Poster Session II
Ecosystem Modeling Theme
Presenter Title
Nate Booth Taking SPARROW Predictions to the Web: A Tool for Research and Resource Management
Bruce Campbell Numerical Simulation of Ground-Water Flow within the Atlantic Coastal Plain Aquifers of North Carolina and South Carolina
Chunfang Chen
Mingshi Chen
Hydrodynamic and Water Quality Modeling of the A.R.M. Loxahatchee National Wildlife Refuge, North Ever-glades, Florida
Mutually Interactive State-Parameter Estimation of a Carbon Cycle Model Using a Smoothed Ensemble Kalman Filter
Michael E. Colvin
Donald L. DeAngelis
A Proposed Ecosystem Simulation Model to Predict the Effects of Common Carp and Zebra Mussels in Shallow Lake Ecosystems
Modeling an Aquatic Trophic Chain in a Two-Dimensional Topography in a Seasonally Varying Wetland
Michael J. Friedel
Brian R. Gray
Application of Stochastic Modeling to Forecast Likely Urbanization Effects on Ecological Integrity in the Upper Illinois River Basin, USA
Addressing Among-Group Variation in Covariate Effects Using Multilevel Modeling Approaches With Emphasis on Multilevel Count Models
Timothy Green Spatial and Age-Structured Population Model of the American Crocodile for Comparisons of CERP Restoration Alternatives
Lauren E. Hay Evaluation of Environmental Flow Components Produced Using a Distributed Watershed Model of the Flint River Basin, Georgia
Appendix 1. Conference Agenda 53
Ecosystem Modeling Theme - Continued.
Presenter Title
Shuguang Liu De-Trending for Climatic Variations to Reveal Stressed Ecosystems
Ken Lubinski Modeling with Stakeholders: When the Process is as Valuable as the Product
Monica Palaseanu-Lovejoy Delineation of Vegetation Communities Using Airborne Lidar Data at Jean Lafitte National Park, Louisiana
Daniel H. Slone A Spatially Explicit Stage-Based Population Model of American Alligators in Support of Everglades Restoration
Brad Stith Integrating Hydrology and Individual-Based Models: Issues and General Approaches to Simulating Animal Movement Using Artificial Intelligence and Navigation Theory
Zhengxi Tan Ecosystem Carbon Budgets and Crop Yields in a Tropical Savanna Ecosystem as Related to Changes in Climate and Management
Adam Terando Seeing the Forest Fire through the Trees: Integrating Mulitple Data Streams to Model the Pre-Settlement Fire Regime in the Longleaf Pine Ecosystem
Alicia Torregrosa A Knowledge Management Approach for Complex Regional Ecosystem Modeling
Roland Viger Formalizing Model-Specific GIS Methodology with the GIS Weasel
Roland Viger The Integration of Environmental Simulation Models and GIS Using Metadata
Hongqing Wang Modeling Surface-Water Sulfate Dynamics in a Northern Everglades Wetland
Mark L. Wildhaber Application of Bayesian Hierarchical and Information Theoretic Approaches in Model-Facilitated Recovery of Endangered Fish Populations Based on Behavior and Physiology as Part of an Individual-Based Spatially Explicit Model
John A. Young Geospatial Modeling to Assess the Risk of American Ginseng Poaching in Shenandoah National Park
Hazards and Risks Theme
Presenter Title
Thomas W. Doyle CONGFLO: Floodplain Inundation Model of Congaree National Park
Thomas W. Doyle HURASIM: Hurricane Simulation Model for Reconstructing Wind Fields and Landfall Frequencies of Historic Storms
Thomas W. Doyle Landscape Simulation Model for Invasive Species Spread and Detection
Michael J. Friedel
Michael J. Friedel
Robert Klinger
Joint Inverse Modeling to Estimate Extreme Rainfall Events and their Uncertainty in Ungaged Coastal Basins, El Salvador, Central America
Joint Inverse Modeling to Estimate Flood-Flow Depths and Their Uncertainty in Ungaged Coastal Basins, El Salvador, Central America
Limitations to Modeling Nonnative Plant Species Distributions for Early Detection Monitoring in Arid Environments
Bruce H. Pugesek Modeling Nonlinear Time Sequences in Earth Change and Human Disease Pandemics
Vivian R. Queija Elevation Derivatives for Modeling Postwildfire Debris Flows
Christopher R. Sherwood Community Sediment-Transport Modeling Project

54 Proceedings of the Second All-USGS Modeling Conference, February 11-14, 2008
Thursday, February 14, 2008
7:45–8:00 a.m. Remarks
8:00–9:20 a.m. Session 3: Ecosystem Modeling—Oral Presentations A Chair: Mark Wildhaber, U.S. Geological Survey 8:00–8:20 a.m. Laura A. Brandt Strategic Habitat Conversation and the Importance of Ecosystem Models
U.S. Fish and Wildlife Service
8:20–8:40 a.m. Roger G. Sayre Modeling Standardized, Meso-Scale Ecosystem Distributions for the United States and U.S. Geological Survey the Planet
8:40–9:00 a.m. Melannie D. Hartman Using a Coupled Ecosystem-Geochemical Model to Assess Ecological, Biogeochemi-Colorado State University cal, and Hydrologic Processes and Their Responses to Atmospheric Deposition and
9:00–9:20 a.m. William B. Labiosa Climate Change for Diverse Ecosystems Within the United States
The South Florida Ecosystem Portfolio Model: Integrating Ecological, Community, U.S. Geological Survey and Economic Values for Decision Support
9:20–9:40 a.m. BREAK
9:40–11:00 a.m. Session 3: Ecosystem Modeling—Oral Presentations B Chair: Mark Wildhaber, U.S. Geological Survey 9:40–10:00 a.m. Guy Gelfenbaum Modeling the Hydrodynamic and Morphologic Response of an Estuary Restoration
U.S. Geological Survey 10:00–10:20 a.m. William R. Green The Future: Data-Driven Lake and Reservoir Monitoring Using Real-Time 3-D Hydro-
U.S. Geological Survey dynamic and Water Quality Simulations 10:20–10:40 a.m. Jon C. Cline Application of a Multimodeling Framework to Linking Ecosystem Pattern and Process
Case Western Across Scales: A Tale of Two Ecosystem Models
10:40–11:00 a.m.Reserve University
Travis S. Schmidt Utilizing Structural Equation Modeling Techniques to Model Watershed Structure and U.S. Geological Survey Land Use Effects on Stream Geochemistry and Ecological Responses
11:00 a.m.-Noon Panel Discussion: Ecosystem ModelingPanel members will share their knowledge and apply their diverse expertise to address multifaceted modeling issues being faced in ecosystem modeling, discuss partnerships that have been developed, and highlight ongoing and proposed multidisciplinary modeling approaches. Chair: Laura Brandt, U.S. Fish and Wildlife Service Panel Members James T. Peterson, U.S. Geological Survey Roger G. Sayre, U.S. Geological Survey Daniel H. Slone, U.S. Geological Survey Adam Terando, U.S. Geological Survey
Noon-1:15 p.m. LUNCH
1:20–2:20 p.m. Session 4: Hazards and Risks-Oral Presentations A
Chair: K. Bruce Jones, U.S. Geological Survey1:20–1:40 p.m. E. Lynn Usery Elements of a Global Model: An Example of Sea-Level Rise and Human Populations
U.S. Geological Survey
1:40–2:00 p.m. James L. Coleman at Risk
Modeling Natural Resource Management Decision Scenarios Using Decision Analysis:
U.S. Geological Survey
2:00–2:20 p.m. Jerad Bales The Flow of Selenium in Appalachian Watersheds from Rocks to Ducks
Three-Dimensional Circulation and Transport Modeling in Devils Lake, North DakotaU.S. Geological Survey
2:20–2:40 p.m. BREAK

Appendix 1. Conference Agenda 55
2:40–4:00 p.m. Session 4: Hazards and Risks—Oral Presentations B
Chair: K. Bruce Jones, U.S. Geological Survey2:40–3 p.m. Laura Dinitz The Land Use Portfolio Model: A Tool for Natural-Hazards Risk Analysis
U.S. Geological Survey
3–3:20 p.m. Larry Garver Mastin Use of Operational and Research Models to Assess Volcanic Tephra Hazards
U.S. Geological Survey
3:20 3:40 p.m. Peter F. Cervelli Data Management and Interoperability in the USGS Volcano Hazards Program
U.S. Geological Survey
3:40–4 p.m. Gregory J. Smith The Delta Research and Global Observation NetworkU.S. Geological Survey
4:00–5:00 p.m. Panel Discussion: Hazards and RisksPanel members will share their knowledge and apply their diverse expertise to address multifaceted modeling issues being faced in hazards and risks modeling, discuss partnerships that have been developed, and highlight ongoing and proposed multidisci-plinary modeling approaches. Co-Chairs: K. Bruce Jones and Richard Bernknopf, U.S. Geological Survey Panel Members Introduction K. Bruce Jones, U.S. Geological Survey Risk Analysis Process Anne Wein, U.S. Geological Survey Floods Michael Friedel, U.S. Geological Survey Fire Matthew Rollins, U.S. Forest Service Climate Change DeWayne Cecil, U.S. Geological Survey Multihazards Rich Bernknopf, U.S. Geological Survey
5:10–5:30 p.m. Closing Remarks—Linda Gundersen and Thomas Casadevall

56 Proceedings of the Second All-USGS Modeling Conference, February 11-14, 2008
Appendix II. List of Conference Participants
Erik A. Beever Ecologist U.S. Geological Survey USGS-ASC 1011 E. Tudor Rd. Anchorage, AK 99503 907-786-3954 [email protected]
Susan Benjamin Director, WGSC U.S. Geological Survey MS 531 345 Middlefield Rd. Menlo Park, CA 94025 650-329-5049 [email protected]
Charles Berenbrock Hydrologist U.S. Geological Survey National Center, MS 41512201 Sunrise Valley Dr. Reston, VA 20192 703-648-6876 [email protected]
Richard BernknopfU.S. Geological SurveyMS 531345 Middlefield Rd.Menlo Park, CA [email protected]
Kyle Blasch Research Hydrologist U.S. Geological Survey 520 N Park Ave., Suite 221 Tucson, AZ 85719 520.670.6671 ext 283 [email protected]
Norman B. Bliss Principal Scientist, SAIC U.S. Geological Survey - SAIC 47914 252nd St. Sioux Falls, SD 57198 605-594-6034 [email protected]
Daniel P. Ames Professor Idaho State University 1784 Science Center Dr. Idaho Falls, ID 83402 208-282-7851 [email protected]
Guleid A. Artan Scientist Science Applications International
CorporationU.S. Geological Survey EROS Data
CenterSioux Falls, SD 57198 605-594-6195 [email protected]
Nicole Athearn Biologist U.S. Geological Survey 505 Azuar Dr. Vallejo, CA 94592 707-562-2002 [email protected]
Scott Ator Hydrologist U.S. Geological Survey 5522 Research Park Dr. Baltimore, MD 21228 443-498-5564 [email protected] Jerad Bales Director, NC WSC U.S. Geological Survey 3916 Sunset Ridge Rd. Raleigh, NC 27607 919-571-4048 [email protected]
Jill S. Baron Research Ecologist U.S. Geological Survey Natural Resource Ecology Laboratory Colorado State University Fort Collins, CO 80523-1499 970-491-1968 [email protected]
David Boldt Computer Scientist U.S. Geological Survey National Center, MS 44512201 Sunrise Valley Dr. Reston, VA 20192 703-648-5679 [email protected]
Nate Booth U.S. Geological Survey 8505 Research Way Middleton, WI 53562 608-821-3822 [email protected]
Kip Bossong Hydrologist U.S. Geological Survey MS 415 Lakewood, CO 80470 303-236-4882 x 317 [email protected]
Shailaja (Sally) R. Brady GeologistU.S. Geological Survey National Center, MS 911 12201 Sunrise Valley Dr. Reston, VA 20192 703-648-6882 [email protected]
Laura A. Brandt Team Leader U.S. Fish and Wildlife Service 3205 College Ave. Davie, FL 33314 954-577-6343 [email protected]
Bruce Campbell Hydrologist U.S. Geological Survey 720 Gracern Rd. Suite 129 Columbia, SC 29210 803-750-6161 [email protected]

Appendix II. List of Conference Participants 57
Darren CarlisleU.S. Geological SurveyNational Center, MS 41312201 Sunrise Valley Dr. Reston, VA [email protected]
Jacoby Carter Research Ecologist U.S. Geological Survey 700 Cajundome Blvd. Lafayette, LA 70506 337-266-8620 [email protected]
Thomas J. Casadevall Regional Director U.S. Geological Survey Box 25046 Denver Federal Center, MS 150 Lakewood, CO 80225-0046 303-202-4740 [email protected]
Thomas H. Cecere Land Remote Sensing Requirements U.S. Geological Survey National Center, MS 517 12201 Sunrise Valley Dr.Reston, VA 20192 703-648-5551 [email protected]
Peter F. Cervelli Research Geophysicist U.S. Geological Survey 4200 University Dr. Anchorage, AK 99508 907-786-7446 [email protected]
Richard A. Champion Mathematician U.S. Geological Survey MS 531 345 Middlefield Rd. Menlo Park, CA 94025 650-329-4260 [email protected]
Mark A. Chandler Research Scientist Columbia University, NASA/GISS 4717 Fond Du Lac Trail Madison, WI 53705 608-270-9645 [email protected]
Colleen CharlesU.S. Geological SurveyNational Center, MS 30012201 Sunrise Valley Dr.Reston, VA [email protected]
Chunfang Chen Postdoctoral Research Associate U.S. Fish and Wildlife Service P.O. Box 4031 Lafayette, LA 70504 337-482-0694 [email protected]
Bogdan Chivoiu ASci Corporation 700 Cajundome Blvd. Lafayette, LA 70506 337-266-8669 [email protected]
Peter R. Claggett Research Geographer U.S. Geological Survey 410 Severn Avenue, Suite 109 Annapolis, MD 21403 410-267-5771 [email protected]
Athena P. Clark Director U.S. Geological Survey 75 TechnaCenter Dr.Montgomery, AL 36117 334-395-4141 [email protected]
Jon C. Cline Case Western Reserve University 10900 Euclid Ave.Cleveland, OH 44106 216-368-8996 [email protected]
Brian E. Cole Regional Chief Scientist U.S. Geological Survey MS 150345 Middlefield Rd. Menlo Park, CA 94025 650-329-4593 [email protected]
James L Coleman Team Chief Scientist U.S. Geological Survey National Center, MS 956 12201 Sunrise Valley Drive Reston, VA 20192 703-648-6400 [email protected]
Michael E. Colvin Iowa State University Coop Unit 339 Science II Ames, IA 50010 515-520-0564 [email protected]
Paul A. Conrads Hydrologist U.S. Geological Survey 720 Gracern Rd. Columbia, SC 29210 803-750-6140 [email protected]
Alyssa M. Dausman Hydrologist U.S. Geological Survey 3110 SW 9th Ave. Fort Lauderdale, FL 33315 954-377-5972 [email protected]
Warren C. Day Rocky Mountain Area Science Program OfficerU.S. Geological Survey Bldg. 20Denver Federal Center, MS 911 Lakewood, CO 80225 303-236-6484 [email protected]

58 Proceedings of the Second All-USGS Modeling Conference, February 11-14, 2008
Robert Deibel U.S. Forest Service 2150 Centre Ave. Building A Fort Collins, CO 80526 970-295-5982 [email protected]
Patrick N. Deliman Technical Director, Environmental ModelingU.S. Army Corps of Engineers 3909 Halls Ferry Rd. CEERD-EV-E Vicksburg, MS 39180 601-634-3623 [email protected]
Charles R. Demas U.S. Geological Survey 3535 S. Sherwood Forest Blvd. Suite 120 Baton Rouge, LA 70816 225-298-5481, ex 3117 [email protected]
Laura Dinitz OR Analyst U.S. Geological Survey MS 531345 Middlefield Rd. Menlo Park, CA 94025 650-329-4953 [email protected]
David I. Donato Computer Scientist U.S. Geological Survey National Center, MS 521 12201 Sunrise Valley Dr. Reston, VA 20192703-648-5772 [email protected]
Therese Donovan Assistant Unit Leader U.S. Geological Survey 311 Aiken Center University of Vermont Burlington, VT 05405 802-656-2516 [email protected]
Dave Douglas U.S. Geological Survey 3100 National Park Rd. Juneau, AK 99801 907-364-1576 [email protected]
Thomas W. Doyle Research Ecologist U.S. Geological Survey 700 Cajundome Blvd. Lafayette, LA 70506 337-266-8647 [email protected]
Paul V. Dresler Program Coordinator U.S. Geological Survey National Center, MS 301 12201 Sunrise Valley Dr. Reston, VA 20192 703-648-4114 [email protected]
Jeff Duda Research Ecologist U.S. Geological Survey 6505 NE 65th St. Seattle, WA 98115 206-526-6282 x233 [email protected]
Ned H. Euliss Research Biologist U.S. Geological Survey 8711 37th St. SE Jamestown, ND 58401 701-253-5564 [email protected]
Stephen P. Faulkner Research Ecologist U.S. Geological Survey 700 Cajundome Blvd Lafayette, LA 70506 337-266-8648 [email protected]
Michael Fienen U.S. Geological Survey 8505 Research Way Middleton, WI 53562 608-821-3894 [email protected]
Kate Flynn Information Technology Specialist U.S. Geological Survey National Center, MS 415 12201 Sunrise Valley Dr. Reston, VA 20192 703-648-5313 [email protected]
Mary C. Freeman Research Ecologist U.S. Geological Survey Odum School of Ecology University of Georgia Athens, GA 30602-2202 706-583-0978 [email protected]
Michael J. Friedel U.S. Geological Survey Box 25046 Denver Federal Center, MS 964Lakewood, CO 80225 303-236-7790 [email protected]
Janice M. Fulford Senior Hydrologist U.S. Geological Survey Bldg. 2101 Stennis Space Center, MS 39529 228-688-1501 [email protected]
Neil K. Ganju U.S. Geological Survey Placer Hall 6000 J St. Sacramento, CA 95819 916-278-3117 [email protected]
Leila Gass U.S. Geological Survey 520 N. Park Ave. Suite 106 Tucson, AZ 85719 520-670-5005 [email protected]

Appendix II. List of Conference Participants 59
Guy Gelfenbaum Oceanographer U.S. Geological Survey MS 999 345 Middlefield Rd. Menlo Park, CA 94025 650-329-5483 [email protected]
James Grace Research Scientist U.S. Geological Survey 700 Cajundome Blvd. Lafayette, LA 70506 337-266-8632 [email protected]
Brian R. Gray Statistician U.S. Geological Survey 2630 Fanta Reed Rd. La Crosse, WI 54603 608-781-6234 [email protected]
William R. Green Hydrologist - Assistant Director U.S. Geological Survey 401 Hardin Rd. Little Rock, AR 72211 501-228-3607 [email protected]
Linda C. Gundersen Chief Scientist for Geology U.S. Geological Survey National Center, MS 91112201 Sunrise Valley Dr. Reston, VA 20192703-648-6641 [email protected]
Thomas M. Gunther U.S. Geological Survey National Center, MS 15912201 Sunrise Valley Dr.Reston, VA 20192703-648-4708 [email protected]
John D. Guthrie U.S. Geological Survey Box 25046 Denver Federal Center, MS 516 Denver, CO 80225 303-202-4289 [email protected]
Stephen E. Hammond Acting Chief, Science Information & Education OfficeU.S. Geological Survey National Center, MS 15912201 Sunrise Valley Dr. Reston, VA 20192 703-648-5033 [email protected]
Leanne Hanson Biologist U.S. Geological Survey Fort Collins Science Center 2150 Centre Ave., Bldg. C Fort Collins, CO 80526-8118 970-226-9262 [email protected]
Melannie D. Hartman Colorado State University Natural Resource Ecology Laboratory Fort Collins, CO 80523-1499 970-491-1609 [email protected]
James R. Hatten Research Geographer U.S. Geological Survey Columbia River Research Lab 5501 A Cook Underwood Rd. Cook, WA 98605 509-538-2299 x252 [email protected]
Lauren E. Hay Hydrologist U.S. Geological Survey Box 25046 Denver Federal Center, MS 412 Denver, CO 80225 303-236-7279 [email protected]
Matthew C. Hayne Senior Scientist U.S. Geological Survey National Center MS 91712201 Sunrise Valley Dr. Reston, VA 20192-0002 703-648-6065 [email protected]
Heather S. Henkel Information Technology Specialist U.S. Geological Survey 600 4th St. South St. Petersburg, FL 727-803-8747 x3028 [email protected]
William B. Hughes Assistant Director U.S. Geological Survey 3039 Amwiler Rd., Suite 130 Atlanta, GA 30360 770-903-9162 [email protected]
Randy Hunt U.S. Geological Survey 8505 Research Way Middleton, WI 53562 608-821-3847 [email protected]
Elise Irwin U.S. Geological Survey Alabama Cooperative Fish and Wildlife Research Unit 119 Swingle Hall Auburn, AL 36849 334-844-9190 [email protected]
James D. Jacobi Botanist U.S. Geological Survey 677 Ala Moana Blvd., Suite 615 Honolulu, HI 96813 808-587-7456 [email protected]
Catherine S. Jarnevich Ecologist U.S. Geological Survey 2150 Centre Ave., Bldg. C Fort Collins, CO 80526 970-226-9439 [email protected]

60 Proceedings of the Second All-USGS Modeling Conference, February 11-14, 2008
K. Bruce JonesChief Scientist for Geography U.S. Geological Survey National Center, MS 30012201 Sunrise Valley Dr.Reston, VA [email protected]
Sonya A. Jones Program Officer U.S. Geological Survey 3850 Holcomb Bridge Rd., Suite 160 Norcross, GA 30092 770-409-7705 [email protected]
Robert L. Joseph Director U.S. Geological Survey USGS Texas Water Science Center 8027 Exchange Dr. Austin, TX 78754 512-927-3502 [email protected] Julie E. Kiang Hydrologist U.S. Geological Survey National Center, MS 41512201 Sunrise Valley Dr. MS415 Reston, VA 20192 703-648-5364 [email protected]
Suzette Kimball Regional Director, Eastern Region U.S. Geological Survey National Center, MS 15012201 Sunrise Valley Dr. Reston, VA 20192 703-648-5817 [email protected]
Jack L. Kindinger Associate Director U.S. Geological Survey 600 Fourth St. South St. Petersburg, FL 33701 727-803-8747 X 3002 [email protected]
Robert Klinger Ecologist U.S. Geological Survey Yosemite Field Station - Bishop Office RR2 14 Utah St. Bishop, CA 93514 760-387-2482 [email protected]
William B. Labiosa Research Physical Scientist U.S. Geological Survey MS 531 345 Middlefield Rd. Menlo Park, CA 94025 650-329-4279 [email protected]
Catherine A. Langtimm Research Wildlife Biologist U.S. Geological Survey 2201 NW 40 Terr. Gainesville, FL 32605 508-335-3029 [email protected]
Dawn L. Lavoie Gulf of Mexico Coordinator U.S. Geological Survey 2045 Lakeshore Dr. University of New Orleans, Lakefront Campus New Orleans, LA 70148 504-280-4054 [email protected]
Linda E. Leake Deputy Center Director U.S. Geological Survey 2630 Fanta Reed Rd. LaCrosse, WI 54636 608-781-6269 [email protected]
Ken J. Leib Hydrologist U.S. Geological Survey 764 Horizon Dr. Grand Junction, CO 81506 970-245-5257 [email protected]
William A. Lellis Branch Chief U.S. Geological Survey 176 Straight Run Rd. Wellsboro, PA 16901 570-724-3322 [email protected]
Shuguang Liu Senior Principal Scientist U.S. Geological Survey EROS - SAIC Science Directorate Sioux Falls, SD 57198 605-594-6168 [email protected]
Ken Lubinski River Ecologist U.S. Geological Survey Upper Midwest Environmental Sciences
Center 2630 Fanta Reed Rd. La Crosse, WI 54603 608-781-6297 [email protected]
Peter Lyttle Program Coordinator U.S. Geological Survey National Center, MS 90812201 Sunrise Valley Dr. Reston, VA 20192 703-648-6943 [email protected]
Steve Markstrom U.S. Geological Survey Box 25046Denver Federal Center, MS 412Denver, CO [email protected]
Luke Marzen Auburn University 210 Petrie Hall Auburn University, AL 36849 334-844-3462 [email protected]

Appendix II. List of Conference Participants 61
Robert Mason Deputy Chief U.S. Geological Survey National Center, MS 41512201 Sunrise Valley Dr. Reston, VA 20192 703-648-5305 [email protected]
Larry G. Mastin Research Hydrologist U.S. Geological Survey 1300 SE Cardinal Court Bdlg. 10, Suite 100 Vancouver, WA 98683 360-993-8925 [email protected]
Gerard McMahon Research Geographer U.S. Geological Survey 3916 Sunset Ridge Rd. Raleigh, NC 27607 919-571-4068 [email protected]
Sergio Merino Biologist U.S. Geological Survey NWRC - IAP World Services 700 Cajundome Blvd. Lafayette, LA 70506 337-266-8641 [email protected]
Mark J. Mihalasky Research Geologist/Spatial Data AnalystU.S. Geological Survey 904 W. Riverside Ave., Room 202 Spokane, WA 99201 509-368-3118 [email protected]
Cheryl Morris Regional Geospatial Information OfficerU.S. Geological Survey Denver Federal Center, MS 306 Denver, CO 80225 303-202-4500 [email protected]
Jonathan NelsonU.S. Geological SurveyMS 4134620 Technology Dr.Golden, CO [email protected]
Peter Ng Computer Scientist U.S. Geological Survey MS 531329 Middlefield Rd. Menlo Park, CA 94025 650-329-5541 [email protected]
Kenneth R. Odom Hydrologic Studies Chief U.S. Geological Survey 75 TechnaCenter Dr.Montgomery, AL 36117 334-395-4140 [email protected]
Monica Palaseanu-Lovejoy Physical Scientist U.S. Geological Survey 600 4th St. South St. Petersburg, FL 33701 727-803-8747 [email protected]
Michael Pantea U.S. Geological Survey Box 25046Denver Federal Center, MS 913 Denver, CO 80225 303-236-5554 [email protected]
Leonard Pearlstine Landscape Ecologist U.S. National Park Service 950 N Krome Ave. Fort Lauderdale, FL 33030 305-224-4228 [email protected]
Charles A. Peters Director U.S. Geological Survey 8505 Research Way Middleton, WI 53562 608-821-3810 [email protected]
James T. PetersonU.S. Geological Survey401 Hardin Rd.Little Rock, AR [email protected]
Nathaniel Plant OceanographerU.S. Geological Survey 600 4th St. SouthSt. Petersburg, FL [email protected]
Christopher Polloni Information Technology Specialist U.S. Geological Survey Woods Hole Science Center 384 Woods Hole Rd. Woods Hole, MA 02543 508-457-2280 [email protected]
Stanley L. Ponce Acting Regional Executive U.S. Geological Survey Box 25046Denver Federal Center, MS 300 Denver, CO 80225 303-236-2730 x246 [email protected]
Bruce H. Pugesek Research Statistician U.S. Geological Survey 1648 S. 7th St.Montana State UniversityForest Science Lab Bozeman, MT 59717 406-994-6144 [email protected]
Vivian R. Queija Geographer U.S. Geological Survey 909 1st Ave., Suite 800 Seattle, WA 98104 206-220-4565 [email protected]
Kenneth G. Rice Section Leader U.S. Geological Survey 7920 NW 71 St.Gainesville, FL 32653 352-264-3544 [email protected]

62 Proceedings of the Second All-USGS Modeling Conference, February 11-14, 2008
Susan Russell-Robinson Associate Program Coordinator U.S. Geological Survey National Center, MS 915-B 12201 Sunrise Valley Dr. Reston, VA 20192 703-648-6682 [email protected]
Roger G. Sayre Senior Scientist U.S. Geological Survey National Center, MS 519Reston, VA 20192 703-648-4529 [email protected]
Travis S. Schmidt Mendenhall Fellow/Research EcologistU.S. Geological Survey Box 25046Denver Federal Center, MS 973 Denver, CO 80225 970-226-9470 [email protected]
Robin Schrock Assistant Program Coordinator U.S. Geological Survey National Center, MS 30112201 Sunrise Valley Dr.Reston, VA 20192 703-648-4066 [email protected]
Craig Seaver Alabama Geospatial Liaison U.S. Geological Survey 75 AUM TechnaCenter Dr. Montgomery, AL 36117 334-395-4129 [email protected]
Darius J. Semmens U.S. Geological Survey Rocky Mountain Geographical Science Center Box 25046Denver Federal Center, MS 516 Denver, CO 80225 303-202-4331 [email protected]
Gabriel B. Senay Principal Scientist U.S. Geological Survey 47914 252nd St. Sioux Falls, SD 57198 605-594-2758 [email protected]
Mark SherfyU.S. Geological Survey Northern Prairie Wildlife Research
Center8711 37th St. SEJamestown, ND [email protected]
Christopher R. Sherwood Oceanographer U.S. Geological Survey USGS Woods Hole Science Center 384 Woods Hole Rd. Woods Hole, MA 02543 [email protected]
Frank S. Shipley Discipline Coordinator for Biology U.S. Geological Survey 909 First Ave., 8th Floor Seattle, WA 98104 206-220-4600 [email protected]
Karen Siderelis U.S. Geological SurveyNational Center, MS 108 12201 Sunrise Valley Dr. Reston, VA 20192 703-648-5747 [email protected]
Daniel H. Slone Research Ecologist U.S. Geological Survey 2201 NW 40th Terr. Gainesville, FL 32605 352-264-3551 [email protected]
Jonathan H. Smith Program Coordinator, Geographic Analysis and MonitoringU.S. Geological Survey National Center, MS 51912201 Sunrise Valley Dr. Reston, VA 20192 703-648-4516
Gregory J. Smith Director U.S. Geological Survey 700 Cajundome Blvd. Lafayette, LA 70506 337-266-8501 [email protected]
Stan Smith Sr. Data Modeler U.S. Geological Survey 4230 University Dr., Suite 201 Anchorage, AK 99508 907-786-7072 [email protected]
Terry L. Sohl U.S. Geological Survey - SAIC USGS EROS Data Center Sioux Falls, SD 57198 605-594-6537 [email protected]
Brad Stith ASci / U. S. Geological Survey 2201 NW 40 Terr. Gainesville, FL 32605 352-264-3556 [email protected]
Eric W. Strom Director, South Carolina Water Science CenterU.S. Geological Survey 720 Gracern Rd., Suite 129 Columbia, SC 29210 803-750-6109 [email protected]
Eric T. Sundquist Research Geologist U.S. Geological Survey 384 Woods Hole Rd. Woods Hole, MA 02543 508-457-2397 [email protected]

Appendix II. List of Conference Participants 63
Eric D. Swain Research Hydrologist U.S. Geological Survey 3110 SW 9th Ave. Ft. Lauderdale, FL 33315 954-377-5925 [email protected]
Adam Terando Geographer/Modeler Southeast Gap Analysis Program 216 David Clark LabsNorth Carolina State University Department of ZoologyCampus Box 7617 Raleigh, NC 27695-7617 919-513-7292 [email protected]
Kathryn A. Thomas Ecologist U.S. Geological Survey 115 Biological Sciences East Sonoran Desert Research Station University of Arizona Tucson, AZ 85721 520-670-5534 [email protected]
Larry L. Tieszen Project Manager U.S. Geological Survey Mundt Federal Building Sioux Falls, SD 57198 605-594-6056 [email protected]
Alicia Torregrosa Physical Scientist U.S. Geological Survey MS 531345 Middlefield Rd. Menlo Park, CA 94025 650-329-4091 [email protected]
Maurice Treece Hydrologist U.S. Geological Survey 75 AUM TechnaCenter Dr. Montgomery, AL 36117334-395-4126 [email protected]
Michael J. Turco Chief - USGS TX-WSC Gulf Coast Program OfficeU.S. Geological Survey 19241 David Memorial Dr., Suite 180 The Woodlands, TX 77385 936-271-5300 [email protected]
Christine E. Turner Geologist U.S. Geological Survey Denver Federal Center, MS 939 Box 25046 Denver, CO 80225 303-236-1561 [email protected]
E. Lynn Usery Research Geographer U.S. Geological Survey 1400 Independence Rd. Rolla, MO 65401 573-308-3837 [email protected]
Beatrice Van Horne Ecosystem Program Coordinator U.S. Geological Survey 1829 Elgin Dr. Vienna, VA 22182 703-938-1686 [email protected]
Dalia E. Varanka Research Geographer U.S. Geological Survey 1400 Independence Rd. Rolla, MO 65401 573-308-3897 [email protected]
Roland Viger U.S. Geological Survey Box 25046Denver Federal Center, MS 412 Denver, CO 80225 303-236-5030 [email protected]
Hardin Waddle Research Ecologist U.S. Geological Survey 700 Cajundome Blvd. Lafayette, LA 70506 337-266-8671 [email protected]
Terry Waddle U.S. Geological Survey 2150 Centre Ave., Bldg. C Fort Collins, CO 80526 970-226-9386 [email protected]
Michael G. Waldon Hydrologist U.S. Fish and Wildlife Service ARM Loxahatchee National Wildlife Refuge 646 Cajundome Blvd., Suite 400 Lafayette, LA 70506337-291-3133 [email protected]
John F. Walker Research Hydrologist U.S. Geological Survey 8505 Research Way Middleton, WI 53562 608-821-3853 [email protected]
Hongqing Wang Assistant Professor Research University of Louisiana at Lafayette 249 Ivory St. Lafayette, LA 70506 850-443-7870 [email protected]
Jess D. Weaver Regional Executive U.S. Geological Survey 3850 Holcomb Bridge Rd. Suite 160 Norcross, GA 30092 770-409-7701 [email protected]
Richard Webb Research Hydrologist U.S. Geological Survey Box 25046 Denver Federal Center, MS 413 Denver, CO 802215 303-236-5025 [email protected]

64 Proceedings of the Second All-USGS Modeling Conference, February 11-14, 2008
Jake F. Weltzin Executive Director U.S. Geological Survey USA-NPN National Coordinating
Office1955 East 6th St.Tucson, AZ 85705 520-626-3821 [email protected]
Emily Wheeler Graduate Student University of Illinois at
Urbana-Champaign1604 S. Vine St.Urbana, IL 61801 217-390-6401 [email protected]
Helen Whiffen Geographer U.S. Geological Survey 2524 S Frontage Rd., Suite C Vicksburg, MS 39180 601-629-6610 [email protected]
Mark L. Wildhaber Research Ecologist U.S. Geological Survey 4200 New Haven Rd. Columbia, MO 65201 573-876-1847 [email protected]
K. Van Wilson Hydrologist, P.E. U.S. Geological Survey 308 South Airport Rd. Jackson, MS 39208 601-933-2922 [email protected]
Scott WilsonU.S. Geological Survey700 Cajundome Blvd.Lafayette, LA [email protected]
Robert A. Winfree Science Advisor National Park Service 240 West 5th Ave., Suite 521 Anchorage, AK 99501-2327 907-644-3516 [email protected]
John A. Young Research Biologist (Biogeography) U.S. Geological Survey 11649 Leetown Rd. Kearneysville, WV 25430 304-724-4469 [email protected]
Ronald B. Zelt Associate Director for NAWQA U.S. Geological Survey USGS Nebraska Water Science Center 5231 South 19th St. Lincoln, NE 68521 402-328-4140 [email protected]

Appendix III. Acronyms 65
Appendix III. Acronyms
2-D two-dimensional
3-D three-dimensional
4-D four-dimensional
ADCP Acoustic Doppler Current Profiler
AIBI Alternate Index of Biotic Integrity
AICc Akaike Information Criterion (second order biased corrected)
AMLI Abandoned Mine Lands Initiative
ANN artificial neural network
ArcGIS Arc Geographic Information System
ASCII American Standard Code for Information Interchange
ATLSS Across Trophic Levels System Simulation
BASINS Better Assessment Science Integrating Point and Nonpoint Sources
BCNP Big Cypress National Preserve
BCR Bird Conservation Region
BDRW San Francisco Bay–Delta River Watershed
BE bare earth
BIA Bureau of Indian Affairs
BLM Bureau of Land Management
BN Bayesian network
BRD Biological Resources Discipline
CANERM Canadian Emergency Response Model
CBLCM Chesapeake Bay Land-Change Model
CERP Comprehensive Everglades Restoration Plan
CH canopy height
CIDR Commercial Remote Sensing Space Policy (CRSSP) Imagery-Derived Requirements tool
CIR color infrared
CMF Completely Mixed Flow
COOP Cooperative Observer Program [National Weather Service]
CRMS Coastwide Reference Monitoring System
CRR canopy-reflection ratio
CRSSP Commercial Remote Sensing Space Policy
CRU Climate Research Unit
CSTM Community Sediment-Transport Modeling project
DA decision analysis
DEFS Deschutes Estuary Feasibility Study
DEM digital elevation model

66 Proceedings of the Second All-USGS Modeling Conference, February 11-14, 2008
DEVS Discrete Event System Specifications
DHI Danish Hydraulic Institute
DNA deoxyribonucleic acid
DRAGON Delta Research and Global Observation Network
DST decision support tool
EAARL Experimental Advanced Airborne Research Lidar
EC-LUE eddy covariance-light use efficiency
EDCM Erosion Deposition Carbon Model
EDEN Everglades Depth Estimation Network
EdGCM Education Global Climate Modeling
EDNA Elevation Derivatives for National Application
EFC environmental flow component
ENFA Ecological Niche Factor Analysis
ENP Everglades National Park
EPA U.S. Environmental Protection Agency
EPM Ecosystem Portfolio Model
EROS Center for Earth Resources Observation and Science
ESA Endangered Species Act
ESM environmental simulation model
ET evapotranspiration
FAO Food and Agriculture Organization [United Nations]
FAO-MCE Food and Agriculture Organization multicriteria evaluation
FORE-SCE Forecasting Scenarios model
FPI Fire Potential Index
FRAME Framing Research in Support of the Adaptive Management of Ecosystems
FTLOADDS Flow and Transport in a Linked Overland/Aquifer Density-Dependent System
FTP File Transfer Protocol
FWS U.S. Fish and Wildlife Service
GAP Gap Analysis Program
GARCH generalized autoregressive conditional heteroskedasticity
GCM general circulation model or global circulation model or global climate model
GDAS Global Data Assimilation System
GEFISH Greater Everglades Fish
GEMS General Ensemble Biogeochemical Modeling System
GEOSS Global Earth Observation System of Systems
GIS geographic information system
GPP gross primary production
GPS global positioning system
GSFLOW Ground-Water and Surface-Water Flow model
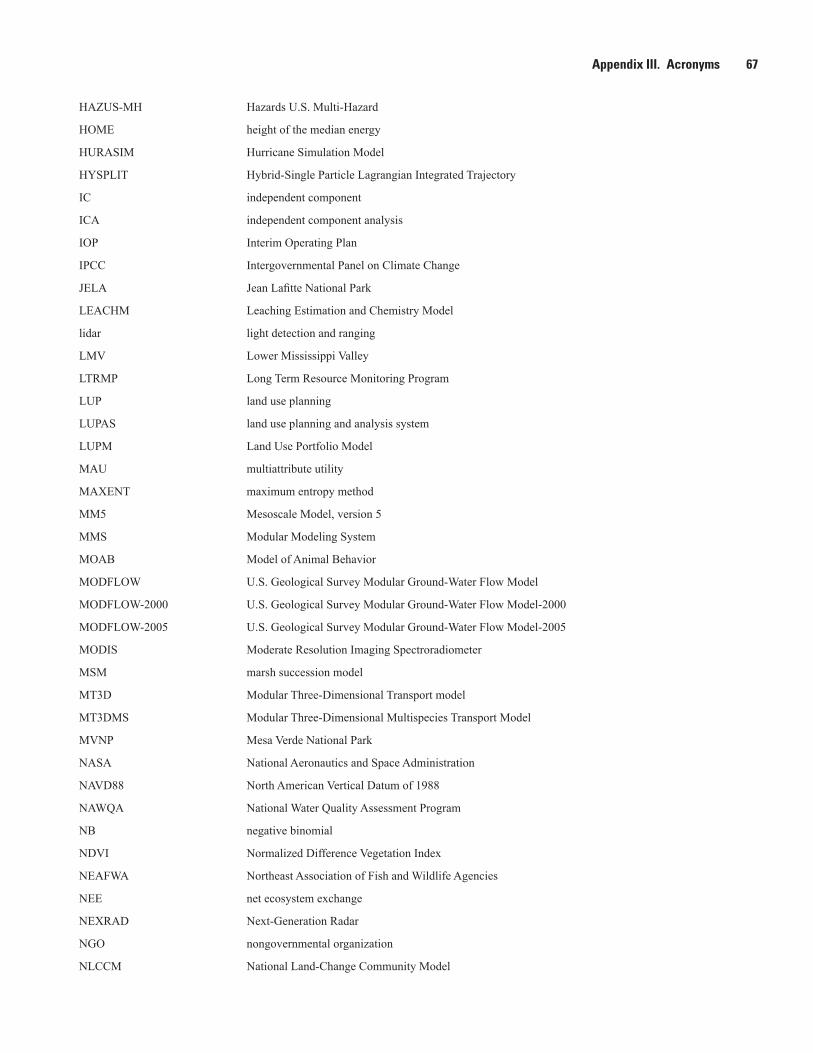
Appendix III. Acronyms 67
HAZUS-MH Hazards U.S. Multi-Hazard
HOME height of the median energy
HURASIM Hurricane Simulation Model
HYSPLIT Hybrid-Single Particle Lagrangian Integrated Trajectory
IC independent component
ICA independent component analysis
IOP Interim Operating Plan
IPCC Intergovernmental Panel on Climate Change
JELA Jean Lafitte National Park
LEACHM Leaching Estimation and Chemistry Model
lidar light detection and ranging
LMV Lower Mississippi Valley
LTRMP Long Term Resource Monitoring Program
LUP land use planning
LUPAS land use planning and analysis system
LUPM Land Use Portfolio Model
MAU multiattribute utility
MAXENT maximum entropy method
MM5 Mesoscale Model, version 5
MMS Modular Modeling System
MOAB Model of Animal Behavior
MODFLOW U.S. Geological Survey Modular Ground-Water Flow Model
MODFLOW-2000 U.S. Geological Survey Modular Ground-Water Flow Model-2000
MODFLOW-2005 U.S. Geological Survey Modular Ground-Water Flow Model-2005
MODIS Moderate Resolution Imaging Spectroradiometer
MSM marsh succession model
MT3D Modular Three-Dimensional Transport model
MT3DMS Modular Three-Dimensional Multispecies Transport Model
MVNP Mesa Verde National Park
NASA National Aeronautics and Space Administration
NAVD88 North American Vertical Datum of 1988
NAWQA National Water Quality Assessment Program
NB negative binomial
NDVI Normalized Difference Vegetation Index
NEAFWA Northeast Association of Fish and Wildlife Agencies
NEE net ecosystem exchange
NEXRAD Next-Generation Radar
NGO nongovernmental organization
NLCCM National Land-Change Community Model

68 Proceedings of the Second All-USGS Modeling Conference, February 11-14, 2008
NPN National Phenology Network
NPP net primary production
NPS National Park Service
NRI National Resources Inventory
NSM Natural Systems Model
NWIS National Water Information System
NWRC National Wetlands Research Center
NWS National Weather Service
OTEC Ocean Thermal Energy Conversion model
OTIS One-Dimensional Transport with Inflow and Storage model
PC principal component
PCA principal component analysis
PEST Parameter Estimation code
PLUP participatory land use planning
PNN probabilistic neural network
PRISM Parameter-Elevation Regressions on Independent Slopes Model
PRMS Precipitation Runoff Modeling System
PS-ILM Puget Sound Integrated Landscape Monitoring project
PUFF Puff Dispersion Model
PWR Piecewise Regression model
Re ecosystem respiration
RECOVER Restoration Coordination and Verification
RHESSys Regional Hydro-Ecological Simulation System
ROMS Regional Oceanographic Modeling System
RPM rapid prototype model
RSF resource selection function
RWQM Refuge Water Quality Model
SAR synthetic aperture radar
SDM species distribution model
SELVA Spatially Explicit Landscape Vegetation Analysis
SELVA-MANGRO Spatially Explicit Landscape Vegetation Analysis-Mangrove model
SEM structural equation modeling
SEnKF Smoothed Ensemble Kalman Filter
SFWMD South Florida Water Management District
SFWMM South Florida Water Management Model
SHC Strategic Habitat Conservation
SICS Southern Inland and Coastal System
SIMPPLLE Simulating Patterns and Processes at Landscape Scales
SLEUTH Slope, Land cover, Exclusions, Urban Areas, Transportation Hydrologic model

Appendix III. Acronyms 69
SLRRP Sea-Level Rise Rectification Program
SOC soil organic carbon
SPARROW Spatially Referenced Regressions On Watershed Attributes model
SQL Structured Query Language
SRES-A1B Special Report on Emissions Scenarios -A1B
SSEB simplified surface energy balance
SWARM Seismic Wave Analysis and Real-time Monitor
SWFL Southwestern Willow Flycatcher
SWIFT2D Surface Water Integrated Flow and Transport in 2-Dimensions
TIME Tides and Inflows in the Mangroves of the Everglades model
TM Thematic Mapper [Landsat]
TSPROC time-series processing
USFS U.S. Forest Service
USGS U.S. Geological Survey
VAAC Volcano Ash Advisory Center
VALVE Volcano Analysis Visualization Environment
VegET vegetation evapotranspiration
VHP Volcano Hazards Program
VR virtual reality
WASP Water Quality Analysis Simulation Program
WASP (EPA) Water Quality Analysis Simulation Program (Environmental Protection Agency)
WB water balance
WEBB Water, Energy and Biogeochemical Budgets program
WRD Water Resources Discipline
XML Extensible Markup Language

Printed on recycled paper
Brady, ed.—Proceedings of the Second A
ll-USG
S Modeling Conference, February 11–14, 2008—
Scientific Investigations Report 2009–5013