Embed Size (px)
Citation preview

22 Haskell Street, Cambridge, MA 02140 Phone: (617) 497-7544 Fax: (617) 497-7543
www.nexusmarketresearch.com
Process and Impact Evaluation of the
Efficiency Maine Lighting Program
Submitted to: Efficiency Maine
Submitted by: Nexus Market Research, Inc.
RLW Analytics, Inc.
April 10, 2007

Process and Impact Evaluation of the Efficiency Maine Residential Lighting Program
Table of Contents
1. Executive Summary ................................................................................................................ 1
1.1. Scope of Work ................................................................................................................ 1 1.2. Process Evaluation Findings ........................................................................................... 2 1.3 Impact Evaluation Findings. ......................................................................................... 10
2. Program Description and Tracking Summary ...................................................................... 19
2.1. Program Description ..................................................................................................... 19 2.2. Program Tracking Summary......................................................................................... 20
3. Methodology......................................................................................................................... 21
3.1. Staff and Retailer Interviews ........................................................................................ 21 3.2. Customer Telephone Surveys ....................................................................................... 22
Coupon Participant Surveys.................................................................................. 22 General Population Survey ................................................................................... 24 Sampling Error...................................................................................................... 25
3.3. On-Site Visits................................................................................................................ 25 On-Site Recruitment ............................................................................................. 26 On-Site Visit Data Collection ............................................................................... 26 Lighting Analysis Methodology ........................................................................... 27
4. Process Evaluation ................................................................................................................ 30
4.1. Program Development, Goals, and Design................................................................... 30 Program Responsibilities and Communication..................................................... 31 Program Goals and Indicators............................................................................... 32 Program Design .................................................................................................... 33
4.2 Participation, Outreach, and Marketing ............................................................................. 35 Outreach................................................................................................................ 36 Marketing.............................................................................................................. 37
4.2. Program Delivery and Impacts ..................................................................................... 40 4.3. Staff and Retailer Program Assessment........................................................................ 47 4.4. Customer Knowledge, Purchases, Satisfaction, and Demographics............................. 50
Awareness, Participation, and Overall Sales ........................................................ 50 Bulb Purchases...................................................................................................... 53 Knowledge of CFL Bulbs ..................................................................................... 54 Reasons for Purchasing and Not Purchasing CFLs .............................................. 58 Customer Demand ................................................................................................ 59 Customer Satisfaction ........................................................................................... 60 Consumer Experiences with CFL Fixtures ........................................................... 61 Customer Demographics....................................................................................... 67
Nexus Market Research

Process and Impact Evaluation of the Efficiency Maine Residential Lighting Program
Table of Contents (continued)
5. Impact Evaluation ................................................................................................................. 81
5.1. Telephone Survey Findings .......................................................................................... 81 Purchases, Installation, Removals, and Failure to Install ..................................... 81 Intended use of the Products ................................................................................. 86 Wattage Replaced ................................................................................................. 89 Comparative Usage............................................................................................... 92 Hours of Use ......................................................................................................... 96
5.2. On-Site Survey Findings............................................................................................. 101 5.3. Adjustment of Telephone Survey Results using On-Site Results............................... 107 5.4. Impact Results............................................................................................................. 108
Gross Program Energy Savings .......................................................................... 108 Net Program Energy Savings.............................................................................. 109
5.5. Comparison to Other Studies ...................................................................................... 114 5.6. Assessment of Measure Life....................................................................................... 117
6. Reference List ..................................................................................................................... 119
Nexus Market Research

Process and Impact Evaluation of the Efficiency Maine Lighting Program Page 1
1. Executive Summary This report presents the results of the process and impact evaluation of the Efficiency Maine (EM) Residential Lighting Program (RLP).
1.1. Scope of Work Process Evaluation. The process evaluation relies on several different research tasks, including interviews conducted with program staff, participating retailers, non-participating retailers, and residential customers.
! A total of six interviews were conducted with program staff covering a variety of program-related topics including design, marketing, and delivery.
! Interviews were conducted with ten employees from retail stores participating in the program.
! A total of six brief interviews were completed with employees at retail stores that are not participating in the program.
! Three distinct customer telephone surveys were conducted with Maine residents: a survey of recent coupon participants, past bulb coupon participants, and a general population survey targeted at markdown purchasers.
Impact Evaluation. The primary goal of this research is to provide Efficiency Maine with estimates of the impacts of the residential lighting program, including in-service rates, hours of use, wattage reduction, free-ridership, participant spillover, and measure life. The impact evaluation integrates data and findings from a variety of evaluation activities, including the following:
! Three distinct telephone surveys were conducted with Maine residents, including: ! 170 surveys with Recent Coupon Participants, who purchased a lighting product
through the coupon program after November 2005 ! 70 surveys with Past Bulb Coupon Participants, who purchased a bulb through the
coupon program prior to November 2005 ! 199 surveys with the general population of customers, including 54 survey with self-
reported purchasers of Markdown bulbs ! On-site surveys using lighting loggers at the homes of 25 participating customers who
purchased bulbs through the 2005-2006 coupon program. ! Engineering estimates of energy and demand savings attributable to the program based on
data collected through the on-site surveys. ! A comparison of key results from a selection of past lighting studies. ! An assessment of the measure lives of energy-efficient lighting products.
Nexus Market Research

Process and Impact Evaluation of the Efficiency Maine Lighting Program Page 2
1.2. Process Evaluation Findings This section provides a summary of the results of the process evaluation, and recommendations that Efficiency Maine may consider for possible program changes. Program staff and participating retailers all believe that the RLP works exceptionally well and are satisfied with the program. Most staff cite the tremendous increase in coupon sales over the past year as a key indicator of its success, while other reasons mentioned include the cost-effective program design, the promotion of Efficiency Maine and ENERGY STAR, the flexibility of the program to adapt to changes in the market, and the consistent statewide service. Participating retailers primarily cite the increase in sales volume at their own stores over the past few years, but also mention the simplicity of the instant coupons. In addition, nearly all customers are satisfied with the products they purchased through the program. Program Goals. Most staff members agree that the goals of the program are to transform the lighting market toward energy efficiency, rather than achieving any specific levels of energy savings or sales volume. Staff believes that the program introduces Efficiency Maine to people, works with retailers to provide a wide selection of CFLs, and educates people regarding the benefits of CFLs. This is expected to lead to CFLs replacing incandescents as the default choice for lighting, according to one staff member. While there are no established annual targets for the program, one goal mentioned by several staff members was installing an average of six CFLs per household in Maine. Some staff members believe that the program should continue its holistic approach, and work toward overall goals, without specific numbers. As the program matures, they believe that opportunities will naturally arise and having the flexibility to pursue them is important. However, other staff members would like to see EM more involved in establishing goals for the program, such as volume of products, kWh savings, cost-effectiveness, number of stores participating, and the reach of public relations and advertising. One staffer notes that establishing targets in such a rapidly developing market is a challenge. Program Staffing. With only five people working at Efficiency Maine, several program staff members believe that EM itself is short-staffed, though it is unclear how this directly affects the lighting program. In addition, several staffers believe that additional field representatives may be warranted in the event of a program expansion, as the three current representatives are handling as many stores as they can. Outreach to Retailers. Most program staff members believe that the current level of involvement by retailers is sufficient; given the variety of products offered by these retailers, CFLs garner a reasonable amount of shelf space and support. Retailers are now more educated regarding CFLs, though some are more active in promotion than others. Some staff members cite the diversity of retailers involved in the program as a strength - including hardware, supermarkets, home improvement, and discount retailers. In particular, two staffers believe that recruiting Wal-Mart to participate in the program is a big “feather in our cap” as Maine is one of
Nexus Market Research

Process and Impact Evaluation of the Efficiency Maine Lighting Program Page 3
the first states where Wal-Mart participates in a lighting program.1 However, one staff member cautions that the program may soon reach a ceiling in terms of store enrollment, because a large majority of stores are already participating. All participating retailers report being satisfied with their field representatives. They report that the representatives provide “excellent service,” inform them of new products, market news, and promotions, and are always available to answer questions. One respondent says that his representative is “enthusiastic, knows his stuff, always answers our questions, and makes sure we have the right products and coupons.” Another retailer mentions that their representative “suggested we carry other models that have sold well.” Marketing. Most program staffers believe that the marketing and advertising strategies are creative and eye-catching. Several staffers mention the large media buy that occurred last year as being particularly successful. However, one staffer thinks that it would be valuable to conduct a critical analysis of the overall marketing strategy, especially whether TV advertising is an appropriate venue for the program. Another member questions the value of mass market advertising when the majority of bulb purchase decisions are made inside the store, noting that point-of-purchase (POP) materials, especially endcap displays, serve as in-store advertising. In comparison, the sponsors of the Massachusetts lighting program generally rely on bill stuffers, circulars, websites, and word-of-mouth to market the program.2 Selected staff suggestions for marketing include the following:
! Conduct cross-promotions with participants from the business program, such as sales of CFLs to employees in the cafeteria of a business that underwent a lighting change. This approach, as well as other cross-program opportunities, may provide an effective venue to jointly promote lighting and possibly reach a new group of customers.
! Do more localized advertising, as most advertising have been statewide to this point. ! One staffer mentions that the program has done little in conjunction with the Change A
Light, Change the World campaign, other than issuing press releases. This campaign presents an opportunity to take advantage of national efforts in order to promote the program during the fall lighting season.
! Provide a free energy column to newspapers and publications. Point-of-Purchase Materials. Most staffers believe that POP materials are eye-catching and educational. One staffer mentions that the POP materials were becoming stale after three years in the field, and the program team has worked for the last six months to revise the materials in order to maintain a fresh look. All ten participating retailers are ‘satisfied’ with the program POP materials - they say the materials are up-to-date, attractive, and work well.
1 Wal-Mart also participates with Pacific Gas & Electric, for example, and is on the verge of cooperating with a wide range of lighting programs as part of their national CFL Initiative. 2 Market Progress and Evaluation Report for the 2005 Massachusetts ENERGY STAR® Lighting Program. NMR, 2006. Submitted to Cape Light Compact, Massachusetts Electric Company, Nantucket Electric Company, NSTAR Electric, Western Massachusetts Electric Company, Unitil
Nexus Market Research

Process and Impact Evaluation of the Efficiency Maine Lighting Program Page 4
Cooperative Advertising. Several staffers note the lack of uptake for the cooperative advertising, which is typically offered to stores in which it can impact CFL advertising practices. Some chains (including Aubuchon and True Value) are already placing CFL ads into their monthly flyers, so one staffer believes there is no reason to offer them cooperative advertising. In addition, most chain and cooperative stores coordinate their advertising at the regional level, so placing ads solely for Maine poses a challenge. In contrast, at the local chains and independent stores, the management often does not have the expertise or time to write their own advertising materials. Lastly, the cooperative program can be a cumbersome process – the advertising must include the EM logo and disclaimer. Only one retailer participated in the cooperative advertising initiative; he was very satisfied with it and reported “no problems.” Product Mix. Most program staff appear cautious regarding the issue of whether and how many resources to devote to specialty bulbs, such as three-way and dimmable models. Most staff members note that technical problems still exist with some of the specialty models, according to the PEARL test results and anecdotal evidence. In addition, several staff members note that the vast majority of CFL bulbs sold are the 15 Watt spiral models at the 2700K temperature. So these staffers question the value of emphasizing specialty bulbs that comprise a small portion of the market. However, a few staffers do believe that specialty bulbs are worth promoting and suggest that scaled markdown incentives for specialty models might be successful. Most participating retailers believe that the current mix of products is appropriate; however, two respondents mention that customers do ask for three-way models. Fixtures. Almost all program staff members believe that the current fixture approach is not working well, and that the program is merely offering fixtures now but not emphasizing them. Several staffers believe that attractive styles and good quality fixtures are not available yet, and others mention that fixtures sales have been stagnant nationwide. Staffers mention that other lighting programs are encountering similar issues and one staffer believes that, in other states, fixtures have sold in large quantities only when low-end fixtures were almost “given away.” Several participating retailers believe that customers purchase the CFL fixtures due to the $12 coupon itself, rather than the energy savings. These retailers have seen little increase in fixture sales over the past few years, and do not expect that customer demand will increase in the future. Several staff members doubt that the program should devote significant resources to fixtures. As one staffer questioned, “is it cost effective to offer $12 per fixture and $2 per bulb package?” Several mention that focus group research (conducted in Maine) found that some customers equate pin-based fixtures to “Betamax” technology and thus are reluctant to invest in a purchase. However, two staff members mention that the new GU-24 fixture specification may help boost fixture sales. Others note that it is much more difficult to persuade people to replace fixtures than bulbs, and that replacement pin-based bulbs are difficult to find in retail stores. One staffer believes that the concern about customers unscrewing CFL bulbs is not justified, as people generally don’t unscrew bulbs if they are satisfied. Staff members suggest a variety of options for promoting fixtures. Several staffers suggest that the program should encourage lighting showrooms to stock a diverse array of stylish CFL models, possibly through offering salesperson incentives. However, another staffer notes that there are few showrooms in Maine and that the home improvement centers serve as the major
Nexus Market Research

Process and Impact Evaluation of the Efficiency Maine Lighting Program Page 5
supply network for fixtures. A few staffers suggest that the program educate builders and remodelers in order to influence the remodeling and new construction market. However, other staffers note that the new construction market in Maine is relatively small; thus there are few large builders to partner with. In addition, most homes are custom-designed (as opposed to spec-built) where the homeowner or decorator selects the fixtures, and not the builder. Coupon vs. Markdown Strategies. Most staffers believe that the current mix of resources allocated to coupon and markdown approaches is reasonable. Neither strategy works in all situations because some stores prefer the coupons, while others (e.g., supermarkets) prefer the markdowns; thus the program should use its opportunities wisely. While markdowns are more cost-effective, they do not provide customer data; in contrast, the coupons provide the opportunities for stores and customers from across the state to participate. One staffer notes that markdowns tend to exhaust funding more quickly than coupons do, which could lead to budget issues even though it may maximize overall sales. Thus, the current approach of offering year-round coupons supplemented by selected markdown events seems reasonable. Program Impacts. All ten participating retailers report that they now stock more CFL bulbs than before they participated in the program. A few stores had not carried CFLs until joining the program, and a few more have seen a moderate increase in stocking – roughly 10% – while one has quadrupled the shelf space devoted to CFLs. Two retailers report that they can “hardly keep up” with stocking the bulbs while a few respondents note that CFLs now garner endcap displays. All ten participating retailers also report that the program has boosted their sales of CFL bulbs, to varying degrees. Two respondents say their sales have increased “ten-fold” and others report the impact has been “tremendous” and “enormous.” A few mention a more moderate increase – one says about 10%-20%. Another reports that before the program they were not selling CFLs, but now sales have shifted from incandescents to CFLs. At five Aubuchon hardware stores in Maine where sales data were available prior to program initiation, sales of CFLs increased from 134 in 2001 to nearly 33,000 in 2006. However, note that this increase occurred during a period when national sales of CFLs have increased as well—albeit a 1,200% increase nationally compared to a 24,600% increase in Maine Aubuchon stores. Compared to bulbs, sales of fixtures at the Aubuchon stores increased less drastically - from 26 in 2001 to 259 in 2006. Customer Demographics. According to the general population survey, 85% of all residents are familiar with CFL bulbs and 59% have purchased CFL bulbs. Approximately 25% of customers have purchased a CFL bulb using the coupon program, and an estimated 8% have purchased through the markdown program. Compared to the general population in Maine, coupon participants are more likely to own their own homes, live in single-family homes, and have larger sized households. In addition, coupon participants tend to be better educated and earn higher incomes than Maine residents as a whole. While the markdown purchasers also exhibit some of these same characteristics, they tend to more closely mirror the general population. In addition, it appears that the markdown program is attracting a larger share of new customers to purchase CFLs, as only 20% of markdown
Nexus Market Research

Process and Impact Evaluation of the Efficiency Maine Lighting Program Page 6
purchasers report having purchased CFLs prior to their markdown purchase. In comparison, this figure was 41% for bulb coupon participants and 50%-65% for fixture coupon participants. In addition, two-thirds of markdown purchasers have become familiar with CFLs within the past two years, much higher than the 25%-30% figure cited by coupon participants. These results suggest that the markdown program is attracting new customers from a somewhat different demographic group to purchase CFLs, Customers who have never purchased a CFL represent an estimated 41% of all households and are more likely than purchasers to be female, lower-income, and less educated. In addition, they most often cite the higher cost of CFLs as the reason for not purchasing, though about one-half may consider purchasing CFLs within the next year. Elimination of Coupons. Most participating retailers believe that sales of CFL bulbs would decrease if the coupons were discontinued and replaced with POP materials and cooperative promotions. Some believe that sales would decline from “a little bit” or “not significantly,” while others would expect declines of 20% to 50%. In addition, several retailers expect that repeat buyers would continue to purchase CFLs but that new customers would be less likely to try them out for the first time. Two respondents say that the price difference between CFLs and incandescents would impact how much their sales decline. Program Expansion. Most staff members believe that the program should expand into other opportunities beyond bulbs. One believes that it is a missed opportunity not to promote other ENERGY STAR products, having already established relationships with retailers. Suggestions include programs for: ENERGY STAR appliances, ENERGY STAR homes, and refrigerator pick-up. One benefit of the ENERGY STAR homes program would be to better address the new construction market for lighting, as well as other efficient products. Others suggest broadening the program to cover other fuels in order to provide more comprehensive energy services. Recommendations. Based on the above findings, we make the following recommendations for the Efficiency Maine Residential Lighting Program.
! Consider establishing annual program targets for the volume of products, kWh savings, and cost-effectiveness in order to measure program performance. Several staff members suggest this change, although others recommended against setting firm targets. However, flexible targets can be developed that allow for the program to continue taking advantage of market opportunities as they arise. While cost-effectiveness is certainly an important goal, an emphasis on this particular outcome could result in resources shifting toward high-volume sales of a small selection of models from larger chain stores. Thus, any goal-setting exercise should consider other important aspects of program delivery, such as offering opportunities for statewide participation by a range of retailers as well as offering a wide selection of models. In addition to establishing annual targets, the program should also consider developing a logic model in order to document the relationship between program activities, outcomes, and goals.
! Maintain only a minimal level of emphasis on fixtures. Program staff provides many
convincing reasons against further emphasizing fixtures, including: little program success
Nexus Market Research

Process and Impact Evaluation of the Efficiency Maine Lighting Program Page 7
with fixtures elsewhere in the U.S., dearth of attractive fixture styles in the market, lack of availability of replacement bulbs, customer aversion to the fixture technology, no clear opportunities for partnership in Maine with lighting showrooms or homebuilders, and the upcoming GU-24 standard. The GU-24 standard establishes a new pin base for replaceable ballasts that will allows easy, one-unit replacement when either the bulb or the ballast fails, and which will be standardized for interchangeability across manufacturers. The standard will introduce a new set of pin-based fixtures and CFLs to the market, overlaying the somewhat complicated array of pin-based fixtures and CFLs that currently exists. Insofar as the GU24 standard is successful, it may undercut the sales potential of energy-saving fixtures that are currently on the market, and make it more difficult for consumers to find replacement bulbs for the fixtures they already have. Moreover, the low penetration level of energy-saving fixtures promoted through the program to some extent reflects low consumer demand, in contrast to the high demand for CFLs. The general population survey found that few customers report sufficient knowledge of fixtures and most have only learned of the technology within the past few years, which is indicative of the lack of customer demand.
! Maintain the statewide, year-round coupon program in order to encourage the
consistent participation of a diverse range of retailers and customers located across the state. Most participating retailers interviewed expect that the elimination of coupons would decrease sales, although there is not a consensus on the extent of such a possible decline. In addition, they expect that few new customers will try CFLs without the coupon. However, if the current $1.50 bulb coupon proves successful, consider further reducing the coupon to $1.00.
! Continue to pursue markdown opportunities where they arise, and expand them if
budgets allow. The markdown promotions are more cost-effective than coupons and thus can maximize sales, although they do not provide customer data and can exhaust funding more quickly. The reason that markdowns exhaust funding, however, is that they are so efficient at moving large volumes of product. Hence, expansion of the markdown approach—a way of moving more product at a lower cost—could be contingent on the program receiving more funding. According to one interviewed retailer who participated in the markdown program, it has been very successful. The general population survey, found that the markdowns attract a different group of customers who more recently learned of CFLs and are less likely to have already purchased CFLs, compared to coupon participants. Program staff mention potential markdown opportunities with Aubuchon, CVS, and a small grocery chain in northern Maine; however, note that not all stores are willing to devote the resources for CFL markdowns or are capable of providing the necessary sales data to participate in markdowns. Of the 738 thousand CFLs incentivized by the EM program in 2006, 26% were sold through the markdown program. In comparison, the Efficiency Vermont lighting program sold 19% of CFLs through a buydown approach during 20043 and the Massachusetts lighting program sold between 93%-95% of its CFLs through a
3 Phase 2 Evaluation of Efficiency Vermont Residential Programs. KEMA, 2005. Prepared for Vermont Department of Public Service.
Nexus Market Research

Process and Impact Evaluation of the Efficiency Maine Lighting Program Page 8
buydown/markdown approach between 2003 and 20054. These data indicate that the EM program could substantially increase its emphasis on markdown promotions, given sufficient funding.
! Consider scaled markdown incentives for specialty models. Most program staffers
appear to be cautious regarding the issue of devoting additional program resources to specialty bulbs, such as three-way and dimmable models. Most staff note that technical problems still exist with some of the specialty models, and that they comprise a small portion of the bulb market. However, a few retailers mentioned that customers do ask for three-way models. One suggestion is to offer higher markdown incentives for selected specialty models that have already passed PEARL or ENERGY STAR testing, in order to ensure quality. However, note that PEARL testing has only been performed on a very small number of models, often those nominated due to perceived quality issues, a new product design, or because they account for a disproportionately high share of sales.
! Consider either expanding or eliminating the cooperative advertising. Program
staffers note the slow uptake on the cooperative advertising funding in its current state, primarily because larger chains coordinate their advertising on a regional basis with long lead times and smaller retailers have neither the time nor the capability to develop their own advertising. If there are opportunities to affect the advertising practices of some key retailers, then increasing the funding limit above $2,000 might attract the larger chains (such as supermarkets) to participate; this may best be done on a case-by-case basis in order to prevent stores that are already advertising CFLs from participating. In addition, the program could also consider a greater cost-share (beyond 50%), offering program assistance in the development of advertising materials, or allowing more than two funding requests per year in order to encourage participation by smaller chains and independent stores. If suitable opportunities are not available or these approaches (or others) are not practical, the program may consider eliminating the service given the current lack of participation.
! Consider expanding the residential programs. Most staff members believe that the
program should expand into other opportunities beyond lighting, such as ENERGY STAR appliances and ENERGY STAR homes. ENERGY STAR appliances appear to be a logical choice given the relationships already established with retailers, some of whom (such as home improvement) also sell appliances. An ENERGY STAR Homes program would provide an avenue boost fixture sales and also integrate appliances, as well as other efficiency measures, into the new construction market. Given the current PUC docket that explores program plans in the case that Efficiency Maine were to receive additional funding, this idea appears to have potential traction. In considering other programs, however, Efficiency Maine should carefully evaluate the possible energy and
4 Market Progress and Evaluation Report for the 2005 Massachusetts ENERGY STAR® Lighting Program. NMR, 2006. Submitted to Cape Light Compact, Massachusetts Electric Company, Nantucket Electric Company, NSTAR Electric, Western Massachusetts Electric Company, Unitil
Nexus Market Research
Process and Impact Evaluation of the Efficiency Maine Lighting Program Page 9
demand savings; the promotion of some appliances, for example, may not be cost effective.
! Consider a program element addressing mercury in CFLs. This program element
would include education about proper storage of burned out CFLs, proper disposal, and the tradeoffs of mercury in CFLs vs. a greater amount of mercury released through production of electricity for incandescents. It could also involve working with cities, towns, and retailers to develop and promote disposal centers. The Maine legislature passed laws in 2006 that regulate the sale and disposal of batteries and thermostats that contain mercury. In addition, more than ten states nationwide have considered legislation that regulates mercury labeling and/or the disposal of CFLs.5 Prior to developing a mercury recycling program, the program should develop baseline data on CFL disposals. However, given the small proportion of survey respondents who report removing CFLs from service, a CFL recycling effort may not be necessary for a few years, when the large number of CFLs recently incentivized through the program reach the end of their useful life.
5 Market Progress and Evaluation Report for the 2005 Massachusetts ENERGY STAR® Lighting Program. NMR, 2006. Submitted to Cape Light Compact, Massachusetts Electric Company, Nantucket Electric Company, NSTAR Electric, Western Massachusetts Electric Company, Unitil
Nexus Market Research

Process and Impact Evaluation of the Efficiency Maine Lighting Program Page 10
1.3. Impact Evaluation Findings This section provides a summary of the results of the impact evaluation, and recommendations that Efficiency Maine may consider for possible program changes. Program Energy Savings. Table 1-1 displays the volume of products, gross lifetime energy savings, Net-to-Gross ratio, net lifetime energy savings, and net lifetime energy savings including planned installations (within the coming year). Gross savings is calculated using the following formula:
Displaced Wattage
* Hours of Use/day
Divided by 1000 watts/kW* Days per Year * In-service rate
Net energy savings is a function of gross energy savings modified by causality and customer use characteristics. Here we define it as a function of the gross energy savings impacted by freeridership and spillover:
Net energy savings = Gross energy savings x (1 + spillover rate – freeridership rate) The Net-to-Gross ratios are all near or above 1.0, primarily because the spillover rate equals or exceeds the freeridership rate, except in the case of exterior fixtures which exhibit high freeridership (40%) but no spillover.
Table 1-1: Lifetime Energy Savings Adjusted for Behavioral Influences
Markdown CFLs
2003 – 2005
Coupon CFLs
2006 Coupon CFLs
Coupon Interior Fixtures
Coupon Exterior Fixtures Total
Volume of Products 199,336 283,591 545,192 26,174 5,920 1,060,213Gross Energy Savings (MWh) 43,057 73,507 129,538 18,041 22,007 302,555 Net-to-Gross ratio (1 + SO – FR) 0.94 1.26 1.10 0.93 0.60 1.07Net Energy Savings (MWh) 40,473 92,619 142,491 16,778 13,204 323,937 Net Energy Savings Including Planned Installations (MWh) 45,099 92,619 149,804 17,552 13,527 337,768
Nexus Market Research

Process and Impact Evaluation of the Efficiency Maine Lighting Program Page 11
Demand Savings. Using the total number of CFLs sold through the program in 2006, the on-site installation rate, and the on-site average displaced wattage, we are able to calculate demand savings with the following formula:
CFL Products sold
in 2006
Divided by 1000
watts/kW= Demand
Savings (kW) * Displaced
Wattage* Installation rate
738,082 * 66.3% * 45.3 / 1000 = 22,167 Winter Peak Demand Factor. Efficiency Maine currently recognizes winter weekday hours between 5pm and 7pm as its winter peak. The weighted winter peak demand factor from the CFLs analyzed on-site is estimated to be 33.6% with a precision of ±11.2% at the 90% confidence level. This means that the installed program CFLs were turned on an average of 33.6% of the time during these hours. Since the lighting logger data gathered in this study were obtained during the winter months we have not calculated a summer demand factor in this report. However, a draft report6 will be available soon that will contain an analysis of residential summer logger data gathered in the New England region for purposes of providing a summer demand factor. Note that this report will also contain a winter demand factor that can be considered for use in lieu of the 33.6% value which has been calculated solely from the lighting loggers from this study. Calculating Coincident Demand Impacts. In order to calculate the winter or summer peak demand reduction due to the program, the following equation can be used:
Connected kW Reduction * Demand Factor * Installation Rate.
The demand savings calculated above already includes the installation rate and has been estimated at 22,167 kW (or 22.1 MW). Therefore, the winter demand reduction in the CFL portion of the program can be calculated as the product of the demand savings (22,167 kW) and the winter demand factor provided above (33.6%); or 7,448 kW.
6 New England State Program Working Group (SPWG), Development of Common Demand Impacts Standards for Energy Efficiency Measures/Programs for the ISO Forward Capacity Market (FCM).
Nexus Market Research

Process and Impact Evaluation of the Efficiency Maine Lighting Program Page 12
In-Service Rate and Hours of Use. Table 1-2 lists the study findings regarding in-service rate and daily hours of use for CFL bulbs, interior fixtures, and exterior fixtures. In addition, the CFL bulb estimates are provided for participants in the Markdown program, those who purchased their products prior to November 2005 through the coupon program (Past Coupon), and those who purchased their products after November 2005 through the coupon program (Recent Coupon). Note that the in-service rate, daily hours of use, and wattage replacement estimates for CFL Bulbs were adjusted based on the results of the onsite visits (see Section 8 for further details). The estimated in-service rates vary from 60% to 72% for CFL bulbs, with the highest rate for Past Coupon participants, who have owned the bulbs longer than other participants and thus had more opportunity to install the bulbs. The fixture participants report in-service rates of 79%-89%. All of these estimates are less than the program assumption of 100%. The daily hours of use estimates for markdown participants (4.8) are substantially higher than the program assumption of 2.7 hours, indicating that these customers may be installing bulbs in higher-use locations. In addition, exterior fixture participants report 6.4 hours, compared to the program assumption of 4.0 hours. Otherwise, the hours of use estimates vary from 2.3 to 3.2 hours, which are similar to the program assumptions. Table 1-2: Comparison of Program Assumptions to Study Findings for In-service
Rate and Daily Hours of Use In-service rate Daily Hours of Use
Product Type Participant Type
Program Assumption
Study Findings
Program Assumption
Study Findings
Markdown 100% 60% 2.7 4.8 Past Coupon 100% 72% 2.7 2.3
CFL Bulb
Recent Coupon 100% 66% 2.7 3.2 Interior Fixture Recent Coupon 100% 79% 2.1 2.4 Exterior Fixture Recent Coupon 100% 89% 4.0 6.4
Nexus Market Research

Process and Impact Evaluation of the Efficiency Maine Lighting Program Page 13
Table 1-3 displays the number and percent of products installed as well those planned to be installed by respondents in the coming year. Note that nearly 11% of markdown bulbs are planned to be installed in the coming year, compared to 5% of recent coupon bulbs; because more recent coupon bulbs are already installed, however, the cumulative installation rate for markdown and recent coupon bulbs should be about the same by the end of the year.
Table 1-3: In-Service Rate plus Planned Installations within Coming Year
Product Type Participant Type
In-service Rate
Planned Installations
Cumulative Installation
rate Markdown 60% 11% 71% Past Coupon 72% n/a 72%
CFL Bulb
Recent Coupon 66% 5% 71% Interior Fixture Recent Coupon 79% 13% 92% Exterior Fixture Recent Coupon 89% 9% 98%
Wattage Replacement and Energy Savings. Table 1-4 displays the program assumptions and study findings for wattage replacement and gross annual energy savings. The CFL wattage sizes were selected because they all had sufficient sample sizes in the onsite study (a minimum of 22 bulbs each). In general, the study found that CFL bulbs usually replace a 60-watt incandescent bulb, regardless of CFL wattage. Note that the per-unit energy savings are greater for exterior fixtures than program assumptions, mostly due to the higher hours of use found in the study.
Table 1-4: Comparison of Program Assumptions to Study Findings for Wattage Replacement and Gross Annual Savings
Wattage Replacement per Product Replaced
Annual Gross Energy Savings per Unit
(kWh) Recent Coupon Product Type Wattage
Program Assumption
Study Findings
Program Assumption
Study Findings
13 52 64 38 39 14 60 60 45 36 15 60 55 44 31 20 75 65 54 35
CFL Bulb
25 100 65 74 31 Interior Fixture 60 69 31 34 Exterior Fixture 120 125 123 186
Nexus Market Research

Process and Impact Evaluation of the Efficiency Maine Lighting Program Page 14
Freeridership and Participant Spillover. Freeridership and participant spillover estimates are derived from the telephone surveys. Freeridership is defined as program purchases that would have been made by participants on their own within three months, in the absence of any incentive from the sponsors. Participant spillover is defined as the proportion of energy-saving lighting products that participants purchased outside the program as a result of having participated in the program. Please note that with a CFL program, non-participant spillover— the measurement of which was beyond the scope of this study—is likely to be equal to or greater than participant spillover. The study found freeridership rates of 20% to 29% for bulbs, 9% for interior fixtures, and a much higher rate for exterior fixtures (40%) (Table 1-5). Note that, for markdown purchasers, the discounted bulbs would not have been available without the program; thus the freeridership estimates for the markdown purchases are potentially less reliable than the freeridership estimates for coupon purchases. Spillover estimates for bulbs range from 23% for Markdown participants, to 30% for Recent Coupon participants, to 46% for Past Coupon participants. Given the longer period of time over which Past Coupon participants have had the opportunity to purchase additional products, it seems reasonable to expect a higher spillover rate for this group. The spillover rate for interior fixtures is estimated at 2% while exterior fixtures were found to have no spillover.
Table 1-5: Comparison of Program Assumptions to Study Findings for Freeridership and Spillover
Freeridership Rate Spillover Rate
Product Type Survey Type Program
Assumption Study
Findings Program
Assumption Study
Findings Markdown n/a 29% n/a 23% Past Coupon n/a n/a n/a 46%
CFL Bulb Recent Coupon n/a 20% n/a 30% Interior Fixture Recent Coupon n/a 9% n/a 2% Exterior Fixture Recent Coupon n/a 40% n/a 0%
Comparison to Other Studies. Table 1-6 compares the in-service rates calculated from the current study to results from similar studies performed in the region over the last several years. Note that these studies evaluated coupon programs, usually over the previous year; thus only the Recent Coupon results from the current study are compared. The following studies were reviewed:
! Impact Evaluation of the Massachusetts, Rhode Island, and Vermont 2003 Residential Lighting Programs.
! The 2002-03 Process and Impact Evaluation of the New Hampshire RLP ! 2000-2001 Northeast Utilities SLC and POP Impact Evaluation ! 1998 Process and Impact Evaluation of Joint Utilities Starlights Residential Lighting
Program.
Nexus Market Research
Process and Impact Evaluation of the Efficiency Maine Lighting Program Page 15
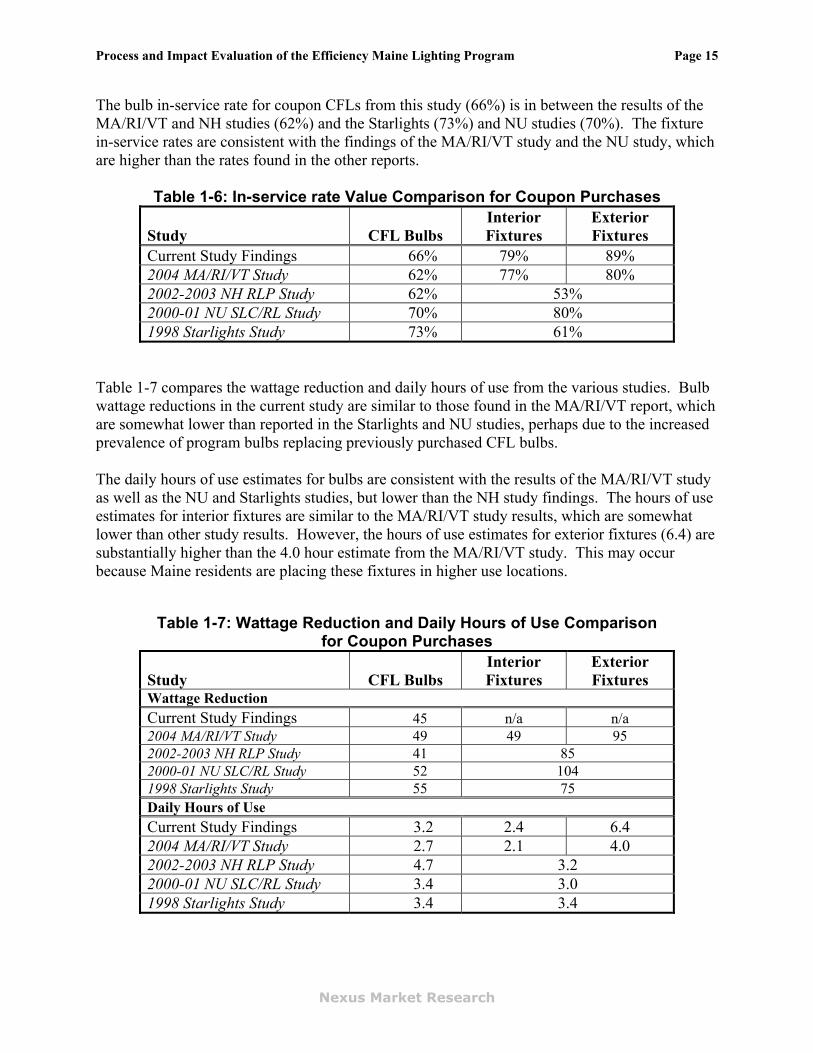
The bulb in-service rate for coupon CFLs from this study (66%) is in between the results of the MA/RI/VT and NH studies (62%) and the Starlights (73%) and NU studies (70%). The fixture in-service rates are consistent with the findings of the MA/RI/VT study and the NU study, which are higher than the rates found in the other reports.
Table 1-6: In-service rate Value Comparison for Coupon Purchases Study CFL Bulbs
Interior Fixtures
Exterior Fixtures
Current Study Findings 66% 79% 89% 2004 MA/RI/VT Study 62% 77% 80% 2002-2003 NH RLP Study 62% 53% 2000-01 NU SLC/RL Study 70% 80% 1998 Starlights Study 73% 61%
Table 1-7 compares the wattage reduction and daily hours of use from the various studies. Bulb wattage reductions in the current study are similar to those found in the MA/RI/VT report, which are somewhat lower than reported in the Starlights and NU studies, perhaps due to the increased prevalence of program bulbs replacing previously purchased CFL bulbs. The daily hours of use estimates for bulbs are consistent with the results of the MA/RI/VT study as well as the NU and Starlights studies, but lower than the NH study findings. The hours of use estimates for interior fixtures are similar to the MA/RI/VT study results, which are somewhat lower than other study results. However, the hours of use estimates for exterior fixtures (6.4) are substantially higher than the 4.0 hour estimate from the MA/RI/VT study. This may occur because Maine residents are placing these fixtures in higher use locations.
Table 1-7: Wattage Reduction and Daily Hours of Use Comparison for Coupon Purchases
Study CFL Bulbs
Interior Fixtures
Exterior Fixtures
Wattage Reduction Current Study Findings 45 n/a n/a 2004 MA/RI/VT Study 49 49 95 2002-2003 NH RLP Study 41 85 2000-01 NU SLC/RL Study 52 104 1998 Starlights Study 55 75 Daily Hours of Use Current Study Findings 3.2 2.4 6.4 2004 MA/RI/VT Study 2.7 2.1 4.0 2002-2003 NH RLP Study 4.7 3.2 2000-01 NU SLC/RL Study 3.4 3.0 1998 Starlights Study 3.4 3.4
Nexus Market Research

Process and Impact Evaluation of the Efficiency Maine Lighting Program Page 16
The freeridership rates for bulbs (20%) and interior fixtures (9%) is similar to those found in other studies (Table 1-8). However, the freeridership estimate for exterior fixtures is substantially higher than rates found in previous studies. The spillover rate for bulbs is higher than found in previous studies, which may be attributed to the widening availability of low-cost CFLs. The estimated spillover rate for fixtures is less than the rates found in other studies.
Table 1-8: Freeridership and Spillover Rate Comparison for Coupon Purchases
Study CFL Bulbs
Interior Fixtures
Exterior Fixtures
Freeridership Rate Current Study Findings 20% 9% 40% 2004 MA/RI/VT Study 11% 10% 15% 2002-2003 NH RLP Study 19% 17% 28% Spillover rate Current Study Findings 30% 2% 0% 2004 MA/RI/VT Study 22% 6% 7% 2002-2003 NH RLP Study 4% 9% 6%
Recommendations. Consider using the estimates of in-service rate, hours of use, wattage reduction, freeridership, and spillover displayed in Table 1-9 for calculating program energy saving impacts. While planned installations of products are important for estimating lifetime savings, we do not recommend including planned installations in estimating annual savings because these installations may depend upon the failure of existing products which would affect the timing of the future installation. All of the impact parameter estimates for fixtures as well as all of the freeridership and spillover rates (regardless of product type) are estimated based solely on the telephone surveys of program participants. The in-service rate and hours of use estimates for the 2006 Coupon CFLs and wattage reduction estimates for all types of CFLs are based solely on the results of the on-site visits. The in-service rate and hours of use estimates for the Markdown and 2003 – 2005 Coupon CFLs are based on the respective telephone survey results as adjusted by the on-site visit results. Note that the in-service rate and daily hours of use estimates for the markdown CFLs are significantly different from the parallel results for the 2006 coupon CFLs. Note that the freeridership and spillover results were not significantly different; the wattage reduction estimates are both derived from the onsite surveys.
Nexus Market Research

Process and Impact Evaluation of the Efficiency Maine Lighting Program Page 17
Table 1-9: Summary of Program Impact Parameter Estimates
Markdown CFLs
2003 – 2005
Coupon CFLs
2006 Coupon CFLs
Coupon Interior Fixtures
Coupon Exterior Fixtures
In-service Rate 60%* 72% 66% 79% 89%Daily Hours of Use 4.8* 2.3 3.2 2.4 6.4 Wattage Reduction 45 45 45 50 89 Freeridership Rate 29% 20% 20% 9% 40%Spillover Rate 23% 46% 30% 2% 0%
* denotes the Markdown results are statistically different from the 2006 Coupon CFL results at the 90% confidence level.
Measure life values can differ by rated lifetime hours. Table 1-10 below presents these values, which are calculated using the formula below; the 1,168 hours per year estimate is based on the on-site surveys – 3.2 hours per day.
Measure Life = Rated Lifetime Hours / Annual Hours of Use (1,168 hours/yr)
Table 1-10: Measure Life Estimates for CFLs Rated Lifetime
Hours Measure
Life (Years) 6,000 5.1 8,000 6.8 10,000 8.6
Due to the fact that there have not been any studies performed to assess CFL measure life, we recommend using 6.8 years as the average life of a CFL for the time being. RLW and NMR are currently performing a persistence study for many program sponsors in the Northeast; we recommend using the results of that study upon its completion. Markdown Customers. Consider developing a strategy to collect information on markdown customers. This would enable future evaluations to rigorously and quantitatively assess the impacts of this expanding segment of program participants. Nonparticipant Spillover. While measurement of nonparticipant spillover was beyond the scope of this study, it can often be greater than participant spillover in residential lighting programs; we therefore recommend measuring nonparticipant spillover in the near future. We suggest an approach that uses national data on CFL bulb sales and compares the Maine program to other states or regions having large-scale active programs, while using with the rest of the U.S. serving as a baseline, once sales in the active areas are removed. Several other regions with active lighting programs, including Massachusetts,7 Northwest,8 Wisconsin,9 and Vermont10 have
7 Baseline and Net-to-Gross Sales. Cape Light Compact, National Grid, NSTAR Electric, Unitil, and Western Massachusetts Electric. By Nexus Market Research, October 11, 2006.
Nexus Market Research

Process and Impact Evaluation of the Efficiency Maine Lighting Program Page 18
estimated program effects using a similar approach. The benefits of this approach include being able to assess net impact, including nonparticipant spillover, because customers may not always able to say whether they have been influenced by the program. If net sales are greater than program sales, the program could be responsible for more savings than it claims—subject to verification of reported per-unit savings.
8 ENERGY STAR Residential Lighting, Market Progress Evaluation Report, No.1. Northwest Energy Efficiency Alliance. By ECONorthwest, June 20, 2002. ENERGY STAR Residential Lighting, Market Progress Evaluation Report, No.2. Northwest Energy Efficiency Alliance. By ECONorthwest, August 16, 2004. Personal communication with Jeff Harris, Northwest Energy Efficiency Alliance, October 2006. 9 FY04/05 Net-to-Gross Savings Adjustments for CFLs Rewarded Through the ENERGY STAR Products Program. By Glacier Consulting Group, LLC and Ralph Prahl Associates. January 11, 2006. 10 Final Report: Phase 2 Evaluation of the Efficiency Vermont Residential Programs. Prepared for Vermont Department of Public Service by KEMA, Inc. December 2005.
Nexus Market Research

Process and Impact Evaluation of the Efficiency Maine Lighting Program Page 19
2. Program Description and Tracking Summary This section provides a summary of the Efficiency Maine lighting program, its tracking assumptions, and the evaluation objectives.
2.1. Program Description The 2006 Efficiency Maine lighting program included two program components:
! Instant rebate coupons ! Markdown Promotions
For the coupon portion of the program, implementation contractor Applied Proactive Technologies (APT) recruits stores to participate via telephone calls and visits by field representatives. Once a store has agreed to participate, they sign an agreement with Efficiency Maine (EM). APT then provides the store with point-of-purchase (POP) materials, coupons, and staff training on the program. Customers fill out a coupon form when purchasing an ENERGY STAR bulb or fixture at a participating store. The store employees check over the coupon to ensure that it is completely filled out and legibly written. The store then mails the coupons to be processed on a weekly to monthly basis, depending on the volume. The coupon information is entered into a database, processed, and then the store (or its corporate location) is mailed a check, usually within three to four weeks. The markdowns provide automatic discounts to customers without requiring them to fill out coupons. The product packages are required to have a sticker saying “Courtesy of Efficiency Maine.” The program pays 100% of the incentive to retailers once the cash register receipts are received. Maine Hardware was the first store to participate in the markdown program, followed by two supermarkets – Shaws and Hannaford – each of which was recruited through their lighting suppliers. The markdown initiatives are coordinated with memoranda of understanding (MOUs) that are re-signed every three months. Table 2-1 displays the annual sales of bulbs and fixtures through the coupon program, which began in 2003, and the markdown program, which began in September of 2005. In order to estimate overall bulb volume, the number of bulb coupons is multiplied by a factor of 1.4, which is the package size factor supplied by EFI to account for the presence of multi-packs.
Table 2-1: Annual Sales by Product Type and Program Component
2003 2004 2005 2006 Total Bulbs
Coupon 50,379 88,714 144,498 545,192 828,783Markdown 6,446 192,890 199,336
Total 50,379 88,714 150,944 738,082 1,028,119Fixtures
Coupon 6,061 8,327 6,164 11,542 32,094
Nexus Market Research

Process and Impact Evaluation of the Efficiency Maine Lighting Program Page 20
2.2. Program Tracking Summary Datasets for the Coupon program were provided to the NMR team at the outset of the study. These datasets included the following information on the products purchased: ! Product Detail (Type, Wattage, Manufacturer, Model Number) ! Quantity Purchased ! Store and Date of Purchase ! Customer Information (Name, Address, Phone Number)
In addition, the impact parameter assumptions being used by Efficiency Maine are shown in Table 2-2 below. As the table shows, the program assumes an in-service rate of 100% and 986 annual hours (2.7 hours per day) of use.
Table 2-2: Efficiency Maine CFL Bulb Input Parameter Assumptions11
CFL Wattage
Baseline Wattage
In-Service Rate
Annual Hours of Use
Annual Savings (kWh)
Useful Life (years)
13 52 100% 986 38 7.6 15 60 100% 986 44 7.6 17 60 100% 986 42 7.6 22 75 100% 986 52 7.6 24 75 100% 986 50 7.6 27 100 100% 986 72 7.6 39 137 100% 986 97 7.6 40 140 100% 986 99 7.6 55 193 100% 986 136 7.6 69 242 100% 986 171 7.6 70 245 100% 986 173 7.6
Table 2-3 displays the parallel impact parameter assumptions for fixtures; the program also assumes an in-service rate of 100% and 2.1 daily hours of use for interior fixtures and 4.0 hours for exterior fixtures.
Table 2-3: Efficiency Maine Fixture Input Parameter Assumptions12
Fixture Type
CFL Wattage
Baseline Wattage
In-Service Rate
Annual Hours of Use
Annual Savings (kWh)
Useful Life (years)
Interior 19 60 100% 766.5 31 20 Exterior 36 120 100% 1,460.0 123 20
11 Efficiency Maine Residential Technical Reference Manual No. 2006-1, November, 2006. 12 Efficiency Maine Residential Technical Reference Manual No. 2006-1, November, 2006.
Nexus Market Research

Process and Impact Evaluation of the Efficiency Maine Lighting Program Page 21
3. Methodology The process and impact evaluation relies on several different research tasks, including interviews conducted with program staff, participating retailers, and non-participating retailers; computer-assisted telephone interviews conducted with residential customers; and onsite visits of residential homes.
3.1. Staff and Retailer Interviews Staff Interviews. A total of six interviews were conducted with program staff in November of 2006, covering a variety of program-related topics including design, marketing, and delivery. Three interviews were completed with Efficiency Maine staff and three with subcontractors Lockheed-Martin, APT, Goldfarb, and GDS. Two of the interviews were conducted in-person, with the remainder completed over the telephone. Participating Retailer Interviews. Interviews were conducted in November and December of 2006 with ten employees from retail stores participating in the program. These stores were located throughout Maine, and were selected to represent the breadth of retail channels that participate in the program. Five of the ten employees interviewed worked at hardware stores, three worked at discount or mass merchant stores, one at a home improvement store, and one at a grocery store. All of the stores stocked ENERGY STAR CFL bulbs, though only six stocked CFL fixtures. All stores had participated in the program for at least one year, with several having participated for about three years – since the beginning of the program. Non-Participating Retailer Interviews. A total of six brief interviews were completed with employees at stores that are not participating in the program: four with hardware stores and two with building supply and/or lumber stores. The objective of the interviews was to assess their familiarity with the program and reasons for not participating; these interviews were conducted in December of 2006.
Nexus Market Research

Process and Impact Evaluation of the Efficiency Maine Lighting Program Page 22
3.2. Customer Telephone Surveys Three distinct telephone surveys were conducted with Maine residents:
! 170 surveys with Recent Coupon Participants, who purchased a lighting product through the coupon program after November 2005
! 70 surveys with Past Bulb Coupon Participants, who purchased a bulb through the coupon program prior to November 2005
! 199 surveys with the general population of customers, including 54 survey with self-reported purchasers of Markdown bulbs
All three telephone surveys are used to estimate spillover, hours of use, and in-service rates for products sold through the program. These measurements are based on the self-reported intentions of participants rather than an accounting of their actions. All telephone surveys were conducted by our subcontractor, Sourceone Info, during November and December of 2006 using computer-assisted telephone interviewing (CATI). According to the 2000 Census, an estimated 15.6% of Maine houses are for ‘seasonal, recreational, or occasional use’, which is the highest rate in the nation. However, this population of customers was not included in the telephone surveys of coupon participants if the phone numbers provided were from outside of Maine. In addition, the general population survey probably excluded second home owners as well, given that it was conducted in early December when second home owners are less likely to be at their Maine home.
Coupon Participant Surveys The recent coupon survey was based on 170 interviews with respondents who had used coupons since November 2005 to purchase bulbs, indoor fixtures, or outdoor fixtures. The past bulb survey involved 70 interviews with respondents who had used coupons before November 2005 to purchase bulbs. While both surveys assessed in-service rates, spillover, and hours of use, the past bulb survey did not ask questions regarding replaced wattage and freeridership because it was expected that these respondents may not accurately recall this information from bulbs purchased up to three years ago. The sample of coupon participants was derived from customer transaction databases provided by EFI. As fulfillment contractor to the program, EFI maintains databases of all qualifying instant rebate redemptions. Considerable effort was necessary to clean the data for use, including identifying unique participants, aggregating individual transaction listings by customer, and determining the number of records in the desired sampling groups. While the customer and product counts from the entire coupon database are used for program impact measurements in this study, only records with complete telephone contact numbers were used for the final telephone sample.
Nexus Market Research

Process and Impact Evaluation of the Efficiency Maine Lighting Program Page 23
Recent Coupon Participant Sample. The EFI coupon databases contained 337,339 records of individual and multiple purchases of products made through the coupon program since November 2005. These files indicate that the program sponsors paid rebates on 560,067 bulbs, 5,792 interior fixtures (including portables and torchieres), and 1,582 exterior fixtures. After excluding unusable records, we aggregated the product records to identify the purchases of individual customers (based on their zip code and address). Table 3-1 lists the population and sample size for customer groups in each of the product mix categories.
Table 3-1: Population of Customers and Sample Size Purchasing Each Combination of Products from Recent Coupon Survey
(all customers participating in the Coupon Program) Recent Coupon
Product Mix Population Sample Bulbs only 100,874 55 Interior Only 2,555 47 Exterior Only 676 46 Bulbs & Interior 858 10 Bulbs & Exterior 260 8 Interior & Exterior 42 2 Bulbs, Interior, Exterior 31 2 Total 105,296 170
Because the recent coupon sample was disproportionately stratified based on the mix of products purchased by customers, the respondent groups were weighted to represent their actual share of the coupon participant population. For example, the stratified design over-sampled those who had purchased fixtures while it under-sampled those who only purchased bulbs. In addition, one of the main objectives of the participant survey was to provide data on the impact of the entire program. In order to do this, we needed to generalize from the samples to the populations of both program participants and the number of products actually purchased. The objectives of the participant survey required that we use two distinct weighting systems. The first system is based on customers, and it weights the sample to the population of individuals purchasing energy-efficient products through the program. We use this weighting system whenever we want to draw conclusions about customers and not products (e.g., about customer satisfaction or certain types of buying and usage behavior). The second weighting procedure is based on the actual number of products purchased through the program. We weight the number of products that survey respondents report purchasing to the actual number of products purchased by all customers through the program. We use this second weighting procedure whenever we wish to draw conclusions about the products purchased through the program. Because the survey respondents represent a random sample of the population, both weighting procedures allow us to draw conclusions about the overall population based on the responses and reported behavior of the survey respondents. However, all generalizations to the population are subject to the assumptions and limitations of statistical procedures. In particular, no random sample will ever provide an exactly accurate description of the true population. All
Nexus Market Research

Process and Impact Evaluation of the Efficiency Maine Lighting Program Page 24
generalizations made from a sample to the population are only estimates. Triangulation, or using diverse methods to answer a similar question, helps us evaluate any single method. For this reason, the larger study provides estimates developed from the participant survey and those obtained from the on-site logger studies. We believe that the use of different methods of analysis enables us to assess the reliability of the data. Past Bulb Participant Sample. The EFI coupon databases contained 183,402 records of individual and multiple purchases of products made through the coupon program before November 2005. These files indicate that the program sponsors paid rebates on 211,139 bulbs. A random sample was selected from the subset of customers who purchased bulbs, though some may have also purchased fixtures as well. Because the sample was randomly selected, no weighting procedures are necessary.
General Population Survey The general population survey was based on 199 interviews with the general population of customers, in order to reach those customers who had purchased discounted CFL bulbs through the Markdown program at either Hannaford, Shaws, or Maine Hardware stores. This survey involved 54 interviews with self-reported markdown purchasers, 73 with customers who had purchased CFLs but not through the markdown program, and 72 with customers who had never purchased CFLs. Respondents to the survey were asked a series of questions to determine if they had purchased CFLs through the markdown program. The following criteria were used to determine if respondents to the survey had purchased bulbs through the markdown program:
! They reported being familiar with CFL bulbs after being read description ! Someone in their household had purchased CFL bulbs ! They reported purchasing at least some bulbs without receiving a $2 instant rebate
coupon ! They reported purchasing CFL bulbs at a Hannaford, Shaws, or Maine Hardware since
September 2005
Overall, 37 respondents reported purchasing bulbs at a Hannaford supermarket, 13 at a Shaws supermarket, and five at Maine Hardware. Of these 54 respondents, twenty-one (38%) reported seeing a sticker on the package that said “Courtesy of Efficiency Maine.” Most of the remaining respondents did not know if the package had such a sticker. Respondents were then asked to list how many single-packs, two-packs, and three-packs they purchased at the stores without receiving an instant rebate at the cash register. These package sizes were used because the markdown program only incentivized these particular configurations. However, because respondents were not expected to have accurate recall of the exact package size they bought at the stores, this information was not used to exclude respondents from the series of markdown questions. In addition, it was assumed that the vast majority of CFLs sold at the two supermarket chains were markdown products; thus if a customer bought CFLs at a supermarket, it is likely that they purchased markdown CFLs.
Nexus Market Research

Process and Impact Evaluation of the Efficiency Maine Lighting Program Page 25
For the demographic analysis, the three distinct respondent groups to the general population survey (markdown participants, non-markdown purchasers, and non-purchasers) were weighted to represent their actual share of the population. The general population survey excluded those respondents who had only purchased CFL bulbs through the coupon program (aka “pure coupon purchasers”), since by default they could not have purchased bulbs through the markdown program and were already being assessed through the coupon participant surveys. In order to present results for the general population, we have selected respondents from the coupon participant surveys to represent the “pure coupon purchasers” and have included their results with the general population results where applicable.
Sampling Error Table 3-2 displays the estimated population, sample size, and sampling error for the program participant telephone surveys. All sampling errors are less than 12% at the 90% confidence interval.
Table 3-2: Sample Size and Sampling Error by Product Population Size
(N)a
Sample Size (n)
Sampling Error at the 90% Confidence
Interval Markdown CFLs 41,456 54 11.3% Past Coupon CFLs 48,453 70 9.9% Recent Coupon CFLs 102,023 75 11.1% Recent Coupon Interior Fixture 3,486 61 11.1% Recent Coupon Exterior Fixture 1,009 58 11.9% All Recent Coupon Products 105,296 170 10.7%
a Excludes individuals with neither an identifiable address. Without this information, we could not identify unique individuals in the data set, a necessity given that many customers made multiple purchases and at different times. b Totals exceed population and sample sizes due to purchases of multiple types of products by individual customers. Such customers are counted in total for both types of products.
3.3. On-Site Visits This section describes the on-site visits conducted for the impact evaluation. Due to the limited resources available for this study, the on-sites focused on the impacts generated by CFLs incentivized through the coupon program within the past year. The onsite visits were used to adjust the results of the telephone survey, which were entirely dependent upon self-reported responses of product use. We believe this approach provides a more reliable result of impacts given the limited resources available for the study. Using the more rigorous (but relatively small) on-site sample results as a benchmark from which the phone
Nexus Market Research

Process and Impact Evaluation of the Efficiency Maine Lighting Program Page 26
survey results are trued up should provide a more accurate estimate of the program impacts than relying solely on the phone results.
On-Site Recruitment After answering the Recent Coupon Participant telephone survey, respondents were offered a $50 incentive to participate in an on-site visit. Thirty customers expressed interest in participating in the on-site portion of the study. Twenty-one of these customers became part of the on-site sample while the remaining nine customers changed their minds and decided not to participate. In order to recruit the remaining four customers, the pool of survey respondents who initially refused on-site participation were re-contacted and offered a $75 incentive to participate.
On-Site Visit Data Collection The on-site data collection activities included a brief interview with the participant to gather information on the products purchased through the program, and metering using lighting loggers. Dent lighting loggers were installed to accurately measure lighting hours of use for a period of two weeks. The lighting logger data set was used to support the evaluation through the estimation of annual hours of use for lighting measures. A total of 153 loggers were installed across the 25 homes visited in support of the study, which captured the hours of operation of 203 CFL purchases. The lighting loggers were installed between December 20, 2006 and January 6, 2007 and removed between January 23 and January 26, 2007. Note that the logger data collected prior to January 3 were not used in the analysis of hours of operation, because it was assumed that lighting use during the holiday season would not be representative of normal lighting use. Figure 3-3 presents an overview of the data collection activities, including the steps of recruitment, on-site visit, logger removal, and analysis. Included in the figure are the lag times associated with each step and the keys to successfully completing each phase of the data collection.
Nexus Market Research

Process and Impact Evaluation of the Efficiency Maine Lighting Program Page 27
Figure 3-3: On-Site Data Collection Flow Chart
On-Site Data Collection Flow ChartRecruitment
Keys: Pre-recruited in Phone Survey, called to schedule appointments throughout weekday and weekend hours.
On-Site/Logger InstallationMonitoring Keys: Determine all lighting types present, attempt monitoring
for all lighting present, calibrate loggersWalkthrough Keys: Inventory measures, gather reported hours of
operation, and reported pre-existing wattage.
1-2 wks lag
1-1.5 hr.
2 Weeks
On-Site/Logger RemovalKeys: Convenience, Follow-up Questions
Analysis and Reporting
Lighting Analysis Methodology This section presents the methodology used to calculate the various input parameters based on the data collected in the on-site visits, including the winter coincident factor calculations. The analysis was performed in a spreadsheet with inputs for all of the on-site information gathered for each lighting product purchased in the homes visited.
Nexus Market Research

Process and Impact Evaluation of the Efficiency Maine Lighting Program Page 28
While participants were generally able to provide pre wattages for most locations, there were some instances in which the lighting purchased through the program did not replace a previously existing light. In these instances, the program baselines shown in the Table 3-4 were used. Therefore, if a 15-watt CFL was installed in a new lamp, it was assumed that it replaced a 60-watt incandescent bulb.
Table 3-4: Program Baseline Wattage Assumptions CFL Wattage Baseline Wattage
10-12 40 13-14 52 15-17 60 18-24 75 25-29 100 30-39 137
40 140 55 193 69 242 70 245
Nexus Market Research

Process and Impact Evaluation of the Efficiency Maine Lighting Program Page 29
When using short-term lighting loggers, the logged hours must be adjusted to compensate for the fact that people use their lights differently at different times of the year (i.e., more in the winter months and less in the summer months). In order to determine the annual hours of operation, the NMR team used the information provided in Table 3-5 from a long-term metering study performed in Massachusetts in 2004 and 2005.13 Specifically, the long-term study was used to calculate the percentage of total annual hours that fell into each month of the year. These data were used to annualize the short-term monitored data in this study to a full year by multiplying the monthly hours observed in the short-term metering by the fraction of annual hours determined to fall during the same month from the long-term study. In this study all of the metering occurred in January so the raw logger data is expanded to represent an entire month’s worth of use and then divided by 9.76% to estimate annual use.
Table 3-5: Monthly Hours of Use from Long-term Monitoring Study in Massachusetts
2004-2005 MA Study Month
Total Hours
Percentage of Total Annual Hours
January 97.3 9.76% February 79.9 8.01% March 87.0 8.73% April 76.7 7.69% May 74.7 7.49% June 71.5 7.18% July 69.3 6.96% August 73.5 7.37% September 79.8 8.01% October 92.4 9.27% November 96.8 9.71% December 97.9 9.82% Total 996.7 100.00%
Winter peak coincident factors were calculated due to the fact that the metering took place during the winter months. It was calculated as the logged percent on-time between the weekday hours of 5 PM and 7 PM.
13 Extended Residential Logging Results, 2005, conducted by NMR and RLW for Northeast Utilities, NSTAR, National Grid, Cape Light Compact, Fitchburg Gas & Electric, Vermont Department of Public Service.
Nexus Market Research

Process and Impact Evaluation of the Efficiency Maine Lighting Program Page 30
4. Process Evaluation This section of the report presents the full results of the process evaluation.
4.1. Program Development, Goals, and Design Program Development. In 2002, the Conservation Law was passed in Maine, which shifted responsibility for operating the energy efficiency programs in Maine from the electric utilities to the PUC. The law mandates that the PUC spend 20% on low-income programs and 20% on business programs, which leaves 60% for other programs including the Residential Lighting Program (RLP). The RLP was launched in 2003 under a one-year interim contract, and APT was selected to operate the program for a period of one year. When the program implementation services were re-bid, the PUC elected to split the contract between Applied Proactive Technologies (APT) and the Aspen (now Lockheed-Martin) team. The APT proposal was perceived to provide stronger field services while the Lockheed-Martin (LM) team was thought to provide stronger marketing plans. The original program manager from EM did not allow the two teams - APT and Lockheed-Martin (and its subcontractors) to directly communicate. This resulted in some management issues, which have been largely overcome with the shift to a new EM program manager. Staff members report that there is no problem that cannot be resolved and that all staff have been professional. However, one staffer does not believe that the split-contract approach is an effective method for managing the program due to the integration of activities that cross between teams, such as the cooperative advertising. Program Revisions. Several staff members mention that the program began with little marketing or advertising effort but evolved to strongly adopt those tactics in 2005. There were significant marketing and advertising activities in conjunction with the energy efficiency campaign sponsored by the PUC in light of the potential for natural gas disruptions. In addition, one staff member notes that the program has shifted its marketing and advertising concepts from explaining what a CFL is to explaining its uses. Another change includes the introduction of markdowns through the grocery channels over the past two years. In addition, the program is now working with school, civic, and church organizations who are interested in selling bulbs for fundraisers and other events. This is perceived as another method to reach new customers as well as educating children. A few staff members mention the introduction of light-emitting diodes (LEDs) for Holiday lights. One staffer believes that there is likely high freeridership in this program, as LEDs had already been ordered by some big box stores and were thus likely to be adopted quickly without the promotion. Another wonders when LEDs will replace CFL technology in the marketplace.
Nexus Market Research

Process and Impact Evaluation of the Efficiency Maine Lighting Program Page 31
Lastly, a recent change is the shift of the bulb coupon incentive from $2 to $1.50 per package, which will further stretch the incentive funding. In conjunction, the coupon is being redesigned to allow the redemption of multiple products per coupon.
Program Responsibilities and Communication The EM program manager, who has been involved with the program for about two years, spends about 60% of his time on the RLP and is involved in managing day-to-day program activities, tracking budgets, and collaborating with contractors. In addition, the EM director spends about 15% of his time on the program, including overseeing the program manager and conducting strategic planning. With only five people on staff, several respondents believe that EM itself is short-staffed. APT provides field services to the retail stores, including the recruitment and enrollment of retail stores, training of retail staff, management of cooperative advertising, support of retail promotions, and negotiation of some markdown promotions. APT has three full-time field staff members located in Maine, a manager, a coordinator, as well as other managerial and administrative staff who are involved on an occasional basis. One staffer believes that the program needs more field representatives. LM is responsible for overall program administration, tracking, reporting, and project management. They employ one project manager and one evaluation person part-time, as well as data entry staff as needed, and recently hired a Maine-based project manager. Working underneath LM are L. Goldfarb, Vreeland Marketing, and GDS Associates. L. Goldfarb has one person involved part-time who develops strategic marketing plans and promotional events. Vreeland marketing is responsible for creative development of advertising and POP materials. GDS has three employees involved part-time in the project who are involved in measure screening and planning. EFI serves as the coupon data contractor, and receives the coupons mailed in by participating stores, then processes the data and mails out checks to stores. Communication. Both the APT and LM teams are in regular email and phone contact with the program manager. All program staff members participate in a monthly 90-minute teleconference to discuss status, updates, and issues. In addition, the LM team members all participate in a weekly meeting in order to coordinate activities. Team members collaborate on issues that overlap – for example, the APT team has worked directly with Vreeland on the redesign of POP materials. One staffer would prefer that the EM staff maintain open lines of communication with contractors in order to better collaborate, as sometimes contractors are not informed of promotions. In addition, quicker decision-making from EM would also be beneficial.
Nexus Market Research

Process and Impact Evaluation of the Efficiency Maine Lighting Program Page 32
Interaction with other Programs. The RLP interacts with the EM Business program because both programs offer incentives for lighting measures; incentives are coordinated to ensure there is no overlap. The Business program offers higher incentives ($2 per bulb rather than $2 per bulb package); thus commercial customers are directed there when possible. In addition, the RLP coupon offers an option to indicate whether the product is intended for the home or business of a customer.
Program Goals and Indicators Most staff members agree that the goals of the program are to transform the lighting market toward energy efficiency, rather than achieving any specific levels of energy savings or sales volume. Staff believes that the program introduces EM to people, works with retailers to provide a wide selection of CFLs, and educates people regarding the benefits of CFLs. This is expected to lead to CFLs replacing incandescents as the default choice for lighting, according to one staff member. Staff members also mention a variety of benefits of market transformation, including energy cost savings and environmental benefits. While there are no established annual targets for the program, one goal mentioned by several staff members is installing an average of six CFLs per household in Maine. One staffer mentions that he would prefer not to see rigid targets applied to the program, as the current design allows for flexibility in implementation. However, another staffer would like to see EM more involved in establishing goals for the program, such as volume of products, kWh, cost-effectiveness, number of stores participating, and the reach of public relations and advertising. One staff member mentions that the program offers services to all customers in Maine, which allows participation by smaller retailers that might be missed if the focus were purely on volume. One staff member hopes that the program will be broadened to include other energy efficient products; this expansion would improve recognition of both EM and ENERGY STAR. He hopes that EM will become the source for information about energy efficiency programs in the state, by providing information on residential new construction and other programs such as Home Performance with ENERGY STAR (which is offered by the Office of Energy Independence). Indicators. In order to measure the performance of the program in achieving its goals, staff members mentioned a variety of indicators. In the short-term (1-2 years), the program tracking databases record the proportion of shelf space allocated to CFLs as well as product placement, retailer enrollment and activity, plus volume of products incentivized. Others mention the geographic spread of participation across the state, cost-effectiveness, energy savings, and freeridership estimates. In the medium term and long term, staff members would like to conduct socket counts and measure hours of use in order to measure the saturation and penetration of CFL products in households. Other items to measure include customer recognition and opinion of EM.
Nexus Market Research

Process and Impact Evaluation of the Efficiency Maine Lighting Program Page 33
One staffer mentions that establishing targets in such a rapidly-developing market is a challenge. In addition, some staff believe that the program should continue its holistic approach, and work toward overall goals without specific numbers. As the program matures, they believe that opportunities will naturally arise and having the flexibility to pursue them is important. Another staffer notes that website hits or phone-calls may not be accurate indicators of the performance of advertising giving that some hits are due to staff. In addition, given the wide availability of CFLs now, customers really don’t need these resources to purchase them.
Program Design The program has established coupon incentive levels based on the levels set in other states, and regularly follows the regional meetings of other energy efficiency program sponsors. However, one staffer expressed concern that other states had slashed incentive levels too much and suggests that markdowns provide an opportunity to reduce incentives or provide scaled incentives for different models. Several other staff members note that the program can move products more cost-effectively through the markdown approach. Most participating retailers believe that the $2 bulb incentive amount is reasonable and are unsure what the impacts will be of reducing the bulb incentives to $1.50. However, some think the change will have little impact on sales because the instant redemption aspect of the coupon is more important than the actual dollar amount. Several retailers also believe that the fixture incentives are sufficient too. One staffer notes that other program sponsors have had some success in continuing sales of bulbs after reducing the incentive to $1.50 per package. Another staff member recommends dropping the incentive to $1 per package and providing higher incentives for specialty models. Such an approach, if done through the coupon program, would require alterations to POP materials among other changes. In contrast, one staff member cites the success of recruiting Wal-Mart and Home Depot into the program as evidence that coupons are probably not needed, because once big box stores are selling CFLs, they are unlikely to discontinue stocking. However, this staffer believes that coupons may still be necessary for specialty models. Product Mix. One staff member would like to see more product variety, including more dimmable and three-way models. However, most note that technical problems still exist with some of the specialty models, according to the PEARL test results and anecdotal evidence. One recommends that the program only incentivize models that have passed the PEARL tests. In addition, one staffer believes that the “third” level in three-way models is not much different than the “second” level. For dimmable models, another member mentions that customers like the added “warmth” of incandescent dimmables but that CFLs remain at a constant color
Nexus Market Research

Process and Impact Evaluation of the Efficiency Maine Lighting Program Page 34
temperature.14 Both of these indicate that the technologies have not been perfected yet, and that the program should move ahead cautiously, lest there be a repeat of customer problems encountered by the earlier generation of CFL bulbs in the 1990’s. In addition, several staff members note that the vast majority of CFL bulbs sold are the 15-Watt spiral models at the 2700K temperature. So these staffers question the value in emphasizing specialty bulbs that comprise a small portion of the market. However, a few staffers do believe that specialty bulbs are worth promoting. One staffer mentions that the program is purchasing a five-socket light bar for demonstrations – one socket for a dimmable bulb, one for a three-way bulbs, and three for different temperature bulbs. Another staffer suggests renting shelf space at retailers to encourage them to carry specialty models, while another recommends offering specialty bulbs online, which would also offer an avenue for rural customers to purchase products. Others mention that scaled incentives for markdowns might work, though implementing scaled incentives with coupons would be more challenging. One staff member believes that educating customers regarding color temperatures is important, though another notes the challenge in educating customers in a brief advertisement. Most participating retailers believe that the current mix of products is appropriate. However, two respondents mention that customers do ask for three-way models. Another retailer reports that customers ask for 200W equivalent bulbs, while one retailer believes that bright lights or daylights, which save energy (with different color rendering) should be eligible for the program. Staff Assessment. Staff members listed a variety of strengths of the program design. One believes that the program is a well-tested, proven model while others note the flexibility of the program to adapt to changes in the market. Another mentions that the program consistently serves the entire state with no exclusions. Other staff members mention that volume of product being delivered through the program. Two staffers believe that recruiting Wal-Mart to participate in the program is a big “feather in our cap” as Maine is one of the few states in which Wal-Mart participates in a lighting program.15 Another mentions that the program has a solid advertising and public relations campaign and provides good service to retailers, which all results in good consumer education. In terms of weaknesses, one staff member mentions that the program is missing the opportunity to install light bulbs in new construction. Another staff member suggests that EM should attempt to get property managers involved in programs as they currently are not eligible for either the residential or the business lighting program. Others mention that the program only emphasizes electric energy savings, and would support expanding into other fuels.
14 Color temperature is a measure of the light’s color shading: - the higher the number (in degrees Kelvin), the “cooler” - i.e., bluer - the shade. 15 Wal-Mart also participates with Pacific Gas & Electric, for example, and is on the verge of cooperating with a wide range of lighting programs as part of their national CFL Initiative.
Nexus Market Research

Process and Impact Evaluation of the Efficiency Maine Lighting Program Page 35
One staffer cautions the program to not make design changes solely for the sake of change. He has seen that occur elsewhere; instead the program should plan out changes and recognize that the program is dealing with a market that includes retailers, not just the program.
4.2 Participation, Outreach, and Marketing Program staff members report a variety of motivations for stores to participate in the program. These include the ability to sell more products and turn a profit, as lighting can be a high-profit item and CFLs are an expanding market. A parallel reason is that their competitors are participating in the program. Other reasons include the publicity and recognition achieved by the connection with ENERGY STAR and Efficiency Maine. Other staffers mention reasons such as the high-quality POP offered by the program, and the fact that the $2 coupon does not include a service fee and thus the retailers receive the entire amount. According to the retailers themselves, most report that they choose to participate in the program because the coupons boost sales volumes for bulbs, while some also mention increased sales of other products as well. Similarly, others report that the program advertising draws people into the stores. One respondent believes that the bulbs benefit customers by saving them energy and helping the environment. Barriers to Participation. Several staff members believe that the coupon is a barrier to participation, especially for supermarkets and for smaller stores that don’t have the staff to verify the information. In addition, these stores cannot compete on price with the large home improvement chains. For the markdowns promotions, obtaining sales data can be an issue for some retailers. About one-half of the retailer interviewees did not mention any barriers, and those that did cited a variety of obstacles. Several mention the fact that customers are required to complete a coupon for each bulb they purchase, which can be cumbersome. Others note a variety of other obstacles, including: occasionally running out of coupons, not having enough counter space for several customers to fill out the coupons at once, having to insure the coupon packages for mail delivery, and not having an adequate selection of bulbs from their warehouse. Nonparticipating Retailers. Five of the six nonparticipating retailers are aware of Efficiency Maine and four are familiar with the lighting program. These four respondents report that program staff had visited their store occasionally over the past few years in order to discuss the program. These four respondents are also aware that the program offered coupons for CFL products as well as POP materials. Two of the stores did not stock CFL bulbs; one respondent from a hardware store says that “it’s a small store and there’s no room for them.” A second respondent (also from a hardware store) says we “don’t stock CFL bulbs, and no customers request them. We did stock them a few years back but didn’t sell much.”
Nexus Market Research

Process and Impact Evaluation of the Efficiency Maine Lighting Program Page 36
The other stores stock CFLs, but typically carry a limited selection. One hardware store respondent says “we just don’t sell enough. We have tried endcaps and carry five or six models, but customers are not interested. The price is too high and I don’t want to tie up a lot of space for them.” Another respondent says that “we are really a lumberyard, and carry few light bulbs – mostly for contractors, drop lights, etc.” A respondent from a lumber company says that we “are planning on getting out of the plumbing and electrical business soon, so there’s really little opportunity for involvement here.” One hardware store respondent declined to participate in the program because we “sell few CFL bulbs so I thought it was a waste of my time and their time [to join the program]. I’ve only ever had one guy come in and ask me about them.” Another respondent says “those bulbs are quite expensive, and our customers just can't afford them.” Only two of the six respondents expressed any interest in joining the program. One reports selling “a lot of LED Christmas lights this year. I didn’t know that Efficiency Maine offered coupons there, so I might be interested in LED coupons next year. [However] I don’t want to do a lot of paperwork for nothing. I already do enough paperwork for the state for nothing.” Another respondent says that we “began carrying CFLs about three months ago. We didn’t carry them earlier because our wholesale price was higher than the retail price at Wal-Mart. [However], recently our vendor has offered CFLs at cheaper prices so we started stocking them.” He was interested in joining the program.
Outreach The program has three field representatives who are currently serving the maximum number of stores each can handle – about 100 stores per representative. The program may be adding a fourth rep for the six-month contract extension to support the fundraiser groups and other upcoming promotions. Most retailers are recruited through the program via cold calls, store visits, and letters; some stores are recruited through their corporate contacts. According to program staff, nearly all potential stores have been contacted at least once by program representatives. The two supermarket chains that participate in the markdown program were recruited through existing contacts with the manufacturers who supply the supermarkets with lighting products. Program staff reports that retailers like the field representatives, and they have heard no complaints. The interviews with participating retailers support this opinion, as all respondents were satisfied with their field representatives. Store respondents were asked to rate their field representatives, on a scale of 1 to 5 where 1 is the lowest and 5 is the highest, regarding four characteristics: well-informed, helpful, courteous, and professional. All respondents gave their representatives a 4 or 5 on each characteristic. They report that the representatives provide “excellent service,” inform them of new products, market news, and promotions, and are always available to answer questions. One respondent says that his representative is “enthusiastic, knows his stuff, always answers our questions, and makes sure we have the right products and coupons.” Others mention that their representative “suggested we carry other models that have
Nexus Market Research
Process and Impact Evaluation of the Efficiency Maine Lighting Program Page 37
sold well” and participation in home shows which “at first we were skeptical but has been a big success.” According to program staff, most stores are visited about once per month, with the large volume stores receiving more frequent visits. Retailers are satisfied with the frequency of visits; some stores are visited several times per month while others are visited every few months. One respondent reports that their representative will come within one day if called. Four of the participating retailers report that they have made suggestions to staff regarding the program: two have mentioned allowing multiple products on a single coupon, another mentioned paperwork issues, and another suggested ideas for other bulb models. They report that staff have been receptive to their suggestions. Training. Because sales staff positions are inherently high turnover, the education of sales staff is a continual issue for the program. Mystery shopping visits to participating stores have found inconsistent knowledge of CFLs and the program, across many different store types. One staffer mentions that Home Depot staff received EM lapel pins to recognize that they have undergone a 90-minute training session. All participating retailer respondents are either ‘satisfied’ or ‘very satisfied’ with the staff training provided by the field representatives. They report that their field representatives keep them abreast of the program and new products, answer questions, provide training to new employees, and check on coupons. One respondent said “I couldn’t answer your questions without the training” and another said their field representative helped them understand the difference in quality between various brands of CFLs. Staff Assessment. Most program staff believe that the current level of involvement by retailers is sufficient; given the variety of products offered by these retailers, CFLs garner a reasonable amount of shelf space and support. Retailers are now more educated, though some are more active in promotion than others. One staffer notes that it requires tremendous effort just to get in the door at some retail stores; Wal-Mart being a prime example. In addition, some staff members cite the diversity of retailers involved in the program as a strength - including hardware, supermarkets, home improvement, and discount retailers. Several stores that are targeted for recruitment include Target, Hammonds, and drug store chains. While one staffer mentions that the program recently obtained an agreement with the Maine Association of Grocers to support their stores through Maine, he also cautions that the program may soon reach a ceiling in terms of store enrollment.
Marketing The program utilizes a variety of methods to market to customers, including advertising via television, radio, and newspaper – particularly during the 10% Challenge and Save A Watt campaigns during the Fall and Winter of 2005-2006. One television advertisement won an award at a New England Association of Energy Service Professionals (AESP) meeting. This
Nexus Market Research

Process and Impact Evaluation of the Efficiency Maine Lighting Program Page 38
campaign challenged customers to reduce their home electricity consumption from the same month in the previous year in order to be automatically entered into a drawing to win $1,000 toward the purchase of ENERGY STAR appliances. This campaign was boosted by the participation of the Office of Energy Independence and funding provided by the default electric service supplier Constellation Energy. Because of the impacts of Hurricanes Katrina and Rita on natural gas supply, ISO-New England asked states to save energy in order to prevent natural gas blackouts during the winter. According to staff, there have been spikes in website hits and coupon usage after such advertising. In addition to traditional advertising, the program also sponsors ‘counter days’ at participating stores where representatives will speak with customers and hand out information. The program has also sponsored a booth at home shows in Portland, Auburn, Bangor, and Lewiston-Auburn. Customers can learn about the program at the booth and purchase CFL products from Aubuchon booths located at the same event. In this case, staff uses a tally sheet which allows customers to purchase up to 24 bulbs each, rather than the usual coupons. The program has also conducted outreach with various organizations, including landlords groups, churches, Elks clubs, low-income groups, and Bath Iron Works employees, among others. In addition, several staff members note that the coupons and POP materials located inside stores is also a form of marketing. Lastly, the EM website and 1-800 phone number also serve to reach customers. The program also is conducting the LED Holiday lights campaign by providing the LED light bulbs to decorate ten Christmas trees across the state. Fire chiefs also were mailed information about the fire-prevention benefits of LED lights. Retailer Marketing. Because corporate staff handle marketing and advertising activities, several participating retailers were not familiar with marketing and advertising strategies and thus were unable to answer questions on this topic. However, six stores report participating in some type of joint promotional activities with the program – primarily the in-store ‘counter days’ as mentioned above. One respondent mentions that his company has also partnered with Efficiency Maine at home shows as well as the torchiere turn-in events that operated several years ago. All retailers are ‘satisfied’ or ‘very satisfied’ with the promotional support they have received through the program. They say the counter days have garnered new customers and sold many more bulbs than usual – ten times more according to one respondent. Of those respondents familiar with their stores’ advertising activities, most report that they do not specifically advertise for CFL bulbs, rather they rely on in-store materials such as endcap displays plus POP materials, coupons, and stickers displayed on the shelves. However, two respondents report including CFLs in their store flyers because of the coupons and customer requests; they did not do this advertising before joining the programs. One store usually features whichever CFL bulb is offered at the best price.
Nexus Market Research

Process and Impact Evaluation of the Efficiency Maine Lighting Program Page 39
Point-of-Purchase Materials. All respondents to the participating retailer interviews are ‘satisfied’ with the program POP materials; they say the materials are up-to-date, eye-catching, and work well. Most respondents believe that all the POP materials provide a good package, and cannot cite any specific items that are particularly useful or not useful, since, as one respondent said, customers “won’t tell you that particular material influenced them.” However, a few respondents mention specific items that seem to work, including the meter display that tracks the electrical usage of a CFL bulb compared to an incandescent bulb, aisle markers, and a banner that displayed the annual energy savings for the entire nation if a certain number of people installed CFL bulbs. Some retailers report that the POP materials and coupons are self-explanatory and that customers do not need much persuasion to purchase bulbs. Others report that their staff will talk with customers about the coupons, the energy savings, the longer lifetimes and then they can usually convince customers to purchase CFLs; one mentions that “X CFLs are equivalent to Y incandescent bulbs because of longer lifetimes.” Others tell customers to earn back their tax dollars from the state through the coupons or ask customers (who intend to purchase incandescents) why they are not purchasing CFLs. Most staffers also believe the POP materials are attractive and educational. One staffer mentions that the POP materials were becoming stale after three years in the field, and the program team has worked for the last six months to revise the materials in order to maintain a fresh look. Another staffer suggests tailoring the POP materials to different retail sectors. Cooperative Advertising. Several staffers note the lack of uptake for the cooperative advertising. One program staff member believes that the slow uptake for the cooperative advertising is due to the low cap ($2,000) which is too small for the larger stores. In addition, some chains (including Aubuchon and True Value) are already placing CFL ads into their monthly flyers, so this staffer believes there is no reason to offer cooperative advertising to them. In addition, most chain and cooperative stores coordinate their advertising at the regional level, so placing ads just for Maine poses a challenge. In contrast, at the local chains and independent stores the management often does not have the expertise or time to write their own advertising materials. Lastly, the cooperative program can be a cumbersome process – the advertising must include the EM logo and disclaimer which presents additional obstacles. In general, if store managers ask for the cooperative funding then it’s provided. Occasionally the field reps will push cooperative advertising but with little success. However, if more promotions occur next year, then this staffer expects to see more requests for cooperative advertising. Supermarkets and independent stores could be targets for future cooperative advertising efforts. One staffer believes that the split-contract arrangement may affect the lack of uptake in cooperative advertising; another staffer suggests that the cooperative advertising could be improved by establishing a retailer advisory panel. Only one participating retailer respondent participated in the cooperative advertising initiative. This respondent ran a newspaper ad and received a reimbursement check from Efficiency Maine
Nexus Market Research

Process and Impact Evaluation of the Efficiency Maine Lighting Program Page 40
after providing the field representative with a copy. He was very satisfied with the cooperative advertising and reported “no problems.” Staff Assessment. Most program staff members believe that the marketing and advertising strategies are creative and eye-catching. Several mention the large media buy that occurred last year as particularly successful, although one staffer notes that the materials need to remain fresh in order maintain their effectiveness. Another mentions that the PUC barred TV advertising before election day, even though October is a key month for light bulb sales; this restriction may have negatively affected the impact of the fall advertising campaign. Other marketing and advertising suggestions include the following:
! Conduct web-based advertising in order to reach a younger audience. ! Mail a vendor newsletter to participating stores. ! Conduct cross-promotions with participants from the business program, such as sales of
CFLs to employees in the cafeteria of a business that underwent a lighting change. ! Develop materials that convey the message that energy efficiency does not mean “giving
up.” ! Do more localized advertising, as most advertising have been statewide to this point. ! One staffer mentions that the program has done little in conjunction with the Change A
Light, Change the World campaign other than issuing press releases. He hopes to coordinate more with the campaign next year.
! Provide a free energy column to newspapers and publications. However, one staffer thinks that it would be valuable to conduct a critical analysis of the overall marketing strategy, especially whether TV advertising is an appropriate venue for the program. This staffer suggests that earned media and environmental challenges (such as selling CFLs at Earth Day events) could be more cost-effective. Another member questions the value of mass market advertising when the majority of bulb purchase decisions are made inside the store. They note that POP materials, especially endcap displays, serve as a form of in-store advertising and that manufacturers would pay for such display space. Others believe that the experience of the field reps and their training of retail sales staff is important, which effectively serves as an extension of the sales force by introducing EM and CFL applications.
4.2. Program Delivery and Impacts Nine of the ten participating retailers believe that nearly 100% of customers fill out the coupons when purchasing ENERGY STAR bulbs. Several retailers report that their staff will fill out coupons for elderly customer or those buying many products, and allow customers to use envelope stickers as long as they contain all the required information. However, one retailer reports that customers only fill out coupons in about 70% of situations due to the nuisance of completing the form at the cash register. Another reports that customers occasionally return products to the shelves because they do not want to fill out multiple coupons. Most retailers are not familiar with submitting coupons and receiving payment because their corporate staff or other employees handle this task. Of the four respondents who were familiar
Nexus Market Research

Process and Impact Evaluation of the Efficiency Maine Lighting Program Page 41
with coupon processing, all were either ‘satisfied’ or ‘extremely satisfied.’ They have encountered no problems and payment is received within three to eight weeks. One retailer reports that, at the beginning, some coupons were returned because they were not filled out completely or correctly, but they have not had issues since then. Another reports that the coupons are occasionally returned because there is a PO box number on the coupon. According to the program contractor, coupons do not require street addresses so this retailer may be mistaken. Markdown Program. Maine Hardware was the first store to participate in the markdown strategy, and they now offer several common bulb models with markdowns and the specialty models with coupons. Both of the supermarkets – Shaws and Hannaford – were enrolled into the markdown initiatives through existing contacts with their lighting suppliers – Sylvania and Phillips, respectively. Each of these stores was opposed to the idea of having customers filling out coupons in their aisles; thus markdowns were the only avenue to gain access to these stores. Other stores, such as Aubuchon and CVS, have also expressed interest in markdown initiatives; an MOU was nearly signed with CVS last year. One issue that has arisen in markdowns is the recognition of Efficiency Maine in sponsoring the markdown initiatives. Stickers the say “Courtesy of Efficiency Maine” are required on the packages, although Shaws opted to have a third-party label the products, and not all have been properly labeled. In contrast, Hannaford has their supplier label the products at the factory in China, and has not encountered any issues. In the future, the plan is to insist that attribution to EM is present through stickers or signage. One staffer notes that supermarkets are challenging to deal with, as the Hannaford buyer has recently reduced their markdown orders. Hannaford also had problems with an EM newspaper advertisement run last fall that included a free coupon for customers A disclaimer was planned for the ad in order to notify customers that they cannot redeem the coupon at Shaws and Hannaford, but Hannaford refused to allow use of their name. Hannaford was then inundated with requests from customers with the coupon, even though they were not eligible. Only one interview was conducted with a retailer who participated in the markdown program. This respondent was ‘extremely satisfied’ with the markdowns, saying that it is “fantastic” and “sales are phenomenal.” He reports that there was initially a problem stocking the markdown products because they did not anticipate the long lead time required. Otherwise, he has not encountered any issues with stocking eligible products. Resources. Most program staff members believe that program resources are sufficient, and that the program is well-staffed and that demand is probably growing faster than the budget. One staffer suggests that more in-house staff at EM would be valuable, though more field representatives would also be beneficial. However, staffing requirements depend on how aggressive the program is - if it remains at a low-scale effort then current staffing may be adequate. Several staff members note that the program is reducing the coupon incentive and is contemplating a shift toward greater reliance on marketing. Such marketing could possibly
Nexus Market Research

Process and Impact Evaluation of the Efficiency Maine Lighting Program Page 42
include more emphasis on fixtures and education of customers. However, another notes that it’s become more difficult to do public relations now, as CFLs are “not news anymore.” Most staff members believe that the mix of resources allocated to coupon and markdown approaches is reasonable. Neither strategy works in all situations because some stores prefer the coupons (smaller stores), while others prefer the markdowns (i.e., supermarkets); thus the program should use the opportunities wisely. While markdowns are more cost-effective, they do not provide customer data. One staffer notes that markdowns tend to exhaust funding more quickly than coupons do, which could lead to budget issues even though it may maximize overall sales. Thus, the current approach of offering year-round coupons supplemented by selected markdown events seems reasonable. Staff notes that the program has explored efforts to expand the markdown program with other chains, such as CVS. Tracking. Through the coupons, the program currently tracks the number, manufacturer, model, and wattage of the product as well as the name, address, phone number, email, and home/business of the person purchasing the product. The purchase date has been included on the coupon for the past several years. The markdown program provides far less data – only the number of bulbs sold, store locations, and dates. The shelf inventories conducted by APT also serve to provide data on the stocking practices of retailers participating in the program. In addition, the program has sponsored focus groups, occasional mystery shopping visits to participating stores, and reports on website tracking. One staff member suggests that the program should designate a central repository for all of the EM program data. In order to remain on the cutting edge of best practices, another staffer would like to benchmark the program against other programs from Efficiency Vermont, Wisconsin Focus on Energy, etc. in terms of cost-effectiveness. Quality Control. The program initially limited customers to four bulbs per person, but recently increased that figure to 24 because the limit requires enforcement by retailers, which was difficult to monitor. In addition, the initial limit on fixtures was also four, which was recently increased to 12 so that new construction projects could outfit the entire house. One staffer believes that as long as the bulb or fixture is installed in Maine then the limits are irrelevant. According to another staffer, in situations where the limits are exceeded the purchaser is usually an apartment building owner. Another QC process is the retail staff training done by field representatives to ensure that the coupons are filled out completely and legibly, which serves to promote accurate data collection. In addition, if it is unable to process coupons, EFI will return them to stores. The mystery shopping visits also provide information on the display of POP materials and the knowledge and promotion of retail staff. Lastly, EM is a member of PEARL, which tests CFL products and provides results to members on failure rates for tested models. Staff Assessment. One staffer says that the program “works,” and another says that the program is moving customer to use CFLs, and that CFLs are “no longer a mystery.” Another mentions that the program has improved cost-effectiveness over the past three years. However, one staff
Nexus Market Research

Process and Impact Evaluation of the Efficiency Maine Lighting Program Page 43
member thinks that the geographic distribution of coupons may favor the more populated regions. One staffer believes that the program contractors have not submitted ideas for design changes or program improvements over the past several months, possibly because they are preparing for the upcoming RFP. This sentiment was echoed by one contractor who preferred not to discuss some potential ideas. Program Impacts. Several program staff members note that standard CFL bulbs are now widely available across Maine, although relatively few stores carry specialty models. One staffer notes that Home Depot recently revised their lighting displays, and that Wal-Mart is stocking more bulb models now too. Several note the tremendous increase in bulb sales over the past year as the single piece of evidence that illustrates the impact of the program in Maine16. Note that the surge in CFL sales may have been influenced by national efforts, such as Walmart’s pledge to annually sell 100 million CFLs by 2008. Anecdotally, other staff members report seeing CFL bulbs installed in more homes, and occasional talks with retail staff also indicate higher sales. Stocking Impacts. All participating retailers report that they now stock more CFL bulbs than before they participated in the program. A few stores report they did not carry CFLs until joining the program, a few more have seen a moderate increase in stocking – roughly 10% – while one reports quadrupling the shelf space devoted to CFLs. A few respondents report that they can “hardly keep up” with stocking the bulbs and note that CFLs now garner endcap displays. Only a few stores report that they have reduced their inventory of incandescent bulbs. These stores now stock more CFL models, at the expense of incandescents. However, most respondents report that their stores still stock the same number of incandescent bulbs, and have just expanded their CFL space. Sales Impacts. All retailers report that the program has boosted their sales of CFL bulbs, to varying degrees. Two respondents say their sales have increased “ten-fold” and others report the impact has been “tremendous” and “enormous.” A few mention a more moderate increase – one says about 10%-20%. One manager notes that “people would not be half as interested without the coupons; we would see a dramatic drop.” Another reports that before the program they were not selling CFLs, but now sales have shifted from incandescents to CFLs. All respondents report that the ratio of CFL to incandescent sales has gradually shifted in favor of CFLs over the past few years. Four stores report that they sell more CFLs than incandescent bulbs, three report higher sales of incandescents, and three respondents could not provide an estimate. The four stores that report higher CFL sales cite CFL-to-incandescent ratios from 2:1 to 20:1. One respondent mentions that they hardly move incandescents anymore, unless they are very inexpensive, whereas they hardly sold any CFLs before the program. Another says they would sell 99% incandescent bulbs without the program. The three stores that report higher incandescent sales cite CFL-to-incandescent ratios of 1:3 to 1:8. They mention that some
16 The EM program incentivized 151 thousand CFLs in 2005 and 738 thousand in 2006.
Nexus Market Research

Process and Impact Evaluation of the Efficiency Maine Lighting Program Page 44
customers do not understand CFLs and that incandescents are still cheaper although the coupons do spark the curiosity of the customers. Most retailers report that a four-pack of incandescents costs between $1.29 and $2.69, while CFLs cost, after the coupon, $1-$2 each in multipacks and $3-$5 for single bulbs. Aubuchon presents one exception to this trend, as they offer single CFL bulbs for $0.29 after the coupon. Most participating stores do not stock non-ENERGY STAR CFL bulbs, with the exception of some specialty models. Fixtures. Almost all program staff members believe that the current fixture approach is not working well, and that the program is merely offering fixtures now but not emphasizing them. Several staffers believe that attractive styles and good quality of fixtures is not available yet, and a few suggest that the program should work with fixture manufacturers and distributors. Several note that the program once offered an initiative that incentivized lighting showrooms to stock CFL fixtures, which was discontinued after slow sales. Others mention that fixtures sales have been stagnant nationwide and that other lighting programs are encountering the same issues. One staffer notes that, in other states, the only time fixtures have sold in large quantities is when low-end fixtures are almost “given away.” Several staff members doubt whether the program should devote significant resources to fixtures. As one staffer questioned – “is it cost effective to offer $12 per fixture and $2 per bulb package?” Several mention that focus group research (conducted in Maine) found that some customers equate pin-based fixtures to “Betamax” technology and thus are reluctant to invest in a purchase. Others note that it is much more difficult to persuade people to replace fixtures than bulbs, and that replacement pin-based bulbs are difficult to find in retail stores. One staffer believes that the concern about customers unscrewing CFL light bulbs is not justified, as people generally don’t unscrew bulbs if they are satisfied. However, staff members do suggest a variety of options for promoting fixtures. Several staffers suggest that the program should encourage lighting showrooms to stock a diverse array of stylish CFL models, possibly through offering salesperson incentives. However, another staffer notes that there are few showrooms in Maine and that the home improvement centers serve as the major supply network for fixtures. One staffer suggests that the program offer a mail catalog in order to promote fixtures while two staff members mention that the new GU-24 fixture specification may boost fixture sales. A few staffers suggest that the program educate builders and remodelers in order to influence the remodeling and new construction market. Such an approach would involve discounts on the bulk purchase of selected fixture models popular in remodeling and new construction. However, other staffers do not believe such as approach would succeed. They note that the new construction market in Maine is relatively small; thus there are few large builders to partner with. In addition, most homes are custom-designed (as opposed to spec-built), so the homeowner or decorator selects the fixtures, and not the builder.
Nexus Market Research

Process and Impact Evaluation of the Efficiency Maine Lighting Program Page 45
Participating Retailers. Only six of the ten participating stores stocked CFL fixtures. In addition, several of the stores only carried a few CFL fixture models and thus were not able to provide much information. Lastly, because of time constraints in conducting the interviews, some fixture questions were skipped in order to focus on bulb and program-related question that were considered more important. Thus, the participating retailers provided limited information on fixtures. Several retailers believe that customers purchase the CFL fixtures due to the $12 coupon itself, rather than the energy savings. Several report that pin-based replacement bulbs are not always available, which presents an obstacle to fixture sales. Two respondents report that CFL fixtures, after the $12 coupon, can be cheaper than comparable incandescent models by $10 to $15. Both stores report that customers who purchase CFL fixtures are satisfied, and they have experienced no returns. One store has doubled the shelf space devoted to CFL fixtures, although the space is still not large – maybe four feet wide. This respondent believes that the coupons have occasionally swayed someone who was leaning toward an incandescent model. The other store now carries a few more models (three), and has sold a “little bit” more since joining the program. One respondent reports that CFL fixture sales have increased over the past few years, while two report that demand has not increased. The one respondent who notes an increase believes that the energy efficiency message promoted by the program has helped boost demand.
These retailers do not expect that customer demand will increase in the future. They note that customers do not want to replace light fixtures unless an existing fixture fails, there is a remodeling project, or they are building a new home. In order to boost demand, one suggested placing endcap displays at very low prices. Another suggested that the program could sponsor in-store demonstrations. All four stores report that they sell more incandescents than CFL fixtures, with estimates ranging from 2:1 to 50:1 in favor of incandescents. One respondent says that “sales have never been very good” while another says “fixtures don’t move as much as I think they should, even though we have a big display at the front.”
Nexus Market Research

Process and Impact Evaluation of the Efficiency Maine Lighting Program Page 46
Sales Comparison at Aubuchon Stores in Maine. The 2002 evaluation of the Efficiency Vermont lighting program collected sales data for ENERGY STAR CFL products from five Aubuchon stores in Maine in order to provide a point of comparison for sales data collected at comparable store in Vermont.17 These data were collected from corporate staff for most of the year 2000 and all of 2001 and are displayed in Table 4-1. For the same five Aubuchon stores, program coupon redemptions from the EM program for 2003-2006 are also displayed; these data assume one bulb per coupon, because Aubuchon has primarily sold single-packs according to program staff. At these five Aubuchon stores, sales of CFLs increased over five-fold between 2001 and 2003, then doubled in 2004, and quadrupled in 2005 and again 2006; overall CFL sales increased from 134 in 2001 to nearly 33,000 in 2006. However, note that this increase has occurred during a period when national sales of CFLs have increased as well. Compared to bulbs, sales of fixtures at the Aubuchon stores increased less drastically - from 26 in 2001 to 144 in 2003; since then the volume has fluctuated.
Table 4-1: Comparison of CFL Product Sales at Five Aubuchon Stores in Maine
Sales Data Program Coupon Redemptions
Product 2000* 2001 2003 2004 2005 2006 CFL Bulbs 21 134 835 1,617 7,772 32,883Fixtures 0 26 144 213 180 259Total 21 160 979 1,830 7,952 33,142
*From the second quarter of 2000.
17 Phase 1 Evaluation of the Efficiency Vermont Efficient Products Program. XENERGY, 2002. Prepared for the Vermont Department of Public Service.
Nexus Market Research

Process and Impact Evaluation of the Efficiency Maine Lighting Program Page 47
4.3. Staff and Retailer Program Assessment This section provides an overview of the program strengths and weaknesses, according to program staff and participating retailers. Strengths. Program staff members mention a variety of strengths of the RLP including the development of “a public face” for EM, as it is the only mass market program. Thus the program sells energy efficiency and ENERGY STAR to customers in addition to CFLs. Several staffers cite the fact that the program sold a large volume of products last year at a reasonable price, and one notes that the program seems to be operating smoothly on “autopilot.” Other staffers mention the creativity of the marketing team and the commitment of staff, which has paved the way for a good distribution of sales across the entire state. In addition, one staffer mentions the depth of community involvement and commitment to outreach, including fire chiefs, LED Christmas tree displays, home shows, and marathon sponsorship. Others mention the fact that the program is consistently implemented statewide. Another staffer cites the cost-effective design of the program, which serves as a model example of the government helping people and promoting energy efficiency and environmental stewardship. Several mention the strong involvement of retailers, and one respondent thinks that the program has engaged the market in a flexible manner and developed real partnerships with retailers and manufacturers. They believe it has been one of the more successful regional programs due to its willingness to adapt to the market and strong, experienced management who understands industry and has realistic expectations. Suggestions. Program staff offers a variety of suggestions when asked to provide overall suggestions for the program. Program Expansion. Most staff members believe that the program should expand into other opportunities beyond bulbs, such as other ENERGY STAR appliances. One believes that it is a missed opportunity not to promote other ENERGY STAR products, having already established relationships with retailers. Other suggestions include a refrigerator pick-up program and an ENERGY STAR homes program; one staffer suggests a direct-install program. Several staffers suggest expanding into other fuels in order to provide more comprehensive energy services. There is an ongoing docket regarding potential EM plans if increased funding becomes available. However, one staffer believes that the market penetration of ENERGY STAR clothes washers is already above 50% in Maine, so a program may not be necessary there. Education. One staff member notes that CFLs require more customer knowledge, as they are more like an appliance than a bulb. The next step for the program is to continue educating customers regarding color temperatures and the fact that not all CFLs are dimmable. In order to address this weakness, the staffer suggests providing more resources to the POP materials and sales staff training in order to educate customers. However, one large retailer has begun color-coding packages to indicate the different color temperatures with a brief explanation, which is a
Nexus Market Research

Process and Impact Evaluation of the Efficiency Maine Lighting Program Page 48
sign that the market may address this issue. In addition, one staffer believes that the program lacks the budget for adequate education and advertising. Coupons. One staffer notes that the program is tied to coupons in order to collect customer information, which poses a challenge for both retailers and customers. It can be difficult to locate the model number on the package, though the revised design allowing for multiple packages per coupon will help streamline the process. In contrast, markdowns do not require this customer information, so these agreements alleviate the ‘hassle’ issue from the customer and retailer perspective. Another potential strategy is to print coupons with the bar code for model numbers already on the coupon, so the customer does not have to locate the information. However, this approach would require customization for specific stores and models, though it would obtain better data would. One staff member believes now that CFL bulbs are in big box stores, they will stay there regardless of coupons. According to this staffer, people now believe in the technology, unlike years ago when CFLs were first introduced. Products. According to one staffer, the program is limited by the list of ENERGY STAR-qualified models, which is inaccurate, not always up-to-date, and sometimes inconsistent (a single pack may qualify, whereas the same multi-pack does not qualify). Retailers. Eight of the ten participating retailers are ‘extremely satisfied’ with the overall program; the remaining two respondents are ‘satisfied.’ They report that the program boosts traffic and sales. One respondent says “Sometimes it’s all I can do to keep up with stocking” and another says it’s a “wonderful program.” Others say “customers are satisfied so we’re satisfied” and “it’s working and meets needs of customers. We look good for customer service, good for the public too.” One comments that the program “provides store representatives who share information and explain issues to our staff.”
According to retailers, the best aspect of the program is the coupon itself, either due to the $2 value or the simplicity of instant redemption. As one respondent says “customers love discounts, especially ones they get immediately at the cash register. They don’t trust mail-in rebates.” Another says that “We’re knowledgeable, so education is not important. The coupons are great, and the POP is useful when we are not available.”
While several retailers do not believe the program needs any improvement, several suggest a variety of issues regarding the program that could be improved. Several say that having customers fill out one coupon for each bulb is an obstacle. Another mentions the excessive time for processing coupons, and the cumbersome mail-in process. Another would like to see brightlights, daylights, and halogens eligible for the program. Another suggests that “fixture designs should be more customer-friendly.” Elimination of Coupons. Most retailers believe that sales of CFL bulbs would decrease if the coupons were discontinued and replaced with POP materials and cooperative promotions. They believe that sales will decline from “a little bit” or “not significantly” to estimates of 20% to 50%. Retailers offer the following comments about the prospect of eliminating coupons.
Nexus Market Research

Process and Impact Evaluation of the Efficiency Maine Lighting Program Page 49
“Now customers know about bulbs. They last longer, use less energy, they almost sell themselves. Sales will probably decrease, but not significantly.” “It would drop sales, maybe ½ to ¾ loss. It would affect us. We now promote seven days/week and have 8-10 linear feet of shelf space for CFLs. We probably wouldn’t have that with no coupons.” “There is a definitely a market for CFL bulbs; customers look for them. We wouldn’t stop selling CFLs or having store displays, and would keep plugging away. But sales would decrease, maybe 20%, so it would impact us.”
In addition, several say they expect that repeat buyers will continue to purchase CFLs but that new customers would be less likely to try them out for the first time.
“Sales would decrease. People who bought bulbs would probably still buy them, but wouldn’t get as many new customers to purchase.” “We would never stop [promoting CFLs], but sales would drop. The coupon is a big incentive. Some people are committed buyers and will buy without the coupon, others are not.” “Without coupons the program wouldn’t do squat for us; people won’t read information on shelves without dollar savings. Sales would drop. We would get sales to repeat buyers who are already educated, but few new customers.” “Education is tough when we’re busy, but the coupon is always there.”
Two respondents mention that the price difference between CFLs and incandescents would impact how much their sales decline.
“We would expect to sell as many bulbs, but I hope that prices would have dropped some by the time program eliminates coupons so price difference is not so large.” “We would still tell them [customers] about CFLs, but it might be harder to convince them. Not sure if it would work. As long as price is close to incandescents.”
Several retailers say that it’s a “great program” and to “keep doing what its doing.” One mentions that having the representatives available to the stores is important, while another suggests that the program should expand into other energy-efficient products.
Nexus Market Research

Process and Impact Evaluation of the Efficiency Maine Lighting Program Page 50
4.4. Customer Knowledge, Purchases, Satisfaction, and Demographics
This section provides an overview of customer knowledge, purchases, satisfaction, and demographics. Information is primarily drawn from the customer survey, and supplemented with results of the staff and participating retailer interviews where appropriate.
Awareness, Participation, and Overall Sales Because the general population survey contacted many residents while attempting to reach the markdown purchasers, it provides some basic information on the Maine population as a whole. However, note that these data are based on self-reported information provided by the telephone survey respondents. Based on the general population survey, about 85% of all residents were familiar with CFL bulbs after being read a description (Table 4-2). About 59% of all households in Maine have ever purchased at least one CFL bulb. Lastly, an estimated 25% of households have ever purchased CFL bulb(s) through the EM coupon program and 8% of households have purchased CFL bulb(s) through the markdown program.
Table 4-2: Contact Distribution from General Population Survey (base – all respondents contacted for survey)
Number of Contacts Percent
Percent of All
Contacts Awareness of CFLs
Aware 581 85% 85% Unaware 99 15% 15%
Sum 680 100% Purchase of CFLs (if aware)
Purchased CFLs 402 69% 59% Never Purchased CFLs 179 31% 26%
Sum 581 100% Coupon Participation (if purchased)
Bought only with coupons 66 16% 10% Bought some coupon, some without 101 25% 15% Bought all without coupons 185 46% 28% Don’t Know 50 13% 8%
Sum 402 100% Markdown Participation
Purchased Markdown CFLs 54 16% 8% Did not purchase Markdown CFLs 281 84% 41%
Sum 335 100%
Nexus Market Research

Process and Impact Evaluation of the Efficiency Maine Lighting Program Page 51
Because the general population survey was intended to target those residents who purchased CFL bulbs through the markdown program, the number of surveys completed with respondents who did not purchase markdown bulbs was limited (Table 4-3). The general population survey completed interviews with three types of respondents: markdown purchasers, non-markdown purchasers, and non-purchasers. The survey excluded those respondents who reported only purchasing CFLs through the coupon program, because they could not have bought markdown bulbs and were already being assessed through the coupon participant surveys.
Table 4-3: Respondent Distribution from General Population Survey (base – all contacts)
Group Surveys
Completed
Contacts Excluded
from Survey Total
Percent of All
Contacts Non-Purchaser: Never purchased a CFL bulb 72 206 278 41%Pure Coupon Purchaser: Only purchased CFLs through coupon program (excluded from survey) 0 66 66 10%Non-Markdown Purchaser: Purchased CFLs, possibly some through coupon program but not through markdown program 73 208 281 41%Markdown Purchaser: Purchased a CFL bulb through Markdown program 54 0 54 8%Sum 199 481 680 100%
Nexus Market Research
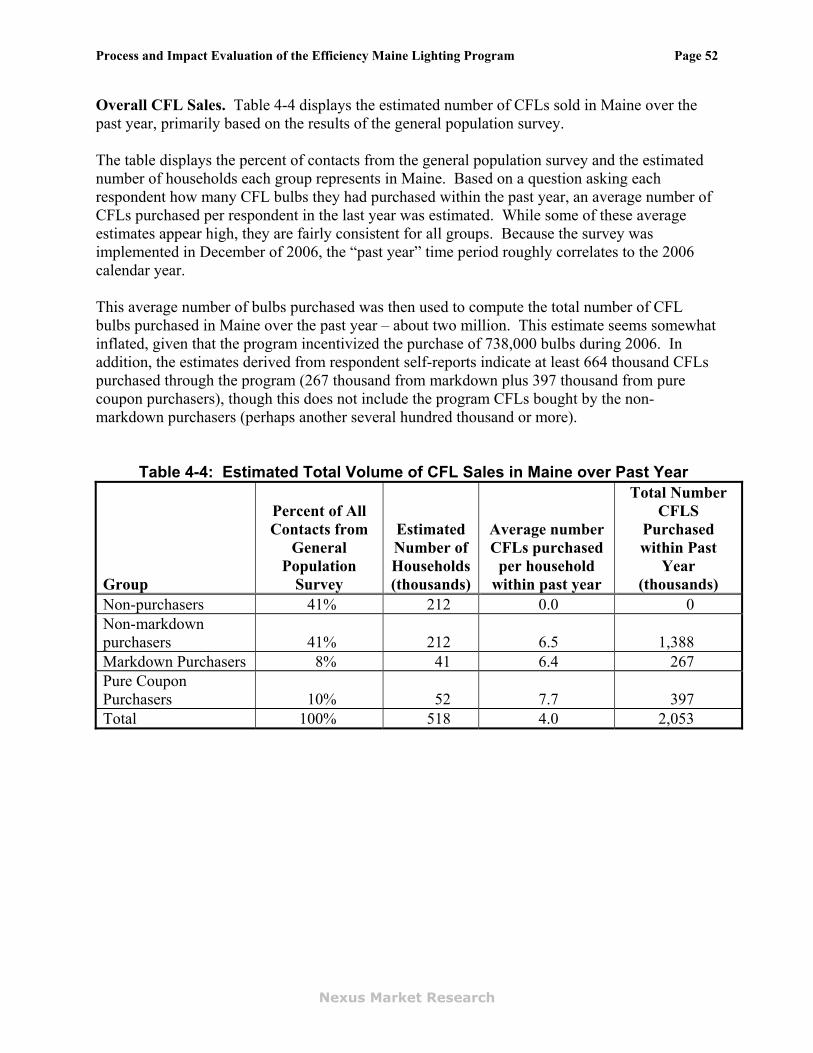
Process and Impact Evaluation of the Efficiency Maine Lighting Program Page 52
Overall CFL Sales. Table 4-4 displays the estimated number of CFLs sold in Maine over the past year, primarily based on the results of the general population survey. The table displays the percent of contacts from the general population survey and the estimated number of households each group represents in Maine. Based on a question asking each respondent how many CFL bulbs they had purchased within the past year, an average number of CFLs purchased per respondent in the last year was estimated. While some of these average estimates appear high, they are fairly consistent for all groups. Because the survey was implemented in December of 2006, the “past year” time period roughly correlates to the 2006 calendar year. This average number of bulbs purchased was then used to compute the total number of CFL bulbs purchased in Maine over the past year – about two million. This estimate seems somewhat inflated, given that the program incentivized the purchase of 738,000 bulbs during 2006. In addition, the estimates derived from respondent self-reports indicate at least 664 thousand CFLs purchased through the program (267 thousand from markdown plus 397 thousand from pure coupon purchasers), though this does not include the program CFLs bought by the non-markdown purchasers (perhaps another several hundred thousand or more).
Table 4-4: Estimated Total Volume of CFL Sales in Maine over Past Year
Group
Percent of All Contacts from
General Population
Survey
Estimated Number of Households (thousands)
Average number CFLs purchased
per household within past year
Total Number CFLS
Purchased within Past
Year (thousands)
Non-purchasers 41% 212 0.0 0 Non-markdown purchasers 41% 212 6.5 1,388 Markdown Purchasers 8% 41 6.4 267 Pure Coupon Purchasers 10% 52 7.7 397 Total 100% 518 4.0 2,053
Nexus Market Research

Process and Impact Evaluation of the Efficiency Maine Lighting Program Page 53
Bulb Purchases According to the respondents interviewed in the general population survey, in households that have purchased CFLs the typical light bulb buyer is equally likely to be male as to be female; in comparison, in nearly-two thirds of those households that have not purchased CFLs report, it is usually a female (Table 4-5).
Table 4-5: Gender of Who Usually Purchases Light Bulbs (base – General Population Survey respondents)
Markdown Purchasers
Non-Markdown Purchasers Non-Purchasers
Overall (except for Pure Coupon
Purchasers) Male 48% 47% 29% 38% Female 50% 52% 65% 58% Unknown 2% 1% 6% 5% Number of Respondents 54 73 72 199 Not surprisingly, the majority of markdown purchasers (67%) mention supermarkets as the store where the typically purchase light bulbs, and another 37% mention hardware stores (Table 4-6). Non-purchasers are more likely to purchase at supermarkets and mass merchants, while non-markdown purchasers tend to buy in relatively similar numbers from supermarkets, home improvement stores, and mass merchants.
Table 4-6: Where do you Usually Purchase Light Bulbs (base – General Population Survey respondents)
Markdown Purchasers
Non-Markdown Purchasers
Non-Purchasers
Overall (except for Pure Coupon
Purchasers) Supermarket 67% 27% 43% 38% Hardware 37% 19% 22% 22% Home improvement 26% 27% 21% 24% Mass merchant or discount 28% 32% 39% 33% Pharmacy or drug store 4% 1% 0% 1% From Power Company 0% 1% 0% 1% Already in home/apartment 0% 0% 3% 1% Lighting design or electrical 2% 0% 1% 1% Other 0% 1% 1% 1% Don’t know 0% 1% 0% 1% Number of respondents 54 73 72 199
Nexus Market Research

Process and Impact Evaluation of the Efficiency Maine Lighting Program Page 54
Nexus Market Research
Knowledge of CFL Bulbs Approximately two-thirds of markdown (69%) and non-markdown (63%) purchasers report that they were “very familiar” with CFL bulbs prior to having them described by the survey interviewer (Table 4-7). In contrast, only one-fourth of non-purchasers were “very familiar” or “not at all familiar” with CFL bulbs prior to the survey.
Table 4-7: Pre-Survey Familiarity with CFL Bulbs (base – all General Population Survey respondents by purchase behavior)
Markdown Purchasers
Non-Markdown Purchasers
Non-Purchasers
Pure Coupon
Purchasers Overall Very familiar 69% 63% 28% 65% 49% Somewhat familiar 29% 27% 26% 29% 27% Slightly familiar 2% 10% 19% 6% 13% Not at all familiar 0% 0% 25% 0% 10% Don’t know 0% 0% 1% 0% 0% Number of respondents 54 73 72 66 199 Prior to purchasing their lighting products with a coupon, 90% or more of all coupon participants express at least some knowledge of CFL bulbs (Table 4-8). Note that respondents who purchase more than one type of product (i.e., bulb plus interior fixture) are counted once in each relevant column (i.e., both the Bulb column and the Interior Fixture column); however, each respondent is only counted once in the Overall column. This occurs in all tables displaying the results of the Recent Coupon surveys.
Table 4-8: Pre-Purchase Knowledge of CFL Bulbs (Base – all coupon respondents by purchase behavior)
Recent Coupon Participants
Past Bulb Coupon
Participant Bulb Interior Fixture
Exterior Fixture Overall
Excellent knowledge 16% 18% 24% 14% 18% Above average knowledge 29% 22% 16% 23% 22% Average knowledge 30% 29% 24% 46% 29% Little knowledge 16% 25% 23% 7% 25% No knowledge 10% 6% 13% 10% 6% Don’t Know/Refused 0% 0% 0% 0% 0% Number of respondents 70 75 61 58 170
About one-third of recent coupon participants who are familiar with CFLs became aware of the technology within the past two years (Table 4-9). In contrast, about two-thirds of markdown customers became aware of CFLs within the past two years, indicating that the markdown program may be reaching new customers.

and Impact Evaluation of the Efficiency Maine Lighting Program Page 55
Nexus Market Research
Table 4-9: When First Became Aware of CFL Bulbs
(Base – respondents familiar with CFL bulbs) Recent Coupon Participants General Population
Past Bulb Coupon
Participant Bulb Interior Fixture
Exterior Fixture Overall
Markdown Purchasers
Non-Markdown Purchasers
Non- Purchasers
Pure Coupon
Purchasers Overall Within past year 10% 19% 23% 9% 19% 28% 16% 30% 37% 25% Two years 13% 15% 8% 16% 15% 39% 22% 30% 16% 26% Three years 11% 19% 21% 19% 19% 11% 11% 13% 19% 12% Four years 9% 4% 13% 5% 4% 6% 8% 8% 8% 8% Five years 20% 12% 11% 17% 12% 11% 19% 8% 8% 14% More than five years 32% 31% 24% 44% 31% 6% 21% 11% 13% 14% Number of respondents 63 71 61 51 152 54 73 53 38 218
Process

Process and Impact Evaluation of the Efficiency Maine Lighting Program Page 56
Nexus Market Research
Respondents first hear about CFL bulbs primarily through three sources: TV, radio or newspaper advertisements; retail store displays; and word of mouth through friends, family, neighbors, and co-workers (Table 4-10). It appears that advertisements are the most common source of learning about CFL bulbs – cited by about 40% of the Recent Coupon and General Population Survey respondents. Between 1% and 8% of aware respondents from each group cite Efficiency Maine as the source of learning about CFLs. Note that some portion of the respondents who cited advertisements may have learned about CFLs through and Efficiency Maine ad, but did not name the sponsor.

and Impact Evaluation of the Efficiency Maine Lighting Program Page 57
Nexus Market Research
Table 4-10: How First Heard of CFL Bulbs
(Base – respondents familiar with CFL bulbs; multiple response) Recent Coupon Participants General Population
Past Bulb Coupon
Participant Bulb Interior Fixture
Exterior Fixture Overall
Markdown Purchasers
Non-Markdown Purchasers
Non- Purchasers
Pure Coupon
Purchasers Overall Through TV, radio, or newspaper advertisement 22% 40% 26% 27% 40% 52% 34% 47% 35% 41%On display at a retail store 30% 18% 37% 26% 18% 28% 14% 15% 16% 15%Through a friend, family, neighbor, or co-worker 20% 14% 19% 22% 14% 30% 25% 22% 24% 22%Efficiency Maine 8% <1% 4% 2% <1% 6% 6% 8% 2% 6%At a promotion or event 2% 10% 2% 5% 9% 6% 6% 6% 5% 6%Saw installed at other location 0% 0% 0% 0% 0% 0% 6% 0% 0% 3%From power company 0% 0% 0% 0% 0% 0% 6% 0% 0% 3%Through low income program 0% 0% 0% 0% 0% 0% 1% 4% 0% 3%Other 5% 8% 4% 9% 8% 0% 7% 0% 10% 6%Don’t know 14% 12% 13% 10% 12% 0% 3% 2% 8% 3%Number of respondents 64 71 53 51 152 54 73 53 38 218
Process

Process and Impact Evaluation of the Efficiency Maine Lighting Program Page 58
Reasons for Purchasing and Not Purchasing CFLs Most program staff agree that customers purchase bulbs for three possible reasons: saving money for themselves, saving energy to help the environment, and the convenience of not replacing bulbs as often. Most of the participating retailers interviewed agree with these reasons – they believe that customers purchase the bulbs in order to save energy and money or to avoid the hassle of replacing bulbs as often. Barriers to Purchase. According to program staff, barriers to the purchase of CFLs include the customer’s own lack of knowledge regarding CFLs and their higher cost (particularly for specialty models). One barrier specific to the program is the coupon itself, both in terms of the hassle for customers to fill it out and for the store staff to check the completed forms. Retailers believe that CFL bulbs don’t always fit into all fixtures, and that customers may not like the spiral shapes, the slower turn-on speed, and the quality of light compared to that from an incandescent bulb. One respondent mentions the hazardous nature of the mercury in bulbs. According to the markdown survey, respondents who are aware of CFL bulbs but have never purchased them cite a wide variety of reasons for the decision not to purchase (Table 4-11). One-fourth say that CFL bulbs are too expensive, and 19% report that they have not thought about it or gotten around to it. Eight percent of respondents are waiting for their current non-CFL bulbs to burn out. Many respondents (23%) do not know why they have not purchased CFL bulbs.
Table 4-11: Why Have Not Purchased CFL Bulbs (base – respondents familiar with CFL bulbs but how have not purchased; multiple response)
Why Not Purchased CFLs Percentage of Respondents
Too expensive 25% Have not thought about or gotten around to it 19% Don’t like the light or color 12% Doesn’t fit properly 10% Waiting for others to burn out 8% Not available in my store or area 4% Have CFLs in home but did not purchase 4% They don’t last long 2% Aesthetics 2% Skeptical of savings claims 2% Do not like fluorescent lights 2% Other 2% Don’t know 23% Number of respondents 53
Nexus Market Research
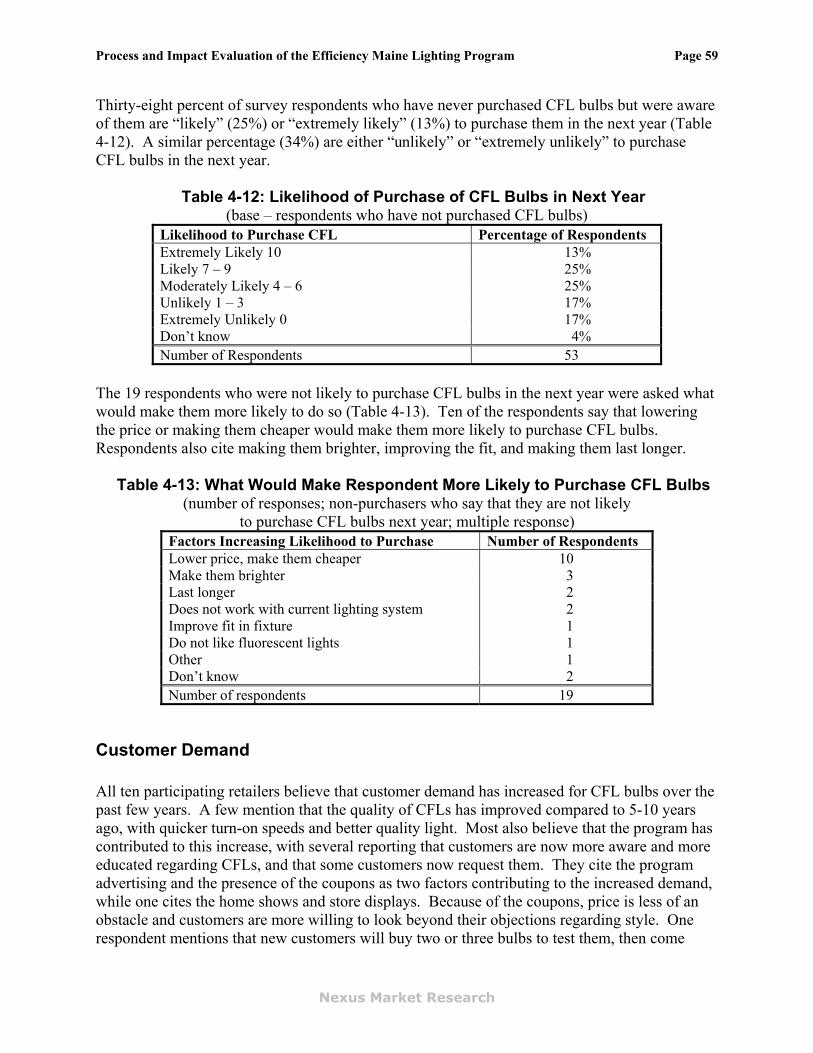
Process and Impact Evaluation of the Efficiency Maine Lighting Program Page 59
Thirty-eight percent of survey respondents who have never purchased CFL bulbs but were aware of them are “likely” (25%) or “extremely likely” (13%) to purchase them in the next year (Table 4-12). A similar percentage (34%) are either “unlikely” or “extremely unlikely” to purchase CFL bulbs in the next year.
Table 4-12: Likelihood of Purchase of CFL Bulbs in Next Year (base – respondents who have not purchased CFL bulbs)
Likelihood to Purchase CFL Percentage of Respondents Extremely Likely 10 13% Likely 7 – 9 25% Moderately Likely 4 – 6 25% Unlikely 1 – 3 17% Extremely Unlikely 0 17% Don’t know 4% Number of Respondents 53
The 19 respondents who were not likely to purchase CFL bulbs in the next year were asked what would make them more likely to do so (Table 4-13). Ten of the respondents say that lowering the price or making them cheaper would make them more likely to purchase CFL bulbs. Respondents also cite making them brighter, improving the fit, and making them last longer.
Table 4-13: What Would Make Respondent More Likely to Purchase CFL Bulbs (number of responses; non-purchasers who say that they are not likely
to purchase CFL bulbs next year; multiple response) Factors Increasing Likelihood to Purchase Number of Respondents Lower price, make them cheaper 10 Make them brighter 3 Last longer 2 Does not work with current lighting system 2 Improve fit in fixture 1 Do not like fluorescent lights 1 Other 1 Don’t know 2 Number of respondents 19
Customer Demand All ten participating retailers believe that customer demand has increased for CFL bulbs over the past few years. A few mention that the quality of CFLs has improved compared to 5-10 years ago, with quicker turn-on speeds and better quality light. Most also believe that the program has contributed to this increase, with several reporting that customers are now more aware and more educated regarding CFLs, and that some customers now request them. They cite the program advertising and the presence of the coupons as two factors contributing to the increased demand, while one cites the home shows and store displays. Because of the coupons, price is less of an obstacle and customers are more willing to look beyond their objections regarding style. One respondent mentions that new customers will buy two or three bulbs to test them, then come
Nexus Market Research

Process and Impact Evaluation of the Efficiency Maine Lighting Program Page 60
back and buy more once they are satisfied. Another respondent reports that customers like the higher wattages, as they tend to sell out more. Several mention that LED Christmas bulbs have been very popular this season. All participating retailers believe that customer demand for CFL bulbs will continue to increase over the next few years. They cite the fact that people are more conscious of energy costs and aware of CFLs and their energy-saving and longer life benefits. However, one respondent mentions that sales may gradually level off due to their longer lifetime, reducing the need for replacement bulbs. Another mentions that LEDs will eventually displace CFLs; this issue was also cited by a program staff member.
Customer Satisfaction Most all retailers report that customers are satisfied with the CFL bulbs purchased at their stores. They report that customers rarely return bulbs, and when they do, it’s usually because of a malfunction and the store typically replaces the bulb at no cost. One store employee says that certain brands do not provide sufficient light output. Another respondent reports that most returns occur because customers install the bulb by twisting the bulb, not the base; he mentions that the Efficiency Maine TV ad shows people installing bulbs in this incorrect manner. In contrast, one retailer says that the store hears positive comments because customers “couldn’t believe” the drop in electricity consumption. According to the customer surveys, respondents also report very high levels of satisfaction with the CFL bulbs purchased (Table 4-14). Of the respondents who recently purchased through the coupon or markdown programs, between 69% and 76% are “very satisfied.” Only 3% to 4% of participants report dissatisfaction levels. In contrast, non-markdown purchasers are somewhat less satisfied; 32% report being “very satisfied” and 44% being “satisfied” with CFL bulbs overall (i.e., non-program purchases and perhaps some coupon purchases too).
Table 4-14: Satisfaction with CFL Bulbs Purchased (Base – respondents who have purchased CFL bulbs)
Satisfaction with CFLs
Past Bulb Coupon
Participant
Recent Bulb Coupon
Participant Markdown Purchasers
Non-Markdown Purchasers
Very Satisfied 71% 76% 69% 32% Satisfied 23% 19% 20% 44% Neither satisfied or dissatisfied 3% 2% 8% 14% Dissatisfied 3% 2% 2% 7% Very Dissatisfied 0% 2% 2% 3% Don’t know/Refused 0 1 0 0 Number of Respondents 70 74 51 72
Nexus Market Research

Process and Impact Evaluation of the Efficiency Maine Lighting Program Page 61
Nexus Market Research
Forty-one percent of all coupon participants report purchasing CFL bulbs prior to their program purchase (Table 4-15). The figure is higher for fixture purchasers (50%-65%), as might be expected, as fixture purchasers are likely to already have had experience with CFL bulbs before purchasing a fixture. In contrast, only 20% of the markdown participants had purchased CFL bulbs prior to their markdown purchase. These results suggest that the markdown program is attracting a larger share of new customers who have never before purchased CFLs.
Table 4-15: Have Purchased CFL Bulbs prior to Coupon Purchase (Base – respondents who purchased CFL bulbs through program)
Recent Coupon Participants Have Purchased Additional CFL Bulbs
Past Bulb Coupon
Participant Bulb Interior Fixture
Exterior Fixture Overall
Markdown Purchasers
Yes 41% 40% 50% 65% 41% 20% No 52% 58% 50% 35% 57% 80% Don’t know 7% 2% 0% 0% 2% 0% Number of Respondents 70 75 61 58
170 54
Consumer Experiences with CFL Fixtures About three-quarters of coupon participants express some knowledge of CFL fixtures prior to the coupon purchase (Table 4-16). In contrast, only one-half of markdown purchasers and other groups express any knowledge of CFL fixtures.18 Interestingly, only about one-quarter of fixture coupon participants rate their knowledge as “above average” or better, prior to their purchase of a fixture.
P
18 Note that non-markdown purchasers and non-purchasers were asked about their level of knowledge “prior to this survey” since there is no defined point in time to use where they purchased a program product.

and Impact Evaluation of the Efficiency Maine Lighting Program Page 62
Nexus Market Research
Table 4-16: Pre-Purchase Knowledge of CFL Fixtures19
(Base – all respondents by purchase behavior) Recent Coupon Participants General Population
Knowledge Level Bulb
Interior Fixture
Exterior Fixture Overall
Markdown Purchasers
Non-Markdown Purchasers
Non- Purchasers
Pure Coupon
Purchasers Overall Excellent knowledge 9% 14% 8% 9% 4% 0% 6% 2% 3% Above average knowledge 15% 13% 17% 15% 2% 12% 6% 7% 9% Average knowledge 27% 26% 48% 27% 15% 26% 19% 34% 23% Little knowledge 22% 15% 15% 22% 33% 18% 21% 29% 23% No knowledge 25% 25% 12% 25% 44% 44% 47% 23% 41% Don’t Know/Refused 2% 7% 2% 2% 2% 0% 2% 5% 1% Number of respondents 75 61 58 170 54 73 53 50 230
P
19 Note that non-markdown purchasers and non-purchasers were asked about their level of knowledge “prior to this survey” since there is no defined point in time to use where they purchased a program product.
Process

Process and Impact Evaluation of the Efficiency Maine Lighting Program Page 63
Nexus Market Research
Over 40% of coupon participants who are familiar with fixtures report having become aware of them within the past two years (Table 4-17). In contrast, three-quarters of aware markdown purchasers became familiar with fixtures within the past two years.

and Impact Evaluation of the Efficiency Maine Lighting Program Page 64
Nexus Market Research
Table 4-17: When First Became Aware of CFL Fixtures
(Base – respondent familiar with CFL fixtures) Recent Coupon Participants General Population
Bulb Interior Fixture
Exterior Fixture Overall
Markdown Purchasers
Non-Markdown Purchasers
Non- Purchasers
Pure Coupon
Purchasers Overall Within past year 15% 17% 10% 15% 31% 24% 41% 24% 33%Two years 27% 20% 24% 27% 45% 26% 19% 30% 25%Three years 5% 18% 19% 6% 10% 7% 15% 7% 10%Four years 10% 10% 4% 10% 0% 10% 4% 13% 7%Five years 13% 14% 16% 13% 10% 5% 11% 17% 8%More than five years 30% 21% 27% 29% 3% 29% 11% 10% 18%Number of respondents 55 42 49 128 29 42 27 31 133
Process

Process and Impact Evaluation of the Efficiency Maine Lighting Program Page 65
Nexus Market Research
Respondents primarily first hear about CFL fixtures through three sources: TV, radio or newspaper advertisements; retail store displays; and by word of mouth through friends, family, neighbors, and co-workers (Table 4-18). While coupon participants are most likely to have learned about fixtures through retail displays (30%), markdown purchasers are more likely to have learned through an advertisement (52%). Between 2% and 5% of aware respondents from each group cite Efficiency Maine as the source of learning about CFL fixtures.
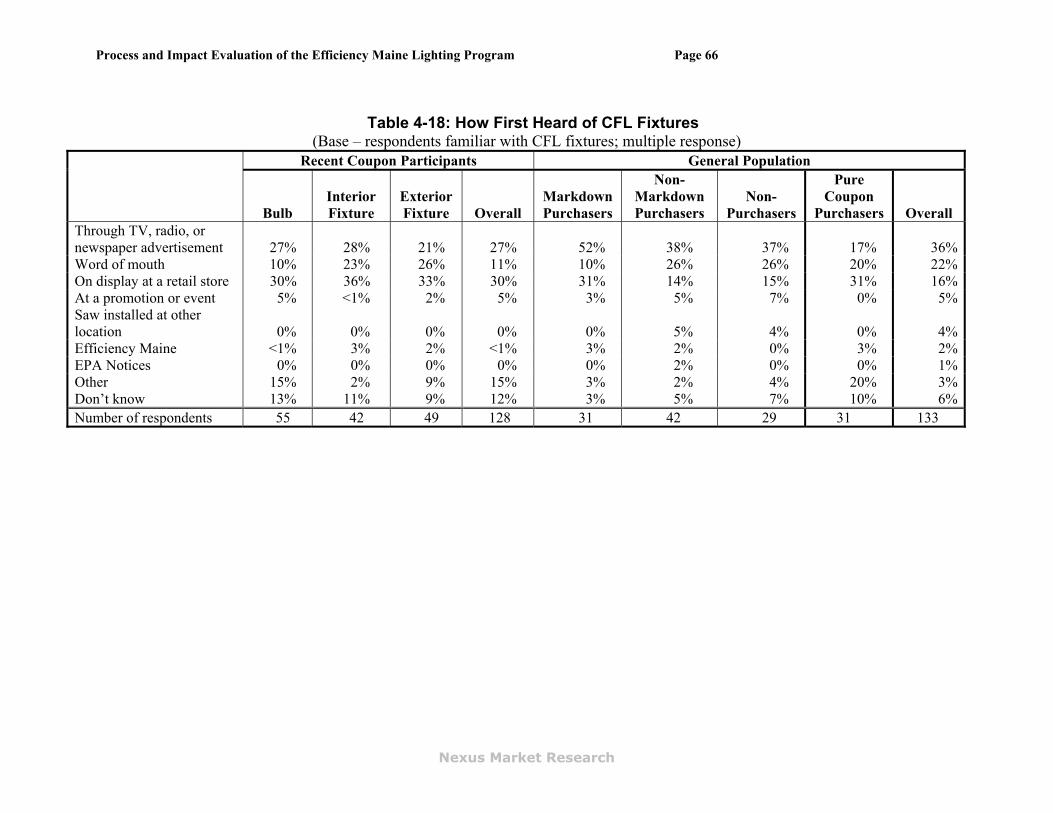
and Impact Evaluation of the Efficiency Maine Lighting Program Page 66
Nexus Market Research
Table 4-18: How First Heard of CFL Fixtures
(Base – respondents familiar with CFL fixtures; multiple response) Recent Coupon Participants General Population
Bulb Interior Fixture
Exterior Fixture Overall
Markdown Purchasers
Non-Markdown Purchasers
Non- Purchasers
Pure Coupon
Purchasers Overall Through TV, radio, or newspaper advertisement 27% 28% 21% 27% 52% 38% 37% 17% 36%Word of mouth 10% 23% 26% 11% 10% 26% 26% 20% 22%On display at a retail store 30% 36% 33% 30% 31% 14% 15% 31% 16%At a promotion or event 5% <1% 2% 5% 3% 5% 7% 0% 5%Saw installed at other location 0% 0% 0% 0% 0% 5% 4% 0% 4%Efficiency Maine <1% 3% 2% <1% 3% 2% 0% 3% 2%EPA Notices 0% 0% 0% 0% 0% 2% 0% 0% 1%Other 15% 2% 9% 15% 3% 2% 4% 20% 3%Don’t know 13% 11% 9% 12% 3% 5% 7% 10% 6%Number of respondents 55 42 49 128 31 42 29 31 133
Process

Process and Impact Evaluation of the Efficiency Maine Lighting Program Page 67
Nexus Market Research
Coupon participants report very high levels of satisfaction with the CFL fixtures purchased (Table 4-19). Between 66% and 78% are “very satisfied” and only 4% report any dissatisfaction.
Table 4-19: Satisfaction with CFL Fixtures Purchased (Base – respondents who have purchased CFL fixtures)
Satisfaction with CFLs
Recent Interior Fixture Coupon
Participant
Recent Exterior Fixture Coupon
Participant Very Satisfied 66% 78% Satisfied 24% 18% Neither satisfied or dissatisfied 4% 0% Dissatisfied 2% 4% Very Dissatisfied 2% 0% Don’t know/Refused 11 3 Number of Respondents 50 55
Only 15% of all coupon participants report purchasing a fixture prior to their coupon purchase, though 29% of interior fixture purchasers had done so (Table 4-20).
Table 4-20: Have Purchased CFL Fixtures prior to Coupon Purchase (Base – respondents who purchased CFL fixtures through coupon program)
Have Purchased CFL Fixtures Prior to Coupon Purchase
Recent Bulb Coupon
Participant
Recent Interior Fixture Coupon
Participant
Recent Exterior Fixture Coupon
Participant
Overall Recent Coupon
Participant Yes 15% 29% 16% 15% No 77% 71% 84% 78% Don’t know 8% 0% 0% 7% Number of Respondents 75 61 58 170
Customer Demographics Respondents were asked a short series of seven demographic questions to better understand who has participated in the coupon and markdown programs and who generally does and does not purchase CFL bulbs and fixtures. We compare the demographic characteristics of respondents to those for households in Maine overall, as reported in the 2005 American Community Survey (ACS) implemented by the U.S. Bureau of the Census. Coupon participants are more likely to own their homes (86%) than are Maine householders overall (72%) (Table 4-21). This is particularly true for fixture coupon participants, who, as might be expected, are most likely to own their own homes (94%+). The general population survey tends to also favor people who own their own homes (80% overall). However, non-purchasers and pure coupon purchasers all have home ownership rates (78%) closer to that of the general population. These results might be expected since renters are more likely to rely on landlords to provide lighting for the rental units.

and Impact Evaluation of the Efficiency Maine Lighting Program Page 68
Nexus Market Research
Table 4-21: Owner and Renter Status Recent Coupon Participants General Population
Past Bulb Coupon
Participant Bulb Interior Fixture
Exterior Fixture Overall
Markdown Purchasers
Non-Markdown Purchasers
Non- Purchasers
Pure Coupon
Purchasers Overall ACS Own 96% 86% 95% 94% 86% 84% 82% 78% 78% 80% 72% Rent 4% 13% 5% 4% 12% 17% 18% 23% 22% 20% 28% Other 0% 2% <1% 2% 2% 0% 0% 0% 0% 0% 0% Number of respondents 70 75 61 58 170 54 72 71 50 247 542,158 Refused 0 0 0 0 0 0 1 1 0 2 n/s
Process

Process and Impact Evaluation of the Efficiency Maine Lighting Program Page 69
Nexus Market Research
Coupon participants are more likely to live in single-family homes (85%) than are Maine residents overall (67%) (Table 4-22). However, the general population survey respondents, particularly non-purchasers (73%), more closely mirror the general population in terms of residence type.
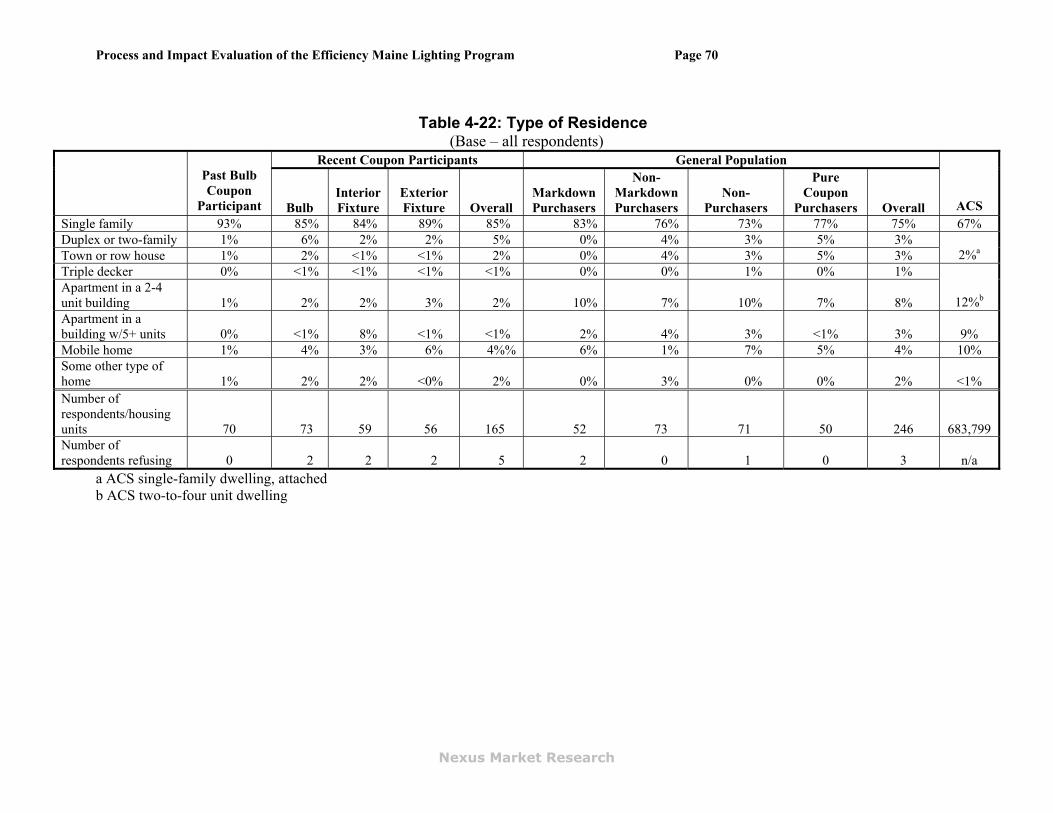
and Impact Evaluation of the Efficiency Maine Lighting Program Page 70
Nexus Market Research
Table 4-22: Type of Residence
(Base – all respondents) Recent Coupon Participants General Population
Past Bulb Coupon
Participant Bulb Interior Fixture
Exterior Fixture Overall
Markdown Purchasers
Non-Markdown Purchasers
Non- Purchasers
Pure Coupon
Purchasers Overall ACS Single family 93% 85% 84% 89% 85% 83% 76% 73% 77% 75% 67% Duplex or two-family 1% 6% 2% 2% 5% 0% 4% 3% 5% 3% Town or row house 1% 2% <1% <1% 2% 0% 4% 3% 5% 3% 2%a
Triple decker 0% <1% <1% <1% <1% 0% 0% 1% 0% 1% Apartment in a 2-4 unit building 1% 2% 2% 3% 2% 10% 7% 10% 7% 8% 12%b
Apartment in a building w/5+ units 0% <1% 8% <1% <1% 2% 4% 3% <1% 3% 9% Mobile home 1% 4% 3% 6% 4%% 6% 1% 7% 5% 4% 10% Some other type of home 1% 2% 2% <0% 2% 0% 3% 0% 0% 2% <1% Number of respondents/housing units 70 73 59 56 165 52 73 71 50 246 683,799 Number of respondents refusing 0 2 2 2 5 2 0 1 0 3 n/a
a ACS single-family dwelling, attached b ACS two-to-four unit dwelling
Process

Process and Impact Evaluation of the Efficiency Maine Lighting Program Page 71
Nexus Market Research
Household sizes vary widely for the survey respondents, though the coupon participants tend to be from larger households, particularly four-person (23% vs 12%), than Maine residents as a whole (Table 4-23). Markdown purchasers are more likely to be from a two-person household (57% vs 39%), though the overall general population survey tends to closely match Maine residents in terms of household size.

and Impact Evaluation of the Efficiency Maine Lighting Program Page 72
Nexus Market Research
Table 4-23: Size of Household Recent Coupon Participants General Population
Past Bulb Coupon
Participant Bulb Interior Fixture
Exterior Fixture Overall
Markdown Purchasers
Non-Markdown Purchasers
Non- Purchasers
Pure Coupon Purchasers Overall ACS
One person 9% 15% 11% 6% 14% 15% 25% 32% 5% 25% 27% Two people 47% 44% 38% 41% 43% 57% 33% 32% 48% 36% 39% Three people 9% 15% 20% 15% 15% 11% 21% 15% 15% 17% 16% Four people 17% 24% 16% 20% 23% 13% 10% 15% 24% 13% 12% Five people 17% 4% 11% 12% 4% 2% 10% 4% 7% 7% 5% Six people 1% <1% 3% 4% <1% 2% 0% 1% 0% 1% 1% Seven or more people 0% <1% 2% 2% <1% 0% 3% 0% <1% 1% 1% Number of respondents 70 74 59 57 168 53 73 72 50 248 542,158 Number of respondents refusing 0 1 2 1 2 1 0 0 0 1 n/a
Process

Process and Impact Evaluation of the Efficiency Maine Lighting Program Page 73
Nexus Market Research
The overall coupon participants and overall general population respondents tend to parallel the age distribution of Mainers as a whole (Table 4-24). However, markdown purchasers tend to be slightly older than Maine residents as a whole and cluster (58% vs. 40%) in the 45 – 64 age grouping.

and Impact Evaluation of the Efficiency Maine Lighting Program Page 74
Nexus Market Research
Table 4-24: Age of Respondent or Householder Recent Coupon Participants General Population
Past Bulb Coupon
Participant Bulb Interior Fixture
Exterior Fixture Overall
Markdown Purchasers
Non-Markdown Purchasers
Non- Purchasers
Pure Coupon Purchasers Overall ACS
18 to 24 years 0% 2% 2% 3% 2% 4% 3% 3% 0% 3% 5% 25 to 34 years 9% 12% 20% 13% 12% 6% 4% 9% 21% 7% 35 to 44 years 19% 16% 25% 31% 17% 10% 20% 20% 23% 19% 33% 45 to 54 years 33% 24% 29% 28% 24% 34% 24% 24% 28% 25% 55 to 64 years 20% 22% 21% 11% 22% 24% 19% 14% 8% 16% 40% 65 or more years 20% 24% 3%
13% 23% 22% 30% 31%
19% 29% 22%
Number of respondents 70 68 59 53 155 50 70 71 46 237 542,158 Number of respondents refusing 0 7 2 5 15 4 3 1 4 12 n/a
Process

Process and Impact Evaluation of the Efficiency Maine Lighting Program Page 75
Nexus Market Research
Coupon and markdown purchasers are much more likely than Maine residents to have attained higher educational status (Table 4-25). Twenty-six percent of Maine residents have graduated from a 4-year college compared to 54% for all coupon participants and 56% for markdown purchasers. However, note that the respondents to the overall general population survey tend to also be higher educated than Maine residents.

and Impact Evaluation of the Efficiency Maine Lighting Program Page 76
Nexus Market Research
Table 4-25: Educational Attainment Recent Coupon Participants General Population
Past Bulb Coupon
Participant Bulb Interior Fixture
Exterior Fixture Overall
Markdown Purchasers
Non-Markdown Purchasers
Non- Purchasers
Pure Coupon
Purchasers Overall ACS Less than high school 0% <1% <1% 3% <1% 2% 1% 6% 0% 3% 11% High school graduate 20% 27% 15% 33% 27% 26% 33% 39% 27% 34% 35% Technical or trade school graduate 0% <1% 4% 9% <1% 2% 1% 1% 0% 1% Some college 10% 13% 13% 10% 13% 8% 18% 10% 13% 14% Two-year college graduate 9% 6% 9% 10% 6% 8% 10% 12% 8% 10% 28% Four-year college graduate 32% 31% 31% 17% 31% 26% 19% 22% 17% 21% Some graduate or professional school 4% 8% 18% 5% 8% 2% 3% 0% 3% 2% Graduate or professional degree 25% 15% 11% 14% 15% 28% 15% 10% 32% 15% 26% Number of Respondents 69 69 54 52 154 51 73 69 46 239 542,158 Number of respondents refusing 1 6 7 6 16 3 0 3 4 10 n/a
Process

Process and Impact Evaluation of the Efficiency Maine Lighting Program Page 77
Nexus Market Research
In keeping with their educational attainment, coupon participants and particularly markdown purchasers tend to have higher household incomes than Maine residents overall (Table 4-26). This data is also probably linked to homeownership rates – as lower-income people are less likely to own their own homes. The incomes of overall general population survey respondents tend to match Maine residents fairly well.

and Impact Evaluation of the Efficiency Maine Lighting Program Page 78
Nexus Market Research
Table 4-26: Annual Household Income Recent Coupon Participants General Population
Past Bulb Coupon
Participant Bulb Interior Fixture
Exterior Fixture Overall
Markdown Purchasers
Non-Markdown Purchasers
Non- Purchasers
Pure Coupon
Purchasers Overall ACS Less than $15,000 0% 3% 4% 11% 3% 7% 12% 33% 7% 19% 16% $15,000 to $24,999 10% 14% 7% 13% 14% 2% 14% 15% 13% 13% 12% $25,000 to $34,999 17% 22% 9% 7% 22% 14% 17% 17% 25% 17% 13% $35,000 to $49,999 24% 28% 23% 14% 28% 19% 17% 10% 25% 15% 16% $50,000 to $74,999 24% 17% 21% 19% 17% 21% 19% 8% 11% 15% 21% $75,000 to $99,999 14% 3% 19% 26% 3% 14% 7% 6% 8% 7% 10% $100,000 or more 10% 14% 17% 10% 14% 21% 14% 10% 10% 13% 11% Number of respondents 29 48 34 36 102 42 58 48 32 182 542,158 Number of respondents refusing 41 27 27 22 68 12 15 24 16 67 n/a
Process

Process and Impact Evaluation of the Efficiency Maine Lighting Program Page 79
Nexus Market Research
While coupon participants and Maine residents as a whole are both about one-half male and female, the markdown purchasers are much more likely to be female (67%) (Table 4-27). The overall respondents to the general population survey tend to favor women (65%).

and Impact Evaluation of the Efficiency Maine Lighting Program Page 80
22 Haskell Street, Cambridge, MA 02140 Phone: (617) 497-7544 Fax: (617) 497-7543
www.nexusmarketresearch.com
Table 4-27: Gender of Respondent
Recent Coupon Participants General Population
Past Bulb Coupon
Participant Bulb Interior Fixture
Exterior Fixture Overall
Markdown Purchasers
Non-Markdown Purchasers
Non- Purchasers
Pure Coupon
Purchasers Overall ACS Male 56% 49% 61% 56% 50% 33% 41% 28% 45% 35% 48% Female 44% 51% 39% 44% 50% 67% 59% 72% 55% 65% 52% Number of respondents or people over 18 70 75 61 58 170 54 73 72 50 249 1,007,454
Process

Process and Impact Evaluation of the Efficiency Maine Lighting Program Page 81
5. Impact Evaluation This section presents the complete results of the impact evaluation.
5.1. Telephone Survey Findings This section presents results from the telephone survey of customers who participated in the program through the coupon or markdown programs. Throughout this section, all reported sample sizes (n) are unweighted, while all percentages, sums, averages, and other results are weighted (unless otherwise noted) by population or total product sales. Outliers in the data set were identified by professional judgment.
Purchases, Installation, Removals, and Failure to Install We used a two-step process to estimate the total number of products purchased in the telephone survey. First, we asked respondents if they remembered purchasing the number of products we had on record from the EFI database. If the respondent said yes, we recorded the number in the records as the actual number of products purchased. For those who said they purchased a different number of products, we recorded the number they recalled as the actual number purchased.20
20 Determining the actual number of products purchased through the program in a household can be problematic for a couple of reasons. First, program purchases may have been made more than once and variations in the way that coupons were filled out by participants—with slight differences in contact name (e.g. contact name listed as Bob Smith v. R. Smith), different members of the same household making a purchase, slight differences in address listings, and different phone numbers (e.g. home number v. mobile number) make aggregating customer records by household a difficult task. Secondly, respondent recollection of program purchases, particularly in the case of CFLs, where the number of products involved can be relatively large, may not be reliable.
22 Haskell Street, Cambridge, MA 02140 Phone: (617) 497-7544 Fax: (617) 497-7543
www.nexusmarketresearch.com

Process and Impact Evaluation of the Efficiency Maine Lighting Program Page 82
Table 5-1 summarizes the unweighted number of products respondents recall purchasing through the program; it also weights their responses to the entire population of products purchased.
Table 5-1: Purchased through the Program
n
UnweightedNumber
Purchased
Weighted Number
Purchasedb
Markdown CFLs 54 385 199,336 Past Coupon CFLs 70 516 211,139 Recent Coupon CFLs 75 636 563,420 Recent Coupon Interior Fixture 61 140 7,084 Recent Coupon Exterior Fixture 58 90 1,584
b Weighted to the population of each product. Table 5-2 summarizes the installed status of products purchased through the program as reported by survey participants. We asked respondents how many products were currently installed in their home. If all the products purchased were not currently installed, we asked respondents to estimate the number of products they had removed. The remainder represents the not-yet-installed products. Because they purchased the products earlier than other participants, the Past Bulb Coupon purchasers have the highest reported in-service rate, at 96%. In comparison, 80% of Markdown bulbs are installed and 88% of Recent Coupon bulbs are installed. A higher percentage of exterior fixtures (89%) than interior fixtures (79%) are installed. Few of the products that are not installed have been removed from service – only 1%-2% for bulbs, and 0%-5% for fixtures; the vast majority of the products that are not installed have simply never been installed.
Table 5-2: Number Installed, Removed, or Not Yet Installed by Product
Installed Removed Not Yet Installed
N 159,469 1,993 37,874 Markdown CFLs % of Program 80% 1% 19%
N 203,364 4,910 2,864Past Coupon CFLs % of Program 96% 2% 1%
N 498,688 2,972 61,760Recent Coupon CFLs % of Program 88% 1% 11%
N 5,610 340 1,134Recent Coupon Interior Fixture % of Program 79% 5% 16%
N 1,409 0 175Recent Coupon Exterior Fixture % of Program 89% 0% 11%
a Weighted to the population of each product.
Nexus Market Research
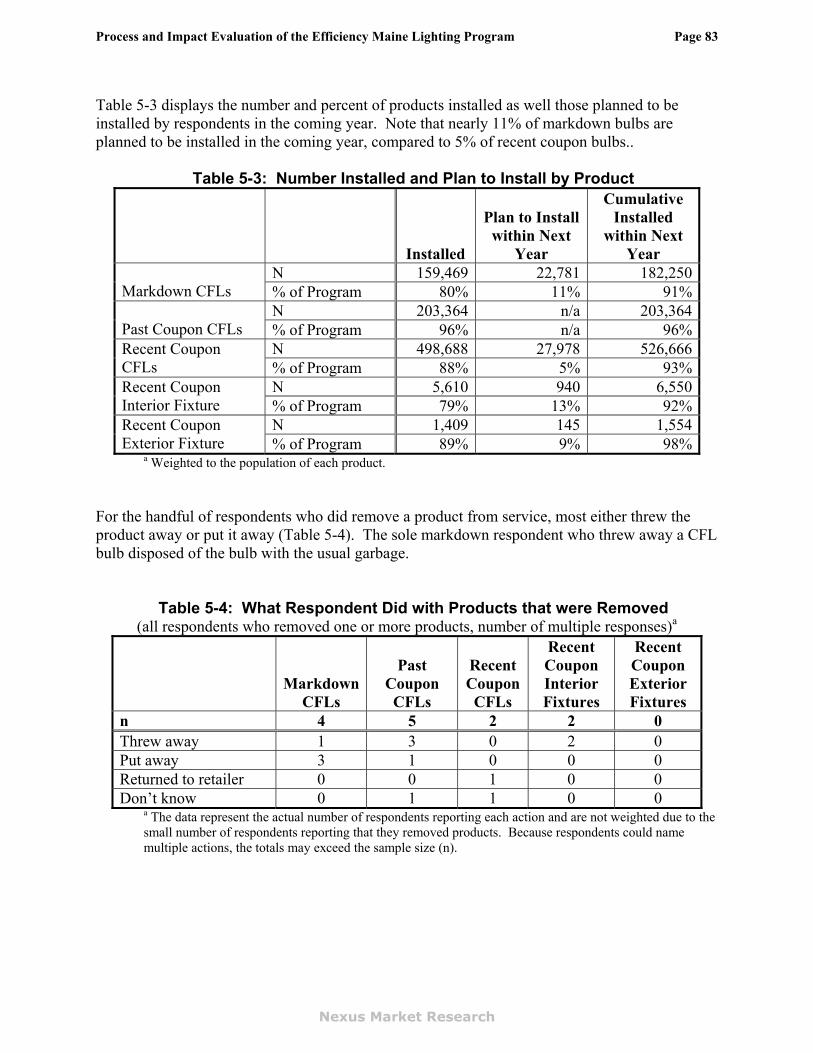
Process and Impact Evaluation of the Efficiency Maine Lighting Program Page 83
Table 5-3 displays the number and percent of products installed as well those planned to be installed by respondents in the coming year. Note that nearly 11% of markdown bulbs are planned to be installed in the coming year, compared to 5% of recent coupon bulbs..
Table 5-3: Number Installed and Plan to Install by Product
Installed
Plan to Install within Next
Year
Cumulative Installed
within Next Year
N 159,469 22,781 182,250Markdown CFLs % of Program 80% 11% 91%
N 203,364 n/a 203,364Past Coupon CFLs % of Program 96% n/a 96%
N 498,688 27,978 526,666Recent Coupon CFLs % of Program 88% 5% 93%
N 5,610 940 6,550Recent Coupon Interior Fixture % of Program 79% 13% 92%
N 1,409 145 1,554Recent Coupon Exterior Fixture % of Program 89% 9% 98%
a Weighted to the population of each product. For the handful of respondents who did remove a product from service, most either threw the product away or put it away (Table 5-4). The sole markdown respondent who threw away a CFL bulb disposed of the bulb with the usual garbage.
Table 5-4: What Respondent Did with Products that were Removed (all respondents who removed one or more products, number of multiple responses)a
Markdown CFLs
Past Coupon CFLs
Recent Coupon CFLs
Recent Coupon Interior Fixtures
Recent Coupon Exterior Fixtures
n 4 5 2 2 0 Threw away 1 3 0 2 0 Put away 3 1 0 0 0 Returned to retailer 0 0 1 0 0 Don’t know 0 1 1 0 0
a The data represent the actual number of respondents reporting each action and are not weighted due to the small number of respondents reporting that they removed products. Because respondents could name multiple actions, the totals may exceed the sample size (n).
Nexus Market Research

Process and Impact Evaluation of the Efficiency Maine Lighting Program Page 84
Table 5-5 lists the reasons that respondents gave for removing their product; of those that could remember why, most reported that the bulb burned out.
Table 5-5: Reasons Named for Removal of Lighting Products (all respondents who removed one or more products, number of responses reported, multiple
response)
Markdown CFLs
Past Coupon CFLs
Recent Coupon CFLs
Recent Coupon Interior Fixtures
Recent Coupon Exterior Fixtures
n 4 5 2 2 0 Burned out 0 4 2 0 0 Bulb not bright enough 1 1 0 0 0 Don’t like quality of light 1 0 0 0 0 Broke 0 0 0 2 0 Light beginning to dim 1 0 0 0 0 Don’t like color of light 1 0 0 0 0 Don’t Know
4 0 0 0 0 a Number of responses shown due to small sample sizes. Data are not weighted. Table 5-6 lists what respondents did with products that they have yet to install; nearly all indicate that they put the product away.
Table 5-6: What Respondents Did with Products Never Installed (all respondents who did not install one or more products, number of multiple responses)
Markdown CFLs
Past Coupon CFLs
Recent Coupon CFLs
Recent Coupon Interior Fixtures
Recent Coupon Exterior Fixtures
n 16 3 12 12 8 Put away 11 3 10 10 8 Threw away 1 0 0 0 0 Gave away 0 0 1 0 0 Took to another location 1 0 1 2 0 Don’t know 3 0 0 0 0
a Number of responses shown due to small sample sizes. Data are not weighted.
Nexus Market Research

Process and Impact Evaluation of the Efficiency Maine Lighting Program Page 85
Most of these respondents report that they bought the product as a spare, while others only recently purchased the product or just haven’t gotten around to installing it yet (Table 5-7).
Table 5-7: Reasons for Not Installing Products (all respondents who did not install one or more products, multiple response)a
Markdown
CFLs
Past Coupon CFLs
Recent Coupon CFLs
Recent Coupon Interior Fixtures
Recent Coupon Exterior Fixtures
N 15 3 13 12 8 Bought as spares 9 2 6 3 1 Only recently received/haven’t gotten around to it 5 0 0 6 4 Need help installing 0 0 0 0 1 Bought for another location 1 0 0 3 0 Other 0 0 5 0 1 Don’t know
1 1 2 0 1 a Number of responses shown due to small sample sizes. Data are not weighted.
Nexus Market Research

Process and Impact Evaluation of the Efficiency Maine Lighting Program Page 86
Intended use of the Products Table 5-8 displays the disposition of those bulbs that were installed: whether the product replaced an incandescent bulb, replaced another CFL, or was installed into a new fixture. Nearly all CFLs replace an incandescent bulb, particularly for Past Coupon purchases (97%), while 88%-89% of Markdown and Recent Coupon CFLs replace incandescent models. As a point of comparison, the Impact Evaluation of the Massachusetts, Rhode Island, and Vermont 2003 Residential Lighting Programs report found that 88% of coupon CFLs replaced an incandescent bulb, 11% replaced another CFL, and 2% were installed into a new fixture.
Table 5-8: CFLs Installed to Replace Existing Bulbs or to Put into New Fixtures
(all respondents installing CFLs) Markdown CFLs Past Coupon CFLs Recent Coupon CFLs
Replace Incan-descent Bulbs
Replace Another
CFL New
Fixture
Replace Incan-descent Bulbs
Replace Another
CFL New
Fixture
Replace Incan-descent Bulbs
Replace Another
CFL New
FixtureN 49 49 49 70 70 70 73 73 73 0a
6% 90% 94% 1% 96% 97% 16% 87% 89%1a
18% 2% 2% 16% 3% 0% 11% 8% 2%2-5a
41% 6% 4% 47% 0% 0% 38% <1% 5%6-10a
25% 2% 0% 23% 0% 0% 17% 2% 5%More than 10a
10.% 0% 0% 12% 0% 1% 14% <1% 0%Don’t know a
0% 0% 0% 1% 1% 1% 4% 4% 4%Total Numberb
133,063 14,497 2,589 197,612 822 4,930 426,4180 22,538 35,268 % of Products Installed 89% 10% 2% 97% 0% 2% 88% 5% 7%
a Weighted to the population of program participants b “Don’t Know” responses removed from total. Weighted to the population of CFLs Note that the results displayed in Table 5-8 are not specifically used in the calculations of energy savings, though the type of bulb replaced would presumably factor into the respondents self-reported estimate of wattage replaced.
Nexus Market Research

Process and Impact Evaluation of the Efficiency Maine Lighting Program Page 87
Table 5-9 lists the type of bulb (incandescent or CFL) replaced by room in the house. As expected, the vast majority of CFLs replace incandescent bulbs regardless of room location.
Table 5-9: Type of Products Respondents Replaced with CFLs by Room
(all respondents who replaced existing bulbs with CFLs, multiple response)a Markdown CFL Past Coupon CFL Recent Coupon CFL n Incan-
descent Another
CFL n Incan-
descent Another
CFL n Incan-
descent Another
CFL Living Room 34 85% 3% 53 100% 0% 50 89% 8% Kitchen 26 81% 15% 28 96% 4% 41 86% 7% Dining Room 15 93% 0% 11 100% 0% 17 85% 8% Hall/Foyer 13 85% 0% 17 100% 0% 25 95% <1% Bedroom 22 86% 5% 25 96% 0% 29 94% <1% Bathroom 14 71% 7% 15 80% 13% 21 87% 7% Garage 6 67% 17% 4 100% 0% 10 71% 14% Exterior/Outside 11 82% 0% 10 90% 0% 16 90% 10% Closet 5 40% 20% 2 100% 0% 3 96% 4% Utility Room 8 100% 0% 1 100% 0% 5 96% 4% Basement 12 75% 8% 7 100% 0% 14 90% 5% Other 0 n/a n/a 2 100% 0% 4 67% 33%
a Weighted to the population of program participants. The survey asked respondents to indicate what, if any, type of bulb was replaced by a CFL, but did not count the number of bulbs for each replacement. Totals may not equal 100% due to multiple responses and “don’t know” and “new light source” responses. Table 5-10 indicates that about 49% of interior fixtures replace an existing lamp, while 36% are installed as part of an addition or a new home, and 15% for a new lamp in an existing room.
Table 5-10: Interior Fixtures Installed to Replace Existing Lamps or as a New Fixture
(all respondents installing Interior Fixtures) Replace Existing
Lamp New Lamp in
Existing Room Lamp in a New
Home or Addition N 49 49 49 0 27% 84% 80% 1 50% 6% 7% 2-5 22% 7% 8% More than 5 2% 3% 5% Total Numberb
2,754 856 2,000 % of Products 49% 15% 36%
a Weighted to the population of program participants. b “Don’t Know” and other unusable responses removed from total. Weighted to the population of interior fixtures.
Nexus Market Research

Process and Impact Evaluation of the Efficiency Maine Lighting Program Page 88
In comparison, Table 5-11 indicates that that nearly three-quarters of exterior fixtures replace an existing fixture, with the remainder installed into a new fixture or as part of an addition/home.
Table 5-11: Exterior Fixtures Installed to Replace Existing Lamps or as a New Fixture
(all respondents installing Exterior Fixture)a Replace Existing
Exterior Fixture New Fixture
Where Was Not One Before
Fixture in a New Home or Addition
N 55 55 55 0 27% 81% 87% 1 44% 12% 11% 2-5 29% 6% 2% More than 5 0% 0% 0% Total Numberb
1,014 228 167 % of Products 72% 16% 12%
a Weighted to the population of program participants. b “Don’t Know” responses removed from total. Weighted to the population of exterior fixtures. Of those fixtures that replaced an existing fixture, roughly 70% replaced an incandescent fixture (Table 5-12).
Table 5-12: Number of Fixtures that Replaced Existing Fixtures by Type of Bulb
(all respondents replacing lamps with Interior or Exterior Fixture)a Interior Exterior Total N % Total N % Incandescent bulb 1190 69% 513 72% Fluorescent tubes 220 13% 147 21% Halogen bulb 184 11% 24 3% CFL 88 5% 15 2% Other 44 3% 15 2%
a Weighted to the population of interior fixtures.
Nexus Market Research
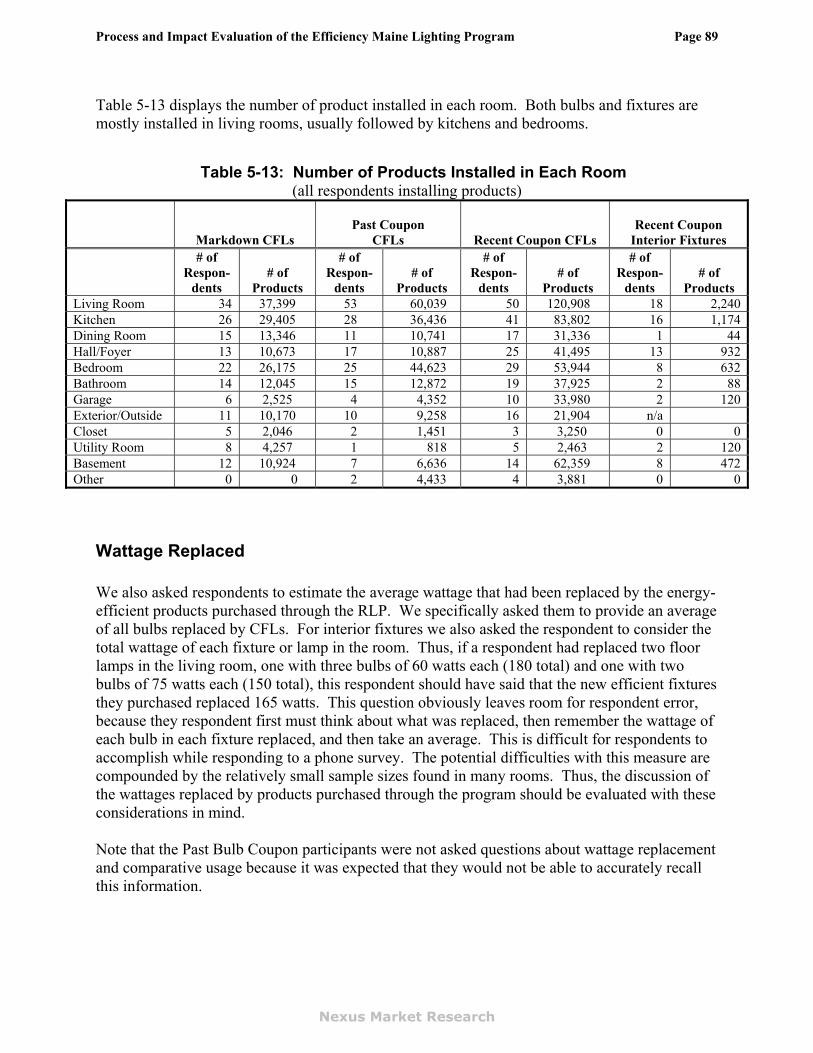
Process and Impact Evaluation of the Efficiency Maine Lighting Program Page 89
Table 5-13 displays the number of product installed in each room. Both bulbs and fixtures are mostly installed in living rooms, usually followed by kitchens and bedrooms.
Table 5-13: Number of Products Installed in Each Room (all respondents installing products)
Markdown CFLs Past Coupon
CFLs
Recent Coupon CFLs
Recent Coupon
Interior Fixtures
# of Respon-
dents # of
Products
# of Respon-
dents # of
Products
# of Respon-
dents # of
Products
# of Respon-
dents # of
Products Living Room 34 37,399 53 60,039 50 120,908 18 2,240Kitchen 26 29,405 28 36,436 41 83,802 16 1,174Dining Room 15 13,346 11 10,741 17 31,336 1 44Hall/Foyer 13 10,673 17 10,887 25 41,495 13 932Bedroom 22 26,175 25 44,623 29 53,944 8 632Bathroom 14 12,045 15 12,872 19 37,925 2 88Garage 6 2,525 4 4,352 10 33,980 2 120Exterior/Outside 11 10,170 10 9,258 16 21,904 n/a Closet 5 2,046 2 1,451 3 3,250 0 0Utility Room 8 4,257 1 818 5 2,463 2 120Basement 12 10,924 7 6,636 14 62,359 8 472Other 0 0 2 4,433 4 3,881 0 0
Wattage Replaced We also asked respondents to estimate the average wattage that had been replaced by the energy-efficient products purchased through the RLP. We specifically asked them to provide an average of all bulbs replaced by CFLs. For interior fixtures we also asked the respondent to consider the total wattage of each fixture or lamp in the room. Thus, if a respondent had replaced two floor lamps in the living room, one with three bulbs of 60 watts each (180 total) and one with two bulbs of 75 watts each (150 total), this respondent should have said that the new efficient fixtures they purchased replaced 165 watts. This question obviously leaves room for respondent error, because they respondent first must think about what was replaced, then remember the wattage of each bulb in each fixture replaced, and then take an average. This is difficult for respondents to accomplish while responding to a phone survey. The potential difficulties with this measure are compounded by the relatively small sample sizes found in many rooms. Thus, the discussion of the wattages replaced by products purchased through the program should be evaluated with these considerations in mind. Note that the Past Bulb Coupon participants were not asked questions about wattage replacement and comparative usage because it was expected that they would not be able to accurately recall this information.
Nexus Market Research

Process and Impact Evaluation of the Efficiency Maine Lighting Program Page 90
Table 5-14 displays the average wattage of bulbs and fixtures replaced by program products – approximately 60 watts for bulbs, 69 watts for interior fixtures, and 125 watts for exterior fixtures.
Table 5-14: Overall Average Wattage Replaced by Products Average Watts
per Product Number of
Respondents Markdown CFLs 59.1 49 Recent Coupon CFLs 61.5 73 Recent Coupon Interior Fixture 68.8 49 Recent Coupon Exterior Fixture 125.4 55
Table 5-15 provides an estimate of the wattage of individual bulbs or fixtures replaced by a product purchased through the program. The majority of bulbs replaced are about 60 watts, while the interior fixtures tend to vary more widely.
Table 5-15: Average Wattage of Products Replaced in Each Room
(all respondents replacing existing products in each room)a
Markdown CFLs Recent Coupon
CFLs Recent Coupon
Interior Fixtures
nb
Ave. Watts per Bulb Replacedc nb
Ave. Watts per Bulb Replacedc nb
Ave. Watts per Fixture Replacedc
Living Room 29 58.2 48 64.4 11 71.6 Kitchen 24 60.1 39 61.4 14 73.4 Dining Room 14 64.2 16 52.7 1 60.0 Hall/Foyer 11 64.1 24 51.9 9 63.0 Bedroom 20 62.9 28 69.3 5 136.0 Bathroom 10 57.2 20 53.9 2 60.0 Garage 4 49.0 7 47.5 2 100.0 Exterior/Outside 9 49.5 15 53.6 0 0 Closet 3 48.1 3 60.1 0 0 Utility Room 6 48.4 5 209.6 5 56.7 Basement 8 60.1 13 69.5 0 0
a Weighted to the population of each product. b Sample size (n) reflects the number of people asked who did not respond that the product was a “new light source.” c “Don’t know” responses excluded from averages.
Nexus Market Research

Process and Impact Evaluation of the Efficiency Maine Lighting Program Page 91
While the data in Table 5-15 provide an estimate of the per-product wattage replaced, those in Table 5-16 instead offer approximations of the total and average wattage replaced by room or home exterior for all CFLs.
Table 5-16: Total and Average Wattage of Products Replaced by CFLs in Each Room
(all respondents replacing existing products with CFLs in each room)a Markdown CFLS Recent Coupon CFLs
nb
Total Watts Replaced
(in thousands)c
Average Watts
Replaced per
Roomc nb
Total Watts Replaced
(in thousands)c
Average Watts
Replaced per
Roomc
Living Room 29 2,175 147 48 7,793 116 Kitchen 24 1,766 142 39 5,147 81 Dining Room 14 857 118 16 1,647 21 Hall/Foyer 11 684 120 24 2,152 27 Bedroom 20 1,645 159 28 3,746 64 Bathroom 10 689 133 20 2,041 28 Garage 4 124 60 7 1,632 28 Exterior/Outside 9 503 108 15 1,168 22 Closet 3 98 63 3 195 3 Utility Room 6 443 142 5 516 18 Basement 8 895 216 13 4,335 55
a Weighted to the population of each product. b Sample size (n) excludes those who said that the product was a “new light source.” c “Don’t know” responses excluded from estimates of total and average wattage.
Nexus Market Research

Process and Impact Evaluation of the Efficiency Maine Lighting Program Page 92
Table 5-17 displays the total watts replaced and average watts replaced per room for interior fixtures.
Table 5-17: Total and Average Wattage of Products Replaced by Interior Fixtures in Each Room
(all respondents replacing existing products with Interior Fixtures in each room)a nb
Total Watts Replaced
(in thousands)c
Average Watts Replaced per
Roomc
Living Room 11 58,160 104 Kitchen 14 70,904 112 Dining Room 1 2,640 60 Hall/Foyer 9 37,280 84 Bedroom 5 29,920 114 Bathroom 2 5,280 60 Garage 2 4,400 37 Utility Room 5 14,960 63
a Weighted to the population of each product. b Sample size (n) excludes those who said that the product was a “new light source.” c “Don’t know” responses excluded from estimates of total and average wattage.
Table 5-18 displays the total watts replaced and average watts replaced for exterior fixtures.
Table 5-18: Average and Total Wattage of Products Replaced by Exterior Fixtures
(all respondents replacing exterior fixtures with energy-efficient models)a nb
39 Total Wattage Replacedc
127,182 Average Wattage Replacedc
125.4 a Weighted to the population of each product. b Sample size (n) excludes those who said that the product was a “new light source.” c “Don’t know” responses excluded from estimates of total and average wattage.
Comparative Usage Behavioral changes due to program participation can impact energy usage. Customers may leave their new lights on longer since they cost less to operate. Of course, customers may also use their new lights less or use them more, but instead of other presumably less efficient bulbs or fixtures. In these situations, energy savings are greater. These effects are generally referred to as snapback and snapforward, respectively. The survey asked customers whether they used each light more, less, or the same as the light it replaced. A fourth option was "more, but instead of others." Table 5-19 indicates that the vast
Nexus Market Research

Process and Impact Evaluation of the Efficiency Maine Lighting Program Page 93
majority of CFLs (78%-81%) are used ‘to the same extent’ as the bulb they replaced. While similar results are found for interior fixtures, only 52% of exterior fixtures are used ‘to the same extent’ while 44% are used ‘more than the one replaced.’
Table 5-19: Use of New CFL Products Compared to the Products that were Replaced
(all respondents replacing existing bulbs)a n More
than one replaced
More than one replaced
but instead
of others
To the same
extent as the one
replaced
Less than the
one replaced
Don’t Know
Markdown CFLs 157 8% 1% 81% 9% 1% Recent Coupon CFLs 226 15% 1% 78% 1% 5% Recent Coupon Interior Fixture 50 15% 0% 78% 4% 4% Recent Coupon Exterior Fixture 39 44% 0% 52% 0% 0%
a Weighted to the population of program participants. The comparative usage of Markdown CFLs is fairly consistent across room type – most are used ‘to the same extent as the one replaced’ (Table 5-20).
Table 5-20: Use of Markdown CFLs Compared to Bulbs that were Replaced (all respondents replacing existing bulbs)a
n More than one replaced
More than one replaced
but instead of
others
To the same
extent as the one
replaced
Less than the one
replaced
Don’t Know
Living Room 32 3% 0% 94% 3% 0%Kitchen 25 12% 0% 80% 8% 0%Dining Room 15 0% 0% 93% 7% 0%Hall/Foyer 12 8% 0% 75% 17% 0%Bedroom 21 5% 0% 81% 14% 0%Bathroom 13 15% 0% 85% 0% 0%Garage 6 17% 0% 67% 17% 0%Exterior/Outside 10 10% 10% 60% 10% 10%Closet 3 0% 0% 100% 0% 0%Utility Room 8 25% 0% 50% 13% 13%Basement 12 8% 0% 75% 17% 0%
a Weighted to the population of program participants.
Nexus Market Research

Process and Impact Evaluation of the Efficiency Maine Lighting Program Page 94
Similar to Markdown CFLs, the majority of Recent Coupon CFLs and interior fixtures are used to the same extent as the bulbs replaced (Table 5-21 and Table 5-22).
Table 5-21: Use of Recent Coupon CFLs
Compared to Products that were Replaced (all respondents replacing existing lamps or interior fixtures)a
n More than one replaced
More than one replaced
but instead of
others
To the same
extent as the one
replaced
Less than the one
replaced
Don’t Know
Living Room 50 14% 0% 78% 6% 3% Kitchen 41 28% 0% 65% 0% 7% Dining Room 17 25% 8% 67% 0% 0% Hall/Foyer 25 11% 0% 84% 0% 5% Bedroom 29 12% 0% 82% 0% 6% Bathroom 21 7% 0% 86% 0% 7% Garage 10 0% 0% 100% 0% 0% Exterior 16 22% 0% 67% 0% 11% Closet 3 0% 0% 96% 0% 4% Utility Room 5 4% 0% 96% 0% 0% Basement 14 0% 0% 90% 0% 10% Other 50 0% 0% 5% 0% 0%
a Weighted to the population of program participants.
Table 5-22: Use of Recent Coupon Interior Fixtures Compared to Products that were Replaced
(all respondents replacing existing interior fixtures) a n More
than one replaced
More than one replaced
but instead of
others
To the same
extent as the one
replaced
Less than the one
replaced
Don’t Know
Living Room 11 17% 0% 83% 0% 0% Kitchen 14 19% 0% 67% 7% 7% Dining Room 1 0% 0% 100% 0% 0% Hall/Foyer 9 0% 0% 90% 0% 10% Bedroom 5 20% 0% 60% 20% 0% Bathroom 2 50% 0% 50% 0% 0% Garage 2 0% 0% 100% 0% 0% Basement 5 0% 0% 100% 0% 0% a Weighted to the population of program participants.
Nexus Market Research

Process and Impact Evaluation of the Efficiency Maine Lighting Program Page 95
Snapback and Snapforward. Because respondents were not asked how much more or less they used each light, we made the assumption that the altered usage ran 15% in either direction. The following algorithms are used to quantify snapback and snapforward.
Snapback = Proportion being used more x 15% Snapforward = (Proportion of lights being used less + Proportion of lights being used more but instead of others) x 15%
For almost all products, the snapback rate exceeds the snapforward rate, except for markdown CFLs where snapforward is slightly greater (Table 5-23). Overall, the snapback and snapforward rate are less than 3%, except for exterior fixtures at almost 7%. Note that these estimates are provided solely for information purposes, but are not used in any calculations of energy savings.
Table 5-23: Assessment of Snapback and Snapforward Category Snapback
Rate Snapforward
Rate Markdown CFLs 1.2% 1.5% Recent Coupon CFLs 2.3% 0.3% Recent Coupon Interior Fixture 2.3% 0.6% Recent Coupon Exterior Fixture 6.6% 0.0%
Nexus Market Research

Process and Impact Evaluation of the Efficiency Maine Lighting Program Page 96
Hours of Use Table 5-24 shows the overall average daily use per unit purchased for each product; note that all hours estimates provided in this section of the report are derived solely from the customer telephone survey. For bulbs and interior fixtures, the estimates are based on the sum of the hours across rooms, divided by the total number of products. Markdown participants report using their bulbs an average of nearly four hours per day in the summer and almost six hours per day in the winter. In comparison, the coupon participants report fewer hours of use – between 1.8 and 2.6 in the summer and between 3.0 and 4.0 in the winter. As expected, the exterior fixture purchasers report the highest usage – 5.6 hours in the summer and 7.2 in the winter.
Table 5-24: Overall Average Daily Use by Product (Hours used per day)
TelephoneSummer
TelephoneWinter
Number of Respondents
Markdown CFLs 3.8 5.7 49 Past Coupon CFLs 1.8 3.0 69 Recent Coupon CFLs 2.6 4.0 73 Recent Coupon Interior Fixture 1.9 2.9 49 Recent Coupon Exterior Fixture 5.6 7.2 55
Nexus Market Research

Process and Impact Evaluation of the Efficiency Maine Lighting Program Page 97
In order to derive the telephone survey-based estimates of seasonal hours of use provided in Table 5-25, we asked respondents to estimate for each room, on average, how many hours of the day they typically used the products purchased through the program in both summer and winter months. In order to account for multiple installations and provide a more complete accounting of usage, we multiplied the average hours customers say they use products in each room by the total number of products installed in that room. Therefore, if a program participant is using four CFLs for eight hours a day, that person is using an equivalent of 32 “bulb hours” each day. Because recent coupon participants have, on average, more program products installed than other participants, they have a higher household usage – over 16 hours per day in the summer and 25 hours per day in the winter. Other bulb purchasers have summer usage of about 13 hours and winter usage of 19 to 22 hours. Fixture purchasers have lower household hours of use because fewer products are typically installed in their homes.
Table 5-25: Total and Household Average Hours Products Used in the Summer and Winter by Producta
Summer Winter
n Hours HouseAve. n Hours
House Ave.
Markdown CFLs 49 326,214 12.9 49 490,356 19.3 Past Coupon CFLs 69 371,872 13.2 69 610,301 21.6 Recent Coupon CFLs 73 1,302,213 16.3 73 2,011,445 25.1 Recent Coupon Interior Fixture 49 11,554 4.9 49 17,582 7.4 Recent Coupon Exterior Fixture 55 2,693 9.3 55 3,477 12.0
a Weighted to the population of each product. “Don’t know” responses removed.
Nexus Market Research

Process and Impact Evaluation of the Efficiency Maine Lighting Program Page 98
Table 5-26 through Table 5-29 display the total hours per room and average hours per product that Markdown CFLs, Past Coupon CFLs, Recent Coupon CFLs, and interior fixtures are used, by room location. The rooms with the highest usage usually are the kitchen, exterior, and utility room. Note that these estimates are solely based on the telephone survey results.
Table 5-26: Total and Average Daily Hours of Use for Markdown CFLs in Summer and Winter by Room
(all respondents installing Markdown CFLs)a
SUMMER HOURS WINTER HOURS
n Total per
Roomb
Average per Productb
Total per Roomb
Average per
Productb
Living Room 34 69,385 3.9 120,130 6.8 Kitchen 26 58,511 4.3 96,311 7.2 Dining Room 15 22,265 2.9 40,906 5.3 Hall/Foyer 13 30,550 4.5 43,495 6.5 Bedroom 22 34,175 3.0 49,191 4.3 Bathroom 14 16,570 2.3 22,783 3.1 Garage 6 8,803 2.8 9,838 3.2 Exterior/Outside 11 27,443 4.8 36,246 6.4 Closet 5 3,625 1.4 5,696 2.2 Utility Room 8 27,443 6.6 31,068 7.5 Basement 12 27,443 4.4 34,693 5.6 a Weighted to the population of CFLs. b “Don’t Know” responses removed from totals and averages.
Nexus Market Research

Process and Impact Evaluation of the Efficiency Maine Lighting Program Page 99
Table 5-27: Total and Average Daily Hours of Use for Past Coupon CFLs in Summer and Winter by Room
(all respondents installing Past Coupon CFLs)a SUMMER HOURS WINTER
HOURS n Total per
Roomb
Average per Productb
Total per Roomb
Average per Productb
Living Room 53 119,765 2.0 207,280 3.5 Kitchen 28 58,989 1.6 110,803 3.0 Dining Room 11 8,025 0.7 13,923 1.3 Hall/Foyer 17 10,879 1.0 23,754 2.2 Bedroom 25 50,338 1.1 100,769 2.3 Bathroom 15 22,436 1.7 31,450 2.4 Garage 4 818 0.2 2,306 0.5 Exterior/Outside 10 43,055 4.7 52,403 5.7 Closet 2 - 0.0 - 0.0 Utility Room 1 4,910 6.0 8,184 10.0 Basement 7 12,090 1.8 12,499 1.9 Office 2 40,646 9.2 47,056 10.6 a Weighted to the population of CFLs. b “Don’t Know” responses removed from totals and averages.
Table 5-28: Total and Average Daily Hours of Use for Recent Coupon CFLs in Summer and Winter by Room
(all respondents installing Recent Coupon CFLs)a SUMMER HOURS WINTER
HOURS n Total per
Roomb
Average per Productb
Total per Roomb
Average per Productb
Living Room 50 359,026 3.0 597,163.6 4.9 Kitchen 41 303,453 3.6 447,113.6 5.3 Dining Room 17 94,291 3.0 164,136.5 5.2 Hall/Foyer 25 71,476 1.7 95,873.6 2.3 Bedroom 29 96,635 1.8 190,714.0 3.5 Bathroom 21 118,604 3.1 150,356.2 4.0 Garage 10 39,655 1.2 53,594.3 1.6 Exterior/Outside 16 59,644 2.7 87,737.5 4.0 Closet 3 3,193 1.0 3,193.0 1.0 Utility Room 5 6,994 2.8 9,283.9 3.8 Basement 14 141,579 2.3 194,974.3 3.1 Other 4 7,663 2.0 17,304.3 4.5 a Weighted to the population of CFLs. b “Don’t Know” responses removed from totals and averages.
Nexus Market Research

Process and Impact Evaluation of the Efficiency Maine Lighting Program Page 100
Table 5-29: Total and Average Daily Hours of Use for Interior Fixtures in the Summer and Winter by Room
(all respondents installing interior fixtures)a Summer Hours Winter Hours n Total per
Roomb
Average per Productb
Total per Roomb
Average per Productb
Living Room 18 4,140 1.8 6,916 3.1 Kitchen 16 2,362 2.0 3,822 3.3 Dining Room 1 440 10.0 528 12.0 Hall/Foyer 13 924 1.0 1,276 1.4 Bedroom 8 1,064 1.7 2,060 3.3 Bathroom 2 308 3.5 660 7.5 Garage 2 832 6.9 528 4.4 Utility Room 2 76 0.6 76 0.6 Basement 8 528 1.1 616 1.3
a Weighted to the population of interior fixtures. b “Don’t Know” responses removed from totals and averages.
Table 5-30 lists the total and average hours of use for exterior fixtures – again, based on the telephone survey results.
Table 5-30: Average Daily Hours of Use Exterior Fixtures Used in Summer and Winter
(all respondents installing exterior fixtures)a n=55 Total Hours
Usedb
Average Hours Used per Dayb
Summer Hours 2,693 5.6 Winter Hours 3,477 7.2
a Weighted to the population of exterior fixtures. b “Don’t Know” responses removed from totals and averages.
Nearly one-half of respondents put their exterior fixture on a timer or photocell and about one-third turn it on and off as needed (Table 5-31).
Table 5-31: Use of Exterior Fixtures on a Nightly Basis
(all respondents installing Exterior Fixtures) n=55 Left On for the night 14% Turn it on and off as needed 36% Timer or Photocell 50%
a Weighted to the population of program participants.
Nexus Market Research

Process and Impact Evaluation of the Efficiency Maine Lighting Program Page 101
Table 5-32 lists how participants would use their exterior fixtures when away from home for long periods of time. Nearly one-third would use a photocell and over one-quarter would not use the fixture at all. Twenty-one percent would use a timer for an average of 9.5 hours per day.
Table 5-32: Use of Exterior Fixtures when Away from Home for Long Periods of Time
(all respondents installing Exterior Fixtures) n=55 Would use all the time (24 hours) 12% Would put on timer/use for X hours per day 21% Would use photocell 30% Would have someone turn it on and off 10% Would not be used 28%
a Weighted to the population of program participants.
5.2. On-Site Survey Findings This section discusses the results of the 25 on-site visits regarding in-service rates, hours of use, displaced wattage, and energy savings for CFL bulbs incentivized through the Coupon program. In-service Rate. According to the program tracking system, the 25 customers in the onsite sample received rebates on 306 CFLs, 6 interior fixtures, and 5 exterior fixtures through the program within the past year. The persistence rates as determined from the on-site survey are expressed in . The table shows the totals for all program CFLs based on the following categories, according to observations on-site and customer reporting of purchase totals:
1) Installed in the customers' homes, 2) Never installed, 3) Installed outside of the customers' homes, 4) Plans to install, 5) Installed and removed, and 6) Not purchased.
Nexus Market Research

Process and Impact Evaluation of the Efficiency Maine Lighting Program Page 102
At the time of the on-site visits, approximately 66.3% (with ±6.7% precision) of the CFLs rebated through the program had been installed. The primary reason for non-installation of CFLs was that the customer was storing the recently purchased lighting to replace bulbs that burn out in the future.
Table 5-33: On-Site CFL Installation and Removal Rates Currently Installed in Maine Installed in Customer's Home 172 Installed in Other Home in Maine 31 Total Installed in Maine 203 Percent Installed 66% Not Currently Installed in Maine Not Installed 103 Customer plans to Install to Replace Existing CFLs 23% Customer Plans to Install to Replace Existing Incandescents 5% Installed and Removed 3% Customer Plans to Install in a New Fixture 2% Never Installed, no Plan to Install, or Don’t Know 1% Total Sample 306
Table 5-34 presents the reported duration until installation among customers with installed CFLs among the on-site sample. Almost all (91%) installations occurred within one week of purchase.
Table 5-34: Duration Until Installation Time Between Purchase and Installation
Total # of CFLs
% of Total Installed
Immediately 153 75% 1 Week 26 13% 1 Month 7 3% 2 Months 6 3% 2-3 Days 5 3% 8 Months 4 2% 3 Months 2 1%
Total 203 100% Only three of the participants in the sample claimed that they changed how they used their lights since purchasing the program CFLs. All three reported an increase in the use of these lights compared to the other lighting in their homes.
Nexus Market Research

Process and Impact Evaluation of the Efficiency Maine Lighting Program Page 103
Hours of Use. Table 5-35 illustrates the logger-informed average daily hours of CFL use. The average installed CFL operates for approximately 3.2 hours per day or 1,168 hours per year with a precision of ±10.3%.
Table 5-35: Average Daily Hours of Use Average Hours of Use CFLs (n=203) Result ± 90% Confidence Interval 3.2 ± 10.3%
Table 5-36 shows where customers installed the CFLs that they purchased through the program and the logged hours of operation. Almost half (47%) of these installations were in the family/living room and kitchen, which are among the most frequently occupied rooms. The locations with the highest usage (and sufficient samples sizes) are the exterior and kitchen.
Table 5-36: CFL Installations and Hours of Use by Room Type
Room # of Bulbs Installed
Avg. Hours
Avg. Hrs/Day
Family/Living Room 57 1,361 3.7 Kitchen 39 1,598 4.4 Bedroom 32 467 1.3 Bathroom 17 351 1.0 Exterior 15 2,011 5.5 Basement 11 880 2.4 Hallway 9 478 1.3 Garage 8 391 1.1 Foyer 7 2,075 5.7 Den/Office 7 1,253 3.4 Dining Room 1 3,172 8.7
Total 203 1,172 3.2 Displaced Wattage Results. Table 5-37 illustrates the on-site observed inputs for wattage displaced by the CFLs installed through the program. The average displaced wattage in the sample is 45.3 watts with a precision of ±3.6%.
Table 5-37: Average Onsite Displaced Wattage Results Average Displaced Wattage CFLs (n=203) Result ± 90% Confidence Interval 45.3 ± 3.6%
Nexus Market Research

Process and Impact Evaluation of the Efficiency Maine Lighting Program Page 104
Table 5-38 lists the replaced and displaced wattages by CFL wattage from the on-site visits. Regardless of wattage, most program CFLs replaced 60 watt incandescent bulbs.
Table 5-38: On-Site Displaced Wattages by CFL Wattage
CFL Wattage n
On-Site Average Wattage Replaced
On-Site Average Wattage
Displaced 5 1 40 35 9 6 60 51 10 9 56 46 11 4 60 49 13 27 64 51 14 42 60 46 15 33 55 40 18 1 60 42 20 42 65 45 23 3 65 42 25 22 65 40 26 11 72 46 42 2 150 108
Total 203 62 45 Demand Savings. Using the total number of CFLs sold through the program in 2006, the on-site installation rate, and the on-site average displaced wattage, we are able to calculate demand savings with the following formula:
Divided by 1000
watts/kW
CFL Products sold
in 2006= Demand
Savings (kW) * Displaced
Wattage* Installation rate
738,082 * 66.3% * 45.3 / 1000 = 22,167 Winter Peak Demand Factor. Efficiency Maine currently recognizes winter weekday hours between 5pm and 7pm as its winter peak. The weighted winter peak demand factor from the CFLs analyzed on-site is estimated to be 33.6% with a precision of ±11.2% at the 90% confidence level. In other words, if we were to conduct the logging activity 100 times, we would expect our results to be consistent, plus or minus 11.2%, 90 times out of 100. This means that the installed program CFLs were turned on an average of 33.6% of the time during these hours. At the 80% confidence level, the precision is calculated to be 8.7%.
Nexus Market Research
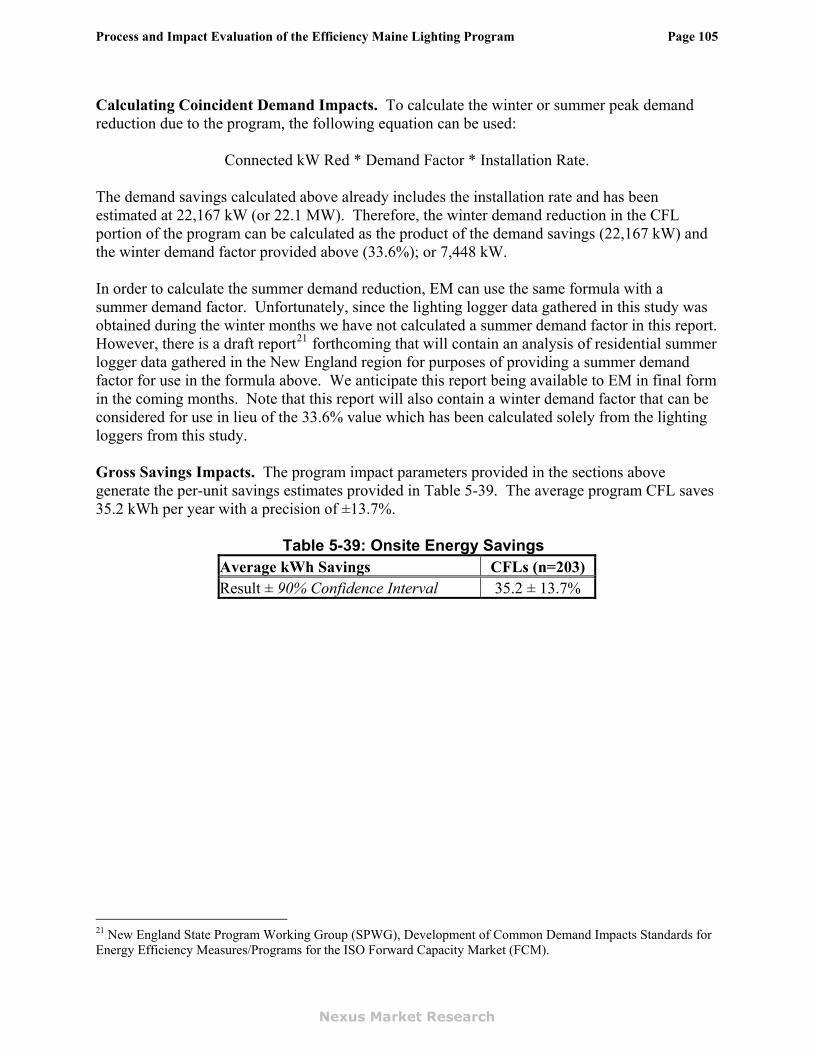
Process and Impact Evaluation of the Efficiency Maine Lighting Program Page 105
Calculating Coincident Demand Impacts. To calculate the winter or summer peak demand reduction due to the program, the following equation can be used:
Connected kW Red * Demand Factor * Installation Rate.
The demand savings calculated above already includes the installation rate and has been estimated at 22,167 kW (or 22.1 MW). Therefore, the winter demand reduction in the CFL portion of the program can be calculated as the product of the demand savings (22,167 kW) and the winter demand factor provided above (33.6%); or 7,448 kW. In order to calculate the summer demand reduction, EM can use the same formula with a summer demand factor. Unfortunately, since the lighting logger data gathered in this study was obtained during the winter months we have not calculated a summer demand factor in this report. However, there is a draft report21 forthcoming that will contain an analysis of residential summer logger data gathered in the New England region for purposes of providing a summer demand factor for use in the formula above. We anticipate this report being available to EM in final form in the coming months. Note that this report will also contain a winter demand factor that can be considered for use in lieu of the 33.6% value which has been calculated solely from the lighting loggers from this study. Gross Savings Impacts. The program impact parameters provided in the sections above generate the per-unit savings estimates provided in Table 5-39. The average program CFL saves 35.2 kWh per year with a precision of ±13.7%.
Table 5-39: Onsite Energy Savings Average kWh Savings CFLs (n=203) Result ± 90% Confidence Interval 35.2 ± 13.7%
21 New England State Program Working Group (SPWG), Development of Common Demand Impacts Standards for Energy Efficiency Measures/Programs for the ISO Forward Capacity Market (FCM).
Nexus Market Research
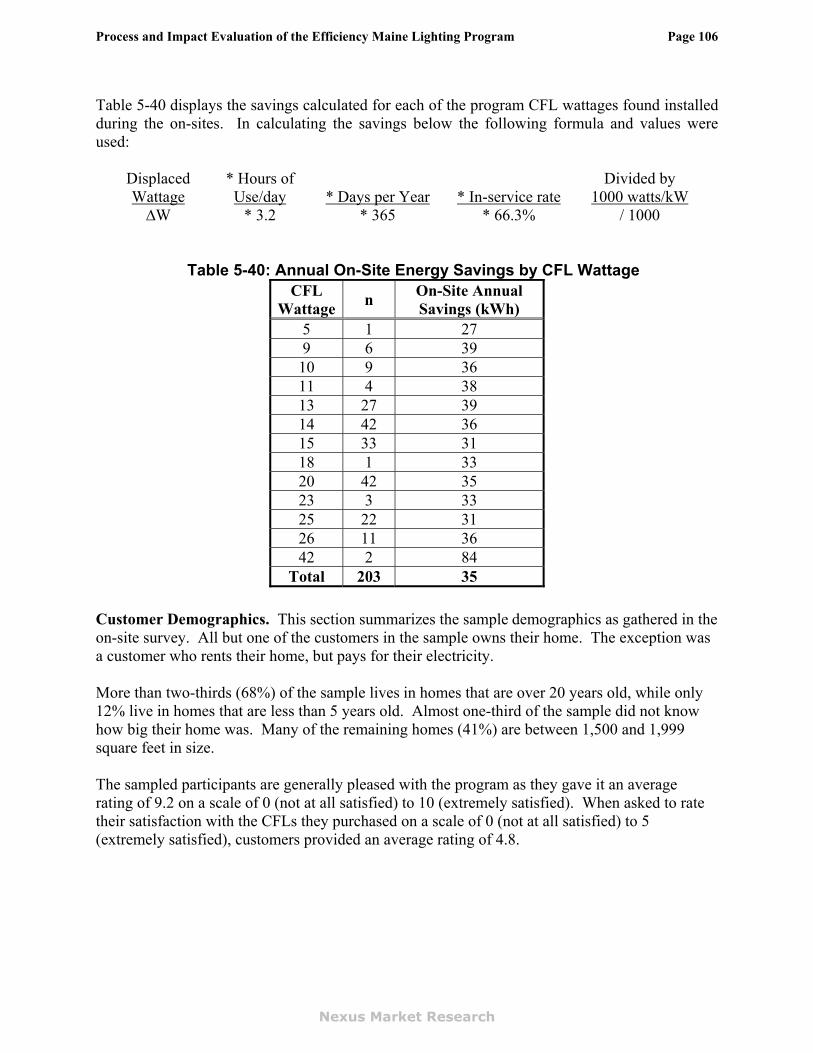
Process and Impact Evaluation of the Efficiency Maine Lighting Program Page 106
Table 5-40 displays the savings calculated for each of the program CFL wattages found installed during the on-sites. In calculating the savings below the following formula and values were used:
Displaced Wattage
* Hours of Use/day
Divided by 1000 watts/kW* Days per Year * In-service rate
!W * 3.2 * 365 * 66.3% / 1000
Table 5-40: Annual On-Site Energy Savings by CFL Wattage CFL
Wattage n On-Site Annual Savings (kWh)
5 1 27 9 6 39 10 9 36 11 4 38 13 27 39 14 42 36 15 33 31 18 1 33 20 42 35 23 3 33 25 22 31 26 11 36 42 2 84
Total 203 35
Customer Demographics. This section summarizes the sample demographics as gathered in the on-site survey. All but one of the customers in the sample owns their home. The exception was a customer who rents their home, but pays for their electricity. More than two-thirds (68%) of the sample lives in homes that are over 20 years old, while only 12% live in homes that are less than 5 years old. Almost one-third of the sample did not know how big their home was. Many of the remaining homes (41%) are between 1,500 and 1,999 square feet in size. The sampled participants are generally pleased with the program as they gave it an average rating of 9.2 on a scale of 0 (not at all satisfied) to 10 (extremely satisfied). When asked to rate their satisfaction with the CFLs they purchased on a scale of 0 (not at all satisfied) to 5 (extremely satisfied), customers provided an average rating of 4.8.
Nexus Market Research

Process and Impact Evaluation of the Efficiency Maine Lighting Program Page 107
5.3. Adjustment of Telephone Survey Results using On-Site Results
Table 5-41 compares the results of the Recent Coupon Survey with the results of the on-site survey. The daily hours of use are nearly identical (3.3 vs. 3.2, respectively) and the replaced wattage values are similar as well (61.5 vs. 65). However, the in-service rates are very different, with the telephone survey respondents reporting 88% and the onsite survey finding only 66% installed. The final column in the table lists the adjustment factor that will be used to adjust the telephone survey results form the Markdown and Past Bulb coupon participants. It is calculated by dividing the result of the onsite visit by the result of the Recent Bulb coupon survey.
Table 5-41: Comparison of Results from Recent Bulb Coupon Survey and Onsite Visits
Recent Bulb Coupon Survey
Onsite Visits Impact Parameter
Number of bulbs
Result Number of bulbs
Result
Adjustment Factor
In-service Rate 636 88% 306 66% 75% Replaced Wattage (watts) 561 61.5 203 62 101% Daily Hours of Use 561 3.3 203 3.2 97% Table 5-42 displays the initial telephone survey results and the adjusted results for the Past Bulb participants and Markdown participants. While the wattage and hours of use results are only slightly modified, the in-service rates decline substantially – from 96% to 72% for the Past Bulb Coupon participants and from 80%to 60% for Markdown participants.
Table 5-42: Adjustment of Past Bulb Survey and Markdown Survey Results by Onsite Findings
Past Bulb Survey Markdown Survey
Impact Parameter Number of bulbs Result
Adjusted from
Onsite Results
Number of bulbs Result
Adjusted from Onsite
Results In-service Rate 516 96% 72% 385 80% 60% Replaced Wattage (watts) n/a n/a n/a 307 59.1 59.7 Daily Hours of Use 497 2.4 2.3 307 4.9 4.8
Nexus Market Research

Process and Impact Evaluation of the Efficiency Maine Lighting Program Page 108
5.4. Impact Results This section presents findings on freeridership, spillover, gross energy savings, and net energy savings.
Gross Program Energy Savings Table 5-43 displays the assumptions and gross energy savings estimates for products incentivized through the program. In calculating the gross savings the following formula was used:
Displaced Wattage
* Hours of Use/day
Divided by 1000 watts/kW* Days per Year * In-service rate
Table 5-43: Gross Energy Savings
Markdown CFLs
2003 – 2005
Coupon CFLs
2006 Coupon CFLs
Coupon Interior Fixtures
Coupon Exterior Fixtures
Volume of Products 199,336 283,591 545,192 26,174 5,920 Displaced Wattage (watts) 45 45 45 50 89 Hours of Use per Day 4.8 2.3 3.2 2.4 6.4 In-service Rate 60% 72% 66% 79% 89%Gross Annual Energy Savings per Unit (kWh) 47 27 35 34 186 Assumed Lifetime (years) 4.6 9.5 6.8 20 20 Gross Lifetime Energy Savings (MWh) 43,057 73,507 129,538 18,041
22,007
Nexus Market Research

Process and Impact Evaluation of the Efficiency Maine Lighting Program Page 109
Net Program Energy Savings Net energy savings are estimated from gross energy savings from the program after adjusting for freeridership and spillover. It should be noted that these estimates are based on survey results from program participants; non-participant spillover is not included in these estimates. Free Ridership. Free ridership estimates are derived from the telephone survey. Free ridership is defined as program purchases that would have been made by participants on their own within three months, in the absence of any incentive from the sponsors. The estimate is based on the following:
! Awareness of efficient lighting product prior to program purchase ! Intention to buy the product at the same time or within three months of the program
purchase ! Willingness to pay average retail price22 for a specific number of products purchased.
Table 5-44 displays the estimates of freeridership for the various groups. Freeridership is estimated to be 29% for Markdown participants and 20% for Recent Coupon participants. In addition, while freeridership for interior fixture participants is 9%, it is estimated to be 40% for exterior fixture participants.
Table 5-44: Free Rider Estimate (all respondents with prior knowledge of product, who purchased products, and who would have
bought at the same time or within three months of purchase)a
Markdown
CFLs
Recent Coupon CFLs
Recent Coupon Interior Fixtures
Recent Coupon Exterior Fixtures
n 54 75 61 58 Full Free Rider Purchasesb
50,744 61,215 610 634 Partial Free Riderc
8,285 52,011 0 0 Total Free Rider Purchases 59,029 113,226 610 634 Total Program Purchases 199,396 563,420 7,084 1,584 % Full Free Rider Purchases 25% 11% 9% 40% % Including Partial Free Rider Purchases 29% 20% 9% 40%
a Weighted to the population of each product purchased. b “Don’t know” responses removed from total. c Partial free ridership occurs when participants planned to purchase a smaller number of products than were purchased through the program; only those products that would have been purchased without the program are counted as partial free rider purchases.
22 Respondents were provided with estimates of average retail prices of $5 per CFL and $50 per fixture.
Nexus Market Research

Process and Impact Evaluation of the Efficiency Maine Lighting Program Page 110
Of those respondents who said they would have waited to purchase their program products if the discounted products had not been available, nearly all said they would do so because they would wait for the price to come down (Table 5-45).
Table 5-45: Why Would Have Waited to Purchase Program Products (all respondents who reported that they would have waited to purchase program products if
discounted products had not been available, number of multiple responses)
Markdown CFLs
Recent Coupon CFLs
Recent Coupon Interior Fixtures
Recent Coupon Exterior Fixtures
n 10 23 10 5 Waiting for price to come down 9 20 8 5 Not sure where else to buy 1 1 0 0 Wouldn’t make a special trip to buy 0 1 0 0 Room where the products will be installed was not ready
0 1 0 0
Other 0 0 2 0 Don’t Know 0 0 0 0
a Number of responses shown due to small sample sizes. Data are not weighted.
Nexus Market Research

Process and Impact Evaluation of the Efficiency Maine Lighting Program Page 111
Spillover. Spillover is defined as the proportion of energy-saving lighting products that participants purchased outside the program as a result of having participated in the program. It should be noted that these estimates are based on survey results from program participants; non-participant spillover is not included in these estimates. Please note that with a CFL program, non-participant spillover—the measurement of which was beyond the scope of this study—is likely to be equal to or greater than participant spillover. In order to determine spillover rates, we look only at those customers who say that the program influenced their decision to purchase additional CFLs or fixtures. Spillover purchases are defined as:
! Products purchased since the program purchase ! Products that were purchased without any coupons ! The respondent reports being influenced by the experience of their program purchase to
make the additional purchases The result for each customer gives us their individual spillover rate. Then, we sum the spillover purchases for all customers claiming the program influenced them and divide this result by the total number of purchases made through the program. The final result is the spillover rate. Table 5-46 displays the estimates of spillover for CFLs, which are 23% for Markdown participants, 30% for Recent Coupon participants, and 45% for Past Coupon participants. Spillover is estimated to be 2% for interior fixture purchasers, but 0% for exterior fixture purchasers.
Table 5-46: Assessment of Spillover
(all respondents reporting the program influenced their purchase of additional products)a
Markdown
CFLs
Past Coupon CFLs
Recent Coupon CFLs
Recent Coupon Interior Fixtures
Recent Coupon Exterior Fixtures
nb 54 70 75 61 58
A. Spillover Purchases 45,049 96,567 168,108 176 0 B. Program Purchases 199,396 211,139 563,420 7,084 1,584 C. Spillover Rate (Line A ÷ Line B) 23% 46% 30% 2% 0%
a Weighted to the population of program participants. b “Don’t Know” responses and outliers from the number of additional products purchased removed.
Nexus Market Research

Process and Impact Evaluation of the Efficiency Maine Lighting Program Page 112
Table 5-47 displays the reasons why respondents did not use the coupons to purchase additional products. Almost all of these respondents report that the coupon was not available at the store, which seems surprising given that the coupons are widely available at retail stores through the state.
Table 5-47: Why Not Used Coupon to Purchase Additional Products (all respondents who purchased additional products after program purchase without an instant
rebate, number of multiple responses)
Markdown CFLs
Past Coupon CFLs
Recent Coupon CFLs
Recent Coupon Interior Fixtures
n 9 43 53 12 Coupon not available at store 5 32 40 7 Coupon did not apply to products I purchased
2 1 1 0
It was not worth the time to fill out the coupon
0 1 2 0
Other 1 5 4 1 Don’t Know 1 4 6 5 a Number of responses shown due to small sample sizes. Data are not weighted.
Nexus Market Research

Process and Impact Evaluation of the Efficiency Maine Lighting Program Page 113
Net Energy Savings. Net energy savings is a function of gross energy savings modified by causality and customer use characteristics. Here we define it as a function of the gross energy savings impacted by free ridership and spillover:
Net energy savings = Gross energy savings x (1 + spillover rate – free ridership rate) Table 5-48 displays the volume of products, gross lifetime energy savings, Net-to-Gross ratio, net lifetime energy savings, and net lifetime energy savings including planned installations within the coming year. The 2006 Coupon CFLs column is the findings of the Recent Bulb Coupon survey (adjusted by the on-site results), while the 2003-2005 Coupon CFLs column relies on the findings of the Past Bulb Coupon survey with estimates for freeridership and wattage displacement substituted from the Recent Coupon survey. The Net-to-Gross ratios are all near or above 1.0, primarily because the spillover rate equals or exceeds the freeridership rate, except in the case of exterior fixtures which found high freeridership (40%) and no spillover.
Table 5-48: Net Lifetime Energy Savings Adjusted for Behavioral Influences
Markdown CFLs
2003 – 2005
Coupon CFLs
2006 Coupon CFLs
Coupon Interior Fixtures
Coupon Exterior Fixtures Total
Volume of Products 199,336 283,591 545,192 26,174 5,920 1,060,213Gross Energy Savings (MWh) 43,057 73,507 129,538 18,041
22,007 302,555
Free Ridership Rate 29% 20% 20% 9% 40% Spillover Rate 23% 46% 30% 2% 0% Net-to-Gross ratio (1 + SO – FR) 0.94 1.26 1.10 0.93 0.60 Net Energy Savings (MWh) 40,473 92,619 142,491 16,778
13,204 323,937
Net Energy Savings Including Planned Installations (MWh) 45,099 92,619 149,804 17,552
13,527 337,768
Nexus Market Research

Process and Impact Evaluation of the Efficiency Maine Lighting Program Page 114
5.5. Comparison to Other Studies This section of the evaluation provides a review of selected findings from other lighting studies conducted in the northeastern U.S. Note that these studies evaluated coupon programs, usually over the previous year, thus only the Recent Coupon results from the current study are compared. Note also that the estimates of in-service rate, wattage reduction, and hours of use from the current study have been adjusted by the on-site data. We have provided a brief description of the methodology used in each study as appropriate. The following studies were reviewed:
! Impact Evaluation of the Massachusetts, Rhode Island, and Vermont 2003 Residential Lighting Programs. This study consisted of 823 telephone surveys and 128 on-site visits.
! The 2002-03 Process and Impact Evaluation of the New Hampshire RLP included both a telephone survey of participants and an on-site logger study; results presented here are based on the on-site logger study.
! 2000-2001 Northeast Utilities SLC and POP Impact Evaluation, April, 2003. This study consisted of a nested sample data collection structure with 613 phone surveys and 153 on-sites.
! 1998 Process and Impact Evaluation of Joint Utilities Starlights Residential Lighting Program. This study consisted of the performance of 753 telephone surveys.
Table 5-49 compares the in-service rates calculated from the current study to the other studies. The current study made a distinction between interior and exterior fixtures; however, most other studies do not provide results at this level. The bulb in-service rate from this study (66%) is in between the results of the MA/RI/VT and NH studies (62%) and the Starlights (73%) and NU studies (70%). The fixture in-service rates are consistent with the findings of the MA/RI/VT study and the NU study, which are substantially higher than the rates found in the other reports. The lower fixture in-service rate in the NH study was described as due primarily to “three customers in the sample that purchased fixtures but never installed them, perhaps due to the need for an electrician or a lack of time to install the fixtures themselves.”
Table 5-49: In-service rate Value Comparison for Coupon Purchases Study CFL Bulbs
Interior Fixtures
Exterior Fixtures
Current Study Findings 66% 79% 89% 2004 MA/RI/VT Study 61.6% 76.5% 79.8% 2002-2003 NH RLP Study 62.3% 53.2% 2000-01 NU SLC/RL Study 70% 80% 1998 Starlights Study 73.1% 60.6%
Nexus Market Research

Process and Impact Evaluation of the Efficiency Maine Lighting Program Page 115
Table 5-50 presents a comparison of the wattage reduction rates calculated from the current study with rates calculated in similar studies performed in the region over the last several years. Bulb wattage reductions in the current study are similar to the MA/RI/VT report, which are somewhat lower than in the Starlights and NU study, perhaps due to the increased prevalence of program bulbs replacing previously purchased CFL bulbs. Because the onsite visits did not assess fixtures, this study cannot estimate wattage displacement for fixtures.
Table 5-50: Wattage Reduction Rate Value Comparison for Coupon Purchases
Study
CFL Bulbs
Interior Fixtures
Exterior Fixtures
Current Study Findings 45 n/a n/a 2004 MA/RI/VT Study 48.7 48.7 94.7 2002-2003 NH RLP Study 40.9 85.3 2000-01 NU SLC/RL Study 52.0 104.0 1998 Starlights Study 54.8 75.4
Table 5-51 compares the hours of use calculated from this study with figures from previous studies. The daily hours of use estimates for bulbs is consistent with the results of the MA/RI/VT study as well as the NU and Starlights studies, but lower than the NH study findings. The hours of use estimates for interior fixtures is similar to the MA/RI/VT study results, which is somewhat less than other study results. The hours of use estimates for exterior fixtures (6.4) is substantially higher than the 4.0 hour estimate from the MA/RI/VT study. This may occur because Maine residents are installing fixtures in higher use locations.
Table 5-51: Daily Hours of Use Rate Value Comparison for Coupon Purchases
Study CFL Bulbs
Interior Fixtures
Exterior Fixtures
Current Study Findings 3.2 2.4 6.4 2004 MA/RI/VT Study 2.7 2.1 4.0 2002-2003 NH RLP Study 4.7 3.2 2000-01 NU SLC/RL Study 3.4 3.0 1998 Starlights Study 3.4 3.4
Nexus Market Research

Process and Impact Evaluation of the Efficiency Maine Lighting Program Page 116
The freeridership rate for bulbs and interior fixtures are similar to those found in other studies (Table 5-52). At 40%, the freeridership estimate for exterior fixtures is higher than rates found in previous studies.
Table 5-52: Freeridership Rate Comparison for Coupon Purchases Study CFL Bulbs
Interior Fixtures
Exterior Fixtures
Current Study Findings 20% 9% 40% 2004 MA/RI/VT Study 11% 10% 15% 2002-2003 NH RLP Study 19% 17% 28%
Table 5-53 finds a higher spillover rate for bulbs than found in previous studies, but lower spillover rates for fixtures. Again, this may be attributed to the widening availability of low-cost CFLs in the marketplace.
Table 5-53: Spillover Rate Comparison for Coupon Purchases Study CFL Bulbs
Interior Fixtures
Exterior Fixtures
Current Study Findings 30% 2% 0% 2004 MA/RI/VT Study 22% 6% 7% 2002-2003 NH RLP Study 4% 9% 6%
Nexus Market Research

Process and Impact Evaluation of the Efficiency Maine Lighting Program Page 117
5.6. Assessment of Measure Life Currently, all ENERGY STAR-qualifying CFLs must have an average rated life of at least 6,000 hours in a 3 hour on/20 minute off cycle, as declared by the manufacturer. However, there has been concern that some products are not performing to the claimed standards. Consideration of measure life is important for a number of reasons. When energy-efficient lighting products are not as durable or do not perform as anticipated, program energy savings expectations are not met and consumer confidence in the products and the ENERGY STAR label is eroded, creating additional barriers to establishing sustainable markets for the products. We investigated the existence of research on the measure life and effective useful life of ENERGY STAR CFLs. Measure life is the number of hours that a bulb operates for before it burns out and needs to be replaced. Effective useful life, on the other hand, bases failure rates on the presence or absence of products at the time a study is conducted. Therefore, products could be considered to have failed just for being removed and not necessarily for having burned out.23 The table below presents the current data available on effective useful life. For comparison, these results are also converted into average hours of use per day assuming measure lifetimes of 6,000, 8,000, and 10,000 hours. These values were selected because almost 96% of ENERGY STAR-qualifying bulbs are rated for one of these three lifetimes24 by manufacturers. Elsewhere, there appears to be little work done to quantify effective useful life.
Table 5-54: Data on Effective Useful Life
Source
CFL Effective Useful Life (in
years)
Est. hrs/day assuming
6,000 hr life
Est. hrs/day assuming
8,000 hr life
Est. hrs/day assuming
10,000 hr life 1996-1997 SG&E2
6.4 2.57 3.42 4.28 California Database for Energy Efficient Resources (DEER)25
9.4 1.75 2.33 2.91
SPWG26 CT 5.0 3.3 4.4 5.5 SPWG26 VT 6.4
*
2.6 3.4 4.3 SPWG26 ME 7.6
+
2.2 2.9 3.6 SPWG26 NH 8.6 1.9 2.5 3.2 SPWG26 MA, RI 9.0 1.8 2.4 3.0
* Based on 3 hours/day, 7,000 hours.
+ Based on 2.7 hours/day, 7,500 hours.
One resource available for estimating measure life is the Program for the Evaluation and Analysis of Residential Lighting (PEARL) at the Lighting Resource Center. PEARL serves as a testing program for efficient lighting products that are available to consumers. To date PEARL has tested 40 CFLs and 20 fixtures. While no measure life testing per se has been performed, the test of lumen maintenance at 40% of rated life provides the best proxy. In the PEARL test, the lumen output for CFL samples was measured at 1,000 hours and then the samples were aged in 23 1996 and 1997 Residential Appliance Efficiency Incentives Program: Compact Fluorescent Lights, Fourth Year Retention Evaluation. San Diego Gas & Electric. March 2001. Study ID No. 984. 24 http://www.energystar.gov/index.cfm?fuseaction=cfls.display_products_excel. 25 http://eega.cpuc.ca.gov/deer/measure.asp?s=1&c=13&sc=63&m=388703. 26 State Program Working Group Measure Life Values, Draft Report. GDS Associates. February, 2007.
Nexus Market Research

Process and Impact Evaluation of the Efficiency Maine Lighting Program Page 118
the testing laboratory until each CFL sample reached 40% of its rated life using a 3-hour on/20-minute off cycle. The light or lumen output of the samples was then measured again. The lumen maintenance at 40% of rated life for each sample was then calculated as the ratio of the lumen output at 40% of rated life to the initial lumen output. Products were considered to meet the ENERGY STAR specification if the average of this ratio was equal to or higher than 80%. Another estimator of CFL measure lifetimes are the Specifier Reports published by the LRC through the National Lighting Product Information Program (NLPIP). These reports summarize the results of testing on various lighting products. For one of these reports,27 they tested screw-based CFLs on the following six different operating cycles:
! 5 minutes on and 20 minutes off ! 5 minutes on and 5 minutes off (under cabinet) ! 15 minutes on and 5 minutes off (bathrooms) ! 1 hour on and 5 minutes off (dining room) ! 3 hours on and 5 minutes off (kitchen or living room) ! 3 hours on and 20 minutes off (standard cycle)
The testing ran for approximately 30 months; from June 1996 until December 1998. Once half of the bulbs in the sample failed, the median life was recorded. These results are presented in the table below. The bolded numbers represent situations where the product met or exceeded the manufacturer reported measure life. The table shows that CFLs which are turned on more frequently do not reach the manufacturer reported measure life as often as those that are turned on less often. Although a little out-dated, these results suggest that pattern of use may play a large role in the true measure life of CFLs.
Table 5-55: Results of NLPIP testing on Screw-In CFL Bulb Life Median Life (Hours)
Wattage, Mfg, & Type Rated Life (hrs)
5m on 5m off
5m on 20m off
15m on 5m off
1h on 5m off
3h on 5m off
3h on 20m off
Total Bulbs Tested 88 88 88 88 44 44 15W GE Triple 10,000 (0)* 7,278 (0)* (0)* (1)* (0)* 20W GE Triple 10,000 6,668 751 3,253 13,559 17,799 (0)* 18W LOA Quad 12,000 1,158 1,632 1,401 3,181 4,025 3,965 20W LOA Circular 12,000 859 1,914 1,797 4,269 5,073 5,397 15W MaxLite Spiral 7,500 1,236 1,817 2,557 5,628 7,364 6,341 17W MaxLite Spiral 10,000 1,950 667 5,390 12,217 12,134 (0)* 15W Sylvania Triple 10,000 (1)* 582 (0)* (1)* (2)* (2)* 23W Sylvania Triple 10,000 (3)* 12,054 14,590 19,887 10,356 17,723 16W Panasonic Capsule 10,000 533 1,258 2,753 6,704 9,618 10,212 15W Phillips Triple 10,000 10,157 286 12,577 12,962 11,103 11,966 17W Phillips Capsule 10,000 4,265 8,893 12,868 13,436 19,005 16,350
* At the time the study had concluded half of the samples had not yet failed and therefore no median lifetimes where calculated for them. The number in parentheses represents the number of bulbs that failed during the testing period.
27 http://www.lrc.rpi.edu/programs/NLPIP/PDF/VIEW/SR_SB_CFL.pdf.
Nexus Market Research
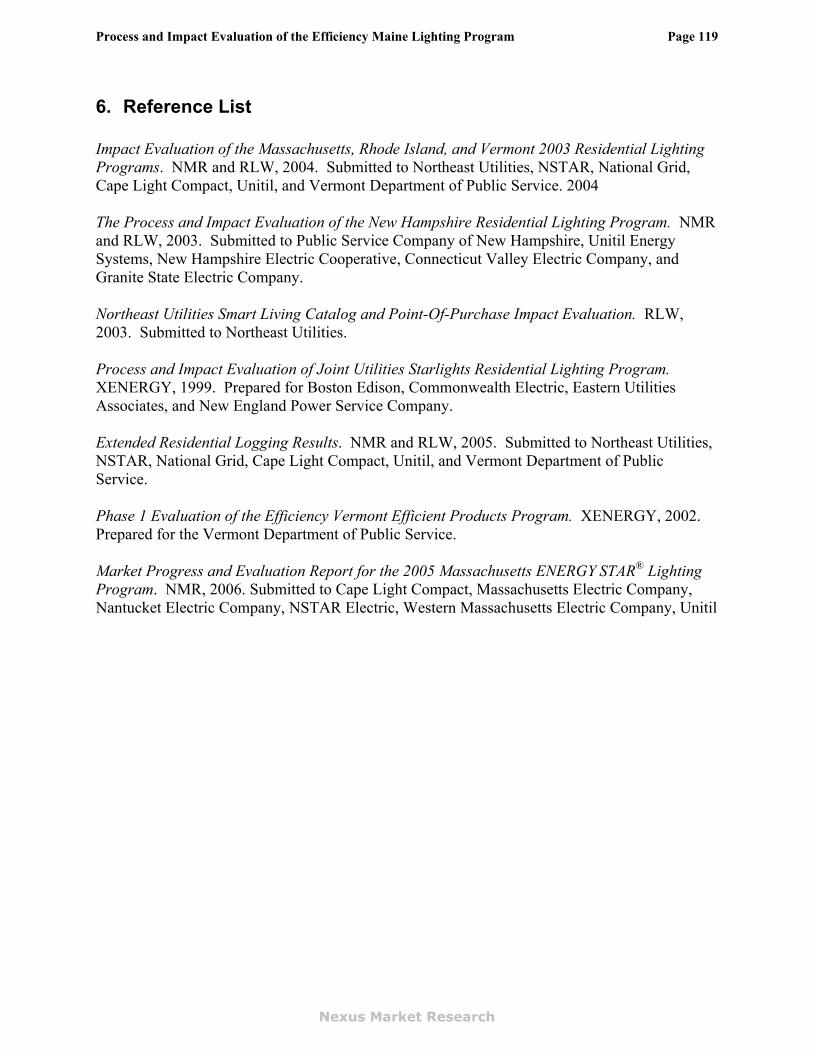
Process and Impact Evaluation of the Efficiency Maine Lighting Program Page 119
6. Reference List Impact Evaluation of the Massachusetts, Rhode Island, and Vermont 2003 Residential Lighting Programs. NMR and RLW, 2004. Submitted to Northeast Utilities, NSTAR, National Grid, Cape Light Compact, Unitil, and Vermont Department of Public Service. 2004 The Process and Impact Evaluation of the New Hampshire Residential Lighting Program. NMR and RLW, 2003. Submitted to Public Service Company of New Hampshire, Unitil Energy Systems, New Hampshire Electric Cooperative, Connecticut Valley Electric Company, and Granite State Electric Company. Northeast Utilities Smart Living Catalog and Point-Of-Purchase Impact Evaluation. RLW, 2003. Submitted to Northeast Utilities. Process and Impact Evaluation of Joint Utilities Starlights Residential Lighting Program. XENERGY, 1999. Prepared for Boston Edison, Commonwealth Electric, Eastern Utilities Associates, and New England Power Service Company. Extended Residential Logging Results. NMR and RLW, 2005. Submitted to Northeast Utilities, NSTAR, National Grid, Cape Light Compact, Unitil, and Vermont Department of Public Service. Phase 1 Evaluation of the Efficiency Vermont Efficient Products Program. XENERGY, 2002. Prepared for the Vermont Department of Public Service. Market Progress and Evaluation Report for the 2005 Massachusetts ENERGY STAR® Lighting Program. NMR, 2006. Submitted to Cape Light Compact, Massachusetts Electric Company, Nantucket Electric Company, NSTAR Electric, Western Massachusetts Electric Company, Unitil
Nexus Market Research