Embed Size (px)
Citation preview
Process Design toward Continuous Manufacturing: a Green Perspective
David am EndeChemical Engineering
Chemical R&DPfizer, Inc., Groton, CT
13th Annual Green Chemistry & Engineering ConferenceJune 23-25, 2009College Park, MD

Current Challenges inPharmaceutical Development [1,2]
• Synthetic targets of increasing complexity• Development costs continue to increase
- Estimates of +$2Billion for NCE to NDA [3]
• High attrition rate post FIH ~90%• Regulatory demands continue to increase• External cost factors on drug pricing• Compressed development timelines• Costs of Manufacturing1Federsel, H, In Search of Sustainability: Process R&D in light of current pharmaceutical challenges, Drug Discovery Today, 11(21/22) November 2006
2 Kola & Landis, Can the pharmaceutical Industry reduce attrition rates, Nature Reviews Drug Discovery, 3, 711-715, 20043 Suresh & Basu, J. Pharm Innov (2008) 3:175-187

Complexity of API Targets
celecoxib/Celebrex varenicline/Chantix pregabalin/Lyrica
N
N
O
S
O
N O
O
NN
N
sildenafil/Viagra atorvastatin/Lipitor
NN
CF3
H3C
SO
O
H2N
NN
CF3
H3C
SO
O
H2N

Manufacturing Costs: A Significant Driver of the Financial Returns of Pharma
COG's26%
R&D15%Admin
32%
Margin27%
COG'sR&DAdminMargin
[1] The Gold Sheet, January 2009, page 3, Attention Turns to the Business case for Quality by Design.[2] Adapted from Codgill, Knight, Anderson, Drennen, The Financial Returns On Investments in Process Analytical Technology andLean Manufacturing: Benchmarks and Case Study, J. Pharm Innov (2007) 2:38-50.
Major Branded Pharma, Median%, (n=10), 2006 Survey of Annual Reports[2]
COG’s average about 25% of Sales in an Industry with $600 Billion of Annual sales; or COG’s of $150 Billion [1]

Lean Manufacturing: Improve Profitability by Eliminating “Waste”
• Overproduction• Waiting• Transportation• Unnecessary processing• Uneccessary inventory• Uneccessary motion• Production of defects
#1 greatest waste is excess Inventory
0
1000
2000
3000
4000
5000
6000
1 2 3 4 5
RawsWIPFG
$Millions Big Inventories of Big Pharma
The accepted standard carrying costof Inventory is 20% [1]
[1] Codgill et al, J. Pharm Innov. (2007) 2:38-50
(cost-of-capital =12% overhead =8%)
$4 Billion Inventory = $800 million Carrying Cost

“Typical” API Cost Reductions Post Launch under Different Development Paradigms
0
20
40
60
80
100
120
0
20
40
60
80
100
120
0 1 2 3 4 5 6 7 8 9 10 11 12
CO
G's
Norm
alized Volum
e (% of M
ax)
Year After Launch
Volume
Traditional
Future
Future state effectively creates revenue:Challenges R&D to launch with low cost processes
Savings
$/kg

“Typical” Annual API Production Costs Post-Launch under Different Development Paradigms
0
20
40
60
80
100
120
0 1 2 3 4 5 6 7 8 9 10 11 12
Cos
t ($
Milli
ons/
year
)
Year after Launch
No Development(Fixed $2000/kg)
TraditionalDevelopment
FutureState
Example: $2000/kg with peak of 50 MT/yr
0
100
200
300
400
500
600
700
800
900
BaseCase Traditional Future
∫ ⎟⎟⎠
⎞⎜⎜⎝
⎛∗= dt
yeartkgtCOGCost )()(
Single API : Potential Cumulative Savings of $400 MM vs Traditional
Cumulative Cost
R&D: Greater Focus on COG’s
• Emphasis on having the best chemistry, at lowest cost, at the time of launch
• Emphasis on Process Design; Integrating best chemistry with the best engineering design – to achieve safe, green, robust, & well understood processes, while meeting or exceeding quality specifications.
Innovation is Key to Driving Down costs

Opportunities: Areas of Emphasis
• Predictive/Process Modeling• Green Chemistry• Biocatalysis• Chemistry “Lab of the Future”• Process Design• New Manufacturing Technologies• Continuous Processing
Quality by Design

Value Proposition for Process Modeling [1]
Increase Results
• Solubility models for improved purifications
• Distillation models to improve quality and performance
• Extraction modeling models • Kinetic modeling to improve
yield and selectivity and reactor design
• Process models that improve control
Reduce Resources
• reduced experimentation• opportunities for energy and
waste minimization• Capacity models identify
minimal resources to produce at given capacity
• Production allocation models to minimize total operating costs
• Supply chain models minimize inventory while maintaining adequate supplies
Productivity = Results obtained / Resources required
Dramatic increases in productivity via predictive screening!…frees resource to drive further optimization and cost reductions
1 McGarvey, Bernard, Chemical Engineering Progress, September 2007, 41-47

Process Modeling Areas in Chemical Engineering (API)• Phase Equilbrium Models
– Solubility prediction– Distillation prediction– Extraction Selectivity
• Reaction Kinetics and Reaction Equlibria– Model Identification and Discrimination
• Unit Operation Models– Filtration/centrifugation performance– Crystallization (growth rates)
• Equipment Models– Mixing times (micro, meso, macro) vs Reaction Kinetics– Solids Suspension in Tanks– Shear Rates (crystal or agglomeration breakage)– Batch and Continuous Flow configurations
• Quality by Design Process Mapping• Retrosynthesis and Costing Models
• Aspen • Athena• Cosmotherm• Design Expert• Dynochem• Fluent• Mettler iControl• Numerica/Jacobian• Visimix
Software Tools*
*Pfizer avails of a wide selection of software tools to aid in process mapping, and are not explicitly endorsing the software tools listed here

Predictive/Process Modeling
Increase Productivity by Increasing Number of Users
Expert Users(Engineering &
Technology Groups)
Occasional Users(available to
all R&D)
BuildUser
FriendlyWeb
Interfaces(for TypicalScreeningProblems)
…further leveraged by making accessible to the masses
e.g. Solubility Screening, Distillation Modeling, Extraction Modeling
…is one of the keys to attacking COG’s

s-surface
s-profile
Relative Solubility
chloroform 9.187238Ethoxy ethanol 5.388971methanol 2.751922n-butanol 2.240603IPA 1.790016t butanol 1.386694DCM 1.112964Water 11,2 dicholoethane 0.650617dimethylformamide 0.54352Ethyl Acetate 0.493754Me-THF 0.458001t-butyl acetate 0.452312MTBE 0.434394PhCF3 0.426536Toluene 0.412605carbon tetrachoride 0.330425iso octane 0.315709hexane 0.314053heptane 0.312642cyclohexane 0.309965
First Principle Models Solubility Predictions (CosmoTherm)CoConductorlike nductorlike SScreening creening MoModeldel
Solvent database s-profile
HB-Acceptor
Weak HB-Donornonpolar
CosmoBaseCOSMO-charge surface are qualitatively describing
molecules :• Reactive Sites• Polarity• Hydrogen Bonding• Lipophilicity / Hydrophilicity
(no experimental data required)
Experiments
Solvent Screening in minutes instead of days

Web Interface Developed by R&D, to enable Solubility Modeling to wide-range of users


Crystallization Design Applications
CP-548495
CP-549864 “meta-impurity”
Screening Prediction :DCM very high solubility – reaction solvent
MeOHCP-548495 / CP-549864 = 0.73
Methanol good solvent to selectively isolate CP-548495
Agrees with experimental Data
Varenicline Recrystalization
Torcetrapib API Solubility Relative Solubility CosmoThem
Experimental Solubility (mg/ml)
Experimental Relative Solubility
H2O 5.9E-09 0.1 0.0002heptane 0.0140 20 0.0333hexane 0.0172 25 0.0417EtOH 0.0728 225 0.3750MeCN 0.2011 600 1.0000EtOAc 1.0000 600 1.0000
CosmoTherm predicts the ranking(high solubility is more difficult to calculate since the solute can act as its own solvent)
0
0.01
0.02
0.03
0.04
0.05
0.06
0.07
0.08
0 0.1 0.2 0.3 0.4 0.5 0.6 0.7 0.8 0.9 1
% wt of Ethanol
non
idea
l sol
ubili
ty
Prediction of anti-solvent effect (water-ethanol system)
Jason Mustakis

Distillation Screening & Modeling
B1
• Development of eLN-Ready Tools• Promotes Green Chemistry by Ranking• Enables Quick Screening of Solvents• Entry into Aspen BatchSep Models
Eric Cordi

Impacts of Poorly Understood Distillation
Wasted cycle time: heat, cool, sample . . . heat, cool, sample . . .Degradation of compounds in solutionFoaming through the ventUnexpected/uncontrolled formation of solids or oilExcessive solvent use
Eric Cordi
Benefits of Good Distillation Design
Efficient exchange of solvents – green chemistryEffective solvent drying before water-sensitive stepsChoice of distillation pressure for beneficial azeotropeChoice of strip & replace or constant-level distillationTracking distillation temperature to preserve chemical stabilityFollow solvent composition vs. volume for solubilityFit to available vessel minimum stir volume

Eric Cordi

Solvent Screening Tool

T-xy Phase Diagrams
Eric Cordi

Liquid Extraction Screening & Modeling
• Property predictions• Distribution coefficients• Complex mixtures available• Temperature sensitive• Portable to Excel interface• Screening for lab efficiency
• COSMOtherm• Aspen Properties• Excel with VBA• Portability for eLN
Log P and Activity Coefficient Modeling
in COSMOtherm

Innovation is Key to Driving Down Costs
• Predictive/Process Modeling• Green Chemistry• Biocatalysis• “Lab of the Future”• Process Design• New Manufacturing Technologies• Continuous Processing• WorkFlows
Areas of opportunity and current focus in Chemical R&D/PGRD

Process Design: An Expanding Tool Box
• Wiped Film Evaporation• Centrifugal Extraction• CCCE – continuous counter-current extraction• Membrane separations• High Shear Mixing• Rapid mixing technology• Continuous processing
– Enabling selected steps– Holistic: reaction through isolated API– Vision: Holistic API through DP

“Evolution to Continuous ProcessingSeen as the Next Step after Quality by Design” [1]
• Novartis-MIT Center for Continuous processing– Blue-Sky Vision …a major transformation in manufacturing– API-DP manufacture fully integrated in one facility
• Different organizational structures• “capital cost for batch processing is about $24.6 MM
while under continuous manufacturing is estimated to be $7MM”
• Operating Costs $8.6 vs $6.4MM (Batch vs Cont.)• Reduction in Footprint - 10% of current
[1] “The Gold Sheet” Vol. 43 No 2. February 2009.

Scope of Continuous Processing
• Single Step Reaction or Unit operation–“continuous” Batch
• Multistep Reaction/Unit Operation interfaced to Batch Processes
• Continuous DP batches (ie continuous tableting)
• Holistic API processes operate 24/7– Significant equipment/facility footprint
• Holistic API + DP operate 24/7

Potential Advantages of Continuous FlowBenefits in R&D
– Enable High Energy Chemistry– Reduced Inventories of hazardous intermediates– Scale-Up of 2X to 4X (on pipe diameter) vs 50 to
1000X– Reactants experience steady state conditions
• High Intensity Mixing typically• Efficient heat exchange• Robustness Enabling:
OxidationsNitrationsHalogenationsMetallationsHigh Temp Chemistrydiazotizations
Benefits in Production•Reduced solvent usage•Reduced cycle times•Reduced capital costs for new capacity•Better lot-to-lot consistency•Less Inventories – (elimination of WIP’s)•Less labor/overhead/smaller plants/lower costs

0
10
20
30
40
50
60
70
80al
kyla
tions
salt/
free
base
redu
ctio
ns
acyl
atio
ns
boc/
debo
c
hydr
olys
is
este
rific
atio
n
ethe
r for
mat
ion
pept
ide
form
atio
n
cond
ensa
tions
sulfo
natio
ns
disp
lace
men
t
deal
kyla
tion
oxid
atio
ns
addi
tions
debe
nzyl
atio
n
Grig
nard
form
atio
n
cros
scou
plin
g
rear
rang
emen
t
epox
idat
ions
met
alla
tion
nitra
tions
halo
gena
tion
deca
rbox
ylat
ion
Frie
delC
rafts
cyan
ohyd
rin
diaz
otiz
atio
n
Reloads-Out
Reloads-IN
Unique-Out
Unique-IN
Enabling Hot Chemistry via Flow
Enable Potentially Hazardous Chemistry via Flow
• Oxidations
• Nitrations
• Diazotizations
• Halogenations
• Reactions Requiring High Containment due to toxicity concerns
Estimated 10% Current Portfolio
Often Chemistry is Re-Routed to avoid a hazardous steps
T
T
T
T
T
Thermocouple
Solution ofProduct
to Quench/Work-up
PAT
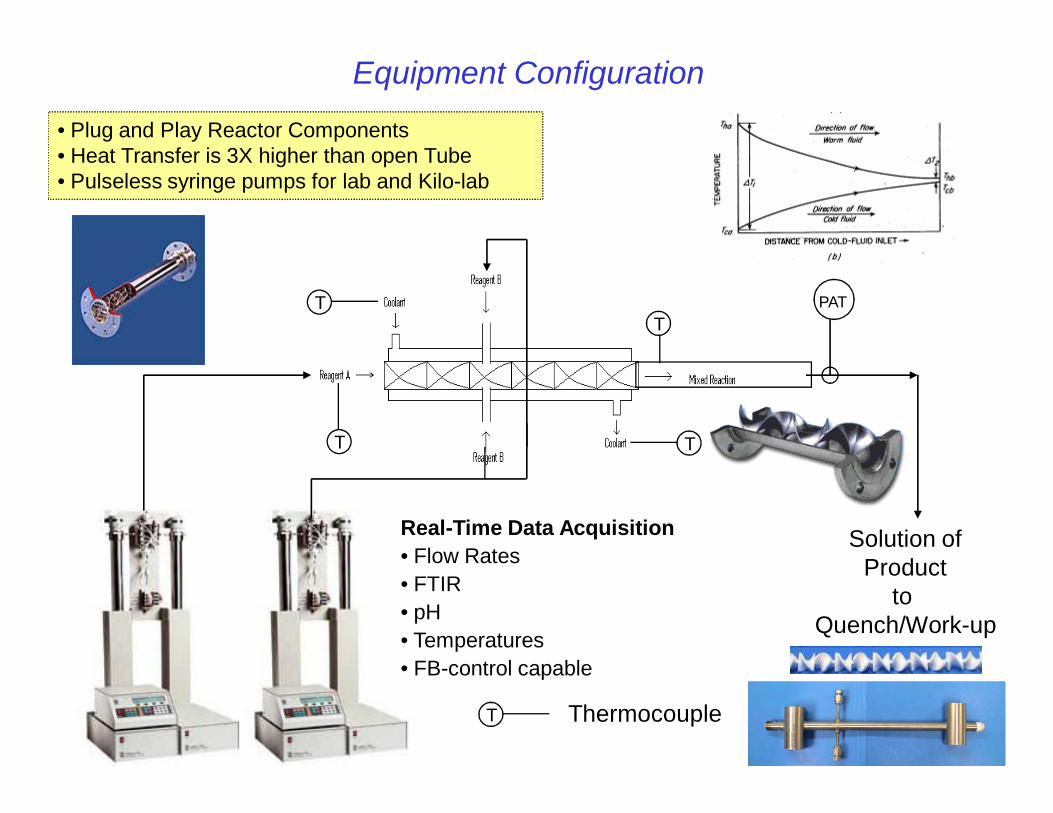
• Plug and Play Reactor Components• Heat Transfer is 3X higher than open Tube• Pulseless syringe pumps for lab and Kilo-lab
Real-Time Data Acquisition• Flow Rates • FTIR• pH• Temperatures• FB-control capable
Equipment Configuration
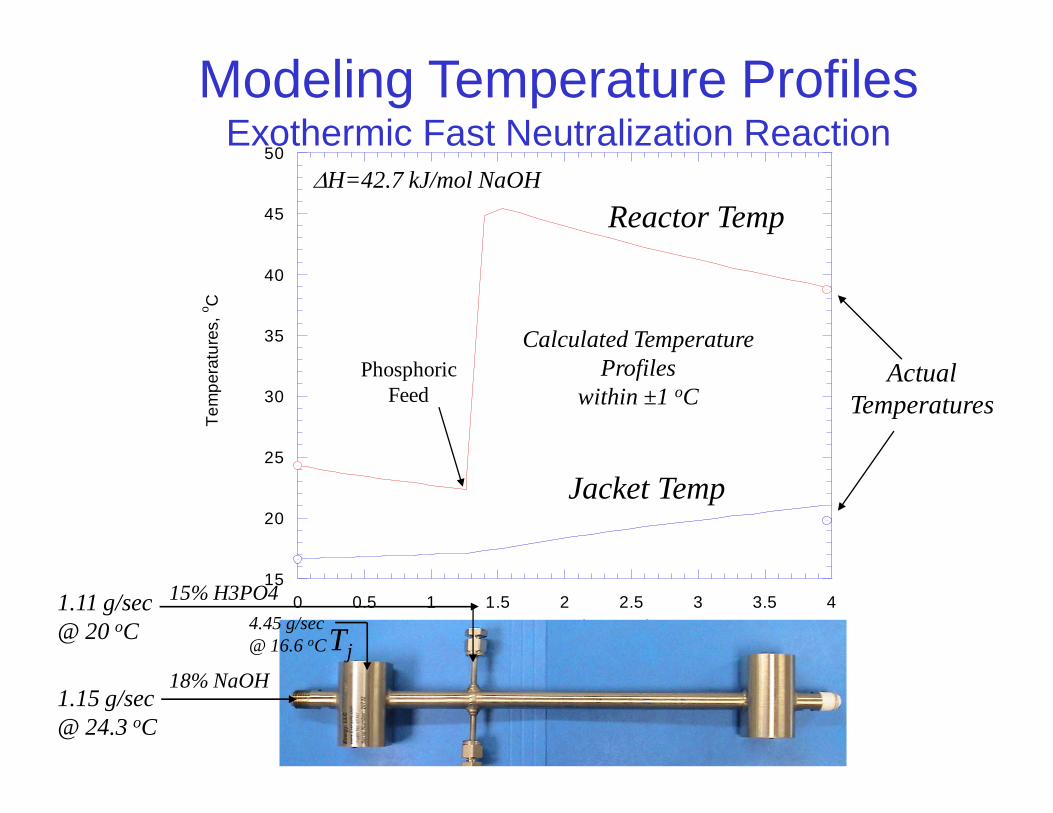
15
20
25
30
35
40
45
50
0 0.5 1 1.5 2 2.5 3 3.5 4
Tem
pera
ture
s, o C
Reactor Volume, ml
PhosphoricFeed
4.45 g/sec@ 16.6 oC
1.15 g/sec@ 24.3 oC
Tj18% NaOH
1.11 g/sec@ 20 oC
15% H3PO4
Calculated Temperature Profiles
within ±1 oC
Reactor Temp
Jacket Temp
ActualTemperatures
∆H=42.7 kJ/mol NaOH
Modeling Temperature ProfilesExothermic Fast Neutralization Reaction

Oxidation with Peracetic Acid
108 g AcOAc 128 g H2O2
substituted pyridine/ 2 vols EtOAC
30 min add40 min add
Dual Addition
-20
0
20
40
60
80
-0.02
0
0.02
0.04
0.06
0.08
0.1
0.12
0.14
-20 0 20 40 60 80 100 120 140
Hea
t Flo
w, W
atts
and
Tr,
o C
mass of dose
minutes
H2O2
acetic anhydride
Heat Flow
Tr
aq 30-50% H2O2 NO
N
substituted pyridine
AcOAc
substituted N-oxide
R2
R3
R1 R1 R2
R3O
O O+
OH
O+
EtOAc

Oxidation with Peracetic Acid
-20
0
20
40
60
80
-0.02
0
0.02
0.04
0.06
0.08
0.1
0.12
0.14
-20 0 20 40 60 80 100 120 140
Hea
t Flo
w, W
atts
and
Tr,
o C
mass of dose
minutes
H2O2
acetic anhydride
Heat Flow
Tr
Gut – Bill – Jorgensen – VanAlsten
O
O OH2O
OH
O2k1
OH
Ok2H2O2+
+
O
O
OHH2O+
N
k3
O
O
OH NO
OH
O+ +
R1 R2
R3
R1 R2
R3

Continuous Flow Oxidation Reactor Set-up

DOE Results:Steady State
Continuous Flow Conditions
Range of Robustness

A Simple Reaction
• Lithiation Reaction performed in RC-1 calorimeter at -50ºC.– During nBuLi addition, reaction went from colorless-orange-green-
black.– Large volume of solids produced, forming a “cap” at top of solution.– Subsequent runs at -65ºC produced similar results, although color
change was slower.
• Comparison with bench-top experiments– Reaction always proceeded as expected in RBF experiments from
0.1 – 22L scale.
Br Br n-BuLi
Br LiTHF
-78 to -40oC
BrR1
R2
OHR1 R2
O
Problem….why are we having problems running in the RC-1
From the Literature
• Reaction turns black upon warming to room temperature
• Both para- and meta- linkages suggest bromobenzyne intermediate
Br
Br
t-BuLi (1.5 eq)THF, -78oC
Li
Br
Warm to r.t.
Br
m n
Tour, J. M.; Stephens, E. B.; Davis, J. F. Macromolecules 1992, 25, 499-500.Stephens, E. B.; Kinsey, K. E.; Davis, J. F.; Tour, J. M. Macromolecules 1993, 26, 3519-3532.
Leroux, F.; Schlosser, M. Angew. Chem. Int. Ed. 2002, 41, 4272-4274.Gilman, H.; Gaj, B. J. J. Org. Chem. 1957, 22, 447-449.
Br
R
Br BrRR-Li
Li
Li
R = Br
H+
R
Br BrR
Kinetic Modeling of the Undesired Reactions
0
2
4
6
8
10
12
0 25 50 75 100 125 150
Hea
t Flo
w (W
)
Minutes
RC-1 Data
Kinetic Model
Br Br
Br Li
Br Br
Li
BrBr
Li
0
0.01
0.02
0.03
0.04
0.05
0.06
0 25 50 75 100 125 150
Mol
s
Minutes
Br Br Br Li+ Br Br
Li
Br Br
Li
+ Br
+ LiBrBr Li+ Br
Li
Br
slow
slow
k1
k2
-55 oC
14.8 g (0.062 mols) of dibromobenzene + 25 ml THF
0.062 mols of LiBrbenzeneIn 400 ml THF
Experimental MeODQuenched samples
• Run more Dilute 10X – will reduce Tad from 89 to 9 oC• Run colder –75 oC• Minimize time for Anion to “see” dibromobenzene
– Use a pre-prechilled feeds in jacketed static mixer
– dual or co-axial flow of both feeds near impeller
Improved Mode of Operation
n-Butyl Lithium in Hexanes
Bromobenzene/THF
Ketone/THFcoolant

Internal Use
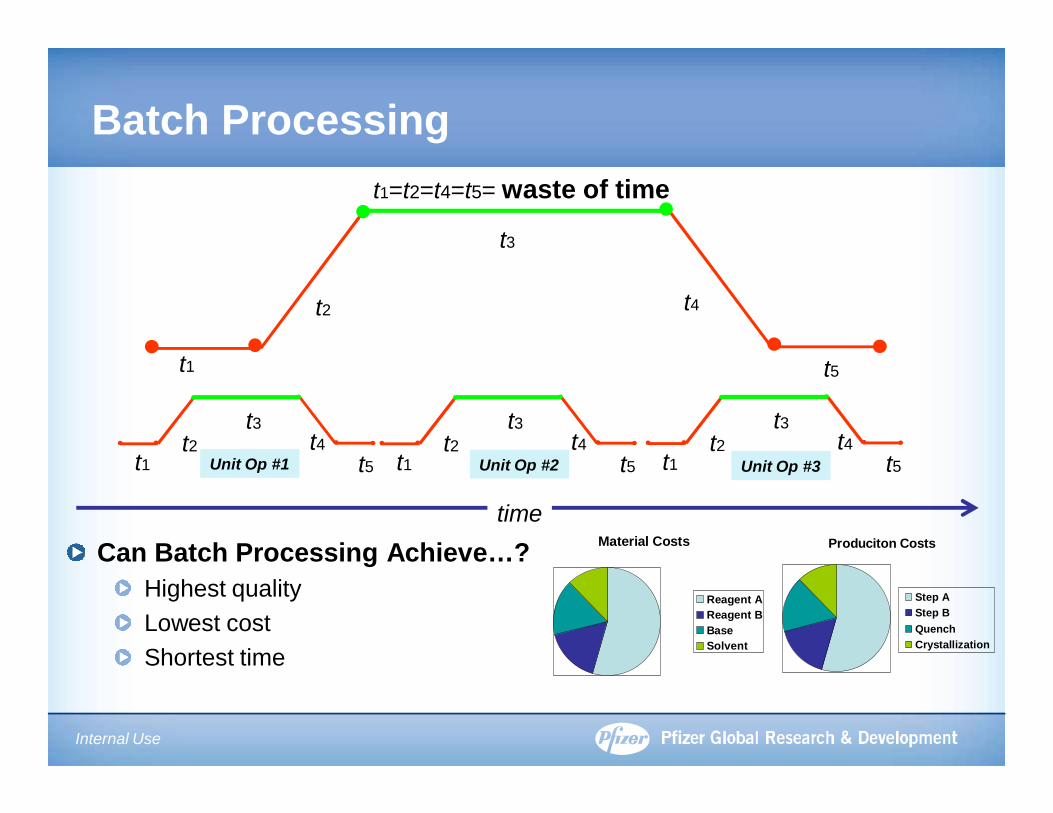
Batch Processing…not just chemical reactionsComplex flow of material and informationTombstone inventory (material sits)Multiple schedules with frequent changesLarge inventories of materials or backlogs
Work methods adapted to changing circumstances (compress cycle times, change sequence of work, …)Customers are distant, needs unclearNot certain when to raise a flag CONFUSION
“Leveling is the smoothing of production. It is the most important condition by Kanban and for minimizing idle time in regard to manpower, equipment, and work in process. It is the cornerstone of Toyota Production System.”
“Toyota Production System” Monden
Raw Materials Reaction Separations Crystallization
Internal Use
Batch Processing
Can Batch Processing Achieve…?Highest qualityLowest costShortest time
Material Costs
Reagent AReagent BBaseSolvent
t1
t4
t3
t2
t5
t1=t2=t4=t5= waste of time
t1t4
t3t2
t5 t1t4
t3t2
t5 t1t4
t3t2
t5Unit Op #1 Unit Op #2 Unit Op #3
Produciton Costs
Step AStep BQuenchCrystallization
time

Internal Use
Continuous Process
Run in parallelImmediate feedbackStability
t1t4
t3t2
t5
t1t4
t3t2
t5
Unit Op #1
t1t4
t3t2
t5Unit Op #2
Unit Op #3
Internal Use
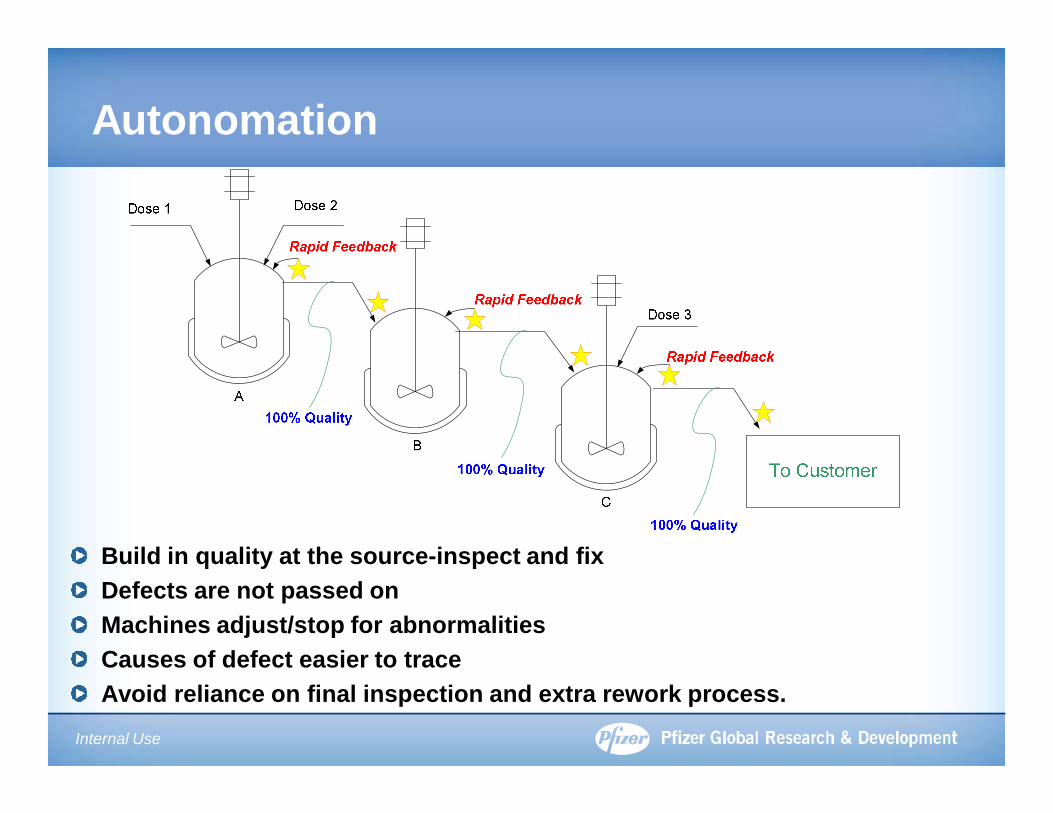
Autonomation
Build in quality at the source-inspect and fixDefects are not passed onMachines adjust/stop for abnormalitiesCauses of defect easier to traceAvoid reliance on final inspection and extra rework process.

Internal Use
Life Cycle Production Strategy
Development Growth Stability Decrease
Launch 2 4 6 8 10Life Cycle in Years
MT API
Ci,Pi,Ti Vi
Fao

Internal Use
Turndown-Option
CSTR 1Step 1
Vi

Internal Use
Ci,Pi,Ti
Turndown-Option 2c-kineticsStep A DynoChem
0.00
10.00
20.00
30.00
40.00
50.00
60.00
70.00
80.00
90.00
100.00
0 1 2 3 4 5
Time [hr]
Con
vers
ion
% 70C60C50C

Internal Use
Bigger Picture
How to integrate API and DP continuous flowWhat will facilities of the future look like?
Smaller, dedicated facilitiesHow will flow be integrated across the company?
Careful of implementing pieces…leads to confusion of the actual goalCareful of trying to do too much—if training is not in place a continuous process will not succeed but again cause confusionSmall team dedicated to a common goal for a flow process will work
Filing Strategies?Batch with quick continuous follow-on?Continuous with batch as back-up?Continuous and batch?

Pla
nt C
osts
Cost savings – reduce footprintReduce overhead, depreciation, laborTo maintain excess capacity
Continuous Processing:Strategic Vision and Future State
= HTF Su pply to m odule = Delta V co nnection
= HTF Retur n fro m mo dule = Power connect io n
pH adjustdissolutionspeck fr ee filtra tion
Crystalliza tion
Pr ocess Area Pro cess Ar ea Process Are a Pr ocess Area Pro cess Ar ea Process Are a Pr ocess Area Proce ss Ar ea Process Are a Pr ocess Area Proce ss Ar ea
Isolation/Dr yin g Area Iso la tion/Drying Are a Isolation /Dr ying Area I solation/Drying Ar ea Isolation /Drying Area Isolation/Drying Ar ea Isolat io n/Drying Area Isolation/Dr yin g Ar ea Iso la tion/Drying Are a
4SAPH/IPA slur ry Isolation M odule, a ssume a ctual location Drying M odule, a ssume in room suitable Isolat io n Mod ule, assum e actu al location Dr yin g Mod ule, assum e in r oom Isolat io n Mod ule, assum e actu al location m ake-u p tank is o n 2nd floor/m ezzanine for packout of API is on 2nd floo r/me zza nine suitable fo r packo ut of API is on 2 nd floor /mezzan ine 2nd Floor a bove th e dryer abo ve the d ryer abo ve the d ryer
Process 1 = Celecox ib Pr ocess 2 - Med ium Volume Pr ocess 3 - Sm all Vo lu me
Diket one Rxn: PF R
Celecoxib Rxn: CST Rs
Continu ous Centr ifuge
Solidaire Pa ddle Dryer
4M AP
ET FA
TF A
Na OMe
Continuou s Centrifu ge
Continuo us Pla te Dryer
Heinkel HF- 300
To rusdisc Dryer
WFEReaction Modu le
Hydr ogena tion Mo dule
Reaction Mo dule
WF E
Reaction Modu le Centrifu gal Separ ation
Mod ule
Speck Fre e F iltration
Crystallize r
Tr ica nter Modu le
Reaction Mod ule Rea ction
M odule
Reaction Mod ule
WF E
Crystallizer
Sp eck Fr ee Filtra tion
rpjack:Large Reactor M odule
r pjack:M edium Reactor Module
rpj ack:Small Work -up Module
rpj ack:Small Reactor M odule
4SAPH - IPA Slur ry
= HTF Supp ly to m odule = De l taV connection
= HTF Re turn from modu le = Power c onnec tion
pH adjustdiss olu tionspec k free fil tra tion
Crysta l li za tion
Process Area Proc es s Area Proc ess Area Process Area Process Area Process Area Proc es s Area Proc ess Area Process Area Proc es s Area Proc ess Area
Is olation /Drying Area Is ola tion/Dry ing Area Is ola tion/Dry ing Area Is o la tion/Dry ing Area Iso la tion /D rying Area Iso la tion /Drying Area Iso lation /Drying Area Iso lation /Drying Area Is olation/Drying Area
4SAPH/IPA s lu rry Is olation Module , ass um e actual loc ation D rying Modu le, as sum e in room su itable Iso lation Modu le, ass um e actual loca tion Drying Module , ass um e in room Is ola tion M odule , ass um e ac tua l loc ation make-up tank i s on 2nd floor/m ez zan ine fo r pack ou t of API i s on 2nd floor/m ez zanine s ui tab le fo r pack ou t of API i s on 2nd floo r/m ezzan ine 2nd Floo r abov e the d rye r abov e the d rye r above the d rye r
Process 1 = Ce lec ox ib Proces s 2 - M ed ium Vo lum e Process 3 - Sma l l Vo lume
Dike tone Rx n: PFR
Ce lec ox ib Rxn : CSTRs
Continuous Centri fuge
So lidai re Paddle Dry er
4M AP
ETFA
TFA
N aO Me
Continuous Cen tri fuge
Con tinuous Pla te Dry er
He ink el HF-300
Torus disc Drye r
WFEReaction M odu le
Hy drogenation Module
Reaction Modu le
WFE
Reac tion Modu le Centri fugal Separation
Module
Speck Free Fi ltra tion
Crys ta l li ze r
Tricante r M odu le
Reaction M odu le Reac tion
Module
Reac tion Modu le
WFE
C rysta ll i ze r
Spec k Free Fi ltra tion
rp jack :L arge Re actor Modul e
rpjac k:Me di um Reac to r Mod ule
rp jack :
S mall Work-up Mod ul e
rpja ck:Smal l R eactor Modu le
4SAPH - IPA Slu rry
vs vs
Flexible Batch facility(e.g Tank Utilization is < 50%)
Flexible Batch facility with Investment in Continuous Flow Trains
(e.g Batch Tank Utilization 30%)Flow Trains are approx 100% Capacity
Dedicated Flow Facility Flow Trains are
approx 100% Capacity
Cost savings inReduction of footprint,
overhead andLabor to maintain excess,
Flexible, capacity
API POF strategic vision analysis
Cost savings – withContinuous flow processingIn existing batch facilities
10%
20%-40%

A Lean Case Study: Convert Batch to a holistic continuous API flow process [1]
• > 60% reduction in capital cost• 40-fold reduction in utility requirements• > 80% reduction in plant footprint• > 7 fold reduction in total effluent• > 100 fold solvent inventory reduction• Elimination of multiple high-containment
operator interfaces
[1] Huw Thomas, Foster-Wheeler, Transforming the Pharma Industry: Lean Thinking AppliedTo pharmaceutical manufacturing , 7th World Congress of ChE, Glasgow 2005
Comment: significant reduction of fugitive emmissions
Internal Use
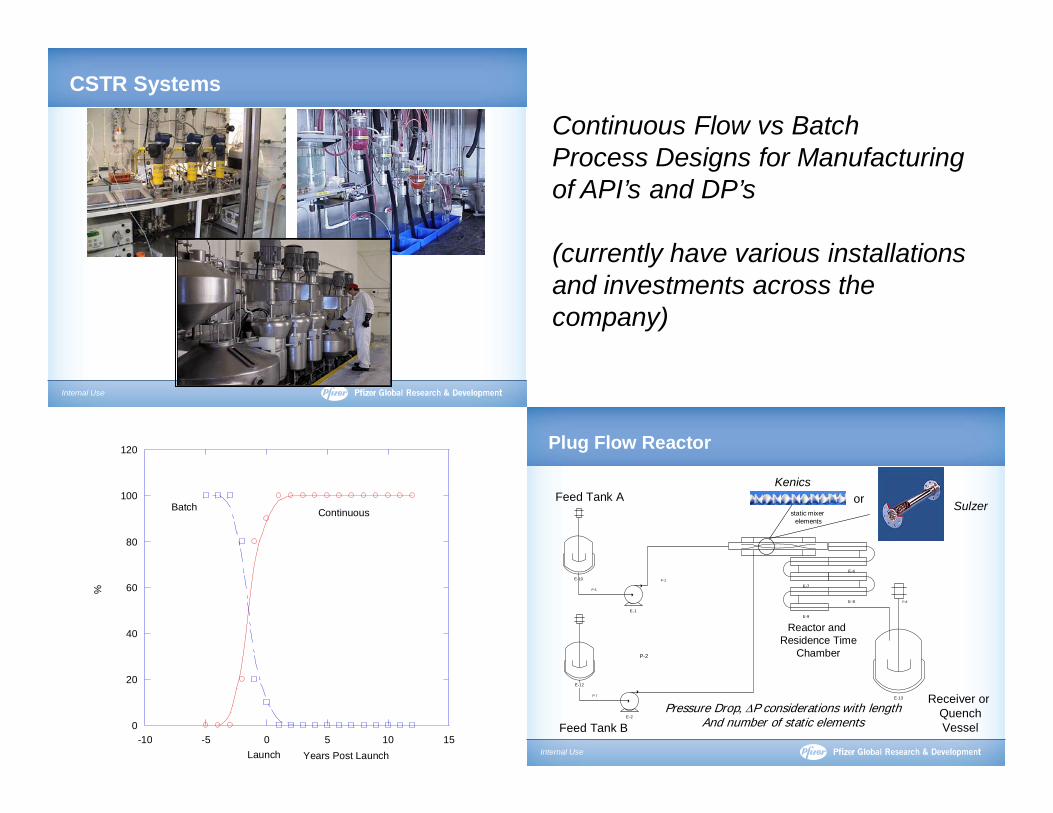
CSTR Systems
Internal Use
Plug Flow Reactor
E-1
E-2
P-2
P-3
E-6
E-7
E-8
E-9
E-10
P-5
P-7
E-12
E-13
P-8
orKenics
Sulzerstatic mixer
elements
Feed Tank A
Feed Tank B
Reactor and Residence Time
Chamber
Receiver or QuenchVessel
Pressure Drop, ∆P considerations with lengthAnd number of static elements
Continuous Flow vs Batch Process Designs for Manufacturing of API’s and DP’s
(currently have various installations and investments across the company)
0
20
40
60
80
100
120
-10 -5 0 5 10 15
%
Years Post LaunchLaunch
ContinuousBatch

Summary• Process (predictive) modeling is one of the
ways COG’s are being lowered and greener processes designed
• Developing/rollout models for the masses• Screening models – narrows the experimental space
• Process Design• Integrating chemistry and engineering to drive down
cycle times and COG’s• Expanded optimal selection of unit operation
technologies for manufacturing/unit operations• Continuous Processing
• Long term substantial costs savings envisaged• Need to figure out the transition• API and DP – Facilities of the future• Need thorough Life-Cycle and cost analysis…• Sustainability favorably impacts the bottom line
Green Engineering

Acknowledgements
• Steve Guinness• Michele Drexler• Jerry Salan• John Van Alsten• Jason Mustakis• Eric Cordi• Tom Ljubicic• Yuriy Abramov
• Matt Jorgensen• Andy Palm• Kevin Hettenbach• Tim Watson• Gerry Taber• Buzz Cue

Back-Up Slides

Perceptions: Design-Related Challenges in the Industry [1]
• “Products are not optimized for production when launched”
• “There is a lack of product and process understanding…we have empirical understanding…we don’t understand the complex physicochemical relationships…”
• “There is a high failure rate in both launch and manufacturing
• “There are long development timelines”• “Resources not always deployed on the highest
net present value topics”
1Ted Fuhr, McKinsey &Co., Attention turns to the business case for Quality by Design,The Gold Sheet January 2009.

“Typical” API Cost Reductions Post Launch under Different Development Paradigms
0
20
40
60
80
100
120
0
20
40
60
80
100
120
0 1 2 3 4 5 6 7 8 9 10 11 12
CO
G's
Norm
alized Volum
e (% of M
ax)
Year After Launch
Volume
Traditional
Future
Potential Savings

Thermodynamic Relationship for Solubility
• Activity coefficients are strong, nonlinear function of solvent composition, weak functions of temperature
⎟⎟⎠
⎞⎜⎜⎝
⎛−
∆−≅
∆−=
m
fusfusSATi
SATi T
TRTH
RTG
x 1lnγ
Solid in equilibriumSingle solid phase, pure solidActivity coefficient: Solvent Effect in
Solid solubility
COSMO-RS : Thermodynamic model that allow the calculation of thermodynamic properties in solution (like activity coefficient)
In order to solve the equation we also need ∆Gf•Estimation by a QSPR method (default) •Approximation with ∆Hf and melting point (DSC data) •This term contains most of the information for the polymorph
![[N GENESIS ELN] ELN - Waters Corporation · Interfaces with LIMS and instrument/ chromatography data systems such ... repository into NuGenesis ELN documents, or integrate content](https://img.pdfslide.net/doc/110x75/5adcd1ab7f8b9aa5088bfe67/n-genesis-eln-eln-waters-with-lims-and-instrument-chromatography-data-systems.jpg)