Embed Size (px)
Citation preview
Treball de Màster
Cadena de Suministro, Transporte y Movilidad
Process improvement for inventory management
in a Fast Moving Consumer Goods company
MEMÒRIA
Author: Shuting Lin Director: Immaculada Ribas Villa Date: January, 2019
Escola Tècnica Superior d’Enginyeria Industrial de Barcelona
Pà g. 2 Memò ria
Process improvement for inventory management in a FMCG
company Pà g. 3
INDEX
1. GLOSSARY ............................................................................................ 7
2. INTRODUCTION ..................................................................................... 8
2.1. Objectives of the project ............................................................................ 8
2.2. Scope of the project ................................................................................... 9
3. INTRODUCTION OF COMPANY A ..................................................... 10
3.1. Organizational structure of company A ................................................... 11
3.2. The layout of the warehouse ................................................................... 12
4. ANALYSIS OF THE INVENTORY MANAGEMENT PROCESS ......... 15
4.1. Process of placing order to suppliers ...................................................... 15
4.2. Receiving process ................................................................................... 16
4.3. Process of update information into the system ........................................ 17
4.4. Process of customers’ orders .................................................................. 19
4.4.1. Online purchase - APP .............................................................................. 19
4.4.2. Purchase at the warehouse ....................................................................... 22
4.5. Problems and analysis of a company's inventory management process 22
4.5.1. Main problems in the inventory management process .............................. 22
4.5.2. Cause analysis .......................................................................................... 23
5. PROCESS IMPROVEMENT FOR THE INVENTORY MANAGEMENT
IN THE COMPANY A .................................................................................. 25
5.1. Improvement of the purchasing process ................................................. 25
5.1.1. Warehouse storekeeper's job responsibilities ............................................ 25
5.1.2. New purchasing process ........................................................................... 26
5.1.3. Indicators for verifying the effectivity of the purchase process ................... 29
5.1.4. Template for purchase order list ................................................................ 30
5.2. Improvement of receiving process ........................................................... 31
5.2.1. New receiving goods process .................................................................... 31
5.2.2. Indicator for verifying the effectivity of the receiving process ..................... 33
5.2.3. Template for the input list .......................................................................... 33
5.3. Improvement of the inventory count process ........................................... 34
5.3.1. New inventory count process .................................................................... 34
Pà g. 4 Memò ria
5.3.2. Indicators for verifying the effectivity of inventory counting process ........... 36
5.3.3. Template for documents used in the inventory count process ................... 36
5.4. Improvement of the picking process ........................................................ 39
5.4.1. Picker's job responsibilities and work processes ....................................... 39
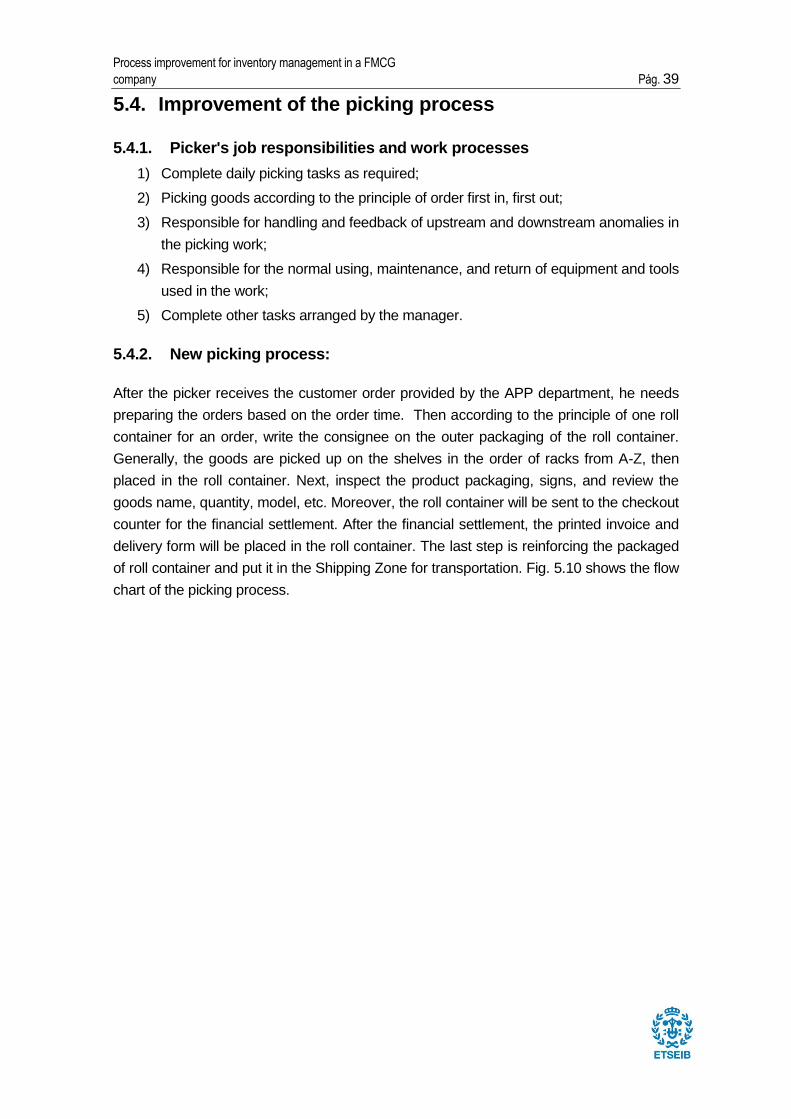
5.4.2. New picking process:................................................................................. 39
5.4.3. Indicators for verifying the effectivity of picking process ............................ 41
5.4.4. Template for delivery form ......................................................................... 41
5.5. Improvement of the placement of goods ................................................. 42
5.5.1. Reclassifies of the goods in company A .................................................... 42
5.5.2. New placement of the goods in the storage zone ...................................... 43
5.6. Improvement of inventory management policy ........................................ 45
5.6.1. ABC analysis ............................................................................................. 45
5.6.2. Inventory cost ............................................................................................ 49
5.6.3. Determine the type of demand .................................................................. 50
5.6.4. Periodic Review System ............................................................................ 51
5.6.5. Harris-Wilson Model .................................................................................. 54
5.6.6. Comparative results of Periodic Review System and Harris and Wilson
Model for 10 goods of class A .................................................................................. 55
5.7. Improvement of the level of informatization ............................................. 56
5.7.1. Foundation of the level of informatization .................................................. 56
5.7.2. The job responsibilities of the information department ............................... 58
6. THE PLANNING AND THE BUDGET OF THE PROJECT ................. 59
6.1. Gantt chart ............................................................................................... 59
6.2. Budget of this project ............................................................................... 60
7. THE ENVIRONMENTAL IMPACT ....................................................... 61
8. CONCLUSION ...................................................................................... 62
8.1. Main conclusions of this thesis ................................................................ 62
8.2. Limitations of this thesis ........................................................................... 63
ACKNOWLEDGMENTS ............................................................................. 64
REFERENCE .............................................................................................. 65
ANNEX ........................................................................................................ 66
Daily Work Style Questionnaire (1) .................................................................... 66
Process improvement for inventory management in a FMCG
company Pà g. 5
Daily Work Style Questionnaire (2) .................................................................... 68
Daily Work Style Questionnaire (3) .................................................................... 70
Daily Work Style Questionnaire (4) .................................................................... 72
Daily Work Style Questionnaire (5) .................................................................... 73
Daily Work Style Questionnaire (6) .................................................................... 75
Daily Work Style Questionnaire (7) .................................................................... 77
Daily Work Style Questionnaire (8) .................................................................... 79
Daily Work Style Questionnaire (9) .................................................................... 81
Daily Work Style Questionnaire (10) .................................................................. 83

Process improvement for inventory management in a FMCG
company Pà g. 7
1. Glossary
App - Application
CL - Ordering costs
CS - Holding costs. CS = i* CA, i is possession rate by u.t
CA - Purchasing costs
D - Annual demand
EOQ - Economic Order Quantity
FMCG - Fast Moving Consumer Goods
ITR - Inventory turnover rate
KPI - Key Performance Indicator
PRS - Periodic Review System
Salesman - Employed by one or more suppliers, mainly responsible for selling goods to
Company A; and personally going to Company A's warehouse in a certain period to accept
orders then transfer orders to the corresponding suppliers.
SS - Safety stock
VC - Coefficient of the variability of demand
Pá g. 8 Memoria
2. Introduction
Fast Moving Consumer Goods(FMCG) usually refers to those goods that are used for a
short period of time, have low value, are easy to consume, have a wide distribution of
consumers, have a high frequency of purchase, and have a long purchase duration.
Company A is a distributor of FMCG and has a large warehouse in Badalona that has more
than 20000 types of inventory such as smoking accessories, stationery, toys, hardware,
light bulbs, toiletries, candles, kitchen utensils, tableware, etc. The customers of company
A are those Bazar (Shop that sells FMCG) located in Barcelona.
In company A, the inventory is mainly managing by 10 ordinary storekeepers, each
storekeeper is responsible for managing inventory in different areas, i.e. to buy and keep
stock to be able to serve all customers. Each storekeeper uses different criteria to manage
the inventory of his products, i.e. which is the stock level, when and how much to buy. In
terms of placing order to suppliers, there isn’t any forecasting method. All storekeepers
place orders based on their own experience, so there are some items with inventory
overstock and others with stock shortage. In terms of checking the inventory, some
storekeepers check once a day, and some storekeepers check once a week, but not
everyone remembers to notify the information staff to update the inventory information in
the company’s system, therefore, physical inventory and inventory data do not match.
Moreover, storekeepers do not record in the system the orders placed to suppliers and the
information staff only can enter inventory into the system according to the delivery note or
the invoice. Moreover, the company does not have other option than believe that the
products and the amount delivered are what the storekeeper ordered. When products arrive,
but the delivery note is lost, the information staff cannot enter the product information into
the system. Hence, the physical inventory and the data in the system does not match.
Therefore, the aim of this master thesis is to analyze and improve the processes related to
the inventory management and control in Company A.
2.1. Objectives of the project
The main objective of this project is to improve inventory management of company A. To
attain this objective, the following specific objectives will be considered:
• An analysis of all processed related to inventory management is analyzed in order to
detect the main problems to address.
• The ABC analysis of plastic goods to be focused on the most important goods.
Process improvement for inventory management in a FMCG
company Pà g. 9
• A demand forecast model for the goods families categorized as A.
• Measures to improve inventory processes.
2.2. Scope of the project
Analyze and improve the processes related to stock management of plastic goods classified
as A. Does not include goods B or C.
Pà g. 10 Memò ria
3. Introduction of company A
Company A is an FMCG distributor in Badalona, founded in 2011. It mainly distributes with
more than 20000 kinds of goods such as hardware, light bulbs, toiletries, candles, kitchen
utensils, tableware, etc. Fast Moving Consumer Goods (hereinafter referred to as FMCG),
usually refers to those goods with short aging, fast turnover, low value, easy consumption,
wide distribution of consumers, high frequency of purchase, long duration of purchase, and
most are the daily necessities of consumers. It involves many industries such as food,
drinks, and daily chemical products that are highly competitive in the market, but company
A's inventory does not include food and drinks. In general, the inherent characteristics of
FMCG can be summarized in the following:
(1) The total demand is large.
FMCG are, mainly, necessary products for people's lives. An FMCG company earns profits
by relying on the market consumption generated by users' repeated use and continuous
purchase. Therefore, all aspects of the FMCG supply chain, especially upstream
companies, tend to expand production, bulk transportation and other measures to reduce
operating costs.
(2) Convenience.
Consumers who purchase such products are subject to high speed and convenience and
are characterized by multi-frequency and small-volume purchases. In order to facilitate
consumer purchases, in general, FMCG retail terminals have a large amount of distribution
and wide distribution. In order to meet the needs of each retail terminal, FMCG companies
tend to distribute a large number of goods in the distribution channels.
(3) Low brand loyalty.
The difference of related products is small so it’s very easy to find an alternative, it means
that customers are easy to convert brands when they are affected by advertising
promotions and prices. Therefore, for FMCG manufacturers and agents, the shortage of
goods often leads to the loss of customers, but for the distribution companies that operate
multi-brand products at the same time, the negative impact of out-of-stocks is not significant.
(4) High demand uncertainty.
There are many factors affecting the demand for FMCG. The convenience of demand, high
price sensitivity, fierce competition among the same industry and the increase in related
products all increase the uncertainty of goods demand. Manufacturers of FMCG, which are
lagging behind in inventory management simply press the bulk of the goods downstream
to avoid the impact of uncertainty.
Process improvement for inventory management in a FMCG
company Pá g. 11
(5) Too much SKUs.
Due to the low technical content of FMCG, there is little difference between similar products.
In order to enhance product competitiveness, enterprises design and locate different
products according to different consumer groups to meet market demand. Enterprises
often classify the same large categories of products into several single product varieties
(SKUs) according to the criteria of taste, size, weight, etc. A large number of SKUs
increases the difficulty of inventory management.
Company A is located in the Badalona, with a building area of approximately 50000 square
meters, in there are offices, warehouse areas, canteens for employees and toilets. At
present, there are 25 employees, including 3 management personnel and 22 ordinary
employees.
3.1. Organizational structure of company A
Company A is a familial enterprise, so its high-level are intimate relatives. There are only 3
people in the high-level, the Boss, the Human Resource(HR) Manager, and the Warehouse
Manager.
The Boss. Nowadays, he is not involved in any activity of the company because he is
focused on other companies.
The Human Resource(HR) Manager. Responsible for the company's personnel changes,
daily inspections of employees, and payroll.
The Warehouse Manager. Determine the company's business scope (purchase new
goods or stop selling some goods), place order for season goods, and receive feedback
from all departments.
• For the Warehouse Manager Department, the 10 storekeepers who manage the
inventory, they can know sales based on inventory situation (inventory overstock or
stock shortage), so they need notify the manager that which goods are not selling well,
then the manager decided to stop selling it or no. For storekeeper 3rd and 4th, they
need notify the manager the stock shortage information of the seasonal goods, so that
the manager can place order to the supplier.
• For other departments, only need to communicate with the manager if there is a
problem with the work they are responsible for.
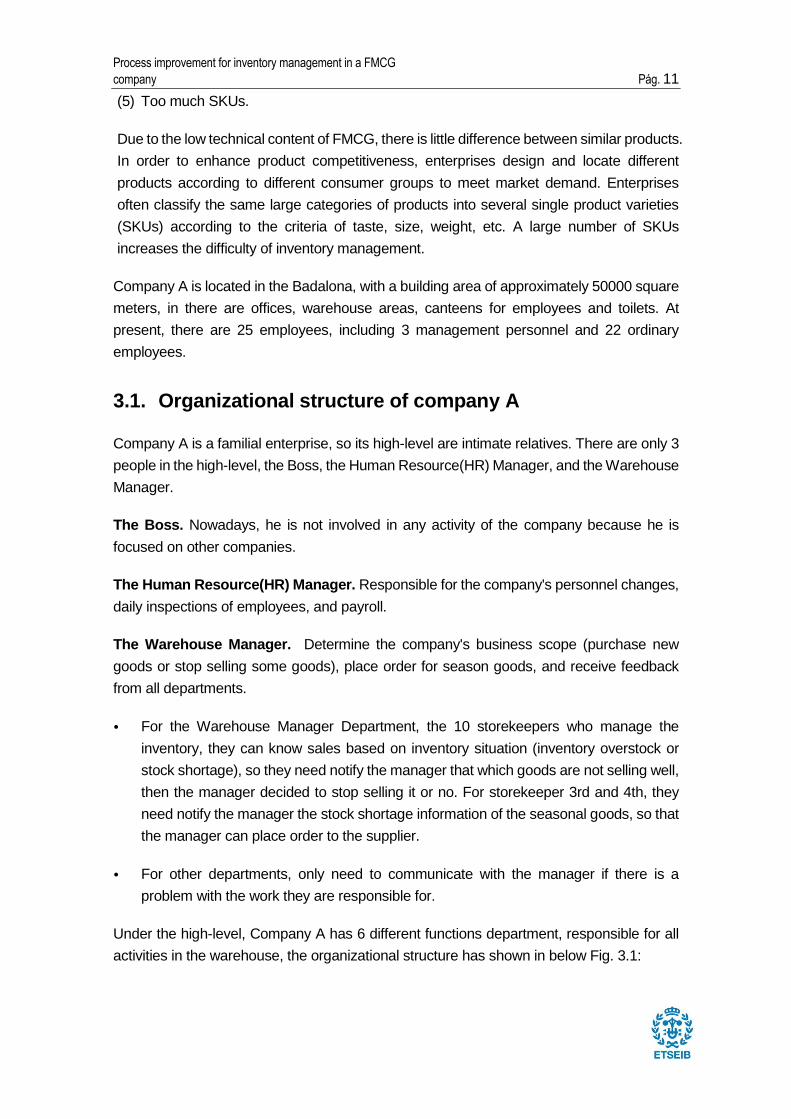
Under the high-level, Company A has 6 different functions department, responsible for all
activities in the warehouse, the organizational structure has shown in below Fig. 3.1:
Pà g. 12 Memò ria
Fig. 3.1 Organizational structure of company A
Warehouse Management Department. This department has 10 storekeepers, they
responsible for managing the goods in their respective lanes, checking the quantity of
inventory and place order to the salesman.
Picking Department. This department has 2 employees(Pickers), they responsible for
picking up the target goods on the warehouse racks according to the customer orders in
the APP, and placing them in the waiting to delivery area.
Cash Department. This department has 4 cashiers, they responsible for the settlement of
customer orders and collect money from the customer.
Logistics Department. In this department has 3 drivers fixed who responsible for making
the route decision and transporting goods to the customer's location. When there is
something need to be delivered, except the driver, also need a follower to help the driver
carry the goods.
APP Department. This department has 3 employees, they responsible for updating the
information of all goods in the app, such as picture, size, color, unit price, goods status,
discount activities, etc.
Goods Information Management Department. There just one person in this department,
who responsible for entering goods information to the company’s system based on the
delivery note or the invoice of the goods.
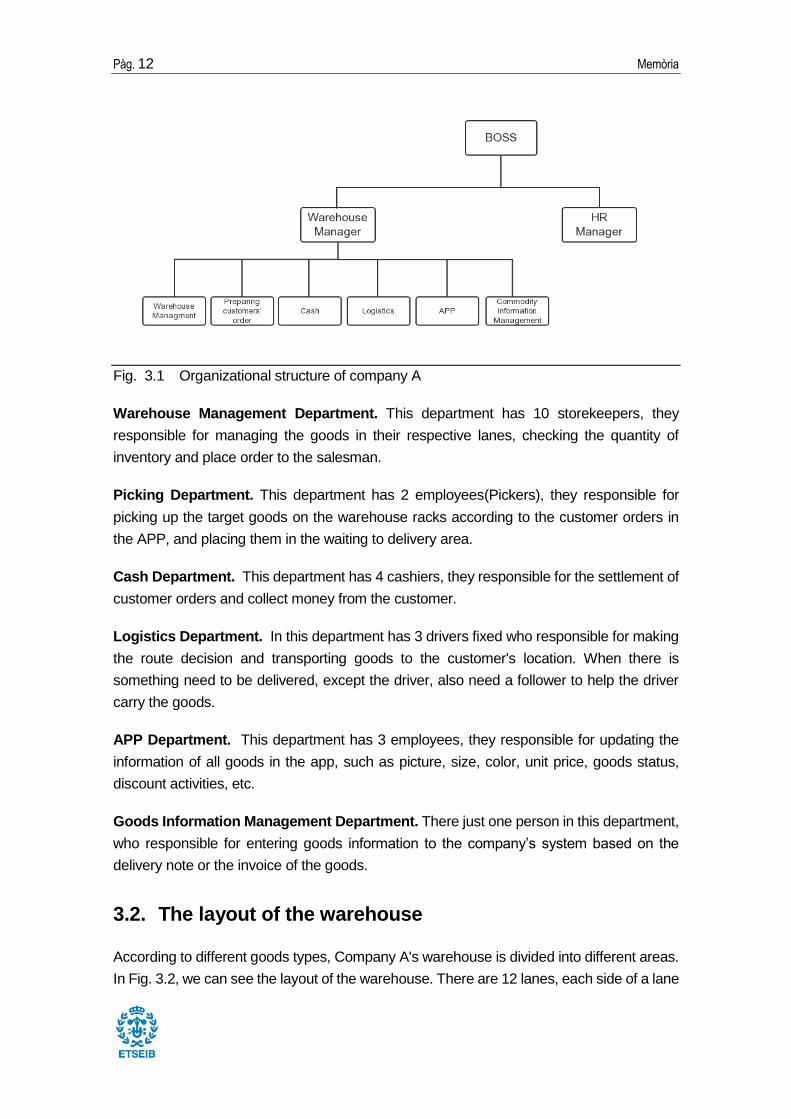
3.2. The layout of the warehouse
According to different goods types, Company A's warehouse is divided into different areas.
In Fig. 3.2, we can see the layout of the warehouse. There are 12 lanes, each side of a lane
Process improvement for inventory management in a FMCG
company Pá g. 13
has a long storage rack, named with 26 Latin scripts in uppercase, like A, B, C… These
racks have 4 floors, named 1, 2, 3, 4 in order from bottom to top; each floor of the rack is
divided into different areas for placing different goods, named 001, 002, 003…from the left
to right. With this naming method, goods can be found very easily, for instance, A1-001 is
the position that storage the Needlework box; B1-001 is the position that storage the Small
wooden boxes for 18*18*9.5 cm. With this naming scheme, the location of goods can be
determined. There are also some other areas that are irregular, like Front zone, Back zone,
Everyday Chemical zone.
All these racks and zones are managed by 10 storekeepers. Each storekeeper is
responsible for the daily management of his own racks and places order for the goods in
their racks to the supplier.
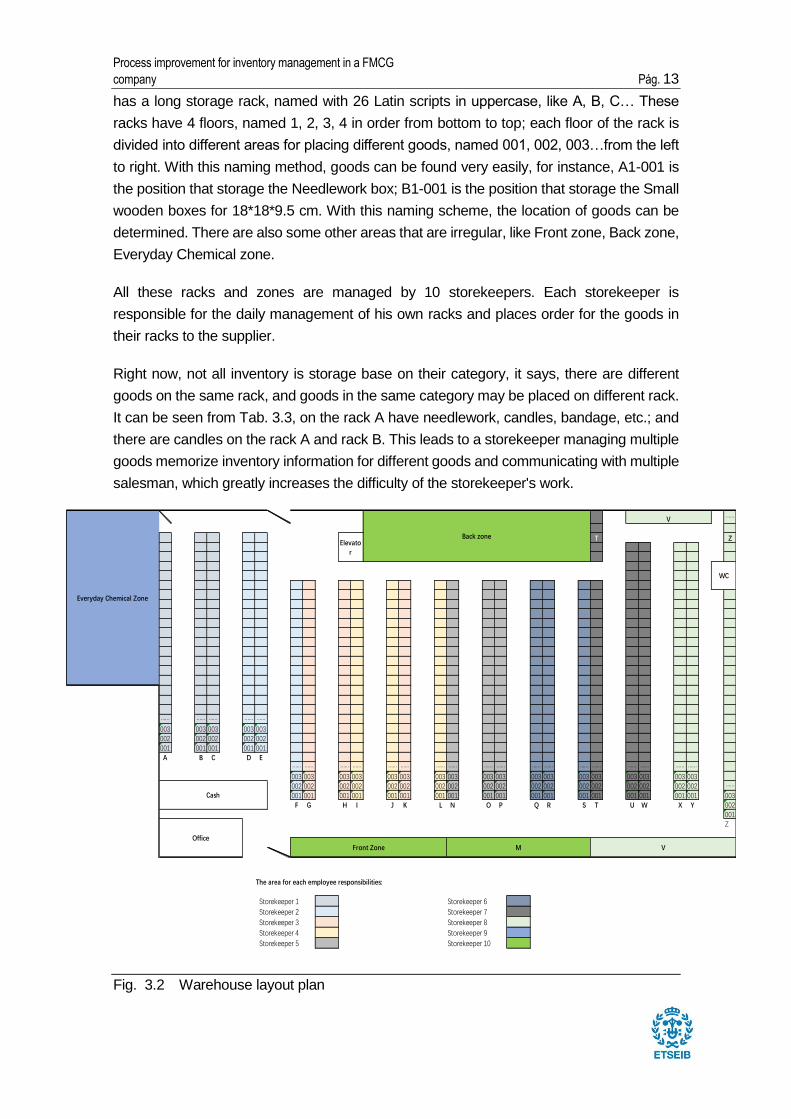
Right now, not all inventory is storage base on their category, it says, there are different
goods on the same rack, and goods in the same category may be placed on different rack.
It can be seen from Tab. 3.3, on the rack A have needlework, candles, bandage, etc.; and
there are candles on the rack A and rack B. This leads to a storekeeper managing multiple
goods memorize inventory information for different goods and communicating with multiple
salesman, which greatly increases the difficulty of the storekeeper's work.
Fig. 3.2 Warehouse layout plan
……
T Z
…… …… …… …… ……003 003 003 003 003002 002 002 002 002001 001 001 001 001A B C D E
…… …… …… …… …… …… …… …… …… …… …… …… …… …… …… …… …… ……003 003 003 003 003 003 003 003 003 003 003 003 003 003 003 003 003 003002 002 002 002 002 002 002 002 002 002 002 002 002 002 002 002 002 002 ……001 001 001 001 001 001 001 001 001 001 001 001 001 001 001 001 001 001 003F G H I J K L N O P Q R S T U W X Y 002
001Z
The area for each employee responsibilities:
Storekeeper 1 Storekeeper 6
Storekeeper 2 Storekeeper 7
Storekeeper 3 Storekeeper 8
Storekeeper 4 Storekeeper 9
Storekeeper 5 Storekeeper 10
Everyday Chemical Zone
OfficeM VFront Zone
Back zone
WC
V
Elevator
Cash
Pà g. 14 Memò ria
Rack name
Goods name
A Needlework, candles, bandages, etc.
B Small wooden boxes, candles, shoe polish, plastic bags, etc.
C Vases, fish tanks, carpets, gift bags, toothpaste, toothbrushes, etc.
D Aromatherapy, gift bags, carpets, candles, tarpaulins, hairdryer, knee pads, wrister etc.
E Bedding, tablecloths, mats, etc.
F Socks, dishwashing cotton, dishwashing gloves, shower curtains, etc.
G, H Toy
I, J, L Seasonal Goods
K Paint, decoration supplies.
N Kitchen supplies (plastic), cling film, tin foil, Kitchen pot
O Kitchen cutlery (plates, knives, forks, chopping boards, colander), kitchen scales, etc.
P Various cups (ceramic cups, teapots, kettles, thermos cup)
Q Glass cups, plate for paella, etc.
R, S Hardware
T Kitchen appliances(Juicing machine, toaster, etc.)
U Household appliances(Hairdryer, coffee machine, etc..), pet supplies, matches, alcohol, lighter
V Gift paper, cardboard, etc.
W Photo frames, photo albums, blackboards, etc.
X Notebook, book, wallpaper, big gift box, etc.
Y,Z Stationery: pens, pencils, ballpoint pens, erasers, folders, etc.
M, Front &Back
Plastic products: trash cans, plastic cups, storage boxes, watering cans, bowls, basin, etc.
Tab. 3.3 Goods stored on different racks
Next, the assignment of racks to each storekeeper is provided.
1) Storekeeper 1 is responsible for racks A, B, C;
2) Storekeeper 2 is responsible for racks D, E, F;
3) Storekeeper 3 is responsible for racks G, H, K;
4) Storekeeper 4 is responsible for racks I, J, L;
5) Storekeeper 5 is responsible for racks N, O, P;
6) Storekeeper 6 is responsible for racks Q, R, S;
7) Storekeeper 7 is responsible for racks T, U, W;
8) Storekeeper 8 is responsible for racks X, Y, Z, V;
9) Storekeeper 9 is responsible for Everyday Chemical zone;
10) Storekeeper 10 is responsible for rack M, Front Zone, and Back Zone.
Process improvement for inventory management in a FMCG
company Pá g. 15
4. Analysis of the inventory management Process
Because there are many competitors in the Badalona, once company A is out of stock,
customers generally go to other FMCG companies, so Company A usually increases the
inventory reserve to do not lose customers order. However, increasing the inventory has
led to an increase in the inventory cost of Company A, and more liquidity is being occupied.
In order to get more information about the inventory management process of company A, I
did a personal interview survey with the 10 storekeepers who are responsible for the daily
management of inventory. The purpose of this survey is grasp the current operation
situation of the warehouse, to know how each storekeeper do the job, to analyze whether
there is a connection between the stock shortage and inventory overstock and the operation
of the warehouse staff, thereby finding a way to improve the problem of stock shortage and
inventory overstock.
Next, this chapter is devoted to analyze all the processes related to inventory management
and identify the main problems based on the result of the survey.
Inventory management is a complex dynamic process, in company A except for the HR, all
departments are involved.
4.1. Process of placing order to suppliers
According to the survey, we know that the inventory in Company A is classified by
characteristics, they classified into seasonal and non-seasonal goods.
Seasonal goods are items that are only sold at a specific time. Such as goods for the beach
in the summer and Christmas items in the winter. These goods normally need to take large-
volume orders and only the warehouse manager can place the orders. The manager always
takes the decision based on his own experience, he takes the sales volume of the previous
sales season and adding or subtracting a quantity on it.
Non-seasonal goods are divided into three categories, high-selling-volume goods, general
goods, and long sales cycles goods. For some high-selling-volume goods, such as
household paper, plastic goods, the corresponding suppliers will send salesman to the
warehouse to receive orders every week; for general goods, such as kitchen utensils,
salesman may come once every 2 weeks; for goods with long sales cycles, such as
hardware and small appliances, salesman may come once every month.
Orders of non-seasonal goods are the responsibility of the 10 storekeepers who manage
the racks, it has been mentioned in 3.2. To give an example: when Storekeeper 1 feels that
there are some goods does not have enough inventory in the lanes A, B, C, he records the
stock shortage information in his mind. Then, when the salesman comes, Storekeeper 1
Pà g. 16 Memò ria
decides the quantity of order based on his own experience. Others 9 storekeepers do the
same order process like Storekeeper 1, the only different thing is they take a different
approach to record stock shortage information, someone records it on paper, someone
records it on phone.
Based on the above situation, we realize that company A has the following problems in the
process of making orders to suppliers:
1. All orders are determined by ordinary storekeepers (non-seasonal products), or the
manager (seasonal products). Everyone determines the quantity according to their own
experience and feelings, so the subjectivity is too strong. When there are personnel
changes, it is easy to produce quantitative deviations, resulting in inventory overstock or
stock shortage.
2. Does not exist a uniform document for orders, neither a record for orders. All orders are
completed by oral communication between Company A’s employees and salesman.
Sometimes goods delivered with a wrong quantity or miss some items.
4.2. Receiving process
When the supplier delivers the goods to the warehouse, the employee R of the company A
will be responsible for receiving the goods. R is not a fixed employee, but whoever is the
one who is available at that moment. As mentioned in 4.1, because all the orders that
company A places to the supplier do not record in anywhere, the employee can only use
the delivery note or the invoice of the goods to check whether the quantity, color, and others
information of the arrived goods are consistent with the information written on the invoice.
When the information on the delivery note or the invoice is consistent with the actual goods,
the employee R confirms the receipt; when the information is not consistent with the goods,
the storekeeper in charge of this order needs to contact the salesman to solve the problem.
When the goods are received, they are placed in the receiving zone, waiting for the
storekeeper in charge of this order to put the goods into the racks.
Problems in this process:
Because all the orders that company A places to the supplier do not record in anywhere,
the correctness of the supplier's delivery information cannot be confirmed. This leads to the
fact that when the supplier delivers more goods than they should have, most times the
company A can only accept this quantity, which causes the inventory overstock. Or instead,
the supplier delivers fewer goods than they should have, which causes the inventory with
stock shortage.
Process improvement for inventory management in a FMCG
company Pá g. 17
4.3. Process of update information into the system
The process of goods information management is mainly to input goods information to the
company system, set and update goods status, change the data, and query the information.
This process mainly consists of the following parts:
(1) Input goods information: After the purchase, the goods information provided by the
supplier, like, goods code, specification, cargo unit, and unit price, etc. is taken as the basic
information and is input by the information staff to the corresponding goods management
module of the system.
(2) Set the status of the goods. The goods status is one of the basic information about the
goods, mainly refers to the three states of the goods: available, obsolete, and out of stock.
When the status of the item changes, it is set by the information staff.
(3) Change goods information. The information of the goods is not static, when employees
see there is out of stock or received some goods, they should inform the person that
responsible for changing the system information. When the unit price of the goods changes,
the unit price in the system also needs to be modified. In general, only the coded of the
goods is fixed.
(4) Consult goods information. According to the authorization of the administrator, the user
of the system can use the username and password log in to the system to check information
or to do other operations.
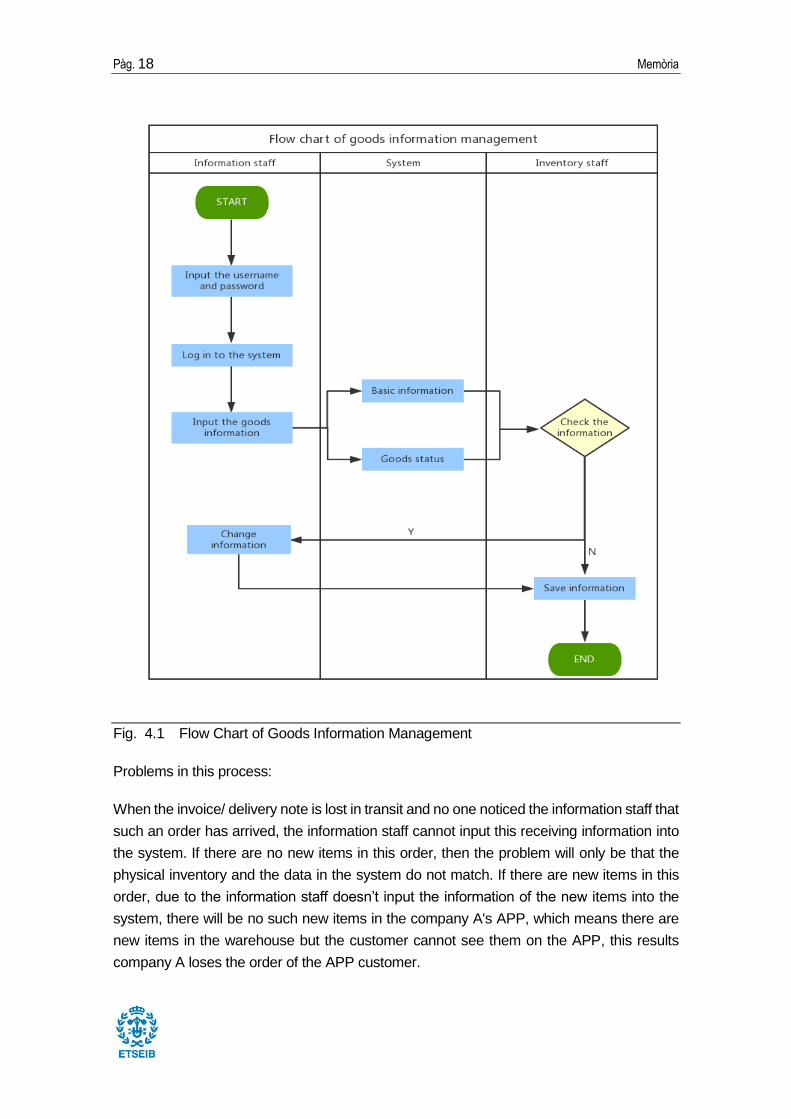
This process normally finished in 1-2 days, the flow chart of this process has in Fig. 4.1.
Pà g. 18 Memò ria
Fig. 4.1 Flow Chart of Goods Information Management
Problems in this process:
When the invoice/ delivery note is lost in transit and no one noticed the information staff that
such an order has arrived, the information staff cannot input this receiving information into
the system. If there are no new items in this order, then the problem will only be that the
physical inventory and the data in the system do not match. If there are new items in this
order, due to the information staff doesn’t input the information of the new items into the
system, there will be no such new items in the company A's APP, which means there are
new items in the warehouse but the customer cannot see them on the APP, this results
company A loses the order of the APP customer.
Process improvement for inventory management in a FMCG
company Pá g. 19
4.4. Process of customers’ orders
Normally, there are two ways that customers place an order to Company A, one is through
the online APP, the another is going warehouse entity to purchase. The two ways will be
explained below in detail.
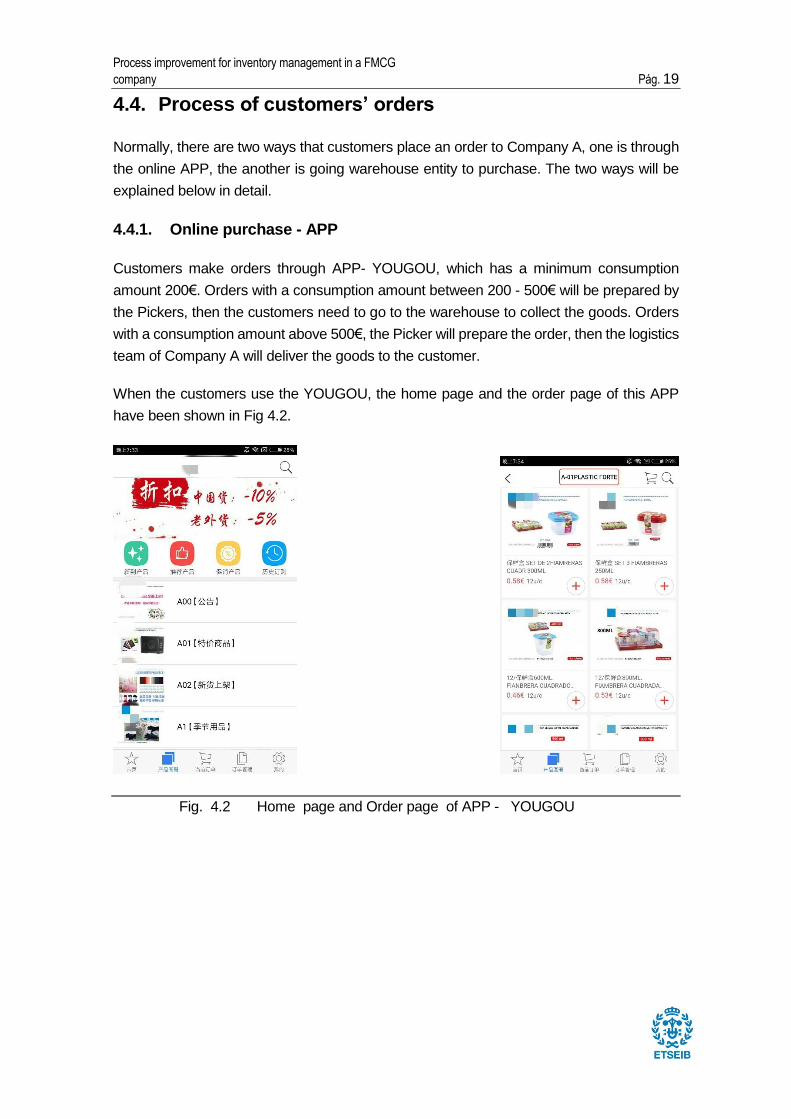
4.4.1. Online purchase - APP
Customers make orders through APP- YOUGOU, which has a minimum consumption
amount 200€. Orders with a consumption amount between 200 - 500€ will be prepared by
the Pickers, then the customers need to go to the warehouse to collect the goods. Orders
with a consumption amount above 500€, the Picker will prepare the order, then the logistics
team of Company A will deliver the goods to the customer.
When the customers use the YOUGOU, the home page and the order page of this APP
have been shown in Fig 4.2.
Fig. 4.2 Home page and Order page of APP - YOUGOU
Pà g. 20 Memò ria
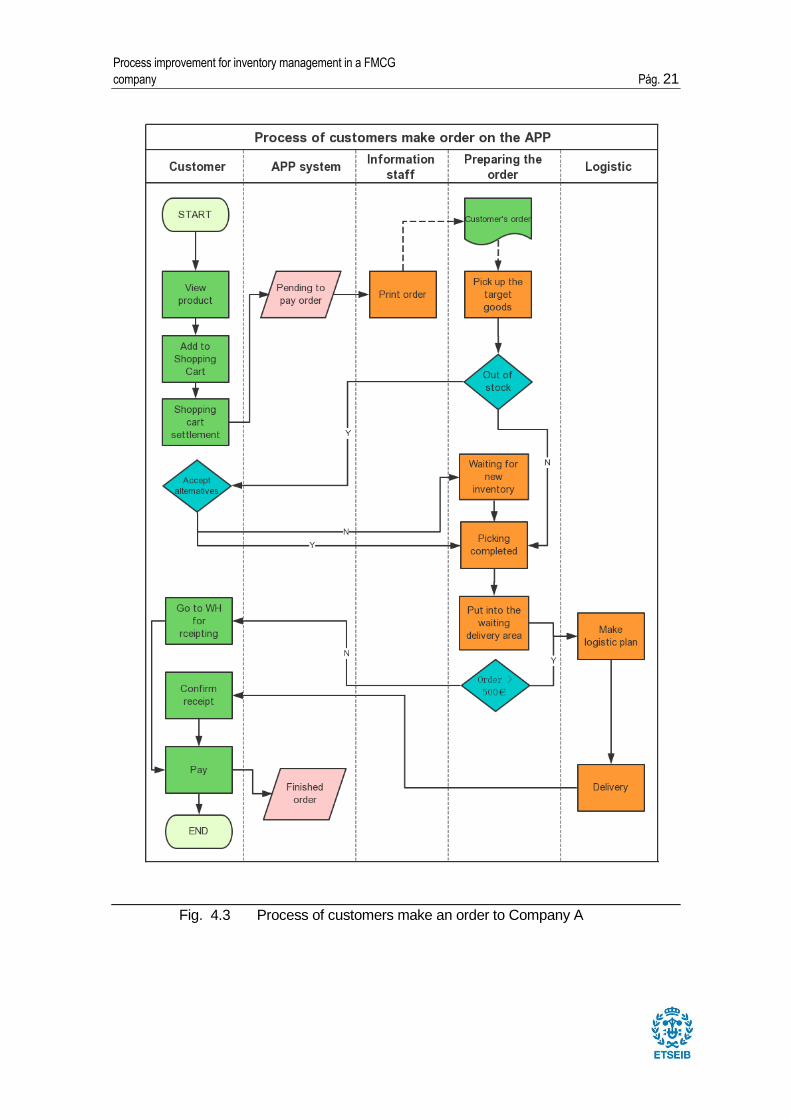
Through the background of the APP, all details of order can be seen, like customers’ name,
address, telephone, goods name, and the quantity. The Information Worker will print the
daily orders and hand it to the Picker. Then the Picker picks up the goods required on the
order list from the rack. After all goods have been picked up, the Picker need to send the
products to the goods issue area. At the end, the logistics department will analyze the
customers’ addresses, and plan the route to deliver the goods to the customers' location.
This process typically takes 1-2 days.
If the out-of-stock situation is encountered during this process, the Picker needs to contact
the customer to ask if he/she accepts the same kind of goods from other brands. If the
customer accepts the alternative, the Picker continues the distribution process; if the
customer does not accept the alternative, he/she needs to decide if he/she wants to wait
until there is the product in stock or close the order.
A company has about 40 stable customers, and about 95% of them will use the APP to
make orders.
The flow chart of customer makes an order on the APP has been shown in Fig. 4.3.
Process improvement for inventory management in a FMCG
company Pá g. 21
Fig. 4.3 Process of customers make an order to Company A
Pà g. 22 Memò ria
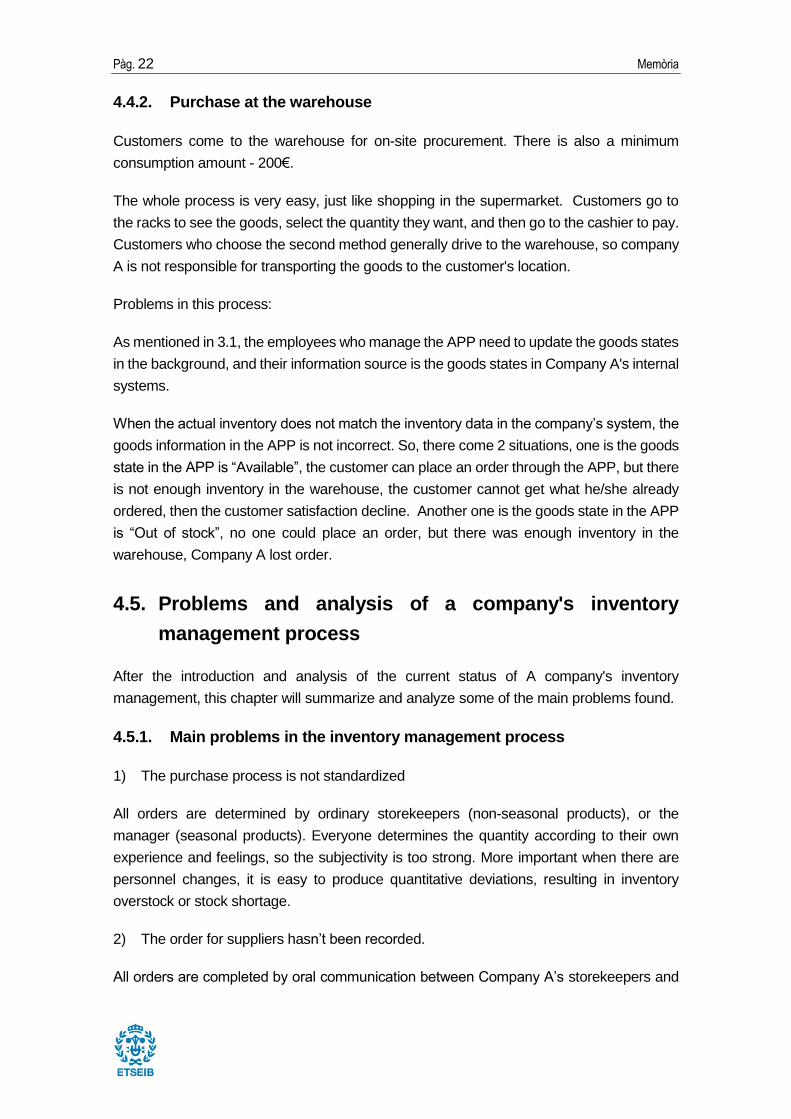
4.4.2. Purchase at the warehouse
Customers come to the warehouse for on-site procurement. There is also a minimum
consumption amount - 200€.
The whole process is very easy, just like shopping in the supermarket. Customers go to
the racks to see the goods, select the quantity they want, and then go to the cashier to pay.
Customers who choose the second method generally drive to the warehouse, so company
A is not responsible for transporting the goods to the customer's location.
Problems in this process:
As mentioned in 3.1, the employees who manage the APP need to update the goods states
in the background, and their information source is the goods states in Company A's internal
systems.
When the actual inventory does not match the inventory data in the company’s system, the
goods information in the APP is not incorrect. So, there come 2 situations, one is the goods
state in the APP is “Available”, the customer can place an order through the APP, but there
is not enough inventory in the warehouse, the customer cannot get what he/she already
ordered, then the customer satisfaction decline. Another one is the goods state in the APP
is “Out of stock”, no one could place an order, but there was enough inventory in the
warehouse, Company A lost order.
4.5. Problems and analysis of a company's inventory
management process
After the introduction and analysis of the current status of A company's inventory
management, this chapter will summarize and analyze some of the main problems found.
4.5.1. Main problems in the inventory management process
1) The purchase process is not standardized
All orders are determined by ordinary storekeepers (non-seasonal products), or the
manager (seasonal products). Everyone determines the quantity according to their own
experience and feelings, so the subjectivity is too strong. More important when there are
personnel changes, it is easy to produce quantitative deviations, resulting in inventory
overstock or stock shortage.
2) The order for suppliers hasn’t been recorded.
All orders are completed by oral communication between Company A’s storekeepers and
Process improvement for inventory management in a FMCG
company Pá g. 23
salesman. Sometimes goods delivered with the wrong quantity or miss some items.
3) Unable to verify the accuracy of the arrival information
Because all the orders that company A places to the supplier do not record in anywhere,
the correctness of the supplier's delivery information cannot be confirmed. This leads to the
fact that when the supplier delivers more goods than they should have, most times the
company A can only accept this quantity, which causes the inventory overstock. Or instead,
the supplier delivers fewer goods than they should have, which causes the inventory with
stock shortage.
4) The physical inventory and the data in the system does not match
As what is wrote in 4.2, when there is an employee does not remember to notify the
information staff of the correct inventory data, or the invoice/ delivery note is lost in transit,
the physical inventory and the data in the system do not match. This leads to slow feedback
of inventory data, poor timeliness, and accuracy, and therefore cannot meet the demand
for customer orders.
5) Products are not allocated logically
Because Company A also accepts customers purchase goods in the warehouse, the
display of goods in the warehouse is very important for sales. Due to the management
personnel have less knowledge of the professional knowledge of cargo palletizing, and the
arbitrariness of the work attitude is strong, the palletizing of goods is often in a disorderly
state, lacking obvious classification. Which make the goods in the warehouse cannot be
updated in time, and the maintenance of goods require a lot of manpower and material
resources, resulting in low work efficiency, increased cost investment, and effect economic
benefits. At the same time, the customer needs to go through every rack to find what they
need. But in the reality, not everyone has this patient, the customer normally asks the
employee where is the goods they need, which increase the employees’ work; or just simply
don’t buy it.
4.5.2. Cause analysis
1) Insufficient understanding of inventory control
Because the benefits of Company A are relatively good, the boss and the managers did not
consider the issue of inventory turnover. Unless there are inventory didn’t been sold for
weeks, the manager will focus on the inventory issue, and the conclusions are often very
simple, either have bought too much, or the sales activity is not doing well.
2) Uncompleted information in the ERP system
Pà g. 24 Memò ria
Although Company A has its own ERP system, it has not been fully utilized. For example,
the data in each department or each process of inventory management is relatively
independent, and is not entered into the corresponding section of the ERP system,
moreover, there is no paper record, so the information history cannot be check. In addition,
in the ERP system, the inventory is simply categorized according to the supplier's name,
instead of further classified by product type. This classification has led to the inability of
Company A to manage in a targeted manner. It says there is no simple way to check total
sales for goods except add the number from each invoice. Therefore, the actual sales of
goods cannot be effectively analyzed, thus affecting the accuracy of procurement. It
happened that some unimportant goods have accumulated inventories, while important
goods have been out of stock.
3) Lack of coordination between department
The communication between the various departments of Company A is not very good. The
employees only care about their job, any job relative other departments will be considered
as an extra job. If there is any problem, they will shirk their responsibility.
4) No one is responsible for the result of the workers
Because there isn’t a censorship system in company A, the initiative of employees is very
low. Some employees only spent a little time on their work, which reduces the efficiency of
the entire warehouse; some employees don’t serious about work, which leads to errors in
the work, such as input wrong inventory quantity is into the system. All these are not
conducive to the timely adjustment of the inventory goods and increased the risk of
inventory overstock, stock shortage, and losing customer’s order.
Process improvement for inventory management in a FMCG
company Pá g. 25
5. Process improvement for the inventory
management in the company A
The goal of A company's inventory management is to reduce the inventory cost and reduce
the capital occupation as much as possible, so as to ensure the economic benefits of the
company. In view of the inventory management problem analyzed, the inventory
management policy should be improved. Firstly, by standardizing all processes of the
inventory management system to reduce the inefficiencies. Secondly, the ERP information
management system currently being used by Company A is sufficient to meet the needs of
Company A in the process of procurement, storage and sales, but the main problem is that
the system is not fully utilized and many data are not saved. Therefore, it is necessary to
strength employees' understanding of the system and increasing the utilization rate of ERP
software to improve the informationization level of inventory management. Finally, the
uneven ability of employees directly restricts the overall work efficiency, so it is necessary
to train employees to do their job better. Strengthen communication and collaboration
between departments.
5.1. Improvement of the purchasing process
As the analysis before, there are 2 main problems in the purchasing process. One is the
purchase process is not standardized, every storekeeper uses his own way to purchase
and determines the quantity according to his own experience and feelings. So it causes that
some goods are in stock before the salesman come, others don’t.
Another one is there isn't a standardized purchase document, so most of the order
information is not registered. Again, this process depends on the way the employee work.
Right now, some storekeepers write the order information they need on the paper, some
others records on their phone or they just remember in their mind, but no matter which way
they chose to record the order information before the salesman come, they will not have
registered this information. It means, those who record them with paper will throw away the
paper; those who record with their phones will delete the records; those who remember
them in their will naturally forget them after a while.
For solving these problems, first, the job responsibilities of storekeepers are redesign and
then, the purchasing process is improved and standardized.
5.1.1. Warehouse storekeeper's job responsibilities
1) Responsible for managing and storing the goods they are assigned to.
2) Responsible for the purchasing and receiving process of their goods.
3) Responsible for regular (for instance, every Sunday) inventory count.
Pà g. 26 Memò ria
4) Responsible for the management of returns and/or bad goods (only for their goods)
and return them to suppliers.
5) Responsible for the recording and delivery of documents such as goods input lists,
inventory count lists, etc.
6) Responsible for the normal using, maintenance, and return of equipment and tools
used in the work;
7) Complete other tasks arranged by the manager.
5.1.2. New purchasing process
Because the purchase of non-seasonal goods is the responsibility of the 10 storekeepers
and the purchase of seasonal goods is the responsibility of the manager, the process of
purchasing is divided into 2 different ways:
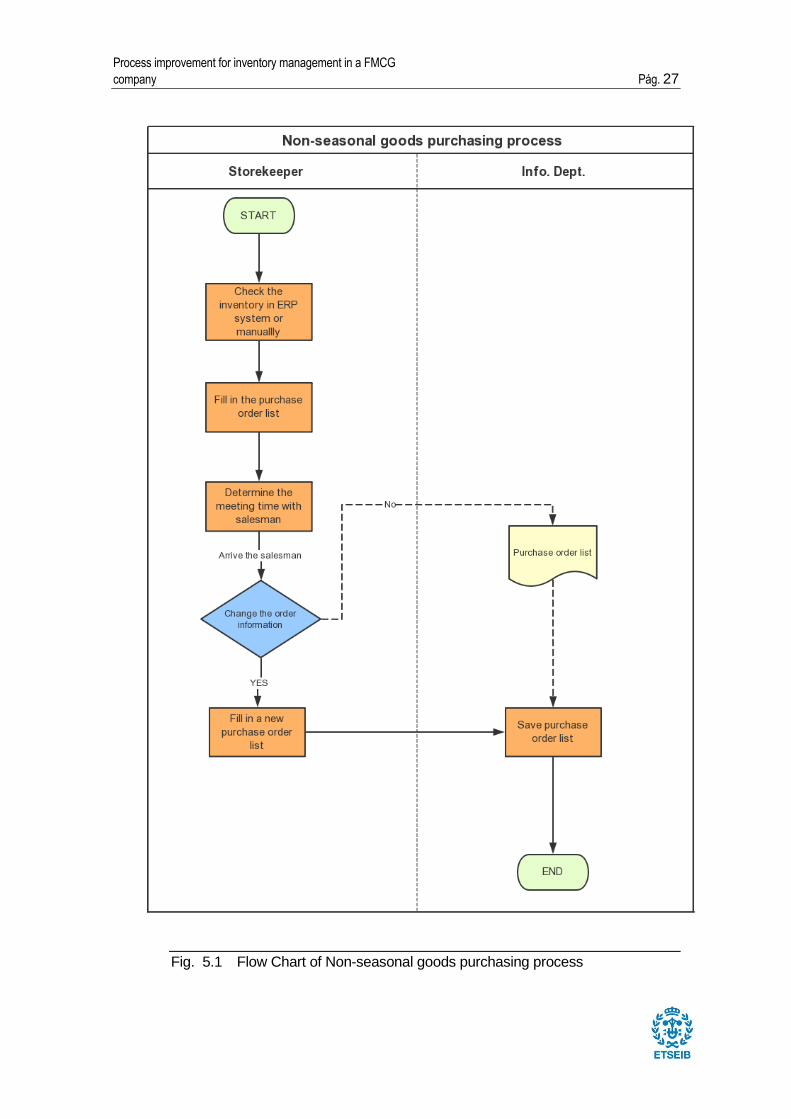
a) Non-seasonal goods purchasing process
Assuming that the information in the ERP system is correct, the storekeeper can check the
inventory into the system. Therefore, 1 day before the salesman come, storekeepers need
to login to the ERP system to check the inventory. Meanwhile, the information into the
system is not correct, the storekeeper should count the product to know the quantity in stock
before deciding the amount to buy. Next, she/he has to fill, in a purchase order document
the products to buy and the quantity. When the salesman comes, the storekeeper prints the
order for the salesman. If the salesman accept the order, the storekeeper sends this
purchase order to the information department for saving. If there is some modification in
this order, such as to reduce the order quantity due to insufficient inventory in the supplier
warehouse, the storekeeper needs to fill in a new purchase order with the correct
information, and send this new order to the information department for saving. Fig 5.1.
shows the flow chart of the process.
Process improvement for inventory management in a FMCG
company Pá g. 27
Fig. 5.1 Flow Chart of Non-seasonal goods purchasing process
Pà g. 28 Memò ria
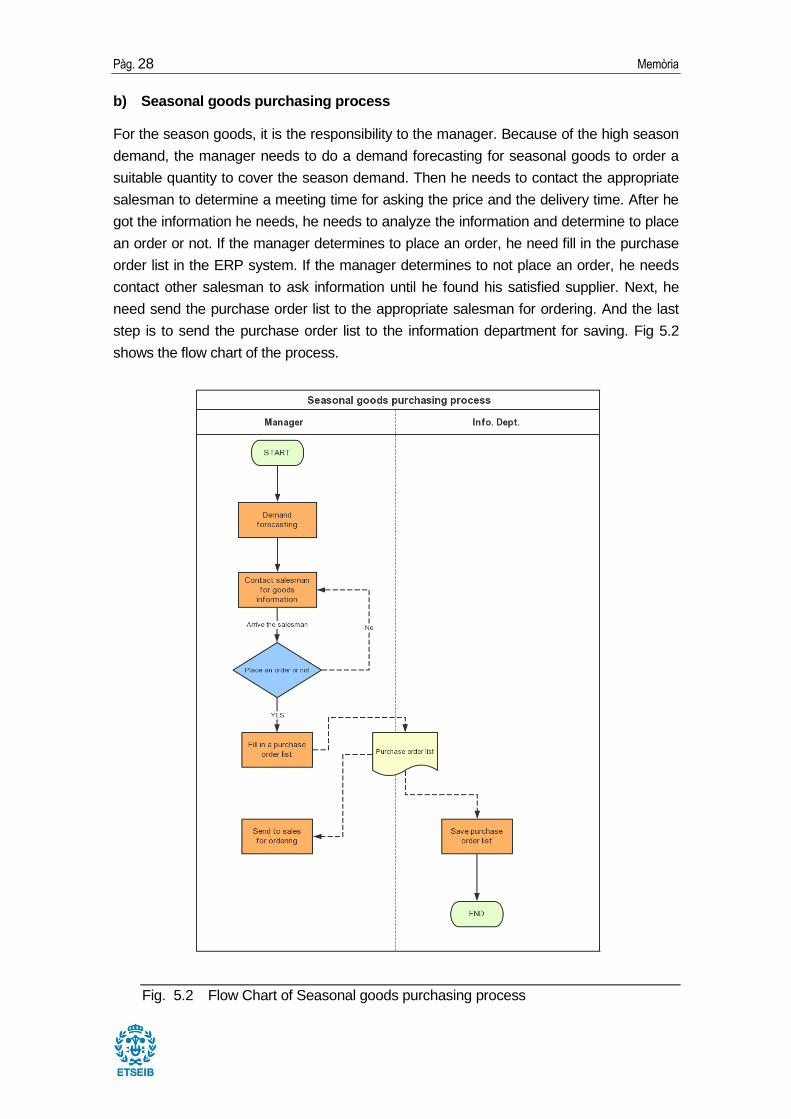
b) Seasonal goods purchasing process
For the season goods, it is the responsibility to the manager. Because of the high season
demand, the manager needs to do a demand forecasting for seasonal goods to order a
suitable quantity to cover the season demand. Then he needs to contact the appropriate
salesman to determine a meeting time for asking the price and the delivery time. After he
got the information he needs, he needs to analyze the information and determine to place
an order or not. If the manager determines to place an order, he need fill in the purchase
order list in the ERP system. If the manager determines to not place an order, he needs
contact other salesman to ask information until he found his satisfied supplier. Next, he
need send the purchase order list to the appropriate salesman for ordering. And the last
step is to send the purchase order list to the information department for saving. Fig 5.2
shows the flow chart of the process.
Fig. 5.2 Flow Chart of Seasonal goods purchasing process
Process improvement for inventory management in a FMCG
company Pá g. 29
5.1.3. Indicators for verifying the effectivity of the purchase process
In order to monetarize the process some indicators are proposed:
1) Rate of purchase order registered
The first Key performance indicator (KPI) [1] is designed to check if the employees register
the purchase order. Remember that one of the detected problems is the impossibility to
check if the quantity bought and the quantity received from the supplier is the same.
Rate of Purchase Order Registered = Number of purchase orders registered / Number of
orders
Target value: 100%
This indicator is calculated every month. The target value is 100%, which means the
storekeeper must send the list to the information department every time and the information
department must storage it well. Once this value is less than 100%, the cause must be
found.
2) Punctual delivery rate
The second KPI is designed to check if the storekeeper finds a good supplier, by analyzing
the delivery punctuality of the supplier. If the Punctual delivery rate is high, means the
storekeeper has found a good supplier, vice versa.
Punctual Delivery Rate = Number of delivery punctuality / Number of orders
Target value: 95%
This indicator is calculated every month. The higher the ratio, the better delivery punctuality
the supplier has; vice versa.
3) Delivery late rate
The third KPI is similar to the second one, but it’s to measure the lateness of the supplier.
Suppose Company A uses the advice given in this thesis, then each good has its own order
cycle, the more the goods delivery delay, the worse the supplier is, the storekeeper
responsible for managing these goods should consider informing this problem to the
appropriate supplier to increase their on-time delivery rate. If the situation has not improved,
the storekeeper should consider changing other suppliers.
Formula: Delivery Late Rate = Delay days / Order cycle
Pà g. 30 Memò ria
Target value: 28.5%
For example, if an item has an order cycle for 7 days, the delay is 3 days, then the delivery
late rate is 42.9%.
This indicator is calculated every month. The higher the ratio, the worse delivery punctuality
the supplier has; vice versa.
The warehouse manager responsible for calculating these 3 indicators and for improving
the purchasing process.
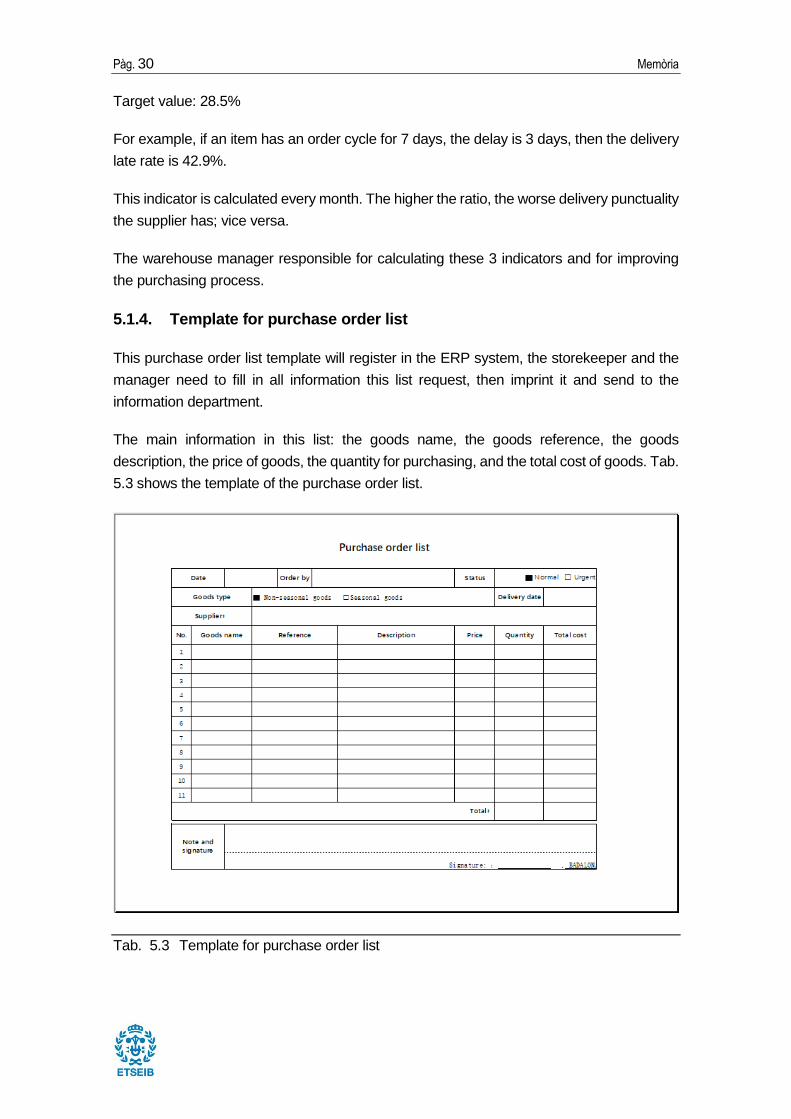
5.1.4. Template for purchase order list
This purchase order list template will register in the ERP system, the storekeeper and the
manager need to fill in all information this list request, then imprint it and send to the
information department.
The main information in this list: the goods name, the goods reference, the goods
description, the price of goods, the quantity for purchasing, and the total cost of goods. Tab.
5.3 shows the template of the purchase order list.
Tab. 5.3 Template for purchase order list
Process improvement for inventory management in a FMCG
company Pá g. 31
5.2. Improvement of receiving process
Due to no one records the purchase order information after finished the purchase process,
the correctness of the supplier's delivery information cannot be confirmed. When the
supplier delivers more goods or fewer goods than the storekeeper orders, company A
doesn’t have evidence, so they can only receive the goods, and this a reason that causes
some items with inventory overstock and others with stock shortage.
With the help of the new purchasing process above, the redesign of the receiving process
could be done.
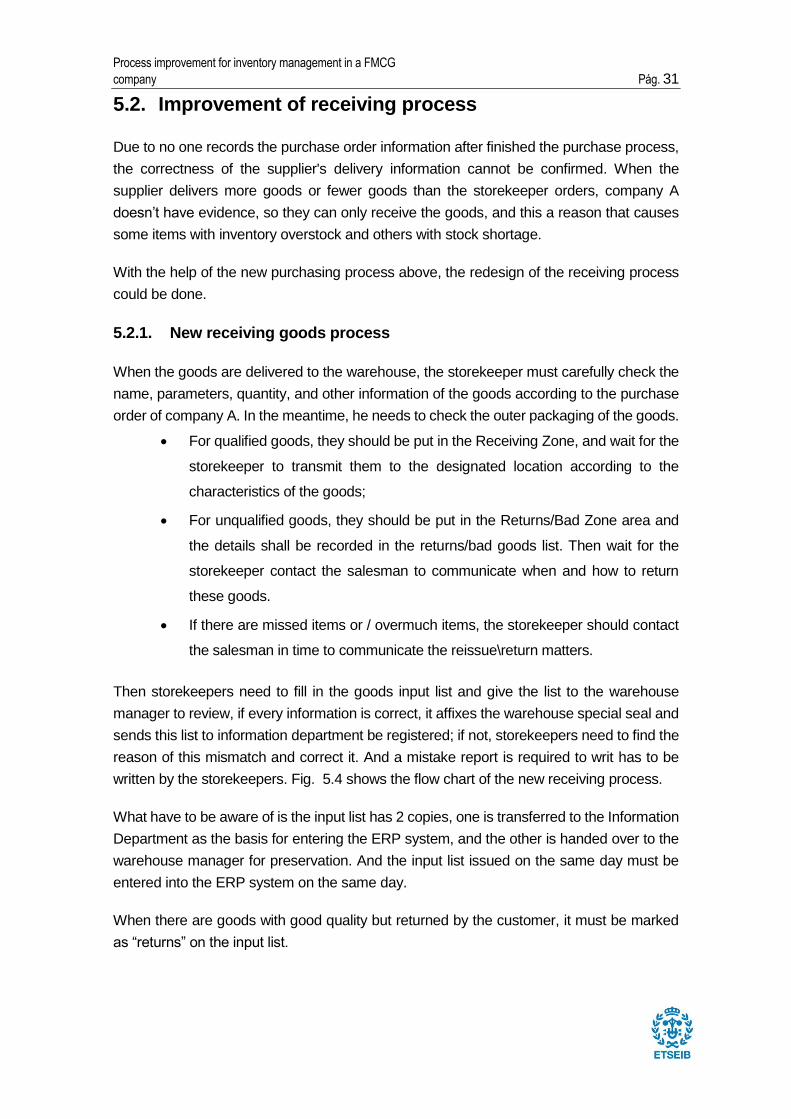
5.2.1. New receiving goods process
When the goods are delivered to the warehouse, the storekeeper must carefully check the
name, parameters, quantity, and other information of the goods according to the purchase
order of company A. In the meantime, he needs to check the outer packaging of the goods.
For qualified goods, they should be put in the Receiving Zone, and wait for the
storekeeper to transmit them to the designated location according to the
characteristics of the goods;
For unqualified goods, they should be put in the Returns/Bad Zone area and
the details shall be recorded in the returns/bad goods list. Then wait for the
storekeeper contact the salesman to communicate when and how to return
these goods.
If there are missed items or / overmuch items, the storekeeper should contact
the salesman in time to communicate the reissue\return matters.
Then storekeepers need to fill in the goods input list and give the list to the warehouse
manager to review, if every information is correct, it affixes the warehouse special seal and
sends this list to information department be registered; if not, storekeepers need to find the
reason of this mismatch and correct it. And a mistake report is required to writ has to be
written by the storekeepers. Fig. 5.4 shows the flow chart of the new receiving process.
What have to be aware of is the input list has 2 copies, one is transferred to the Information
Department as the basis for entering the ERP system, and the other is handed over to the
warehouse manager for preservation. And the input list issued on the same day must be
entered into the ERP system on the same day.
When there are goods with good quality but returned by the customer, it must be marked
as “returns” on the input list.
Pà g. 32 Memò ria
Fig. 5.4 Flow Chart of Receiving process
Process improvement for inventory management in a FMCG
company Pá g. 33
5.2.2. Indicator for verifying the effectivity of the receiving process
1) Accuracy of the placement of the goods
This KPI is designed to measure the accuracy of the placement of the goods. If the position
of goods is wrong, pickers can't find what the customer wants.
Formula: Accuracy of the placement of the goods = Number of products placed in the wrong
position / Total number of received goods
Target value: 5%
This indicator is calculated every month. The higher the ratio, the worse work efficiency the
storekeeper has; vice versa.
The warehouse manager is responsible for calculating this indicator and for improving the
receiving process.
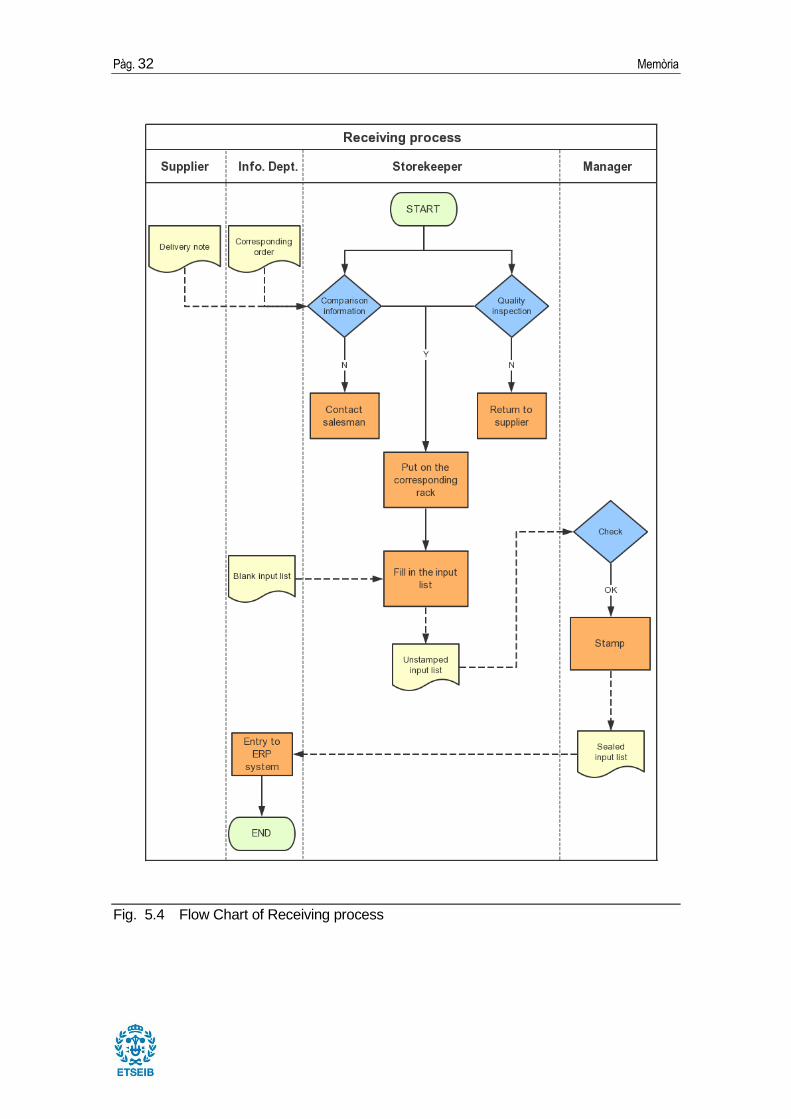
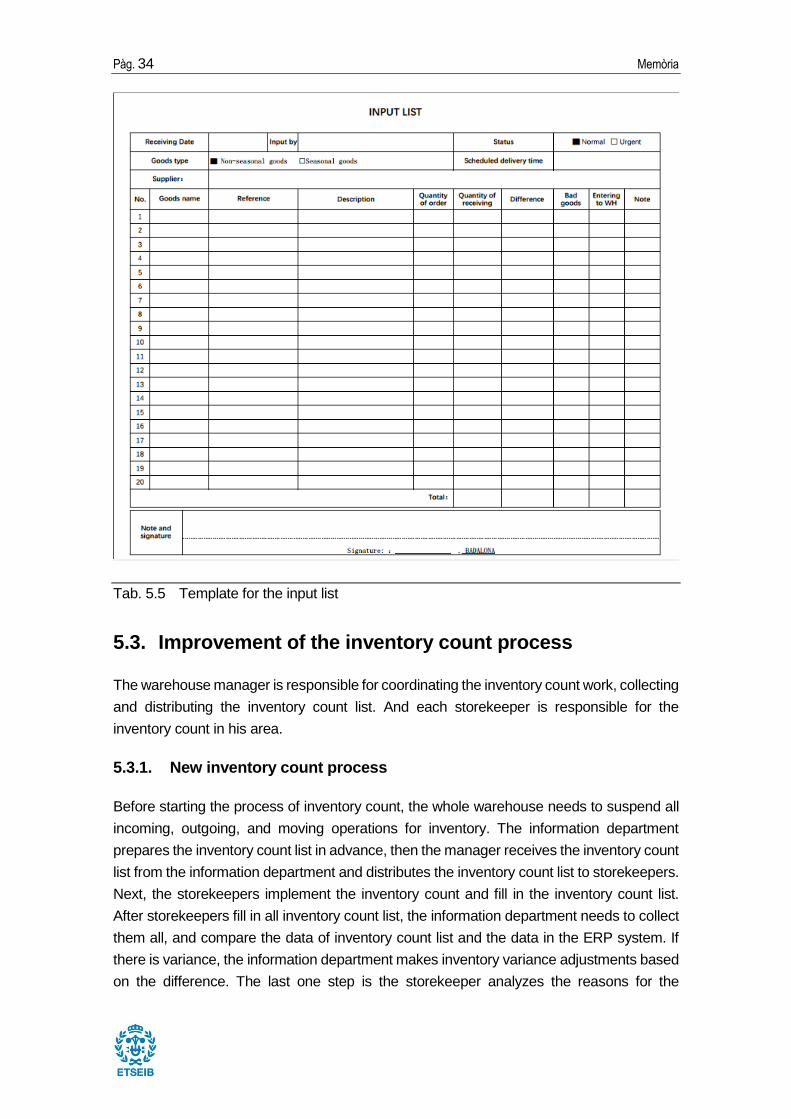
5.2.3. Template for the input list
The input list is a confirmation of the physical received quantity of purchased goods. The
main information in this list: the goods name, the goods reference, the goods description,
the order quantity in purchase order list, the quantity of receiving, and the difference
between the purchasing quantity and the receiving quantity. Tab. 5.5 shows the template
of the input list.
Pà g. 34 Memò ria
Tab. 5.5 Template for the input list
5.3. Improvement of the inventory count process
The warehouse manager is responsible for coordinating the inventory count work, collecting
and distributing the inventory count list. And each storekeeper is responsible for the
inventory count in his area.
5.3.1. New inventory count process
Before starting the process of inventory count, the whole warehouse needs to suspend all
incoming, outgoing, and moving operations for inventory. The information department
prepares the inventory count list in advance, then the manager receives the inventory count
list from the information department and distributes the inventory count list to storekeepers.
Next, the storekeepers implement the inventory count and fill in the inventory count list.
After storekeepers fill in all inventory count list, the information department needs to collect
them all, and compare the data of inventory count list and the data in the ERP system. If
there is variance, the information department makes inventory variance adjustments based
on the difference. The last one step is the storekeeper analyzes the reasons for the
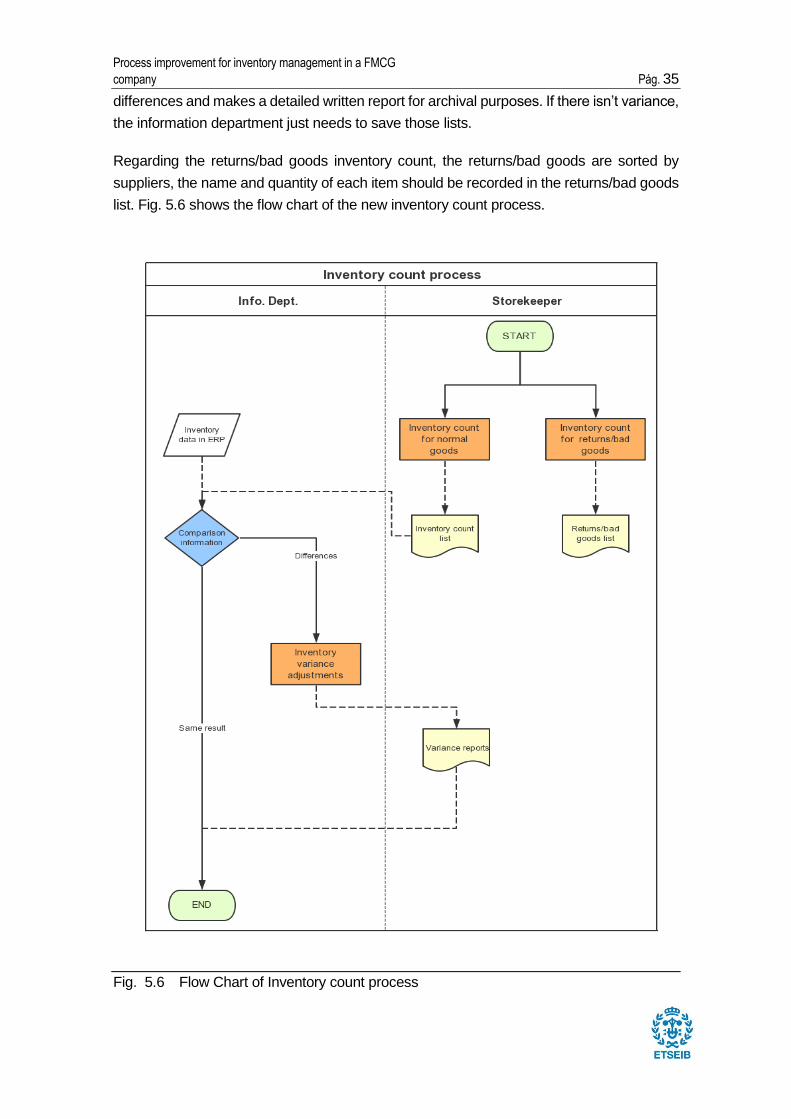
Process improvement for inventory management in a FMCG
company Pá g. 35
differences and makes a detailed written report for archival purposes. If there isn’t variance,
the information department just needs to save those lists.
Regarding the returns/bad goods inventory count, the returns/bad goods are sorted by
suppliers, the name and quantity of each item should be recorded in the returns/bad goods
list. Fig. 5.6 shows the flow chart of the new inventory count process.
Fig. 5.6 Flow Chart of Inventory count process
Pà g. 36 Memò ria
5.3.2. Indicators for verifying the effectivity of inventory counting process
1) Rate of data mismatch
The first KPI is designed to check if the inventory counting process improves the mismatch
between the inventory fiscal and the inventory data in the system. By recording the number
of inconsistencies of the actual inventory and the inventory data in the system, as well as
the number of discrepancies of each item. The fewer the discrepancies, the fewer
inconsistencies, the more effective the improvements are; and vice versa.
Rate of Data Mismatch = Number of mismatch type of the goods / The amount of goods
items
Target value: 0%
This indicator is calculated every month, and the manager is responsible for this. The target
value is 0%, which means the storekeepers must communicate with information department
about the correct inventory number in time, and the information department updates it
correctly and timely. Once this value is bigger than 0%, the cause must be found.
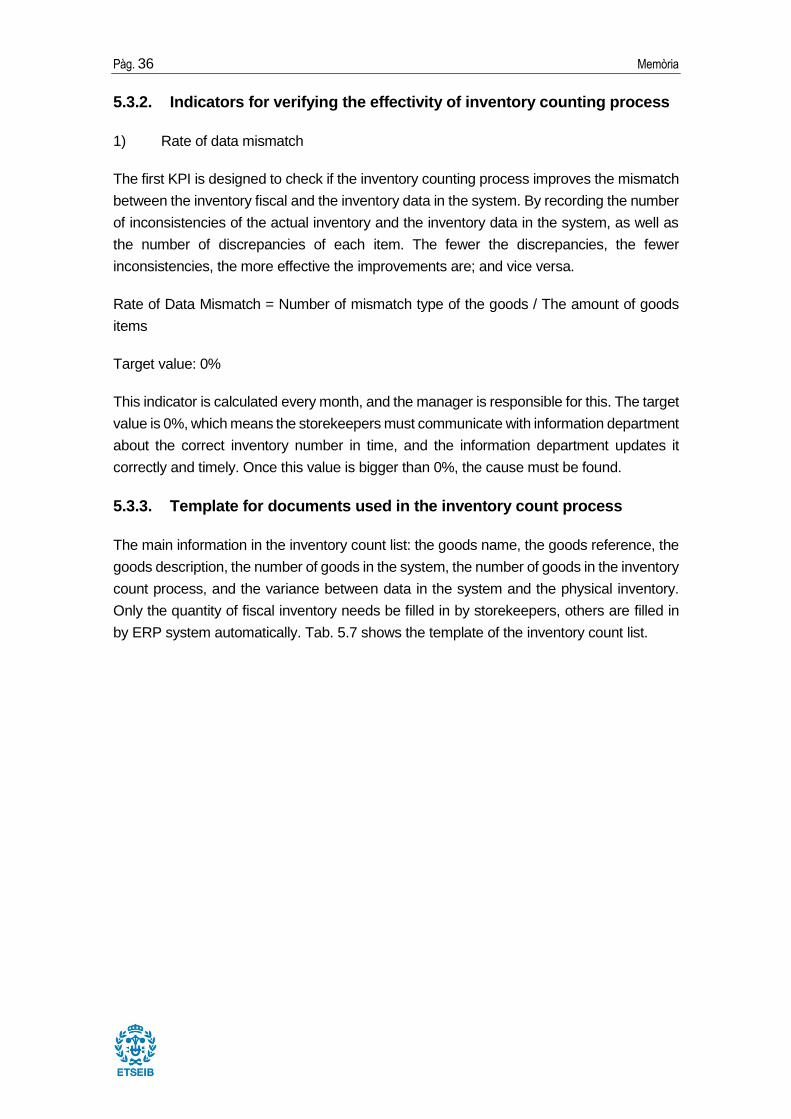
5.3.3. Template for documents used in the inventory count process
The main information in the inventory count list: the goods name, the goods reference, the
goods description, the number of goods in the system, the number of goods in the inventory
count process, and the variance between data in the system and the physical inventory.
Only the quantity of fiscal inventory needs be filled in by storekeepers, others are filled in
by ERP system automatically. Tab. 5.7 shows the template of the inventory count list.
Process improvement for inventory management in a FMCG
company Pá g. 37
Tab. 5.7 Template for inventory count list
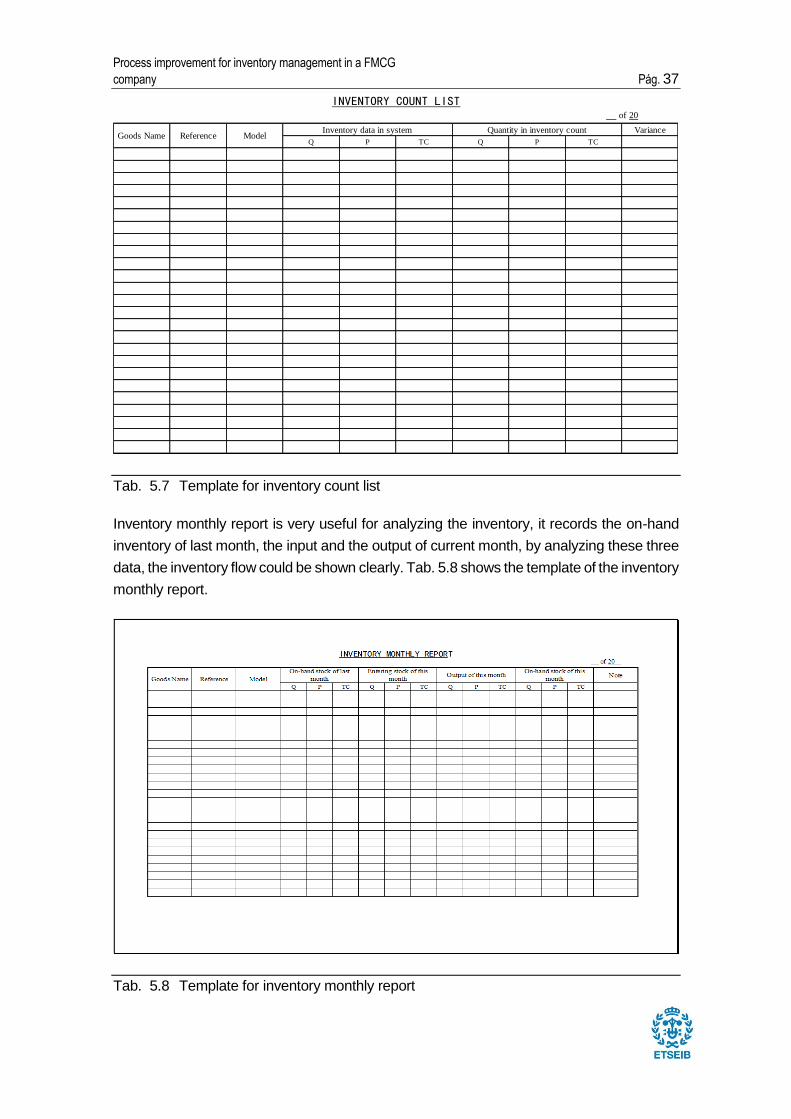
Inventory monthly report is very useful for analyzing the inventory, it records the on-hand
inventory of last month, the input and the output of current month, by analyzing these three
data, the inventory flow could be shown clearly. Tab. 5.8 shows the template of the inventory
monthly report.
Tab. 5.8 Template for inventory monthly report
Variance
Q P TC Q P TC
INVENTORY COUNT LIST of 20
Goods Name Reference ModelInventory data in system Quantity in inventory count
Pà g. 38 Memò ria
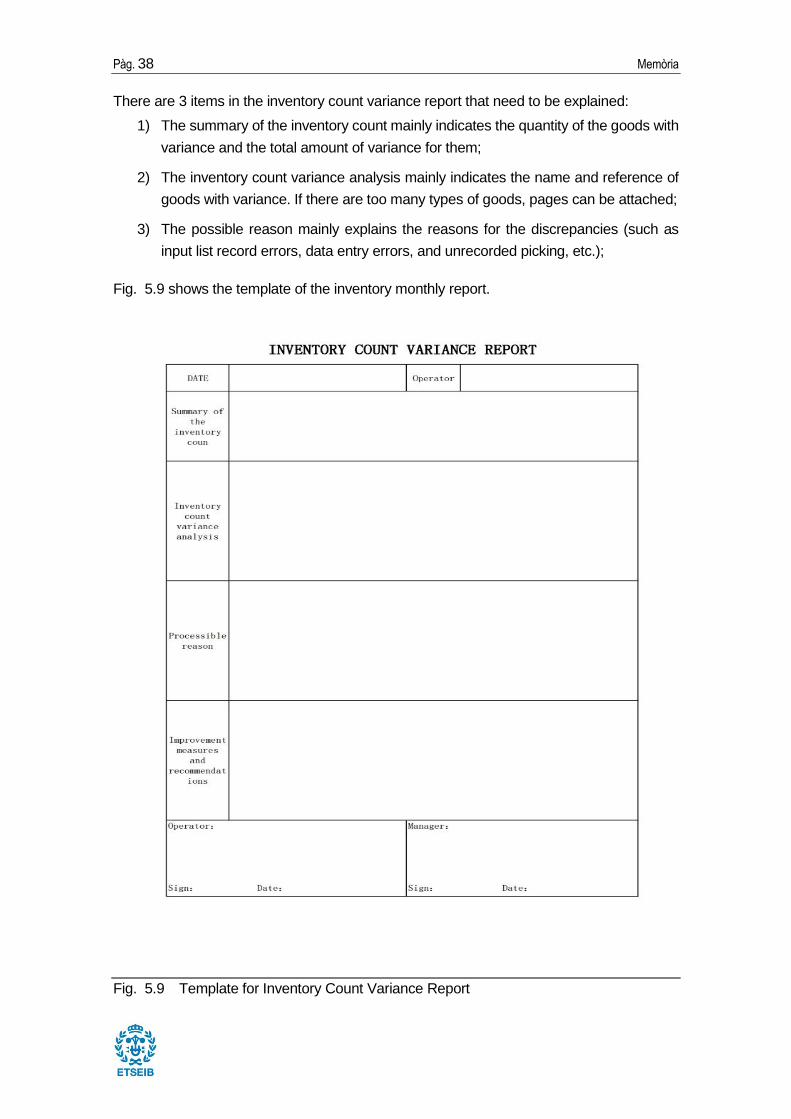
There are 3 items in the inventory count variance report that need to be explained:
1) The summary of the inventory count mainly indicates the quantity of the goods with
variance and the total amount of variance for them;
2) The inventory count variance analysis mainly indicates the name and reference of
goods with variance. If there are too many types of goods, pages can be attached;
3) The possible reason mainly explains the reasons for the discrepancies (such as
input list record errors, data entry errors, and unrecorded picking, etc.);
Fig. 5.9 shows the template of the inventory monthly report.
Fig. 5.9 Template for Inventory Count Variance Report
Process improvement for inventory management in a FMCG
company Pá g. 39
5.4. Improvement of the picking process
5.4.1. Picker's job responsibilities and work processes
1) Complete daily picking tasks as required;
2) Picking goods according to the principle of order first in, first out;
3) Responsible for handling and feedback of upstream and downstream anomalies in
the picking work;
4) Responsible for the normal using, maintenance, and return of equipment and tools
used in the work;
5) Complete other tasks arranged by the manager.
5.4.2. New picking process:
After the picker receives the customer order provided by the APP department, he needs
preparing the orders based on the order time. Then according to the principle of one roll
container for an order, write the consignee on the outer packaging of the roll container.
Generally, the goods are picked up on the shelves in the order of racks from A-Z, then
placed in the roll container. Next, inspect the product packaging, signs, and review the
goods name, quantity, model, etc. Moreover, the roll container will be sent to the checkout
counter for the financial settlement. After the financial settlement, the printed invoice and
delivery form will be placed in the roll container. The last step is reinforcing the packaged
of roll container and put it in the Shipping Zone for transportation. Fig. 5.10 shows the flow
chart of the picking process.
Pà g. 40 Memò ria
Fig. 5.10 Flow Chart of the Picking process
Process improvement for inventory management in a FMCG
company Pá g. 41
5.4.3. Indicators for verifying the effectivity of picking process
1) On-time delivery rate
The first KPI is to test the efficiency of the entire warehouse and to assess the coordination
ability between the picking departments, finance department, and the logistic department.
On-time delivery rate = Number of on-time delivery / Number of order
Target value: 100%
This indicator is calculated every week by the manager, the target value is 100%, which
means the picker must pick up all goods correctly, the finance department must do the
settlement quickly and the logistic department must make a good transportation plan and
avoid the roads that are prone to traffic jams. Once this value is less than 100%, the cause
must be found, and write a delay report.
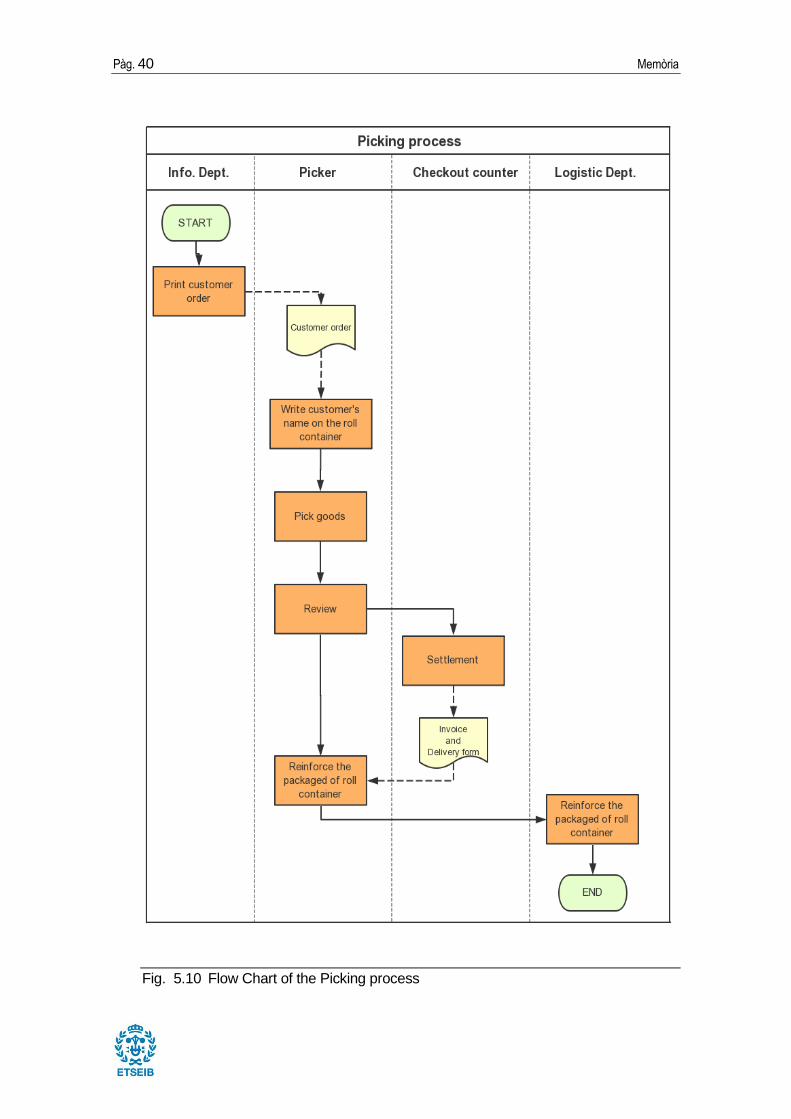
5.4.4. Template for delivery form
The delivery form records the information about those goods leaving the warehouse, like
the price, the quantity and the total cost of goods.
In the picking process, there are three copies of the delivery form, one is transferred to the
Information Department as the basis for entering the ERP system; one is handed over to
the warehouse manager for preservation; the another will be recovered after the customer
signed. Tab. 5.11 shows the template of delivery form.
Tab. 5.11 Template for delivery from
Pick by: Status
Delivery date:
Goods Name Reference Model Quantity Price Total price
Total Cost
DELIVERY FORM of 20
Customer Order Date ▇ Normal □ Urgent
Goods type
Customer:
Note
Pà g. 42 Memò ria
5.5. Improvement of the placement of goods
One of the problems of A company's inventory management is that the products are not
allocated logically. The goods displayed on the rack lacking obvious classification. Which
make the maintenance of goods require a lot of manpower and material resources, resulting
in low work efficiency, increased cost operation. At the same time, the customers need to
go through every rack to find what they need. But in the reality, not everyone has this patient,
if the customer doesn’t like ask the employee where is the goods they need, they will Give
up buying it, it caused the loss of customer orders.
In order to improve this problem, this section first reorganizes and reclassifies all the items
in the warehouse, and then makes a new placement of goods based on the new
classification.
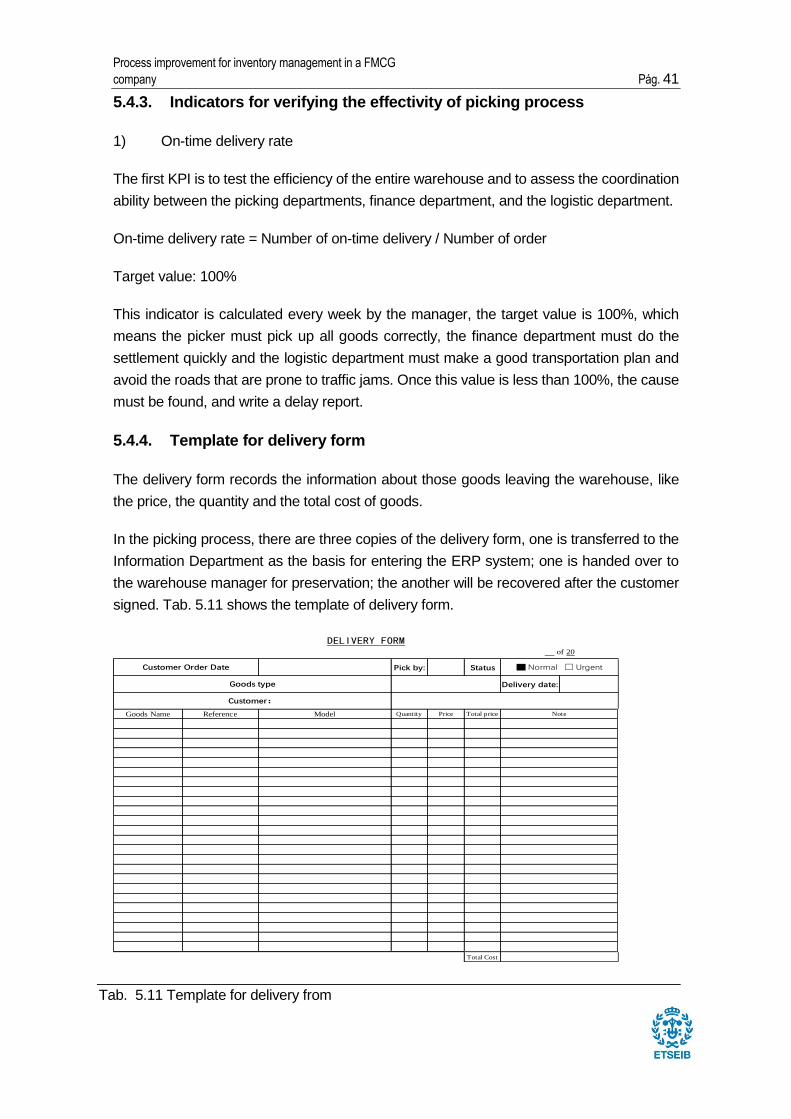
5.5.1. Reclassifies of the goods in company A
In this reclassifies, those goods in company A are probably divided into 8 main categories,
and there are some sub-categories and third level classification in each main category. Tab
5.12 shows the reclassifies of the goods.
Tab. 5.12 Reclassifies of the goods
Main categories Sub-categories
Shampoo and hair care
Toiletries
Oral care
Beauty makeup
Medical supplies
Kitchen Appliances
Home devices
Hard ware
Personal care
Computer product
Mobile Communications
Fashion digital
Bed linings
Storage
Washing
Cleaning paper
cleaning supplies
Kitchen utensils
Toiletries
Auto Accessories
Dog food supplies
Office paper
Office stationery
Daily supplies
6 Sporting goods ball
7 Toy
8 Seasonal goods
Third level categories
1
2
3
4
5
shampoo, Hair care, Hair dye,Stereotype, etc
Bath products, Shower Gel, Soap, etc
Toothpaste, Toothbrush, Oral care accessories, Children's
beauty tools, perfume, etc
alcohol, bandage.Bandage, etc
Rice cooker, Juicer, Coffee machine,Bread machine, etc
Lamp, charger, socket, etc
Shaver, hair dryer, Electronic scale, weighing scale, etc
Office Supplies
Copy paper, printing paper, fax paper
Ballpoint pens, folders, books, envelopes, etc.
Briefcase, photo album, gift pen, etc.
Balls, outdoor products, bicycles and accessories, etc.
Household products
Pillows, pillows, blankets, four-piece beds, etc.
Storage box, storage box, compressed storage bag,
Clips, hangers, etc.
Toilet paper, paper, handkerchief paper, wet tissue, kitchen
Clothing cleaning, furniture cleaning, kitchen cleaning,
Pots, crispers, small kitchen utensils, cutlery, tea sets,
Towels, bath towels, bathroom tools, etc.
Motor oil, perfume, auto parts, etc.
Dog food, cat food, repeating toys
Beauty care
Household appliances
Mobile digital
Mouse, keyboard, stereo, computer accessories, etc.
Telephone, mobile phone accessories, etc.
Radio, tape recorder, card reader, headphones, etc.
Process improvement for inventory management in a FMCG
company Pá g. 43
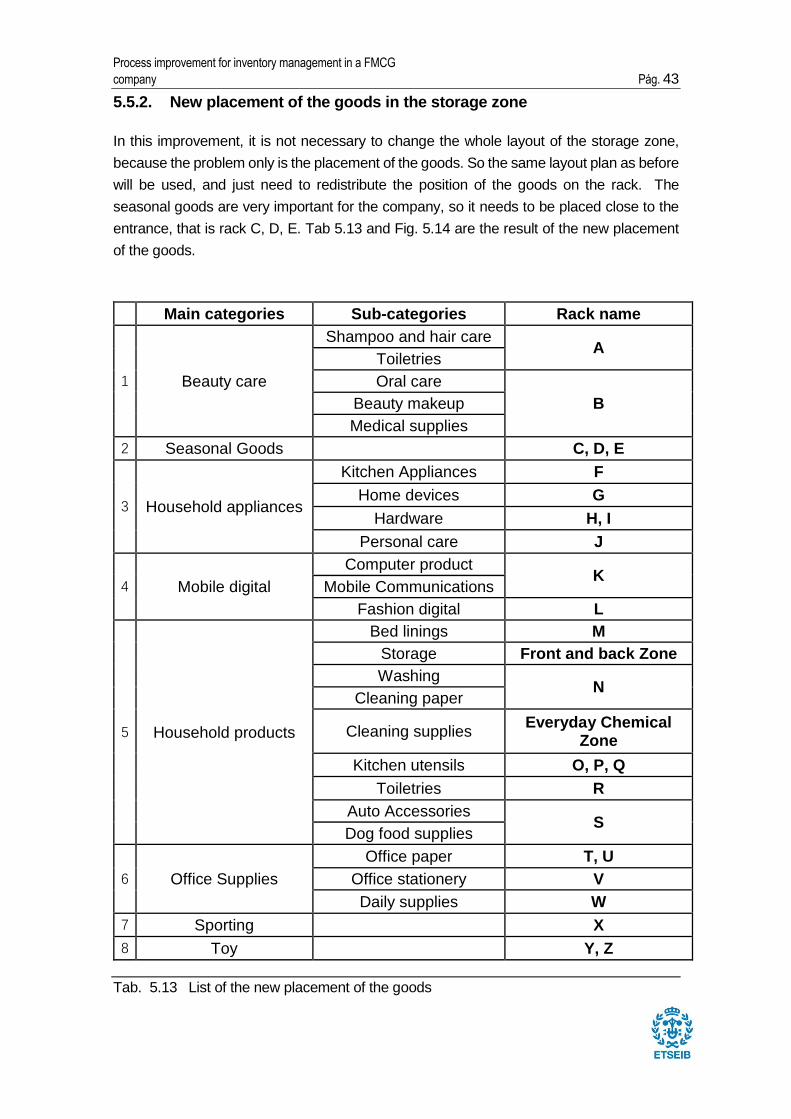
5.5.2. New placement of the goods in the storage zone
In this improvement, it is not necessary to change the whole layout of the storage zone,
because the problem only is the placement of the goods. So the same layout plan as before
will be used, and just need to redistribute the position of the goods on the rack. The
seasonal goods are very important for the company, so it needs to be placed close to the
entrance, that is rack C, D, E. Tab 5.13 and Fig. 5.14 are the result of the new placement
of the goods.
Main categories Sub-categories Rack name
1 Beauty care
Shampoo and hair care A
Toiletries
Oral care
B Beauty makeup
Medical supplies
2 Seasonal Goods C, D, E
3 Household appliances
Kitchen Appliances F
Home devices G
Hardware H, I
Personal care J
4 Mobile digital
Computer product K
Mobile Communications
Fashion digital L
5 Household products
Bed linings M
Storage Front and back Zone
Washing N
Cleaning paper
Cleaning supplies Everyday Chemical
Zone
Kitchen utensils O, P, Q
Toiletries R
Auto Accessories S
Dog food supplies
6 Office Supplies
Office paper T, U
Office stationery V
Daily supplies W
7 Sporting X
8 Toy Y, Z
Tab. 5.13 List of the new placement of the goods
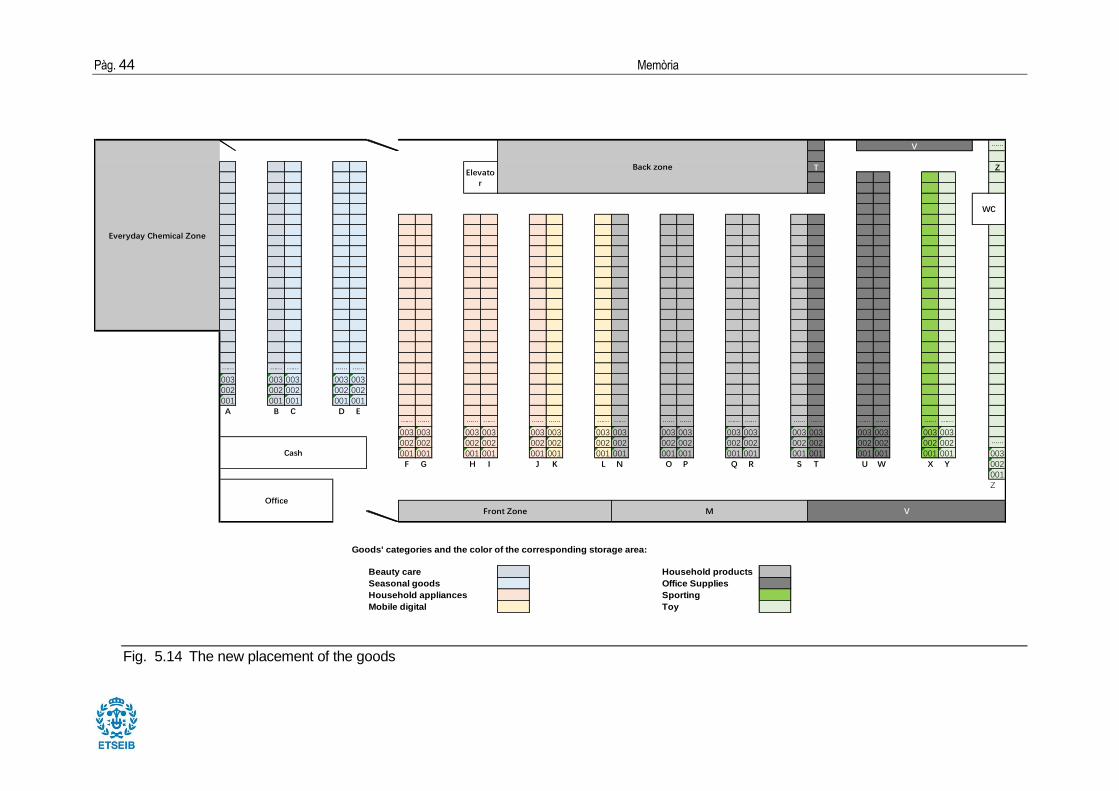
Pà g. 44 Memò ria
Fig. 5.14 The new placement of the goods
……
T Z
…… …… …… …… ……003 003 003 003 003002 002 002 002 002001 001 001 001 001A B C D E
…… …… …… …… …… …… …… …… …… …… …… …… …… …… …… …… …… ……003 003 003 003 003 003 003 003 003 003 003 003 003 003 003 003 003 003002 002 002 002 002 002 002 002 002 002 002 002 002 002 002 002 002 002 ……001 001 001 001 001 001 001 001 001 001 001 001 001 001 001 001 001 001 003F G H I J K L N O P Q R S T U W X Y 002
001Z
Goods' categories and the color of the corresponding storage area:
Beauty care Household products
Seasonal goods Office Supplies
Household appliances Sporting
Mobile digital Toy
Cash
OfficeFront Zone M V
Everyday Chemical Zone
Back zone
V
Elevator
WC
Process improvement for inventory management in a FMCG
company Pá g. 45
5.6. Improvement of inventory management policy
Because Company A does not currently have a standardized ordering policy, even those
storekeepers place order according to a certain period, once a week, once a month or twice
a month, which is depended on the period of salesman comes, but the order – up – to –
level is not optimized, actually they order any amount they want, don’t follow a policy.
For resolving this problem, the Periodic Review System will be used to calculate the order
cycle and the Order – Up – to – Level. The first step is doing the ABC analysis, then analyze
the composition of inventory costs, and determine the type of demand.
5.6.1. ABC analysis
Since there are more than 20,000 kinds of stocks in Company A, only the processes relate
to plastic trash cans have been chosen to be improved. Because the cost of the trash can
be relatively high compared to other goods in Company A, and the volume is large, the
improvement can significantly improve the utilization rate of the company A warehouse. At
the same time, inventory overstock and stock shortage happened in this product line, it’s a
very representative example.
The first step to improving the inventory management is to perform ABC analysis on 36
trash cans sold by Company A.
The ABC inventory classification management method [2] refers to the classification of
inventory items into three levels: particularly important inventory (category A), generally
important inventory (category B), and unimportant inventory (category C) according to the
variety and amount of funds occupied.
Category A products generally account for 15% of the total number of products, but account
for about 75 - 80% of the total value of products; Category B products generally account for
25% of the total number of products, but about 15% of the total value of the remaining
products; Category C products generally account for products 60% of the total, accounting
for about 5% of the total value of the remaining products. Then we need to manage and
control separately for different grades. Such classification management methods can
achieve the following functions: compressing inventory, releasing pressure on capital,
rationalizing inventory, and saving management input.
ABC Inventory Classification Management Procedure:
1) Calculate the total amount and total amount of various materials consumed by
multiplying the average annual consumption of various types of inventory by their unit
price.
Pà g. 46 Memò ria
2) Rearranging according to the order of the amount of money spent on each variety of
materials, and calculating the proportion of total amount and total amount occupied by
various materials.
3) Products with appropriate spending segments of 80% of the total amount are classified
into Category A; products with 80%-95% of the total amount are classified into Category
B; the remaining 5% of products are divided into Category C.
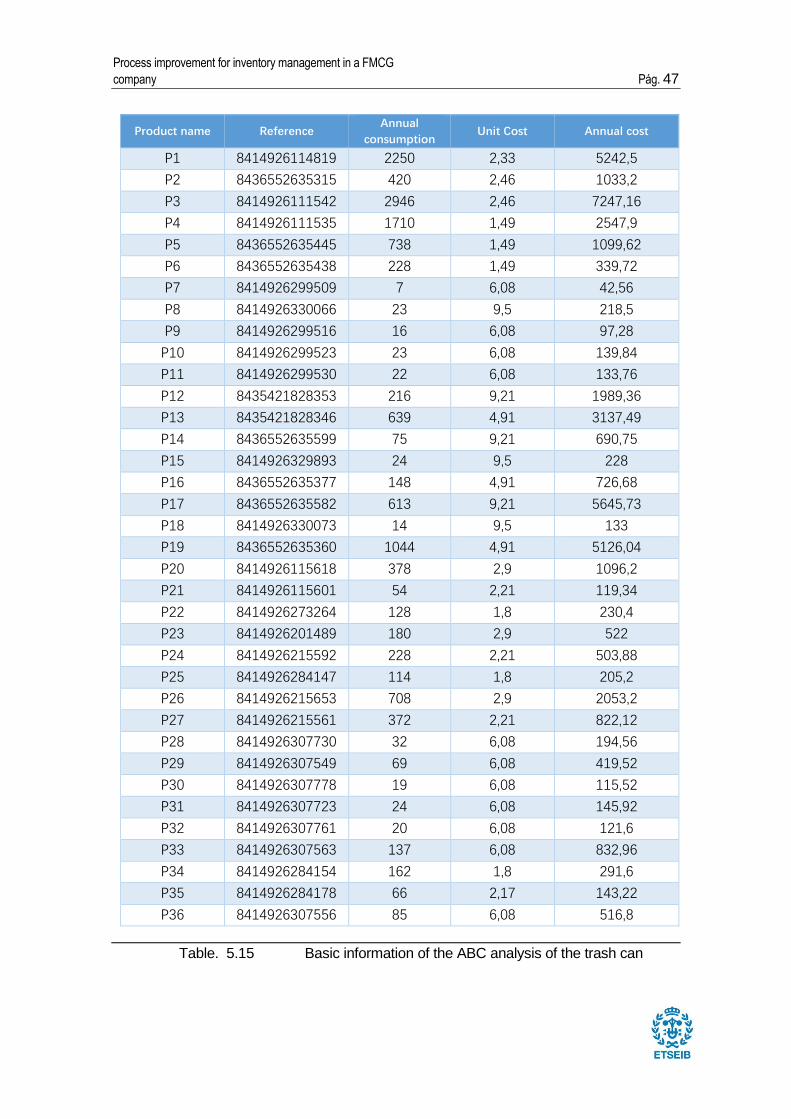
After the statistics and analysis, the basic information of crash can of the company A data,
the two important data - unit prices and annual consumption (25/11/2017-27/10/2018)
required for ABC analysis are listed in the Tab. 5.15.
Process improvement for inventory management in a FMCG
company Pá g. 47
Product name Reference Annual
consumption Unit Cost Annual cost
P1 8414926114819 2250 2,33 5242,5
P2 8436552635315 420 2,46 1033,2
P3 8414926111542 2946 2,46 7247,16
P4 8414926111535 1710 1,49 2547,9
P5 8436552635445 738 1,49 1099,62
P6 8436552635438 228 1,49 339,72
P7 8414926299509 7 6,08 42,56
P8 8414926330066 23 9,5 218,5
P9 8414926299516 16 6,08 97,28
P10 8414926299523 23 6,08 139,84
P11 8414926299530 22 6,08 133,76
P12 8435421828353 216 9,21 1989,36
P13 8435421828346 639 4,91 3137,49
P14 8436552635599 75 9,21 690,75
P15 8414926329893 24 9,5 228
P16 8436552635377 148 4,91 726,68
P17 8436552635582 613 9,21 5645,73
P18 8414926330073 14 9,5 133
P19 8436552635360 1044 4,91 5126,04
P20 8414926115618 378 2,9 1096,2
P21 8414926115601 54 2,21 119,34
P22 8414926273264 128 1,8 230,4
P23 8414926201489 180 2,9 522
P24 8414926215592 228 2,21 503,88
P25 8414926284147 114 1,8 205,2
P26 8414926215653 708 2,9 2053,2
P27 8414926215561 372 2,21 822,12
P28 8414926307730 32 6,08 194,56
P29 8414926307549 69 6,08 419,52
P30 8414926307778 19 6,08 115,52
P31 8414926307723 24 6,08 145,92
P32 8414926307761 20 6,08 121,6
P33 8414926307563 137 6,08 832,96
P34 8414926284154 162 1,8 291,6
P35 8414926284178 66 2,17 143,22
P36 8414926307556 85 6,08 516,8
Table. 5.15 Basic information of the ABC analysis of the trash can
Pà g. 48 Memò ria
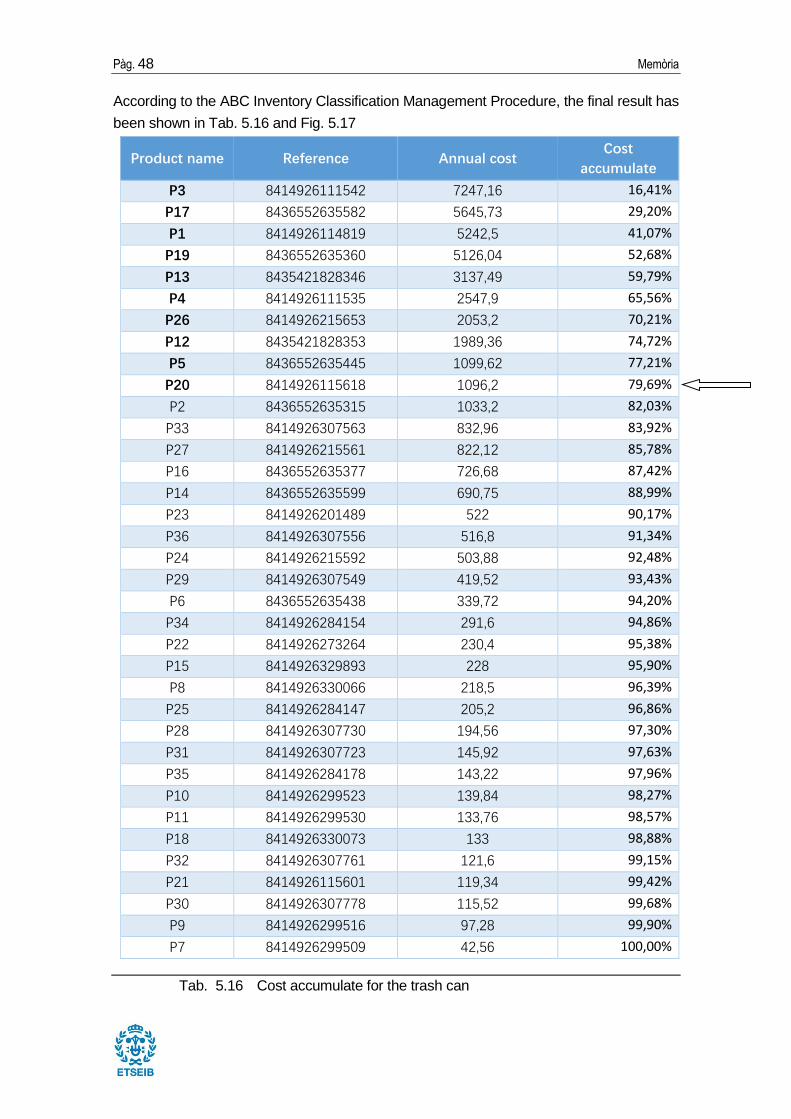
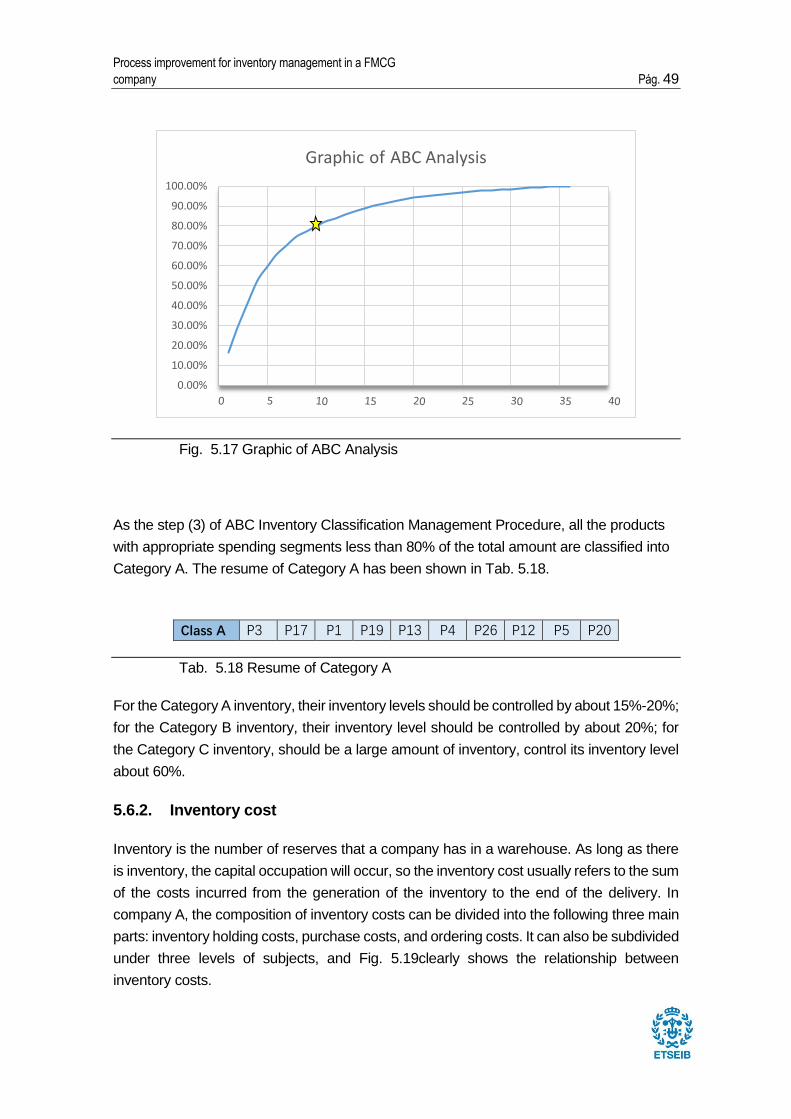
According to the ABC Inventory Classification Management Procedure, the final result has
been shown in Tab. 5.16 and Fig. 5.17
Product name Reference Annual cost Cost
accumulate
P3 8414926111542 7247,16 16,41%
P17 8436552635582 5645,73 29,20%
P1 8414926114819 5242,5 41,07%
P19 8436552635360 5126,04 52,68%
P13 8435421828346 3137,49 59,79%
P4 8414926111535 2547,9 65,56%
P26 8414926215653 2053,2 70,21%
P12 8435421828353 1989,36 74,72%
P5 8436552635445 1099,62 77,21%
P20 8414926115618 1096,2 79,69%
P2 8436552635315 1033,2 82,03%
P33 8414926307563 832,96 83,92%
P27 8414926215561 822,12 85,78%
P16 8436552635377 726,68 87,42%
P14 8436552635599 690,75 88,99%
P23 8414926201489 522 90,17%
P36 8414926307556 516,8 91,34%
P24 8414926215592 503,88 92,48%
P29 8414926307549 419,52 93,43%
P6 8436552635438 339,72 94,20%
P34 8414926284154 291,6 94,86%
P22 8414926273264 230,4 95,38%
P15 8414926329893 228 95,90%
P8 8414926330066 218,5 96,39%
P25 8414926284147 205,2 96,86%
P28 8414926307730 194,56 97,30%
P31 8414926307723 145,92 97,63%
P35 8414926284178 143,22 97,96%
P10 8414926299523 139,84 98,27%
P11 8414926299530 133,76 98,57%
P18 8414926330073 133 98,88%
P32 8414926307761 121,6 99,15%
P21 8414926115601 119,34 99,42%
P30 8414926307778 115,52 99,68%
P9 8414926299516 97,28 99,90%
P7 8414926299509 42,56 100,00%
Tab. 5.16 Cost accumulate for the trash can
Process improvement for inventory management in a FMCG
company Pá g. 49
Fig. 5.17 Graphic of ABC Analysis
As the step (3) of ABC Inventory Classification Management Procedure, all the products
with appropriate spending segments less than 80% of the total amount are classified into
Category A. The resume of Category A has been shown in Tab. 5.18.
Class A P3 P17 P1 P19 P13 P4 P26 P12 P5 P20
Tab. 5.18 Resume of Category A
For the Category A inventory, their inventory levels should be controlled by about 15%-20%;
for the Category B inventory, their inventory level should be controlled by about 20%; for
the Category C inventory, should be a large amount of inventory, control its inventory level
about 60%.
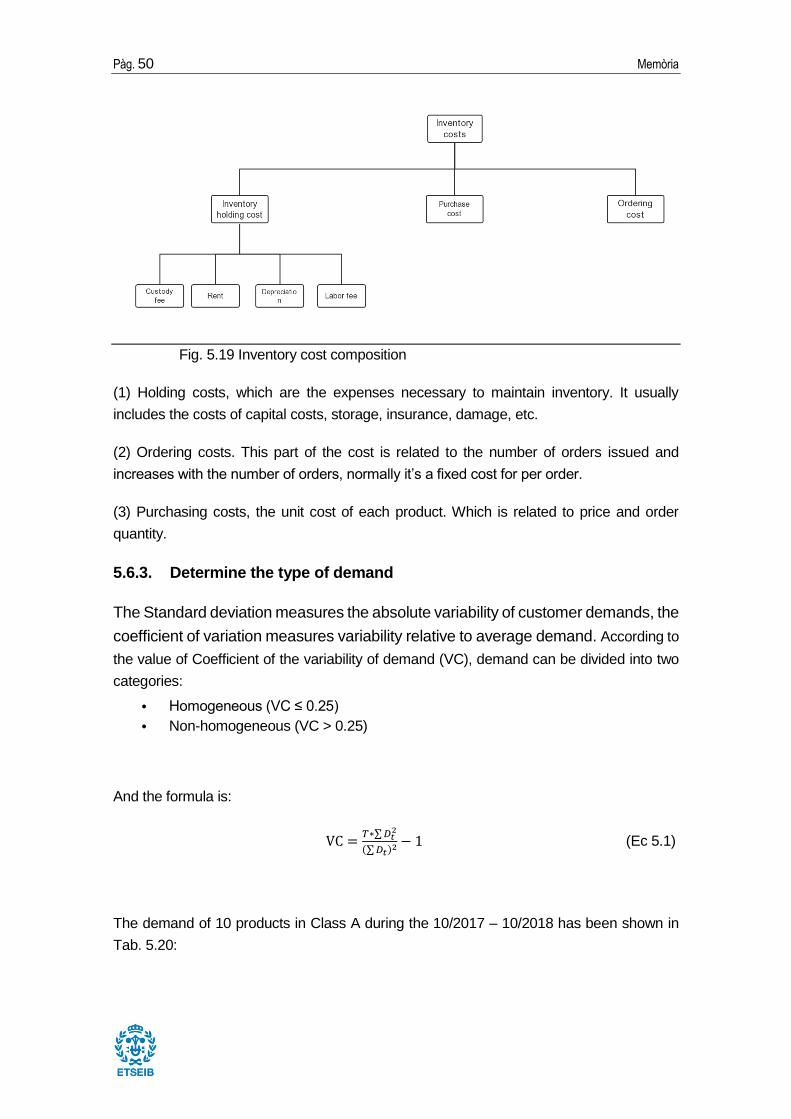
5.6.2. Inventory cost
Inventory is the number of reserves that a company has in a warehouse. As long as there
is inventory, the capital occupation will occur, so the inventory cost usually refers to the sum
of the costs incurred from the generation of the inventory to the end of the delivery. In
company A, the composition of inventory costs can be divided into the following three main
parts: inventory holding costs, purchase costs, and ordering costs. It can also be subdivided
under three levels of subjects, and Fig. 5.19clearly shows the relationship between
inventory costs.
0.00%
10.00%
20.00%
30.00%
40.00%
50.00%
60.00%
70.00%
80.00%
90.00%
100.00%
Graphic of ABC Analysis
Pà g. 50 Memò ria
Fig. 5.19 Inventory cost composition
(1) Holding costs, which are the expenses necessary to maintain inventory. It usually
includes the costs of capital costs, storage, insurance, damage, etc.
(2) Ordering costs. This part of the cost is related to the number of orders issued and
increases with the number of orders, normally it’s a fixed cost for per order.
(3) Purchasing costs, the unit cost of each product. Which is related to price and order
quantity.
5.6.3. Determine the type of demand
The Standard deviation measures the absolute variability of customer demands, the
coefficient of variation measures variability relative to average demand. According to
the value of Coefficient of the variability of demand (VC), demand can be divided into two
categories:
• Homogeneous (VC ≤ 0.25)
• Non-homogeneous (VC > 0.25)
And the formula is:
VC =𝑇∗∑ 𝐷𝑡
2
(∑ 𝐷𝑡)2 − 1 (Ec 5.1)
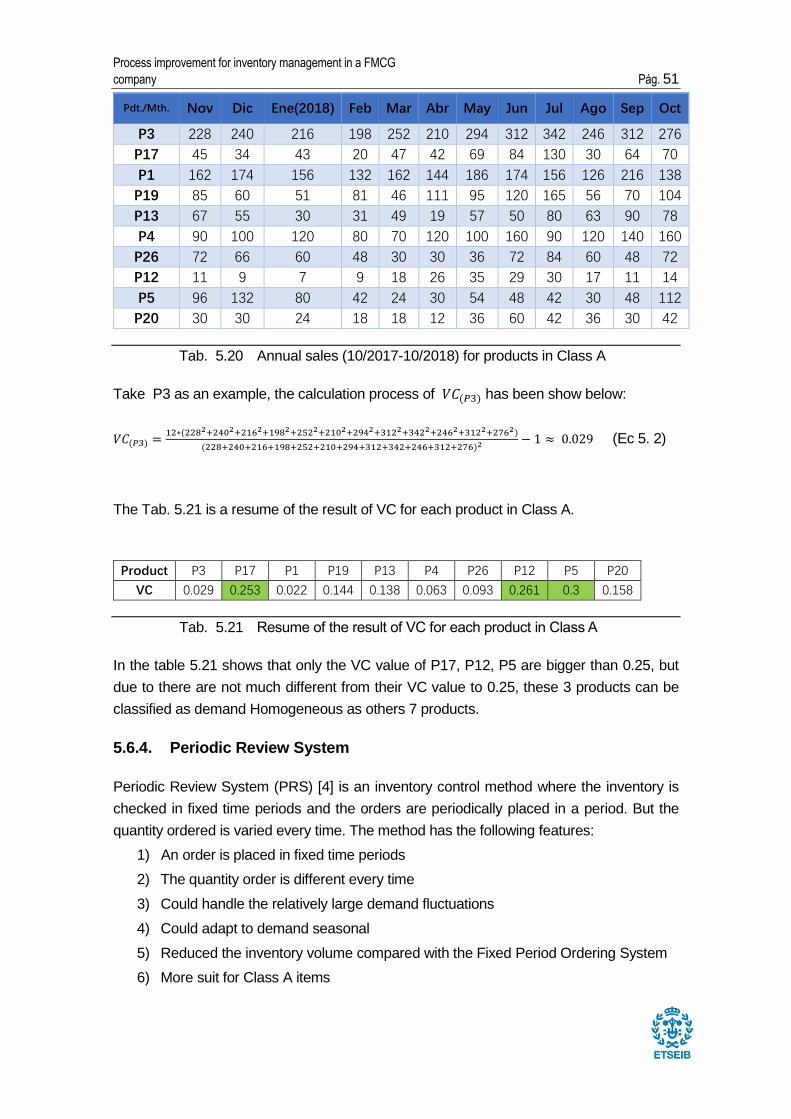
The demand of 10 products in Class A during the 10/2017 – 10/2018 has been shown in
Tab. 5.20:
Process improvement for inventory management in a FMCG
company Pá g. 51
Pdt./Mth. Nov Dic Ene(2018) Feb Mar Abr May Jun Jul Ago Sep Oct
P3 228 240 216 198 252 210 294 312 342 246 312 276
P17 45 34 43 20 47 42 69 84 130 30 64 70
P1 162 174 156 132 162 144 186 174 156 126 216 138
P19 85 60 51 81 46 111 95 120 165 56 70 104
P13 67 55 30 31 49 19 57 50 80 63 90 78
P4 90 100 120 80 70 120 100 160 90 120 140 160
P26 72 66 60 48 30 30 36 72 84 60 48 72
P12 11 9 7 9 18 26 35 29 30 17 11 14
P5 96 132 80 42 24 30 54 48 42 30 48 112
P20 30 30 24 18 18 12 36 60 42 36 30 42
Tab. 5.20 Annual sales (10/2017-10/2018) for products in Class A
Take P3 as an example, the calculation process of 𝑉𝐶(𝑃3) has been show below:
𝑉𝐶(𝑃3) =12∗(2282+2402+2162+1982+2522+2102+2942+3122+3422+2462+3122+2762)
(228+240+216+198+252+210+294+312+342+246+312+276)2 − 1 ≈ 0.029 (Ec 5. 2)
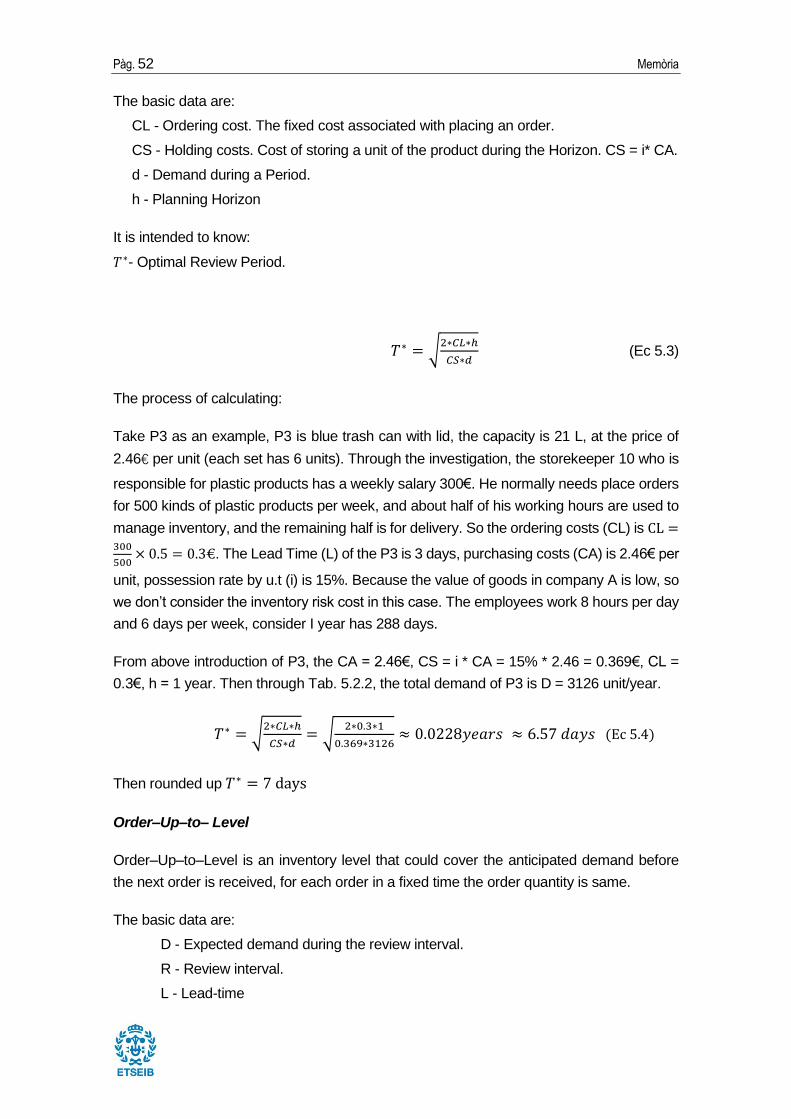
The Tab. 5.21 is a resume of the result of VC for each product in Class A.
Product P3 P17 P1 P19 P13 P4 P26 P12 P5 P20
VC 0.029 0.253 0.022 0.144 0.138 0.063 0.093 0.261 0.3 0.158
Tab. 5.21 Resume of the result of VC for each product in Class A
In the table 5.21 shows that only the VC value of P17, P12, P5 are bigger than 0.25, but
due to there are not much different from their VC value to 0.25, these 3 products can be
classified as demand Homogeneous as others 7 products.
5.6.4. Periodic Review System
Periodic Review System (PRS) [4] is an inventory control method where the inventory is
checked in fixed time periods and the orders are periodically placed in a period. But the
quantity ordered is varied every time. The method has the following features:
1) An order is placed in fixed time periods
2) The quantity order is different every time
3) Could handle the relatively large demand fluctuations
4) Could adapt to demand seasonal
5) Reduced the inventory volume compared with the Fixed Period Ordering System
6) More suit for Class A items
Pà g. 52 Memò ria
The basic data are:
CL - Ordering cost. The fixed cost associated with placing an order.
CS - Holding costs. Cost of storing a unit of the product during the Horizon. CS = i* CA.
d - Demand during a Period.
h - Planning Horizon
It is intended to know:
𝑇∗- Optimal Review Period.
𝑇∗ = √2∗𝐶𝐿∗ℎ
𝐶𝑆∗𝑑 (Ec 5.3)
The process of calculating:
Take P3 as an example, P3 is blue trash can with lid, the capacity is 21 L, at the price of
2.46€ per unit (each set has 6 units). Through the investigation, the storekeeper 10 who is
responsible for plastic products has a weekly salary 300€. He normally needs place orders
for 500 kinds of plastic products per week, and about half of his working hours are used to
manage inventory, and the remaining half is for delivery. So the ordering costs (CL) is CL =300
500× 0.5 = 0.3€. The Lead Time (L) of the P3 is 3 days, purchasing costs (CA) is 2.46€ per
unit, possession rate by u.t (i) is 15%. Because the value of goods in company A is low, so
we don’t consider the inventory risk cost in this case. The employees work 8 hours per day
and 6 days per week, consider I year has 288 days.
From above introduction of P3, the CA = 2.46€, CS = i * CA = 15% * 2.46 = 0.369€, CL =
0.3€, h = 1 year. Then through Tab. 5.2.2, the total demand of P3 is D = 3126 unit/year.
𝑇∗ = √2∗𝐶𝐿∗ℎ
𝐶𝑆∗𝑑= √
2∗0.3∗1
0.369∗3126≈ 0.0228𝑦𝑒𝑎𝑟𝑠 ≈ 6.57 𝑑𝑎𝑦𝑠 (Ec 5.4)
Then rounded up 𝑇∗ = 7 days
Order–Up–to– Level
Order–Up–to–Level is an inventory level that could cover the anticipated demand before
the next order is received, for each order in a fixed time the order quantity is same.
The basic data are:
D - Expected demand during the review interval.
R - Review interval.
L - Lead-time
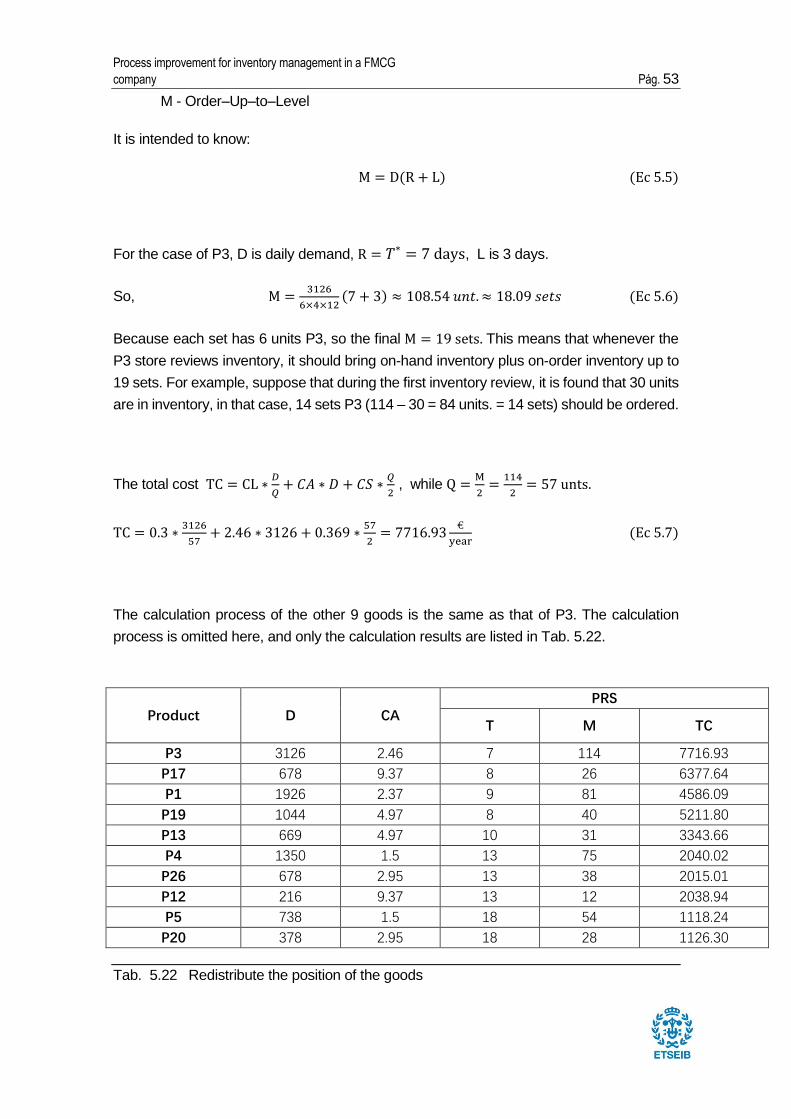
Process improvement for inventory management in a FMCG
company Pá g. 53
M - Order–Up–to–Level
It is intended to know:
M = D(R + L) (Ec 5.5)
For the case of P3, D is daily demand, R = 𝑇∗ = 7 days, L is 3 days.
So, M =3126
6×4×12(7 + 3) ≈ 108.54 𝑢𝑛𝑡. ≈ 18.09 𝑠𝑒𝑡𝑠 (Ec 5.6)
Because each set has 6 units P3, so the final M = 19 sets. This means that whenever the
P3 store reviews inventory, it should bring on-hand inventory plus on-order inventory up to
19 sets. For example, suppose that during the first inventory review, it is found that 30 units
are in inventory, in that case, 14 sets P3 (114 – 30 = 84 units. = 14 sets) should be ordered.
The total cost TC = CL ∗𝐷
𝑄+ 𝐶𝐴 ∗ 𝐷 + 𝐶𝑆 ∗
𝑄
2 , while Q =
M
2=
114
2= 57 unts.
TC = 0.3 ∗3126
57+ 2.46 ∗ 3126 + 0.369 ∗
57
2= 7716.93
€
year (Ec 5.7)
The calculation process of the other 9 goods is the same as that of P3. The calculation
process is omitted here, and only the calculation results are listed in Tab. 5.22.
Product D CA PRS
T M TC
P3 3126 2.46 7 114 7716.93
P17 678 9.37 8 26 6377.64
P1 1926 2.37 9 81 4586.09
P19 1044 4.97 8 40 5211.80
P13 669 4.97 10 31 3343.66
P4 1350 1.5 13 75 2040.02
P26 678 2.95 13 38 2015.01
P12 216 9.37 13 12 2038.94
P5 738 1.5 18 54 1118.24
P20 378 2.95 18 28 1126.30
Tab. 5.22 Redistribute the position of the goods
Pà g. 54 Memò ria
5.6.5. Harris-Wilson Model
Because company A has an aim which is reducing the total cost of inventory management,
so the Harris – Wilson Model [4] will be used to calculating the total cost. But if the ERP
system in company A isn’t good, the Harris – Wilson Model cannot be used in reality.
Harris-Wilson Model was first proposed by F. W. Harris in 1913. In 1934, after further
revision by R. H. Wilson., the well-known economic order quantity (EOQ) was formed. It
refers to the calculation of the purchase order cost and the storage cost, so as to achieve
the best order quantity with the sum of the purchase order cost and the storage cost. This
method not only considers the problem of order but also considers the aspect of
warehousing, it is a combination of these two aspects.
Q∗ = √2∗𝐶𝐿∗𝐷
𝐶𝑆 (Ec 5.8)
K(Q) = CL ∗𝐷
𝑄+ 𝐶𝐴 ∗ 𝐷 + 𝐶𝑆 ∗
𝑄
2 (Ec 5.9)
In the formula:
CL: Ordering costs
CS: Holding costs. CS = i* CA, i is possession rate by u.t
CA: Purchasing costs
D: Annual demand
Assumption: the out of stock is not allowed, regardless of the volume discount, the ordering
cost is independent of the order quantity, and through the investigation, the Lead Time (L)
of the P3 is 3 days, CL=0.3€, CA = 2.46€, i = 15%.
So, CS = i * CA = 15% * 2.46 = 0.369€
Then through Tab. 5.20 we have D = 3126 unit.
Q∗ = √2 ∗ 𝐶𝐿 ∗ 𝐷
𝐶𝑆= √
2 ∗ 0.3 ∗ 3126
0.369≈ 71.29 units ≈ 11.88 sets (Ec 5.10)
If Q= 11 sets = 66 units,
K(Q1) = 0.3 ∗3126
66+ 2.46 ∗ 3126 + 0.369 ∗
66
2≈ 7716.35 € (Ec 5.11)
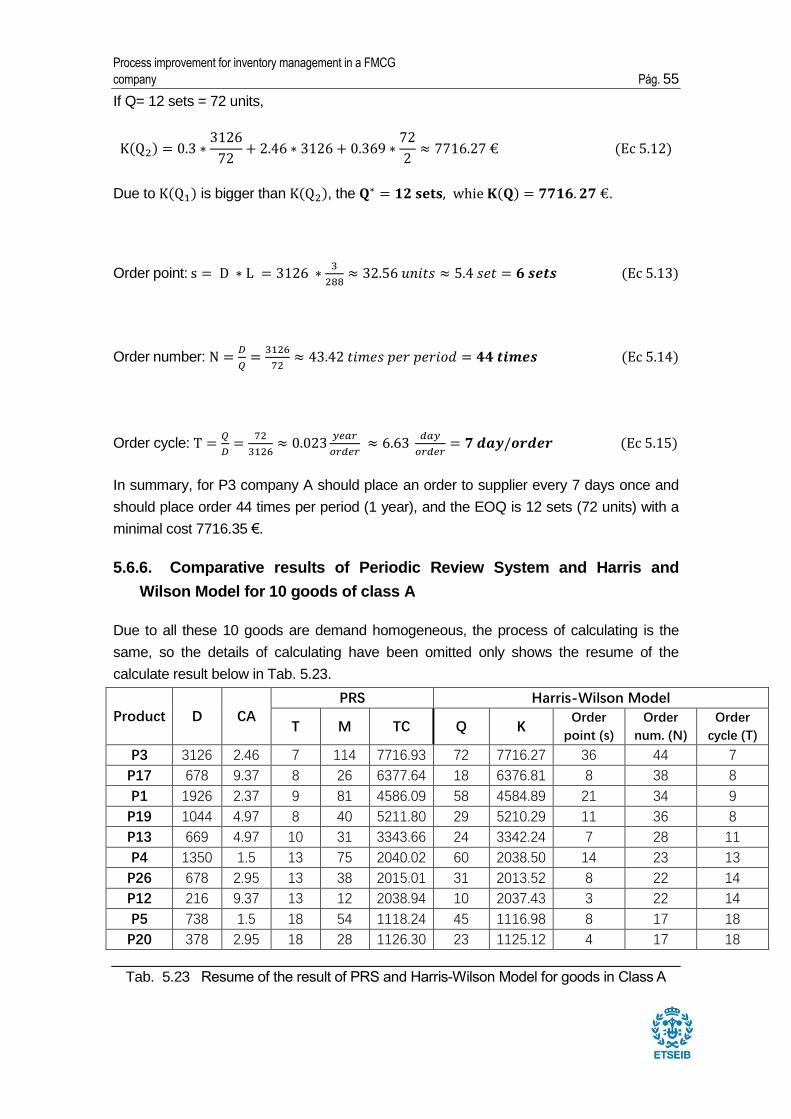
Process improvement for inventory management in a FMCG
company Pá g. 55
If Q= 12 sets = 72 units,
K(Q2) = 0.3 ∗3126
72+ 2.46 ∗ 3126 + 0.369 ∗
72
2≈ 7716.27 € (Ec 5.12)
Due to K(Q1) is bigger than K(Q2), the 𝐐∗ = 𝟏𝟐 𝐬𝐞𝐭𝐬, whie 𝐊(𝐐) = 𝟕𝟕𝟏𝟔. 𝟐𝟕 €.
Order point: s = D ∗ L = 3126 ∗3
288≈ 32.56 𝑢𝑛𝑖𝑡𝑠 ≈ 5.4 𝑠𝑒𝑡 = 𝟔 𝒔𝒆𝒕𝒔 (Ec 5.13)
Order number: N =𝐷
𝑄=
3126
72≈ 43.42 𝑡𝑖𝑚𝑒𝑠 𝑝𝑒𝑟 𝑝𝑒𝑟𝑖𝑜𝑑 = 𝟒𝟒 𝒕𝒊𝒎𝒆𝒔 (Ec 5.14)
Order cycle: T =𝑄
𝐷=
72
3126≈ 0.023
𝑦𝑒𝑎𝑟
𝑜𝑟𝑑𝑒𝑟 ≈ 6.63
𝑑𝑎𝑦
𝑜𝑟𝑑𝑒𝑟= 𝟕 𝒅𝒂𝒚/𝒐𝒓𝒅𝒆𝒓 (Ec 5.15)
In summary, for P3 company A should place an order to supplier every 7 days once and
should place order 44 times per period (1 year), and the EOQ is 12 sets (72 units) with a
minimal cost 7716.35 €.
5.6.6. Comparative results of Periodic Review System and Harris and
Wilson Model for 10 goods of class A
Due to all these 10 goods are demand homogeneous, the process of calculating is the
same, so the details of calculating have been omitted only shows the resume of the
calculate result below in Tab. 5.23.
Product D CA PRS Harris-Wilson Model
T M TC Q K Order
point (s)
Order
num. (N)
Order
cycle (T)
P3 3126 2.46 7 114 7716.93 72 7716.27 36 44 7
P17 678 9.37 8 26 6377.64 18 6376.81 8 38 8
P1 1926 2.37 9 81 4586.09 58 4584.89 21 34 9
P19 1044 4.97 8 40 5211.80 29 5210.29 11 36 8
P13 669 4.97 10 31 3343.66 24 3342.24 7 28 11
P4 1350 1.5 13 75 2040.02 60 2038.50 14 23 13
P26 678 2.95 13 38 2015.01 31 2013.52 8 22 14
P12 216 9.37 13 12 2038.94 10 2037.43 3 22 14
P5 738 1.5 18 54 1118.24 45 1116.98 8 17 18
P20 378 2.95 18 28 1126.30 23 1125.12 4 17 18
Tab. 5.23 Resume of the result of PRS and Harris-Wilson Model for goods in Class A
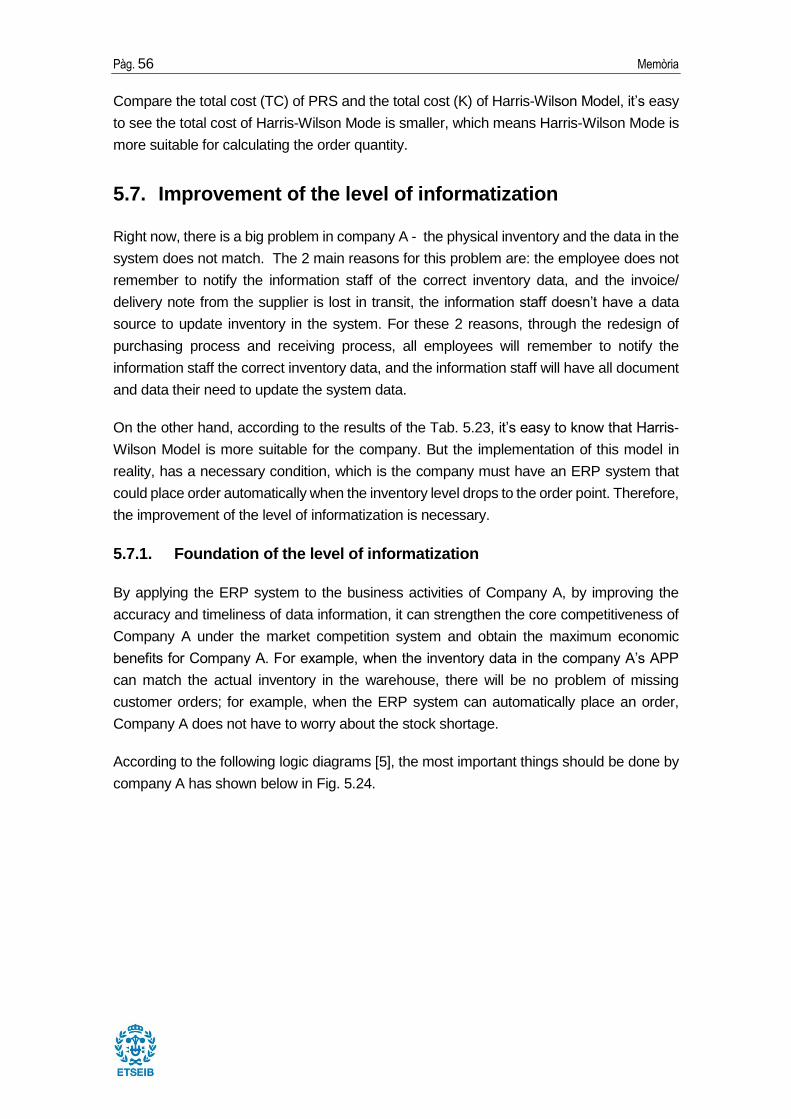
Pà g. 56 Memò ria
Compare the total cost (TC) of PRS and the total cost (K) of Harris-Wilson Model, it’s easy
to see the total cost of Harris-Wilson Mode is smaller, which means Harris-Wilson Mode is
more suitable for calculating the order quantity.
5.7. Improvement of the level of informatization
Right now, there is a big problem in company A - the physical inventory and the data in the
system does not match. The 2 main reasons for this problem are: the employee does not
remember to notify the information staff of the correct inventory data, and the invoice/
delivery note from the supplier is lost in transit, the information staff doesn’t have a data
source to update inventory in the system. For these 2 reasons, through the redesign of
purchasing process and receiving process, all employees will remember to notify the
information staff the correct inventory data, and the information staff will have all document
and data their need to update the system data.
On the other hand, according to the results of the Tab. 5.23, it’s easy to know that Harris-
Wilson Model is more suitable for the company. But the implementation of this model in
reality, has a necessary condition, which is the company must have an ERP system that
could place order automatically when the inventory level drops to the order point. Therefore,
the improvement of the level of informatization is necessary.
5.7.1. Foundation of the level of informatization
By applying the ERP system to the business activities of Company A, by improving the
accuracy and timeliness of data information, it can strengthen the core competitiveness of
Company A under the market competition system and obtain the maximum economic
benefits for Company A. For example, when the inventory data in the company A’s APP
can match the actual inventory in the warehouse, there will be no problem of missing
customer orders; for example, when the ERP system can automatically place an order,
Company A does not have to worry about the stock shortage.
According to the following logic diagrams [5], the most important things should be done by
company A has shown below in Fig. 5.24.
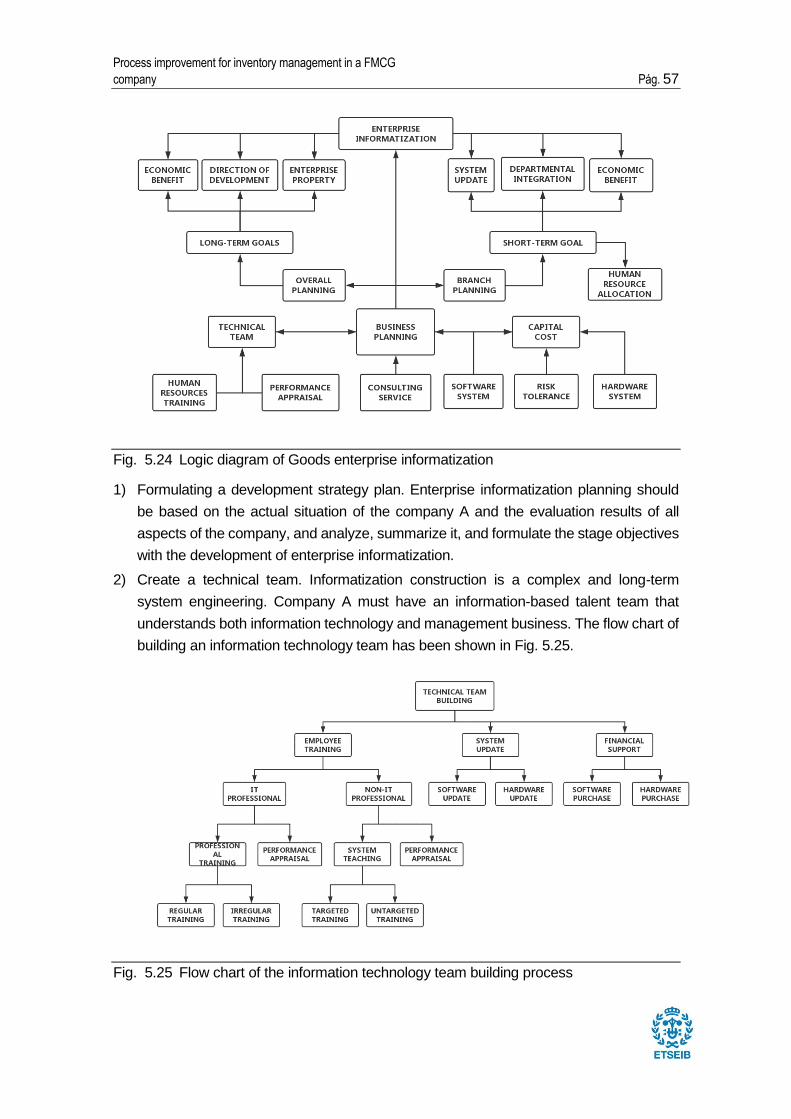
Process improvement for inventory management in a FMCG
company Pá g. 57
Fig. 5.24 Logic diagram of Goods enterprise informatization
1) Formulating a development strategy plan. Enterprise informatization planning should
be based on the actual situation of the company A and the evaluation results of all
aspects of the company, and analyze, summarize it, and formulate the stage objectives
with the development of enterprise informatization.
2) Create a technical team. Informatization construction is a complex and long-term
system engineering. Company A must have an information-based talent team that
understands both information technology and management business. The flow chart of
building an information technology team has been shown in Fig. 5.25.
Fig. 5.25 Flow chart of the information technology team building process
Pà g. 58 Memò ria
Enterprise informatization is not a simple purchase of software and hardware systems.
It is the real operation of informatization. The technical team is the most important
choice for enterprise information construction. Company A already has an ERP system,
now it just missing a technical team that can make enterprise information real operation,
and seek economic benefits for the company.
3) Adjust the working mode. The foundation of enterprise informatization construction is
the “digitalization” of internal information of company A, and on this basis, the workflow
of business operations is fixed in the form of software programs, and this process is
continuously extended to various areas of business operations.
5.7.2. The job responsibilities of the information department
1) Manage and maintain various data in the ERP system;
2) Create and maintain templates for the various paper documents required for the
daily work of the various departments in the warehouse;
3) Enter the data and information on various paper documents submitted by various
departments into the ERP system;
4) Keep a variety of paper documents handed over by various departments;
5) Check the inventory data in the ERP system according to the inventory count list
6) Complete other tasks arranged by the manager.
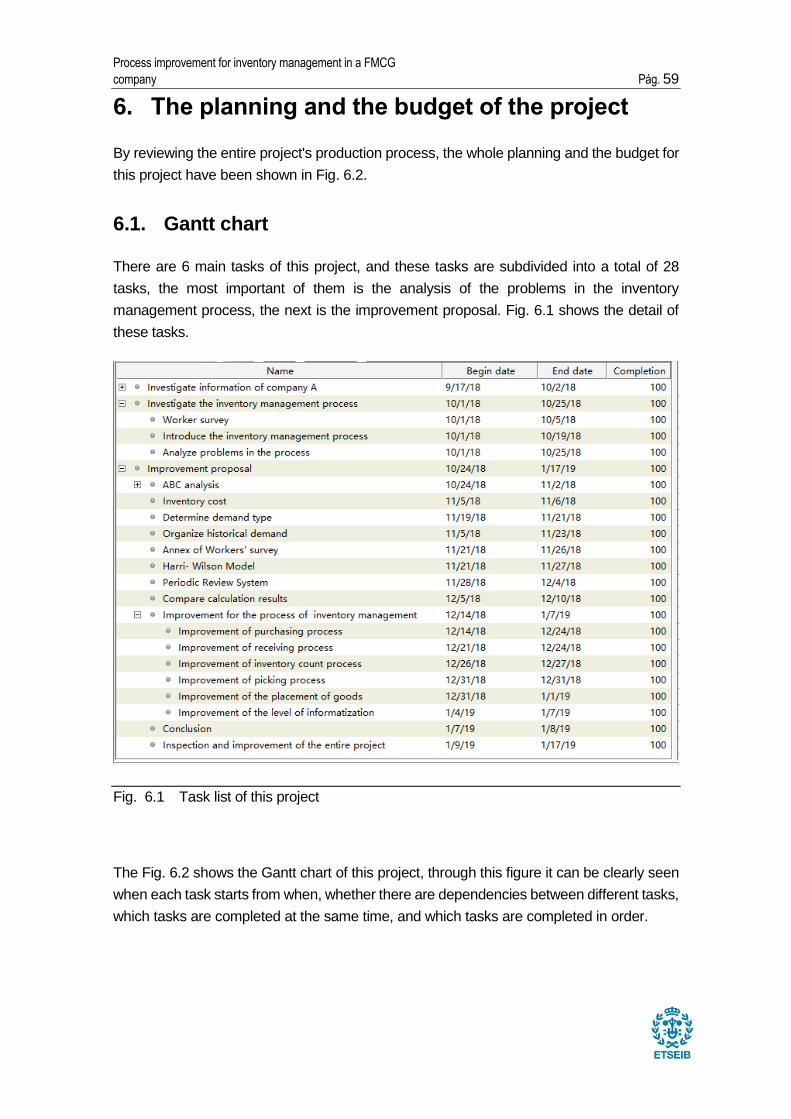
Process improvement for inventory management in a FMCG
company Pá g. 59
6. The planning and the budget of the project
By reviewing the entire project's production process, the whole planning and the budget for
this project have been shown in Fig. 6.2.
6.1. Gantt chart
There are 6 main tasks of this project, and these tasks are subdivided into a total of 28
tasks, the most important of them is the analysis of the problems in the inventory
management process, the next is the improvement proposal. Fig. 6.1 shows the detail of
these tasks.
Fig. 6.1 Task list of this project
The Fig. 6.2 shows the Gantt chart of this project, through this figure it can be clearly seen
when each task starts from when, whether there are dependencies between different tasks,
which tasks are completed at the same time, and which tasks are completed in order.
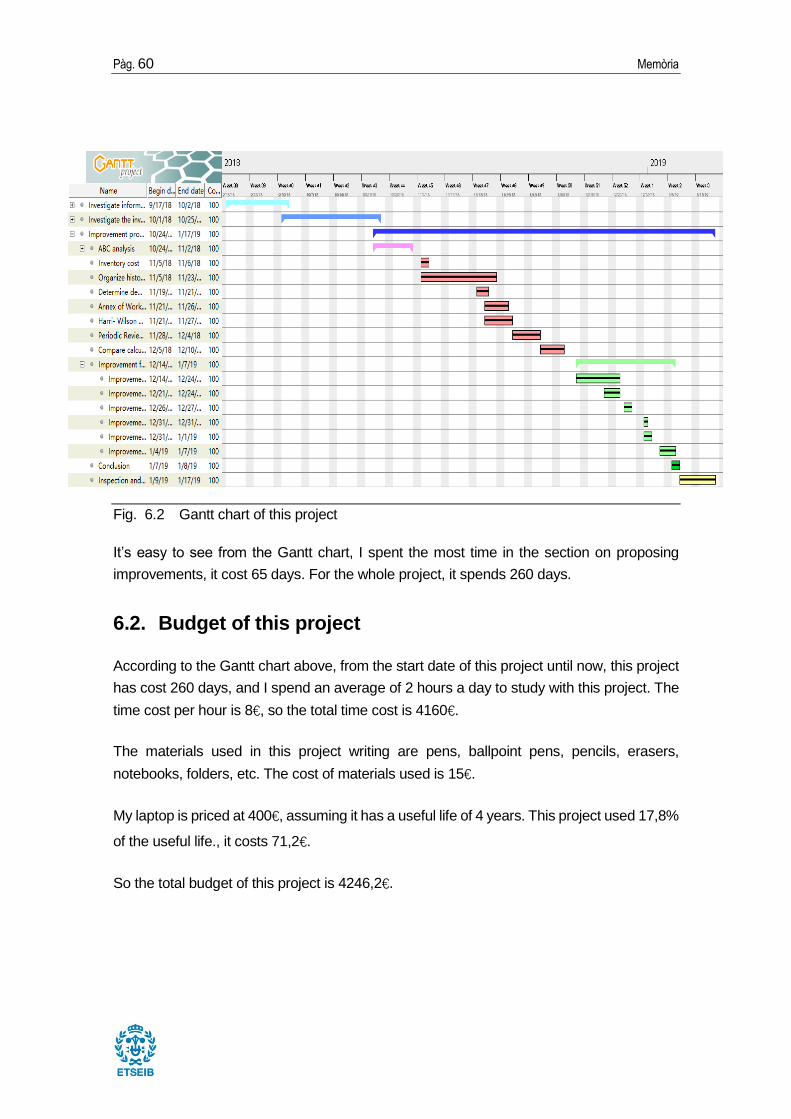
Pà g. 60 Memò ria
Fig. 6.2 Gantt chart of this project
It’s easy to see from the Gantt chart, I spent the most time in the section on proposing
improvements, it cost 65 days. For the whole project, it spends 260 days.
6.2. Budget of this project
According to the Gantt chart above, from the start date of this project until now, this project
has cost 260 days, and I spend an average of 2 hours a day to study with this project. The
time cost per hour is 8€, so the total time cost is 4160€.
The materials used in this project writing are pens, ballpoint pens, pencils, erasers,
notebooks, folders, etc. The cost of materials used is 15€.
My laptop is priced at 400€, assuming it has a useful life of 4 years. This project used 17,8%
of the useful life., it costs 71,2€.
So the total budget of this project is 4246,2€.
Process improvement for inventory management in a FMCG
company Pá g. 61
7. The environmental impact
In the process of completing this project, I paid great attention to the protection of the
environment. The questionnaires given to workers of Company A were all based on online
questionnaires and sound recording interviews, which reduced paper waste during the
project.
On the other hand, if Company A implements the improvement suggestions I have
proposed in this thesis, then Company A can effectively improve the efficiency of inventory
management and reduce inventory costs. Then the adverse impact on the environment
generated by Company A's old inventory management process will be reduced. For
example, when certain goods have inventory overstock, Company A will return the goods
to the supplier, which will generate unnecessary Energy (gasoline, electric energy, etc.)
loss.
In summary, the project is an environmentally neutral project that does not have a very bad
impact on the environment and does not greatly contribute to environmental improvement.
Pà g. 62 Memò ria
8. Conclusion
In recent years, with the development of Company A, various problems in its inventory
management have gradually emerged. How to do a good job in inventory management and
develop an inventory management strategy suitable for its own development is an urgent
problem that Company A needs to solve.
In this context, this thesis introduces and analyzes the current situation of inventory
management of Company A, and uses the ABC analysis principle, the Periodic Review
System and the EOQ model as the theoretical basis, combined with the relevant data of
Company A, the improvements for the problems in the company A's inventory management
are proposed.
8.1. Main conclusions of this thesis
This thesis analyzes the current situation of A company's operation and inventory
management, clarifies the research focus, conducts relevant analysis, and draws
corresponding optimization measures in a targeted manner. The specific conclusions are
as follows:
1) The main problems of A company's inventory management are:
• the purchase process is not standardized;
• the order for suppliers haven’t been recorded;
• unable to verify the accuracy of the arrival information;
• the physical inventory and the data in the system does not match;
• the product order does not follow a logic.
2) Analyze the causes of the problem and summarize it as:
• insufficient understanding of inventory control;
• uncompleted information in the ERP system;
• lack of coordination between departments;
• no one is responsible for the result of the workers
3) Based on the above analysis, with the initial application of A company's ERP system,
by using the ABC analysis theory, EOQ model and other theories, improved the
company's inventory management process and inventory management policy.
4) In order to reduce the resistance and difficulty of the work, under the premise of not
affect the original administrative organization structure, the inventory management
related management mode was adjusted, the professional organization structure
and functions were improved, formed an inventory management mechanism
suitable for the actual work needs of Company A.
5) Designed a long-term plan for the improvement of the level of informatization of
Process improvement for inventory management in a FMCG
company Pá g. 63
Company A, and established an inventory inquiry form and method to meet the
needs of differentiated management.
8.2. Limitations of this thesis
Although this thesis studies the inventory management of Company A and analyzes its
existing problems, it proposes corresponding improvement measures, but it is limited by the
geographical location, development status, consumer groups, and my personal experience
and ability level, it has led to the insufficiency of the research on other related problems in
company A's inventory management. The method of solving the problem is not
comprehensive enough, and many aspects still need further research and improvement.
Teachers, experts, and professors are welcome to criticize and correct.
Pà g. 64 Memò ria
Acknowledgments
First of all, I would like to sincerely thank my thesis supervisor Professor Immaculada Ribas
Her meticulous academic attitude has benefited me a lot, and I have made great progress
both in theoretical research and in practical work. In the whole process of opening the topic,
structure, practice, writing, revision, and finalization, Imma gave me a lot of careful guidance
and detailed revision opinions, which enabled me to successfully complete the graduation
thesis. Thanks again to Professor Imma for his selflessness guidance and teaching.
Finally, I would like to express my heartfelt gratitude and respect to the experts who have
patiently reviewed this thesis during the busy schedule and the teachers of the defense
team!
Process improvement for inventory management in a FMCG
company Pá g. 65
Reference
[1] JINGSONG HU, Performance management from entry to mastery. 2015, p.6-21.
[2] LUNLAI, CHENG, Shipping and Logistics Management. 2010, p.158.
[3] MARK A. VONDEREMBSE & GREGORY P. WHITE, Operations management:
Concepts, Methods, and Strategies. (3rd. edition), p. 626-627.
[4] ALBET PORTER & VENTUS PUBLISHING APS, Operations management © 2009,
p. 60-62
[5] JAY ZHAO, Enterprise informationization architecture. 2011, p. 24-44, p. 60-99.
Pà g. 66 Memò ria
Annex
Daily Work Style Questionnaire (1)
Your feedback will be used to improve our inventory management. Thank you!
1. How long have you been working at Company A?
6 years
2. Have you had worked at any warehouse before? If you have, how long?
No
3. Which racks are you responsible for?
A, B, C
4. Which products are you responsible for?
Needlework, candles, bandages, etc.
Small wooden boxes, candles, shoe polish, plastic bags, etc.
Vases, fish tanks, carpets, gift bags, toothpaste, toothbrushes, etc.
5. Is there stock shortage in products that you are responsible for?
Carpets,
toothpaste, toothbrushes, small wooden boxes.
6. Is there inventory overstock in products that you are responsible for?
Vases, fish tanks.
7. How often do you check the inventory?
1) For the products that salesman comes once a week.
2) For the products that salesman comes once a half month.
3) For the products that salesman comes once a month.
The storekeepers check the inventory every day for all goods, because one of their
work is to replenish the goods on the racks in a timely manner.
Company A's racks have 4 floors, only first and second floors are sales areas, because
third and 4th floors are too high, customers are not convenient to get goods. So when
goods on the first and second floors are not enough, the storekeepers need to move
goods on the third and 4th floors to the first and second floors.
8. How do you judge the inventory of a product is overstock?
The storekeepers are judged based on experience, so they can’t give a certain time
period. I sorted out their answers and can be divided into the following two situations.
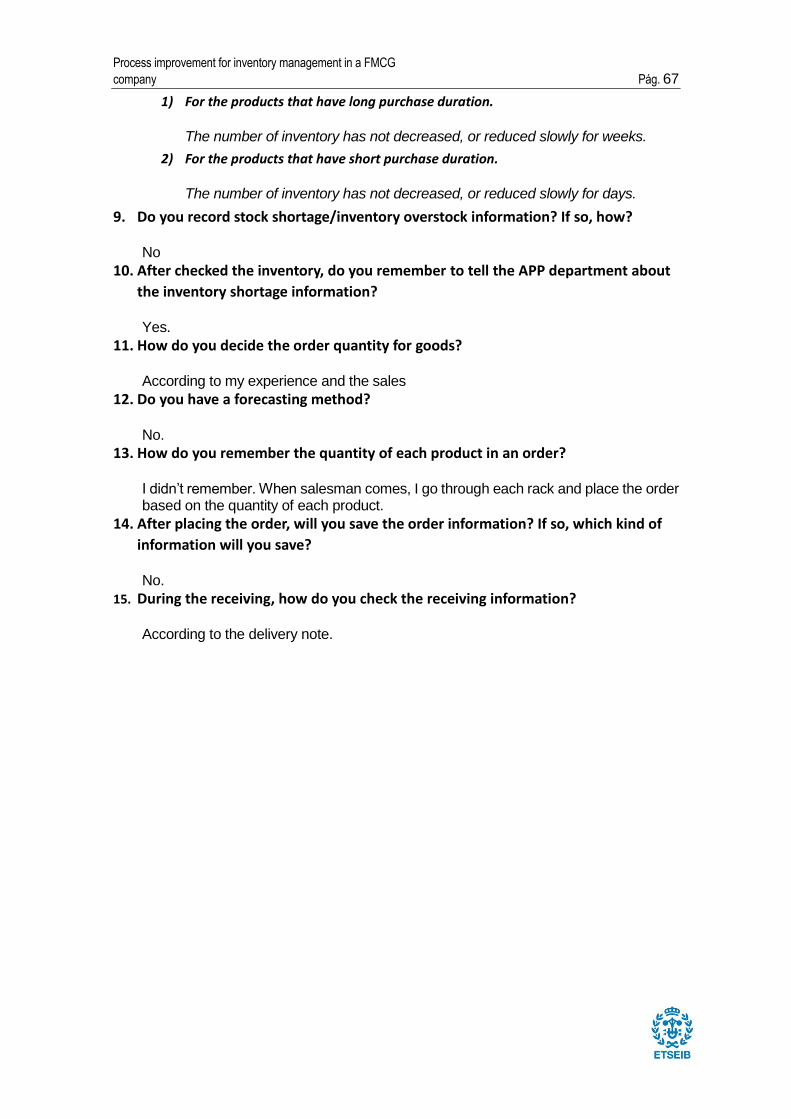
Process improvement for inventory management in a FMCG
company Pá g. 67
1) For the products that have long purchase duration.
The number of inventory has not decreased, or reduced slowly for weeks.
2) For the products that have short purchase duration.
The number of inventory has not decreased, or reduced slowly for days.
9. Do you record stock shortage/inventory overstock information? If so, how?
No
10. After checked the inventory, do you remember to tell the APP department about
the inventory shortage information?
Yes.
11. How do you decide the order quantity for goods?
According to my experience and the sales
12. Do you have a forecasting method?
No.
13. How do you remember the quantity of each product in an order?
I didn’t remember. When salesman comes, I go through each rack and place the order based on the quantity of each product.
14. After placing the order, will you save the order information? If so, which kind of
information will you save?
No.
15. During the receiving, how do you check the receiving information?
According to the delivery note.
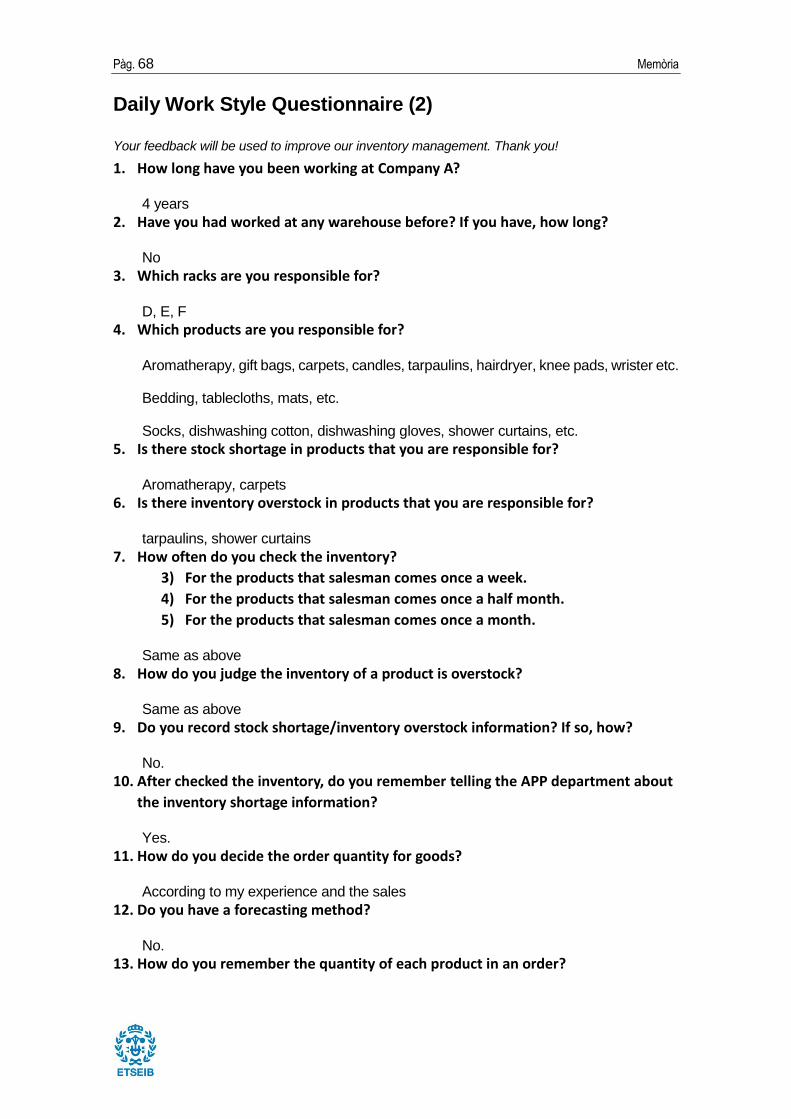
Pà g. 68 Memò ria
Daily Work Style Questionnaire (2)
Your feedback will be used to improve our inventory management. Thank you!
1. How long have you been working at Company A?
4 years
2. Have you had worked at any warehouse before? If you have, how long?
No
3. Which racks are you responsible for?
D, E, F
4. Which products are you responsible for?
Aromatherapy, gift bags, carpets, candles, tarpaulins, hairdryer, knee pads, wrister etc.
Bedding, tablecloths, mats, etc.
Socks, dishwashing cotton, dishwashing gloves, shower curtains, etc.
5. Is there stock shortage in products that you are responsible for?
Aromatherapy, carpets
6. Is there inventory overstock in products that you are responsible for?
tarpaulins, shower curtains
7. How often do you check the inventory?
3) For the products that salesman comes once a week.
4) For the products that salesman comes once a half month.
5) For the products that salesman comes once a month.
Same as above
8. How do you judge the inventory of a product is overstock?
Same as above
9. Do you record stock shortage/inventory overstock information? If so, how?
No.
10. After checked the inventory, do you remember telling the APP department about
the inventory shortage information?
Yes.
11. How do you decide the order quantity for goods?
According to my experience and the sales
12. Do you have a forecasting method?
No.
13. How do you remember the quantity of each product in an order?
Process improvement for inventory management in a FMCG
company Pá g. 69
I didn’t remember. When salesman comes, I go through each rack and place the order
based on the quantity of each product.
14. After placing the order, will you save the order information? If so, which kind of
information will you save?
No.
15. During the receiving, how do you check the receiving information?
I don’t check it.
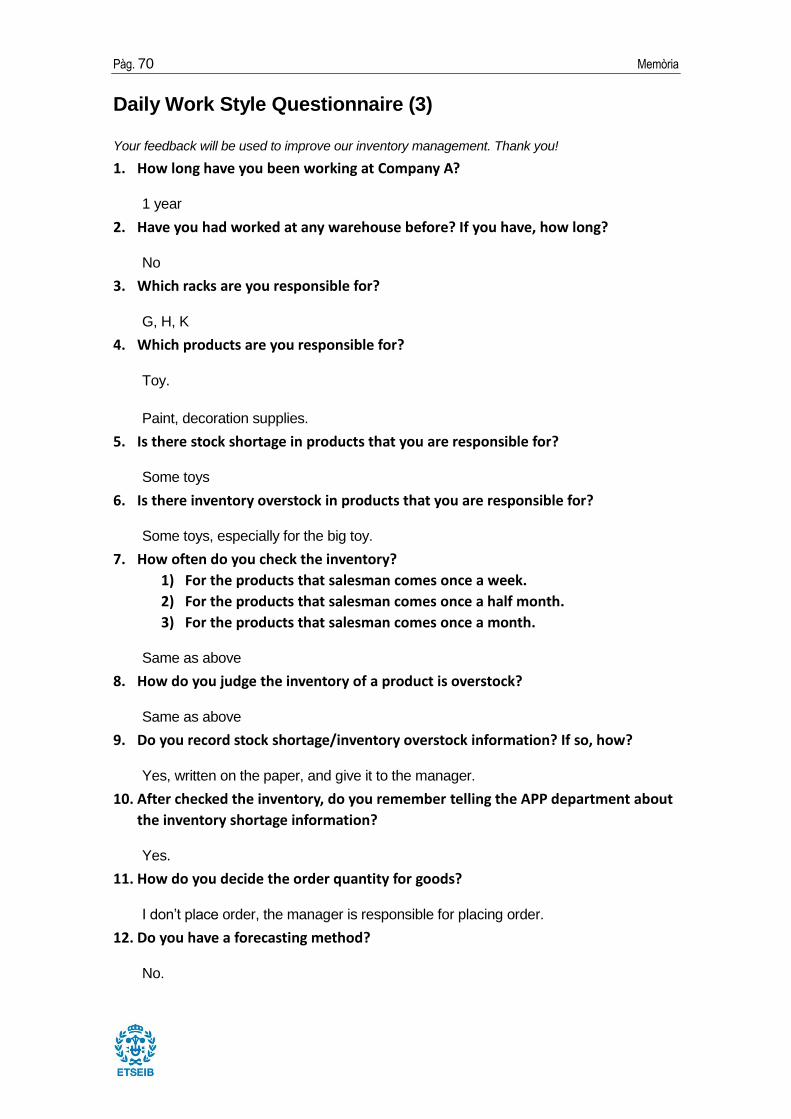
Pà g. 70 Memò ria
Daily Work Style Questionnaire (3)
Your feedback will be used to improve our inventory management. Thank you!
1. How long have you been working at Company A?
1 year
2. Have you had worked at any warehouse before? If you have, how long?
No
3. Which racks are you responsible for?
G, H, K
4. Which products are you responsible for?
Toy.
Paint, decoration supplies.
5. Is there stock shortage in products that you are responsible for?
Some toys
6. Is there inventory overstock in products that you are responsible for?
Some toys, especially for the big toy.
7. How often do you check the inventory?
1) For the products that salesman comes once a week.
2) For the products that salesman comes once a half month.
3) For the products that salesman comes once a month.
Same as above
8. How do you judge the inventory of a product is overstock?
Same as above
9. Do you record stock shortage/inventory overstock information? If so, how?
Yes, written on the paper, and give it to the manager.
10. After checked the inventory, do you remember telling the APP department about
the inventory shortage information?
Yes.
11. How do you decide the order quantity for goods?
I don’t place order, the manager is responsible for placing order.
12. Do you have a forecasting method?
No.
Process improvement for inventory management in a FMCG
company Pá g. 71
13. How do you remember the quantity of each product in an order?
I don’t place order, the manager is responsible for placing order.
14. After placing the order, will you save the order information? If so, which kind of
information will you save?
No.
15. During the receiving, how do you check the receiving information?
I don’t check it.
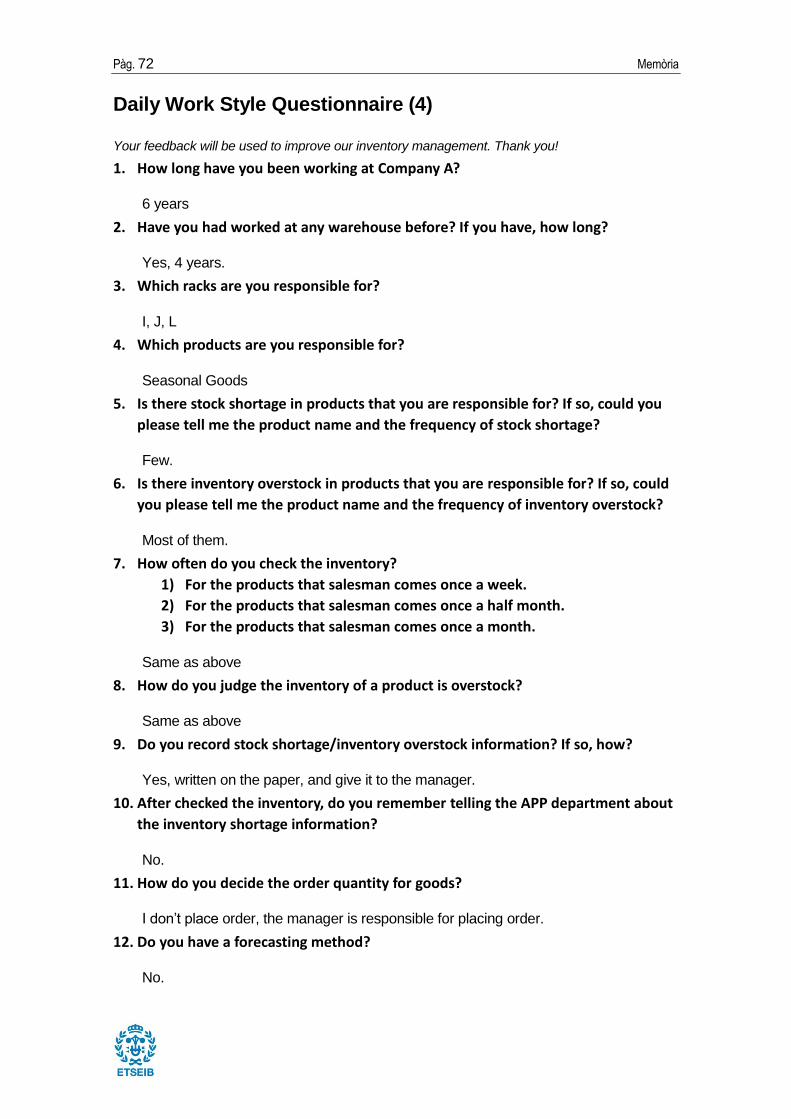
Pà g. 72 Memò ria
Daily Work Style Questionnaire (4)
Your feedback will be used to improve our inventory management. Thank you!
1. How long have you been working at Company A?
6 years
2. Have you had worked at any warehouse before? If you have, how long?
Yes, 4 years.
3. Which racks are you responsible for?
I, J, L
4. Which products are you responsible for?
Seasonal Goods
5. Is there stock shortage in products that you are responsible for? If so, could you
please tell me the product name and the frequency of stock shortage?
Few.
6. Is there inventory overstock in products that you are responsible for? If so, could
you please tell me the product name and the frequency of inventory overstock?
Most of them.
7. How often do you check the inventory?
1) For the products that salesman comes once a week.
2) For the products that salesman comes once a half month.
3) For the products that salesman comes once a month.
Same as above
8. How do you judge the inventory of a product is overstock?
Same as above
9. Do you record stock shortage/inventory overstock information? If so, how?
Yes, written on the paper, and give it to the manager.
10. After checked the inventory, do you remember telling the APP department about
the inventory shortage information?
No.
11. How do you decide the order quantity for goods?
I don’t place order, the manager is responsible for placing order.
12. Do you have a forecasting method?
No.
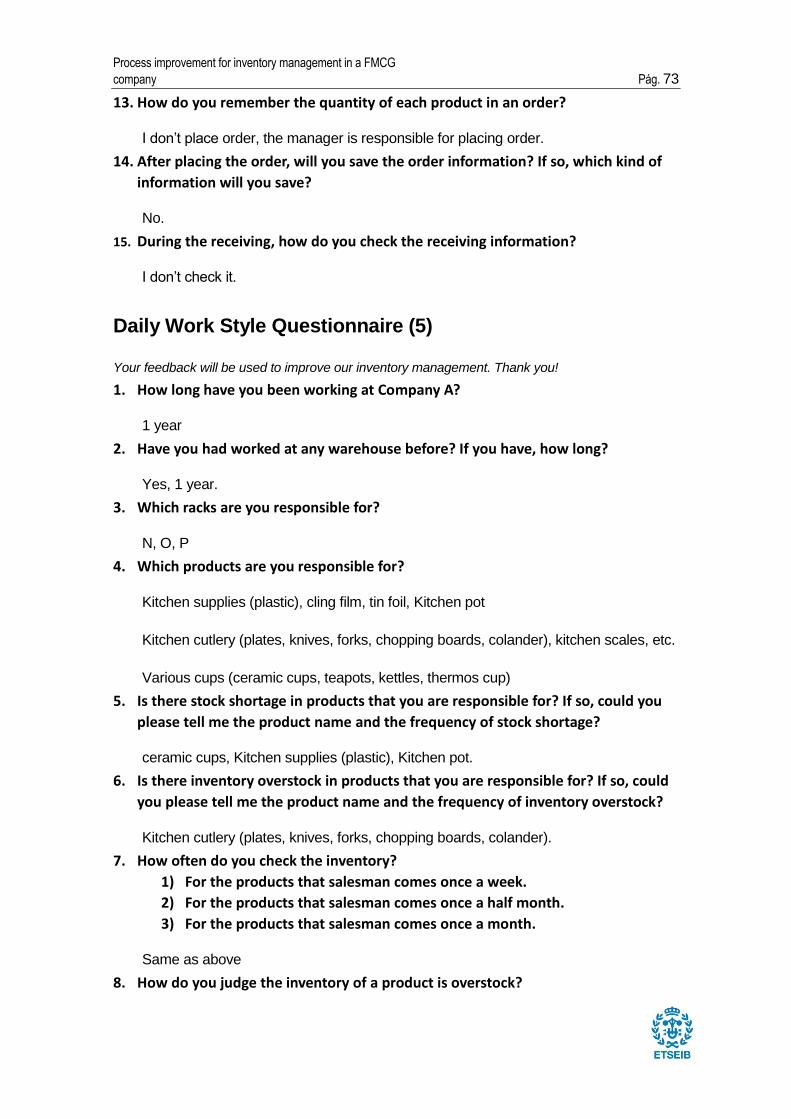
Process improvement for inventory management in a FMCG
company Pá g. 73
13. How do you remember the quantity of each product in an order?
I don’t place order, the manager is responsible for placing order.
14. After placing the order, will you save the order information? If so, which kind of
information will you save?
No.
15. During the receiving, how do you check the receiving information?
I don’t check it.
Daily Work Style Questionnaire (5)
Your feedback will be used to improve our inventory management. Thank you!
1. How long have you been working at Company A?
1 year
2. Have you had worked at any warehouse before? If you have, how long?
Yes, 1 year.
3. Which racks are you responsible for?
N, O, P
4. Which products are you responsible for?
Kitchen supplies (plastic), cling film, tin foil, Kitchen pot
Kitchen cutlery (plates, knives, forks, chopping boards, colander), kitchen scales, etc.
Various cups (ceramic cups, teapots, kettles, thermos cup)
5. Is there stock shortage in products that you are responsible for? If so, could you
please tell me the product name and the frequency of stock shortage?
ceramic cups, Kitchen supplies (plastic), Kitchen pot.
6. Is there inventory overstock in products that you are responsible for? If so, could
you please tell me the product name and the frequency of inventory overstock?
Kitchen cutlery (plates, knives, forks, chopping boards, colander).
7. How often do you check the inventory?
1) For the products that salesman comes once a week.
2) For the products that salesman comes once a half month.
3) For the products that salesman comes once a month.
Same as above
8. How do you judge the inventory of a product is overstock?
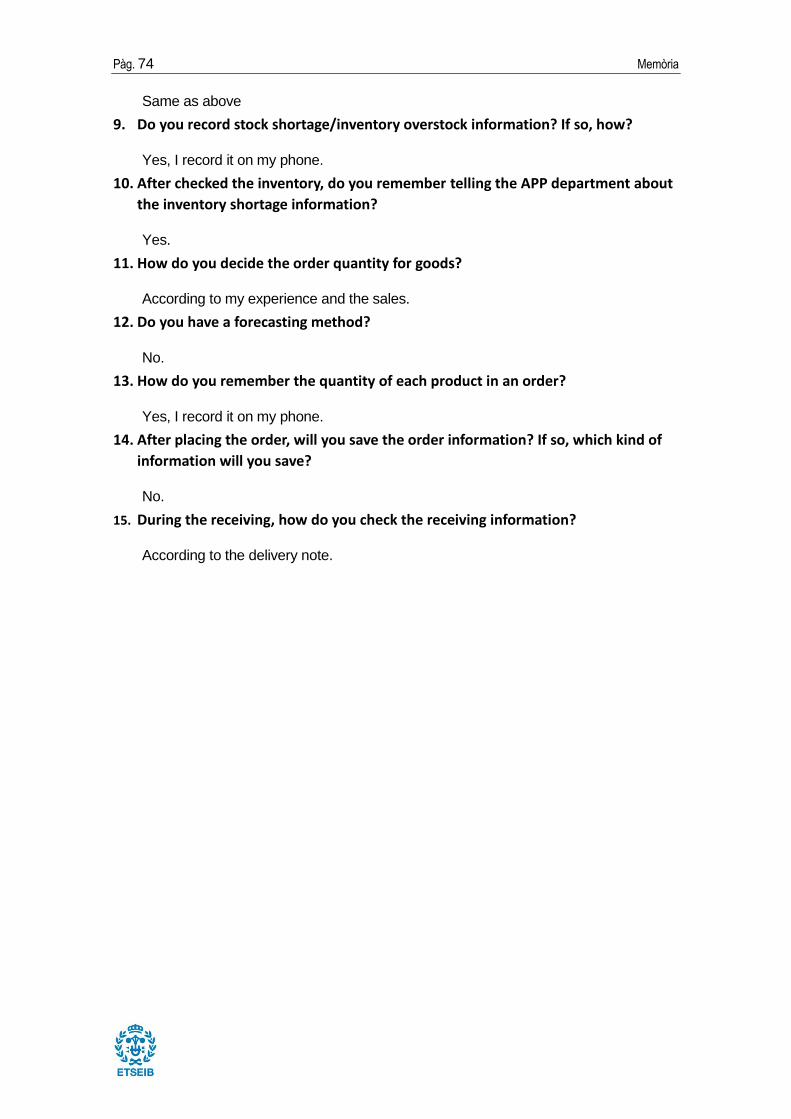
Pà g. 74 Memò ria
Same as above
9. Do you record stock shortage/inventory overstock information? If so, how?
Yes, I record it on my phone.
10. After checked the inventory, do you remember telling the APP department about
the inventory shortage information?
Yes.
11. How do you decide the order quantity for goods?
According to my experience and the sales.
12. Do you have a forecasting method?
No.
13. How do you remember the quantity of each product in an order?
Yes, I record it on my phone.
14. After placing the order, will you save the order information? If so, which kind of
information will you save?
No.
15. During the receiving, how do you check the receiving information?
According to the delivery note.
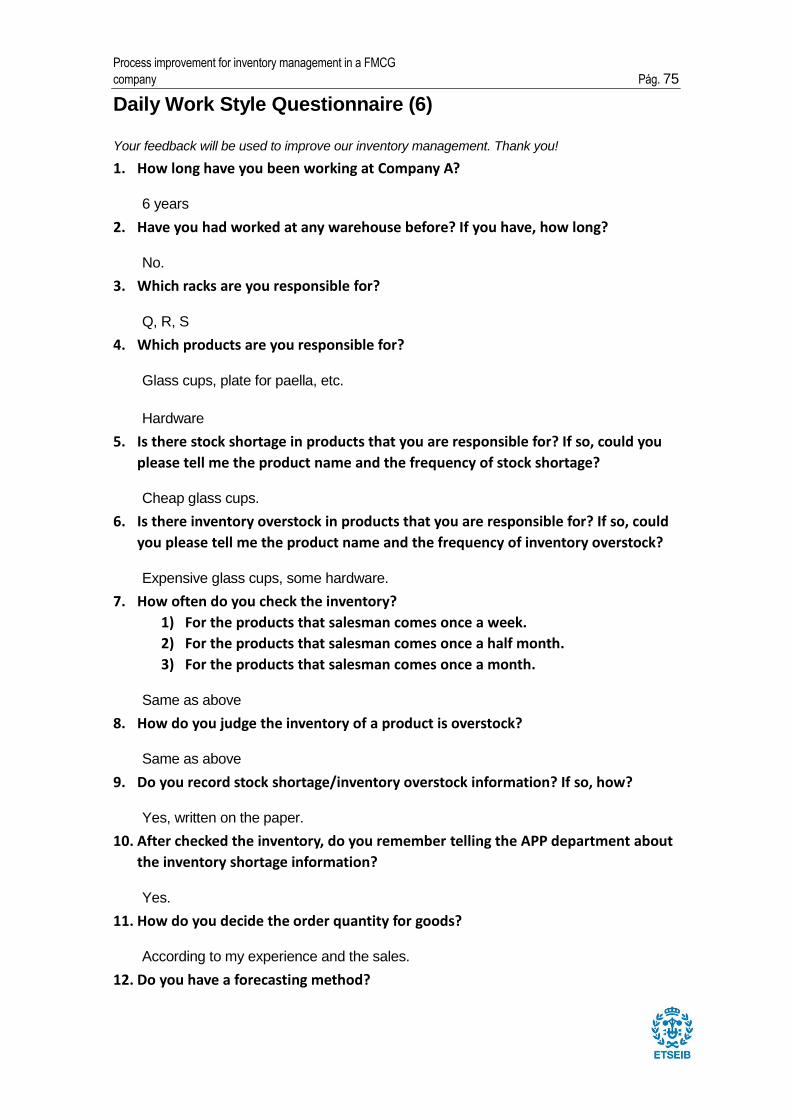
Process improvement for inventory management in a FMCG
company Pá g. 75
Daily Work Style Questionnaire (6)
Your feedback will be used to improve our inventory management. Thank you!
1. How long have you been working at Company A?
6 years
2. Have you had worked at any warehouse before? If you have, how long?
No.
3. Which racks are you responsible for?
Q, R, S
4. Which products are you responsible for?
Glass cups, plate for paella, etc.
Hardware
5. Is there stock shortage in products that you are responsible for? If so, could you
please tell me the product name and the frequency of stock shortage?
Cheap glass cups.
6. Is there inventory overstock in products that you are responsible for? If so, could
you please tell me the product name and the frequency of inventory overstock?
Expensive glass cups, some hardware.
7. How often do you check the inventory?
1) For the products that salesman comes once a week.
2) For the products that salesman comes once a half month.
3) For the products that salesman comes once a month.
Same as above
8. How do you judge the inventory of a product is overstock?
Same as above
9. Do you record stock shortage/inventory overstock information? If so, how?
Yes, written on the paper.
10. After checked the inventory, do you remember telling the APP department about
the inventory shortage information?
Yes.
11. How do you decide the order quantity for goods?
According to my experience and the sales.
12. Do you have a forecasting method?

Pà g. 76 Memò ria
No.
13. How do you remember the quantity of each product in an order?
I wrote them on the paper.
14. After placing the order, will you save the order information? If so, which kind of
information will you save?
No.
15. During the receiving, how do you check the receiving information?
According to the delivery note.
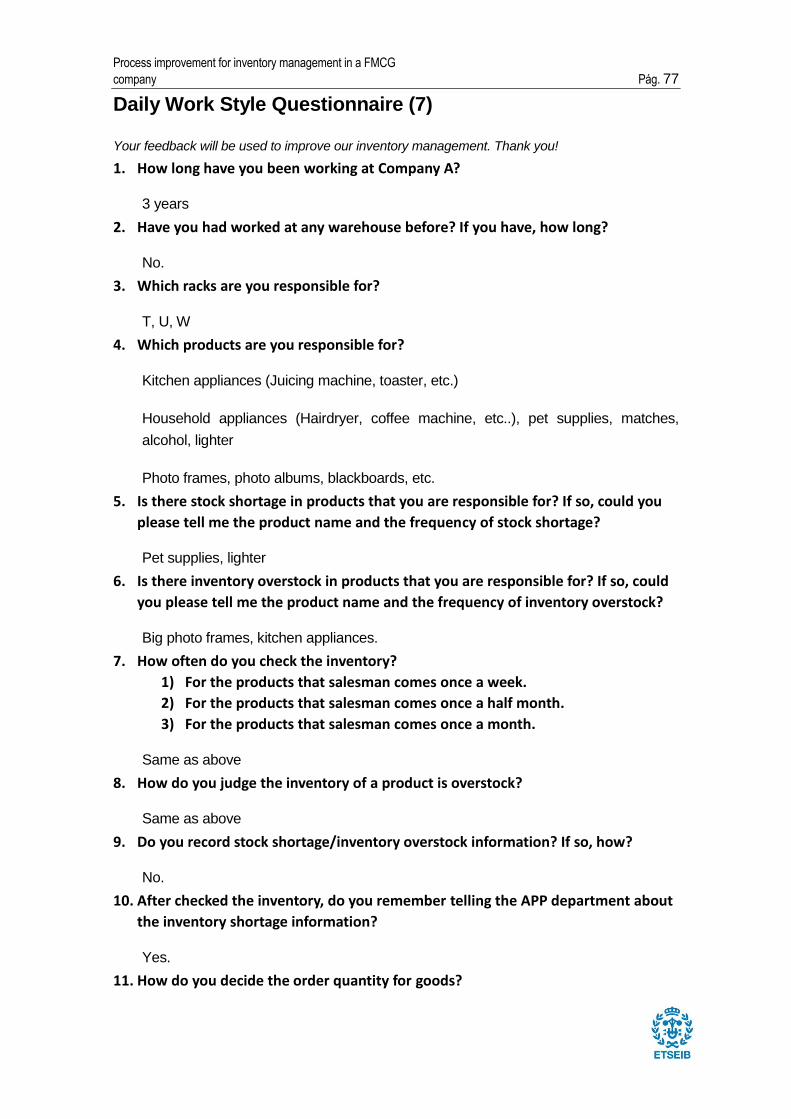
Process improvement for inventory management in a FMCG
company Pá g. 77
Daily Work Style Questionnaire (7)
Your feedback will be used to improve our inventory management. Thank you!
1. How long have you been working at Company A?
3 years
2. Have you had worked at any warehouse before? If you have, how long?
No.
3. Which racks are you responsible for?
T, U, W
4. Which products are you responsible for?
Kitchen appliances (Juicing machine, toaster, etc.)
Household appliances (Hairdryer, coffee machine, etc..), pet supplies, matches,
alcohol, lighter
Photo frames, photo albums, blackboards, etc.
5. Is there stock shortage in products that you are responsible for? If so, could you
please tell me the product name and the frequency of stock shortage?
Pet supplies, lighter
6. Is there inventory overstock in products that you are responsible for? If so, could
you please tell me the product name and the frequency of inventory overstock?
Big photo frames, kitchen appliances.
7. How often do you check the inventory?
1) For the products that salesman comes once a week.
2) For the products that salesman comes once a half month.
3) For the products that salesman comes once a month.
Same as above
8. How do you judge the inventory of a product is overstock?
Same as above
9. Do you record stock shortage/inventory overstock information? If so, how?
No.
10. After checked the inventory, do you remember telling the APP department about
the inventory shortage information?
Yes.
11. How do you decide the order quantity for goods?
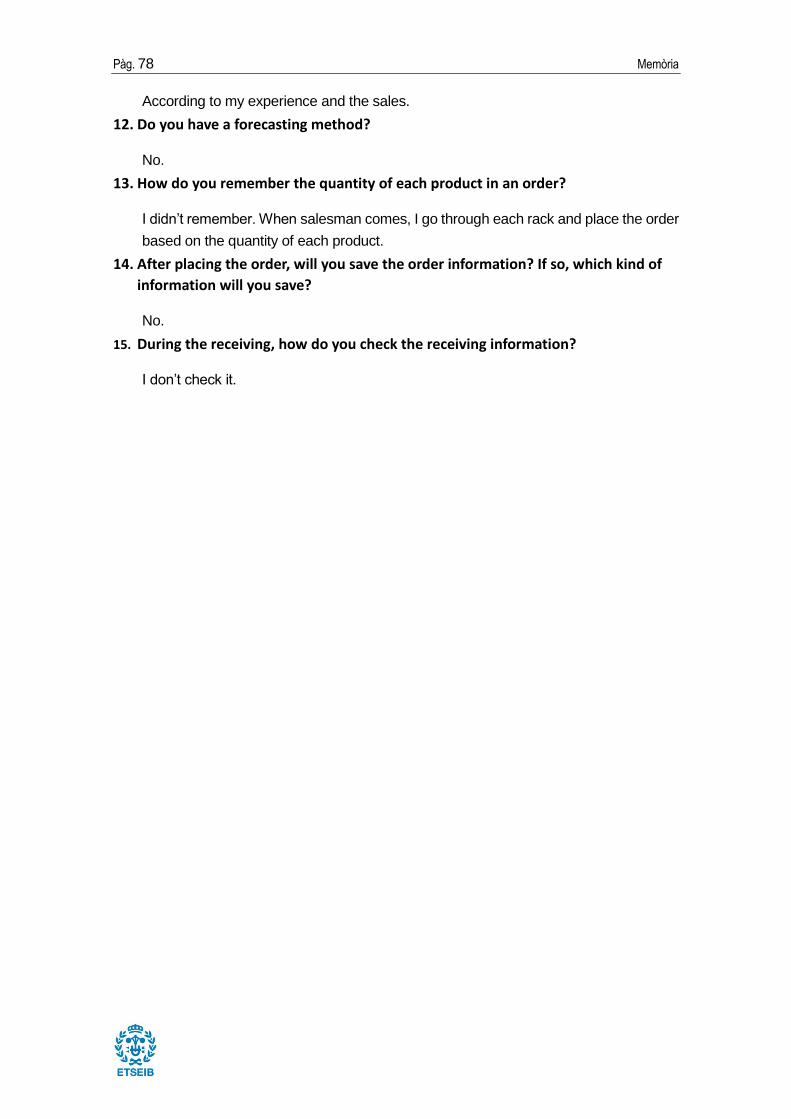
Pà g. 78 Memò ria
According to my experience and the sales.
12. Do you have a forecasting method?
No.
13. How do you remember the quantity of each product in an order?
I didn’t remember. When salesman comes, I go through each rack and place the order
based on the quantity of each product.
14. After placing the order, will you save the order information? If so, which kind of
information will you save?
No.
15. During the receiving, how do you check the receiving information?
I don’t check it.
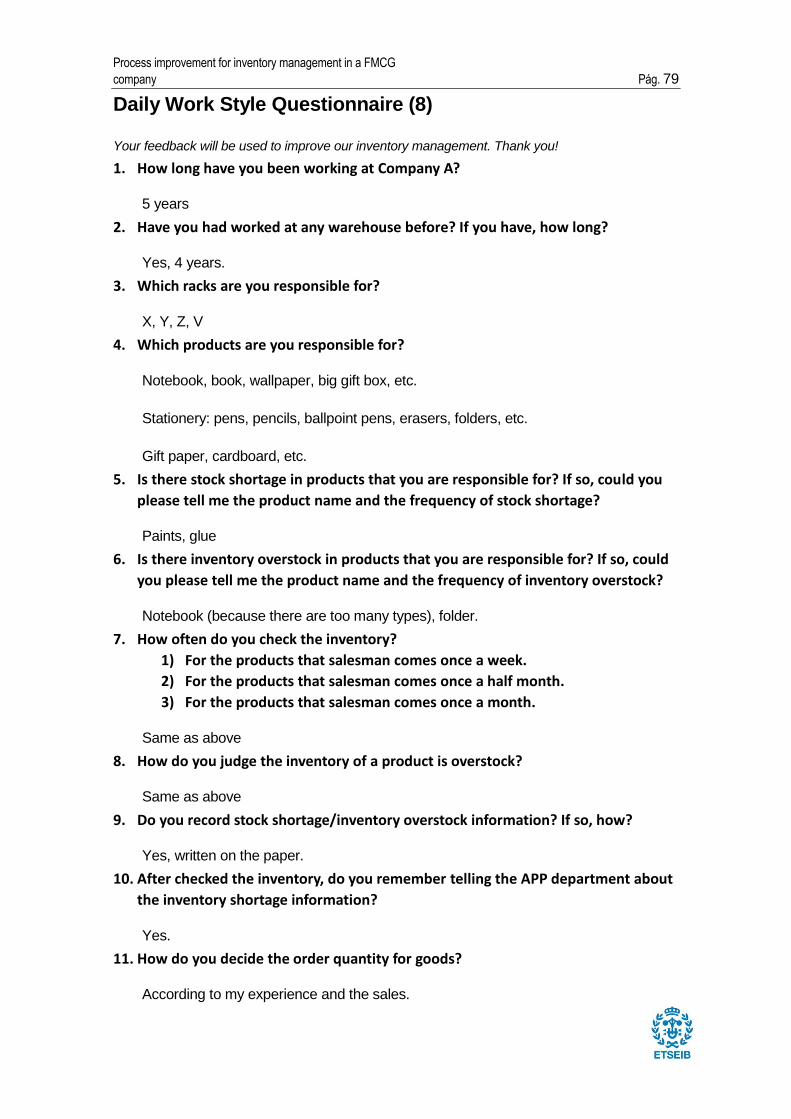
Process improvement for inventory management in a FMCG
company Pá g. 79
Daily Work Style Questionnaire (8)
Your feedback will be used to improve our inventory management. Thank you!
1. How long have you been working at Company A?
5 years
2. Have you had worked at any warehouse before? If you have, how long?
Yes, 4 years.
3. Which racks are you responsible for?
X, Y, Z, V
4. Which products are you responsible for?
Notebook, book, wallpaper, big gift box, etc.
Stationery: pens, pencils, ballpoint pens, erasers, folders, etc.
Gift paper, cardboard, etc.
5. Is there stock shortage in products that you are responsible for? If so, could you
please tell me the product name and the frequency of stock shortage?
Paints, glue
6. Is there inventory overstock in products that you are responsible for? If so, could
you please tell me the product name and the frequency of inventory overstock?
Notebook (because there are too many types), folder.
7. How often do you check the inventory?
1) For the products that salesman comes once a week.
2) For the products that salesman comes once a half month.
3) For the products that salesman comes once a month.
Same as above
8. How do you judge the inventory of a product is overstock?
Same as above
9. Do you record stock shortage/inventory overstock information? If so, how?
Yes, written on the paper.
10. After checked the inventory, do you remember telling the APP department about
the inventory shortage information?
Yes.
11. How do you decide the order quantity for goods?
According to my experience and the sales.
Pà g. 80 Memò ria
12. Do you have a forecasting method?
No.
13. How do you remember the quantity of each product in an order?
I wrote them on the paper.
14. After placing the order, will you save the order information? If so, which kind of
information will you save?
No.
15. During the receiving, how do you check the receiving information?
According to the delivery note.
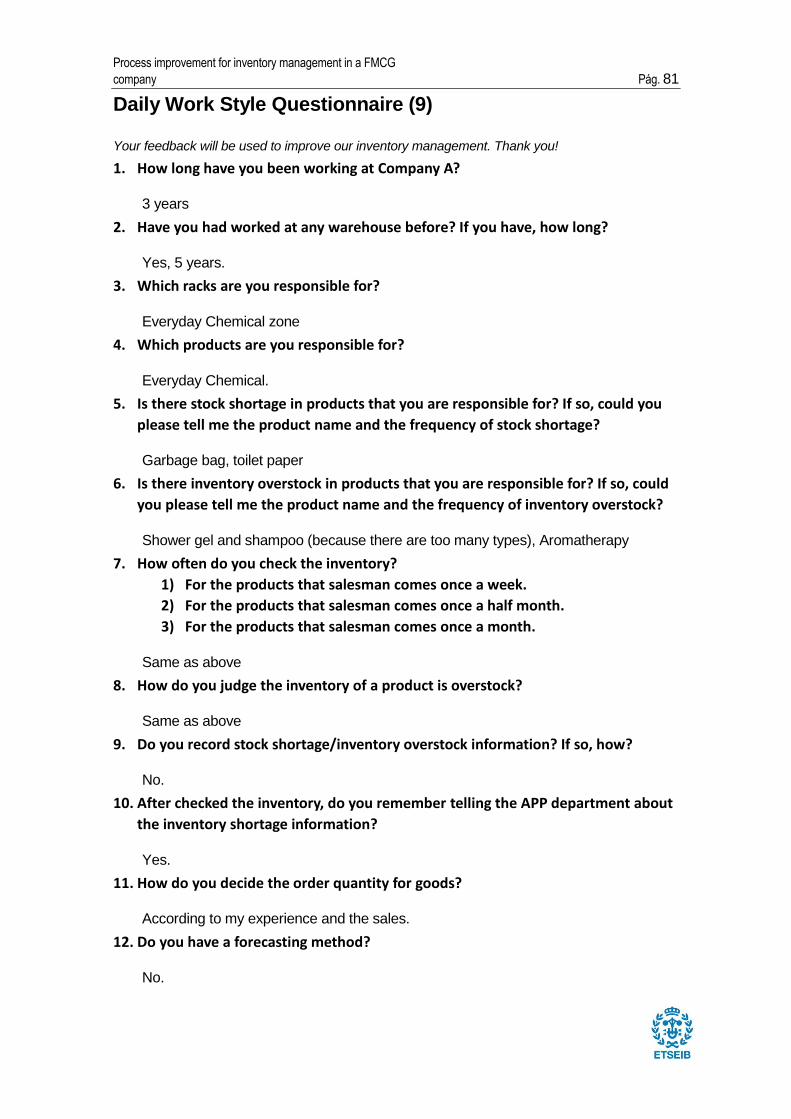
Process improvement for inventory management in a FMCG
company Pá g. 81
Daily Work Style Questionnaire (9)
Your feedback will be used to improve our inventory management. Thank you!
1. How long have you been working at Company A?
3 years
2. Have you had worked at any warehouse before? If you have, how long?
Yes, 5 years.
3. Which racks are you responsible for?
Everyday Chemical zone
4. Which products are you responsible for?
Everyday Chemical.
5. Is there stock shortage in products that you are responsible for? If so, could you
please tell me the product name and the frequency of stock shortage?
Garbage bag, toilet paper
6. Is there inventory overstock in products that you are responsible for? If so, could
you please tell me the product name and the frequency of inventory overstock?
Shower gel and shampoo (because there are too many types), Aromatherapy
7. How often do you check the inventory?
1) For the products that salesman comes once a week.
2) For the products that salesman comes once a half month.
3) For the products that salesman comes once a month.
Same as above
8. How do you judge the inventory of a product is overstock?
Same as above
9. Do you record stock shortage/inventory overstock information? If so, how?
No.
10. After checked the inventory, do you remember telling the APP department about
the inventory shortage information?
Yes.
11. How do you decide the order quantity for goods?
According to my experience and the sales.
12. Do you have a forecasting method?
No.
Pà g. 82 Memò ria
13. How do you remember the quantity of each product in an order?
I didn’t remember. When salesman comes, I go through each rack and place the order
based on the quantity of each product.
14. After placing the order, will you save the order information? If so, which kind of
information will you save?
No.
15. During the receiving, how do you check the receiving information?
According to the delivery note.
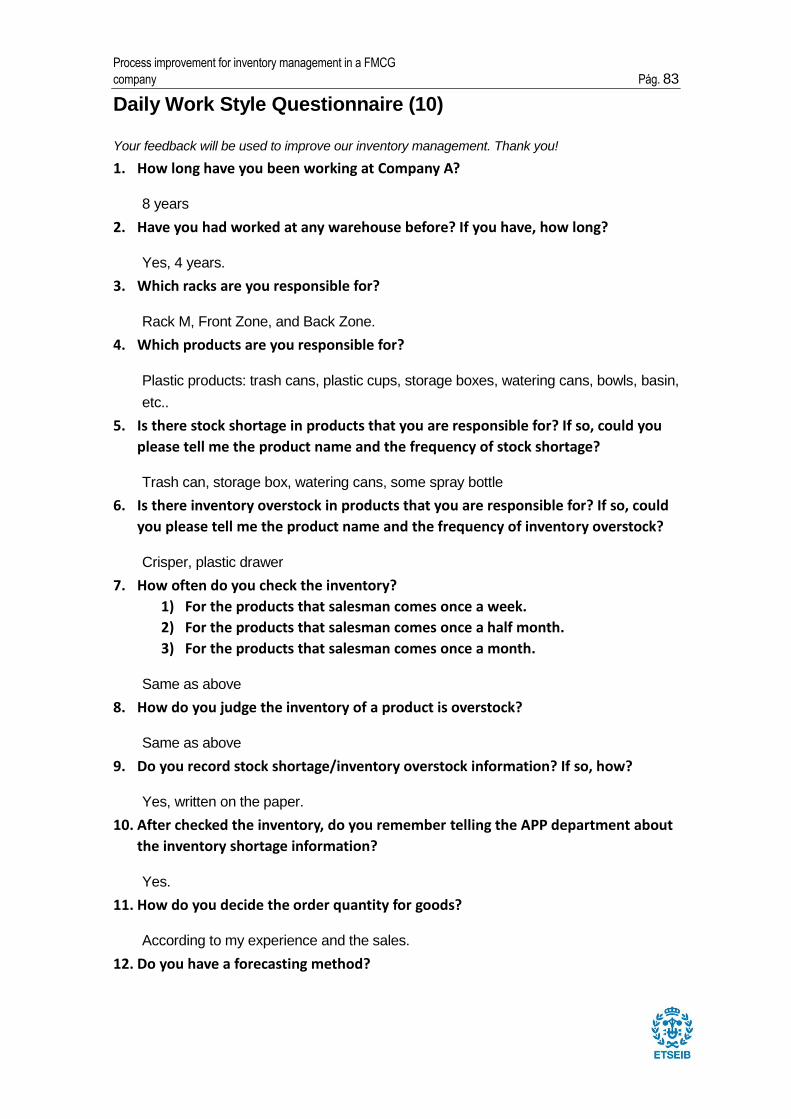
Process improvement for inventory management in a FMCG
company Pá g. 83
Daily Work Style Questionnaire (10)
Your feedback will be used to improve our inventory management. Thank you!
1. How long have you been working at Company A?
8 years
2. Have you had worked at any warehouse before? If you have, how long?
Yes, 4 years.
3. Which racks are you responsible for?
Rack M, Front Zone, and Back Zone.
4. Which products are you responsible for?
Plastic products: trash cans, plastic cups, storage boxes, watering cans, bowls, basin,
etc..
5. Is there stock shortage in products that you are responsible for? If so, could you
please tell me the product name and the frequency of stock shortage?
Trash can, storage box, watering cans, some spray bottle
6. Is there inventory overstock in products that you are responsible for? If so, could
you please tell me the product name and the frequency of inventory overstock?
Crisper, plastic drawer
7. How often do you check the inventory?
1) For the products that salesman comes once a week.
2) For the products that salesman comes once a half month.
3) For the products that salesman comes once a month.
Same as above
8. How do you judge the inventory of a product is overstock?
Same as above
9. Do you record stock shortage/inventory overstock information? If so, how?
Yes, written on the paper.
10. After checked the inventory, do you remember telling the APP department about
the inventory shortage information?
Yes.
11. How do you decide the order quantity for goods?
According to my experience and the sales.
12. Do you have a forecasting method?
Pà g. 84 Memò ria
No.
13. How do you remember the quantity of each product in an order?
I wrote them on the paper.
14. After placing the order, will you save the order information? If so, which kind of
information will you save?
No.
15. During the receiving, how do you check the receiving information?
No, the goods are stable, so the quantity of each order is almost the same.