Embed Size (px)
DESCRIPTION
operations
Citation preview

PROCESS MANAGEMENT AND IMPROVEMENT THROUGH OPERATIONS
Dr. Jitendra SharmaProfessor - OperationsIMT - Nagpur

SESSIONS OBJECTIVES
To know what is actually a process Categorize activities in the process What is value add; non value add & required non value add? What are wastes and how to identify them What are process parameters How to read a process How to make changes in process What is process analysis What are the ways and means we can do process analysis?

PROCESS PARAMETERS Process: Is any part of an organization that takes inputs and
transforms them into outputs Capacity: Maximum capability to produce; is affected by the
mix of product or services, the choice of technology, the size of a facility, and the resource allocated
Rated/Designed/Theoretical, Utilized, Effective Capacity/Actual Utilization: Is the ratio of the time that a resource is actually
activated relative to the time that it is available for use Efficiency: Ratio of the actual output of a process relative to
some standard Productivity: Productivity is the ratio of outputs divided by the
inputs (resources)

PROCESS MANAGEMENT SKILLS All functions need to manage processes Management education teaches the basic, fundamental
and technical aspects It does not teach as to how to run a factory process or a
marketing process or an accounting process At the end of the day, org’ns runs the processes that
delivers some kind of goods or services, if not to the customers directly at-least internally known as internal services
Therefore it is very important to know about processes, and as to how to build competencies and capabilities within the processes

PROCESS SKILLS So we can say that everybody is concerned with building
capabilities and they do it because everybody is concerned with building processes
Managers should, invariably, posses an important skill which traditionally they are very bad at – internally managing process that delivers goods and services efficiently and effectively
For that you need to understand your processes – as they inside out – you should know about loading, capacity, bottlenecks, flexibility, service quality, etc.
There are certain fundamental and basic laws of behavior of a processes

TYPES OF ACTIVITIES IN ANY SET UP Value adding activities Non value adding activities
OverproductionUnnecessary inventoryTransportProcessesActivity resulting in rejects/scrapWaitingUnnecessary motion
Required non value adding activities

VALUE ADDING ACTIVITY Is the one which when carried out makes the product
more complete Work is the activity that generates revenue by causing
the product to change form to a more complete state Product is actually being built Customer values these acts, and are willing to pay to
have them performed The bottom line is that when we do this we get money
for doing them This brings us revenue and generates profits, and keeps
us alive

NON VALUE ADDING ACTIVITIES Non value added is an activity which does not advance the
product to a more complete or finished state It adds no value in the eye of customer and he is not willing to
pay for such activity; Adds to the costs and reduces profitability There are seven categories of NVAA known as WASTE
Overproduction – unnecessary production which wont sale Inventory – idle resources Transport – moving stuff from place to place Processes – incorrect tooling, setup times, changeovers Activity resulting in rejects/scrap – work till the point you get it wrong Waiting – just being idle Unnecessary motion – refers to people, ergonomics, etc.
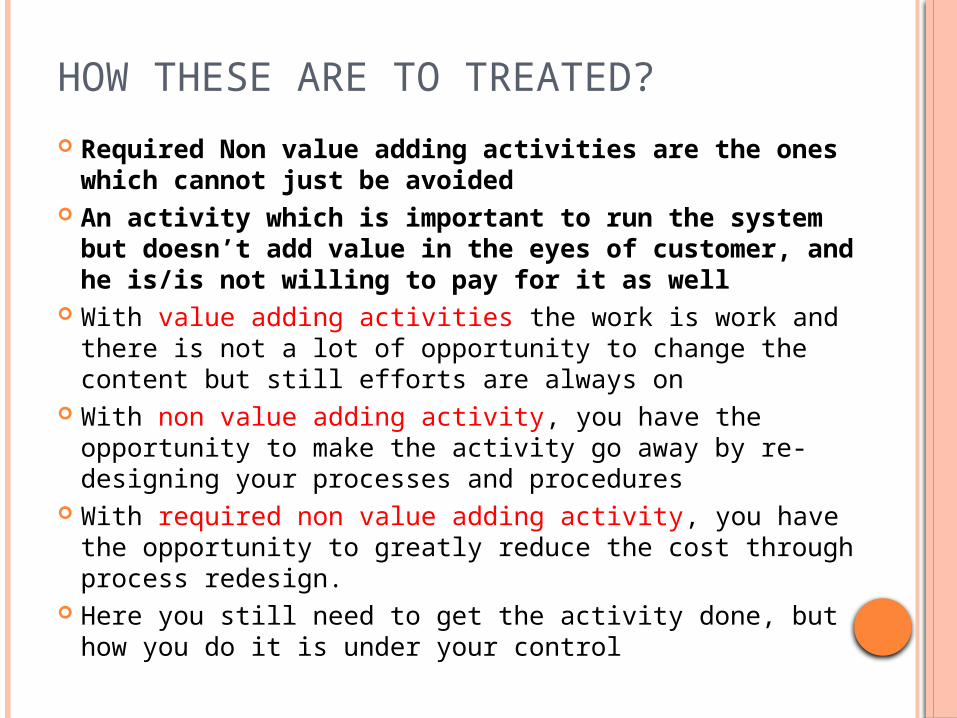
HOW THESE ARE TO TREATED? Required Non value adding activities are the ones which cannot
just be avoided An activity which is important to run the system but doesn’t add
value in the eyes of customer, and he is/is not willing to pay for it as well
With value adding activities the work is work and there is not a lot of opportunity to change the content but still efforts are always on
With non value adding activity, you have the opportunity to make the activity go away by re-designing your processes and procedures
With required non value adding activity, you have the opportunity to greatly reduce the cost through process redesign.
Here you still need to get the activity done, but how you do it is under your control

PROCESS PARAMETERS Cycle Time: Is the average successive time between
completions of successive units Setup time: is the time required to prepare a machine to
make a particular item Run time: is the time required to produce a batch of parts Operation time: is sum of the setup time and run time for a
batch of parts that run on a machine Queue time and Waiting time Pacing: Refers to the fixed timing of the movement of
items through the process Bottleneck: Capacity or any other ‘constraint’/limiting
factor

IMPACT OF PROCESS FLOW Lead time is the length of time it takes to process an order
through the system From the view point of customer – the time taken from the
placement of order to the delivery of the same Bottleneck is your capacity constraint A constraint as we all know is a limiting factor in your process When you keep on improving your processes your bottleneck
keep getting shifted from one process to the other Visual idea of a constraint
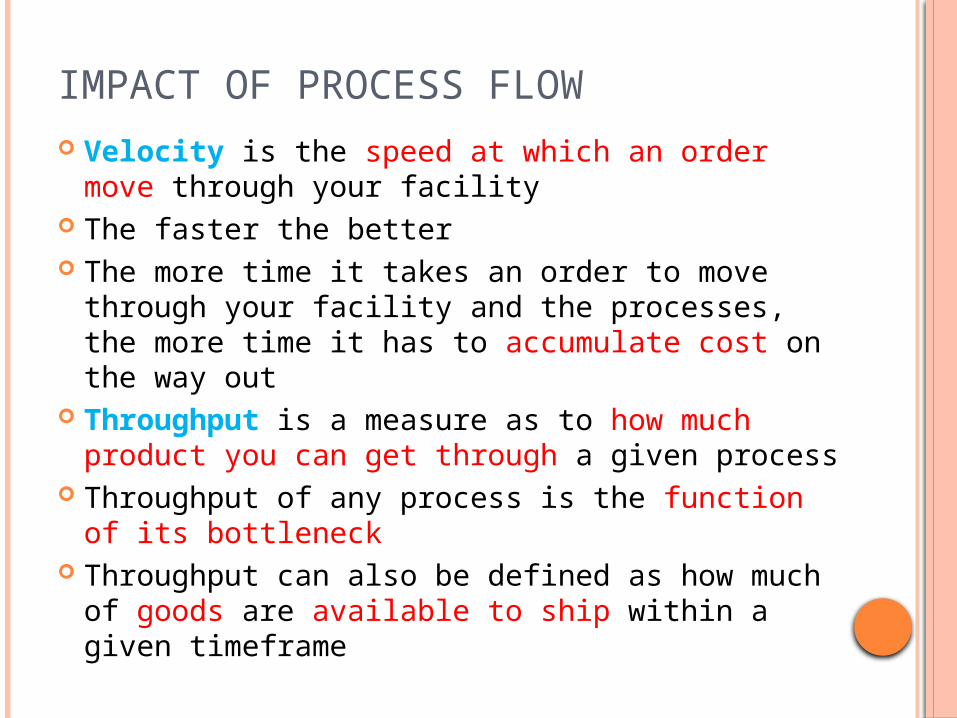
IMPACT OF PROCESS FLOW Velocity is the speed at which an order move through
your facility The faster the better The more time it takes an order to move through your
facility and the processes, the more time it has to accumulate cost on the way out
Throughput is a measure as to how much product you can get through a given process
Throughput of any process is the function of its bottleneck Throughput can also be defined as how much of goods are
available to ship within a given timeframe

BlockingOccurs when the activities in a stage must stop because there
is no place to deposit the item just completed If there is no room for an employee to place a unit of work
down, the employee will hold on to it not able to continue working on the next unit
StarvingOccurs when the activities in a stage must stop because there
is no work If an employee is waiting at a work station and no work is
coming to the employee to process, the employee will remain idle until the next unit of work comes
PROCESS PARAMETERS

PROCESS PERFORMANCE METRICS Operation time = Setup time + Run time Throughput rate = 1 .
Cycle time Efficiency = Actual output
Standard Output
Productivity = Output Input
Utilization = Time Activated Time Available
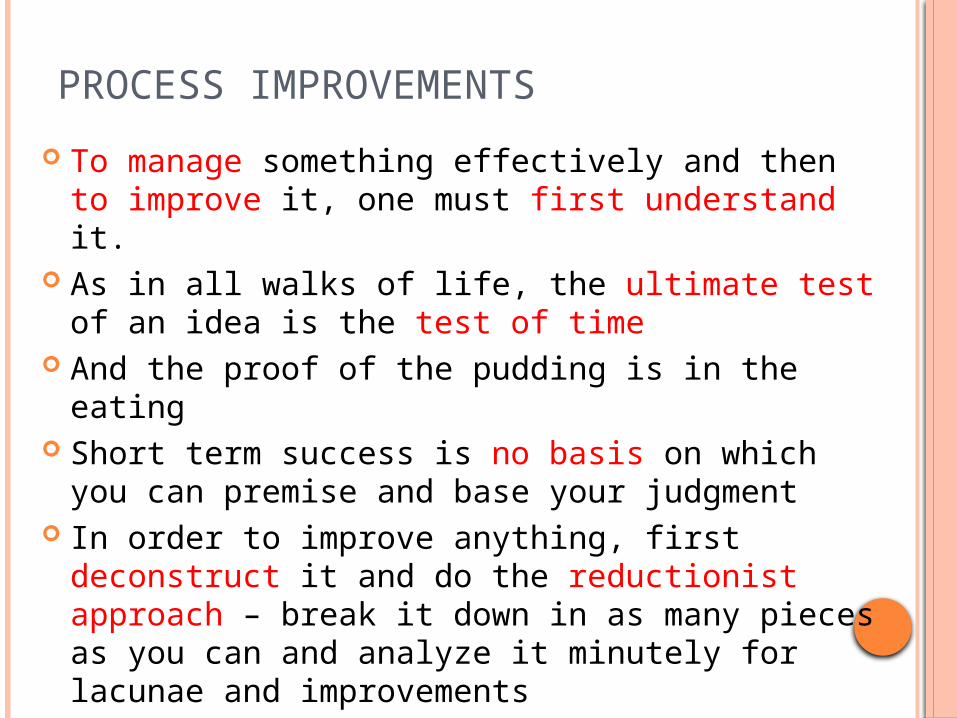
PROCESS IMPROVEMENTS To manage something effectively and then to improve it, one
must first understand it. As in all walks of life, the ultimate test of an idea is the test of
time And the proof of the pudding is in the eating Short term success is no basis on which you can premise and
base your judgment In order to improve anything, first deconstruct it and do the
reductionist approach – break it down in as many pieces as you can and analyze it minutely for lacunae and improvements

For designing and analyzing process to transform inputs into goods or services, one should ask following questions -
Is the process designed to achieve some competitive advantage?
Does the process eliminate all non-value adding activities?
Can the process be broken down and improved further upon?
Does the process adds value as per the customers perception?
Will this process win the orders?
There are number of tools which makes sense of ‘what is happening’ and tells us ‘what should happen’…
PROCESS ANALYSIS AND DESIGN

Flow Diagrams - Shows the movement of materials and provides an overall view of the big picture
Process Charts - Uses symbols to show key activities and in much more detailed fashion
Time-Function Mapping - Shows flows and time frame; adds rigor and a time element
Service Blueprinting - focuses on customer/provider interaction; focuses on three different levels of interaction; highlights potential failure points.
PROCESS ANALYSIS AND DESIGN

PROCESS FLOW DIAGRAMS Process flow diagrams is the schematic
representation of the major elements of a process The basic elements can include tasks or operations,
flows of materials or customers, decision points, and storage areas or queues
It is an ideal methodology by which to begin analyzing a process

Tasks or operationsExamples: Giving an admission ticket to a customer, installing a engine in a car, etc.
Decision Points
Examples: How much change should be given to a customer, which wrench should be used, etc.
Process Flow Diagrams

Examples: lines of people waiting for a service, even temporary storage, etc.
Examples: Customers moving to a seat, mechanic getting a tool, etc.
Storage areas or queues
Flows of materials or customers
Process Flow Diagrams


Process Flowchart Symbols
Operations
Inspection
Transportation
Delay
Storage


PROCESS FLOW - EXAMPLE


Thanks…