Embed Size (px)
Citation preview
Procyclical Finance: The Money View∗
Ye Li†
November 19, 2017
Abstract
Banks are important because agents hold their debts (“inside money”) as liquidity buffer.
Banking crises are costly because the contraction of inside money supply compromises firms’
liquidity management and hurts investment. By highlighting the interaction between banks and
firms in the money market, this paper offers a theory of procyclical inside money creation and
the resulting instability. It sheds light on the cyclicality of bank leverage, and how it affects
the frequency and duration of banking crises. Introducing outside money (government debt)
to alleviate liquidity shortage can be counterproductive, because its competition with inside
money destabilizes the banking sector.
∗I am indebted to my advisors at Columbia University, Patrick Bolton, Tano Santos, and Jose A. Scheinkman,for their invaluable guidance. I also thank Tobias Adrian, Geert Bekaert, Nina Boyarchenko, Markus Brunnermeier,Charles Calomiris, Murillo Campello, Guojun Chen, Gilles Chemla, Dong Beom Choi, Nicolas Crouzet, OlivierM. Darmouni, Ian Dew-Becker, Douglas Diamond, William Diamond, John Donaldson, Lars Peter Hansen, ZhiguoHe, Harrison Hong, Yunzhi Hu, Yi Huang, Gur Huberman, Christian Julliard, Peter Kondor, Arvind Krishnamurthy,Siyuan Liu, Marco Di Maggio, Harry Mamaysky, Konstantin Milbradt, Emi Nakamura, Martin Oehmke, MitchellPetersen, Tomasz Piskorski, Vincenzo Quadrini, Adriano A. Rampini, Raghuram Rajan, Jean-Charles Rochet, JonSteinsson, Amir Sufi, Huijun Sun, Suresh Sundaresan, Harald Uhlig, Dimitri Vayanos, S. Viswanathan, Chen Wang,Neng Wang, Kathy Yuan, and Jing Zeng for helpful comments. I am grateful to seminar/conference participants atBecker Friedman Institute (University of Chicago), Chicago Booth, CEPR Credit Cycle Conference, Columbia Fi-nance Seminar, Columbia Economics Colloquium, New York Fed, Finance Theory Group, Georgetown McDonough,Gradudate Institute (Geneva), Imperial College, Johns Hopkins Carey, London School of Economics, Nanyang Tech-nological University, Northwestern Kellogg, NYU Stern PhD Seminar, OSU Fisher, Oxford Financial IntermediationTheory Conference, University of Melbourne, USC Marshall, and Wharton. I acknowledge the generous dissertationsupport from Macro Financial Modeling Group of Becker Friedman Institute. All errors are mine.†The Ohio State University. E-mail: [email protected]
1 Introduction
In the years leading up to the Great Recession, the financial sector grew rapidly, setting a favorable
liquidity condition that stimulated the real economy. A booming real sector in turn fueled financial
intermediaries’ expansion and leverage. During the crisis, the spiral flipped. Much progress has
been made in recent years to characterize crisis dynamics by incorporating intermediaries in macro
models (e.g., He and Krishnamurthy (2013); Brunnermeier and Sannikov (2014)), yet a complete
account of procyclical intermediation, and in particular, the run-up to crisis, remains a challenge.
This paper argues that at the heart of this procyclicality is intermediaries’ role as money cre-
ators. The monetary aspect of financial intermediation is so ubiquitous that we often fail to notice.
Intermediary debt (e.g., bank deposits) is a store of value, but more importantly, it supports trade by
serving as a means of payment, or “inside money”.1 In an economy where agents’ future income
is not fully pledgeable, money facilitates spot transactions and resource reallocation. However, the
money demand of the real sector feeds leverage to the financial sector, and thus, breeds instability.
I build a continuous-time model of macroeconomy that crystallizes this money view of fi-
nancial intermediation. A key ingredient is the money demand from firms’ liquidity management
problem that is similar to Holmstrom and Tirole (1998). Banks supply money by issuing debt, and
thus, build up leverage in the process. The dynamic interaction between money demand and supply
generates a rich set of unique predictions, such as bank leverage cycle, money premium dynamics,
endogenous risk accumulation in booms, stagnant recessions, and investment inefficiencies.
The idea that financial intermediaries affect the real economy through inside money supply
goes back at least to the classic account of the Great Depression by Friedman and Schwartz (1963).
One may argue that this money view is less relevant today given the active supply of outside money
in the form of liquid government securities and central bank liabilities (Woodford (2010)). How-
ever, the model shows that competition between inside and outside money destabilizes the banking
sector by amplifying its leverage cycle, making booms more fragile and prolonging crises. These
results complement the literature on outside money as a means to financial stability (Greenwood,
1The term “inside money” is from Gurley and Shaw (1960). From the private sector’s perspective, fiat money andgovernment securities are in positive supply (“outside money”), while bank deposits are in zero net supply (“insidemoney”). Both outside and inside money facilitate transactions. Lagos (2008) briefly reviews the concept.
1
Hanson, and Stein (2015); Krishnamurthy and Vissing-Jørgensen (2015); Woodford (2016)).
The model economy operates in continuous time. It has three types of agents: bankers,
entrepreneurs (“firms”), and households who play a limited role. All agents are risk-neutral with
the same time discount rate, and consume nonstorable generic goods produced by firms’ capital.
Firms can hold capital and bank deposits, and borrow from banks and households as long
as they are not hit by liquidity shocks. Every instant, firms face a constant probability of liquidity
shock, and in such an event, their production halts, and their capital can either grow – if further
investment is made – or perish, if not. This investment is not pledgeable, so firms can only obtain
goods (investment inputs) from others in spot transactions, using deposits as means of payment.
Therefore, banks add value because their debts (deposits) facilitate trade and resource reallocation.
Bankers issue deposits that are short-term risk-free debts, and extend loans to firms that are
backed by designated capital as collateral. Every instant, a random fraction of capital collateral is
destroyed, and the corresponding loans default. The only aggregate shock is a Brownian motion
that drives this stochastic destruction of capital. Money creation requires risk-taking, because at
the margin, one more dollar of deposits is backed by one more dollar of risky loan. Therefore,
inside money supply depends on bank equity as risk buffer. Bankers may raise equity subject to
an issuance cost. This friction ties the supply of inside money to the current level of bank equity.
When bad shocks leave more loans in default and deplete bank equity, the supply of inside money
declines, which hurts firms’ liquidity management and investment.
The model has a Markov equilibrium with the ratio of bank equity to firm capital as state
variable, which is intuitively the size of money suppliers relative to money demanders. Because
banks have leveraged exposure to the capital destruction shock, this state variable rises following
good shocks, and falls following bad shocks. It is also bounded by two endogenous boundaries:
when the banking sector is small, bankers raise equity because the marginal value of equity reaches
one plus the issuance cost (lower boundary); when the banking sector is large, the marginal value of
equity falls to one, so bankers consume and pay out dividends to shareholders (upper boundary).2
2As in Phelan (2016) and Klimenko et al. (2016), banks issue equity in bad times, and pay out dividends in goodtimes, which is consistent with the evidence in Baron (2014) and Adrian, Boyarchenko, and Shin (2015).
2
Bank leverage is procyclical.3 Good shocks increase bank equity, but banks issue even more
debt to meet firms’ procyclical money demand. Good shock means less loans default than expected.
Banks hoard the windfall instead of paying it out because the issuance cost creates a wedge between
the value of retained equity and one dollar (payout value). Thus, shock impact dissipates gradu-
ally. Expecting banks to be better capitalized and to issue more money going forward, firms foresee
themselves to carry more money in the future that will then finance faster capital growth. Thereby,
capital becomes more valuable, inducing firms to hold more money now in case the liquidity shock
arrives the very next instant. In sum, firms’ money demand exhibits intertemporal complemen-
tarity. Asset price (capital value) plays a key role here, feeding the expectation of future money
market conditions into the current money demand of firms. By strengthening the procyclicality of
money demand and bank leverage, endogenous asset price has a unique destabilizing effect that is
distinct from the typical balance-sheet channel (e.g., Brunnermeier and Sannikov (2014)).
Downside risk accumulates through procyclical leverage.4 As banks become more levered,
their equity is more sensitive to shocks. And, as the economy approaches bank payout boundary,
high leverage only serves to amplify bad shocks, because good shocks cannot increase bank equity
above the boundary without triggering payout. The longer booms last, the higher downside risk is.
Crises are stagnant. As the economy approaches bank issuance boundary, low bank leverage
only serves to dampen good shocks, because bank equity never falls below the issuance boundary.
Therefore, banks can only rebuild equity after a sequence of sufficiently large good shocks. The
calibrated model predicts an eight-year recovery period, during which the economy is stuck with
insufficient money supply that compromises firms’ liquidity management. In sum, fragile booms
and stagnant crises result from a combination of procyclical leverage and the asymmetric impact
of shocks near the reflecting boundaries given by bank payout and equity issuance policies.
So far, we have focused on the procyclical quantity of inside money. The model also gen-
erates a countercyclical price of money, the money premium, which is a spread between the time
discount rate and deposit rate. Borrowing at an interest rate lower than the time discount rate, banks
3The leverage here is the ratio of book asset to book equity, as will be clearly defined in the model.4Intermediary leverage does not exhibit procyclicality in models that feature a static demand for intermediary
debt and focus on the asset-side of intermediary balance sheet for channels of shock amplification (e.g. He andKrishnamurthy (2013); Brunnermeier and Sannikov (2014); Phelan (2016); Klimenko et al. (2016)).
3
earn the money premium. Carrying low-yield deposits, firms pay the money premium, which is a
cost of liquidity management, but they optimally do so in anticipation of transaction needs.
Another important theme of this paper is the financial stability implications of outside money.
I model outside money as government debt that offers the same monetary service to firms as bank
deposits. Its empirical counterparts include a broad range of liquid government securities, not just
central bank liabilities.5 To highlight the competition between inside and outside money, I abstract
away other fiscal distortions by assuming the debt issuance proceeds are paid to agents as lump-
sum transfer and debt is repaid with lump-sum tax. Outside money decreases the money premium
in every state of the world, which seems to indicate a more favorable condition for firms and more
investments as a result. However, the impact of outside money depends on how banks respond.
By lowering the money premium, outside money increases banks’ debt cost, and thereby,
decreases the net interest margin. This profit crowding-out effect amplifies bank leverage cycle.
In the states where banks are well capitalized and willing to take risks, they raise leverage even
higher, so that on average, return on equity (i.e., net interest margin multiplied by leverage) is still
high enough to justify the occasionally incurred cost of equity issuance. The crowding-out effect
can also lengthen the crisis. With lower profit, banks become more reluctant to raise equity, which
translates into a lower equity issuance boundary. And, with lower return on equity, it takes more
time for banks to rebuild equity through retained earnings.
With booms being more fragile and crises more stagnant, the economy spends more time
in states where banks are undercapitalized and inside money creation depressed. Unless outside
money satiates firms’ money demand, the economy still relies on banks as the marginal suppliers
of money. Therefore, even if outside money increases the total money supply in every state of the
world, by shifting the probability mass to relatively worse states, it can lead to a lower average
money supply over the cycles, and thus, hurt resource reallocation and welfare in the long run.
Related literature. Financial intermediaries provide liquidity – the ease of transferring resources
over time and between agents. They finance projects (supply credit) and issue securities that fa-
5The monetary service of government liabilities is an old theme (e.g., Patinkin (1965); Friedman (1969)). Re-cent contributions include Bansal and Coleman (1996), Bansal, Coleman, and Lundblad (2011), Krishnamurthy andVissing-Jørgensen (2012), Greenwood, Hanson, and Stein (2015), Bolton and Huang (2016), and Nagel (2016).
4
cilitate trade (supply money). The cost of liquidity is zero in the frictionless world of Modigliani
and Miller (1958), but in reality, we rely on intermediaries to supply money and credit, and due to
their limited balance-sheet capacity, they earn a spread. This paper focuses on money supply. It
advances an old tradition in macroeconomics by taking a corporate-finance approach, which em-
phasizes money as a store of value and a means of payment rather than a unit of account (the critical
ingredient of models with nominal rigidities, e.g., Christiano, Eichenbaum, and Evans (2005)).
A recent literature has revived the money view of financial intermediation by emphasizing
bank liabilities as stores of value and means of payment (Hart and Zingales (2014); Brunnermeier
and Sannikov (2016); Donaldson, Piacentino, and Thakor (2016); Piazzesi and Schneider (2017);
Quadrini (2017)).6 This paper takes this money view of banking to understand the dynamic inter-
action between firms’ liquidity management and banks’ choice of leverage, frequency and duration
of crises, and how government debt may contribute to financial instability.
Because of the equity issuance cost, the model has a “balance-sheet channel”, through which
shock impact is persistent (e.g., Bernanke and Gertler (1989)).7 Bank net worth is important, which
is a feature shared with other models of balance-sheet channel.8 My model differs in two aspects.
First, asset price (capital value) plays a role in shock amplification through the intertemporal com-
plementarity of firms’ money holdings, instead of the typical balance-sheet impact (e.g., Brunner-
meier and Sannikov (2014)). Second, the demand for intermediary debt is dynamic, contributing to
the procyclicality of bank leverage and endogenous risk accumulation. In contrast, many models
have a static/passive demand for intermediary debt, so book leverage is countercyclical because
equity is more responsive to shocks than assets (e.g., He and Krishnamurthy (2013)).
Models that produce procyclical leverage often focus on the impact of asset price variations
on collateral or risk constraints (Brunnermeier and Pedersen (2009); Geanakoplos (2010); Adrian
6Several branches of literature provide microfoundations for bank debts serving as means of payment. Limitedcommitment (Kiyotaki and Moore (2002)) and imperfect record keeping (Kocherlakota (1998)) limits credit, so tradesmust engage in quid pro quo, involving a transaction medium. Banks overcome such problems and supply money (e.g.,Kiyotaki and Moore (2000); Cavalcanti and Wallace (1999)). Ostroy and Starr (1990) and Williamson and Wright(2010) review monetary theories. Another approach relates resalability to information sensitivity. Banks create moneyby issuing safe claims that circulate in secondary markets (Gorton and Pennacchi (1990); Dang et al. (2014)).
7The issuance cost limits the sharing of aggregate risk between banks and the rest of the economy (Di Tella (2015)).8Bank equity is a common measure of financial slackness, as it alleviates agency friction (Holmstrom and Tirole
(1997); Diamond and Rajan (2000)) and facilitates collateralization (Rampini and Viswanathan (2017)).
5
and Boyarchenko (2012); Danielsson, Shin, and Zigrand (2012); Moreira and Savov (2014)). This
paper offers a complementary explanation based on corporate money demand. More importantly,
it unveils a feedback mechanism between the real and financial sectors that sets the stage for a
formal analysis of the financial stability implications of government debt.
A recent literature documents a money premium that lowers the yield on government se-
curities (e.g., Bansal and Coleman (1996); Krishnamurthy and Vissing-Jørgensen (2012); Nagel
(2016)). Intermediaries earn the money premium by issuing money-like liabilities, such as asset-
backed commercial paper (Sunderam (2015)), deposits (Drechsler, Savov, and Schnabl (2016)),
and certificates of deposits (Kacperczyk, Perignon, and Vuillemey (2017)). Many have empha-
sized the risk of excessive leverage (Gorton (2010); Stein (2012)), and pointed out that increasing
government debt stabilizes the economy by crowding out intermediary debt (Greenwood, Hanson,
and Stein (2015); Krishnamurthy and Vissing-Jørgensen (2015); Woodford (2016)). Advancing
this line of research, this paper highlights banks’ dynamic balance-sheet management under is-
suance cost, the key ingredient that generates the destabilizing effects of outside money.9
As in Woodford (1990b) and Holmstrom and Tirole (1998), government debt facilitates in-
vestment by allowing entrepreneurs to transfer wealth across contingencies. This paper adds to this
line of research by emphasizing government as intermediaries’ competitor in liquidity supply. By
crowding out intermediated liquidity, public liquidity can reduce the overall liquidity and welfare.
After the financial crisis, governments increased their indebtedness and central banks expanded
balance sheets dramatically in advanced economies, raising concerns such as moral hazard and
excessive inflation (Fischer (2009)). This paper highlights a financial instability channel through
which an expanding government balance sheet can be counterproductive.10
A key ingredient of the model is firms’ money demand, which is motivated by studies on the
enormous amount of corporate cash holdings (e.g., Bates, Kahle, and Stulz (2009); Eisfeldt and
Muir (2016)).11 This paper connects corporate cash holdings to bank leverage, and money demand
9Also highlighting the dilution cost of equity issuance, Bolton and Freixas (2000) analyze the effects of monetarypolicy on banks’ profit and equity capital through changes in the lending spread instead of the money premium.
10The model omits other important channels through which the government may interact with the banking sector,such as monetary policy (Drechsler, Savov, and Schnabl (2017); Di Tella and Kurlat (2017)).
11Firms’ liquidity management problem in the model can be viewed as simplified version of He and Kondor (2016).
6
arises from firms’ investment needs.12 R&D is a typical form of investment that heavily relies on
internal liquidity and exhibits procyclicality.13 A number of studies have shown that the rise of
corporate cash holdings in the last few decades is largely driven by R&D-intensive firms (Begenau
and Palazzo (2015); Graham and Leary (2015); Pinkowitz, Stulz, and Williamson (2016)). There
is a rising literature on the demand for money-like or safe assets and its implications for financial
instability. Theoretical studies often relegate the modeling of money demand side, for instance, by
assuming money or safety in utility (Stein (2012); Caballero and Farhi (2017)). This paper takes a
step forward, relating money demand to firms’ liquidity management and showing its endogenous
and unique dynamics is relevant for understanding the causes and consequences of financial crisis.
The remainder is organized as follows. Section 2 lays out key economic forces in a static
setting. The continuous-time model is in Section 3. Section 4 adds government debt. Section 5
concludes. Appendices contain proofs, algorithm, and calibration details. Internet Appendix offers
preliminary evidence, and discusses the setup of outside money and its broader implications.
2 Static Model: An Anatomy of Money Shortage
This section lays out the key economic forces in a two-period model (t = 0, 1). There are goods,
capital, and three types of agents, households, bankers, and firms. Firms own capital that produces
goods at t = 1, but some are hit by a liquidity shock before production and need further investment.
To buffer the shock, firms carry deposits issued by bankers at t = 0 (inside money). Bankers back
By allowing capital to be traded, the model easily aggregates firms’ liquidity demand (linear in firm wealth). Bolton,Chen, and Wang (2011) and (2013) study nonlinear liquidity demand of firms when capital is nontradable.
12Eisfeldt (2007) shows that liquidity demand from consumption smoothing cannot explain the liquidity premiumon Treasury bills. Eisfeldt and Rampini (2009) show that liquidity premium rises when asynchronicity between cashflow and investment in the corporate sector becomes more severe, consistent with the theory of Holmstrom and Tirole(2001). Investment need is a key determinant of cash holdings (Denis and Sibilkov (2010); Duchin (2010)), especiallyfor firms with less collateral (Almeida and Campello (2007)) and more R&D activities (Falato and Sim (2014)).
13The procyclicality of R&D expenditures, as measured by the NSF, has been documented by many studies, includ-ing Griliches (1990), Fatas (2000), and Comin and Gertler (2006). Using data from the NSF and Compustat, Barlevy(2007) finds a significant positive correlation between real GDP growth and the growth rate of R&D. Using Frenchfirm-level data, Aghion et al. (2012) show that the procyclicality of R&D investment (with respect to sales growth) isfound among firms that are financially constrained. Fabrizio and Tsolmon (2014) find that R&D investments are moreprocyclical in industries with faster obsolescence. The setup of firms’ liquidity shock is motivated by these findings.
7
deposits by loans extended to firms. Inside money supply depends on bankers’ balance-sheet ca-
pacity (net worth). Insufficient supply compromises firms’ liquidity management and investment.
2.1 Setup
Physical structure. All agents consume a non-storable, generic good, and have the same risk-
neutral utility with discount rate ρ. At t = 0, there are K0 units of capital endowed to a unit mass
of homogeneous entrepreneurs (firms). One unit of capital produces α units of goods at t = 1, and
it is only productive in the hands of entrepreneurs. Capital can be traded in a competitive market at
t = 0, at price qK0 . Let k0 denote a firm’s holdings of capital, so that K0 =∫s∈[0,1] k0 (s) ds. I use
subscripts for time, and whenever necessary, superscripts for type (“B” for bankers, “H” for house-
holds, and “K” for firms who own capital). There is also a unit mass of homogeneous bankers.
Each is endowed with e0 units of goods, so their aggregate endowment is E0 =∫s∈[0,1] e0 (s) ds.
The index “s” will be suppressed without loss of clarity. There are a unit mass of homogeneous
households endowed with a large amount of goods per period. Households play a very limited role.
At the beginning of date 1 (t = 1), all firms experience a capital destruction shock, while
some also experience a liquidity shock. The economy has one aggregate shock Z1, a binary random
variable that takes value 1 or −1 with equal probability. After Z1 is realized, firms lose a fraction
π (Z1) of their capital. For simplicity, I assume that π (Z1) = δ − σZ1 (δ − σ ≥ 0 and δ + σ ≤ 1).
Later we will see Z1 makes bank equity essential for money creation. After capital loss, firms
proceed to produce α [1− π (Z1)] k0 units of goods, if they not are hit by the liquidity shock.
Independent liquidity shocks hit firms with probability λ, and destroys all capital. In the
spirit of Holmstrom and Tirole (1998) and (2001), firms must make further investment; otherwise,
they can not produce anything, and thus, exit with zero terminal value. By investing i1 units
of goods per unit of capital, firms can create F (i1) k0 (F ′ (·) > 0, F ′′ (·) < 0) units of new
capital. Homogeneity in k0 helps reduce the dimension of state variable later in the continuous-
time dynamic analysis. I assume that after the investment, firms can revive their old capital, so the
post-investment production is α [1− π (Z1) + F (i1)] k0. Through investment, firms preserve the
existing scale of production and grow. The first-best level of investment rate, iFB, is defined by:
8
All agents
– Raise funds byissuing securities
– Consume
– Allocate savings
Investing Firms: λ
– Acquire goods as inv-estment inputs
– Invest
– Produce &sell goods
All agents
– Pay out to investors
– Consume
Non-investing Firms: 1− λ
– Produce & sell goods
Date 0 Date 1
Capital
– π (Z1) fractiondestroyed
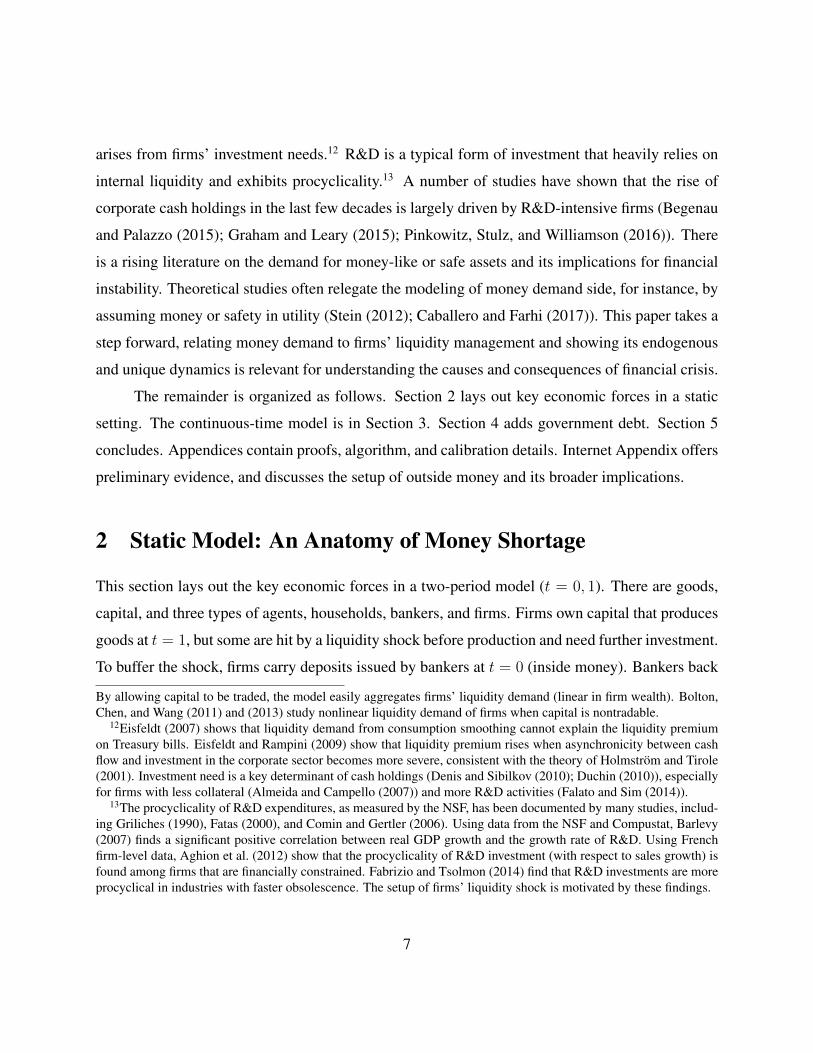
Figure 1: Timeline. This figure plots the timeline of static model. Agents set balance sheets at t = 0. Z1 is realizedat the beginning of t = 1. π (Zt) fraction of capital is destroyed. Then the liquidity shock hits λ fraction of firms. Therest produce. λ firms produce after investments. All agents consume and repay liability holders at the end of t = 1.
αF ′ (iFB) = 1, (1)
Note that firms making investment at the beginning of t = 1 instead of t = 0. This backloaded
specification gives rise to firms’ liquidity demand later in the presence of financial constraints.
Last but not least, it is assumed that all securities issued by agents in this economy pay out at
the end of date 1. This timing assumption is particularly relevant for defining what is liquidity from
firms’ perspective. Assets that firms carry to relax constraints on investment must be resalable in
exchange for investment inputs at the beginning of date 1. Firms are not buy-and-hold investors.
It will be shown that this resalability requirement relates the model setup to several strands of
literature that study banks as issuers of inside money. Figure 1 shows how events unfold.
Liquidity demand. The model features three frictions, one that gives rise to firms’ liquidity de-
mand, and the other two limiting liquidity supply. The first friction is that investment has to be
internally financed. In other words, the newly created capital is not pledgeable.14 As a result, firms
need to carry liquidity (i.e., instruments that transfer wealth from t = 0 to t = 1). This is a com-
mon assumption used to model firms’ liquidity demand.15 To achieve the first-best investment, a
firm must have access to liquidity of at least iFBk0 when the λ shock hits.
The objective of this paper is to analyze the endogenous supply of liquidity, so I assume
that goods cannot be stored (i.e., there is no exogenous storage technology). And, capital cannot
14This can be motivated by a typical moral hazard problem as in Holmstrom and Tirole (1998).15See Froot, Scharfstein, and Stein (1993), Holmstrom and Tirole (1998) and (2001) in the micro literature, and
Woodford (1990b), Kiyotaki and Moore (2005), and He and Kondor (2016) in the macro literature among others.
9
transfer wealth to a contingency where itself is destroyed without further spending. So firms must
hold financial assets as liquidity buffer. While households receive endowments per period, it is
assumed that they cannot sell claims on their future endowments because they can default with
impunity; otherwise, there would be no liquidity shortage (as in Holmstrom and Tirole (1998)).
Therefore, the focus is on the asset creation capacity of entrepreneurs themselves and bankers.
Liquidity supply. At date 0, what is a firm’s capacity to issue claims that pay out at date 1? I
assume firms’ endowed capital is pledgeable.16 It is collateral that can be seized by investors when
default happens.17 In an equilibrium where firms always carry liquidity and invest when hit by the
λ shock, a fraction [1− π (Z1)] of endowed capital is always preserved. Thus, a firm’s pledgeable
value at t = 1 is α (1− δ) k0 in expectation, and α (1− δ − σ) k0 when Z1 = −1.
Potentially, firms could hold securities issued by each other as liquidity buffer. If the aggre-
gate pledgeable value always exceeds firms’ aggregate liquidity demand, i.e.,
α (1− δ − σ)K0 ≥ iFBK0, (2)
the economy achieves the first-best investment defined in Equation (1).18 Even better, as long as
the liquidity shock is verifiable, firms’ liabilities can be pooled into a mutual fund that pays out to
investing firms, so given this perfect risk-sharing, the first-best investment is achieved if
α (1− δ − σ)K0 ≥ λiFBK0, where λ ∈ (0, 1) . (3)
In a similar setting, Holmstrom and Tirole (1998) study the question whether entrepreneurs’ supply
of assets meets their own liquidity demand (i.e., Equation (2) and (3)), and emphasize the severity
of liquidity shortage depends on aggregate shock (i.e., σ in my setting).
This paper departs from Holmstrom and Tirole (1998) by introducing the second friction:
firms can hold liquidity only in the form of bank liabilities. Therefore, in the model, banks issue
claims to firms that are in turn backed by banks’ holdings of firm liabilities (“loans”).
16New capital expected to be created at t = 1 is not pledgeable, in line with non-pledgeability of investment project.17This reflects that mature capital can be relatively easily evaluated, verified, and seized by investors. Allowing
capital created at date 1 to serve as collateral complicates the expressions but does not change the main results.18Liquidity holdings cannot be pledged. Otherwise, pledgeable value is infinite: firms’ issuance of securities enlarge
each other’s financing capacity, so more securities are issued. Holmstrom and Tirole (2011) make a related argument.
10
There are several reasons why firms hold intermediated liquidity. Entrepreneurs may sim-
ply lack the required expertise of asset management.19 And, cross holding is regulated in many
countries and industries. This assumption is also motivated by strands of theoretical literature that
study banks as inside money creators. Given the timing in Figure 1, entrepreneurs purchase goods
as investment inputs by selling their liquidity holdings when the λ shock hits. In other words, firms
carry liquidity as a means of payment. Kiyotaki and Moore (2000) model bankers as agents with
superior ability to make multilateral commitment, i.e., to pay whoever holds their liabilities, so
bank liabilities circulate as means of payment.20 Taking a step further, money creation may require
not only a special set of agents (i.e., bankers), but also a particular security design. In Gorton and
Pennacchi (1990) and Dang et al. (2014), banks create money by issuing information-insensitive
claims (safe debts) that do not suffer asymmetric information problem in secondary markets.
This paper takes the aforementioned literature as a starting point: firms are assumed to hold
liquidity in the form of safe debt issued by banks (“deposits”).21 Let m0 denote a firm’s deposit
holdings per unit of capital. Investment at t = 1 is thus directly tied to deposits carried from t = 0:
i1k0 ≤ m0k0.22 (4)
Equation (4) resembles a money-in-advance constraint (e.g., Svensson (1985); Lucas and Stokey
(1987)), except that what firms hold for transaction purposes is not fiat money, but bank debt, or
“inside money.” Thus, banks add value to the economy by supplying deposits that can be held by
firms to relax this “money-in-advance” constraint on investment. Linking firm cash holdings to
bank debt is in line with evidence.23 Pozsar (2014) shows that corporate treasury, as one of the
major cash pools, feeds leverage to the financial sector in the run-up to the global financial crisis.
19There is a large literature on households’ limited participation in financial markets (Mankiw and Zeldes (1991);Basak and Cuoco (1998); He and Krishnamurthy (2013)), but firms’ portfolio choice is relatively less studied. Duchinet al. (2017) find firms hold risky securities, but what dominate are safe debts issued by intermediaries or governments.
20In a richer setting with limited commitment and imperfect record keeping (Kocherlakota (1998)), credit is con-strained, so trades must engage in quid pro quo, involving a transaction medium (Kiyotaki and Wright (1989)). Cav-alcanti and Wallace (1999) show that bankers arise as issuers of inside money when their trading history is publicknowledge. Ostroy and Starr (1990) and Williamson and Wright (2010) review the literature of monetary theories.
21The concavity of investment technology F (·) also implies that firms prefer safe assets as liquidity buffer.22To be consistent with the continuous-time expressions, deposits’ interest payments are ignored in Equation (4).23Based on Financial Accounts of the United States, Figure 1 in Online Appendix shows 80% of liquidity holdings of
nonfinancial corporate businesses are in financial intermediaries’ debt, with the rest dominated by Treasury securities.
11
Inside money creation capacity. To impose more structure on the analysis, I assume loans take
a particular contractual form: each dollar of loan extended at t = 0 is backed by a designated
capital as collateral, and is repaid with interest rate R0 at the end of date 1 if the collateral is intact.
Thus, a fraction π (Z1) of loans default as their collateral is destroyed. The return to a diversified
loan portfolio is [1− π (Z1)] (1 +R0). To mimic the corresponding continuous-time expressions,
I approximate it with 1 +R0− π (Z1), ignoring π (Z1)R0, product of two percentages. This setup
is similar to Klimenko et al. (2016).
Because of the aggregate shock, banks’ safe debt capacity depends on their equity cushion.
Let r0 denote the deposit rate, and x0 denote the leverage (asset-to-equity ratio). A banker will
never default if her net worth is still positive even in a bad state (Z1 = −1), i.e.,
x0e0︸︷︷︸total assets
[1 +R0 − πD (−1)]︸ ︷︷ ︸loan return
≥ (x0 − 1) e0︸ ︷︷ ︸total debt
(1 + r0)︸ ︷︷ ︸deposit repayment
.
This incentive or solvency constraint can be rewritten as a limit on leverage:
x0 ≤r0 + 1
r0 + δ + σ −R0
:= x0 (5)
Finally, I introduce the third and last friction – banks’ equity issuance cost. At t = 0, bankers
may raise equity subject to a proportional dilution cost χ. To raise one dollar, a bank needs to give
1 + χ worth of equity to investors.24 I will consider χ < ∞ in the continuous-time analysis.
For now, χ = ∞ and banks do not issue equity. As a result, inside money creation is limited by
bankers’ equity or balance-sheet capacity: total deposits cannot exceed (x0 − 1)E0.
The frictions form three pillars of the model: firms’ money demand, bank debt as money;
banks’ equity constraint. Insufficient inside money supply leads to underinvestment by compromis-
ing entrepreneurs’ liquidity management. The next section recasts the model in a continuous-time
framework and delivers the main results. Before that, I will close this section by showing several
features of the static model that are shared with the continuous-time Markov equilibrium.
24χ is a reduced form representation of informational frictions in settings such as Myers and Majluf (1984) orDittmar and Thakor (2007). The illiquidity of bank equity may also result from banks’ intentional choice of balance-sheet opaqueness that protects the information insensitivity, and thus, the moneyness of deposits (Dang et al. (2014)).
12
2.2 Equilibrium
Lemma 1, 2, and 3 below summarize the optimal choices for firms and banks at t = 0. We will
focus on an equilibrium where firms’ liquidity constraint binds (i.e., i1 = m0). One more unit of de-
posits can be used to purchase one more unit of goods as inputs to create F ′ (m0) more units of cap-
ital (with productivity α) when λ shock hits. This has an expected net value of λ [αF ′ (m0)− 1],
making firms willing to accept a return lower than ρ, the discount rate.25 The spread, ρ − r0, is
money premium, a carrying cost. Note that when r0 < ρ, households do not hold deposits.
Lemma 1 (Money Demand) Firms’ equilibrium deposits, m0, satisfy the condition
λ [αF ′ (m0)− 1] = ρ− r0.
Firms also choose the amount they borrow from banks, which is subject to the collateral con-
straint that the expected repayment cannot exceed the total pledgeable value (α (1− δ) k0). Given
the expected default probability E [π (Z1)] = δ, the expected loan repayment is (1− δ) (1 +R0)
per dollar borrowed, approximated by 1 +R0− δ (the product of two percentages ignored). When
R0 − δ = ρ, firms are indifferent; when R0 − δ < ρ, firms borrow to the maximum. The spread,
ρ− (R0 − δ), is collateral shadow value κ0 (the Lagrange multiplier of collateral constraint).
Lemma 2 (Credit Demand) The equilibrium loan rate is given by: R0 = δ + ρ− κ0.
Competitive bankers take as given the market loan rate R0 and deposit rate r0. At t = 0, a
representative banker chooses consumption-to-equity ratio y0 (and retained equity e0 − y0e0), and
the asset-to-equity ratio x0 (leverage). Each dollar of retained equity is worth x0 [1 +R0 − π (Z1)]−(x0 − 1) (1 + r0) at t = 1, which is the difference between asset and liability value. Because
E [πD (Z1)] = δ, the expected return on retained equity is 1 + r0 + x0 (R0 − δ − r0). The return in
25Because bankers’ only endowments are goods that cannot be stored, to carry net worth to date 1, bankers must lendsome goods to firms in exchange for loans, i.e., the instruments that bankers use to transfer wealth intertemporarily.Since goods cannot be stored, entrepreneurs must consume at t = 0 in equilibrium. To make risk-neutral entrepreneursindifferent between consumption and savings, the price of capital qK0 adjusts so that acquiring capital delivers anexpected return equal to ρ, which is precisely the opportunity cost of holding deposits instead of capital.
13
a bad state is 1 + r0 +x0 (R0 − δ − σ − r0). Let ξ0 denote the Lagrange multiplier of the solvency
constraint, i.e., the shadow value of bank equity.26 The value function is
v (e0;R0, r0) = maxy0≥0,x0≥0
y0e0 +(e0 − y0e0)
(1 + ρ){1 + r0 + x0 (R0 − δ − r0)
+ ξ0 [1 + r0 + x0 (R0 − δ − σ − r0)]}.
Lemma 3 (Bank Optimization) The first-order condition (F.O.C.) for bank leverage x0 is
R0 − r0 = δ + γB0 σ, (6)
where γB0 =(
ξ01+ξ0
)= R0−δ−r0
σ∈ [0, 1) is the banker’s effective risk aversion or price of risk.
Substituting the F.O.C. into the value function, we have
v(e0; qB0 ) = y0e0 + qB0 (e0 − y0e0), where, qB0 =
(1 + r0) (1 + ξ0)
(1 + ρ). (7)
The banker consumes if qB0 ≤ 1; if qB0 > 1, y0 = 0 so that the entire endowments are lent out.
The equilibrium credit spread,R0−r0, has two components: the expected default probability
δ and the risk premium γB0 σ. Each dollar lent adds σ units of downside risk at date 1, which tightens
the capital adequacy constraint. γB0 is the price of risk charged by bankers, the Sharpe ratio of
risky lending financed by risk-free deposits. qB0 is the marginal value of bank equity (Tobin’s Q).
Retained equity has a compounded payoff of (1 + r0) (1 + ξ0) from reducing the external financing
(debt) cost and relaxing the solvency constraint, so its present value is (1+r0)(1+ξ0)(1+ρ)
. When qB0 > 1,
bankers lend out all endowments in order to carry their wealth to t = 1 in the form of loans.
Substituting the equilibrium loan rate into Equation (6), we can solve for the money premium
ρ− r0, as the sum of γB0 σ, bankers’ risk compensation, and κ0, the collateral shadow value.
Proposition 1 (Money Premium Decomposition) The equilibrium money premium is given by
ρ− r0 = γB0 σ + κ0. (8)
Equation (8) decomposes the money premium into an intermediary wedge, γB0 σ, that mea-
sures the scarcity of bank equity, and a collateral wedge κ0. Since the money premium equals the26Note that ξ0 is known at t = 0, so its subscript is 0 instead of 1.
14
expected value of foregone marginal investment (Lemma 1), Equation (8) offers an anatomy of
investment inefficiency. To support the first-best investment, iFB, each firms must carry at least
iFBK0 deposits in aggregate, which requires a minimum level of bank equity:
Condition 1 E0 ≥ EFB, where EFB := iFBK0
xFB−1= iFB
1+ρσ−1K0, and iFB is defined in Equation (1).
xFB is solved as follows: under the first-best investment, the money premium is zero, so κ0 = 0.
Substituting r0 = ρ and R0 = δ + ρ into the solvency constraint yields xFB = 1+ρσ
. When the size
of aggregate shock is larger (higher σ), the required bank equity as risk buffer (EFB) is larger.
First-best deposit creation also requires a minimum stock of collateral to back bank loans.
The minimum bank lending that supports the first-best investment is xFBEFB, so that collateral
must be sufficient to cover firms’ expected debt repayment: α (1− δ)K0 ≥ xFBEFB (1 + ρ), or,
K0 ≥ KFB :=xFBEFB (1 + ρ)
α (1− δ) =
(1+ρσ
1+ρσ− 1
)(iFB (1 + ρ)
α (1− δ)
)K0,
This condition can be simplified into the following parameter restrictions:
Condition 2 α(1−δ)1+ρ
≥(
11− σ
1+ρ
)iFB, where iFB is defined in Equation (1).
Condition 2 is more likely to be violated when the expected collateral destruction rate δ is
higher. Thus, δ measures the severity of collateral shortage that is studied by Holmstrom and Tirole
(1998).27 This paper focuses on the scarcity of intermediation capacity. As shown in Condition 1,
such scarcity is more severe if σ is larger. Therefore, two parameters, δ and σ, correspond to the
strengths of two limits on inside money creation. Corollary 1 summarizes the analysis.
Corollary 1 (Sufficient Conditions for a Money Shortage) The equilibrium money premium is
positive, and investment is below the first-best level, if either Condition 1 or 2 is violated.27See also the literature of asset shortage, such as Woodford (1990b), Kocherlakota (2009), Kiyotaki and Moore
(2005), Caballero and Krishnamurthy (2006), Farhi and Tirole (2012), Giglio and Severo (2012) among others.
15

3 Dynamic Model: Procyclical Money Creation
To study the cyclicality of bank leverage and the frequency and duration of crisis, I recast the
model in continuous time. New mechanisms arise from agents’ intertemporal decision making.
The analysis focuses on the intermediary wedge, assuming a corresponding version of Condition 2
holds, so the economy has enough capital as collateral, but not enough bank equity as risk buffer.
3.1 Setup
Continuous-time setup. All agents maximize risk-neutral life-time utility with discount rate ρ.
Households consumes the generic goods and can invest in securities issued by firms and banks.28
Firms trade capital at price qKt . One unit of capital produces α units of goods per unit of time.
They can issue equity to households, promising an expected return of ρ per unit of time (i.e., their
cost of equity). Given the deposit rate rt, the deposit carry cost or the money premium, is defined
by the spread between ρ and deposit rate rt as in the static model.29
At idiosyncratic Poisson times (intensity λ), firms are hit by a liquidity shock and cut off
from external financing. These firms either quit or invest. Let kt denote a firm’s capital holdings.
Investing itkt units of goods can preserve the existing capital and create F (it)kt units of new
capital. Investment is constrained by the firm’s deposit holdings, it ≤ mt, where mt is the deposits
per unit of capital on its balance sheet.30 Holding deposits allows firms’ wealth to jump up at these
Poisson times through the creation of new capital. I assume the technology F (·) is sufficiently
productive, so we focus on an equilibrium where the liquidity constraint always binds.
The aggregate shock Zt is a standard Brownian motion. Every instant, δdt − σdZt fraction
28Risk-neutral households’ required return is fixed at ρ because negative consumption is allowed, which is inter-preted as dis-utility from additional labor to produce extra goods as in Brunnermeier and Sannikov (2014). Allowingnegative consumption serves the same purpose as assuming large endowments of goods per period in the static model.
29Nagel (2016) emphasizes the variation in illiquid return (i.e. ρ in the model) as a driver of the money premiumdynamics in data. This paper provides an alternative model that focuses on the yield on money-like securities, rt.
30The idiosyncratic nature of liquidity shock and the assumption that firms can access external funds in normal timesimply that firms’ money demand does not contain hedging motive that complicates model mechanism. Bolton, Chen,and Wang (2013) model the market timing motive of corporate liquidity holdings in the presence of technologicalilliquidity and state-dependent external financing costs. He and Kondor (2016) examine how the hedging motive ofliquidity holdings amplifies investment cycle through pecuniary externality in the market of productive capital.
16
of capital is destroyed. Firms default on loans backed by the destroyed capital. Let Rt denote the
loan rate. For one dollar borrowed from banks at t, firms expect to pay back
(1 +Rtdt)︸ ︷︷ ︸principal + interest payments
[1− (δdt− σdZt)︸ ︷︷ ︸default probability
] = 1 +Rtdt− (δdt− σdZt) ,
where high-order infinitesimal terms are ignored. The default probability is a random variable that
loads on dZt.31 Both loans and deposits are short-term contracts, initiated at t and settled at t+dt.32
Let rt denote the deposit rate, and xt banks’ asset-to-equity ratio. Let cBt denote a bank’s
cumulative dividend. dcBt > 0 means consumption and paying dividends to outside shareholders
(households); dcBt < 0 means raising equity. As in the static model, we can define dyt =dcBtet
as
the payout or issuance ratio, which is an impulse variable, so bank equity et follows a regulated
diffusion process, reflected at payout and issuance (i.e., when dyt 6= 0):
det = etxt︸︷︷︸Loan value
[Rtdt− (δdt− σdZt)]︸ ︷︷ ︸Loan return
− et (xt − 1)︸ ︷︷ ︸Debt value
rtdt︸︷︷︸Interest payment
− etdyt︸︷︷︸Payout or issue
− etιdt︸︷︷︸Cost of operations
. (9)
Because in equilibrium, banks earn a positive expected return on equity, the operation cost ι is
introduced to motivate payout so that the banking sector does not outgrow the economy.33
Bankers maximize life-time utility, subject to a proportional equity issuance cost:
E{∫ τ
t=0
e−ρt[I{dyt≥0} − (1 + χ) I{dyt<0}
]etdyt
}. (10)
IA is the indicator function of event A.34 The solvency constraint in the static setting boils down
to the requirement of non-negative equity. Unlike the static setting, in equilibrium, bankers always
preserve a slackness, so τ := inf{t : et ≤ 0} =∞. As will be shown later, even in the absence of
a binding solvency constraint, bankers are still risk-averse due to the recapitalization friction χ.31Probit transformation can guarantee π(dZt) ∈ (0, 1) but complicates expressions. See also Klimenko et al. (2016).32I assume banks repay deposits after investment takes place, so that investing firms cannot be buy-and-hold in-
vestors, and thus, have to actually sell deposits in exchange for goods. Long-term deposits avoid this assumption, butwould introduce other mechanisms, such as the Fisherian deflationary spiral in Brunnermeier and Sannikov (2016).Similarly, long-term loan contracts introduce the fire sale mechanism in Brunnermeier and Sannikov (2014).
33The cost of operations is mathematically equivalent to a higher time-discount rate for bankers, common in theliterature of heterogeneous-agent models (e.g., Kiyotaki and Moore (1997)). It can also be interpreted as agency cost.
34In different settings, Van den Heuvel (2002), Phelan (2016), and Klimenko et al. (2016) also introduce issuancefrictions in dynamic banking models. Dilution cost is just one form of frictions that lead to the endogenous variationof intermediaries’ risk-taking capacity. He and Krishnamurthy (2012) use a minimum requirement of insiders’ stake.
17
State variable. At time t, the economy has Kt units of capital and aggregate bank equity Et. In
principle, a time-homogeneous Markov equilibrium would have both as state variables. Because
production has constant return-to-scale and the investment technology is homogeneous of degree
one in capital, the Markov equilibrium has only one state variable:
ηt =EtKt
.
Since the model highlights the interaction between money supply and demand, intuitively, ηt mea-
sures the size of liquidity suppliers (banks) relative to that of liquidity demanders (firms).
Because there is a unit mass of homogeneous bankers,Et follows the same dynamics as et, so
the instantaneous expectation and standard deviation of dEtEt
(µet and σet ) are rt+xt (Rt − δ − rt)−ιand xtσ respectively (from Equation (9)). By Ito’s lemma, ηt follows a regulated diffusion process
dηtηt
= µηt dt+ σηt dZt − dyt, (11)
where µηt is µet − [λF (mt)− δ] − σetσ + σ2, with bracket term being the expected growth rate
of Kt, and the shock elasticity σηt is (xt − 1)σ, which is positive because banks lever up (xt >
1). Positive shocks increase ηt, so banks become relatively richer; negative shocks make banks
relatively undercapitalized. As ηt evolves over time, the economy repeats the timeline in Figure 1
with date 0 replaced by t and date 1 replaced by t + dt. Let intervals B = [0, 1] and K = [0, 1]
denote the sets of banks and firms respectively. The Markov equilibrium is formally defined below.
Definition 1 (Markov Equilibrium) For any initial endowments of firms’ capital {k0(s), s ∈ K}and banks’ goods (i.e., initial bank equity) {e0(s), s ∈ B} such that∫
s∈Kk0(s)ds = K0, and
∫s∈B
e0(s)ds = E0,
a Markov equilibrium is described by the stochastic processes of agents’ choices and price vari-
ables on the filtered probability space generated by the Brownian motion {Zt, t ≥ 0}, such that:
(i) Agents know and take as given the processes of price variables, such as the price of capital,
the loan rate, and the deposit rate (i.e., agents are competitive with rational expectation);
(ii) Households optimally choose consumption and savings that are invested in securities iss-
18
ued by firms and banks;
(iii) Firms optimally choose capital holdings, deposit holdings, investment, and loans;
(iv) Bankers optimally choose leverage, and consumption/payout and issuance policies;
(v) Price variables adjust to clear all markets with goods being the numeraire;
(vi) All the choice variables and price variables are functions of ηt, so Equation (11) is an au-
tonomous law of motion that maps any path of shocks {Zs, s ≤ t} to the current state ηt.
3.2 Markov Equilibrium
The risk cost of money creation. In analogy to Proposition 1, I will show a risk cost of money
creation that ties inside money supply to bank equity. I start with firms’ demand for bank deposits.
Lemma 1′ gives firms’ optimal deposit demand in analogy to Lemma 1, with one modi-
fication that capital is valued at the market price qKt instead of the terminal value α in the static
setting.35 As will be shown, this difference is critical, as it leads to a unique intertemporal feedback
mechanism that amplifies the procyclicality of money creation. As in the static model, households
do not hold deposits when rt < ρ, so firms’ deposit demand is the aggregate demand for bank debt.
Lemma 1′ (Money Demand) Firms’ equilibrium deposits, mt, satisfy the condition
λ[qKt F
′ (mt)− 1]
= ρ− rt. (12)
The static model highlights two limits on inside money creation: the scarcities of collateral
and bank equity. Here I will focus on the latter, and later confirm that firms’ collateral constraint
never binds in the calibrated equilibrium. Thus, the expected loan repayment Rt− δ, is equal to ρ.
Lemma 2′ (Credit Demand) The equilibrium loan rate is given by: Rt = δ + ρ.
Bankers solve a dynamic problem. Following Lemma 3, I conjecture bankers’ value function
is linear in equity, v(et; q
Bt
)= qBt et, where qBt summarizes the investment opportunity set. Define
35To be precise, the liquidity shock hits at t+ dt, and by then the capital created will be worth qKt+dt = qKt + dqKt .In equilibrium, qKt is a diffusion process with continuous sample paths, so dqKt is infinitesimal, and thus, ignored.
19
εBt as the elasticity of qBt : εBt :=dqBt /q
Bt
dηt/ηt. Intuitively, qBt signals the scarcity of bank equity, so I look
for an equilibrium in which εBt ≤ 0. Individual bankers take as given the equilibrium dynamics of
qBt . Let µBt and σBt denote the instantaneous expectation and standard deviation of dqBt
qBtrespectively.
The Hamilton-Jacobi-Bellman (HJB) equation can be written as
ρ = maxdyBt ∈R
{(1− qBt
)qBt
I{dyt>0}dyt +
(qBt − 1− χ
)qBt
I{dyt<0} (−dyt)}
+ µBt + maxxt≥0
{rt + xt (Rt − δ − rt)− xtγBt σ
}− ι,
(13)
where the effective risk aversion is defined by γBt := −σBt . By Ito’s lemma, γBt = −εBt σηt ≥ 0.
Lemma 3′ (Bank Optimization) The first-order condition for bank leverage xt is
Rt − δ − rt = γBt σ, (14)
The banker pays dividends (dyt > 0) if qBt ≤ 1, and raises equity (dyt < 0) if qBt ≥ 1 + χ.
Bankers’ issuance and payout policies imply that ηt is bounded by two reflecting boundaries:
the issuance boundary η, given by qB(η)
= 1+χ, and the payout boundary η given by qB (η) = 1.
When ηt falls to η, banks raise equity and ηt never decreases further; When ηt rises to η, banks pay
out dividends and ηt never increases further. When ηt ∈(η, η), bankers neither issue equity nor
pay out dividends, because qBt ∈ (1, 1 + χ) by the monotonicity of qB (ηt). As ηt rises following
good shocks and falls following bad shocks, banks follow a countercyclical equity management
strategy, paying out dividends in good times and issuing shares in bad times, which is consistent
with the evidence (Baron (2014); Adrian, Boyarchenko, and Shin (2015)).
Lemma 4 (Reflecting Boundaries) The economy moves within bank issuance boundary η and
payout boundary η. In[η, η], the law of motion of the state variable ηt is given by Equation (11).
Bankers are risk-averse because of the recapitalization friction. From an individual banker’s
perspective, the issuance cost causes her marginal value of equity qBt to be negatively correlated
with shocks. Following a negative shock, bankers will not raise equity unless qBt reaches 1 + χ,
so the whole industry shrinks (i.e. the aggregate bank equity decreases), and intuitively, Tobin’s
20
Q, qBt , increases. Following a positive shock, bankers will not immediately pay out dividends
unless qBt drops to 1, so the whole industry expands and qBt decreases. Thus, bankers require a
risk premium for holding any asset whose return is positively correlated with dZt (i.e., negatively
correlated with qBt ). In particular, bankers require a risk compensation for extending loans.
On the left-hand side of Equation (14) is the net interest margin, Rt − δ − rt, the marginal
benefit of issuing deposits backed by risky loans. The right-hand side is the marginal cost, that is
the σ units of risk exposure, priced at γBt per unit.36 We can interpret the equilibrium γBt as the
expected profit per unit of risk (i.e. the Sharpe ratio), from creating deposits backed by risky loans:
γBt =Rt − δ − rt
σ.
Banks face two markets, the loan market and the money market. With the loan rate Rt equal to
ρ+ δ (Lemma 2′), there is a one-to-one mapping between the deposit rate rt and γBt .
Interpreting γBt as the Sharpe ratio or profitability of money creation helps us build an in-
tuitive connection between qBt and γBt . As a summary statistic for banks’ investment opportunity
set, qBt reflects the expectation of future profits from money creation (i.e. the future paths of γBt ).
Intuitively, when the banking sector is relatively large, i.e., ηt is high, banks’ profit per unit of risk,
γBt , declines. This is a key equilibrium property, later confirmed by the full solution. Substituting
the equilibrium loan rate into Equation (14), we have the dynamic counterpart of Proposition 1.37
Proposition 1′ (Money Premium) The equilibrium money premium is given by
ρ− rt = γBt σ. (15)
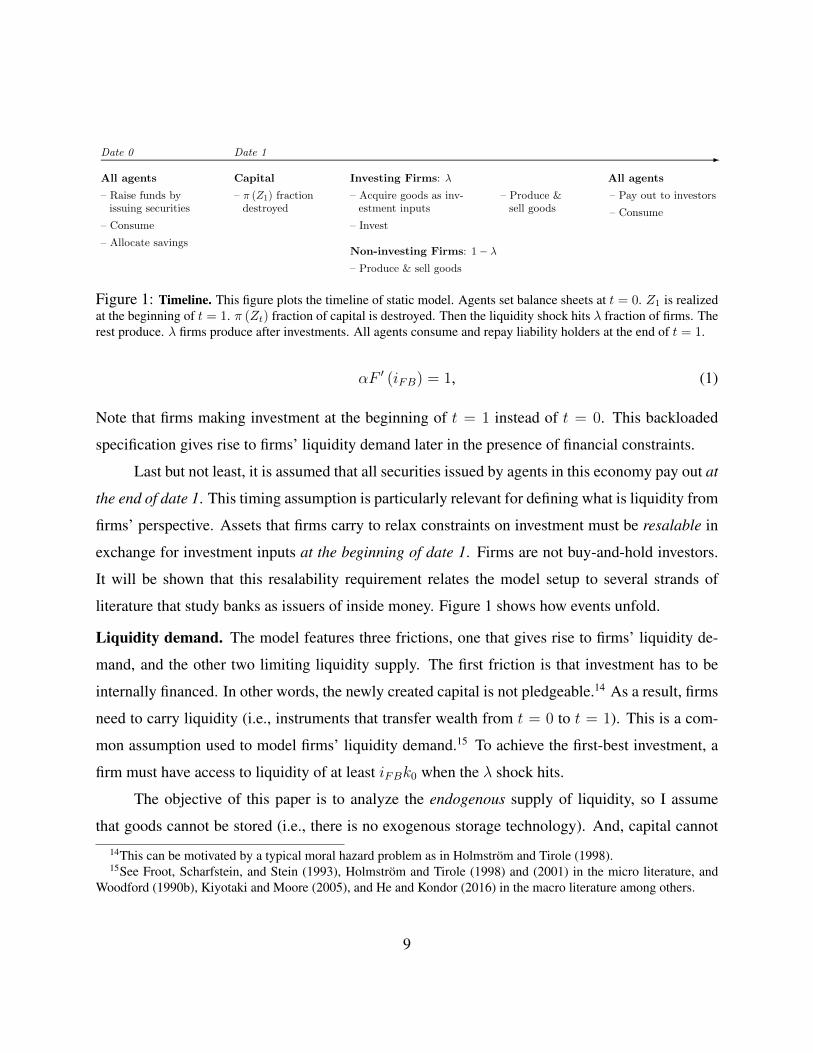
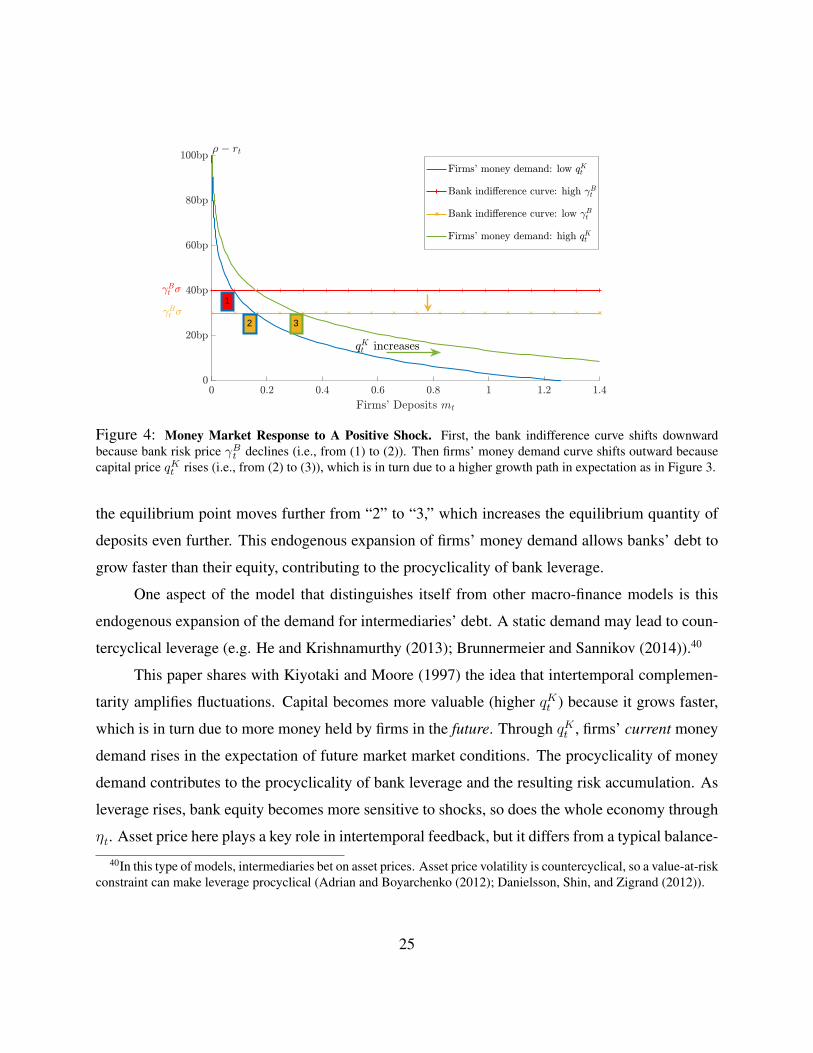
Figure 2 takes a snapshot of the deposit market, given capital value qKt and γBt . In the Markov
equilibrium, these variables vary continuously with ηt. The horizontal axis ismt, the representative
firm’s deposits per unit of capital. The vertical axis is the money premium. The investment tech-
nology F (·) is concave, so firms’ indifference curve from Lemma 1′ gives a downward-sloping
36γBt σ opens up a wedge between the credit spread, Rt − rt, and δ the expected default rate. This intermediarypremium shares the insight of He and Krishnamurthy (2013), but here, the purpose of intermediation is to create insidemoney. Bankers need loans to back deposits, and all that households need is to break even as shown in Lemma 2′.
37Recall that for the transparency of the dynamic mechanisms, I assume firms’ collateral constraint never binds, sothe collateral shadow value disappears. This assumption is confirmed later by the solution of calibrated model.
21
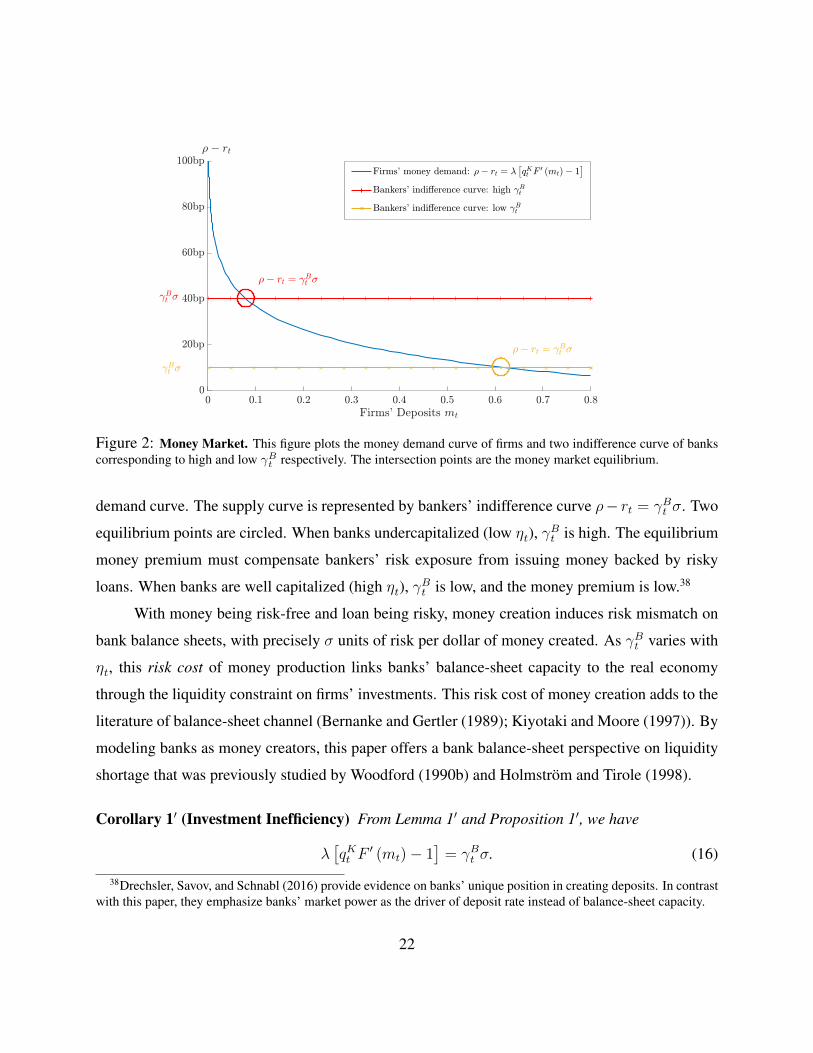
Figure 2: Money Market. This figure plots the money demand curve of firms and two indifference curve of bankscorresponding to high and low γBt respectively. The intersection points are the money market equilibrium.
demand curve. The supply curve is represented by bankers’ indifference curve ρ− rt = γBt σ. Two
equilibrium points are circled. When banks undercapitalized (low ηt), γBt is high. The equilibrium
money premium must compensate bankers’ risk exposure from issuing money backed by risky
loans. When banks are well capitalized (high ηt), γBt is low, and the money premium is low.38
With money being risk-free and loan being risky, money creation induces risk mismatch on
bank balance sheets, with precisely σ units of risk per dollar of money created. As γBt varies with
ηt, this risk cost of money production links banks’ balance-sheet capacity to the real economy
through the liquidity constraint on firms’ investments. This risk cost of money creation adds to the
literature of balance-sheet channel (Bernanke and Gertler (1989); Kiyotaki and Moore (1997)). By
modeling banks as money creators, this paper offers a bank balance-sheet perspective on liquidity
shortage that was previously studied by Woodford (1990b) and Holmstrom and Tirole (1998).
Corollary 1′ (Investment Inefficiency) From Lemma 1′ and Proposition 1′, we have
λ[qKt F
′ (mt)− 1]
= γBt σ. (16)
38Drechsler, Savov, and Schnabl (2016) provide evidence on banks’ unique position in creating deposits. In contrastwith this paper, they emphasize banks’ market power as the driver of deposit rate instead of balance-sheet capacity.
22
The risk compensation charged by bankers is exactly the net present value of foregone
marginal investment. When banks are undercapitalized and γBt is high, firms hold less liquid-
ity and invest less. This result echoes Corollary 1 of the static model, except that now bank equity
evolves endogenously. Bad shocks destroy bank equity, so inside money supply contracts, slowing
down resources reallocation towards investing firms. Following good shocks, more inside money is
created, facilitating reallocation. Eisfeldt and Rampini (2006) find procyclical reallocation among
firms. Bachmann and Bayer (2014) find procyclical dispersion of firms’ investment rates. Here,
procyclical reallocation is driven by procyclical money creation and transaction volumes.
So far, we have revisited the main results of the static model in a dynamic setting. Next, I
will discuss intertemporal feedback mechanisms that amplify the procyclicality of money creation.
Intertemporal feedback. The endogenous capital price plays a critical role in generating a feed-
back mechanism. Proposition 2 shows firms’ indifference condition as a capital pricing formula.
Proposition 2 (Capital Valuation) The equilibrium price of capital satisfies
qKt =
Production︷︸︸︷α +
Expected net investment gain︷ ︸︸ ︷λ[qKt F (mt)−mt
]−
Deposit carry cost︷ ︸︸ ︷(ρ− rt)mt
ρ︸︷︷︸Discount rate
− ( µKt︸︷︷︸Expected price appreciation
− δ︸︷︷︸Expected capital destruction
+ σKt σ︸︷︷︸Quadratic covariation
), (17)
where µKt and σKt are defined in the equilibrium price dynamics: dqKt = µKt qKt dt+ σKt q
Kt dZt.
Capital value qKt is procyclical. Consider a positive shock, dZt > 0, at an interior state,
ηt ∈(η, η). Since fewer loans default than expected, banks receive a windfall. Given the wedge
between qBt and 1 that is created by the issuance cost, qBt does not immediately jump down to one
and trigger payout. So, banks’ equity increases, and in expectation, the shock’s impact on the bank
equity will only dissipate gradually into the future. Thus, a positive shock increases current bank
equity, and due to the persistence of its impact, it lifts up the expectation of future bank equity.
Thus, a positive shock increases capital value through two channels. As banks’ equity in-
creases, they charge a lower price of risk for deposit creation, so firms pay a lower deposit carry
cost, ρ− rt, and hold more deposits from t to t+dt. Capital is expected to grow faster in dt thanks
23
Present Future
date t date t+ dt date t+ 2dt ...
Good shock
γBt & carry cost falls
Deposits increase
Capital grows faster in dt
Capital value qKt increases
γBt+dt & carry cost falls
Deposits increase
Capital grows faster in dt
Capital value qKt+dt increases
γBt+2dt & carry cost falls
Deposits increase
Capital grows faster in dt
Capital value qKt+2dt increases
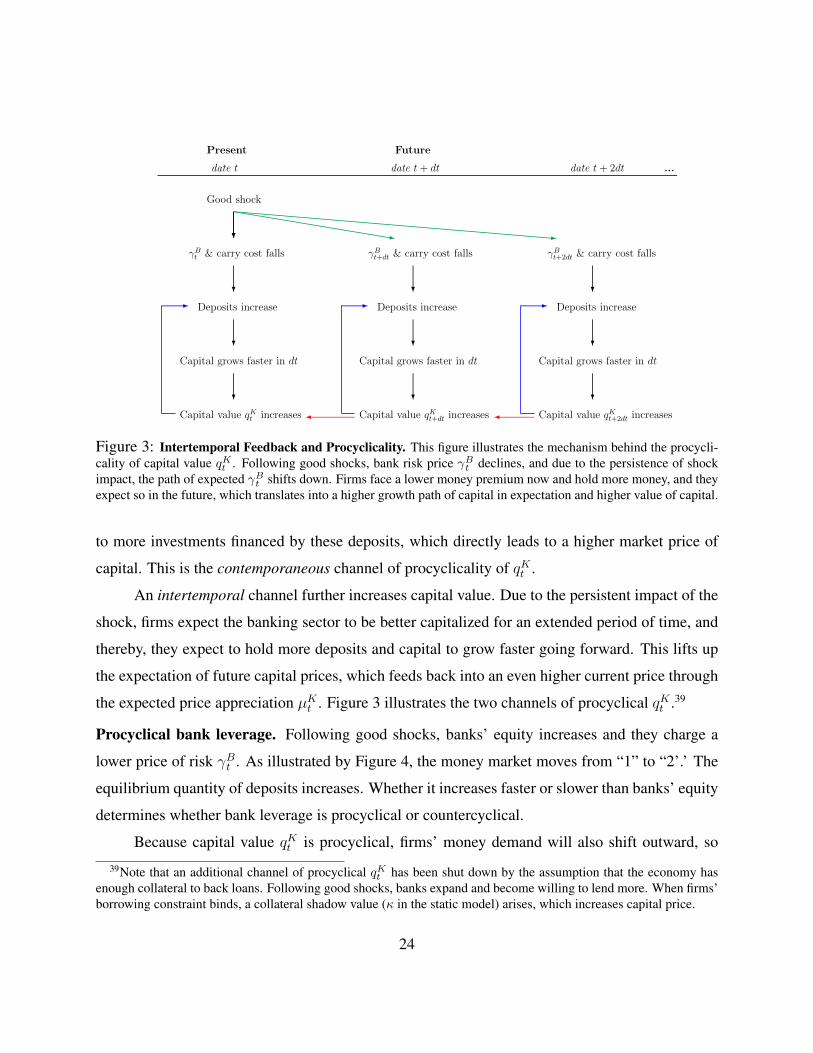
Figure 3: Intertemporal Feedback and Procyclicality. This figure illustrates the mechanism behind the procycli-cality of capital value qKt . Following good shocks, bank risk price γBt declines, and due to the persistence of shockimpact, the path of expected γBt shifts down. Firms face a lower money premium now and hold more money, and theyexpect so in the future, which translates into a higher growth path of capital in expectation and higher value of capital.
to more investments financed by these deposits, which directly leads to a higher market price of
capital. This is the contemporaneous channel of procyclicality of qKt .
An intertemporal channel further increases capital value. Due to the persistent impact of the
shock, firms expect the banking sector to be better capitalized for an extended period of time, and
thereby, they expect to hold more deposits and capital to grow faster going forward. This lifts up
the expectation of future capital prices, which feeds back into an even higher current price through
the expected price appreciation µKt . Figure 3 illustrates the two channels of procyclical qKt .39
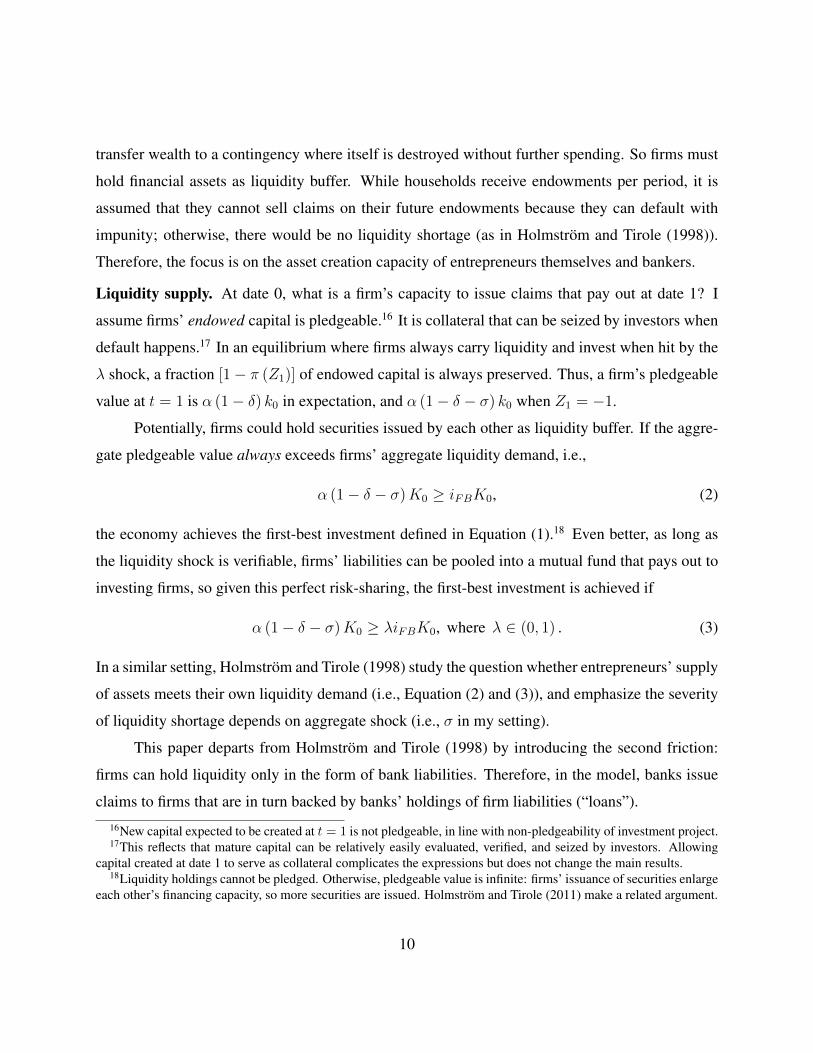
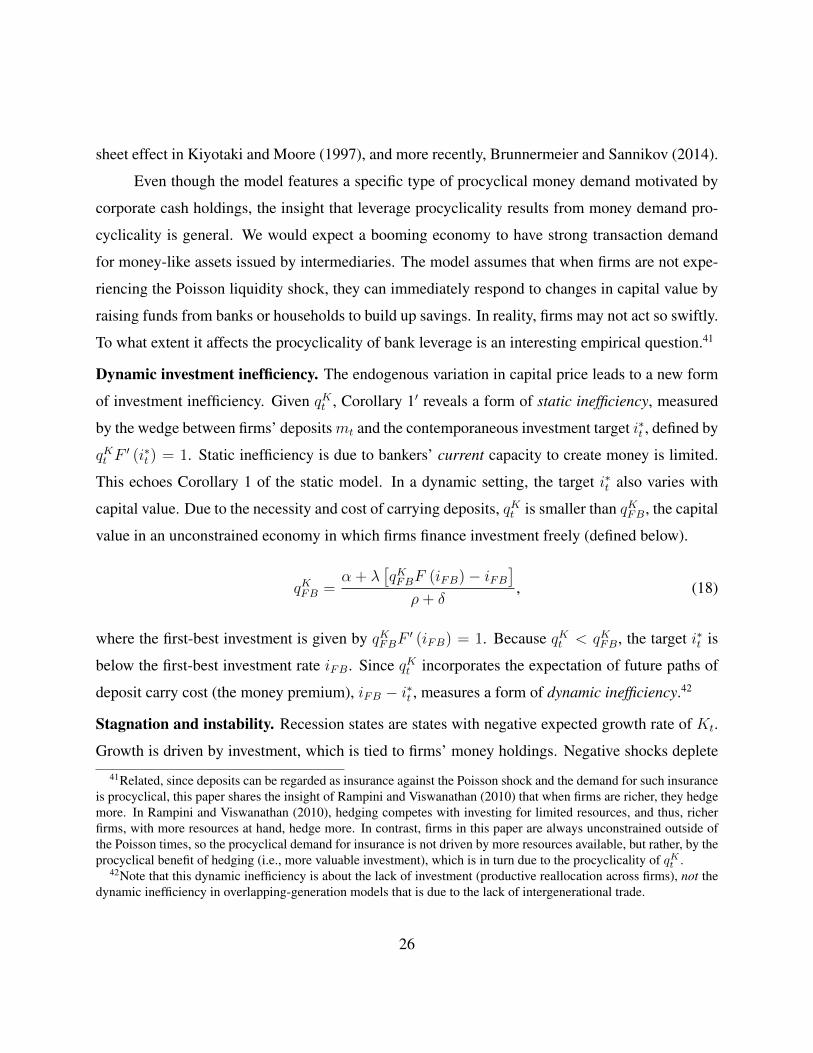
Procyclical bank leverage. Following good shocks, banks’ equity increases and they charge a
lower price of risk γBt . As illustrated by Figure 4, the money market moves from “1” to “2’.’ The
equilibrium quantity of deposits increases. Whether it increases faster or slower than banks’ equity
determines whether bank leverage is procyclical or countercyclical.
Because capital value qKt is procyclical, firms’ money demand will also shift outward, so
39Note that an additional channel of procyclical qKt has been shut down by the assumption that the economy hasenough collateral to back loans. Following good shocks, banks expand and become willing to lend more. When firms’borrowing constraint binds, a collateral shadow value (κ in the static model) arises, which increases capital price.
24
2
1
3
Figure 4: Money Market Response to A Positive Shock. First, the bank indifference curve shifts downwardbecause bank risk price γBt declines (i.e., from (1) to (2)). Then firms’ money demand curve shifts outward becausecapital price qKt rises (i.e., from (2) to (3)), which is in turn due to a higher growth path in expectation as in Figure 3.
the equilibrium point moves further from “2” to “3,” which increases the equilibrium quantity of
deposits even further. This endogenous expansion of firms’ money demand allows banks’ debt to
grow faster than their equity, contributing to the procyclicality of bank leverage.
One aspect of the model that distinguishes itself from other macro-finance models is this
endogenous expansion of the demand for intermediaries’ debt. A static demand may lead to coun-
tercyclical leverage (e.g. He and Krishnamurthy (2013); Brunnermeier and Sannikov (2014)).40
This paper shares with Kiyotaki and Moore (1997) the idea that intertemporal complemen-
tarity amplifies fluctuations. Capital becomes more valuable (higher qKt ) because it grows faster,
which is in turn due to more money held by firms in the future. Through qKt , firms’ current money
demand rises in the expectation of future market market conditions. The procyclicality of money
demand contributes to the procyclicality of bank leverage and the resulting risk accumulation. As
leverage rises, bank equity becomes more sensitive to shocks, so does the whole economy through
ηt. Asset price here plays a key role in intertemporal feedback, but it differs from a typical balance-
40In this type of models, intermediaries bet on asset prices. Asset price volatility is countercyclical, so a value-at-riskconstraint can make leverage procyclical (Adrian and Boyarchenko (2012); Danielsson, Shin, and Zigrand (2012)).
25
sheet effect in Kiyotaki and Moore (1997), and more recently, Brunnermeier and Sannikov (2014).
Even though the model features a specific type of procyclical money demand motivated by
corporate cash holdings, the insight that leverage procyclicality results from money demand pro-
cyclicality is general. We would expect a booming economy to have strong transaction demand
for money-like assets issued by intermediaries. The model assumes that when firms are not expe-
riencing the Poisson liquidity shock, they can immediately respond to changes in capital value by
raising funds from banks or households to build up savings. In reality, firms may not act so swiftly.
To what extent it affects the procyclicality of bank leverage is an interesting empirical question.41
Dynamic investment inefficiency. The endogenous variation in capital price leads to a new form
of investment inefficiency. Given qKt , Corollary 1′ reveals a form of static inefficiency, measured
by the wedge between firms’ depositsmt and the contemporaneous investment target i∗t , defined by
qKt F′ (i∗t ) = 1. Static inefficiency is due to bankers’ current capacity to create money is limited.
This echoes Corollary 1 of the static model. In a dynamic setting, the target i∗t also varies with
capital value. Due to the necessity and cost of carrying deposits, qKt is smaller than qKFB, the capital
value in an unconstrained economy in which firms finance investment freely (defined below).
qKFB =α + λ
[qKFBF (iFB)− iFB
]ρ+ δ
, (18)
where the first-best investment is given by qKFBF′ (iFB) = 1. Because qKt < qKFB, the target i∗t is
below the first-best investment rate iFB. Since qKt incorporates the expectation of future paths of
deposit carry cost (the money premium), iFB − i∗t , measures a form of dynamic inefficiency.42
Stagnation and instability. Recession states are states with negative expected growth rate of Kt.
Growth is driven by investment, which is tied to firms’ money holdings. Negative shocks deplete
41Related, since deposits can be regarded as insurance against the Poisson shock and the demand for such insuranceis procyclical, this paper shares the insight of Rampini and Viswanathan (2010) that when firms are richer, they hedgemore. In Rampini and Viswanathan (2010), hedging competes with investing for limited resources, and thus, richerfirms, with more resources at hand, hedge more. In contrast, firms in this paper are always unconstrained outside ofthe Poisson times, so the procyclical demand for insurance is not driven by more resources available, but rather, by theprocyclical benefit of hedging (i.e., more valuable investment), which is in turn due to the procyclicality of qKt .
42Note that this dynamic inefficiency is about the lack of investment (productive reallocation across firms), not thedynamic inefficiency in overlapping-generation models that is due to the lack of intergenerational trade.
26
banks’ equity and elevate the required risk compensation γBt σ. At the same time, capital value
decreases. As illustrated by Figure 4, bankers’ indifference curve shifts upward and firms’ money
demand curve shifts inward, so firms hold less deposits and invest less, and the economy grows
slower. Banking crises affect the real economy through the contraction of inside money supply,
which echoes the classic account of the Great Depression by Friedman and Schwartz (1963).
Procyclical bank leverage implies stagnant recessions. Recessions happen near the issuance
boundary η where banks are undercapitalized (ηt is low) and leverage is low. Low leverage limits
the impact of good shocks on bank equity, so banks have to rebuild equity slowly. Low leverage
also limits the impact of bad shocks, but this benefit is small. Near η, the impact of bad shocks is
already bounded: bank equity never decreases below η. Low leverage and such asymmetric impact
of shocks near boundary implies the economy is stuck with undercapitalized banks for a long time.
Procyclical leverage leads to downside risk accumulation in booms. Following good shocks,
banks build up equity and leverage. As the economy approaches the payout boundary η, shock
impact becomes increasingly asymmetric. Since bank equity never rises above η, the impact of
good shocks is bounded, so high leverage only serves to amplify the impact of bad shocks on bank
equity. Therefore, as a boom prolongs, leverage builds up, and the economy becomes increasingly
fragile. Even small bad shocks can significantly deplete bank equity and trigger a recession.
Proposition 3 solves the stationary probability density of ηt (i.e., the likelihood of different
states in the long run) and the expected time to reach η ∈[η, η]
from η (“recovery time”).
Proposition 3 The stationary probability density of state variable ηt, p(η) can be solved by:
µη (η) p(η)− 1
2
d
dη
(ση (η)2 p(η)
)= 0,
where µη (η) and ση (η) are defined in Equation (11). The expected time to reach η from η, g (η)
can be solved by:1− g′ (η)µη (η)− ση (η)2
2g′′ (η) = 0,
with the boundary conditions g(η)
= 0 and g′(η)
= 0.
Solving the equilibrium. The solution of the model is a set of functions defined on[η, η]. Each
function maps the value of state variable ηt to the value of an endogenous variable. These functions
27
are separated into two sets. The first set includes the forward-looking variables(qB (ηt) , q
K (ηt)).
The second includes variables, such as banks’ leverage xt, firms’ deposits-to-capital ratio mt, and
deposit rate rt that can be solved once we know the first set of functions. We solve the second set
of variables as functions of(qB (ηt) , q
K (ηt))
and their derivatives to transform Equation (13) and
(17) into a system differential equations of(qB (ηt) , q
K (ηt))
using Ito’s lemma.
A key step is to solve bank leverage from the intersection of money demand and supply
curves. We can use the deposit market clearing condition
mtKt = (xt − 1)Et, i.e., mt = (xt − 1) ηt,
to substitute out mt with (xt − 1) ηt on the left hand side of Equation (16). On the right hand side
is the intermediary wedge, γBt σ. By knowing the function qB (ηt), we know the elasticity εBt , so
banks’ risk price, γBt , is directly linked to the equilibrium leverage as follows.
γBt = −εBt σηt , where the ηt’s instantaneous shock elasticity is σηt = (xt − 1)σ. (19)
Equation (16) has a unique solution (F ′′ (·) < 0) of leverage xt as a function of ηt, qKt , and εBt . mt
is given by deposit market clearing condition, and rt from Equation (12). Details are in Appendix
I, which also shows the existence and uniqueness of Markov equilibrium in a constructive manner.
Proposition 4 (Markov Equilibrium) There exists a unique Markov equilibrium with state vari-
able ηt that follows an autonomous law of motion in[η, η]. Given functions qB (ηt) and qK (ηt),
agents’ optimality conditions and market clearing conditions solve bank leverage, firms’ deposits,
and deposit rate as functions of ηt. Substituting these variables into bankers’ HJB equation and the
capital pricing formula (Equations (13) and (17)), we have a system of two second-order ordinary
differential equations that solves qB (ηt) and qK (ηt) under the following boundary conditions:
At η: (1) dqK(ηt)dηt
= 0; (2) qB (η) = 1 + χ; (3)d(qBt ηt)dηt
= 0;
At η: (4) dqK(ηt)dηt
= 0; (5) qB(η)
= 1; (6)d(qBt ηt)dηt
= 1.
We need exactly six boundary conditions for two second-order ordinary differential equa-
tions and two endogenous boundaries to pin down the solution. (1) and (4) prevent capital price
from jumping upon reflection, ruling out arbitrage in the market of capital. (2) and (5) are the
28
value-matching conditions for banks’ issuance and payout respectively. (3) and (6) are the smooth-
pasting conditions that guarantee that the bank shareholders’ value does not jump at the reflecting
boundaries (similar to those in Brunnermeier and Sannikov (2014) and Phelan (2016)).43
3.3 Solution
Calibration. To numerically solve the differential equations, I calibrate the model as follows. One
unit of time is set to one year. δ and σ are the mean and standard deviation of loan delinquency
rates (source: FRED). The other parameters are set to match model moments to data, such as in-
terest rate, corporate cash holdings, and economic growth. All model moments are based on the
stationary distribution. In particular, I use the mean and standard deviation of money premium to
calibrate λ, the arrival rate of liquidity shocks, and χ, the issuance cost that governs the tail be-
havior of the model. Money premium data is from Nagel (2016) (GC repo/T-bill spread). Since in
reality, money premium varies due to forces beyond the model mechanism, χ is set to a conserva-
tive value so that model-generated standard deviation is two thirds of data standard deviation. Bank
leverage is intentionally left out of the calibration, so the leverage dynamics, and the associated
boom-bust cycle, may serve for external validation. Appendix II summarizes the calibration.
Note that as in the static model, firms’ external financing capacity cannot exceed their collat-
eral value, i.e., qKt Kt in aggregate. The analysis so far has focused on the case that this constraint
never binds. This assumption is satisfied by the calibrated solution: the ratio of bank loans to
collateral value varies from 4.6% to 83.3% depending on the state of the world (i.e., ηt).44
Bank balance-sheet cycle. The state variable ηt measures the aggregate bank equity, i.e., the size
of money suppliers, relative to the size of firms (money demanders). Bank equity affects the real
economy through deposit creation. When ηt increases, banks expand balance sheets and issue more
43The market value of bank equity is qBt ηtKt. (3) guarantees the value of existing shares does not jump when banksissue news shares. (6) guarantees the value of bank equity declines exactly by the amount of dividends paid out. If (3)or (6) is violated, taking as given aggregate issuance and payout, individual banks have incentive to deviate.
44The model will have two state variables, ηt and firm equity scaled by capital stock, if in some states of the world,firms’ collateral constraint binds. This certainly enriches the model and improves its quantitative performance, butsacrifices the transparency of mechanisms. Rampini and Viswanathan (2017) study the joint dynamics of firm andintermediary equities (see also Elenev, Landvoigt, and Nieuwerburgh (2017)).
29

0 Year 2 Year 4 Year 6 Year 8 Year 10
0
0.01
0.02
0.03
0.04
0.05
0 0.01 0.02 0.03 0.04 0.050
0.2
0.4
0.6
0.8
1
0.004 0.006 0.008 0.01 0.012 0.0140
2
4
6
8
Year 2 Year 4 Year 6 Year 8 Year 100
2%
4%
6%
8%
10%
12%
Figure 5: State Variable Dynamics. This figure shows the statistical properties of state variable ηt, the ratio ofbanking capital to illiquid, productive capital. Panel A plots the simulated paths of ηt. Panel B plots the percentagechange of the expected value of η at different horizons in response to a positive shock. It shows the persistence ofshock impact. Panel C plots the stationary cumulative distribution function (C.D.F.) of ηt that starts from the issuanceboundary, passes the zero growth point, and ends at the payout boundary. Panel D plots expected years to reach a valueof η (horizontal axis) when the current state is at the issuance boundary. It ends at the zero growth point.
deposits, so firms can hold more liquidity for investment, and the economy grows faster. Figure 5
shows the statistical properties of ηt. Panel A plots several sample paths of ηt by simulating the
law of motion (Equation (11)).45 The paths are bounded by the issuance and payout boundaries.
Panel B of Figure 5 plots the impulse response function of ηt, showing that shocks have
persistent effects. Because the law of motion of ηt is non-linear and state-dependent, we cannot
define impulse response functions as in linear time series analysis. Thus, to illustrate the persistent
impact of shocks, I fix the value of ηt to the median value under the stationary distribution, and
consider an increase. The figure plots the percentage change of the term structure of expectation,
45One step is one day so the shock ∆Zt is drawn from normal distribution N (0, 1/365). Asmussen, Glynn, andPitman (1995) show a weak order of convergence of 1/2 for discretized regulated diffusion.
30
i.e., the expected value of ηt+T with T ranging from one month to ten years.46 Shock impact
dissipates gradually. The initial increase of 11.6% raises the expected value in ten years by 2.4%.
The persistence is caused by banks’ precautionary behavior, which is in turn due to the equity
issuance cost. If bankers could issue equity freely (i.e. χ = 0), they no longer need to retain equity.
Whenever qBt is above one, signaling an improvement of the investment opportunity set, bankers
raise equity from households; whenever qBt is below one, bankers distribute dividends. The dilution
cost implies that equity is only raised infrequently when qBt reaches 1 +χ, signaling severe capital
shortage. χ opens up a wedge between qBt , the value of one dollar as banks’ retained equity, and
1, the value of one dollar paid out as dividends. As a result, banks preserve a financial slackness.
Unless the economy hits the payout boundary, banks accumulate equity.
Panel C shows the stationary cumulative probability function (c.d.f.) from Proposition 3. The
curve starts from zero at the issuance boundary, and ends at one at the payout boundary. Around
50% of the time, the economy is in a region with negative growth. I calibrate the mean growth rate
to a relatively low number, 0.74% per year, which is the growth of output attributed to intangible
investment from 1995 to 2007 (Corrado and Hulten (2010)). Intangible investment, such as R&D,
relies heavily on internal liquidity, and thus, corresponds well to investment in the model.47
Panel D of Figure 5 plots the expected time to reach different values of ηt from the issuance
boundary η (Proposition 3). The right bound marks the lowest value of ηt that delivers a non-
negative economic growth rate. In expectation, it takes more than eight years to recover from the
bottom of a recession. As previously discussed, stagnation results from bank’s deleveraging in the
bad states and the asymmetric impact of shocks on bank equity near the reflecting boundaries.
Procyclicality. As illustrated by Figure 4, the money market moves with(γBt , q
Kt
), which in turn
varies with the state variable, ηt. γBt , the risk price that bankers charge for issuing safe deposits
46The expectation is calculated by the Kolmogorov backward equation (i.e. the Feynman–Kac formula), for re-flected diffusion processes. The partial differential equations are solved by the Method of Lines (Schiesser and Grif-fiths (2009)). Borovicka, Hansen, and Scheinkman (2014) provide an alternative, systematic framework to define andcalculate impulse responses and the term structure of shock elasticity for non-linear diffusion processes.
47Since Hall (1992) and Himmelberg and Petersen (1994), it has been well documented that R&D heavily relies oninternal financing (see Hall and Lerner (2009) for a survey on innovation financing). A difficulty of external financingis that the knowledge asset created by R&D is intangible, partly embedded in human capital, and is often specialized tothe particular firm in which it resides. It is difficult for investors to repossess such intangible assets in case of default.
31
0 0.01 0.02 0.03 0.04 0.050
0.1
0.2
0.3
0 0.2 0.4 0.6 0.8 112
14
16
18
20
22
24
0 0.2 0.4 0.6 0.8 10
20bp
30bp
60bp
0 0.01 0.02 0.03 0.04 0.051.254
1.256
1.258
1.26
1.262
Figure 6: Procyclical Leverage. This figure plots bank risk price γBt (Panel A) and capital price qKt (Panel B) againstthe state variable ηt. These two variables determine the locale of money market equilibrium (Figure 2). Panel C andD plot money premium and bank book leverage respectively against the stationary cumulative distribution function(C.D.F.). They show how often (horizontal axis) the variable of interest stays in certain regions (vertical axis).
backed by risky loans, drives the money supply, while qKt , the capital value, shifts firms’ money
demand curve. Panel A of Figure 6 shows γBt as a function of ηt. Because one unit of time is
set to one year, γBt is the annual Sharpe ratio of risky lending financed by risk-free deposits. γBtdecreases in ηt. When the economy is close to the bank recapitalization boundary η, banks charge
a price of risk close to 0.25; at the payout boundary, γBt is zero. Good shocks increase ηt and
decrease γBt , shifting downward the bankers’ indifference curve in Figure 4. Panel B shows that
qKt increases in ηt. Even if the variation of qKt is not quantitatively large, it is sufficient to generate
strong procyclicality of firms’ money demand that leads to procyclical bank leverage.48
48As well documented in the empirical literature, asset price variation is dominated by the variation in discount rate(e.g. Cochrane (2011)). In the model, discount rate is fixed at ρ, so the variation in qKt is purely driven by firms’ costof liquidity management (i.e. the money premium), and their choice of liquidity holdings that determines the capitalgrowth. Thus, quantitatively, we would not look for large variation in capital price over the cycle.
32
Panel C plots the equilibrium money premium, ρ − rt, against the stationary cumulative
probability of ηt. For instance, 0.2 on the horizontal axis is mapped to a money premium equal to
36bps, meaning that 20% of the time, money premium is larger than or equal to 36 basis points. The
width of an interval on horizontal axis shows how much time the economy spends in the region.
The interval [0.2, 0.3] is mapped to [32bps, 36bps], so 30% − 20% = 10% of the time, the money
premium is between 32bps and 36bps. Reading the graph from left to right, we follow a path of
positive shocks, and see as the banking sector builds up equity, their risk-taking capacity expands,
and thus, the equilibrium money premium, i.e., firms’ cost of liquidity management, declines.
Panel D plots bank leverage, xt, against the stationary cumulative probability of ηt. Leverage
is mostly procyclical. Reading the graph from left to right, we see that when bank equity increases,
banks issue even more deposits, so their leverage increases. The reason is that firm foresee a lower
cost of liquidity management going forward, and thus, assign a higher valuation of capital, making
the incentive stronger to hoard liquidity in case the investment opportunity arrives the very next
instant (Figure 3 and 4). From right to left, we see how a crisis unfolds and banks deleverage.
There is a small region near the 80th percentile, where bank leverage rises following bad
shocks (moving left). In reality, balance-sheet cyclicality may differ by the types of financial
intermediaries. Adrian and Shin (2010) find the book leverage of broker-dealers is procyclical.
He, Khang, and Krishnamurthy (2010) show that commercial banks’ leverage increased in the
2007-09 crisis. Commercial banks’ ability to issue deposits depends not only on equity as risk
buffer but also regulatory constraints and government guarantees. Banks in the model are actually
closer to shadow banks. Many have argued that the demand for money-like securities is one of the
major drivers behind shadow banking developments (e.g., Gorton (2010); Gennaioli, Shleifer, and
Vishny (2013); Pozsar (2014)). The model does not have heterogeneous intermediaries, but the
countercyclicality of leverage at high ηt reflects some complexity of the leverage cycle.
The procyclicality of bank leverage helps explain the statistical properties of the model in
Figure 5. In Panel C, there is a relatively small probability of states with high banks’ equity. In
good times, banks’ leverage is high, so the economy is sensitive to shocks. When the economy
is close to the payout boundary, the impact of good shocks is limited, because large good shocks
33
0 0.5 10
0.2
0.4
0.6
0.8
1
0 0.5 10
0.1
0.2
0.3
0.4
Figure 7: Static and Dynamic Investment Inefficiencies. This figure plots static investment inefficiency (Panel A),measured by the percentage deviation of equilibrium investment rate (it) from the target rate implied by the equilibriumcapital price (i∗t ), and dynamic investment inefficiency (Panel B), measured by the percentage deviation of target rate(i∗t ) from the first-best investment rate (iFB), against the stationary cumulative distribution function (C.D.F.). Theplots show how often (horizontal axis) the variable of interest stays in certain regions (vertical axis).
trigger dividend distribution, meaning that the banking sector cannot grow beyond η. High leverage
only serves to amplify the impact of negative shocks. Therefore, the downside risk accumulates
as leverage rises. Because of this fragility, the economy spends less time in boom. Panel D of
Figure 5 also shows the slow recovery. When the economy is close to the issuance boundary, the
impact of negative shocks is bounded. Low bank leverage only serves to reduce the impact of good
shocks on bank equity, so banks accumulate equity slowly and the economy tends to get stuck in
recessions. Countercyclical leverage would have led to the exactly opposite pattern.49
Static and dynamic inefficiencies. In Corollary 1′, the money premium is equal to bankers’ re-
quired risk compensation γBt σ. A higher γBt , and thus, a higher money premium, directly translates
into a larger gap between the cash-constrained investment rate and the current target rate i∗t , defined
by qKt F′ (i∗t ) = 1. Panel A of Figure 7 shows the static inefficiency, measured by the percentage
deviation of the actually investment rate from the target, i∗t . As bankers’ risk capacity increases,
the money premium declines, and firms hold more deposits for investment. Moving from the left
to the right, the investment wedge declines from 95% at the depth of recession to 0% at η.
49Models with countercyclical leverage generate instability through other mechanisms, such as fire sale in He andKrishnamurthy (2013) and Brunnermeier and Sannikov (2014), which need intermediaries to hold long-term assets,and thereby, are exposed to endogenous volatility of asset prices. To highlight the novel link between leverage andmoney demand, I shut down this channel by restricting banks’ investment to short-term loans.
34
Panel B of Figure 7 shows the dynamic inefficiency, measured by the percentage deviation
of the current target from the first-best investment rate defined by Equation (18). The wedge varies
with capital price, and declines as ηt increases, because qKt increases in ηt (as shown in Panel B of
Figure 6). Around 50% of the time, the current target is 25% or more below the first-best level.
Investment inefficiencies decrease welfare. Given the constant productivity α, the aggregate
consumption is determined by the capital stock Kt. Under risk-neutral preference, what matters,
from a welfare perspective, is the expected growth rate of Kt, i.e., λF (mt)−δ, newly created cap-
ital net of destroyed existing capital. Therefore, through firms’ liquidity constraint on investment,
welfare is tied to money creation. Insufficient inside money suggests the government has a role in
supplying outside money. Does outside money really improve welfare? How will banks respond?
Will outside money stabilize the economy? The next section aims to answer these questions.
4 Government Debt: Instability, Stagnation, and Welfare
It has long been recognized that government debt offers monetary services (Patinkin (1965); Fried-
man (1969)). Repo market developments since 1980s enhanced the liquidity of Treasury securities
(Fleming and Garbade (2003)). In this section, I introduce government debt as “outside money”,
an alternative to bank debt. Whether outside money alleviates the money shortage faced by firms
depends on how banks react. The competition between inside and outside money can destabilize
the economy by amplifying bank leverage cycle, and thereby, exacerbate investment inefficien-
cies. These findings complement the literature on government debt as a means to financial stability
(Greenwood et al. (2015); Krishnamurthy and Vissing-Jørgensen (2015); Woodford (2016)).
Setup. Firms can hold bank debt or government debt to relax the liquidity constraint on invest-
ments. Thus, issued at t, government debt pays the same risk-free rate as deposits, rtdt, at t + dt.
To focus on the liquidity provision role of government debt, I abstract away other fiscal distortions:
issuance proceeds are distributed as lump-sum payments and debt is repaid with lump-sum tax on
households. Moreover, I assume the government faces a debt limit that is proportional to the scale
of the economy, i.e., MGKt, and consider a debt management strategy in line with Friedman’s rule
35
– the government always issues the maximum amount when the money premium is positive.50
Firms’ money holdings per unit of capital are now mt + MG. Substituting it into the opti-
mality condition of deposit holdings in Lemma 1′, we have a new deposit demand curve:
ρ− rt = λ[qKt F
′ (mt +MG)− 1]
.
Because F (·) is a concave function, the demand curve is shifted inward. Introducing government
debt reduces the marginal benefit of deposit holdings (mt), and the equilibrium money premium.
By helping firms manage liquidity, government debt is likely to have a positive effect on invest-
ment and growth, which is similar to the investment crowding-in effect in Woodford (1990b) and
Holmstrom and Tirole (1998).51 However, the actual effect depends on how banks react.
This setup does not distinguish Treasury securities from central bank liabilities that pay in-
terests. It intends to capture outside money supply from the traditional expansion of monetary base
and from government issuing liquid securities. Accordingly, the setup has an alternative interpre-
tation. Government debt is held by a central bank, who issues an equal amount of reserves that pay
the same interest rate. Reserves are held by banks who in turn issue an equal amount of deposits
to firms. On this chain, both the central bank and banks are just pass-throughs. Intermediating
between risk-free assets and liabilities does not require additional bank equity. In reality, the line
between short-term Treasury securities and reserves is becoming increasingly blurry.52 Interest
on reserves has been introduced in countries such as the U.K. and the U.S. Federal Reserve now
allows the public to hold reserves through money market funds that are reverse repo counterparties.
Leverage cycle and instability. Figure 8 compares the model’s performances when the govern-
50Friedman’s rule says individuals’ opportunity cost to hold money should be equal to the social cost of creatingmoney (Friedman (1969); Woodford (1990a)). Firms’ opportunity cost to hold money is ρ− rt, the money premium.The private sector’s marginal cost of money creation is γBt σ, the risk compensation charged by bankers. In contrast,the government’s cost of money creation is zero as I already assume away any fiscal distortions. Therefore, Friedman’srule suggests that the government should maximize its debt issuance (i.e., outside money supply). However, as will bediscussed later, because outside money crowds out inside money, Friedman’s rule is not necessarily optimal.
51The traditional crowding-out effect describes how the government debt supply raises interest rate in general, andthereby crowds out private investment through a higher financing cost. My model does not entertain this effect, becauseby shutting down external financing completely, the model has cash being the only determinant of investment.
52The liquidity coverage ratio (Basel Committee on Bank Supervision (2013)), which counts government securitiesas banks’ liquidity holdings, is introduced as a modern version of reserves requirement.
36
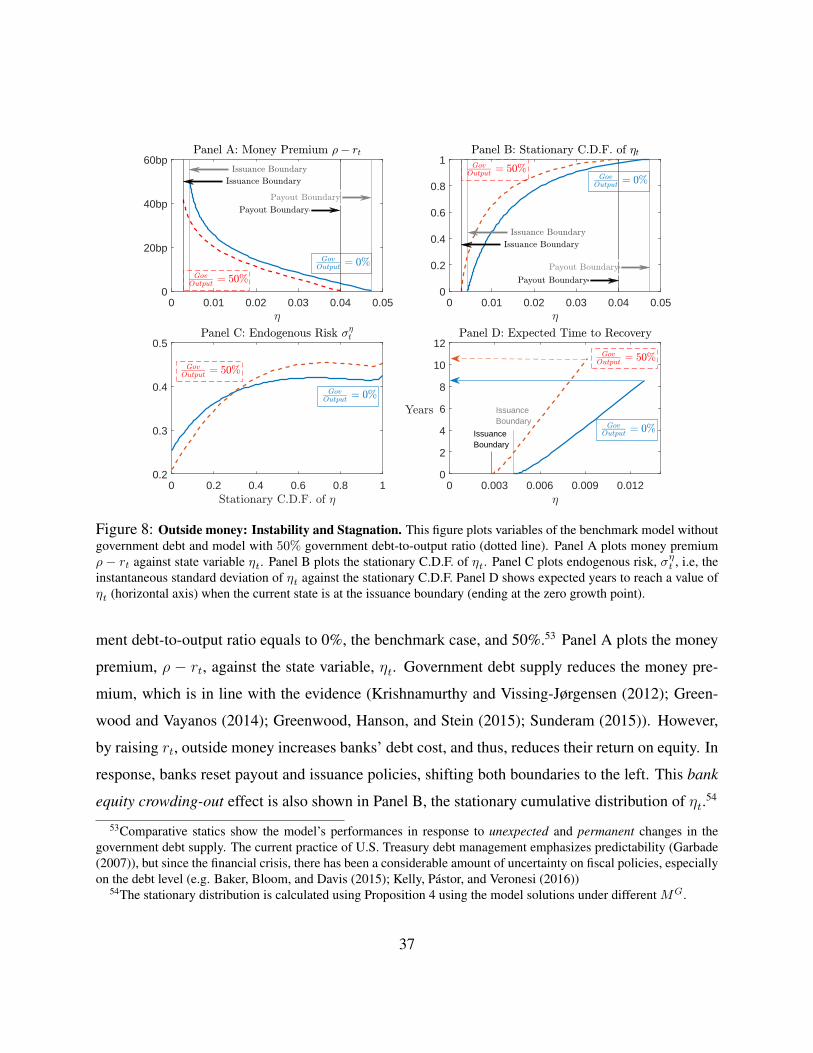
0 0.01 0.02 0.03 0.04 0.050
20bp
40bp
60bp
0 0.2 0.4 0.6 0.8 10.2
0.3
0.4
0.5
0 0.01 0.02 0.03 0.04 0.050
0.2
0.4
0.6
0.8
1
0 0.003 0.006 0.009 0.0120
2
4
6
8
10
12
IssuanceBoundary
IssuanceBoundary
Figure 8: Outside money: Instability and Stagnation. This figure plots variables of the benchmark model withoutgovernment debt and model with 50% government debt-to-output ratio (dotted line). Panel A plots money premiumρ − rt against state variable ηt. Panel B plots the stationary C.D.F. of ηt. Panel C plots endogenous risk, σηt , i.e, theinstantaneous standard deviation of ηt against the stationary C.D.F. Panel D shows expected years to reach a value ofηt (horizontal axis) when the current state is at the issuance boundary (ending at the zero growth point).
ment debt-to-output ratio equals to 0%, the benchmark case, and 50%.53 Panel A plots the money
premium, ρ − rt, against the state variable, ηt. Government debt supply reduces the money pre-
mium, which is in line with the evidence (Krishnamurthy and Vissing-Jørgensen (2012); Green-
wood and Vayanos (2014); Greenwood, Hanson, and Stein (2015); Sunderam (2015)). However,
by raising rt, outside money increases banks’ debt cost, and thus, reduces their return on equity. In
response, banks reset payout and issuance policies, shifting both boundaries to the left. This bank
equity crowding-out effect is also shown in Panel B, the stationary cumulative distribution of ηt.54
53Comparative statics show the model’s performances in response to unexpected and permanent changes in thegovernment debt supply. The current practice of U.S. Treasury debt management emphasizes predictability (Garbade(2007)), but since the financial crisis, there has been a considerable amount of uncertainty on fiscal policies, especiallyon the debt level (e.g. Baker, Bloom, and Davis (2015); Kelly, Pastor, and Veronesi (2016))
54The stationary distribution is calculated using Proposition 4 using the model solutions under different MG.
37
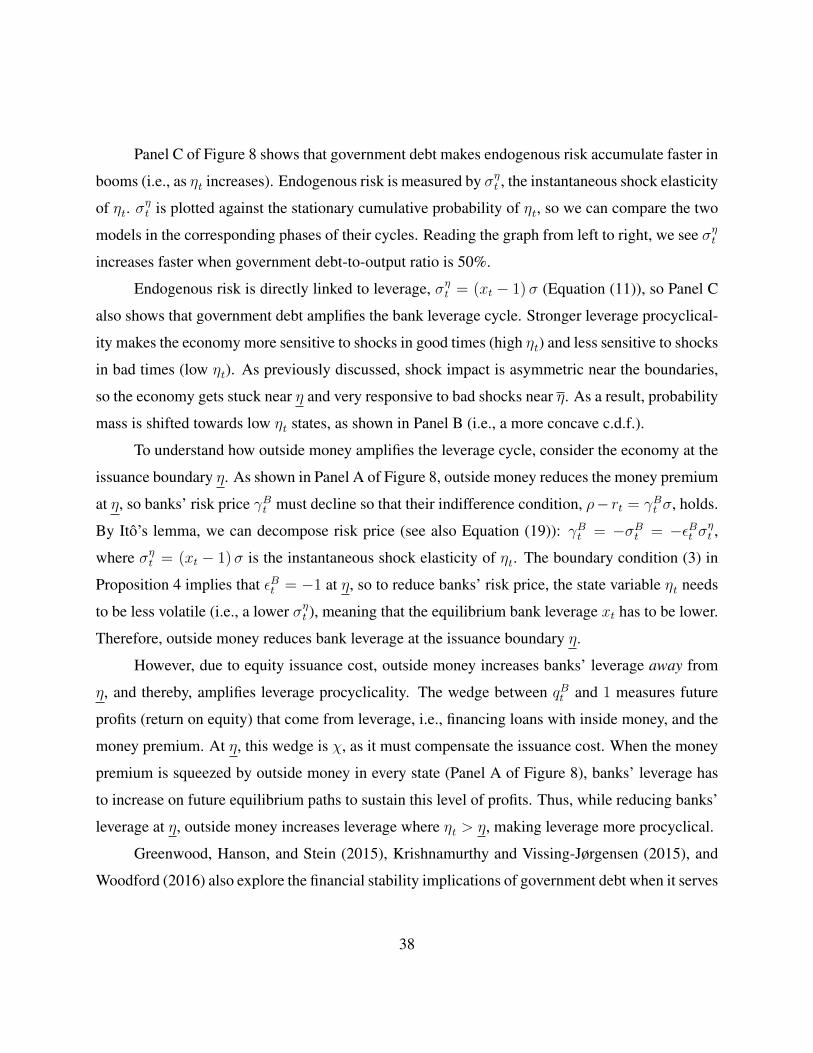
Panel C of Figure 8 shows that government debt makes endogenous risk accumulate faster in
booms (i.e., as ηt increases). Endogenous risk is measured by σηt , the instantaneous shock elasticity
of ηt. σηt is plotted against the stationary cumulative probability of ηt, so we can compare the two
models in the corresponding phases of their cycles. Reading the graph from left to right, we see σηtincreases faster when government debt-to-output ratio is 50%.
Endogenous risk is directly linked to leverage, σηt = (xt − 1)σ (Equation (11)), so Panel C
also shows that government debt amplifies the bank leverage cycle. Stronger leverage procyclical-
ity makes the economy more sensitive to shocks in good times (high ηt) and less sensitive to shocks
in bad times (low ηt). As previously discussed, shock impact is asymmetric near the boundaries,
so the economy gets stuck near η and very responsive to bad shocks near η. As a result, probability
mass is shifted towards low ηt states, as shown in Panel B (i.e., a more concave c.d.f.).
To understand how outside money amplifies the leverage cycle, consider the economy at the
issuance boundary η. As shown in Panel A of Figure 8, outside money reduces the money premium
at η, so banks’ risk price γBt must decline so that their indifference condition, ρ− rt = γBt σ, holds.
By Ito’s lemma, we can decompose risk price (see also Equation (19)): γBt = −σBt = −εBt σηt ,where σηt = (xt − 1)σ is the instantaneous shock elasticity of ηt. The boundary condition (3) in
Proposition 4 implies that εBt = −1 at η, so to reduce banks’ risk price, the state variable ηt needs
to be less volatile (i.e., a lower σηt ), meaning that the equilibrium bank leverage xt has to be lower.
Therefore, outside money reduces bank leverage at the issuance boundary η.
However, due to equity issuance cost, outside money increases banks’ leverage away from
η, and thereby, amplifies leverage procyclicality. The wedge between qBt and 1 measures future
profits (return on equity) that come from leverage, i.e., financing loans with inside money, and the
money premium. At η, this wedge is χ, as it must compensate the issuance cost. When the money
premium is squeezed by outside money in every state (Panel A of Figure 8), banks’ leverage has
to increase on future equilibrium paths to sustain this level of profits. Thus, while reducing banks’
leverage at η, outside money increases leverage where ηt > η, making leverage more procyclical.
Greenwood, Hanson, and Stein (2015), Krishnamurthy and Vissing-Jørgensen (2015), and
Woodford (2016) also explore the financial stability implications of government debt when it serves
38
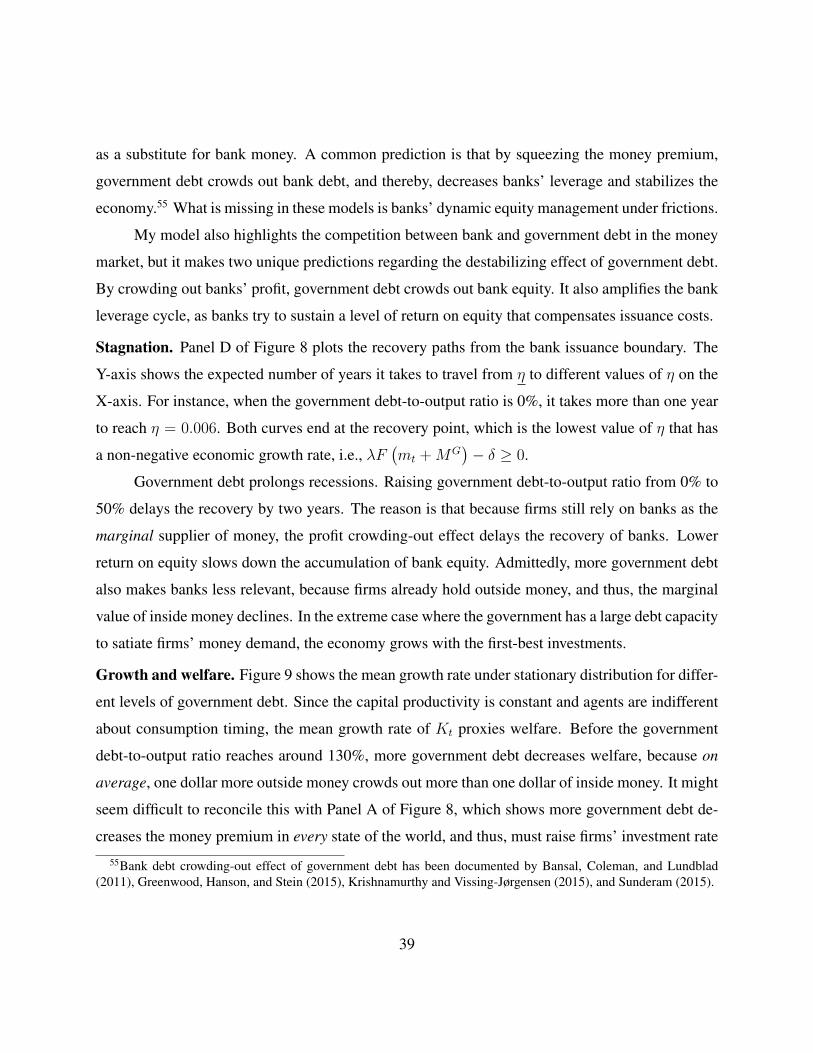
as a substitute for bank money. A common prediction is that by squeezing the money premium,
government debt crowds out bank debt, and thereby, decreases banks’ leverage and stabilizes the
economy.55 What is missing in these models is banks’ dynamic equity management under frictions.
My model also highlights the competition between bank and government debt in the money
market, but it makes two unique predictions regarding the destabilizing effect of government debt.
By crowding out banks’ profit, government debt crowds out bank equity. It also amplifies the bank
leverage cycle, as banks try to sustain a level of return on equity that compensates issuance costs.
Stagnation. Panel D of Figure 8 plots the recovery paths from the bank issuance boundary. The
Y-axis shows the expected number of years it takes to travel from η to different values of η on the
X-axis. For instance, when the government debt-to-output ratio is 0%, it takes more than one year
to reach η = 0.006. Both curves end at the recovery point, which is the lowest value of η that has
a non-negative economic growth rate, i.e., λF(mt +MG
)− δ ≥ 0.
Government debt prolongs recessions. Raising government debt-to-output ratio from 0% to
50% delays the recovery by two years. The reason is that because firms still rely on banks as the
marginal supplier of money, the profit crowding-out effect delays the recovery of banks. Lower
return on equity slows down the accumulation of bank equity. Admittedly, more government debt
also makes banks less relevant, because firms already hold outside money, and thus, the marginal
value of inside money declines. In the extreme case where the government has a large debt capacity
to satiate firms’ money demand, the economy grows with the first-best investments.
Growth and welfare. Figure 9 shows the mean growth rate under stationary distribution for differ-
ent levels of government debt. Since the capital productivity is constant and agents are indifferent
about consumption timing, the mean growth rate of Kt proxies welfare. Before the government
debt-to-output ratio reaches around 130%, more government debt decreases welfare, because on
average, one dollar more outside money crowds out more than one dollar of inside money. It might
seem difficult to reconcile this with Panel A of Figure 8, which shows more government debt de-
creases the money premium in every state of the world, and thus, must raise firms’ investment rate
55Bank debt crowding-out effect of government debt has been documented by Bansal, Coleman, and Lundblad(2011), Greenwood, Hanson, and Stein (2015), Krishnamurthy and Vissing-Jørgensen (2015), and Sunderam (2015).
39
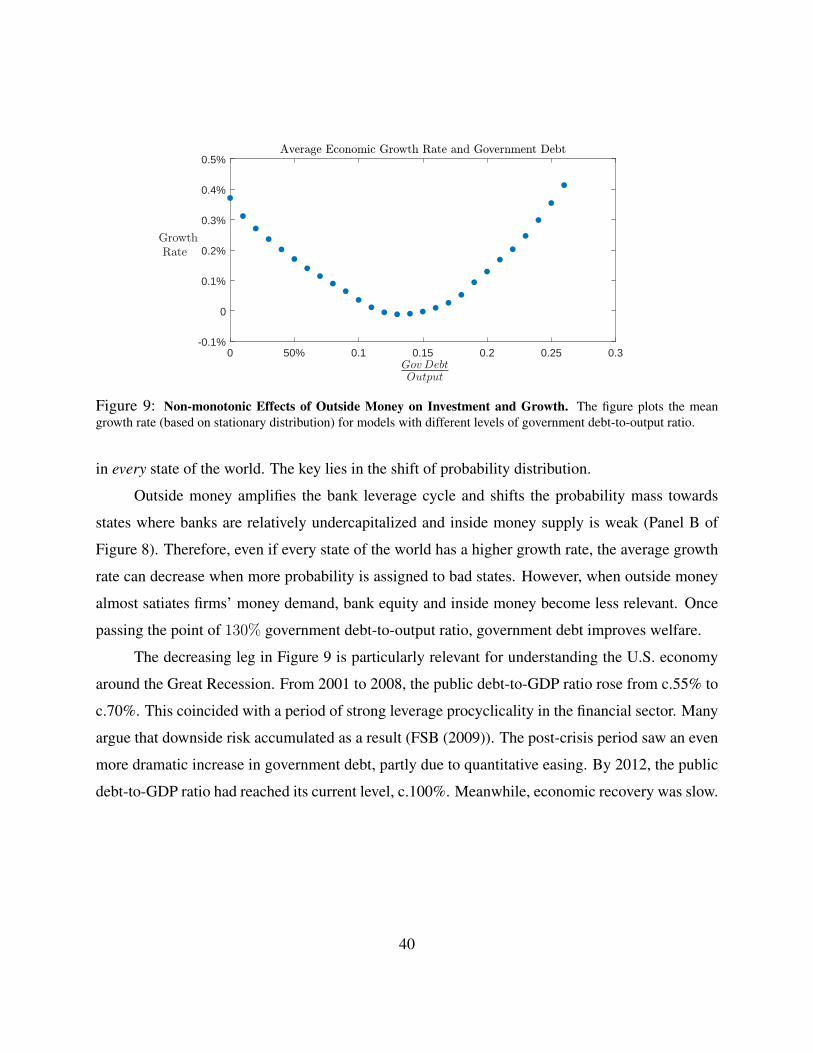
0 50% 0.1 0.15 0.2 0.25 0.3-0.1%
0
0.1%
0.2%
0.3%
0.4%
0.5%
Figure 9: Non-monotonic Effects of Outside Money on Investment and Growth. The figure plots the meangrowth rate (based on stationary distribution) for models with different levels of government debt-to-output ratio.
in every state of the world. The key lies in the shift of probability distribution.
Outside money amplifies the bank leverage cycle and shifts the probability mass towards
states where banks are relatively undercapitalized and inside money supply is weak (Panel B of
Figure 8). Therefore, even if every state of the world has a higher growth rate, the average growth
rate can decrease when more probability is assigned to bad states. However, when outside money
almost satiates firms’ money demand, bank equity and inside money become less relevant. Once
passing the point of 130% government debt-to-output ratio, government debt improves welfare.
The decreasing leg in Figure 9 is particularly relevant for understanding the U.S. economy
around the Great Recession. From 2001 to 2008, the public debt-to-GDP ratio rose from c.55% to
c.70%. This coincided with a period of strong leverage procyclicality in the financial sector. Many
argue that downside risk accumulated as a result (FSB (2009)). The post-crisis period saw an even
more dramatic increase in government debt, partly due to quantitative easing. By 2012, the public
debt-to-GDP ratio had reached its current level, c.100%. Meanwhile, economic recovery was slow.
40

5 Conclusion
This paper revisits the money view of banking. To buffer liquidity shocks, firms hold inside money
issued by banks. Banking crises cause the contraction of inside money supply, which compromises
firms’ liquidity management. The frequency and duration of crisis depend on the bank leverage
cycle and banks’ payout and equity issuance decisions. Another theme is how government debt
(outside money) may contribute to financial instability. By squeezing banks’ profits from money
creation, government debt crowds out bank equity and amplifies the leverage cycle, and thus, may
reduce welfare. The key to this destabilizing effect is banks’ dynamic balance-sheet management
under equity issuance frictions, which has been ignored by the pioneer works in the literature.
In the model, the government walks on a tightrope. Increasing government debt temporarily
alleviates the liquidity shortage that firms face, but in the long run, by crowding out bank equity and
amplifying bank leverage cycle, it can crowd out more inside money, causing more severe liquidity
shortage. This trade-off suggests that optimal strategy of outside money supply is macroprudential,
i.e., contingent on the relative tightness of banks’ and firms’ financial constraints.
In this paper, outside money crowds out inside money. In a richer environment, outside
money can crowd in inside money. Banks hold outside money to buffer their own liquidity shocks,
so by relaxing banks’ liquidity constraint, outside money allows banks to expand balance sheet and
issue more inside money. The proceeds from outside money issuance can be used by governments
to recapitalize banks, preventing a sudden evaporation of inside money due to banks’ default.
The demand for money-like securities, or safe assets in general, has attracted enormous at-
tention. Theoretical studies in the literature devote tremendous effort in characterizing the issuers,
intermediaries for instance, while relegate the modeling of investors who demand money or safe
assets, often by assuming money in utility. This paper takes a step forward, relating money de-
mand to corporate liquidity management. Other sources of demand, such as foreign sovereigns
and institutional investors, should also be modeled carefully. The endogenous and distinct dy-
namics of different money market investors is as important as the behavior of issuers (financial
intermediaries), when it comes to understand the causes and consequences of financial crisis.
41
Appendix I Proofs
I.1 Static Model
Firms’ problem. Let k0 (s) denote capital endowments of a firm s at t = 0, and k0 (s) its capital
demand. Aggregate stock K0 is∫s∈[0,1] k0 (s) ds. Capital market clears, so K0 =
∫s∈[0,1] k0 (s) ds.
To save notations, I suppress firm index s. Given qK0 , a firm’s wealth is w0 = qK0 k0. At t = 0, a
firm chooses capital k0, deposits per unit of capital m0, consumption c0, the value of bank loan l0,
and funds raised by issuing securities to households h0, and at t = 1, chooses investment rate i1.
By promising to expected payments of vH1 at t = 1, a firm raises h0 from households at
t = 0. Given household discount rate ρ, a competitive security market implies vH1 = h0 (1 + ρ) .
Let v0 denote the firm’s value function, which is equal to maxc0≥0,h0≥0
c0+ 11+ρ
(v∗1 − vH1
), where
v∗1 is the maximized expected value before repaying households, a function of other optimal choices
(k0, m0, l0, i1). Substituting vH1 = h0 (1 + ρ) into the expression, we have
v0 = maxc0≥0,h0≥0
c0 − h0 +1
1 + ρv∗1 .
Therefore, what matters is the net consumption (c0−h0) or net financing (h0−c0). Going forward,
we allow c0 to take positive or negative values. When c0 > 0, the entrepreneur consumes, and when
c0 < 0, the entrepreneur raises funds from households. We can write the firms’ value function as
v0 = maxcB0 ∈R
c0 +1
1 + ρv∗1 .
The firm can also issue securities to banks. Let vB1 denote the firm’s expected repayment
to banks at t = 1. Note that in the analysis of the firm’s problem, we do not need to specify the
contractual form of securities issued to banks or households. All that matters is the expected repay-
ment. Let v∗∗1 denote the maximized expected value of the firm before repaying both households
and banks, so v∗∗1 = v∗1 + vB1 by definition. We can rewrite the value function as
v0 = maxcB0 ∈R
c0 +1
1 + ρ
(v∗∗1 − vB1
).
Because bank debt earns a money premium, the required rate of return of banks can be different
from that of households. Let ρB0 denote banks’ required expected return in equilibrium. For the
42

firm to raise l0 from banks at t = 0, it must deliver an expected repayment to competitive banks
equal to vB1 = l0(1 + ρB0
). Thus, we can rewrite the value function as
v0 = maxcB0 ∈R,l0≥0
c0 −1 + ρB01 + ρ
l0 +1
1 + ρv∗∗1 , (20)
where v∗∗ is a function of other optimal choices (k0, m0, i1). If ρB0 < ρ, the firm only issue
securities to banks; likewise, if ρ < ρB0 , the firm only issue securities to households if at all. Since
we study an equilibrium where firms do borrow from banks, it must be true that ρB0 ≤ ρ.
The firm’s financing capacity depends on its pledgeable value at t = 1. Newly created capital
is not pledgeable, and a fraction δ−σZ1 of existing capital will be gone by t = 1 (with E0 [Z1] = 0),
so the expected pledgeable value is αk0 (1− δ). The firm faces the following financing constraint:
l0(1 + ρB0
)+ I{c0<0} (−c0) (1 + ρ) ≤ αk0 (1− δ) , (21)
where I{·} is an indicator function. Note that when −c0 < 0, the firm raises |c0| from households.
The firm also faces the budget constraint and the liquidity constraint:
c0 + qK0 k0 +m0k0 ≤ w0 + l0, where c0 ∈ R, (22)
i1 ≤ m0. (23)
Given capital price qK0 , the deposit rate r0, and the required expected return of banks ρB0 , the
firm maximizes the objective in Equation (20) subject to constraints (21), (22), and (23), with the
expected total firm value (before repayment to investors) at t = 1 given by
v∗∗ = αk0 (1− δ)︸ ︷︷ ︸expected surviving capital value
+ (1 + r0)m0k0deposits
+ λ (αF (i1)− i1) k0expected new capital net value
. (24)
Let κ0, ψ0, and θ0 denote the Lagrange multipliers of the financing, budget, and liquidity
constraints respectively. We can write the Lagrange (omitting the non-negativity constraints):
v0 = maxcI0∈R,l0≥0,k0≥0,m0≥0,i1≥0
c0 −1 + ρB01 + ρ
l0 +1
1 + ρ[αk0 (1− δ) + (1 + r0)m0k0
+λ (αF (i1)− i1) k0] + θ0 (m0 − i1)
+κ0[αk0 (1− δ)− l0
(1 + ρB0
)− I{c0<0} (−c0) (1 + ρ)
]+ψ0
(w0 + l0 − c0 − qK0 k0 −m0k0
).
43
Proof of Lemma 2. First, we solve ψ0. We must have the coefficient of c0 equal to zero
1 + κ0Ic0<0 (1 + ρ)− ψ0 = 0, (25)
Because c0 can take either positive or negative values. In equilibrium, banks lend out at least some
of their goods endowments to firms to carry net worth to t = 1. Because goods cannot be stored,
in aggregate, entrepreneurs must consume, so c0 > 0, so from Equation (25), ψ0 = 1.
Next, we solve κ0, the shadow value of financing. In equilibrium l0 > 0 (i.e., not a corner
solution), so locally the entrepreneur must be indifferent. Thus, the coefficient of l0 is equal to zero
− 1 + ρB01 + ρ
− κ0(1 + ρB0
)+ ψ0 = 0. (26)
Substituting ψ0 = 1 into Equation (26), we have
κ0 =1
1 + ρB0− 1
1 + ρ. (27)
If the firm promises one unit of goods in expectation at t = 1, it can obtain 11+ρB0
bank financing and1
1+ρhousehold financing at t = 0. Intuitively, κ0 is the difference between the price of securities
issued to banks and the price of securities issued to households. κ0 > 0 if and only if ρB0 < ρ.
Multiplying both sides of Equation (27) by(1 + ρB0
)(1 + ρ), we have
κ0(1 + ρB0
)(1 + ρ) = ρ− ρB0
Expanding the left hand side we have, κ0 + κ0ρB0 + κ0ρ + κ0ρ
B0 ρ. The current time interval is 1,
but if we let ∆ denote the length of time between date 0 and 1, the product terms on the left-hand
side are of the order of ∆2 or higher. As ∆ shrinks to zero, these terms approach to zero at a faster
pace. To approximate the continuous-time expression, we ignore those product terms, so we have
κ0 = ρ− ρB0 = ρ− (R0 − δ) . (28)
Proof of Lemma 1. The firm’s first order condition with respect to m0 is
1
1 + ρ(1 + r0) k0 − ψ0k0 + θ0 = 0. (29)
The first order condition with respect to i1 is
1
1 + ρλ (αF ′ (i1)− 1) k0 − θ0 = 0. (30)
44
Summing up Equation (29) and (30), we have
1
1 + ρ(1 + r0) k0 − ψ0k0 +
1
1 + ρλ (αF ′ (i1)− 1) k0 = 0. (31)
We focus on the situation where the investment technology F (·) is so productive that the liquidity
constraint always binds, so i1 = m0. Substituting ψ0 = 1 and rearranging the equation, we have
r0 − ρ+ λ (αF ′ (m0)− 1) = 0. (32)
Proof of Lemma 3. The expected return on bank equity is:
x0 (1 +R0 − E [π (Z1)])− (x0 − 1) (1 + r0) = 1 + r0 + x0 (R0 − E [π (Z1)]− r0) .
Note that E [πD (Z1)] = δ. When Z1 = −1, the realized return on bank equity is:
1 + r0 + x0 (R0 − δ − σ − r0) .
The representative bank starts with equity e0 and has the following value function:
v (e0;R0, r0) = maxy0≥0,x0≥0
y0e0 +e0 (1− y0)
(1 + ρ){1 + r0 + x0 (R0 − δ − r0)
+ ξ0 [1 + r0 + x0 (R0 − δ − σ − r0)]},
where y0 is the banker’s consumption-to-wealth ratio. The first order condition for x0 is:
R0 − r0 = δ + γB0 σ, (33)
where γB0 = ξ01+ξ0
∈ [0, 1) because ξ0 ≥ 0. Rearranging the equation, we have γB0 equal to the
Sharpe ratio of loans: γB0 = R0−δ−r0σ
. When γB0 > 0, the capital adequacy constraint binds. Sub-
stituting the F.O.C. for x0 into the value function, we have: v (e0;R0, r0) = y0e0 + qB0 (e0 − y0e0) ,
where qB0 = (1+r0)(1+ξ0)(1+ρ)
. The bank chooses y0 > 0 only if qB0 ≤ 1.
Proofs of Proposition 1 and Corollary 1. Proofs are provided in the main text.
I.2 Continuous-time Model
Firms’ problem: proof of Lemma 1′, Lemma 2′, and Proposition 2. Entrepreneurs (“firms”)
maximize life-time utility, E[∫ +∞
t=0e−ρtdct
], subject to the following wealth (equity) dynamics:
45
dwt = −dct + µwt wtdt+ σwt wtdZt + (wt − wt) dNt,
µwt wt and σwt wt are the drift and diffusion terms that depend on choices of capital and deposit
holdings and will be elaborated later. dNt is the increment of the idiosyncratic counting (Poisson)
process. dNt = 1 if an investment opportunity arrives. At the Poisson time, firm equity jumps to
wt = wt + qKt F (mt) kt −mtkt.
We may conjecture that the value function is linear in equity wt: Vt = ζtwt, where ζt is the
marginal value of equity, and in equilibrium, follows a diffusion process:
dζt = ζtµζtdt+ ζtσ
ζtdZt,
where ζtµζt and ζtσ
ζt are th drift and diffusion terms respectively. Note that firms’ marginal value of
wealth, ζt, is a summary statistic of firms’ investment opportunity set, which depends on the overall
industry dynamics, so it does not jump when an individual firm is hit by investment opportunities.
Under this conjecture, the Hamilton-Jacobi-Bellman (HJB) equation is
ρVtdt = maxdct∈R,kt≥0,mt≥0,lt≥0
dct − ζtdct + {wtζtµζt + wtζtµwt + wtζtσ
ζtσ
wt + λζt [wt − wt]}dt.
By the same logic in the analysis of firms’ problem in the static model, firms’ negative consumption
is equivalent to raising funds from households. Firms can choose any dct ∈ R, so ζt must be equal
to one, and thus, I have also confirmed the value function conjecture.
Since ζt is a constant equal to one, µζt and σζt are both zero. The HJB equation is simplified:
ρVtdt = maxkt≥0,mt≥0,lt≥0
µwt wtdt+ λ[qKt F (mt)−mt
]ktdt. (34)
Equity drift has production, value change of capital holdings, deposit return, and loan repayment:
µwt wtdt = αktdt+ Et(qKt+dtkt+dt − qKt kt
)+ rtmtktdt− lt (Rt − δ) dt
Let dψt denote the Lagrange multiplier of the budget constraint, qKt kt + mtkt ≤ wt + lt. The
first-order condition (F.O.C.) for optimal deposit holdings per unit of capital is: mt ≥ 0, and
46
mt
{rtdt+ λ
[qKt F
′ (mt)− 1]dt− dψt
}= 0.
A fraction (δdt− σdZt) of capital is to be destroyed, so the capital evolves as
kt+dt = kt − (δdt− σdZt) kt.
Given the equilibrium capital price dynamics, dqKt = qKt µKt dt+ qKt σ
Kt dZt, we have
qKt+dtkt+dt − qKt kt = qKt kt[− (δdt− σdZt) + µKt dt+ σKt dZt + σσKt dt
].
The F.O.C. for optimal capital holdings is : kt ≥ 0, and
kt{αdt+ qKt
(−δ + µKt + σσKt
)dt+ rtmtdt+ λdt
[qKt F (mt)−mt
]−(qKt +mt
)dψt}
= 0.
The F.O.C. for optimal borrowing from banks is: lt ≥ 0, and
− (Rt − δ) dt+ dψt = 0.
Finally, we have the complementary slackness condition: dψt ≥ 0, and(wt + lt − qKt kt −mtkt
)dψt = 0.
Substituting these optimality conditions into the HJB equation, we have
ρVtdt = wtdψt.
Because ζt = 1, Vt = wt, and dψt = ρdt. Substituting dψt = ρdt into the F.O.C. for mt, we have
rt + λ[qKt F
′ (mt)− 1]
= ρ.
Substituting dψt = ρdt into the F.O.C. for kt and rearranging the equation, we have
qKt =α− (ρ− rt)mt + λ
[qKt F (mt)−mt
]ρ− (µKt − δ + σσKt )
.
Substituting dψt = ρdt into the F.O.C. for lt, we have
Rt = ρ+ δ.
Banks’ problem: proof of Lemma 3′. Conjecture that the bank’s value function takes the linear
47
form: vt = qBt et. In equilibrium, the marginal value of equity, qBt , evolves as follows
dqBt = qBt µBt dt+ qBt σ
Bt dZt.
Under this conjecture, the HJB equation is
ρvtdt = maxdyt∈R
{(1− qBt
)I{dyt>0}etdyt +
(qBt − 1− χ
)I{dyt<0}et (−dyt)
}+µBt q
Bt et + max
xt≥0
{rt + xt (Rt − δ − rt)− xtγBt σ
}qBt et − ιqBt et,
where γBt = −σBt . Dividing both sides by qBt et, we eliminate et in the HJB equation,
ρ = maxdyt∈R
{(1− qBt
)qBt
I{dyt>0}dyt +
(qBt − 1− χ
)qBt
I{dyt<0} (−dyt)}
+µBt + maxxt≥0
{rt + xt (Rt − δ − rt)− xtγBt σ
}− ι,
and thus, confirm the conjecture of linear value function.
qBt is the marginal value of equity. Paying out one dollar of dividend, the bank’s shareholders
receive 1, but lose qBt . Only when qBt ≤ 1, dyt > 0. When the bank issues equity, it incurs a dilution
cost. From the existing shareholders’ perspective, one dollar equity is sold to outside investors at
price qBt1+χ
. To raise (−dyt) et that is worth qBt (−dyt) et, the bank must issue (1+χ)(−dyt)etqBt
shares,
and thus, the existing shareholders give up total value of qBt(1+χ)(−dyt)et
qBt= (1 + χ) (−dyt) et.
Therefore, the bank raises equity only if qBt ≥ 1 + χ. Finally, the indifference condition for xt is
Rt− δ− rt = γtσ. If Rt− δ− rt < γtσ, xt is set to zero; if Rt− δ− rt > γtσ, xt is set to infinity.
Proof of Proposition 1′. Proof is provided in the main text.
Proof of Corollary 1′. Proof is provided in the main text.
Proof of Lemma 4. First, I derive equation (11). Because individual banks share the same µet , σet ,
and payout/issuance rate dyt, aggregating over banks, the law of motion of Et is
dEt = µetEtdt+ σetEtdZt − dytEt.
Given the expected growth rate, λF (mt)−δ, which is the investment net of expected depreciation,
the aggregate capital stock, Kt, evolves as: dKt = [λF (mt)− δ]Ktdt+ σKtdZt.
48
By Ito’s lemma, the ratio, ηt = EtKt
, has the following law of motion:
dηt =1
Kt
dEt −EtK2t
dKt +1
K3t
〈dKt, dKt〉 −1
K2t
〈dEt, dKt〉 ,
where 〈dXt, dYt〉 denotes the quadratic covariation of diffusion processes Xt and Yt, so we have
〈dKt, dKt〉 = σ2K2t dt, and 〈dEt, dKt〉 = σetσEtKtdt. Dividing both sides by ηt, we have
dηtηt
=dEtEt− dKt
Kt
+ σ2dt− σetσdt.
Substituting the law of motions of Et and Kt into the equation above, we have Equation (11). The
boundaries are given by banks’ optimal payout and issuance policies in Proposition 3′.
Proof of Proposition 3. Following Brunnermeier and Sannikov (2014), I derive the stationary
probability density. Probability density of ηt at time t, p (η, t), has Kolmogorov forward equation
∂
∂tp (η, t) = − ∂
∂η(ηµη (η) p (η, t)) +
1
2
∂2
∂η2(η2ση (η)2 p (η, t)
).
Note that in a Markov equilibrium, µηt and σηt are functions of ηt. A stationary density is a solution
to the forward equation that does not vary with time (i.e. ∂∂tp (η, t) = 0). So I suppress the time
variable, and denote stationary density as p (η). Integrating the forward equation over η, p (η)
solves the following first-order ordinary differential equation within the two reflecting boundaries:
0 = C − ηµη (η) p (η) +1
2
d
dη
(η2ση (η)2 p (η)
), η ∈
[η, η]
.
The integration constantC is zero because of the reflecting boundaries. The boundary condition for
the equation is the requirement that probability density is integrated to one (i.e.∫ ηηp (η) dη = 1).
Next, I solve the expected time to reach from η. Define fη0 (η) the expected time it takes to
reach η0 starting from η ≤ η0. Define g (η0) = fη0(η)
the expected time to reach η0 from η. One
has to reach η ∈(η, η0
)first and then reach η0 from η. Therefore, g (η) + fη0 (η) = g (η0). Since
g (η0) is constant, we differentiate both sides to have g′ (η) = −f ′η0 (η) and g′′ (η) = −f ′′η0 (η).
From ηt, the expected time to reach η0, denoted by fη0 (ηt), is decomposed into s − t, and
Et[fη0 (ηs)
], i.e., the expected time to reach η0 from ηs (s ≥ t) after s − t has passed. We have
fη0 (ηt) equal to Et[fη0 (ηs)
]+ s − t. Therefore, t + fη0 (ηt) is a martingale, so fη0 satisfies the
ordinary differential equation: 1 + f ′η0 (η)µη (η) + ση(η)2
2f ′′η0 (η) = 0. Therefore, g (η) must satisfy
49
1− g′ (η)µη (η)− ση (η)2
2g′′ (η) = 0.
It takes no time to reach η, so g(η)
= 0. Moreover, since η is a reflecting boundary, g′(η)
= 0.
Proof of Proposition 4. The Markov equilibrium is time-homogeneous, so I suppress time sub-
scripts. In the main text, I show how to uniquely solve x, m, and r as functions of(qK (η) , qB (η)
)and their derivatives. Once we know these variables, we solve the dynamics of Et:
µe = r + xB (R− δ − r) , and σe = xBσ,
and the economic growth rate, λF (mt)− δ. So, the we have the drift and diffusion of ηt:
µη = µe − [λF (mt)− δ]− σeσ + σ2, and ση = (x− 1)σ.
Next, we can use bankers’ HJB equation and the capital pricing formula (i.e. Equations
(13) and (17)) to form a system of differential equations for(qK (η) , qB (η)
), i.e., a mapping from(
η, qB, qK , dqB
dη, dq
K
dη
)to(d2qB
dη2, d
2qK
dη2
). In stead of the first derivatives, we can work with elasticities
of(qB, qK
), εX = dqX/qX
dη/η, X ∈ {B,K} to simplify the expressions. Using Ito’s lemma, we know
µX = εXµη +1
2qX(σηη)2
d2qX
dη2, i.e.,
d2qX
dη2= 2qX
(µX − εXµη
)(σηη)2
, X ∈ {B,K} .
To calculate µK and µK , we use banks’ HJB equation (Equation (13)):
µB = ρ+ ι− r,
and the capital pricing formula (Equation (17)),
µK = ρ+ δ − σKσ − α
qK+ (ρ− r)m− λ
[F (m)− m
qK
], where σK = εKση.
Because F (·) is concave, Equation (16)) has a unique solution of x. Following from it, we
solve mt and rt uniquely as shown in the main text. Thus, the mapping from(η, qB, qK , dq
B
dη, dq
K
dη
)to(d2qB
dη2, d
2qK
dη2
)is unique. Given the boundary conditions, the system of differential equations
uniquely pins down a solution(qB (η) , qK (η)
)under proper parameter range that guarantees ex-
istence, so we have a unique Markov equilibrium with state variable ηt. To solve the problem with
government debt, we only need to change firms’ deposit demand as shown in the main text.
50
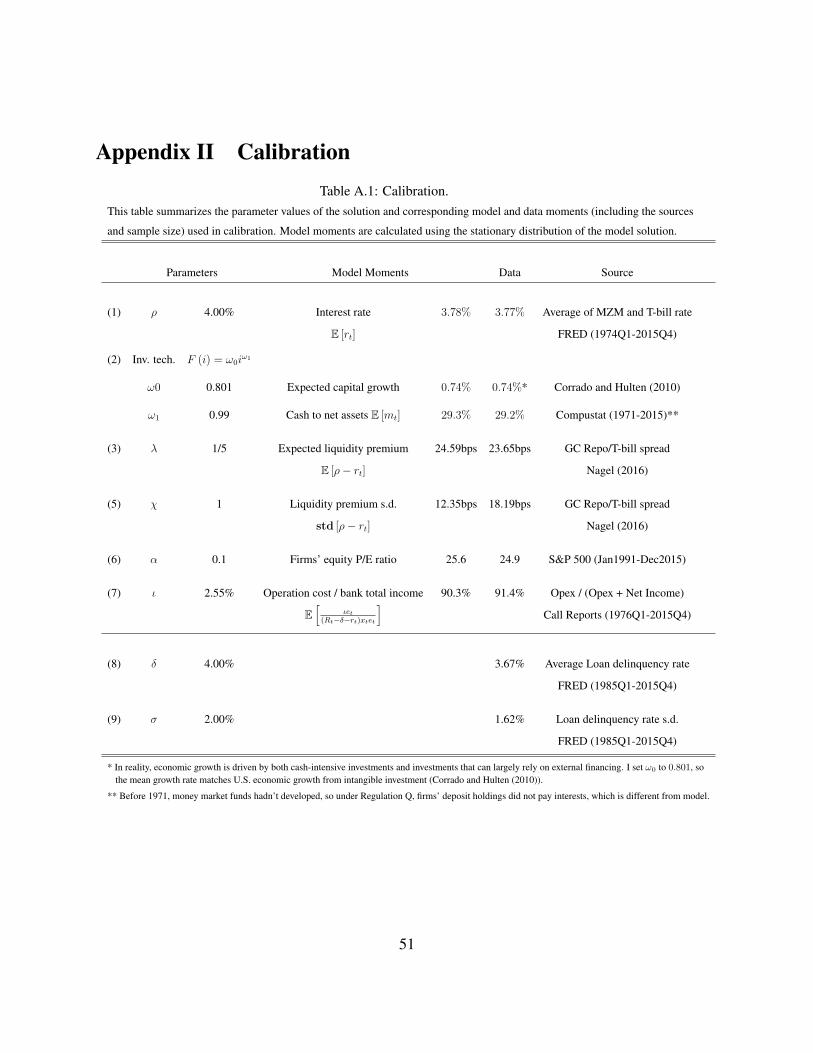
Appendix II CalibrationTable A.1: Calibration.
This table summarizes the parameter values of the solution and corresponding model and data moments (including the sources
and sample size) used in calibration. Model moments are calculated using the stationary distribution of the model solution.
Parameters Model Moments Data Source
(1) ρ 4.00% Interest rate 3.78% 3.77% Average of MZM and T-bill rate
E [rt] FRED (1974Q1-2015Q4)
(2) Inv. tech. F (i) = ω0iω1
ω0 0.801 Expected capital growth 0.74% 0.74%* Corrado and Hulten (2010)
ω1 0.99 Cash to net assets E [mt] 29.3% 29.2% Compustat (1971-2015)**
(3) λ 1/5 Expected liquidity premium 24.59bps 23.65bps GC Repo/T-bill spread
E [ρ− rt] Nagel (2016)
(5) χ 1 Liquidity premium s.d. 12.35bps 18.19bps GC Repo/T-bill spread
std [ρ− rt] Nagel (2016)
(6) α 0.1 Firms’ equity P/E ratio 25.6 24.9 S&P 500 (Jan1991-Dec2015)
(7) ι 2.55% Operation cost / bank total income 90.3% 91.4% Opex / (Opex + Net Income)
E[
ιet(Rt−δ−rt)xtet
]Call Reports (1976Q1-2015Q4)
(8) δ 4.00% 3.67% Average Loan delinquency rate
FRED (1985Q1-2015Q4)
(9) σ 2.00% 1.62% Loan delinquency rate s.d.
FRED (1985Q1-2015Q4)
* In reality, economic growth is driven by both cash-intensive investments and investments that can largely rely on external financing. I set ω0 to 0.801, sothe mean growth rate matches U.S. economic growth from intangible investment (Corrado and Hulten (2010)).
** Before 1971, money market funds hadn’t developed, so under Regulation Q, firms’ deposit holdings did not pay interests, which is different from model.
51

ReferencesAdrian, T. and N. Boyarchenko (2012). Intermediary leverage cycles and financial stability. Staff
Reports 567, Federal Reserve Bank of New York.
Adrian, T., N. Boyarchenko, and H. S. Shin (2015). The cyclicality of leverage. Staff Reports 442,Federal Reserve Bank of New York.
Adrian, T. and H. S. Shin (2010). Liquidity and leverage. Journal of Financial Intermedia-tion 19(3), 418 – 437.
Aghion, P., P. Askenazy, N. Berman, G. Cette, and L. Eymard (2012). Credit constraints andthe cyclicality of R&D investment: Evidence from france. Journal of the European EconomicAssociation 10(5), 1001–1024.
Almeida, H. and M. Campello (2007). Financial constraints, asset tangibility, and corporate in-vestment. Review of Financial Studies 20(5), 1429–1460.
Asmussen, S., P. Glynn, and J. Pitman (1995). Discretization error in simulation of one-dimensional reflecting brownian motion. The Annals of Applied Probability 5(4), 875–896.
Bachmann, R. and C. Bayer (2014). Investment dispersion and the business cycle. AmericanEconomic Review 104(4), 1392–1416.
Baker, S. R., N. Bloom, and S. J. Davis (2015). Measuring economic policy uncertainty. WorkingPaper 21633, National Bureau of Economic Research.
Bansal, R. and W. J. Coleman (1996). A monetary explanation of the equity premium, term pre-mium, and risk-free rate puzzles. Journal of Political Economy 104(6), 1135–1171.
Bansal, R., W. J. Coleman, and C. T. Lundblad (2011). Endogenous liquidity supply. 2011 MeetingPapers 1200, Society for Economic Dynamics.
Barlevy, G. (2007). On the cyclicality of research and development. American Economic Re-view 97(4), 1131–1164.
Baron, M. (2014). Countercyclical bank equity issuance. Working paper, Princeton University.
Basak, S. and D. Cuoco (1998). An equilibrium model with restricted stock market participation.The Review of Financial Studies 11(2), 309–341.
Basel Committee on Bank Supervision (2013). Basel III: The Liquidity Coverage Ratio and liq-uidity risk monitoring tools. Technical report, Bank for International Settlements.
52
Bates, T. W., K. M. Kahle, and R. M. Stulz (2009). Why do U.S. firms hold so much more cashthan they used to? The Journal of Finance 64(5), 1985–2021.
Begenau, J. and B. Palazzo (2015). Firm selection and corporate cash holdings. 2015 MeetingPapers 1047, Society for Economic Dynamics.
Bernanke, B. S. and M. Gertler (1989). Agency costs, net worth, and business fluctuations. TheAmerican Economic Review 79(1), 14–31.
Bolton, P., H. Chen, and N. Wang (2011). A unified theory of Tobin’s q, corporate investment,financing, and risk management. The Journal of Finance 66(5), 1545–1578.
Bolton, P., H. Chen, and N. Wang (2013). Market timing, investment, and risk management.Journal of Financial Economics 109(1), 40 – 62.
Bolton, P. and X. Freixas (2000). Equity, bonds, and bank debt: Capital structure and financialmarket equilibrium under asymmetric information. Journal of Political Economy 108(2), 324–351.
Bolton, P. and H. Huang (2016). The capital structure of nations. Working paper, ColumbiaUniversity.
Borovicka, J., L. P. Hansen, and J. A. Scheinkman (2014). Shock elasticities and impulse re-sponses. Mathematics and Financial Economics 8(4), 333–354.
Brunnermeier, M. K. and L. H. Pedersen (2009). Market liquidity and funding liquidity. Reviewof Financial Studies 22(6), 2201–2238.
Brunnermeier, M. K. and Y. Sannikov (2014). A macroeconomic model with a financial sector.American Economic Review 104(2), 379–421.
Brunnermeier, M. K. and Y. Sannikov (2016). The I theory of money. Working paper, PrincetonUniversity.
Caballero, R. J. and E. Farhi (2017). The safety trap. The Review of Economic Studies, rdx013.
Caballero, R. J. and A. Krishnamurthy (2006). Bubbles and capital flow volatility: Causes and riskmanagement. Journal of Monetary Economics 53(1), 35 – 53.
Cavalcanti, R. d. O. and N. Wallace (1999). A model of private bank-note issue. Review ofEconomic Dynamics 2(1), 104 – 136.
Christiano, L., M. Eichenbaum, and C. Evans (2005). Nominal rigidities and the dynamic effectsof a shock to monetary policy. Journal of Political Economy 113(1), 1–45.
53
Cochrane, J. H. (2011). Presidential address: Discount rates. The Journal of Finance 66(4), 1047–1108.
Comin, D. and M. Gertler (2006). Medium-term business cycles. American Economic Re-view 96(3), 523–551.
Corrado, C. A. and C. R. Hulten (2010). How do you measure a ”technological revolution”?American Economic Review 100(2), 99–104.
Dang, T. V., G. Gorton, B. Holmstrom, and G. Ordonez (2014). Banks as secret keepers. WorkingPaper 20255, National Bureau of Economic Research.
Danielsson, J., H. S. Shin, and J.-P. Zigrand (2012). Procyclical leverage and endogenous risk.Working paper, London School of Economics.
Denis, D. J. and V. Sibilkov (2010). Financial constraints, investment, and the value of cashholdings. Review of Financial Studies 23(1), 247–269.
Di Tella, S. (2015). Uncertainty shocks and balance sheet recessions. Journal of Political Economy,forthcoming.
Di Tella, S. and P. Kurlat (2017). Why are banks exposed to monetary policy? Working paper,Stanford University.
Diamond, D. W. and R. G. Rajan (2000). A theory of bank capital. The Journal of Finance 55(6),2431–2465.
Dittmar, A. and A. Thakor (2007). Why do firms issue equity? The Journal of Finance 62(1),1–54.
Donaldson, J. R., G. Piacentino, and A. Thakor (2016). Warehouse banking. Journal of FinancialEconomics, forthcoming.
Drechsler, I., A. Savov, and P. Schnabl (2016). The deposits channel of monetary policy. WorkingPaper Series 22152, National Bureau of Economic Research.
Drechsler, I., A. Savov, and P. Schnabl (2017). A model of monetary policy and risk premia. TheJournal of Finance, forthcoming.
Duchin, R. (2010). Cash holdings and corporate diversification. The Journal of Finance 65(3),955–992.
Duchin, R., T. Gilbert, J. Harford, and C. M. Hrdlicka (2017). Precautionary savings with riskyassets: When cash is not cash. The Journal of Finance 72(2), 793–852.
54
Eisfeldt, A. and A. Rampini (2009). Financing shortfalls and the value of aggregate liquidity.Working paper, Duke University.
Eisfeldt, A. L. (2007). Smoothing with liquid and illiquid assets. Journal of Monetary Eco-nomics 54(6), 1572 – 1586.
Eisfeldt, A. L. and T. Muir (2016). Aggregate external financing and savings waves. Journal ofMonetary Economics 84(Supplement C), 116 – 133.
Eisfeldt, A. L. and A. A. Rampini (2006). Capital reallocation and liquidity. Journal of MonetaryEconomics 53(3), 369 – 399.
Elenev, V., T. Landvoigt, and S. V. Nieuwerburgh (2017). A macroeconomic model with financiallyconstrained producers and intermediaries. Working paper, New York University.
Fabrizio, K. R. and U. Tsolmon (2014). An empirical examination of the procyclicality of rdinvestment and innovation. The Review of Economics and Statistics 96(4), 662 – 675.
Falato, A. and J. W. Sim (2014). Why Do Innovative Firms Hold So Much Cash? Evidence fromChanges in State R&D Tax Credits. Finance and Economics Discussion Series 2014-72, Boardof Governors of the Federal Reserve System (U.S.).
Farhi, E. and J. Tirole (2012). Bubbly liquidity. Review of Economic Studies 79(2), 678–706.
Fatas, A. (2000). Do business cycles cast long shadows? Short-run persistence and economicgrowth. Journal of Economic Growth 5(2), 147–162.
Fischer, S. (2009). Preparing for future crises. Speech at the 33rd Annual Symposium of theFederal Reserve Bank of Kansas City, on “Financial Stability and Macroeconomic Stability”, atJackson Hole, Wyoming, 21 August 2009.
Fleming, M. J. and K. D. Garbade (2003). The repurchase agreement refined: GCF Repo. CurrentIssues in Economics and Finance 9(6).
Friedman, M. (1969). The Optimum Quantity of Money and Other Essays. Chicago, I.L.: AldineAldine Transaction.
Friedman, M. and A. J. Schwartz (1963). A Monetary History of the United States, 1867-1960.Princeton, N.J.: Princeton University Press.
Froot, K. A., D. S. Scharfstein, and J. C. Stein (1993). Risk management: Coordinating corporateinvestment and financing policies. The Journal of Finance 48(5), 1629–1658.
FSB (Financial Stability Board) (2009). Report of the Financial Stability Forum on AddressingProcyclicality in the Financial System. Basel, Switzerland.
55
Garbade, K. D. (2007). The emergence of “regular and predictable” as a treasury debt managementstrategy. Economic Policy Review 13(1).
Geanakoplos, J. (2010). The Leverage Cycle. NBER Macroeconomics Annual 2009, Volume 24,pp.1-65. University of Chicago Press.
Gennaioli, N., A. Shleifer, and R. W. Vishny (2013). A model of shadow banking. The Journal ofFinance 68(4), 1331–1363.
Giglio, S. and T. Severo (2012). Intangible capital, relative asset shortages and bubbles. Journalof Monetary Economics 59(3), 303 – 317.
Gorton, G. (2010). Slapped by the Invisible Hand: The Panic of 2007. New York, N.Y.: OxfordUniversity Press.
Gorton, G. and G. Pennacchi (1990). Financial intermediaries and liquidity creation. The Journalof Finance 45(1), 49–71.
Graham, J. R. and M. T. Leary (2015). The evolution of corporate cash. Working paper, DukeUniversity.
Greenwood, R., S. G. Hanson, and J. C. Stein (2015). A comparative-advantage approach togovernment debt maturity. The Journal of Finance 70(4), 1683–1722.
Greenwood, R. and D. Vayanos (2014). Bond supply and excess bond returns. Review of FinancialStudies 27(3), 663–713.
Griliches, Z. (1990). Patent statistics as economic indicators: A survey. Working Paper 3301,National Bureau of Economic Research.
Gurley, J. G. and E. S. Shaw (1960). Money in a Theory of Finance. Washington, D.C.: BrookingsInstitution.
Hall, B. H. (1992). Investment and research and development at the firm level: Does the source offinancing matter? Working Paper 4096, National Bureau of Economic Research.
Hall, B. H. and J. Lerner (2009). The financing of R&D and innovation. Working Paper 15325,National Bureau of Economic Research.
Hart, O. and L. Zingales (2014). Banks are where the liquidity is. Working paper, Harvard Uni-versity.
He, Z., I. G. Khang, and A. Krishnamurthy (2010). Balance sheet adjustments in the 2008 crisis.Working Paper 15919, National Bureau of Economic Research.
56
He, Z. and P. Kondor (2016). Inefficient investment waves. Econometrica 84(2), 735–780.
He, Z. and A. Krishnamurthy (2012). A model of capital and crises. The Review of EconomicStudies 79(2), 735–777.
He, Z. and A. Krishnamurthy (2013). Intermediary asset pricing. American Economic Re-view 103(2), 732–70.
Himmelberg, C. P. and B. C. Petersen (1994). R&D and internal finance: A panel study of smallfirms in high-tech industries. The Review of Economics and Statistics 76(1), 38–51.
Holmstrom, B. and J. Tirole (1997). Financial intermediation, loanable funds, and the real sector.The Quarterly Journal of Economics 112(3), 663–691.
Holmstrom, B. and J. Tirole (1998). Private and public supply of liquidity. Journal of PoliticalEconomy 106(1), 1–40.
Holmstrom, B. and J. Tirole (2001). LAPM: A liquidity-based asset pricing model. The Journalof Finance 56(5), 1837–1867.
Holmstrom, B. and J. Tirole (2011). Inside and Outside Liquidity. Cambridge, M.A.: The MITPress.
Kacperczyk, M., C. Perignon, and G. Vuillemey (2017). The private production of safe assets.Working Paper FIN-2017-1212, HEC Paris Research Paper.
Kelly, B., L. Pastor, and P. Veronesi (2016). The price of political uncertainty: Theory and evidencefrom the option market. The Journal of Finance, forthcoming.
Kiyotaki, N. and J. Moore (1997). Credit cycles. Journal of Political Economy 105(2), 211–248.
Kiyotaki, N. and J. Moore (2000). Inside money and liquidity. Working paper, London School ofEconomics.
Kiyotaki, N. and J. Moore (2002). Evil is the root of all money. American Economic Review 92(2),62–66.
Kiyotaki, N. and J. Moore (2005). Lawrence R. Klein Lecture: Liquidity and asset prices. Inter-national Economic Review 46(2), 317–349.
Kiyotaki, N. and R. Wright (1989). On money as a medium of exchange. Journal of PoliticalEconomy 97(4), 927–954.
Klimenko, N., S. Pfeil, J.-C. Rochet, and G. D. Nicolo (2016). Aggregate bank capital and creditdynamics. Swiss Finance Institute Research Paper Series 16-42.
57

Kocherlakota, N. R. (1998). Money is memory. Journal of Economic Theory 81(2), 232 – 251.
Kocherlakota, N. R. (2009). Bursting bubbles: Consequences and cures. Unpublished manuscript,Federal Reserve Bank of Minneapolis.
Krishnamurthy, A. and A. Vissing-Jørgensen (2012). The aggregate demand for treasury debt.Journal of Political Economy 120(2), 233–267.
Krishnamurthy, A. and A. Vissing-Jørgensen (2015). The impact of Treasury supply on financialsector lending and stability. Journal of Financial Economics 118(3), 571 – 600.
Lagos, R. (2008). inside and outside money. In S. N. Durlauf and L. E. Blume (Eds.), The NewPalgrave Dictionary of Economics. Basingstoke: Palgrave Macmillan.
Lucas, R. E. and N. L. Stokey (1987). Money and interest in a cash-in-advance economy. Econo-metrica 55(3), 491–513.
Mankiw, N. and S. P. Zeldes (1991). The consumption of stockholders and nonstockholders.Journal of Financial Economics 29(1), 97 – 112.
Modigliani, F. and M. H. Miller (1958). The cost of capital, corporation finance and the theory ofinvestment. The American Economic Review 48(3), 261–297.
Moreira, A. and A. Savov (2014). The macroeconomics of shadow banking. Working Paper 20335,National Bureau of Economic Research.
Myers, S. C. and N. S. Majluf (1984). Corporate financing and investment decisions when firmshave information that investors do not have. Journal of Financial Economics 13(2), 187 – 221.
Nagel, S. (2016). The liquidity premium of near-money assets. The Quarterly Journal of Eco-nomics, forthcoming.
Ostroy, J. M. and R. M. Starr (1990). Chapter 1 the transactions role of money. Volume 1 ofHandbook of Monetary Economics, pp. 3 – 62. Elsevier.
Patinkin, D. (1965). Money, Interest, and Prices: An Integration of Monetary and Value Theory (2ed.). New York, N.Y.: Harper & Row.
Phelan, G. (2016). Financial intermediation, leverage, and macroeconomic instability. AmericanEconomic Journal: Macroeconomics 8(4), 199–224.
Piazzesi, M. and M. Schneider (2017). Payments, credit and asset prices. Working paper, StanfordUniversity.
58
Pinkowitz, L., R. M. Stulz, and R. Williamson (2016). Do U.S. firms hold more cash than foreignfirms do? Review of Financial Studies 29(2), 309–348.
Pozsar, Z. (2014). Shadow banking: The money view. Working paper 14-04, Office of FinancialResearch.
Quadrini, V. (2017). Bank liabilities channel. Journal of Monetary Economics 89, 25 – 44.
Rampini, A. A. and S. Viswanathan (2010). Collateral, risk management, and the distribution ofdebt capacity. The Journal of Finance 65(6), 2293–2322.
Rampini, A. A. and S. Viswanathan (2017). Financial intermediary capital. Working Paper 23302,National Bureau of Economic Research.
Schiesser, W. E. and G. W. Griffiths (2009). A Compendium of Partial Differential EquationModels. New York, N.Y.: Cambridge University Press.
Stein, J. C. (2012). Monetary policy as financial stability regulation. The Quarterly Journal ofEconomics 127(1), 57–95.
Sunderam, A. (2015). Money creation and the shadow banking system. Review of FinancialStudies 28(4), 939–977.
Svensson, L. E. O. (1985). Money and asset prices in a cash-in-advance economy. Journal ofPolitical Economy 93(5), 919–944.
Van den Heuvel, S. J. (2002). The bank capital channel of monetary policy. Working paper, TheWharton School of the University of Pennsylvania.
Williamson, S. and R. Wright (2010). Chapter 2 - New monetarist economics: Models. Volume 3of Handbook of Monetary Economics, pp. 25 – 96. Elsevier.
Woodford, M. (1990a). Chapter 20 the optimum quantity of money. Volume 2 of Handbook ofMonetary Economics, pp. 1067 – 1152. Elsevier.
Woodford, M. (1990b). Public debt as private liquidity. The American Economic Review 80(2),382–388.
Woodford, M. (2010). Financial intermediation and macroeconomic analysis. Journal of EconomicPerspectives 24(4), 21–44.
Woodford, M. (2016). Quantitative easing and financial stability. Working Paper 22285, NationalBureau of Economic Research.
59
Procyclical Finance: The Money View
Internet Appendix
Ye Li∗
November 19, 2017
1 Preliminary Evidence
1.1 The Structure of Inside Money
Figure 1 shows that the model setup and its mechanism are quantitatively important. The left
panel shows that to nonfinancial firms, financial intermediaries are the most important suppliers of
money-like securities. The right panel shows that nonfinancial firms are among the most important
buyers of intermediaries’ money-like liabilities. Money-like assets include various financial instru-
ments. Accordingly, “deposits” in the model should be interpreted broadly, including short-term
debt issued by financial intermediaries that either serves as a means of payment, such as deposits
at commercial banks, or close substitutes (usually held through money market funds by corporate
treasuries), such as repurchase agreements and high-quality asset-backed commercial papers.
The left panel of Figure 1 decomposes the money-like assets of U.S. non-financial corpora-
tions by the types of securities, and for each security, by the types of its issuers. I use the data in
December 2015 from the March 10, 2016 release of the Financial Accounts of the United States∗The Ohio State University. E-mail: [email protected]
1
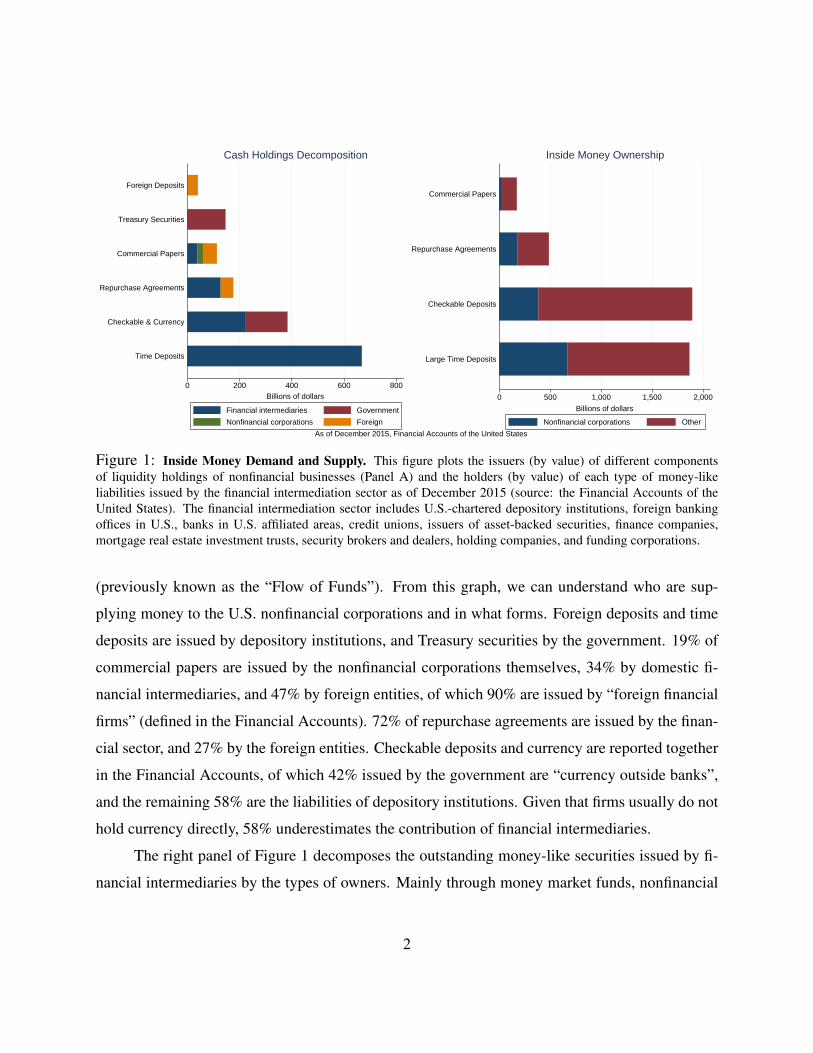
0 200 400 600 800Billions of dollars
Time Deposits
Checkable & Currency
Repurchase Agreements
Commercial Papers
Treasury Securities
Foreign Deposits
Cash Holdings Decomposition
Financial intermediaries Government
Nonfinancial corporations Foreign
0 500 1,000 1,500 2,000
Billions of dollars
Large Time Deposits
Checkable Deposits
Repurchase Agreements
Commercial Papers
Inside Money Ownership
Nonfinancial corporations Other
As of December 2015, Financial Accounts of the United States
Figure 1: Inside Money Demand and Supply. This figure plots the issuers (by value) of different componentsof liquidity holdings of nonfinancial businesses (Panel A) and the holders (by value) of each type of money-likeliabilities issued by the financial intermediation sector as of December 2015 (source: the Financial Accounts of theUnited States). The financial intermediation sector includes U.S.-chartered depository institutions, foreign bankingoffices in U.S., banks in U.S. affiliated areas, credit unions, issuers of asset-backed securities, finance companies,mortgage real estate investment trusts, security brokers and dealers, holding companies, and funding corporations.
(previously known as the “Flow of Funds”). From this graph, we can understand who are sup-
plying money to the U.S. nonfinancial corporations and in what forms. Foreign deposits and time
deposits are issued by depository institutions, and Treasury securities by the government. 19% of
commercial papers are issued by the nonfinancial corporations themselves, 34% by domestic fi-
nancial intermediaries, and 47% by foreign entities, of which 90% are issued by “foreign financial
firms” (defined in the Financial Accounts). 72% of repurchase agreements are issued by the finan-
cial sector, and 27% by the foreign entities. Checkable deposits and currency are reported together
in the Financial Accounts, of which 42% issued by the government are “currency outside banks”,
and the remaining 58% are the liabilities of depository institutions. Given that firms usually do not
hold currency directly, 58% underestimates the contribution of financial intermediaries.
The right panel of Figure 1 decomposes the outstanding money-like securities issued by fi-
nancial intermediaries by the types of owners. Mainly through money market funds, nonfinancial
2

corporations hold a little less than a third of outstanding repurchase agreements and some commer-
cial papers that account for a smaller fraction of the outstanding amount. They hold a significant
share of checkable deposits and large time deposits.
Here are some details on how to construct this graph. Table L.103 records nonfinancial
corporations’ assets and liabilities. I break down the holdings of money market fund shares and
mutual fund shares into financial instruments using Table L.121 and L.122 respectively, under the
assumption that funds held by nonfinancial firms invest in the same portfolio as the aggregate sector
does.1 Corporate and foreign bonds, loans, and miscellaneous assets, all held indirectly through
money market mutual funds and mutual funds, are excluded. Agency- and GSE-backed securities
are excluded because of the potential spikes of repo haircuts and the secondary market illiquidity
during crisis times. Municipal securities are excluded because of secondary market illiquidity.
Next, for each financial instrument, I calculate the net supply by each type of issuers using
the instrument-level tables. Financial intermediaries are defined as in Krishnamurthy and Vissing-
Jørgensen (2015), including the following financial institutions: U.S.-chartered depository institu-
tions, foreign banking offices in U.S., banks in U.S. affiliated areas, credit unions, issuers of asset-
backed securities, finance companies, mortgage real estate investment trusts, security brokers and
dealers, holding companies, and funding corporations. Insurance companies are not included as
financial intermediaries because their liabilities are long-term and usually held until maturity by
insurance policy holders instead of resold in secondary market. Their liabilities are not money-like.
1.2 Cyclical money creation
The model predicts procyclical quantity of money and countercyclical price (i.e., the money pre-
mium). The banking sector expands its supply of inside money in goods times, allowing firms to
better hedge against their liquidity shocks. In the model, all quantity variables are proportional
to Kt, the capital stock, and thus, the output αKt, so I scale all quantities variables in data by
the nominal GDP. Figure 2 plots the quarterly data of money premium (the solid line) and the
1It is implicitly assumed that funds are just pass-through and do not provide any liquidity services beyond thesecurities they hold. This ignores the potential sharing of idiosyncratic liquidity shocks through funds.
3
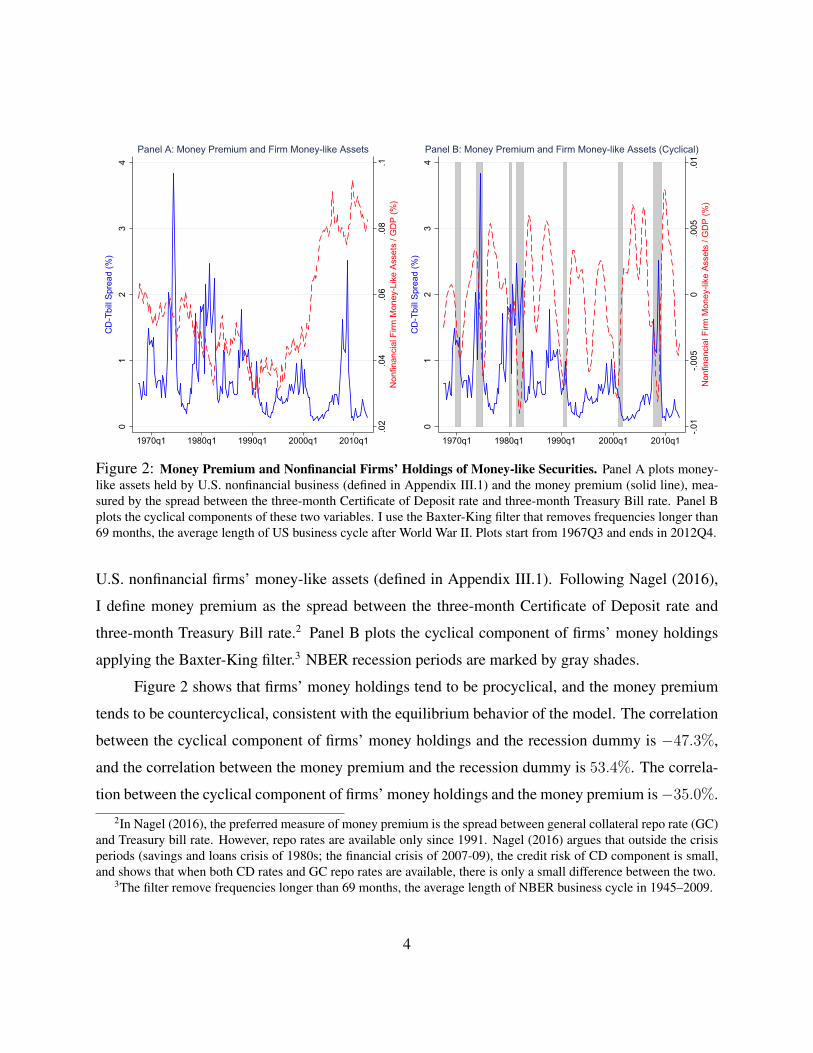
.02
.04
.06
.08
.1N
onfin
anci
al F
irm M
oney
-Lik
e As
sets
/ G
DP
(%)
01
23
4C
D-T
bill
Spre
ad (%
)
1970q1 1980q1 1990q1 2000q1 2010q1
Panel A: Money Premium and Firm Money-like Assets
-.01
-.005
0.0
05.0
1N
onfin
anci
al F
irm M
oney
-like
Ass
ets
/ GD
P (%
)
01
23
4C
D-T
bill
Spre
ad (%
)
1970q1 1980q1 1990q1 2000q1 2010q1
Panel B: Money Premium and Firm Money-like Assets (Cyclical)
Figure 2: Money Premium and Nonfinancial Firms’ Holdings of Money-like Securities. Panel A plots money-like assets held by U.S. nonfinancial business (defined in Appendix III.1) and the money premium (solid line), mea-sured by the spread between the three-month Certificate of Deposit rate and three-month Treasury Bill rate. Panel Bplots the cyclical components of these two variables. I use the Baxter-King filter that removes frequencies longer than69 months, the average length of US business cycle after World War II. Plots start from 1967Q3 and ends in 2012Q4.
U.S. nonfinancial firms’ money-like assets (defined in Appendix III.1). Following Nagel (2016),
I define money premium as the spread between the three-month Certificate of Deposit rate and
three-month Treasury Bill rate.2 Panel B plots the cyclical component of firms’ money holdings
applying the Baxter-King filter.3 NBER recession periods are marked by gray shades.
Figure 2 shows that firms’ money holdings tend to be procyclical, and the money premium
tends to be countercyclical, consistent with the equilibrium behavior of the model. The correlation
between the cyclical component of firms’ money holdings and the recession dummy is −47.3%,
and the correlation between the money premium and the recession dummy is 53.4%. The correla-
tion between the cyclical component of firms’ money holdings and the money premium is −35.0%.
2In Nagel (2016), the preferred measure of money premium is the spread between general collateral repo rate (GC)and Treasury bill rate. However, repo rates are available only since 1991. Nagel (2016) argues that outside the crisisperiods (savings and loans crisis of 1980s; the financial crisis of 2007-09), the credit risk of CD component is small,and shows that when both CD rates and GC repo rates are available, there is only a small difference between the two.
3The filter remove frequencies longer than 69 months, the average length of NBER business cycle in 1945–2009.
4

.1.1
5.2
.25
.3.3
5In
term
edia
ry M
oney
-like
Sec
uriti
es S
uppl
y / G
DP
(%)
.06
.08
.1.1
2.1
4Tr
easu
ry B
ills /
GD
P (%
)
1970q1 1980q1 1990q1 2000q1 2010q1
Panel A: Intermediary and Goverment Supply of Money-like Assets
.1.2
.3.4
.5M
oney
-like
Lia
bilit
ies
of N
on-d
epos
itory
/ To
tal (
%)
1970q1 1980q1 1990q1 2000q1 2010q1
Panel B: Shadow Money Share
Figure 3: Money-like Securities Issued by Financial Intermediaries and Government. Panel A plots the out-standing Treasury bills (solid line) scaled by nominal GDP and the money-like liabilities of financial intermediariesscaled by GDP (defined in Figure 1 in Appendix III.1). Panel B plots the share of inside money, i.e., total money-like liabilities of financial intermediaries, that is from the non-depository intermediaries (“shadow banks”). The datasource is the Financial Accounts of the United States from 1967Q3 to 2012Q4.
There is a large literature on the secular trends in corporate liquidity holdings (e.g., Bates,
Kahle, and Stulz (2009)), but relatively few on its cycle. Eisfeldt and Rampini (2009) document a
positive correlation between the money premium and the asynchronicity between the sources and
uses of funds in the productive sector. The model by He and Kondor (2016) also predicts a negative
correlation between the money premium and firms’ cash holdings, but they focus on the pecuniary
externality in the market of productive capital and the resulting inefficient investment waves.
Using data from the Financial Accounts of the United States, Panel A of Figure 3 plots the
outstanding Treasury bills (the solid line) and the net supply of money-like securities by interme-
diaries, i.e., the sum of intermediaries’ net liabilities in each instrument listed in Figure 1 minus
their holdings of government securities.4 A key message is the collapse of inside money supply in
the Great Recession, a more than 50% decline from the second quarter of 2007 (the peak) to end of
4Government securities include Treasury securities and vault cash held by depository institutions, and Treasurysecurities indirectly held through money market funds by other financial intermediaries.
5
2009 and a continuing contraction afterwards to a level lower than 1960s. This secular depression
of inside money creation is consistent with the model’s prediction on stagnant crises.
Treasury Bill supply increased by more than 100% during the Great Recession. The model
predicts that such an increase prolongs the crisis by crowding out intermediaries’ profit, and thus,
delaying the repairment of intermediaries’ balance sheet. To some extent, Treasury Bill supply mit-
igates the money shortage that the productive sector faces, so we do not see a slump in nonfinancial
firms’ money holdings (Figure 2) that is as large as the slump of inside money supply. However,
the yield on money-like securities has been extremely low in the post-crisis period, which signals
a persistent scarcity very likely due to the depressed inside money creation.
Panel B of Figure 3 plots the share of inside money supplied by non-depository financial
intermediaries, i.e. the “shadow banks”, such as broker-dealers, finance companies, and issuers of
asset-backed securities. Many have argued that other sectors’ demand for money-like securities is
a major driver of the growth of shadow banking (Gorton (2010), Stein (2012), and Pozsar (2011)
and (2014)). In comparison with traditional banks (depository institutions), shadow banks seemed
to be more responsive to rise of money demand in the productive sector in the last two decades,
and until the global financial crisis, took an increasingly large share of inside money supply.
1.3 Government debt and intermediary leverage cycle
This section provides evidence on the impact of outside money on the intermediary leverage cycle.
I focus on one type of intermediaries, broker-dealers (or investment banks). Adrian and Shin (2010)
document the procyclicality of broker-dealer leverage: when their assets grow, their debt grows
faster, leading to higher leverage. Broker-dealers issue money-like securities (mainly repurchase
agreements) that are held by firms and other entities through money market mutual funds. I focus
on investment banks because relative to commercial banks, their choice of leverage is subject to
less regulatory constraints, and thereby, they are closer to the laissez-faire banks in the model,
and as shown in Figure 3, shadow banks play a more important role than traditional banks in the
pre-crisis boom of inside money creation. Leverage is defined as the ratio of total book assets
to book equity, using the data from the Financial Accounts, following Adrian and Shin (2010).
6

1968q3
1968q4
1969q1
1969q3
1969q4
1970q1
1970q31970q4
1971q1
1971q3
1971q4
1972q1
1972q3
1972q4
1973q1
1973q3
1973q4
1974q1
1974q3
1974q4
1975q11975q3
1975q41976q11976q3
1976q4
1977q1
1977q3
1977q4
1978q11978q3
1978q4
1979q1
1979q3
1979q4
1980q1
1980q3
1980q4
1981q11981q3
1981q4
1982q11982q3
1982q4
1983q1
1983q31983q4
1984q1
1984q3
1984q4
1985q1
1985q3
1985q4
1986q1
1986q3
1986q4
1987q1
1987q3
1987q4
1988q11988q3
1988q4
1989q11989q3
1989q4
1990q1
1990q3
1990q4
1991q1
1991q3
1991q4
1992q1
1992q3
1992q4
1993q1
1993q3
1993q4
1994q1
1994q3
1994q4
1995q11995q3
1995q4
1996q1
1996q3
1996q4
1997q11997q3
1997q4
1998q1
1998q3
1998q41999q1
1999q3
1999q4
2000q1
2000q3
2000q4
2001q1
2001q3
2001q42002q1
2002q3
2002q4
2003q1
2003q3
2003q42004q12004q3
2004q4
2005q12005q32005q4
2006q1
2006q3
2006q4
2007q12007q3
2007q42010q1
2010q3
2010q4
2011q1
2011q32011q4
2012q12012q32012q4
2013q1
2013q3
2013q4
2014q12014q32014q42015q12015q3
-40%
-20%
0%20
%40
%
-40% -20% 0% 20% 40%Asset Growth
Leverage Growth Fitted
Panel C: Rest of the Year
1969q2
1970q2
1971q2
1972q2
1973q2
1974q21975q2
1976q21977q2
1978q2
1979q2
1980q21981q2
1982q21983q2
1984q2
1985q2
1986q21987q2
1988q2
1989q2
1990q2
1991q2
1992q2
1993q2
1994q21995q2
1996q2
1997q2
1998q2
1999q2
2000q2
2001q2
2002q22003q2
2004q2
2005q22006q22007q2
2010q2
2011q2
2012q22013q22014q22015q2
-40%
-20%
0%20
%40
%
-40% -20% 0% 20% 40%Asset Growth
Leverage Growth Fitted
Panel B: 2nd Quarter
-20%
-10%
0%10
%20
%
1 2 3 4Quarter
∆ Treasury Bills / GDP
Panel A: Treasury Bill Supply
Figure 4: Intermediary Leverage Cycle and Government Debt. Panel A plots the change of Treasury billsoutstanding scaled by nominal GDP by quarter. Panel B plots the quarterly growth rate (log difference) of broker-dealer book leverage (Adrian and Shin (2010)) against the growth rate of broker-dealer book assets in the secondquarterly, and Panel C plots the quarterly growth rate of leverage against the growth rate of assets in the first, third,and fourth quarters. The data source is the Financial Accounts of the United States from 1968Q3 to 2015Q3.
The sample is 1968Q3–2015Q3.5 He, Kelly, and Manela (2016) discuss issues related to internal
capital markets that may induce measurement errors in leverage. For government debt, I use the
ratio of Treasury Bills to nominal GDP. Short-term debt is more money-like in the sense that their
value is more stable, their secondary market more liquid, and repo haircuts smaller.
In identifying the impact of government debt on intermediary leverage, one of the challenges
is the endogeneity of government debt supply. Greenwood, Hanson, and Stein (2015) argue that
Treasury Bill supply has seasonality. It expands ahead of statutory tax deadlines (e.g., April 15th)
to meet its ongoing needs, and contracts following these deadlines. Greenwood, Hanson, and Stein
(2015) and Nagel (2016) use week and month dummies respectively to instrument Treasury Bill
supply. Panel A of Figure 4 shows that the strongest seasonality is in the second quarter of the
year. Because my data is quarterly, I use the Q2 dummy as an instrument for T-bill supply.
5Adrian, Etula, and Muir (2014) discuss the data quality concerns in the pre-1968 sample.
7
Panel B and C of Figure 4 plot the log difference of book leverage (i.e., quarterly growth)
against the book asset growth, extending the main result of Adrian and Shin (2010) to this longer
sample. Panel B separates out the observations from the second quarters, and Panel C shows the
rest of the year. The fitted line is steeper in Panel C, which seems to be consistent with the model’s
prediction – increases in government debt amplify the procyclicality of intermediary leverage.
Another identification challenge is the endogeneity of asset growth. In the model, the cycli-
cality of leverage is defined with respect to exogenous shocks that increase or decrease banks’
asset value through their impact of collateral quality. Such structural shocks are rarely observed in
reality. However, for the purpose of empirical analysis, any exogenous shocks that affect banks’
asset value can be used as instruments. I use monetary policy shocks as such instruments, and
consider two measures: the unanticipated changes in the Fed Funds Rate around the FOMC (Fed-
eral Open Market Committee) announcements (“MP-FFR”), and a composite measure of unantic-
ipated changes in several interest rates around the FOMC announcements proposed by Nakamura
and Steinsson (2017) (“MP-Comp”).6 Shocks are aggregated to quarterly level. Calculated from
high-frequency data, these policy shocks arguably reflect the changes in interest rates only from
the unexpected content of FOMC announcements, and thus, tend to be orthogonal to contempo-
raneous variations of other economic variables. Through the impact on interest rates and various
spreads, monetary policy shocks affect the value of banks’ assets.7
Table A.2 reports the results. The first column replicates the main regression in Adrian
and Shin (2010). The left-hand side is leverage growth and the right-hand side is asset growth. A
positive coefficient shows the procyclicality of leverage. The fourth column of Table A.2 shows the
coefficients from regressing leverage growth on both asset growth and the interaction between asset
and Treasury bill growth. A positive coefficient on the interaction term suggests when government
debt increases, leverage becomes more procyclical, consistent with the model’s prediction.
Column 2 and 3 show leverage procyclicality using different measures of monetary policy
6A monetary policy shock is calculated using a 30-minute window from 10 minutes before the FOMC announce-ment to 20 minutes after it. The calculation follows Nakamura and Steinsson (2017). For earlier contributions, pleaserefer to Cook and Hahn (1989), Kuttner (2001), and Cochrane and Piazzesi (2002) among others.
7Gertler and Karadi (2015) show that these high-frequency monetary policy shocks affect term premia and creditspreads, and Hanson and Stein (2015) show the strong effect on forward real rates even in the distant future.
8
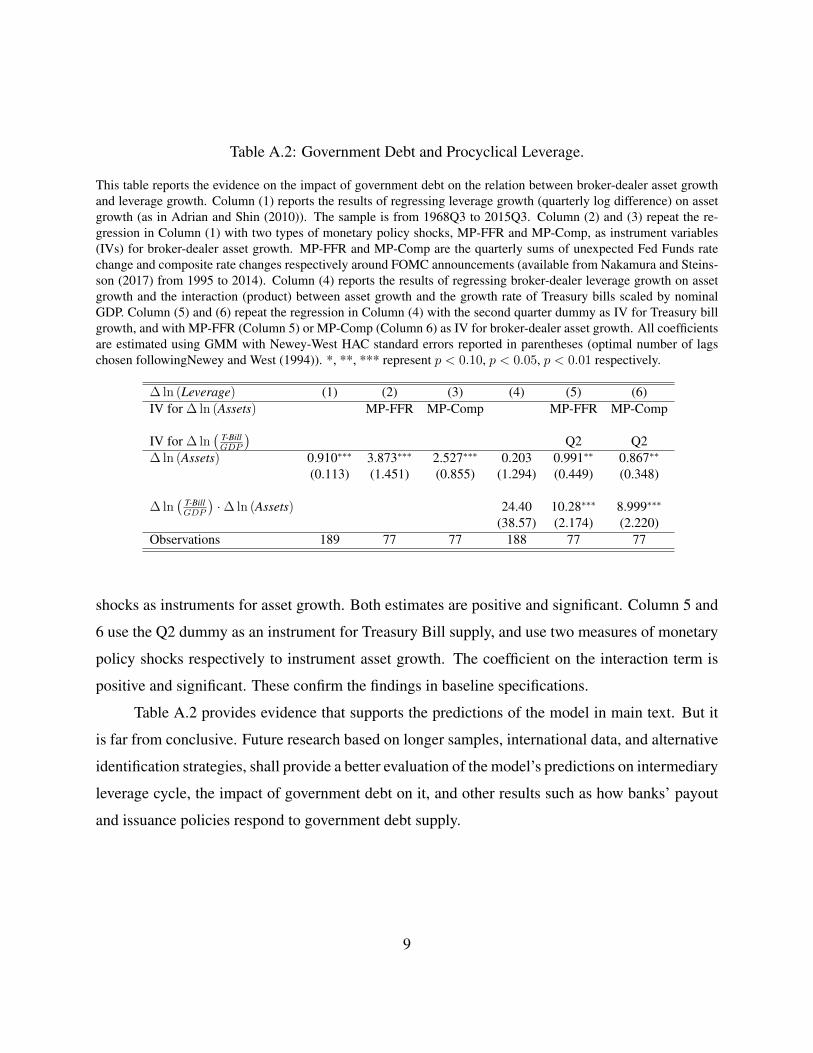
Table A.2: Government Debt and Procyclical Leverage.
This table reports the evidence on the impact of government debt on the relation between broker-dealer asset growthand leverage growth. Column (1) reports the results of regressing leverage growth (quarterly log difference) on assetgrowth (as in Adrian and Shin (2010)). The sample is from 1968Q3 to 2015Q3. Column (2) and (3) repeat the re-gression in Column (1) with two types of monetary policy shocks, MP-FFR and MP-Comp, as instrument variables(IVs) for broker-dealer asset growth. MP-FFR and MP-Comp are the quarterly sums of unexpected Fed Funds ratechange and composite rate changes respectively around FOMC announcements (available from Nakamura and Steins-son (2017) from 1995 to 2014). Column (4) reports the results of regressing broker-dealer leverage growth on assetgrowth and the interaction (product) between asset growth and the growth rate of Treasury bills scaled by nominalGDP. Column (5) and (6) repeat the regression in Column (4) with the second quarter dummy as IV for Treasury billgrowth, and with MP-FFR (Column 5) or MP-Comp (Column 6) as IV for broker-dealer asset growth. All coefficientsare estimated using GMM with Newey-West HAC standard errors reported in parentheses (optimal number of lagschosen followingNewey and West (1994)). *, **, *** represent p < 0.10, p < 0.05, p < 0.01 respectively.
∆ ln (Leverage) (1) (2) (3) (4) (5) (6)IV for ∆ ln (Assets) MP-FFR MP-Comp MP-FFR MP-Comp
IV for ∆ ln(
T-BillGDP
)Q2 Q2
∆ ln (Assets) 0.910∗∗∗ 3.873∗∗∗ 2.527∗∗∗ 0.203 0.991∗∗ 0.867∗∗
(0.113) (1.451) (0.855) (1.294) (0.449) (0.348)
∆ ln(
T-BillGDP
)· ∆ ln (Assets) 24.40 10.28∗∗∗ 8.999∗∗∗
(38.57) (2.174) (2.220)Observations 189 77 77 188 77 77
shocks as instruments for asset growth. Both estimates are positive and significant. Column 5 and
6 use the Q2 dummy as an instrument for Treasury Bill supply, and use two measures of monetary
policy shocks respectively to instrument asset growth. The coefficient on the interaction term is
positive and significant. These confirm the findings in baseline specifications.
Table A.2 provides evidence that supports the predictions of the model in main text. But it
is far from conclusive. Future research based on longer samples, international data, and alternative
identification strategies, shall provide a better evaluation of the model’s predictions on intermediary
leverage cycle, the impact of government debt on it, and other results such as how banks’ payout
and issuance policies respond to government debt supply.
9
2 Discussion: Government Debt as Outside Money
Optimal timing of government debt supply. This paper only considers the simplest case of fixed
government debt supply, but the model does reveal an interesting trade-off that calls for an optimal
strategy of government debt management. When the government issues more debt, it benefits the
firms by reducing the money premium, but at the same time, it hurts the bankers who rely on the
money premium as a source of profit. Its decision to increase or decrease its debt should balance
the impact on both sectors, and in particular, depend on which sector is more constrained.
When ηt is high and banks are already supplying a large amount of money, the marginal
benefit of increasing government debt is small. When banks are undercapitalized and not creating
enough deposits, raising government debt can significantly alleviate the money shortage. This
suggests a countercyclical government debt supply. However, the bank crowding-out effect favors
procyclical government debt supply. In good times, banks’ leverage rises, making the economy
unstable. The government should increase its debt to crowd out bank leverage. And since banks
are well capitalized, the government worries less about crowding out banks’ profit.8 In low ηt
states, the equity crowding-out effect becomes a major concern. The government may want to
reduce its debt, allowing banks to rebuild equity by earning a high money premium.
Bank equity crowding in. So far, we have only considered the competition between government
and banks as money suppliers. Under additional frictions, government debt may be held by banks
for their own liquidity needs (Bianchi and Bigio (2014); Drechsler, Savov, and Schnabl (2017)) or
as collateral (Saint-Paul (2005); Bolton and Jeanne (2011)). Banks may also hold government se-
curities for regulatory purpose, for example to meet the liquidity coverage ratio (Basel Committee
on Bank Supervision (2013)). Therefore, increases in government debt could relax banks’ liquidity
or regulatory constraints, and thereby, may increase their profit and crowd in equity.
Optimal bailout scale. In bad states, the government may intervene to recapitalize the banking
sector, like the Troubled Asset Relief Program (“TARP”) in the financial crisis of 2007-09. On the
8But by crowding out banks’ profit, raising government debt gives banks more incentive to pay out dividends at alower level of equity. By decreasing the payout boundary, it strengthens the asymmetric impact of shocks, making theimpact of negative shocks stronger relative to good shocks. This negative effect needs to be weighed in against thepositive effect on stability from the reduction of bank leverage.
10
one hand, the banking sector benefits from equity injection. On the other hand, banks’ profit from
money creation is squeezed by the government debt that finances the bailout program. Balancing
the two effects, the government may find an optimal scale of bailout financed by government debt
in the sense that the expected time to recover is minimized.
Instability from coexistence of regulated and unregulated banks. We can reinterpret MG as
money supplied by a separate banking sector that is fully regulated and backs deposits with 100%
reserves in the form of government debt. Regulated banks’ balance sheets are just a pass-through.
Their money supply grows proportionally with the economy. Such a banking sector was proposed
in the Chicago Plan.9 The competition between government and banks in supplying money can
thus be reinterpreted as the competition between fully regulated banks and unregulated banks, or
“shadow banks”. Besides many issues surrounding the Chicago Plan, this paper points to a partic-
ular concern. If private money cannot be completely forbidden, the leverage cycle in unregulated
shadow banking can be amplified by money that is fully backed government securities.
Instability from market liquidity. In reality, firms can and do hold some of other firms’ or house-
holds’ liabilities in their liquidity portfolios, provided that these securities have sufficiently liquid
secondary markets. We can define MFKt as the maximum amount of liquid securities that firms
and households can issue in aggregate, so MF is almost a measure of financial market develop-
ment. Since firms and households are willing to issue any securities that promise an expected
return less or equal to ρ, firms and households will maximize their issuance in the presence of
money premium. To analyze the effects of market liquidity on growth and stability, we can simply
follow the analysis of government debt, and all the conclusions carry through. Through the lens
of the model, larger and deeper secondary security markets (i.e., higher MF ) can amplify the bank
leverage cycle and prolong recessions. From 1975 to 2014, the stock market capitalization in the
United States increased from c.40% of GDP to c.140%. The competition between market and in-
termediated liquidity is not the focus of this paper, but the model does point out a possibility that
from a liquidity provision perspective, financial markets can destabilize financial intermediaries.
9It is a banking reform initially proposed by Frank Knight and Henry Simons of the University of Chicago andsupported by Irving Fisher of Yale University (Phillips (1996)). Benes and Kumhof (2012) revisited the plan in theinterest of financial stability.
11
Relaxing the financial constraint. It has been assumed that when the liquidity shock hits, a firm
cannot mobilize any resources other than its money holdings because existing capital has been de-
stroyed and the investment project is not pledgeable. One way to relax the financial constraint is to
introduce a liquidation value of the firm, say MLkt, where ML is a constant, so creditors can liq-
uidate the firm and seize MLkt when the firm defaults. Thereby, when the liquidity shock arrives,
the firm has liquidity equal to(mt +ML
)kt, the sum of money holdings and the pledgeable value
of the firm. Now, we have a new money demand curve:
ρ− rt = λ[qKt F
′ (mt +ML)− 1
].
The role thatML plays is the same asMG (andMF in the analysis of market liquidity). Therefore,
the previous analysis carries through.10 Relaxing the financial constraint indeed reduces firms’
demand for bank debt, but it may amplify the bank leverage cycle, prolong recessions, and actually
make the economy worse. To understand the financial stability implications of liquidity provided
by the government (MG), the secondary market of securities (MF ), and the productive capital
(ML), we must take into account the endogenous response of the banking system. More liquidity
is not always beneficial.
10There is one caveat – more capital holdings (i.e., larger kt) relaxes the liquidity constraint on future investmentsby raising the liquidation value, so capital price qKt is likely to increase in comparison with the benchmark case.However, this mechanism enhances the procyclicality of qKt , and thus, amplifies the procyclicality of bank leverage.
12
ReferencesAdrian, T., E. Etula, and T. Muir (2014). Financial intermediaries and the cross-section of asset
returns. The Journal of Finance 69(6), 2557–2596.
Adrian, T. and H. S. Shin (2010). Liquidity and leverage. Journal of Financial Intermedia-tion 19(3), 418 – 437.
Basel Committee on Bank Supervision (2013). Basel III: The Liquidity Coverage Ratio and liq-uidity risk monitoring tools. Technical report, Bank for International Settlements.
Bates, T. W., K. M. Kahle, and R. M. Stulz (2009). Why do U.S. firms hold so much more cashthan they used to? The Journal of Finance 64(5), 1985–2021.
Benes, J. and M. Kumhof (2012). The Chicago plan revisited. Working paper WP/12/202, Inter-national Monetary Fund.
Bianchi, J. and S. Bigio (2014). Banks, liquidity management and monetary policy. Working PaperSeries 20490, National Bureau of Economic Research.
Bolton, P. and O. Jeanne (2011). Sovereign default risk in financially integrated economies. IMFEconomic Review 59(2), 162–194.
Cochrane, J. H. and M. Piazzesi (2002). The Fed and interest rates: A high-frequency identifica-tion. Working Paper 8839, National Bureau of Economic Research.
Cook, T. and T. Hahn (1989). The effect of changes in the federal funds rate target on marketinterest rates in the 1970s. Journal of Monetary Economics 24(3), 331 – 351.
Drechsler, I., A. Savov, and P. Schnabl (2017). A model of monetary policy and risk premia. TheJournal of Finance, forthcoming.
Eisfeldt, A. and A. Rampini (2009). Financing shortfalls and the value of aggregate liquidity.Working paper, Duke University.
Gertler, M. and P. Karadi (2015). Monetary policy surprises, credit costs, and economic activity.American Economic Journal: Macroeconomics 7(1), 44–76.
Gorton, G. (2010). Slapped by the Invisible Hand: The Panic of 2007. New York, N.Y.: OxfordUniversity Press.
Greenwood, R., S. G. Hanson, and J. C. Stein (2015). A comparative-advantage approach togovernment debt maturity. The Journal of Finance 70(4), 1683–1722.
13
Hanson, S. G. and J. C. Stein (2015). Monetary policy and long-term real rates. Journal ofFinancial Economics 115(3), 429 – 448.
He, Z., B. Kelly, and A. Manela (2016). Intermediary asset pricing: New evidence from manyasset classes. Working Paper 21920, National Bureau of Economic Research.
He, Z. and P. Kondor (2016). Inefficient investment waves. Econometrica 84(2), 735–780.
Krishnamurthy, A. and A. Vissing-Jørgensen (2015). The impact of Treasury supply on financialsector lending and stability. Journal of Financial Economics 118(3), 571 – 600.
Kuttner, K. N. (2001). Monetary policy surprises and interest rates: Evidence from the fed fundsfutures market. Journal of Monetary Economics 47(3), 523 – 544.
Nagel, S. (2016). The liquidity premium of near-money assets. The Quarterly Journal of Eco-nomics, forthcoming.
Nakamura, E. and J. Steinsson (2017). High frequency identification of monetary non-neutrality:The information effect. Quarterly Journal of Economics, forthcoming.
Newey, W. K. and K. D. West (1994). Automatic lag selection in covariance matrix estimation.The Review of Economic Studies 61(4), 631–653.
Phillips, R. J. (1996). The ‘Chicago Plan’ and New Deal Banking Reform. Stability in the FinancialSystem, pp. 94–114. Palgrave Macmillan UK.
Pozsar, Z. (2011). Institutional cash pools and the triffin dilemma of the U.S. banking system.Working paper WP/11/190, International Monetary Fund.
Saint-Paul, G. (2005). Fiscal policy and economic growth: the role of financial intermediation.Review of International Economics 13(3), 612–629.
Stein, J. C. (2012). Monetary policy as financial stability regulation. The Quarterly Journal ofEconomics 127(1), 57–95.
14