Embed Size (px)
Citation preview
Product Sustainability Index
Feel the difference
Feel the differenceFordS-MAX FordGalaxy

PSI �
Foreword
Contents1 ExecutiveSummary 42 ProductSustainabilityIndex 42.1 Introduction 42.2 PSI–Method 52.3 PSI–Implementation 63 LifeCycleAspects 73.1 Introduction 73.2 DefinitionofGoalandScope 83.3 EnvironmentalLifeCycleInventory(LCI)andCostDataInventory 123.4 LifeCycleImpactAssessmentanddirectionalLifeCycleCostingResult 183.5 Interpretation 204 FordGalaxyandS-MAXProductSustainabilityIndex 254.1 Scaling 254.2 FordGalaxyandS-MAXPSIResults 27
5 References 306 Acronyms 317 Appendix 328 ISO14040CriticalReviewofVehicleOptions(fullindependentreport) 34
Sustainabledevelopmentisoneofthekeyglobalissuesfacingsocietyinthe21stcentury.FordMotorCompanyseesthisissueasnotonlyakeybusinesschallengebutalsoasanimportantopportunitytofacilitatesustainablegrowthinourbusiness.Sustainabilityisoneofmanagement’scentralresponsibilitiesandhighonthelistofourcorporatevalues.
DemonstratingthatweputsustainabilityattheheartofeverythingwedoisFordofEurope’snewProductSustainabilityIndex(PSI).TheFordPSIisthefirstexampleintheautomotiveindustryofhowsustainabilitycanbeintegratedintomainstreamproductdevelopment.
Themainchallengesofsustainabledevelopment–orforus,sustainablemobility-aretocontinuouslymakeourproductsmoresustainablebyfurtherreducingtheirenvironmentalimpact,enhancingtheirvaluetosocietyandkeepingourfocusonefficiencyandaffordability.Andthisalongtheentirelife-cycleofourproducts.
Asseveralofthechallengesinvolveamultitudeof-oftenconflicting-issues,wefeltitnecessarytodevelopacomprehensiverangeofvehicle-relatedsustainabilitycriteriaandintegratethemrightatthebeginningofourproductdevelopmentprocess.FromthiswasborntheFordPSI.
ThenewFordGalaxyandFordS-MAXarethefirstvehiclesdevelopedusingthisnewholisticapproach.AllfutureFordofEuropevehicleswillalsobedevelopedwithPSIinmind,asrevealedwiththenewFordMondeothisyear.
Iamproudofmyteam–theyaredevelopinggood-looking,desirablepassengervehicleswhoseenvironmentalandsocietalcharacteristicsandaffordabilityhavebeenimprovedcomparedtopreviousmodels.
IamalsoproudthattheintegrityoftheFordPSIinitiativehasbeenconfirmedbyindependent,externalassessments.Furthermore,ourworkandresultsareinlinewithinternationalstandardssuchastheISO14040LifeCycleAssessmentStandard.
Ford’sProductSustainabilityIndexwillhelpmakemobilitymoresustainable.However,itisalsoclearthattofullyaddressthisissue,societywillincreasinglyneedafully-integratedapproachwithallstakeholdersinthetransportsectorcontributing.
Weareallpartoftheproblem,andweareallpartofthesolution.
John Fleming, President and CEO, Ford of Europe
� PSI
1. Executive SummaryFordofEuropeintroducedasustainabilitymanagementtool,theFordProductSustainabilityIndex(hereafter‘PSI’)intotheproductdevelopmentofthenewFordGalaxyandFordS-MAX.Ford’sPSIconsidersenviron-mental,economicandsocietalaspectsbasedon:
•ExternallyreviewedenvironmentalandcostaspectssuchasaLifeCycleAssessment(LCA)andLifeCycleCost
•Externallycertifiedaspectssuchasanallergy-testedinterior
•Otherrelevantaspects,includingsustainablemateri-als,safety,mobilitycapabilityandnoise
ThenewFordGalaxyandFordS-MAXshowsignificantimprovementsoverthepreviousmodelGalaxyregardingthelifecycleairquality*,useofsustainablematerials,restrictedsubstancesandsafety.Theiraffordability(LifecycleCostofOwnership)hasalsobeenimprovedwhenlookingatcomparableenginetypes.Thus,Fordcanshowthatindicatorsfromallthreemajorareasofsustainability-environment,socialandeconomic-havebeenimproved.FollowingtheS-MAXandGalaxy,allfutureFordofEuropevehicleswillbedevelopedinlinewithPSI,includingthe2007FordMondeo.
*Coveringcertainairemissions(forexampleNOx,VOC)alongthelifecycle,i.e.fromrawmaterialextractionviaproductionandusethroughtorecoveryofthevehicle.PSIalsoshowstowhatextentCO2equivalentemissionsarereducedalongthevehiclelifecycle.
2. Product Sustainability Index
2.1 IntroductionSustainabledevelopmentisdevelopmentthatmeetsthe“needsofthepresentwithoutcompromisingtheabilityoffuturegenerationstomeettheirownneeds”(BrundtlandCommission;[1]).Theconceptistoimproveenviron-mental,societalandeconomicaspectssimultaneously.Withinthiscontext,ChairmanWilliamClayFordJr.said,“FordMotorCompanyonceprovidedtheworldwithmobilitybymakingitaffordable.Inthe21stcentury,wewanttocontinuetoprovidetheworldwithmobilitybymakingitsustainable”(BillFord[2]).FordofEurope’sPSIisonewaytoimplementthisvision.Itdefinesaworkablenumberofkey,controllableproductattributesthatdefinethesustainabilityofavehiclefromaProductDevelop-ment(PD)perspective.
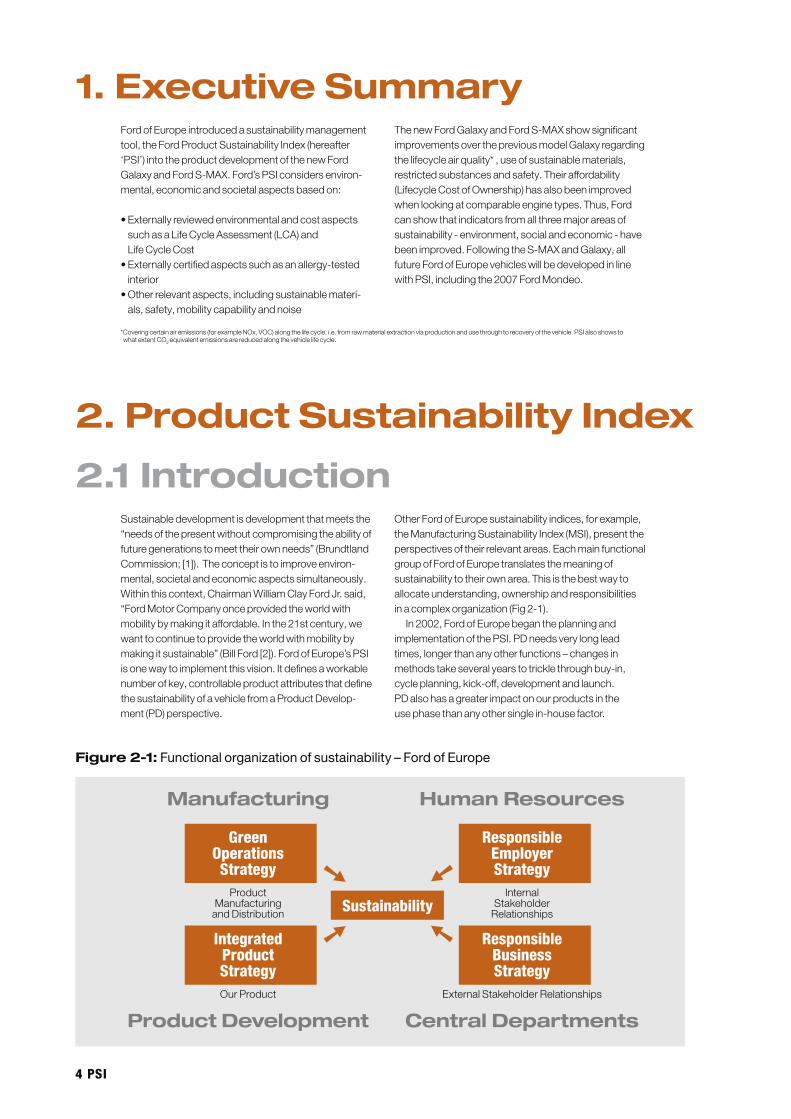
OtherFordofEuropesustainabilityindices,forexample,theManufacturingSustainabilityIndex(MSI),presenttheperspectivesoftheirrelevantareas.EachmainfunctionalgroupofFordofEuropetranslatesthemeaningofsustainabilitytotheirownarea.Thisisthebestwaytoallocateunderstanding,ownershipandresponsibilitiesinacomplexorganization(Fig2-1).
In2002,FordofEuropebegantheplanningandimplementationofthePSI.PDneedsverylongleadtimes,longerthananyotherfunctions–changesinmethodstakeseveralyearstotricklethroughbuy-in,cycleplanning,kick-off,developmentandlaunch.PDalsohasagreaterimpactonourproductsintheusephasethananyothersinglein-housefactor.
Manufacturing
Green OperationsStrategy
ProductManufacturingandDistribution
IntegratedProduct StrategyOurProduct
Product Development
Human Resources
Responsible Employer Strategy
InternalStakeholder
Relationships
Responsible Business Strategy
ExternalStakeholderRelationships
Central Departments
Sustainability
➚
➘
➚
➘
Figure 2-1: Functional organization of sustainability – Ford of Europe
PSI �
2.2 PSI – MethodThereisnotyetanagreedinternationalstandardformeasuringproductsustainability.However,thePSIindicatorschosenbyFordarepartiallybasedontheISO14040(LifeCycleAssess-ment-LCA)standard.TheFordPSIisuniqueintheautomotiveindustryandnoautomobilemanufacturingcompanyhaspub-lishedsimilarapproachesbefore.However,therearesomeexamplesinotherindustriesandorganizationsofsustainabilitypracticesinuse.Theseexampleshaveallowedustodeduce,developandimproveupontheprinciplestheyhavefollowed.ThePSI’sinitialmethodologywasdevelopedbyFordCorporateCitizenshipandenvironmentalpersonnelstartingin2001.Fol-lowingdiscussionswithPDandmodifications,itwasapprovedinautumn2002bytheProductDevelopmentvicepresidentandhisseniormanagementteam.ThenewFordS-MAXandthenewFordGalaxyaretheresultsofthesepilotprograms.AllFordofEuropevehicleskicked-offfollowingthesetwovehiclesareandwillbedevelopedusingthePSI.
TheprinciplesdefiningwhathadtobecoveredbythePSIweremanagementandmethodologicallydriven:•Allrelevantenvironmental,social,andeconomicissueshaveto
beaddressed•OnlyissuesthataremainlyinfluencedbyProductDevelopment
willbedealtwith•Themainissuesmustbeintegratedfromaproductperspective
•Status-trackingmustbepossiblebasedonreadilyavailableproductdevelopmentdata
•Bottom-lineissuesmustbeaddressed,notsingletechnologies(i.e.overallLifeCycleperformance,notdiscussionsoftheuseofcertain,specifictechnologies)
•BusinessprinciplesmustbeintegratedOtherissuesrelatingtosustainablemobility-serviceaspects,inparticular-arenotcoveredbythePSIbecausetheycannotbedealtwithattheengineeringlevel.Legalcomplianceissuesincludingtailpipeemissionstandards,recyclability,andphasingoutofheavymetalsforexample,arenotcoveredwithinPSIasthesearemandatoryregulatoryissues.
Ford’sPSIissplitintoeightdifferentindicators.Thisisconsid-eredthemaximumnumberofissuesthatcouldbedealtwitheffectivelybymanagement.ThePSIcannotbereducedtoasin-glefinalscore-sustainabilityisbydefinitionnotaone-dimen-sionalissue.Itisalwaysmeasuredbyvarioussetsofindicators.Thereisnoreasonablewaytocombineaspectsasdiverseassafety,useofrecycledmaterials,andcostintoonenumber.Thiswouldrequire,forexample,asociallyacceptableweightingoftheirrelativeimportance.Globalcompanieswithglobalmarketsfacethechallengeofbeingconfrontedbydifferingvaluesintheirvariousmarketsandproductionlocations.Asingleweightingoftherelativeimportancewillneverbeuniversallysuitableforallregions[3].
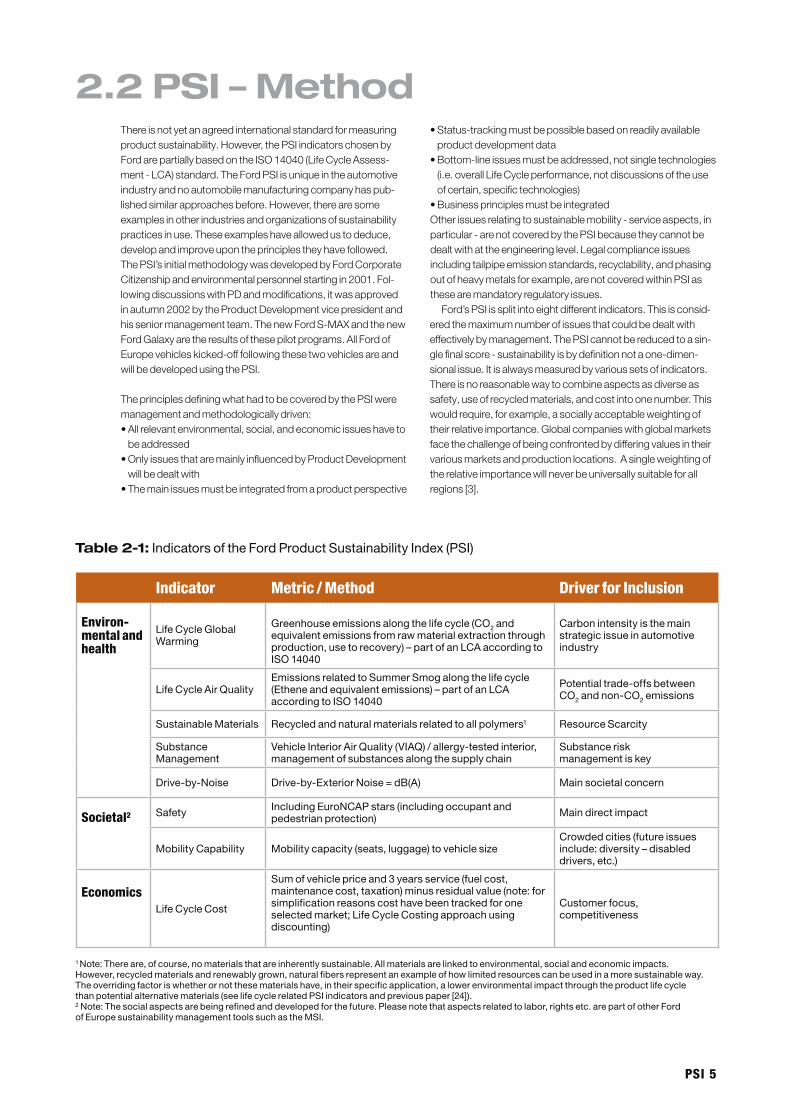
Table 2-1: Indicators of the Ford Product Sustainability Index (PSI)
Indicator Metric / Method Driver for Inclusion
Environ-mental and health
Life Cycle Global Warming
Greenhouse emissions along the life cycle (CO2 and equivalent emissions from raw material extraction through production, use to recovery) – part of an LCA according to ISO 14040
Carbon intensity is the main strategic issue in automotive industry
Life Cycle Air QualityEmissions related to Summer Smog along the life cycle (Ethene and equivalent emissions) – part of an LCA according to ISO 14040
Potential trade-offs between CO2 and non-CO2 emissions
Sustainable Materials Recycled and natural materials related to all polymers1 Resource Scarcity
Substance Management
Vehicle Interior Air Quality (VIAQ) / allergy-tested interior, management of substances along the supply chain
Substance risk management is key
Drive-by-Noise Drive-by-Exterior Noise = dB(A) Main societal concern
Societal2 Safety Including EuroNCAP stars (including occupant and pedestrian protection) Main direct impact
Mobility Capability Mobility capacity (seats, luggage) to vehicle sizeCrowded cities (future issues include: diversity – disabled drivers, etc.)
EconomicsLife Cycle Cost
Sum of vehicle price and 3 years service (fuel cost, maintenance cost, taxation) minus residual value (note: for simplification reasons cost have been tracked for one selected market; Life Cycle Costing approach using discounting)
Customer focus, competitiveness
1 Note: There are, of course, no materials that are inherently sustainable. All materials are linked to environmental, social and economic impacts. However, recycled materials and renewably grown, natural fibers represent an example of how limited resources can be used in a more sustainable way. The overriding factor is whether or not these materials have, in their specific application, a lower environmental impact through the product life cycle than potential alternative materials (see life cycle related PSI indicators and previous paper [24]).2 Note: The social aspects are being refined and developed for the future. Please note that aspects related to labor, rights etc. are part of other Ford of Europe sustainability management tools such as the MSI.
� PSI
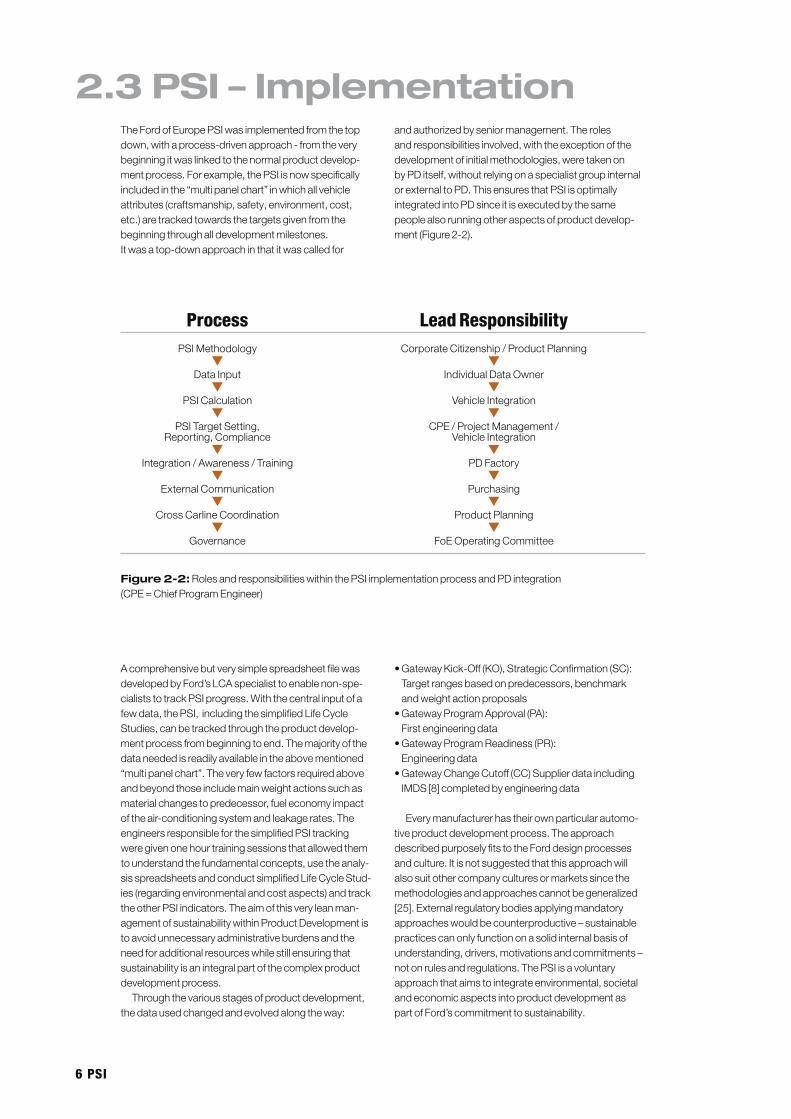
2.3 PSI – ImplementationTheFordofEuropePSIwasimplementedfromthetopdown,withaprocess-drivenapproach-fromtheverybeginningitwaslinkedtothenormalproductdevelop-mentprocess.Forexample,thePSIisnowspecificallyincludedinthe“multipanelchart”inwhichallvehicleattributes(craftsmanship,safety,environment,cost,etc.)aretrackedtowardsthetargetsgivenfromthebeginningthroughalldevelopmentmilestones.Itwasatop-downapproachinthatitwascalledfor
andauthorizedbyseniormanagement.Therolesandresponsibilitiesinvolved,withtheexceptionofthedevelopmentofinitialmethodologies,weretakenonbyPDitself,withoutrelyingonaspecialistgroupinternalorexternaltoPD.ThisensuresthatPSIisoptimallyintegratedintoPDsinceitisexecutedbythesamepeoplealsorunningotheraspectsofproductdevelop-ment(Figure2-2).
AcomprehensivebutverysimplespreadsheetfilewasdevelopedbyFord’sLCAspecialisttoenablenon-spe-cialiststotrackPSIprogress.Withthecentralinputofafewdata,thePSI,includingthesimplifiedLifeCycleStudies,canbetrackedthroughtheproductdevelop-mentprocessfrombeginningtoend.Themajorityofthedataneededisreadilyavailableintheabovementioned“multipanelchart”.Theveryfewfactorsrequiredaboveandbeyondthoseincludemainweightactionssuchasmaterialchangestopredecessor,fueleconomyimpactoftheair-conditioningsystemandleakagerates.TheengineersresponsibleforthesimplifiedPSItrackingweregivenonehourtrainingsessionsthatallowedthemtounderstandthefundamentalconcepts,usetheanaly-sisspreadsheetsandconductsimplifiedLifeCycleStud-ies(regardingenvironmentalandcostaspects)andtracktheotherPSIindicators.Theaimofthisveryleanman-agementofsustainabilitywithinProductDevelopmentistoavoidunnecessaryadministrativeburdensandtheneedforadditionalresourceswhilestillensuringthatsustainabilityisanintegralpartofthecomplexproductdevelopmentprocess.
Throughthevariousstagesofproductdevelopment,thedatausedchangedandevolvedalongtheway:
•GatewayKick-Off(KO),StrategicConfirmation(SC):Targetrangesbasedonpredecessors,benchmarkandweightactionproposals
•GatewayProgramApproval(PA):Firstengineeringdata
•GatewayProgramReadiness(PR):Engineeringdata
•GatewayChangeCutoff(CC)SupplierdataincludingIMDS[8]completedbyengineeringdata
Everymanufacturerhastheirownparticularautomo-tiveproductdevelopmentprocess.TheapproachdescribedpurposelyfitstotheForddesignprocessesandculture.Itisnotsuggestedthatthisapproachwillalsosuitothercompanyculturesormarketssincethemethodologiesandapproachescannotbegeneralized[25].Externalregulatorybodiesapplyingmandatoryapproacheswouldbecounterproductive–sustainablepracticescanonlyfunctiononasolidinternalbasisofunderstanding,drivers,motivationsandcommitments–notonrulesandregulations.ThePSIisavoluntaryapproachthataimstointegrateenvironmental,societalandeconomicaspectsintoproductdevelopmentaspartofFord’scommitmenttosustainability.
ProcessPSIMethodology
▼DataInput
▼PSICalculation
▼PSITargetSetting,
Reporting,Compliance▼
Integration/Awareness/Training▼
ExternalCommunication▼
CrossCarlineCoordination▼
Governance
Lead ResponsibilityCorporateCitizenship/ProductPlanning
▼IndividualDataOwner
▼VehicleIntegration
▼CPE/ProjectManagement/
VehicleIntegration▼
PDFactory▼
Purchasing▼
ProductPlanning▼
FoEOperatingCommittee
Figure 2-2:RolesandresponsibilitieswithinthePSIimplementationprocessandPDintegration(CPE=ChiefProgramEngineer)
PSI �
3 Life Cycle Aspects
3.1 IntroductionThevehiclelifecyclecoversallphasesandprocesseswithin:
•ManufacturingandAssembly(fromresourceextractionthroughmaterialproduction,partsproductiontovehicleassemblyandpainting)
•Usephase(drivingofvehicles)•End-of-LifePhase(pre-treatmentofvehicles,
shreddingoftheremainingvehicleandrecycling,recoveryanddisposaloftheresultingmaterials)
Takingaholisticapproachisessentialforcreatingasustainablevehiclelifecycle.Designactionsthatimproveonelifecyclephasebuthaveanegativeimpactonanothermustbeavoided.Forexample,usingcertainmaterialsmayreducerecyclingcostbutaddweighttothevehicle,thusincreasingemissionsduringtheusephase.Measurestoreducefuelconsumptionwillreducetheusephasecostbutincreasethevehiclepriceandsoon.Theaimistoensurenetbenefitsalongthelifecycleasawhole–inanenvironmentallyandsocietallyefficientway[4].
TheenvironmentalaspectsaretrackedfollowingtheISO14040forLifeCycleAssessment(LCA).Duringproductdevelopment,asimplifiedLCAiscarriedoutbynon-specialists.Beforevehiclelaunch,aFordLCAandLCCspecialistverifiestheinitialresults,doingafullLCAbasedonspecializedsoftwareandusinganextendeddatabase[5].ThebasicmethodofthisLCAisthesameasusedinanotherautomotivestudy[6]thatwasinde-pendentlyreviewedaccordingtoISO14040§7.3.3andwherethemissingdetailsindescription(methodology,data)arecovered.However,additionshavebeenmadetoincludemodernvehicletechnologiesnotconsideredpreviouslyaswellasdataspecifictothecurrentproject.
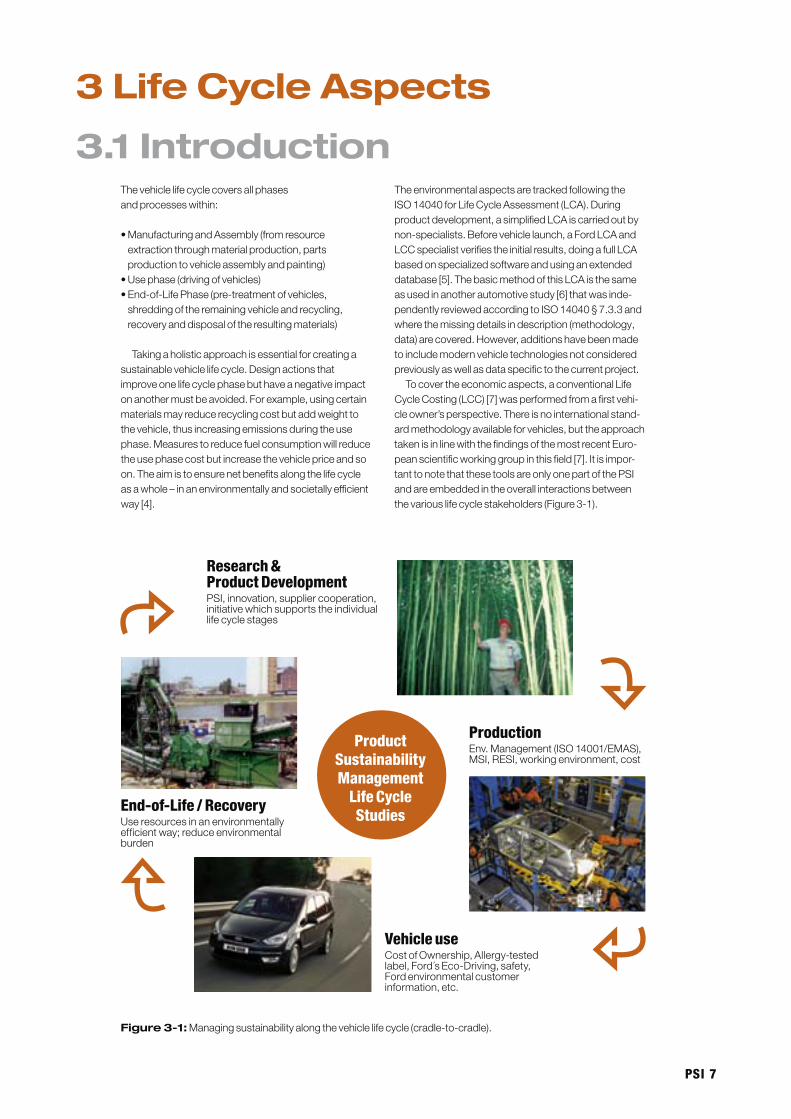
Tocovertheeconomicaspects,aconventionalLifeCycleCosting(LCC)[7]wasperformedfromafirstvehi-cleowner’sperspective.Thereisnointernationalstand-ardmethodologyavailableforvehicles,buttheapproachtakenisinlinewiththefindingsofthemostrecentEuro-peanscientificworkinggroupinthisfield[7].Itisimpor-tanttonotethatthesetoolsareonlyonepartofthePSIandareembeddedintheoverallinteractionsbetweenthevariouslifecyclestakeholders(Figure3-1).
Figure 3-1:Managingsustainabilityalongthevehiclelifecycle(cradle-to-cradle).
Research & Product DevelopmentPSI,innovation,suppliercooperation,initiativewhichsupportstheindividuallifecyclestages
ProductionEnv.Management(ISO14001/EMAS),MSI,RESI,workingenvironment,cost
Vehicle useCostofOwnership,Allergy-testedlabel,Ford´sEco-Driving,safety,Fordenvironmentalcustomerinformation,etc.
End-of-Life / RecoveryUseresourcesinanenvironmentallyefficientway;reduceenvironmentalburden
Product Sustainability Management
Life Cycle Studies
� PSI
3.2 Definition of Goal and Scope
Goal –ThegoaloftheLifeCycleStudiesisto:•SupportinternalProductDevelopmentbytracking
keyenvironmentallifecycleimpacts(LCA)andbottom-lineeconomic(LCC)impactsofplannedand/orimple-mentedengineeringactionsthroughouttheproductdevelopmentprocess
•VerifythePSIresultsregardingGlobalWarmingandAirQualityPotentialandalsocheckotherlifecycleenvironmentalimpactsnotincludedinthePSI
•AssesstheFordvehicles’environmentallifecycleperformancefromapurelyenvironmentalandeconomicstandpoint
•IdentifyandassessthecostassociatedwithvehiclepurchaseandmaintenanceforatypicalvehiclebuyerinaselectedEuropeanmarketassumingaresaleafter3years(typicalcarownershiptradecycle)
Functional Unit – Alldatafromthelifecyclestudiesarecalculatedbasedonastandardfunctionalunit.Itisdefinedasfollows:aEuropean,premium,mid-class,van-sized,five-doorvehicleforaminimumof5passen-gersincludingaluggagecompartmentwithaminimumvolumeof900liters,climatecontrolledinterior,modernentertainmentandsafetystandardswithanaveragemileageof150,000kilometersover12years.Note:ThepreviousandnewFordGalaxiescanseatsevenpassengers,butthenhavelessthan900litersluggagecapacityinthatconfiguration.AnadditionalLCCvalueisidentifiedforthecaseofaresaleafter3years.
Assessment Vehicles – Thefollowingvehicleshavebeenassessed:•PreviousFordGalaxy1.9lTDI,96kW,
manual6speed,economyedition•NewFordGalaxy2.0lTDCiwith
dieselparticulatefilter(DPF),96kW,trendedition•NewFordGalaxy2.0l,gasoline,manual5speed,
107kW,trendedition•NewFordS-MAX2.0LTDCiwithDPF,
96kW,trendedition•NewFordS-MAX2.0lgasoline,manual5speed,
107kW,trendedition
Thebasedataforvehicleproductionisthematerialbreakdownofthedifferentvehicles.Thesearederivedfrom:•CompleteteardownofthepreviousFordGalaxy
intheForddismantlingcenterinCologne.•Weightassumptionsbasedonthepredecessorplat-
formandplannedweightrelatedactions(forthefirstlifecyclestudyatthestartofvehicledevelopmentforthenewFordvehiclemodels–fromGatewaysKOtoPA).
•WeightengineeringdataofthenewFordvehiclesmodels(forlifecyclestudiesduringproductdevelop-ment–fromgatewaysPAtoPR).
•IMDSdataofthenewFordvehiclesmodels[8]com-pletedbyengineeringdata–forgatewayCCandforlifecyclestudyverificationbeforelaunch).
Note:Toavoidcomplicatingthisworkbeyondthepointofpracticability,thevehiclemodelschosenrepresentthenormalweight-controlmodels.Similarly,noadditionalsupplierinformationhasbeenrequestedtoavoidfurthercomplication.
3.2.1 Goal, Functional Unit and Assessed Vehicles
PSI �
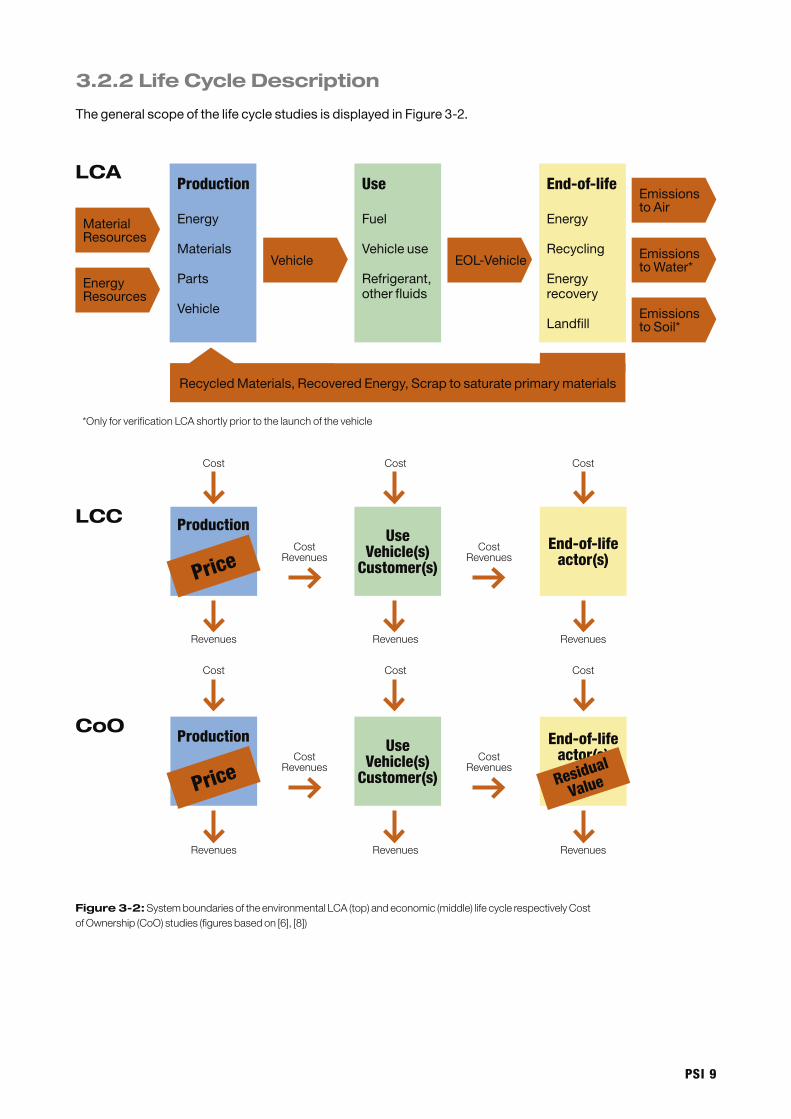
3.2.2 Life Cycle Description
The general scope of the life cycle studies is displayed in Figure 3-2.
UseVehicle(s)
Customer(s)PriceEnd-of-life
actor(s)
Cost Cost Cost
Revenues Revenues Revenues
CostRevenues
CostRevenues
Production
Energy
Materials
Parts
Vehicle
Use
Fuel
Vehicle use
Refrigerant,other fluids
End-of-life
Energy
Recycling
Energy recovery
Landfill
Vehicle
Material Resources
EnergyResources
EOL-Vehicle
Emissions to Air
Emissions to Water*
Emissions to Soil*
Recycled Materials, Recovered Energy, Scrap to saturate primary materials
*OnlyforverificationLCAshortlypriortothelaunchofthevehicle
Figure 3-2:SystemboundariesoftheenvironmentalLCA(top)andeconomic(middle)lifecyclerespectivelyCostofOwnership(CoO)studies(figuresbasedon[6],[8])
UseVehicle(s)
Customer(s)
End-of-lifeactor(s)
Cost Cost Cost
Revenues Revenues Revenues
CostRevenues
CostRevenues
Residual
Value
LCA
LCC
CoO
Production
Price
Production
10 PSI
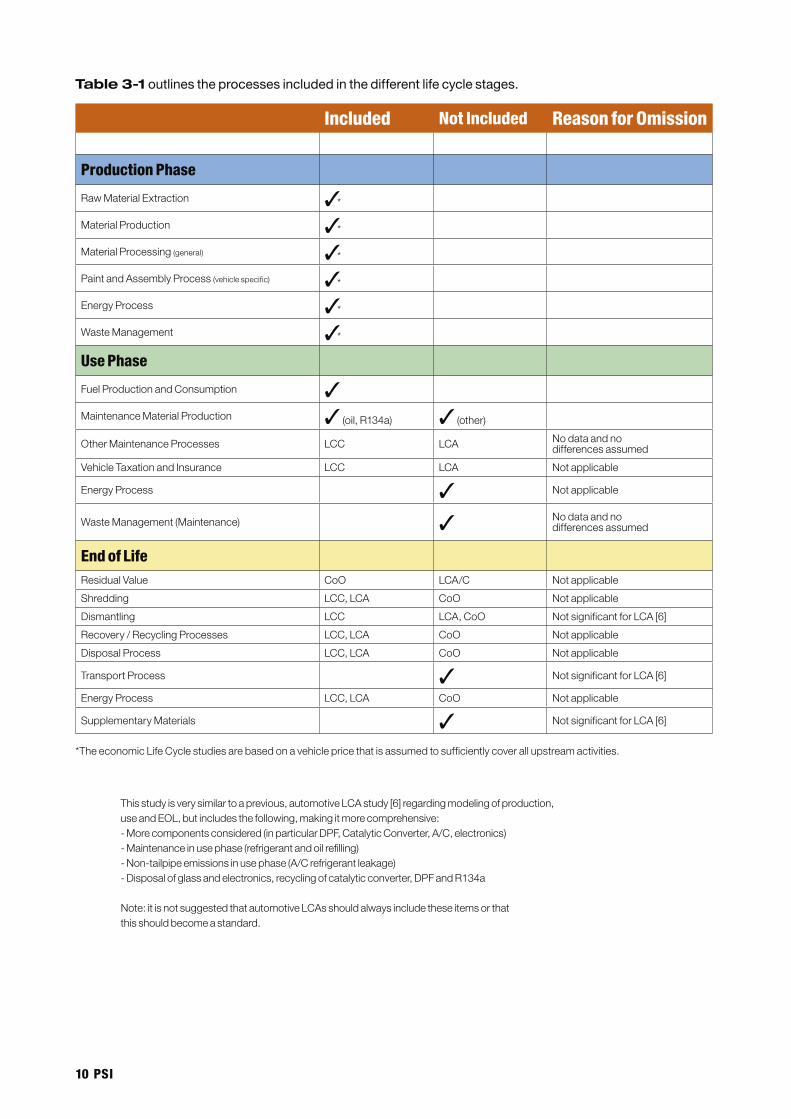
Table 3-1 outlines the processes included in the different life cycle stages.
Included Not Included Reason for Omission
Production Phase
RawMaterialExtraction ✓*
MaterialProduction ✓*
MaterialProcessing(general) ✓*
PaintandAssemblyProcess(vehiclespecific) ✓*
EnergyProcess ✓*
WasteManagement ✓*
Use Phase
FuelProductionandConsumption ✓MaintenanceMaterialProduction ✓(oil,R134a) ✓(other)
OtherMaintenanceProcesses LCC LCA Nodataandnodifferencesassumed
VehicleTaxationandInsurance LCC LCA Notapplicable
EnergyProcess ✓ Notapplicable
WasteManagement(Maintenance) ✓ Nodataandnodifferencesassumed
End of LifeResidualValue CoO LCA/C Notapplicable
Shredding LCC,LCA CoO Notapplicable
Dismantling LCC LCA,CoO NotsignificantforLCA[6]
Recovery/RecyclingProcesses LCC,LCA CoO Notapplicable
DisposalProcess LCC,LCA CoO Notapplicable
TransportProcess ✓ NotsignificantforLCA[6]
EnergyProcess LCC,LCA CoO Notapplicable
SupplementaryMaterials ✓ NotsignificantforLCA[6]
*TheeconomicLifeCyclestudiesarebasedonavehiclepricethatisassumedtosufficientlycoverallupstreamactivities.
Thisstudyisverysimilartoaprevious,automotiveLCAstudy[6]regardingmodelingofproduction,useandEOL,butincludesthefollowing,makingitmorecomprehensive:-Morecomponentsconsidered(inparticularDPF,CatalyticConverter,A/C,electronics)-Maintenanceinusephase(refrigerantandoilrefilling)-Non-tailpipeemissionsinusephase(A/Crefrigerantleakage)-Disposalofglassandelectronics,recyclingofcatalyticconverter,DPFandR134a
Note:itisnotsuggestedthatautomotiveLCAsshouldalwaysincludetheseitemsorthatthisshouldbecomeastandard.
PSI 11
Oneoftherequirementsofthestudyisthatthedataregardingalltheproductionprocessesconsidered–apartfromthevehicleassemblyandpaintshop–mustbegeneric.Theglobalsupplychainisflexibleandmaysourceitsmaterialsandpre-productsfromdifferentsourcesandlocationsduringtheyearsofproduction.Thismeans,forexample,thatpartproductionisreflect-edasgeneralprocessesanddoesnotincludeeitherspecificdimensionsorproductionlocationsofindividualcomponents.Inaddition,thedatasetshavetorepresentanaveragetechnologymixfromacrosstherelevantgeo-graphicallocations.Furthermore,theymustbesourced,asmuchaspossiblefrompublicdatasuchasmaterialindustryassociationdata.Thedatamustalsocoveratleast95%ofthematerialsusedinallvehiclescenarios.
Fortheenvironmentalelementaryflowsandimpactassessment,thestudyissimilarto[6],focusingonthefollowingfortheverificationLCA:•Emissions–GlobalWarmingPotential*,Acidification
Potential,EutrophicationPotential,OzoneDepletionPotential,PhotochemicalOzoneCreationPotentials*accordingtoCML[9]
*bothalsocoveredbythesimplifiedLCAinparalleltoproductdevelopment•Waste–isnotanimpactcategory,however,itis
shown,dividedintofiguresshowingtotalwasteandhazardouswaste
•Resources–non-renewableresourcedepletionofenergyandmaterialsaccordingtoCMLapproach[9]aswellasanEUROMATapproach[23]
Thisstudydoesnotincludeinformationontoxicity,effectsonbiodiversity,landscapedegradation,desertifi-cation,etc.Thereisalackofscientificallyacceptedapproachesregardingtheseissues.Inaddition,anyref-erencetothesecategorieswouldbemisleadinglookingatthecompletenessoftheintendeddatasourcesandthesystemboundaries.
Thereisnoweightingbetweenthevariousareas.ISO14042[10]explicitlystatesthatweightingmaynotbedoneforcomparativeassertionsdisclosedtothepublicandforthecorporatereasonsoutlinedabove.
3.2.3 Data Requirements
Thisstudyistargetedatbothaninternalandexternalaudienceandincludescomparativeassertions.There-fore,anindependent,thirdparty,criticalreviewaccord-ingtoISO14040§7.3.3wasundertakenattheendoftheproject.Thiswastoensurethatthestudywascon-ductedinaccordancewiththeinternationalISO14040standardseriesandisinlinewithcurrentbestpracticesfortheLifeCycleCostingsection(seechapters5
and10).Thechairmanofthereviewpanel,ProfDavidHunkeler,hashadpreviousexperiencesinbothfields.HewasinvolvedinreviewingasimilarLCAstudy[6]andheldthechairmanshipofanLCCscientificworkinggroup.Thesecondreviewer,Prof.WalterKlöpffer,wasselectedbythechairman,buthadnotbeeninvolvedintheabovementionedLCAstudy[6].
3.2.4 Critical Review Panel
Passengervehiclesareverycomplexproductswithupto180,000parts,dependingonthecountingmethodused.Theeffortneededtoinvestigateallelementaryflowsofavehicleindetailwouldbetremendousjustforonevehicle.Thisisthereasonwhyevenpublishedcom-pletesingle-vehicleLCIsaresimplifiedanddonotreflecteverysinglevehicledetail.Inthisstudy,severalvehiclesmustbecompared.Asaresult,itcanonlygointolimiteddetail,butfollowingexperiencewithseveralcompletevehicleLCIs,itcanbestatedwithconfidencethatthelimitationsandsimplificationsdonotaffecttheabilitytodrawconclusionswithinthegoalsofthisstudy.Itdoesmean,however,thatitisnotpossibletocomparetheresultsofthisstudywithresultsofothercompletevehiclestudies.ThecompleteLCIsconsiderdifferentsystemboundaries,vehiclefeaturesincludedandusephaseassumptions-forexample,thisstudyalsoconsiderstheadditionalfuelconsumptionofair-conditioningthatisnotcoveredbymostpublishedcompletevehicleLCAs.Itisalsonotpossibletoderiveconclusionsfromthisstudyregardingspecificcomponentsormaterialssincegener-alassumptionshavebeenmadeforthemanufactureandprocessingoftheseparts–forexample,excluding
theirprecisedesignparameterssuchasthickness,etc.[6]Thisstudydoesnotpredicttheimpactofdatathequalityofwhichisquestionable,suchasthoserelatedtotoxicityandlandscape.Despitethelimitationsofthestudy,thechosenmodelandassumptionsallowmeaningfulconclusionstobedrawnregardingthemainissuesoutlinedaboveforthefollowingreasons:•Centralspecificsofthevehiclesstudiedareconsidered•Theassumptions,systemboundariesanddata
approachesforthevehiclesstudiedarefullyaligned.•Dataanalysisshowshowsignificantandrobustpoten-
tialdifferencesintheresultsare.
IntheLifeCycleCostingsection,allfiguresarebasedonthesetofassumptionsaboutfuturetrendsmadeforthestudy.Theycanbeconsideredasbroadindicatorsoftendenciesonlyandareusedsolelyforthepurposesofarelativeassessmentbetweenthevehicles.Thefiguresarenotexactandmaychangesignificantlyinrealmarketconditions.FordMotorCompanymakesnoguaranteethatthecostreflectmarketconditions.
3.2.5 Limitations of the Life Cycle Study
12 PSI
3.3 Environmental Life Cycle Inventory (LCI) and Cost Data Inventory
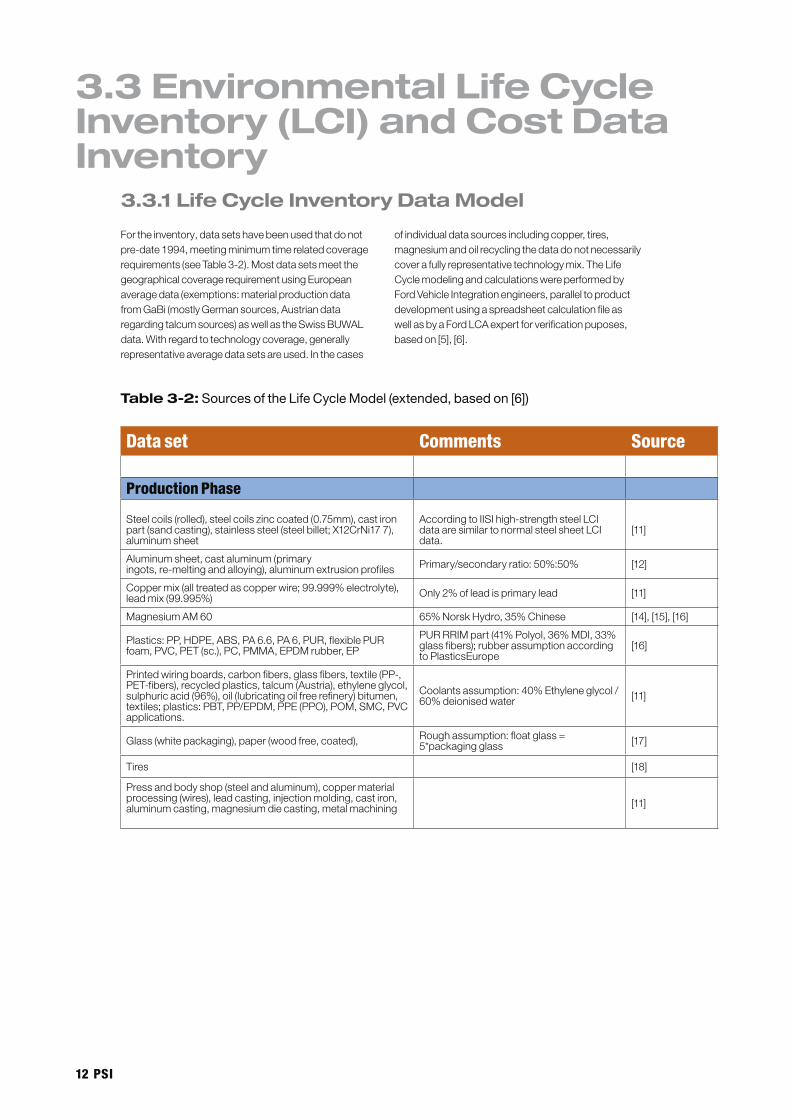
Fortheinventory,datasetshavebeenusedthatdonotpre-date1994,meetingminimumtimerelatedcoveragerequirements(seeTable3-2).MostdatasetsmeetthegeographicalcoveragerequirementusingEuropeanaveragedata(exemptions:materialproductiondatafromGaBi(mostlyGermansources,Austriandataregardingtalcumsources)aswellastheSwissBUWALdata.Withregardtotechnologycoverage,generallyrepresentativeaveragedatasetsareused.Inthecases
ofindividualdatasourcesincludingcopper,tires,magnesiumandoilrecyclingthedatadonotnecessarilycoverafullyrepresentativetechnologymix.TheLifeCyclemodelingandcalculationswereperformedbyFordVehicleIntegrationengineers,paralleltoproductdevelopmentusingaspreadsheetcalculationfileaswellasbyaFordLCAexpertforverificationpuposes,basedon[5],[6].
3.3.1 Life Cycle Inventory Data Model
Table 3-2: Sources of the Life Cycle Model (extended, based on [6])
Data set Comments Source
Production Phase
Steelcoils(rolled),steelcoilszinccoated(0.75mm),castironpart(sandcasting),stainlesssteel(steelbillet;X12CrNi177),aluminumsheet
AccordingtoIISIhigh-strengthsteelLCIdataaresimilartonormalsteelsheetLCIdata.
[11]
Aluminumsheet,castaluminum(primaryingots,re-meltingandalloying),aluminumextrusionprofiles Primary/secondaryratio:50%:50% [12]
Coppermix(alltreatedascopperwire;99.999%electrolyte),leadmix(99.995%) Only2%ofleadisprimarylead [11]
MagnesiumAM60 65%NorskHydro,35%Chinese [14],[15],[16]
Plastics:PP,HDPE,ABS,PA6.6,PA6,PUR,flexiblePURfoam,PVC,PET(sc.),PC,PMMA,EPDMrubber,EP
PURRRIMpart(41%Polyol,36%MDI,33%glassfibers);rubberassumptionaccordingtoPlasticsEurope
[16]
Printedwiringboards,carbonfibers,glassfibers,textile(PP-,PET-fibers),recycledplastics,talcum(Austria),ethyleneglycol,sulphuricacid(96%),oil(lubricatingoilfreerefinery)bitumen,textiles;plastics:PBT,PP/EPDM,PPE(PPO),POM,SMC,PVCapplications.
Coolantsassumption:40%Ethyleneglycol/60%deionisedwater [11]
Glass(whitepackaging),paper(woodfree,coated), Roughassumption:floatglass=5*packagingglass [17]
Tires [18]
Pressandbodyshop(steelandaluminum),coppermaterialprocessing(wires),leadcasting,injectionmolding,castiron,aluminumcasting,magnesiumdiecasting,metalmachining [11]
PSI 1�
Data Set Comments Source
Aluminumsheet,aluminumextrusion [12]
Preciousmetals,siliconcarbideetc.forDPFfilter,catalyticconverter [11],[19],[20]
R134a,recycledcotton,naturalfibers Specificsupplierdataand[21]
painting,assemblySpecificDataforthevehiclesadjustingalsodataonpainting[11]
Othermaterialprocessing(paper,bitumen,glass,ceramics)areassumedtobeincludedinmaterialproduction [6]
Use Phase
Averagemileage 15,0000km [21]
Averagefuelconsumptionandregulatedairemissionsofspecificvehicles,A/Cperformance
Referringto2006performanceofvehicles
Fordhomologateddata;assumptionsforA/C
Premiumgasoline,dieselfuelproduction [11]
SO2,CO2
Calculationbasede.g.onsulphurcontentoffuel
End-of-Life Phase
Recyclingofaluminum [12]
Steelelectricarcfurnace IISI
Recyclingofmagnesium IMA
Recyclingoflead Eurometaux
Recyclingofoil,coolingliquid,rubber(incl.tires),copper Specific[6]
Shredder EFR
Recyclingofthermoplastics(re-granulation+fillersubstitution),thermosets(Shredding+Fillersubstitution);recoveryoffluids,wasteoil,coolingliquid,breakfluidsenergy,rubberandshredderresidue(basedonincineration,cementworks),landfillingofceramics/glass
[11]
Recyclingofpreciousmetals/DPF/catalyticconverter Basedon[11],[19]
R134arecovery Specificdata
Rubberlandfilling(PP),shredder-residuelandfilling,landfilling(mixoflandfillingdatasets) [17]
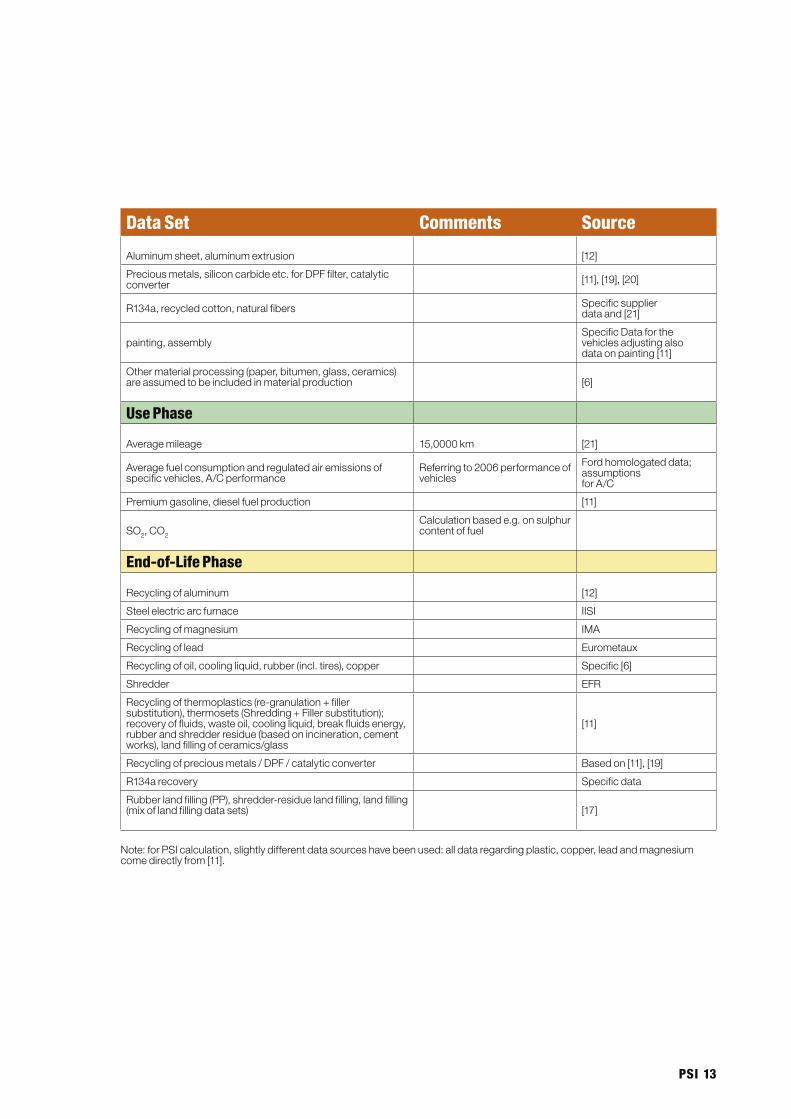
Note:forPSIcalculation,slightlydifferentdatasourceshavebeenused:alldataregardingplastic,copper,leadandmagnesiumcomedirectlyfrom[11].
KO 1034 194 48 355 27 992 187 46 348 21
PA 1068 199 49 366 28 1023 192 48 358 22
PR 1052 197 49 362 34 1025 192 48 351 36
CC >1005 246 50 <355 37 >981 244 50 <329 27
Ferrous* Glass and Ceramics
Fluids and other
Other metals Plastic andElastomers
Milestone Other metals Plastics and Elastomers
Ferrous* Glass and Ceramics
Fluids and other
1� PSI
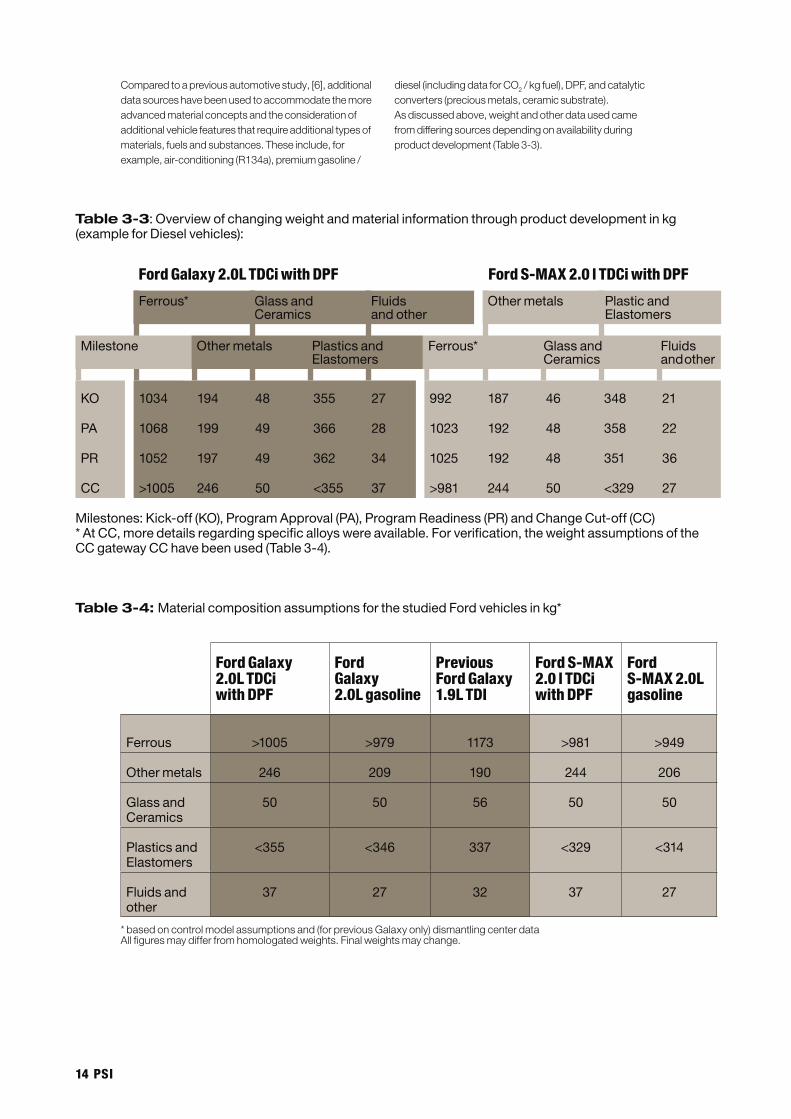
Comparedtoapreviousautomotivestudy,[6],additionaldatasourceshavebeenusedtoaccommodatethemoreadvancedmaterialconceptsandtheconsiderationofadditionalvehiclefeaturesthatrequireadditionaltypesofmaterials,fuelsandsubstances.Theseinclude,forexample,air-conditioning(R134a),premiumgasoline/
diesel(includingdataforCO2/kgfuel),DPF,andcatalyticconverters(preciousmetals,ceramicsubstrate).Asdiscussedabove,weightandotherdatausedcamefromdifferingsourcesdependingonavailabilityduringproductdevelopment(Table3-3).
Table 3-3: Overview of changing weight and material information through product development in kg (example for Diesel vehicles):
Milestones: Kick-off (KO), Program Approval (PA), Program Readiness (PR) and Change Cut-off (CC)* At CC, more details regarding specific alloys were available. For verification, the weight assumptions of the CC gateway CC have been used (Table 3-4).
Table 3-4: Material composition assumptions for the studied Ford vehicles in kg*
Ford Galaxy 2.0L TDCi with DPF
Ford Galaxy 2.0L gasoline
Previous Ford Galaxy 1.�L TDI
Ford S-MAX 2.0 l TDCi with DPF
Ford S-MAX 2.0L gasoline
Ferrous
>1005
>979
1173
>981
>949
Other metals 246 209 190 244 206
Glass and Ceramics
50 50 56 50 50
Plastics and Elastomers
<355 <346 337 <329 <314
Fluids and other
37 27 32 37 27
*basedoncontrolmodelassumptionsand(forpreviousGalaxyonly)dismantlingcenterdataAllfiguresmaydifferfromhomologatedweights.Finalweightsmaychange.
Ford Galaxy 2.0L TDCi with DPF Ford S-MAX 2.0 l TDCi with DPF
PSI 1�
Generalmaterialproduction,processing,useandrecyclingaretakenintoaccount.Fordoperationsareincluded.LCCdataisbasedonestimatedpricesforaselectedEuropeanmarket.
Thefollowingassemblyandmaterialproductionassumptionshavebeenmade:
•RecycledPlasticsareassumedtobemainlyPPbased•ThelargestsourceofLCIdatauncertaintyistheLCI
datafortheproductionofautomotiveglass(packaging
glassdatamultipliedby5wasusedinstead,toapproxi-matetheextramaterialsandprocessingrequirementsforthemanufactureofautomotiveglass).However,sincethesameassumptionsaremadeforallvehiclealternativesinthisstudy,theirimpactislimited[6]
•LCIdatafortheproductionofcelluloseandcardboard–naturalfiberdatausedinstead
•LCIdataforsomepolymerswereunavailable(seechapter3.5.1foraffectedquantities).AverageLCIdataofallotherthermoplasticsin[11]havebeenusedtotakethesepolymersintoaccount.
3.3.2 Production Phase Assumptions
Thefollowingassumptionshavebeenmade:•150,000km,12years(functionalunit)[21]•Fuelconsumption/emissionstandard:
PreviousFordGalaxy1.9lTDI: 6,5ldiesel/100km, Euro3
NewFordGalaxy 2.0lTDCiwithDPF:6,5ldiesel/100km, Euro4
NewFordGalaxy 2.0lgasoline: 8,2lgasoline/100km,Euro4
NewFordS-MAX 2.0lTDCiwithDPF:6,4ldiesel/100km, Euro4
NewFordS-MAX 2.0lgasoline: 8,1lgasoline/100km,Euro4
•Sulphurcontentoffuelisassumedtobe50ppm.•ForA/C,aworst-caseassumptionismade,assumingthatA/Cuseincreasesvehiclefuelconsumptionby10%overandabovetheconsumptionfigureslistedabove.TheHFCleakagerateisassumedtobe0.025kg/year.
3.3.3 Use Phase Assumptions
Allvehicleshavetofulfillratesof85%recyclingand95%recovery.TheserateshavebeenusedforthesimplifiedLCAapproachinparalleltoproductdevelopment.Forverification,theLIRECARscenariosforrecyclingandenergyrecoveryofshredderresidueshavebeenusedassumingthat50%oftheshredderresiduegoesintorecyclingand50%intoenergyrecovery.ForEnd-of-Lifevehicles,asubstitutionmethodologyisappliedtoavoidotherallocationapproaches.TheEnd-of-Lifecostaredifficulttoestimate:•Fromthefirstownerperspectivethereisnormallya
residualvalueofavehicleandnoend-of-lifescenario.Atrade-cycleisassumedinthisstudyinwhichfirstown-ersreplacetheirvehiclesafterthreeyears.Theresidualvalueforecastisquitedifficult,especiallyfortheFordS-MAX,asitisacompletelynewtypeofvehicle.Thefore-castisbasedonthevaluesforFordFocus/FordFocusC-MAX,MondeoandFordGalaxy,takingintoconsid-erationnew-vehicleup-lifts(5%),newvehicletype(8%-similartoC-MAX),correctionforpotentialconsumer’semotionalchangesafter3years(-5%)andafurthercorrectionofminus2%(noguaranteeprovidedforanyofthesevalues).
•Fromthelastownerperspective,theworstcaseend-of-lifecostarezeroduetotheEUELVdirective(thelast
ownercandisposeofavehiclefree-of-charge).•Fromamanufacturer’sperspective,theend-of-life
costarecurrentlyalsozero.•FromaEuropeandismantlerandshreddingoperator’s
perspective,thereareprofitsbasedonthehighvalueofscrap.ItMarketdynamicsmakeitimpossibletopro-videagoodestimateoffutureprofitsandcost.ELVcostarelinkedtothelargeuncertaintiesasshownin[4].Therefore,onlyestimatesoffuturetrendsandELVcostcanbemade.
Thefollowingassumptionshavebeenmadeaboutfuturetrendsfromadismantler/shreddingoperator’sperspec-tive:•Removaloffluids,centralneutralizationofpyrotechni-
caldevices,dismantlingofheavymetals,catalyticconverter,battery,tiresandbodyglass(accordingtocurrentlegislativeandregulatoryrequirements)
•Post-shreddertreatmentapproach•Reuseprofitsarenotconsidered-thisisa
worstcasevalue•Non-laborrelatedcostareconsideredfor
allvehicles(logistics,overhead,etc.)•Allcostarediscountedusing8%interestand
2%inflationratesasbefore
3.3.4 End-of-Life Phase Assumptions
Otherfluidslossesareassumedtobearound5%ofinitialfilling.Theleakageratedataisuncertainbutistakenhereasaworstcaseassumptionandtakenatthesamerateforallvehicles.•Fuelprices:€1,229perliterpremiumgasoline,€1,099perliterdiesel(variationinsensitivityanalysis).
•Insurancecostareestimatedbasedonacountryspe-cificsetofpremiumsbasedonastandardsetofindivid-ualinsuranceclassesandisindicativeonly(ratingsrespectivetoengineeringtargets,a55%deductible,insurancetariff“R”ofFordinsurance,withoutbonus).
Allusephasecostarediscounted,assuminganinterestrateof8%and2%inflation.Thisreflectsprivateconsum-erinterestratesandgeneralEuropeaninflationfigures.
1� PSI
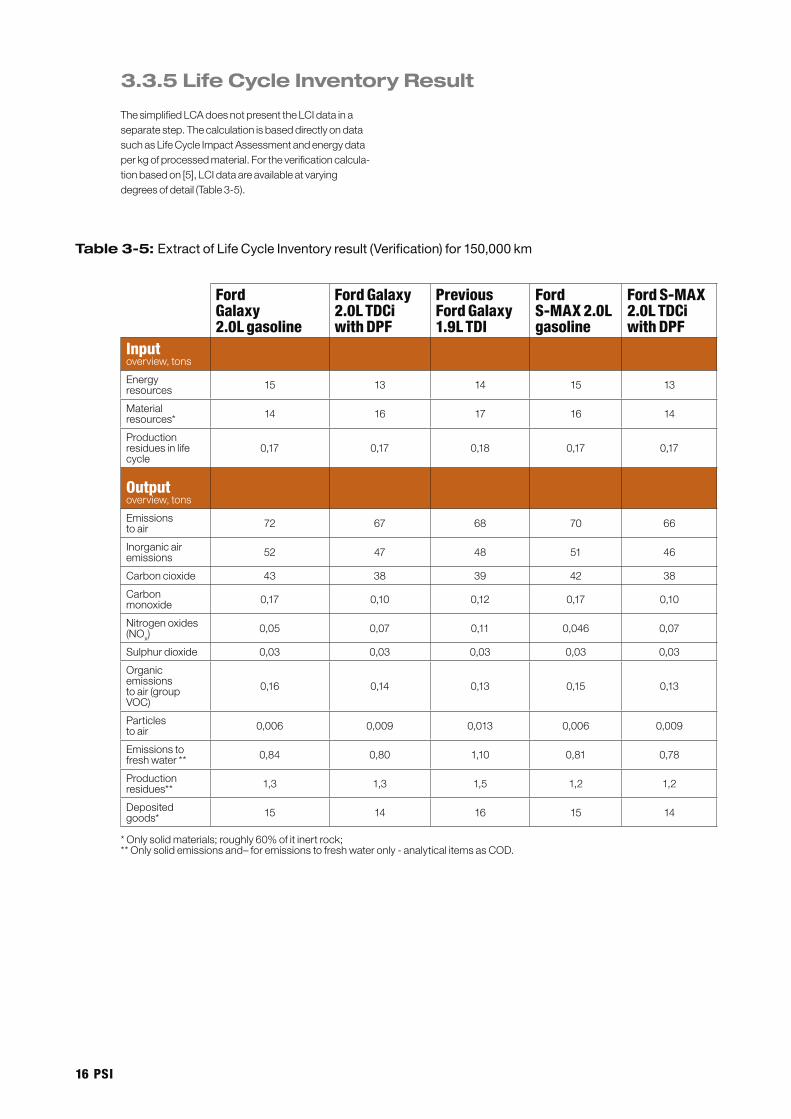
ThesimplifiedLCAdoesnotpresenttheLCIdatainaseparatestep.ThecalculationisbaseddirectlyondatasuchasLifeCycleImpactAssessmentandenergydataperkgofprocessedmaterial.Fortheverificationcalcula-tionbasedon[5],LCIdataareavailableatvaryingdegreesofdetail(Table3-5).
3.3.5 Life Cycle Inventory Result
Table 3-5: Extract of Life Cycle Inventory result (Verification) for 150,000 km
Ford Galaxy 2.0L gasoline
Ford Galaxy 2.0L TDCi with DPF
Previous Ford Galaxy 1.�L TDI
Ford S-MAX 2.0L gasoline
Ford S-MAX 2.0L TDCi with DPF
Input overview,tons
Energyresources 15 13 14 15 13
Materialresources* 14 16 17 16 14
Productionresiduesinlifecycle
0,17 0,17 0,18 0,17 0,17
Outputoverview,tons
Emissionstoair 72 67 68 70 66
Inorganicairemissions 52 47 48 51 46
Carboncioxide 43 38 39 42 38
Carbonmonoxide 0,17 0,10 0,12 0,17 0,10
Nitrogenoxides(NOx)
0,05 0,07 0,11 0,046 0,07
Sulphurdioxide 0,03 0,03 0,03 0,03 0,03
Organicemissionstoair(groupVOC)
0,16 0,14 0,13 0,15 0,13
Particlestoair 0,006 0,009 0,013 0,006 0,009
Emissionstofreshwater** 0,84 0,80 1,10 0,81 0,78
Productionresidues** 1,3 1,3 1,5 1,2 1,2
Depositedgoods* 15 14 16 15 14
*Onlysolidmaterials;roughly60%ofitinertrock;**Onlysolidemissionsand–foremissionstofreshwateronly-analyticalitemsasCOD.
PSI 1�
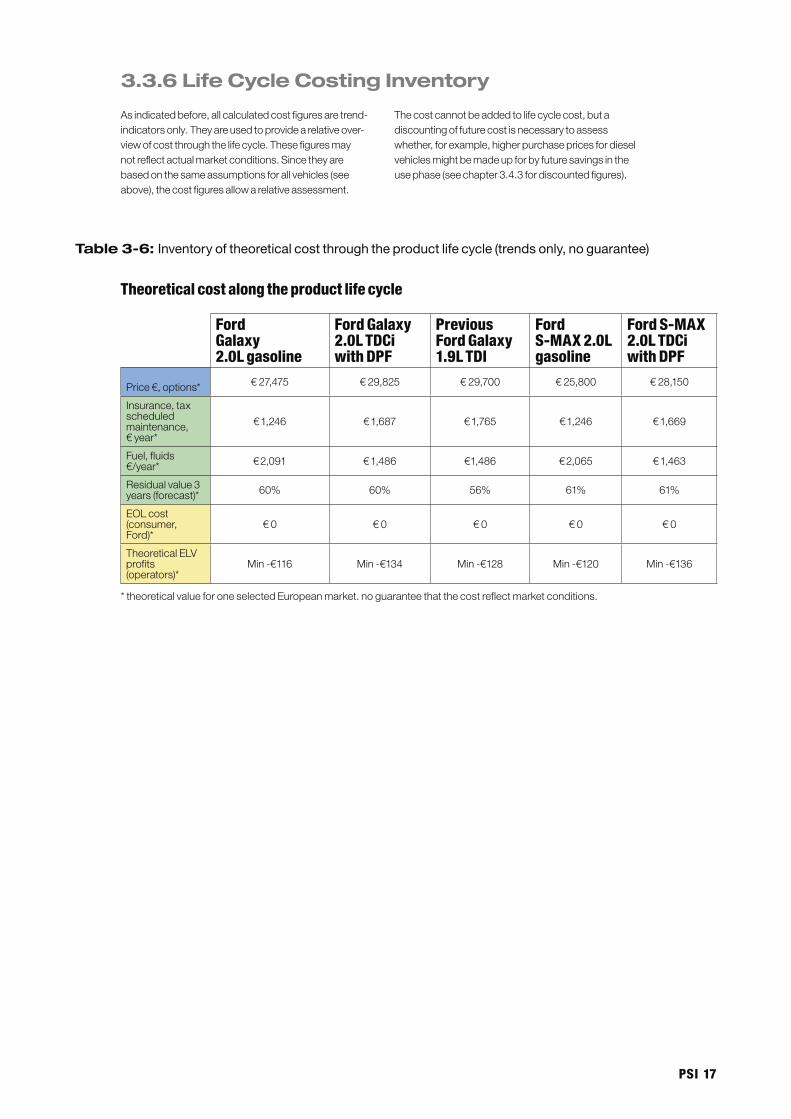
Asindicatedbefore,allcalculatedcostfiguresaretrend-indicatorsonly.Theyareusedtoprovidearelativeover-viewofcostthroughthelifecycle.Thesefiguresmaynotreflectactualmarketconditions.Sincetheyarebasedonthesameassumptionsforallvehicles(seeabove),thecostfiguresallowarelativeassessment.
Thecostcannotbeaddedtolifecyclecost,butadiscountingoffuturecostisnecessarytoassesswhether,forexample,higherpurchasepricesfordieselvehiclesmightbemadeupforbyfuturesavingsintheusephase(seechapter3.4.3fordiscountedfigures).
3.3.6 Life Cycle Costing Inventory
Table 3-6: Inventory of theoretical cost through the product life cycle (trends only, no guarantee)
Ford Galaxy 2.0L gasoline
Ford Galaxy 2.0L TDCi with DPF
Previous Ford Galaxy 1.�L TDI
Ford S-MAX 2.0L gasoline
Ford S-MAX 2.0L TDCi with DPF
Price€,options* €27,475 €29,825 €29,700 €25,800 €28,150
Insurance,taxscheduledmaintenance,€year*
€1,246 €1,687 €1,765 €1,246 €1,669
Fuel,fluids€/year* €2,091 €1,486 €1,486 €2,065 €1,463
Residualvalue3years(forecast)* 60% 60% 56% 61% 61%
EOLcost(consumer,Ford)*
€0 €0 €0 €0 €0
TheoreticalELVprofits(operators)*
Min-€116 Min-€134 Min-€128 Min-€120 Min-€136
*theoreticalvalueforoneselectedEuropeanmarket.noguaranteethatthecostreflectmarketconditions.
Theoretical cost along the product life cycle
1� PSI
3.4 Life Cycle Impact Assessment and Directional Life Cycle Costing Result
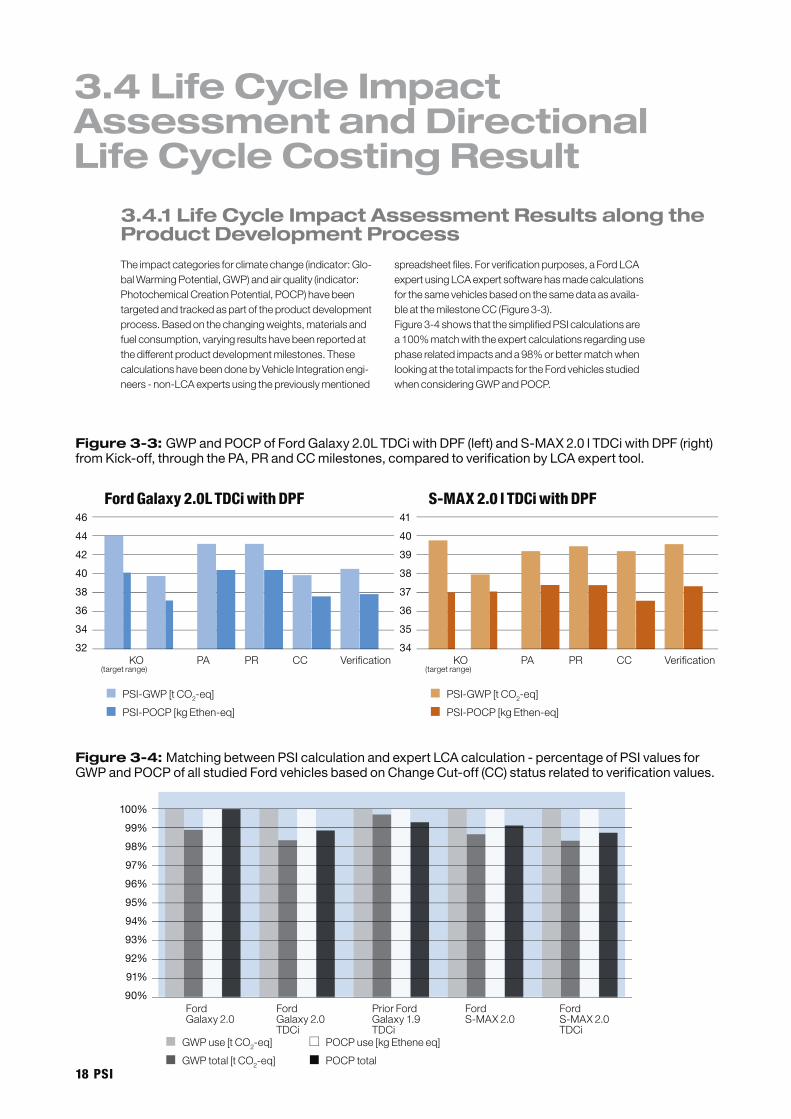
Theimpactcategoriesforclimatechange(indicator:Glo-balWarmingPotential,GWP)andairquality(indicator:PhotochemicalCreationPotential,POCP)havebeentargetedandtrackedaspartoftheproductdevelopmentprocess.Basedonthechangingweights,materialsandfuelconsumption,varyingresultshavebeenreportedatthedifferentproductdevelopmentmilestones.ThesecalculationshavebeendonebyVehicleIntegrationengi-neers-non-LCAexpertsusingthepreviouslymentioned
spreadsheetfiles.Forverificationpurposes,aFordLCAexpertusingLCAexpertsoftwarehasmadecalculationsforthesamevehiclesbasedonthesamedataasavaila-bleatthemilestoneCC(Figure3-3).Figure3-4showsthatthesimplifiedPSIcalculationsarea100%matchwiththeexpertcalculationsregardingusephaserelatedimpactsanda98%orbettermatchwhenlookingatthetotalimpactsfortheFordvehiclesstudiedwhenconsideringGWPandPOCP.
3.4.1 Life Cycle Impact Assessment Results along the Product Development Process
Figure 3-3: GWP and POCP of Ford Galaxy 2.0L TDCi with DPF (left) and S-MAX 2.0 l TDCi with DPF (right) from Kick-off, through the PA, PR and CC milestones, compared to verification by LCA expert tool.
Figure 3-4: Matching between PSI calculation and expert LCA calculation - percentage of PSI values for GWP and POCP of all studied Ford vehicles based on Change Cut-off (CC) status related to verification values.
46
44
42
40
38
36
34
32KO PA PR CC Verification(targetrange)
PSI-GWP[tCO2-eq]
PSI-POCP[kgEthen-eq]
Ford Galaxy 2.0L TDCi with DPF41
40
39
38
37
36
35
34KO PA PR CC Verification(targetrange)
PSI-GWP[tCO2-eq]
PSI-POCP[kgEthen-eq]
S-MAX 2.0 l TDCi with DPF
100%
99%
98%
97%
96%
95%
94%
93%
92%
91%
90%Ford Ford PriorFord Ford FordGalaxy2.0 Galaxy2.0 Galaxy1.9 S-MAX2.0 S-MAX2.0 TDCi TDCi TDCi
GWPuse[tCO2-eq]
GWPtotal[tCO2-eq]
POCPuse[kgEtheneeq]
POCPtotal
PSI 1�
Theoretical cost along the product life cycle
Ford Galaxy 2.0L gasoline
Ford Galaxy 2.0L TDCi with DPF
Previous Ford Galaxy 1.�L TDI
Ford S-MAX 2.0L gasoline
Ford S-MAX 2.0L TDCi with DPF
Price€,options* €27,475 €29,825 €29,700 €25,800 €28,150
Discountedusephasecost€*(3years)
€8,938 €8,498 €8,707 €8,870 €8,389
Residualvalueafter3years*(forecast)
60% 60% 56% 61% 61%
Discountedusephasecost€*(12years)
€28,153 €26,767 €27,427 €26,424 €27,939
EOLcost(consumer,Ford)* €0 €0 €0 €0 €0
DiscountedTheoreticalELVprofits*(operators)
Min-€59 Min-€67 Min-€65 Min-€60 Min-€68
TheoreticalCostofOwnership*(3years) €22,525 €23,248 €24,396 €21,412 €22,073
TheoreticalLCC*(12years) €55,569 €56,525 €57,062 €52,164 €56,021*EstimatedvalueforoneselectedEuropeanmarket,noguaranteethatthecostreflectmarketconditions.
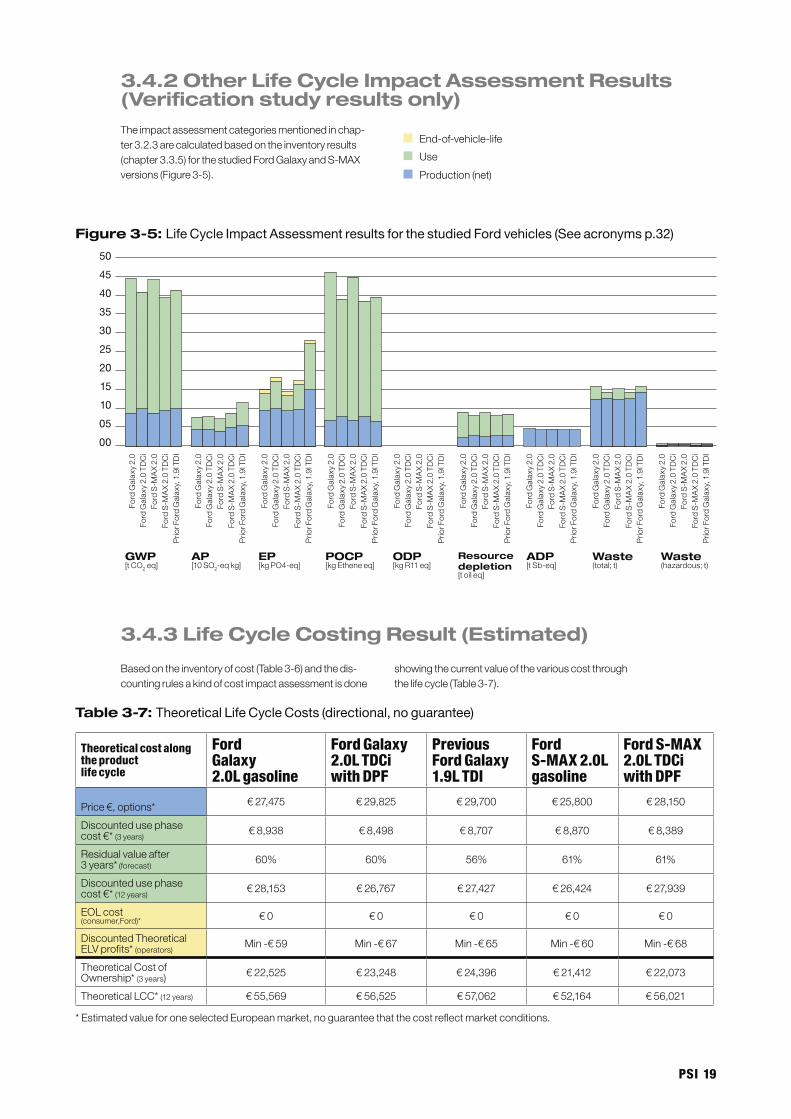
Theimpactassessmentcategoriesmentionedinchap-ter3.2.3arecalculatedbasedontheinventoryresults(chapter3.3.5)forthestudiedFordGalaxyandS-MAXversions(Figure3-5).
3.4.2 Other Life Cycle Impact Assessment Results (Verification study results only)
Use
Production(net)
End-of-vehicle-life
50
45
40
35
30
25
20
15
10
05
00
Ford
Gal
axy
2.0
Ford
Gal
axy
2.0
TDC
iFo
rdS
-MA
X2.
0Fo
rdS
-MA
X2.
0TD
Ci
Prio
rFor
dG
alax
y,1
.9lT
DI
Ford
Gal
axy
2.0
Ford
Gal
axy
2.0
TDC
iFo
rdS
-MA
X2.
0Fo
rdS
-MA
X2.
0TD
Ci
Prio
rFor
dG
alax
y,1
.9lT
DI
Ford
Gal
axy
2.0
Ford
Gal
axy
2.0
TDC
iFo
rdS
-MA
X2.
0Fo
rdS
-MA
X2.
0TD
Ci
Prio
rFor
dG
alax
y,1
.9lT
DI
Ford
Gal
axy
2.0
Ford
Gal
axy
2.0
TDC
iFo
rdS
-MA
X2.
0Fo
rdS
-MA
X2.
0TD
Ci
Prio
rFor
dG
alax
y,1
.9lT
DI
Ford
Gal
axy
2.0
Ford
Gal
axy
2.0
TDC
iFo
rdS
-MA
X2.
0Fo
rdS
-MA
X2.
0TD
Ci
Prio
rFor
dG
alax
y,1
.9lT
DI
Ford
Gal
axy
2.0
Ford
Gal
axy
2.0
TDC
iFo
rdS
-MA
X2.
0Fo
rdS
-MA
X2.
0TD
Ci
Prio
rFor
dG
alax
y,1
.9lT
DI
Ford
Gal
axy
2.0
Ford
Gal
axy
2.0
TDC
iFo
rdS
-MA
X2.
0Fo
rdS
-MA
X2.
0TD
Ci
Prio
rFor
dG
alax
y,1
.9lT
DI
Ford
Gal
axy
2.0
Ford
Gal
axy
2.0
TDC
iFo
rdS
-MA
X2.
0Fo
rdS
-MA
X2.
0TD
Ci
Prio
rFor
dG
alax
y,1
.9lT
DI
Ford
Gal
axy
2.0
Ford
Gal
axy
2.0
TDC
iFo
rdS
-MA
X2.
0Fo
rdS
-MA
X2.
0TD
Ci
Prio
rFor
dG
alax
y,1
.9lT
DI
GWP[tCO2eq]
AP[10SO2-eqkg]
EP[kgPO4-eq]
POCP[kgEtheneeq]
ODP[kgR11eq]
Resource depletion[toileq]
ADP[tSb-eq]
Waste (total;t)
Waste (hazardous;t)
3.4.3 Life Cycle Costing Result (Estimated)
Figure 3-5: Life Cycle Impact Assessment results for the studied Ford vehicles (See acronyms p.32)
Basedontheinventoryofcost(Table3-6)andthedis-countingrulesakindofcostimpactassessmentisdone
showingthecurrentvalueofthevariouscostthroughthelifecycle(Table3-7).
Table 3-7: Theoretical Life Cycle Costs (directional, no guarantee)
20 PSI
3.5 Interpretation3.5.1 Data Quality
Dataqualitywillbereviewedpredominantlyinthefollowingsub-chapters.Consideringthedatarequirementsfromchapter3.2.3,alldatasourcesfulfilltheserequirements.Thedatasourcesthem-selvesdonotallowmoredetailedstatisticsaboutdataqualityindicators.However,forallvehiclessignificantlymorethantherequired95%ofthematerialsarereflectedinthedata.Infact,forallmaterialsatleastaveragedataforthematerialgrouphasbeenused.Forplastics,thedatacompositionwasnotalwaysclear(i.e.specifictypeofplastic).Inthiscase,anaverageofallplasticshasbeenused(mixedthermoplastic).Thisapproximationcoversroughly3%forGalaxy2lTDCi,4%forGalaxy2lI4,5%forthepre-viousGalaxy,and2%fortheS-MAXvariants.Inasensitivityanalysistheimpactofthisapproximationhasbeenevaluated,
showingaminorimpact(clearlybelow1%forallimpactcatego-riesexceptacidificationpotential).
LookingatallinputsandoutputsoftheLCI,5.5%ofthemarebasedonmeasurements,16.3%oncalculations,58.2%onliterature,16.1%onestimates,and3.9%onunknownmethods(partlyconfidential).
Oneexamplecomparingtheuseofmeasureddata(regardingthepreviousGalaxymodel)versustheuseofestimateddata(regardingthenewGalaxymodel)istheleakagerateofR134a.TheimpactofthisdatahasbeenspecificallyanalyzedusingthePSItoolinasensitivityanalysis.TheresultshowsthatthisdatahasnosignificantimpactinthatatheoreticaldoublingoftheleakageratechangesthelifecycleGWPpotentialby0.9to1%.
3.5.2 Dominance Analysis
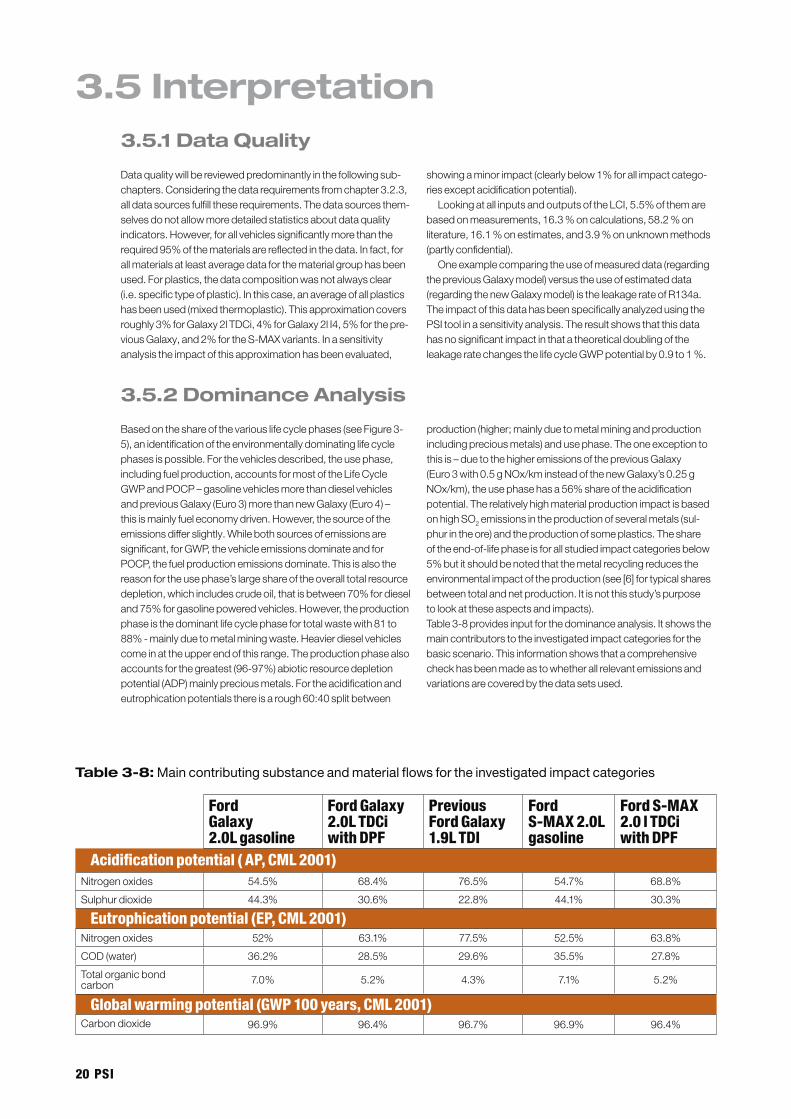
Basedontheshareofthevariouslifecyclephases(seeFigure3-5),anidentificationoftheenvironmentallydominatinglifecyclephasesispossible.Forthevehiclesdescribed,theusephase,includingfuelproduction,accountsformostoftheLifeCycleGWPandPOCP–gasolinevehiclesmorethandieselvehiclesandpreviousGalaxy(Euro3)morethannewGalaxy(Euro4)–thisismainlyfueleconomydriven.However,thesourceoftheemissionsdifferslightly.Whilebothsourcesofemissionsaresignificant,forGWP,thevehicleemissionsdominateandforPOCP,thefuelproductionemissionsdominate.Thisisalsothereasonfortheusephase’slargeshareoftheoveralltotalresourcedepletion,whichincludescrudeoil,thatisbetween70%fordieseland75%forgasolinepoweredvehicles.However,theproductionphaseisthedominantlifecyclephasefortotalwastewith81to88%-mainlyduetometalminingwaste.Heavierdieselvehiclescomeinattheupperendofthisrange.Theproductionphasealsoaccountsforthegreatest(96-97%)abioticresourcedepletionpotential(ADP)mainlypreciousmetals.Fortheacidificationandeutrophicationpotentialsthereisarough60:40splitbetween
production(higher;mainlyduetometalminingandproductionincludingpreciousmetals)andusephase.Theoneexceptiontothisis–duetothehigheremissionsofthepreviousGalaxy(Euro3with0.5gNOx/kminsteadofthenewGalaxy’s0.25gNOx/km),theusephasehasa56%shareoftheacidificationpotential.TherelativelyhighmaterialproductionimpactisbasedonhighSO2emissionsintheproductionofseveralmetals(sul-phurintheore)andtheproductionofsomeplastics.Theshareoftheend-of-lifephaseisforallstudiedimpactcategoriesbelow5%butitshouldbenotedthatthemetalrecyclingreducestheenvironmentalimpactoftheproduction(see[6]fortypicalsharesbetweentotalandnetproduction.Itisnotthisstudy’spurposetolookattheseaspectsandimpacts).Table3-8providesinputforthedominanceanalysis.Itshowsthemaincontributorstotheinvestigatedimpactcategoriesforthebasicscenario.Thisinformationshowsthatacomprehensivecheckhasbeenmadeastowhetherallrelevantemissionsandvariationsarecoveredbythedatasetsused.
Table 3-8: Main contributing substance and material flows for the investigated impact categories
Ford Galaxy 2.0L gasoline
Ford Galaxy 2.0L TDCi with DPF
Previous Ford Galaxy 1.�L TDI
Ford S-MAX 2.0L gasoline
Ford S-MAX 2.0 l TDCi with DPF
Nitrogenoxides 54.5% 68.4% 76.5% 54.7% 68.8%
Sulphurdioxide 44.3% 30.6% 22.8% 44.1% 30.3%
Nitrogenoxides 52% 63.1% 77.5% 52.5% 63.8%
COD(water) 36.2% 28.5% 29.6% 35.5% 27.8%
Totalorganicbondcarbon 7.0% 5.2% 4.3% 7.1% 5.2%
Carbondioxide 96.9% 96.4% 96.7% 96.9% 96.4%
Acidification potential ( AP, CML 2001)
Eutrophication potential (EP, CML 2001)
Global warming potential (GWP 100 years, CML 2001)
PSI 21
Ford Galaxy 2.0L gasoline
Ford Galaxy 2.0L TDCi with DPF
Previous Ford Galaxy 1.�L TDI
Ford S-MAX 2.0L gasoline
Ford S-MAX 2.0 l TDCi with DPF
Halon(1301) 97.8% 96.9% 97.6% 97.8% 97.7%
Carbonmonoxide 10.5% 7.1% 8.2% 10.7% 7.2%
NMVOC(unspecified) 81.5% 82.0% 79.1% 81.6% 82.0%
NitrogenOxides 2.6% 5.0% 7.7% 2.6% 5.0%
Sludge(oilexploration) 4.5% 4.5% 4.1% 4.5% 4.5%
Overburden(mining) 69% 67.6% 71% 69.2% 67.8%
Tailings(oreprocessing) 24.8% 25.9% 22.5% 24.6% 25.7%
Ozone depletion potential (ODP, CML 2001)
Photochemical oxidant potential (POCP, CML 2001)
Waste (total)
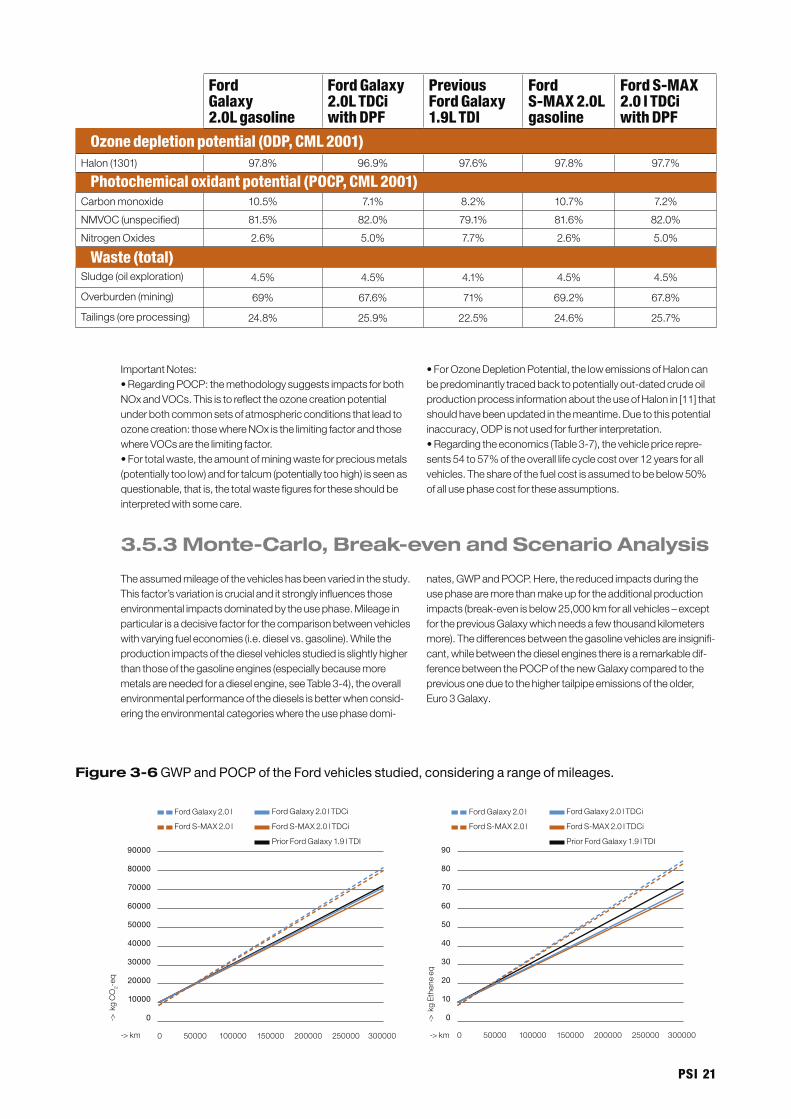
ImportantNotes:•RegardingPOCP:themethodologysuggestsimpactsforbothNOxandVOCs.Thisistoreflecttheozonecreationpotentialunderbothcommonsetsofatmosphericconditionsthatleadtoozonecreation:thosewhereNOxisthelimitingfactorandthosewhereVOCsarethelimitingfactor.•Fortotalwaste,theamountofminingwasteforpreciousmetals(potentiallytoolow)andfortalcum(potentiallytoohigh)isseenasquestionable,thatis,thetotalwastefiguresfortheseshouldbeinterpretedwithsomecare.
•ForOzoneDepletionPotential,thelowemissionsofHaloncanbepredominantlytracedbacktopotentiallyout-datedcrudeoilproductionprocessinformationabouttheuseofHalonin[11]thatshouldhavebeenupdatedinthemeantime.Duetothispotentialinaccuracy,ODPisnotusedforfurtherinterpretation.•Regardingtheeconomics(Table3-7),thevehiclepricerepre-sents54to57%oftheoveralllifecyclecostover12yearsforallvehicles.Theshareofthefuelcostisassumedtobebelow50%ofallusephasecostfortheseassumptions.
3.5.3 Monte-Carlo, Break-even and Scenario Analysis
Theassumedmileageofthevehicleshasbeenvariedinthestudy.Thisfactor’svariationiscrucialanditstronglyinfluencesthoseenvironmentalimpactsdominatedbytheusephase.Mileageinparticularisadecisivefactorforthecomparisonbetweenvehicleswithvaryingfueleconomies(i.e.dieselvs.gasoline).Whiletheproductionimpactsofthedieselvehiclesstudiedisslightlyhigherthanthoseofthegasolineengines(especiallybecausemoremetalsareneededforadieselengine,seeTable3-4),theoverallenvironmentalperformanceofthedieselsisbetterwhenconsid-eringtheenvironmentalcategorieswheretheusephasedomi-
nates,GWPandPOCP.Here,thereducedimpactsduringtheusephasearemorethanmakeupfortheadditionalproductionimpacts(break-evenisbelow25,000kmforallvehicles–exceptforthepreviousGalaxywhichneedsafewthousandkilometersmore).Thedifferencesbetweenthegasolinevehiclesareinsignifi-cant,whilebetweenthedieselenginesthereisaremarkabledif-ferencebetweenthePOCPofthenewGalaxycomparedtothepreviousoneduetothehighertailpipeemissionsoftheolder,Euro3Galaxy.
90000
80000
70000
60000
50000
40000
30000
20000
10000
0
0 50000 100000 150000 200000 250000 300000
FordGalaxy2.0l
FordS-MAX2.0l FordS-MAX2.0lTDCi
PriorFordGalaxy1.9lTDI
FordGalaxy2.0lTDCi
90
80
70
60
50
40
30
20
10
0
0 50000 100000 150000 200000 250000 300000
FordGalaxy2.0l
FordS-MAX2.0l FordS-MAX2.0lTDCi
PriorFordGalaxy1.9lTDI
FordGalaxy2.0lTDCi
->km
->k
gE
then
eeq
->km
->k
gC
O2-
eq
Figure 3-6 GWP and POCP of the Ford vehicles studied, considering a range of mileages.
22 PSI
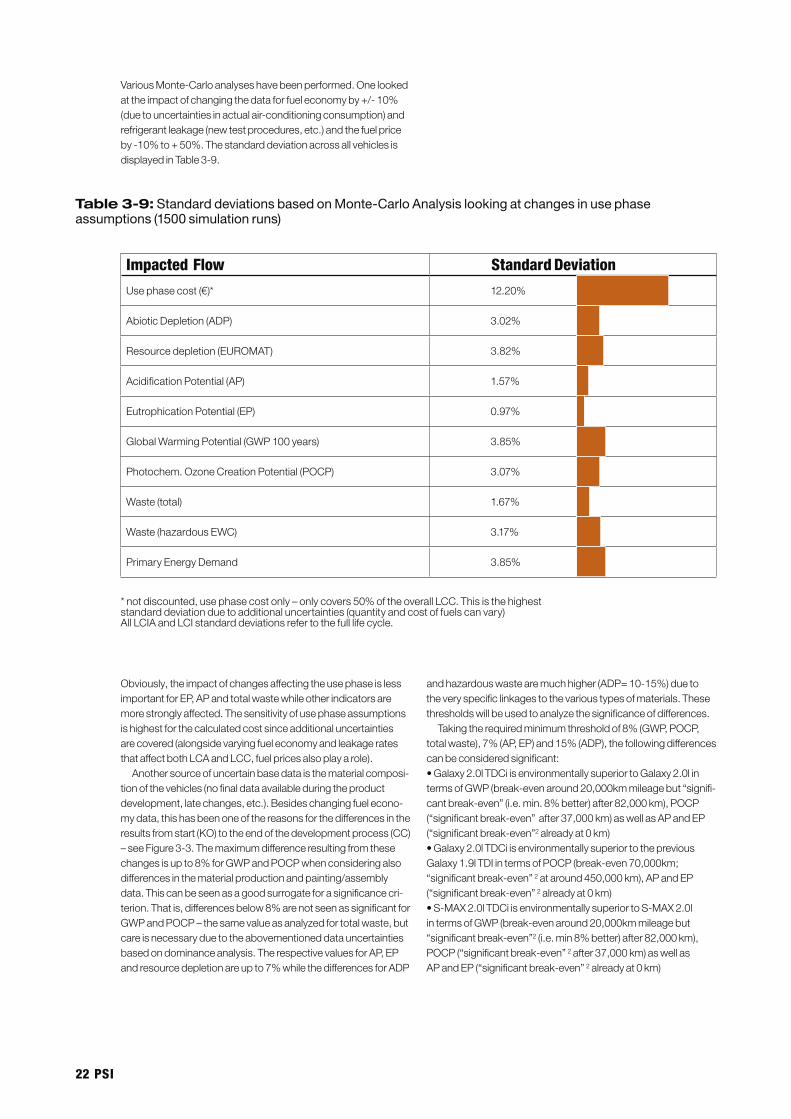
VariousMonte-Carloanalyseshavebeenperformed.Onelookedattheimpactofchangingthedataforfueleconomyby+/-10%(duetouncertaintiesinactualair-conditioningconsumption)andrefrigerantleakage(newtestprocedures,etc.)andthefuelpriceby-10%to+50%.ThestandarddeviationacrossallvehiclesisdisplayedinTable3-9.
Table 3-9: Standard deviations based on Monte-Carlo Analysis looking at changes in use phase assumptions (1500 simulation runs)
Impacted Flow Standard Deviation
Usephasecost(€)* 12.20%
AbioticDepletion(ADP) 3.02%
Resourcedepletion(EUROMAT) 3.82%
AcidificationPotential(AP) 1.57%
EutrophicationPotential(EP) 0.97%
GlobalWarmingPotential(GWP100years) 3.85%
Photochem.OzoneCreationPotential(POCP) 3.07%
Waste(total) 1.67%
Waste(hazardousEWC) 3.17%
PrimaryEnergyDemand 3.85%
*notdiscounted,usephasecostonly–onlycovers50%oftheoverallLCC.Thisisthehigheststandarddeviationduetoadditionaluncertainties(quantityandcostoffuelscanvary)AllLCIAandLCIstandarddeviationsrefertothefulllifecycle.
Obviously,theimpactofchangesaffectingtheusephaseislessimportantforEP,APandtotalwastewhileotherindicatorsaremorestronglyaffected.Thesensitivityofusephaseassumptionsishighestforthecalculatedcostsinceadditionaluncertaintiesarecovered(alongsidevaryingfueleconomyandleakageratesthataffectbothLCAandLCC,fuelpricesalsoplayarole).
Anothersourceofuncertainbasedataisthematerialcomposi-tionofthevehicles(nofinaldataavailableduringtheproductdevelopment,latechanges,etc.).Besideschangingfuelecono-mydata,thishasbeenoneofthereasonsforthedifferencesintheresultsfromstart(KO)totheendofthedevelopmentprocess(CC)–seeFigure3-3.Themaximumdifferenceresultingfromthesechangesisupto8%forGWPandPOCPwhenconsideringalsodifferencesinthematerialproductionandpainting/assemblydata.Thiscanbeseenasagoodsurrogateforasignificancecri-terion.Thatis,differencesbelow8%arenotseenassignificantforGWPandPOCP–thesamevalueasanalyzedfortotalwaste,butcareisnecessaryduetotheabovementioneddatauncertaintiesbasedondominanceanalysis.TherespectivevaluesforAP,EPandresourcedepletionareupto7%whilethedifferencesforADP
andhazardouswastearemuchhigher(ADP=10-15%)duetotheveryspecificlinkagestothevarioustypesofmaterials.Thesethresholdswillbeusedtoanalyzethesignificanceofdifferences.
Takingtherequiredminimumthresholdof8%(GWP,POCP,totalwaste),7%(AP,EP)and15%(ADP),thefollowingdifferencescanbeconsideredsignificant:•Galaxy2.0lTDCiisenvironmentallysuperiortoGalaxy2.0lintermsofGWP(break-evenaround20,000kmmileagebut“signifi-cantbreak-even”(i.e.min.8%better)after82,000km),POCP(“significantbreak-even”after37,000km)aswellasAPandEP(“significantbreak-even”2alreadyat0km)•Galaxy2.0lTDCiisenvironmentallysuperiortothepreviousGalaxy1.9lTDIintermsofPOCP(break-even70,000km;“significantbreak-even”2ataround450,000km),APandEP(“significantbreak-even”2alreadyat0km)•S-MAX2.0lTDCiisenvironmentallysuperiortoS-MAX2.0lintermsofGWP(break-evenaround20,000kmmileagebut“significantbreak-even”2(i.e.min8%better)after82,000km),POCP(“significantbreak-even”2after37,000km)aswellasAPandEP(“significantbreak-even”2alreadyat0km)
PSI 2�
•AllnewdevelopedvehiclesresultinlesstotalwastecomparedtopreviousGalaxy(“significantbreak-even”2below100,000km).
Consideringtheeconomicaspects,therearehugeuncertain-tiesaroundend-of-lifeprofits[4],buttheiroverallimpactisnegligi-ble(below0.2%)ofthetotalLCC.Moresignificantistheuncertaintyfortherealinsurancecost(highlydependentonper-sonalcontracts),realmaintenancecost(theoreticalvaluesareworstcaseassumptions),fuelconsumptioncost(seeTable3-9)andmileage.Economicbreak-evenconditionscanbededucedfromthefollowing:•Dieselversionsareeconomicallypreferablebeyond255,000kmover12yearsfortheassumedyearlyfuel,insuranceandmainte-nancecostoraround200,000kmwithcostat50%ofthoseassumedinthemainscenario.•ThenewdieselGalaxyversioniseconomicallypreferablebeyond250,000km(S-MAXaround240,000km)over12yearsfortheassumedyearlyfuel,insuranceandmaintenancecostbutaninterestrateof4%.
•Thenewdieselversionsareeconomicallypreferablebeyond160,000kmover12yearsfortheassumedyearlyfuel,insuranceandmaintenancecostbutaninterestrateof4%and50%higherfuelpricesthanassumedinthemainscenario.
TheelasticityofresultsislargerfortheLCCcalculationsthanfortheLCAcalculations(compare[4])asthereisanadditionalsetofassumptionsfortheLCCcalculations–i.e.typeofinsurancecost,fuelpricesandinterestrates–thatrepresentadditionalsourcesofuncertaintywhiletheseaspectshavenoimpactontheLCAresult.
2“Significantbreak-even“referstothatmileagewhereonevehicleissignificantlybetterthantheothervehicle,i.e.inthiscasetheenvironmentalimpactpotentialsarelowerbyatleast8%(GWP,POCP)respectively7%(AP,EP)–seeacronymlistingchapter8.
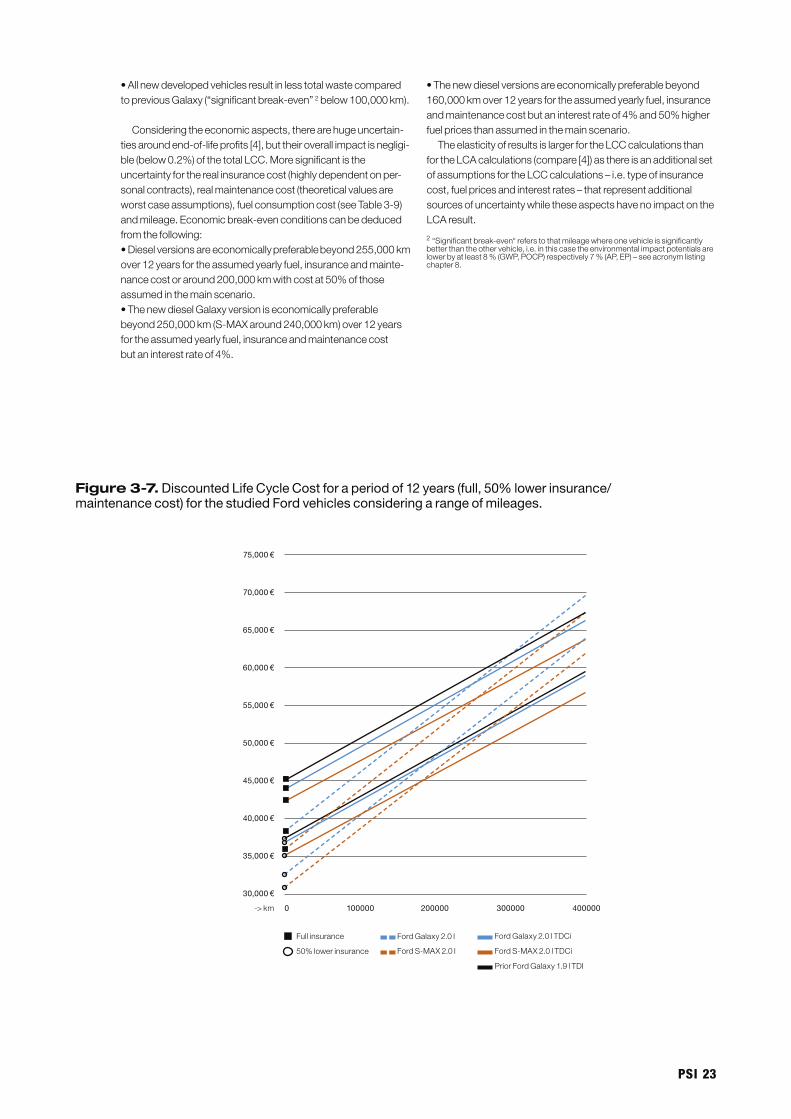
Figure 3-7. Discounted Life Cycle Cost for a period of 12 years (full, 50% lower insurance/maintenance cost) for the studied Ford vehicles considering a range of mileages.
75,000 €
70,000 €
65,000 €
60,000 €
55,000 €
50,000 €
45,000 €
40,000 €
35,000 €
30,000 €
0 100000 200000 300000 400000->km
FordGalaxy2.0l
FordS-MAX2.0l FordS-MAX2.0lTDCi
PriorFordGalaxy1.9lTDI
FordGalaxy2.0lTDCiFullinsurance
50%lowerinsurance
2� PSI
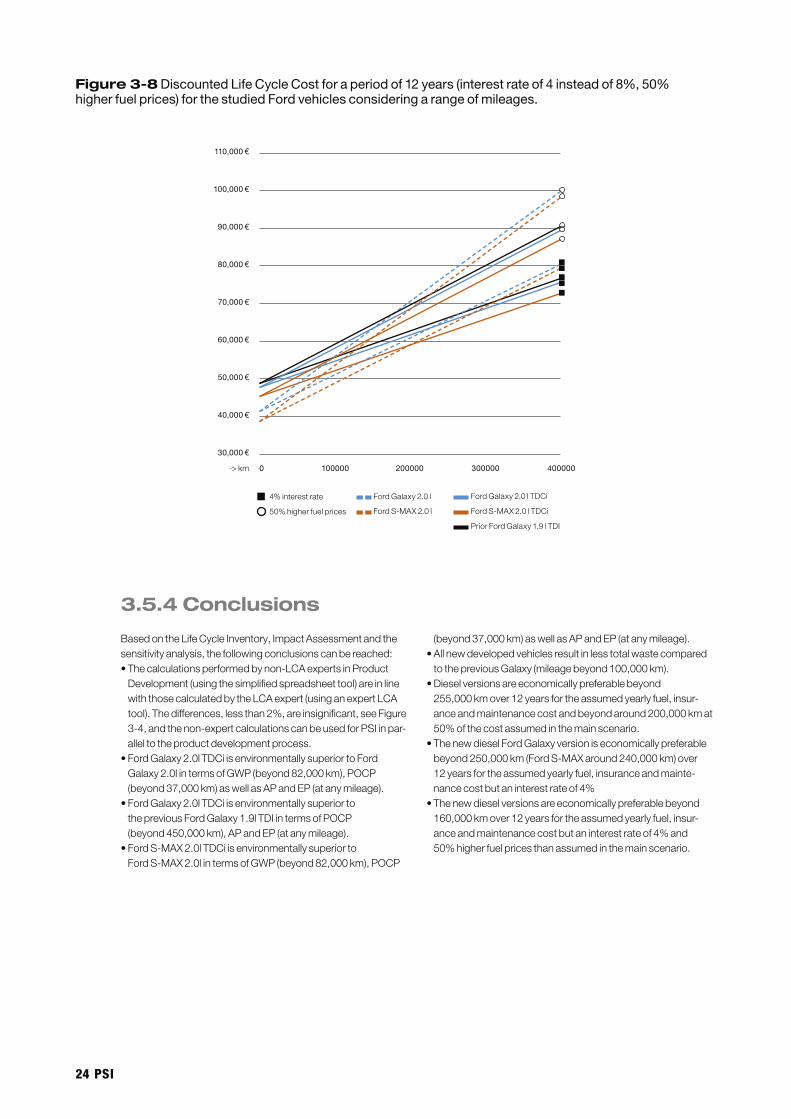
3.5.4 Conclusions
BasedontheLifeCycleInventory,ImpactAssessmentandthesensitivityanalysis,thefollowingconclusionscanbereached:•Thecalculationsperformedbynon-LCAexpertsinProduct
Development(usingthesimplifiedspreadsheettool)areinlinewiththosecalculatedbytheLCAexpert(usinganexpertLCAtool).Thedifferences,lessthan2%,areinsignificant,seeFigure3-4,andthenon-expertcalculationscanbeusedforPSIinpar-alleltotheproductdevelopmentprocess.
•FordGalaxy2.0lTDCiisenvironmentallysuperiortoFordGalaxy2.0lintermsofGWP(beyond82,000km),POCP(beyond37,000km)aswellasAPandEP(atanymileage).
•FordGalaxy2.0lTDCiisenvironmentallysuperiortothepreviousFordGalaxy1.9lTDIintermsofPOCP(beyond450,000km),APandEP(atanymileage).
•FordS-MAX2.0lTDCiisenvironmentallysuperiortoFordS-MAX2.0lintermsofGWP(beyond82,000km),POCP
(beyond37,000km)aswellasAPandEP(atanymileage).•Allnewdevelopedvehiclesresultinlesstotalwastecompared
tothepreviousGalaxy(mileagebeyond100,000km).•Dieselversionsareeconomicallypreferablebeyond
255,000kmover12yearsfortheassumedyearlyfuel,insur-anceandmaintenancecostandbeyondaround200,000kmat50%ofthecostassumedinthemainscenario.
•ThenewdieselFordGalaxyversioniseconomicallypreferablebeyond250,000km(FordS-MAXaround240,000km)over12yearsfortheassumedyearlyfuel,insuranceandmainte-nancecostbutaninterestrateof4%
•Thenewdieselversionsareeconomicallypreferablebeyond160,000kmover12yearsfortheassumedyearlyfuel,insur-anceandmaintenancecostbutaninterestrateof4%and50%higherfuelpricesthanassumedinthemainscenario.
Figure 3-8 Discounted Life Cycle Cost for a period of 12 years (interest rate of 4 instead of 8%, 50% higher fuel prices) for the studied Ford vehicles considering a range of mileages.
110,000 €
100,000 €
90,000 €
80,000 €
70,000 €
60,000 €
50,000 €
40,000 €
30,000 €
0 100000 200000 300000 400000->km
FordGalaxy2.0l
FordS-MAX2.0l FordS-MAX2.0lTDCi
PriorFordGalaxy1.9lTDI
FordGalaxy2.0lTDCi4%interestrate
50%higherfuelprices
PSI 2�
4 Ford Galaxy and S-MAX Product Sustainability Index
4.1 Scaling
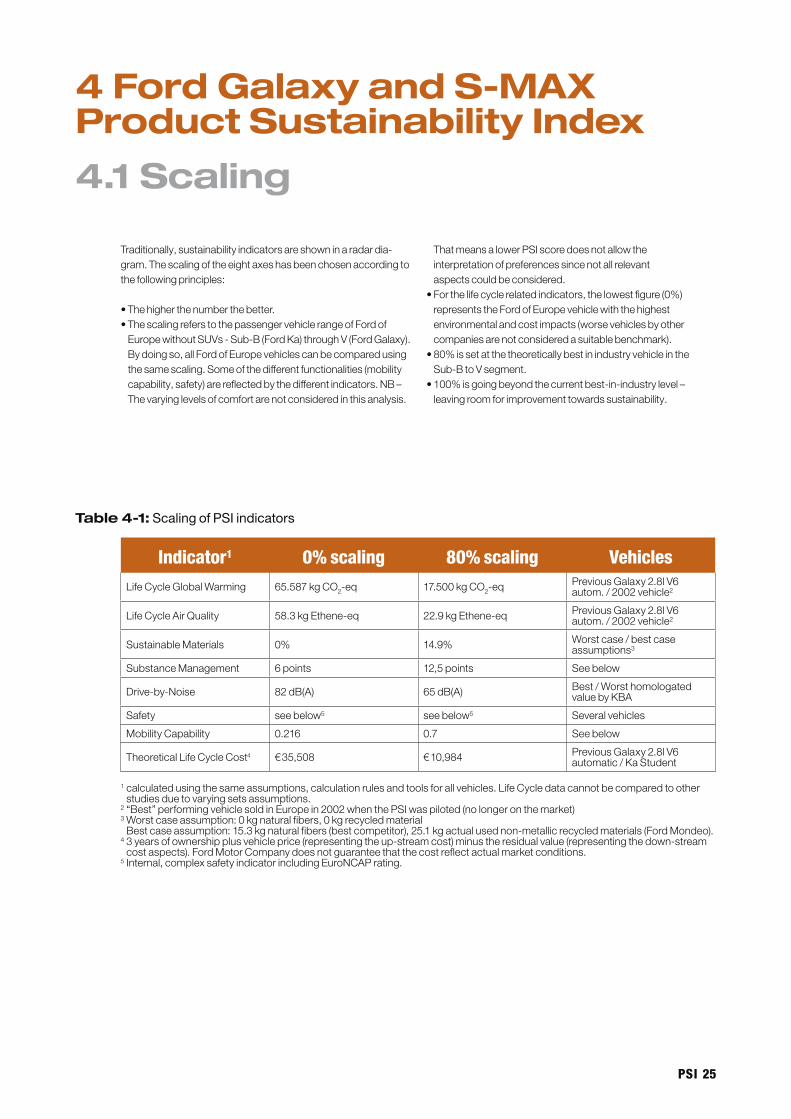
Traditionally,sustainabilityindicatorsareshowninaradardia-gram.Thescalingoftheeightaxeshasbeenchosenaccordingtothefollowingprinciples:
•Thehigherthenumberthebetter.•ThescalingreferstothepassengervehiclerangeofFordof
EuropewithoutSUVs-Sub-B(FordKa)throughV(FordGalaxy).Bydoingso,allFordofEuropevehiclescanbecomparedusingthesamescaling.Someofthedifferentfunctionalities(mobilitycapability,safety)arereflectedbythedifferentindicators.NB–Thevaryinglevelsofcomfortarenotconsideredinthisanalysis.
ThatmeansalowerPSIscoredoesnotallowtheinterpretationofpreferencessincenotallrelevantaspectscouldbeconsidered.
•Forthelifecyclerelatedindicators,thelowestfigure(0%)representstheFordofEuropevehiclewiththehighestenvironmentalandcostimpacts(worsevehiclesbyothercompaniesarenotconsideredasuitablebenchmark).
•80%issetatthetheoreticallybestinindustryvehicleintheSub-BtoVsegment.
•100%isgoingbeyondthecurrentbest-in-industrylevel–leavingroomforimprovementtowardssustainability.
Table 4-1: Scaling of PSI indicators
Indicator1 0% scaling �0% scaling VehiclesLifeCycleGlobalWarming 65.587kgCO2-eq 17.500kgCO2-eq PreviousGalaxy2.8lV6
autom./2002vehicle2
LifeCycleAirQuality 58.3kgEthene-eq 22.9kgEthene-eq PreviousGalaxy2.8lV6autom./2002vehicle2
SustainableMaterials 0% 14.9% Worstcase/bestcaseassumptions3
SubstanceManagement 6points 12,5points Seebelow
Drive-by-Noise 82dB(A) 65dB(A) Best/WorsthomologatedvaluebyKBA
Safety seebelow5 seebelow5 Severalvehicles
MobilityCapability 0.216 0.7 Seebelow
TheoreticalLifeCycleCost4 €35,508 €10,984 PreviousGalaxy2.8lV6automatic/KaStudent
1calculatedusingthesameassumptions,calculationrulesandtoolsforallvehicles.LifeCycledatacannotbecomparedtootherstudiesduetovaryingsetsassumptions.
2“Best”performingvehiclesoldinEuropein2002whenthePSIwaspiloted(nolongeronthemarket)3Worstcaseassumption:0kgnaturalfibers,0kgrecycledmaterialBestcaseassumption:15.3kgnaturalfibers(bestcompetitor),25.1kgactualusednon-metallicrecycledmaterials(FordMondeo).
43yearsofownershipplusvehicleprice(representingtheup-streamcost)minustheresidualvalue(representingthedown-streamcostaspects).FordMotorCompanydoesnotguaranteethatthecostreflectactualmarketconditions.
5Internal,complexsafetyindicatorincludingEuroNCAPrating.
2� PSI
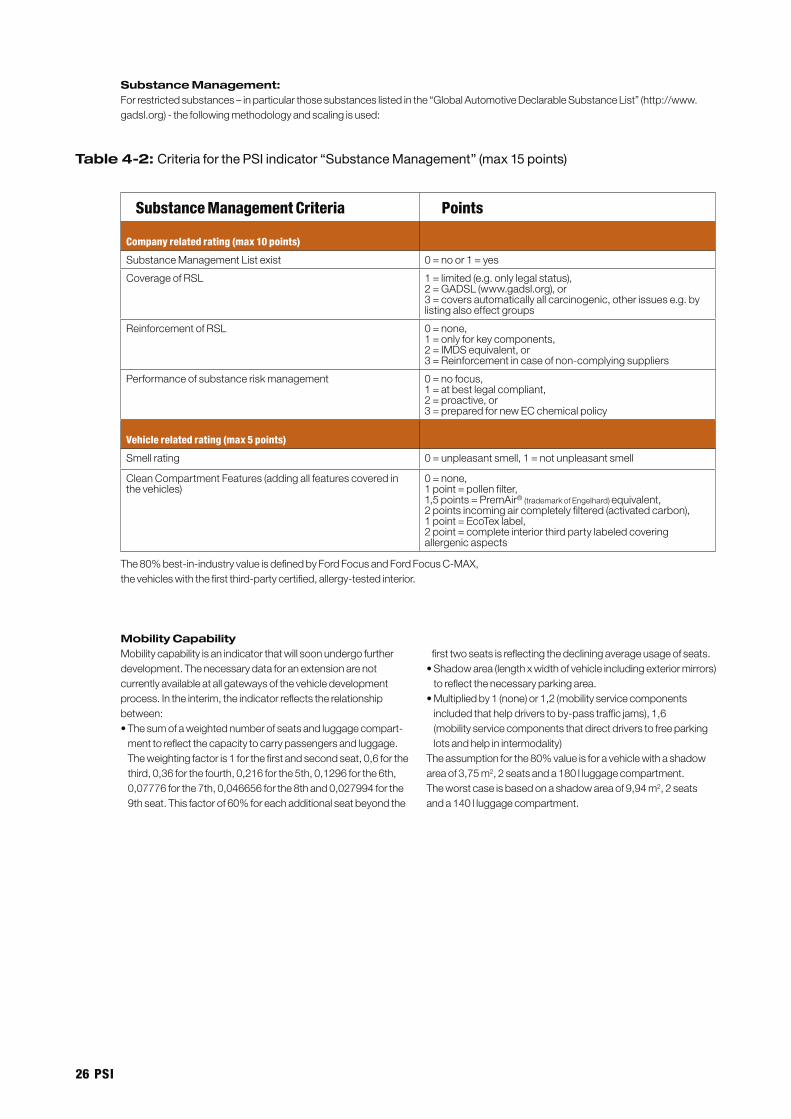
Substance Management:Forrestrictedsubstances–inparticularthosesubstanceslistedinthe“GlobalAutomotiveDeclarableSubstanceList”(http://www.gadsl.org)-thefollowingmethodologyandscalingisused:
Table 4-2: Criteria for the PSI indicator “Substance Management” (max 15 points)
Company related rating (max 10 points)
SubstanceManagementListexist 0=noor1=yes
CoverageofRSL 1=limited(e.g.onlylegalstatus),2=GADSL(www.gadsl.org),or3=coversautomaticallyallcarcinogenic,otherissuese.g.bylistingalsoeffectgroups
ReinforcementofRSL 0=none,1=onlyforkeycomponents,2=IMDSequivalent,or3=Reinforcementincaseofnon-complyingsuppliers
Performanceofsubstanceriskmanagement 0=nofocus,1=atbestlegalcompliant,2=proactive,or3=preparedfornewECchemicalpolicy
Vehicle related rating (max � points)
Smellrating 0=unpleasantsmell,1=notunpleasantsmell
CleanCompartmentFeatures(addingallfeaturescoveredinthevehicles)
0=none,1point=pollenfilter,1,5points=PremAir®(trademarkofEngelhard)equivalent,2pointsincomingaircompletelyfiltered(activatedcarbon),1point=EcoTexlabel,2point=completeinteriorthirdpartylabeledcoveringallergenicaspects
Substance Management Criteria Points
Mobility CapabilityMobilitycapabilityisanindicatorthatwillsoonundergofurtherdevelopment.Thenecessarydataforanextensionarenotcurrentlyavailableatallgatewaysofthevehicledevelopmentprocess.Intheinterim,theindicatorreflectstherelationshipbetween:•Thesumofaweightednumberofseatsandluggagecompart-
menttoreflectthecapacitytocarrypassengersandluggage.Theweightingfactoris1forthefirstandsecondseat,0,6forthethird,0,36forthefourth,0,216forthe5th,0,1296forthe6th,0,07776forthe7th,0,046656forthe8thand0,027994forthe9thseat.Thisfactorof60%foreachadditionalseatbeyondthe
firsttwoseatsisreflectingthedecliningaverageusageofseats.•Shadowarea(lengthxwidthofvehicleincludingexteriormirrors)
toreflectthenecessaryparkingarea.•Multipliedby1(none)or1,2(mobilityservicecomponents
includedthathelpdriverstoby-passtrafficjams),1,6(mobilityservicecomponentsthatdirectdriverstofreeparkinglotsandhelpinintermodality)
Theassumptionforthe80%valueisforavehiclewithashadowareaof3,75m2,2seatsanda180lluggagecompartment.Theworstcaseisbasedonashadowareaof9,94m2,2seatsanda140lluggagecompartment.
The80%best-in-industryvalueisdefinedbyFordFocusandFordFocusC-MAX,thevehicleswiththefirstthird-partycertified,allergy-testedinterior.
PSI 2�
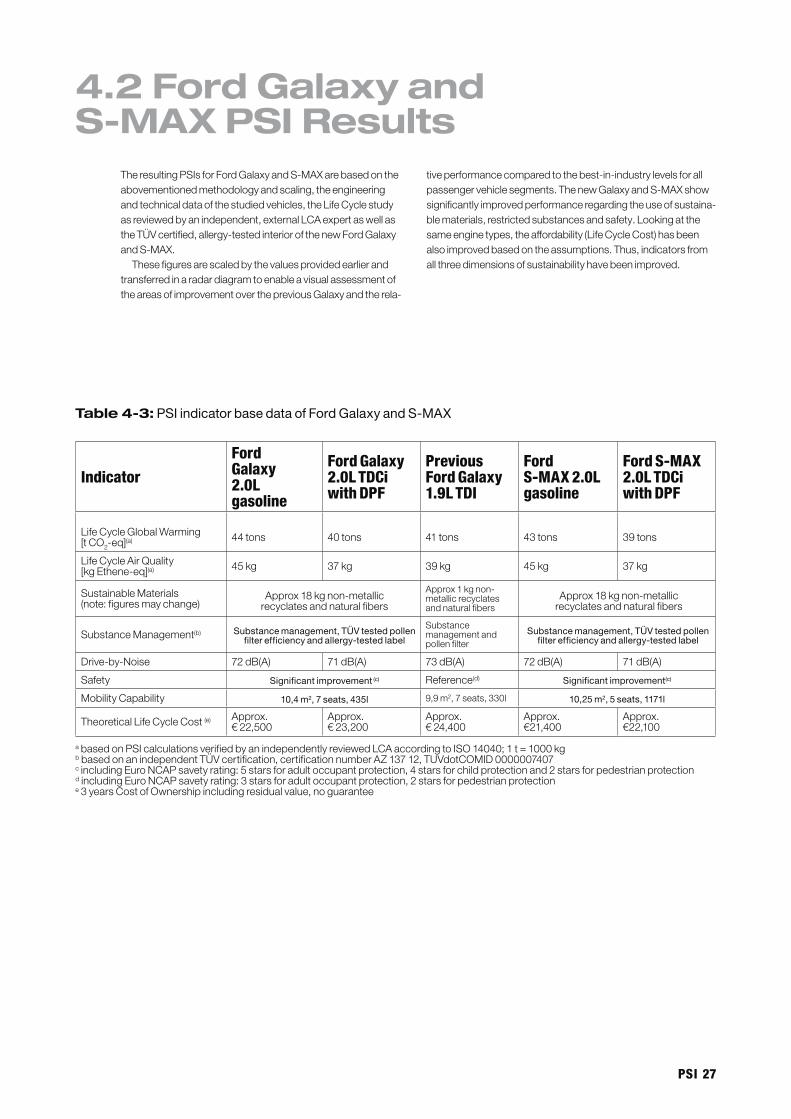
4.2 Ford Galaxy and S-MAX PSI Results
TheresultingPSIsforFordGalaxyandS-MAXarebasedontheabovementionedmethodologyandscaling,theengineeringandtechnicaldataofthestudiedvehicles,theLifeCyclestudyasreviewedbyanindependent,externalLCAexpertaswellastheTÜVcertified,allergy-testedinteriorofthenewFordGalaxyandS-MAX.
ThesefiguresarescaledbythevaluesprovidedearlierandtransferredinaradardiagramtoenableavisualassessmentoftheareasofimprovementoverthepreviousGalaxyandtherela-
tiveperformancecomparedtothebest-in-industrylevelsforallpassengervehiclesegments.ThenewGalaxyandS-MAXshowsignificantlyimprovedperformanceregardingtheuseofsustaina-blematerials,restrictedsubstancesandsafety.Lookingatthesameenginetypes,theaffordability(LifeCycleCost)hasbeenalsoimprovedbasedontheassumptions.Thus,indicatorsfromallthreedimensionsofsustainabilityhavebeenimproved.
Table 4-3: PSI indicator base data of Ford Galaxy and S-MAX
Indicator
Ford Galaxy 2.0L gasoline
Ford Galaxy 2.0L TDCi with DPF
Previous Ford Galaxy 1.�L TDI
Ford S-MAX 2.0L gasoline
Ford S-MAX 2.0L TDCi with DPF
LifeCycleGlobalWarming[tCO2-eq](a)
44tons
40tons
41tons
43tons
39tons
LifeCycleAirQuality[kgEthene-eq](a) 45kg 37kg 39kg 45kg 37kg
SustainableMaterials(note:figuresmaychange)
Approx1kgnon-metallicrecyclatesandnaturalfibers
SubstanceManagement(b)Substancemanagementandpollenfilter
Drive-by-Noise 72dB(A) 71dB(A) 73dB(A) 72dB(A) 71dB(A)
Safety Reference(d)
MobilityCapability 9,9m2,7seats,330l
TheoreticalLifeCycleCost(e) Approx.€22,500
Approx.€23,200
Approx.€24,400
Approx.€21,400
Approx.€22,100
abasedonPSIcalculationsverifiedbyanindependentlyreviewedLCAaccordingtoISO14040;1t=1000kgbbasedonanindependentTÜVcertification,certificationnumberAZ13712,TUVdotCOMID0000007407cincludingEuroNCAPsavetyrating:5starsforadultoccupantprotection,4starsforchildprotectionand2starsforpedestrianprotectiondincludingEuroNCAPsavetyrating:3starsforadultoccupantprotection,2starsforpedestrianprotectione3yearsCostofOwnershipincludingresidualvalue,noguarantee
Approx18kgnon-metallicrecyclatesandnaturalfibers
Approx18kgnon-metallicrecyclatesandnaturalfibers
Substance management, TÜV tested pollen filter efficiency and allergy-tested label
Substance management, TÜV tested pollen filter efficiency and allergy-tested label
Significant improvement (c) Significant improvement(c)
10,4 m2, 7 seats, 435l 10,25 m2, 5 seats, 1171l
2� PSI
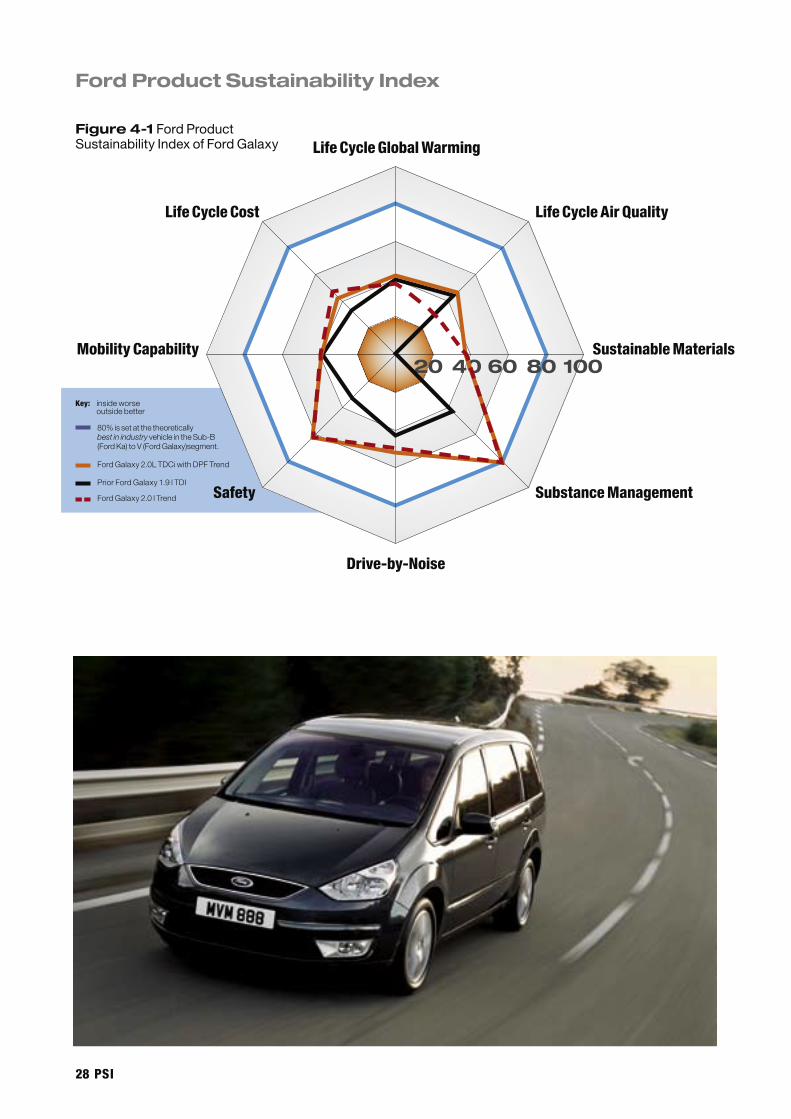
Ford Product Sustainability Index
20 40 60 80 100
Drive-by-Noise
Life Cycle Global Warming
Life Cycle Air Quality
Sustainable Materials
Substance Management
Life Cycle Cost
Mobility Capability
SafetyFordGalaxy2.0lTrend
PriorFordGalaxy1.9lTDI
FordGalaxy2.0LTDCiwithDPFTrend
Key:insideworseoutsidebetter
Figure 4-1 Ford Product Sustainability Index of Ford Galaxy
80%issetatthetheoreticallybest in industryvehicleintheSub-B(FordKa)toV(FordGalaxy)segment.
PSI 2�
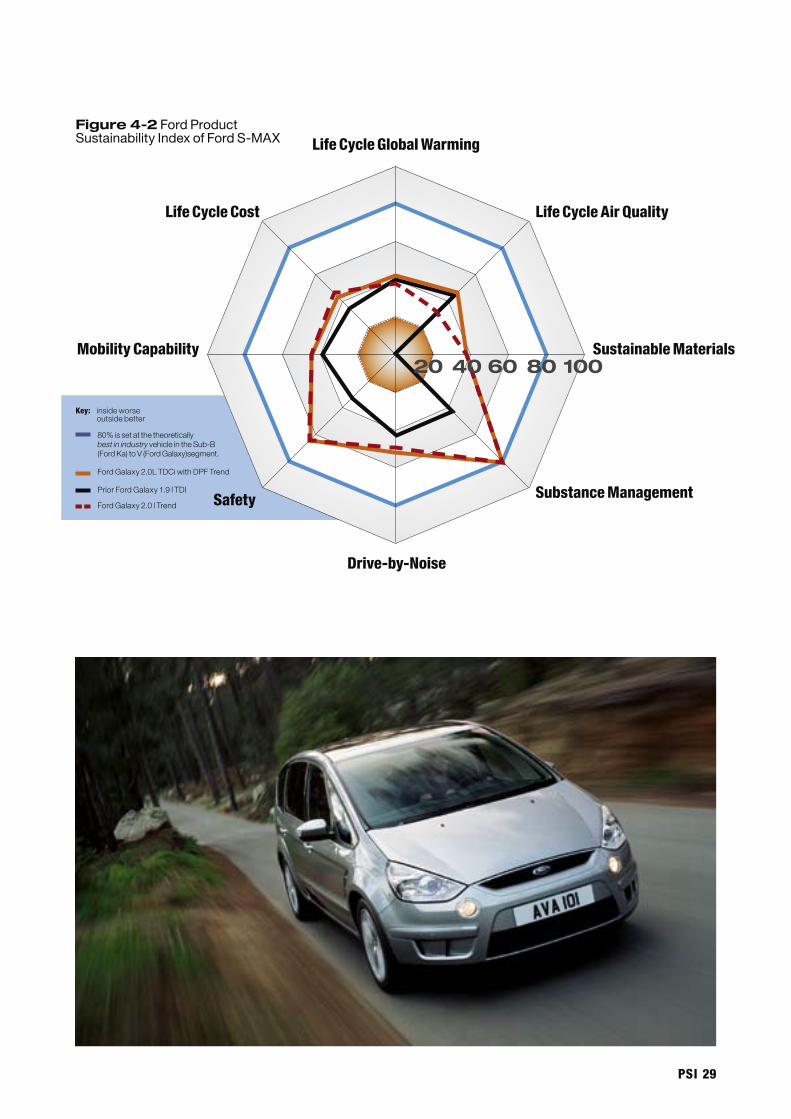
SafetyFordGalaxy2.0lTrend
PriorFordGalaxy1.9lTDI
FordGalaxy2.0LTDCiwithDPFTrend
Key:insideworseoutsidebetter
80%issetatthetheoreticallybest in industryvehicleintheSub-B(FordKa)toV(FordGalaxy)segment.
Drive-by-Noise
Life Cycle Global Warming
Life Cycle Air Quality
Sustainable Materials
Substance Management
Life Cycle Cost
Mobility Capability
Figure 4-2 Ford Product Sustainability Index of Ford S-MAX
20 40 60 80 100
�0 PSI
5 References[1] UN:ReportoftheWorldCommissiononEnvironmentand
Development–OurCommonFuture(theBrundtlandreport)1987http://www.sdgateway.net/introsd/definitions.htm
[2] WilliamClay(Bill)Ford,Jr.:speechatthe5thAnnualGreen-peaceBusinessConferenceinLondon5thofOctober2000.http://www.crowley-offroad.com/greenpeace__bill_ford.htm
[3] Schmidt,W.-P.;Sullivan,John:WeightinginLifeCycleAssessmentsinaGlobalContext.InternationalJournalofLifeCycleAssessment7(1),pp5-10(2002)
[4] Schmidt,W.-P.:LifeCycleCostingasPartofDesignforEnvi-ronment–EnvironmentalBusinessCases.In:InternationalJournalofLCA8(3),2003.pp167-174DOI:
[5] [5]IKP,PE:GaBi4Software-SystemforLifeCycleEngineering.Copyright,TM.Stuttgart,Echterdingen
[6] SchmidtWP,DahlqvistE,FinkbeinerM,KrinkeS,LazzariS,OschmannD,PichonS,ThielC(2004):LifeCycleAssess-mentofLightweightandEnd-of-LifeScenariosforGenericCompactClassPassengerVehicles.IntJLCA9(6),pp405-416
[7] SocietyofEnvironmentalToxicityAndChemistry(SETAC):EnvironmentalLifeCycleCosting–submittedtoSETACpublicationsastheresultsoftheLifeCycleCostingWorkingGroupofSETACEurope.2006
[8] InternationalMaterialDataSystemhttp://www.mdsystem.com
[9] LeidenUniversityInstituteofEnvironmentalSciences(CML):ImpactassessmentDec2001.xls,version2.5,download:http://www.leidenuniv.nl/cml/lca2/index.html
[10]InternationalOrganizationforStandardization–ISO(2000):Environmentalmanagement–Lifecycleassessment–Lifecycleimpactassessment.EuropeanstandardENISO14042,Geneva
[11]IKP,PE:GaBi4DatabasesforLifeCycleEngineering.Copy-right,TM.Stuttgart,Echterdingen-includingup-datesforelectronics,textiles,paint,specialplasticsetc.
[12]EuropeanAluminumAssociation(2000):Environmentalpro-filereportfortheEuropeanaluminumindustryApril2000,EAA,Brussels
[13]InternationalMagnesiumAssociation(2001):“PidgeonProcessofGoldRiverMagnesiumCorporationofNingxia”PresentationofMr.LiattheWorldMagnesiumConferenceBrussels,May2001.Document4dated19.08.2001,IMA:Brussels
[14]InternationalMagnesiumAssociation(2001):LCIdataMag-nesium.xls.Document6dated19.08.2001,IMA:Brussels
[15]EuropeanIntegratedPollutionPreventionandControlBureau(2000):ReferenceDocumentonBestAvailableTechniquesintheNonFerrousMetalsIndustries.Brussels:May2000
[16]BousteadI(1997):Eco-ProfilesoftheEuropeanplasticsindustry,APME,PWMI:Brussels
[17]BundesamtfürUmwelt,WaldundLandschaft(1998):Ökoin-ventarefürVerpackungen.SchriftreiheUmweltNr.250.BUWAL:Bern
[18]ContinentalAG(1999):Produkt-ÖkobilanzeinesPKW-Reifens.DataprovidedasGaBi3dataset.ContinentalAG:Hannover
[19]Öko-Institut:BilanzierungderUmweltauswirkungenbeiderGewinnungvonPlatingruppen-MetallenfürPkw-Abgaskatalysatoren,Freiburg1997
[20]NSWdepartmentofprimaryindustries:ProspectsforSiliconCarbideProduction.
[21]Schmidt,W.-P.;Beyer,H.-M.:LifeCycleStudyonaNaturalFiberReinforcedComponent.S.251-258,ProceedingsoftheTotalLifeCycleConferenceofSAEinGraz,Dec1-31998
[22]BMWAG,Daimler-BenzAG,Fiat,Ford-WerkeAG,AdamOpelAG,Porsche,PSA-Peugeot-Citroën,Renault,RoverGroupLtd,VolkswagenAG,ABVolvo(1998):LifeCycleAnalysis–DataandMethodologiesPhase2,EUCARProjectR3.FinalReport,EUCAR:Brussels
[23]Fleischer,G(Ed.):Eco-Design-EffizienteEntwicklungnach-haltigerProduktemiteuroMat.Springer:Berlin,Heidelberg,2000
[24]Schmidt,W.-P.;Duranceau,Claudia;Sullivan,John:Sus-tainableMaterialsinAutomotiveApplications.Proceedingsofthe2002EnvironmentalSustainabilityConferenceandExhibition,SAE2001-01-3762,pp393–398
[25]Quella,F.;Schmidt,W.-P.:IntegratingEnvironmentalAspectsintoProductDesignandDevelopment.ThenewISOTR14062.In:InternationalJournalofLCA8(2),2003
PSI �1
6 AcronymsA/C Air-ConditioningSystem
AirQualityPotential SeePOCP
ADP AbioticResourceDepletionPotential-Issueofsustainableavailabilityofmaterials
AP AcidificationPotential-Issueofacidrainleadinge.g.tofishpopulationlossesincertainlakes
BUWAL SwissEnvironmentalAgency
CC Gatewayinproductdevelopment:ChangeCut-off
COD ChemicalOxygenDemand
CoO CostofOwnership
DPF DieselParticulateFilter
EuroNCAP EuropeanNewCarAssessmentProgramhttp://www.euroncap.com/
EFR EuropeanFerrousRecovery&RecyclingFederation
EOL End-of-Life
EP EutrophicationPotential-Issueofanexcessiveadditionofnutrientstotheenvironmentaffectinge.g.biodiversity
Euro3/4 EuropeanEmissionstandards
EWC EuropeanWasteCatalogue
FoE FordofEurope
GADSL GlobalAutomotiveDeclarableSubstanceList(http://www.gadsl.org)
GWP GlobalWarmingPotential(measuredaskgCO2-equivalentemissions)-Issueofclimatechange
HFC Hydrofluorocarbon(seeR134abelow)
IISI InternationalIronandSteelInstitute
IMA InternationalMagnesiumAssociation
IMDS InternationalManagementDataSystemhttp://www.mdsystem.com
ISO14040 InternationalStandardaboutLifeCycleAssessment
KO Gatewayinproductdevelopment:Kick-off
LCA LifeCycleAssessment
LCC LifeCycleCosting
LCI LifeCycleInventory
LIRECAR LCAstudyLightandRecyclableCar[6]
NOx NitrogenOxides
MSI FordofEuropes’sManufacturingSustainabilityIndex
ODP OzoneDepletionPotential-IssueofreducingthestratosphericozonelayerprotectinglifeonearthfromharmfulUVBsun-light
PA GatewayinproductdevelopmentProgramApproval
PD ProductDevelopment
POCP PhotochemicalCreationPotential(SummerSmog;measuredaskgEthene-equivalentemissionscoveringforexampleNOx,VOCetc.)
PP Polypropylene(plastic)
PR GatewayinproductdevelopmentProgramReadiness
PSI FordofEuorpe’sProductSustainabilityIndex
R134a Refrigerantofair-conditioning(1,1,1,2-Tetrafluorethan)
RESI ResponsibleEmployerSustainabilityIndex
SC Gatewayinproductdevelopment:StrategicConfirmation
SETAC SocietyofEnvironmentalToxicologyAndChemistry
SiC SiliconCarbide
SO2 SulfurDioxides
VI VehicleIntegration
VIAQ VehicleInteriorAirQuality
VOC VolatileOrganicCompounds
WVM GermanAssociationofMetalIndustries
�2 PSI
7 Appendix
Additional Dominance and Sensitivity Analysis
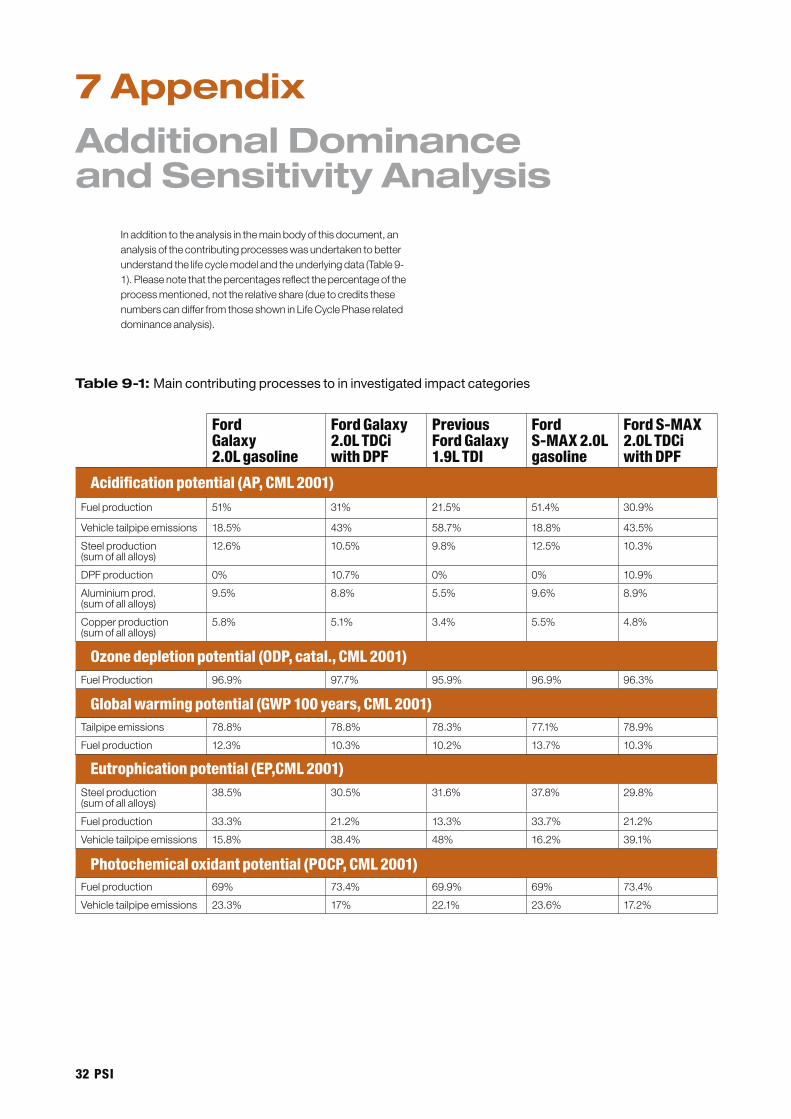
Inadditiontotheanalysisinthemainbodyofthisdocument,ananalysisofthecontributingprocesseswasundertakentobetterunderstandthelifecyclemodelandtheunderlyingdata(Table9-1).Pleasenotethatthepercentagesreflectthepercentageoftheprocessmentioned,nottherelativeshare(duetocreditsthesenumberscandifferfromthoseshowninLifeCyclePhaserelateddominanceanalysis).
Table 9-1: Main contributing processes to in investigated impact categories
Ford Galaxy 2.0L gasoline
Ford Galaxy 2.0L TDCi with DPF
Previous Ford Galaxy 1.�L TDI
Ford S-MAX 2.0L gasoline
Ford S-MAX 2.0L TDCi with DPF
Fuelproduction 51% 31% 21.5% 51.4% 30.9%
Vehicletailpipeemissions 18.5% 43% 58.7% 18.8% 43.5%
Steelproduction(sumofallalloys)
12.6% 10.5% 9.8% 12.5% 10.3%
DPFproduction 0% 10.7% 0% 0% 10.9%
Aluminiumprod.(sumofallalloys)
9.5% 8.8% 5.5% 9.6% 8.9%
Copperproduction(sumofallalloys)
5.8% 5.1% 3.4% 5.5% 4.8%
FuelProduction 96.9% 97.7% 95.9% 96.9% 96.3%
Tailpipeemissions 78.8% 78.8% 78.3% 77.1% 78.9%
Fuelproduction 12.3% 10.3% 10.2% 13.7% 10.3%
Steelproduction(sumofallalloys)
38.5% 30.5% 31.6% 37.8% 29.8%
Fuelproduction 33.3% 21.2% 13.3% 33.7% 21.2%
Vehicletailpipeemissions 15.8% 38.4% 48% 16.2% 39.1%
Fuelproduction 69% 73.4% 69.9% 69% 73.4%
Vehicletailpipeemissions 23.3% 17% 22.1% 23.6% 17.2%
Acidification potential (AP, CML 2001)
Ozone depletion potential (ODP, catal., CML 2001)
Global warming potential (GWP 100 years, CML 2001)
Eutrophication potential (EP,CML 2001)
Photochemical oxidant potential (POCP, CML 2001)
PSI ��
Ford Galaxy 2.0L gasoline
Ford Galaxy 2.0L TDCi with DPF
Previous Ford Galaxy 1.�L TDI
Ford S-MAX 2.0L gasoline
Ford S-MAX 2.0L TDCi with DPF
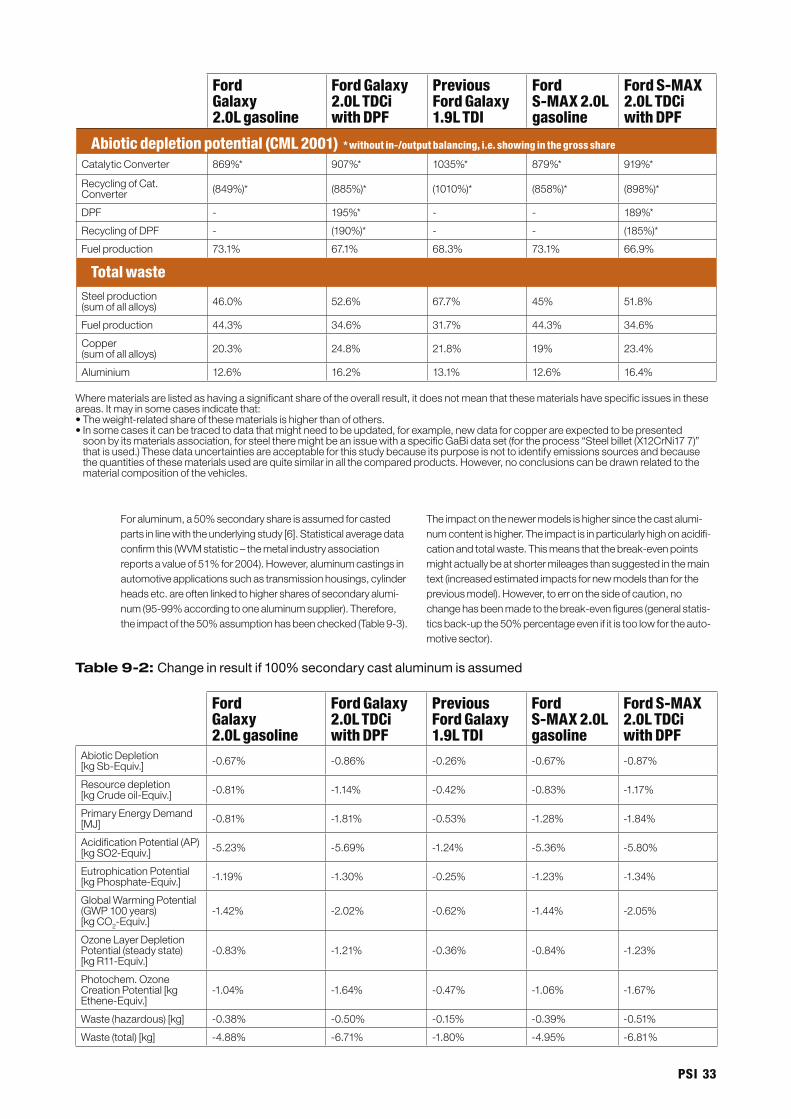
CatalyticConverter 869%* 907%* 1035%* 879%* 919%*
RecyclingofCat.Converter (849%)* (885%)* (1010%)* (858%)* (898%)*
DPF - 195%* - - 189%*
RecyclingofDPF - (190%)* - - (185%)*
Fuelproduction 73.1% 67.1% 68.3% 73.1% 66.9%
Steelproduction(sumofallalloys) 46.0% 52.6% 67.7% 45% 51.8%
Fuelproduction 44.3% 34.6% 31.7% 44.3% 34.6%
Copper(sumofallalloys) 20.3% 24.8% 21.8% 19% 23.4%
Aluminium 12.6% 16.2% 13.1% 12.6% 16.4%
Abiotic depletion potential (CML 2001) * without in-/output balancing, i.e. showing in the gross share
Total waste
Wherematerialsarelistedashavingasignificantshareoftheoverallresult,itdoesnotmeanthatthesematerialshavespecificissuesintheseareas.Itmayinsomecasesindicatethat:•Theweight-relatedshareofthesematerialsishigherthanofothers.•Insomecasesitcanbetracedtodatathatmightneedtobeupdated,forexample,newdataforcopperareexpectedtobepresented
soonbyitsmaterialsassociation,forsteeltheremightbeanissuewithaspecificGaBidataset(fortheprocess“Steelbillet(X12CrNi177)”thatisused.)Thesedatauncertaintiesareacceptableforthisstudybecauseitspurposeisnottoidentifyemissionssourcesandbecausethequantitiesofthesematerialsusedarequitesimilarinallthecomparedproducts.However,noconclusionscanbedrawnrelatedtothematerialcompositionofthevehicles.
Foraluminum,a50%secondaryshareisassumedforcastedpartsinlinewiththeunderlyingstudy[6].Statisticalaveragedataconfirmthis(WVMstatistic–themetalindustryassociationreportsavalueof51%for2004).However,aluminumcastingsinautomotiveapplicationssuchastransmissionhousings,cylinderheadsetc.areoftenlinkedtohighersharesofsecondaryalumi-num(95-99%accordingtoonealuminumsupplier).Therefore,theimpactofthe50%assumptionhasbeenchecked(Table9-3).
Theimpactonthenewermodelsishighersincethecastalumi-numcontentishigher.Theimpactisinparticularlyhighonacidifi-cationandtotalwaste.Thismeansthatthebreak-evenpointsmightactuallybeatshortermileagesthansuggestedinthemaintext(increasedestimatedimpactsfornewmodelsthanforthepreviousmodel).However,toerronthesideofcaution,nochangehasbeenmadetothebreak-evenfigures(generalstatis-ticsback-upthe50%percentageevenifitistoolowfortheauto-motivesector).
Table 9-2: Change in result if 100% secondary cast aluminum is assumed
Ford Galaxy 2.0L gasoline
Ford Galaxy 2.0L TDCi with DPF
Previous Ford Galaxy 1.�L TDI
Ford S-MAX 2.0L gasoline
Ford S-MAX 2.0L TDCi with DPF
AbioticDepletion[kgSb-Equiv.] -0.67% -0.86% -0.26% -0.67% -0.87%
Resourcedepletion[kgCrudeoil-Equiv.] -0.81% -1.14% -0.42% -0.83% -1.17%
PrimaryEnergyDemand[MJ] -0.81% -1.81% -0.53% -1.28% -1.84%
AcidificationPotential(AP)[kgSO2-Equiv.] -5.23% -5.69% -1.24% -5.36% -5.80%
EutrophicationPotential[kgPhosphate-Equiv.] -1.19% -1.30% -0.25% -1.23% -1.34%
GlobalWarmingPotential(GWP100years)[kgCO2-Equiv.]
-1.42% -2.02% -0.62% -1.44% -2.05%
OzoneLayerDepletionPotential(steadystate)[kgR11-Equiv.]
-0.83% -1.21% -0.36% -0.84% -1.23%
Photochem.OzoneCreationPotential[kgEthene-Equiv.]
-1.04% -1.64% -0.47% -1.06% -1.67%
Waste(hazardous)[kg] -0.38% -0.50% -0.15% -0.39% -0.51%
Waste(total)[kg] -4.88% -6.71% -1.80% -4.95% -6.81%
�� PSI
8 ISO 14040 External Critical Review of Vehicle Options (full independent report)
BasedonthedocumentationprovidedbyFord,aswellasthegeneralmethodologyemployedandpartofthedatasetfromapreviousstudy(LIRECAR)forwhichthechairmanofthepresentreviewpanelwasamemberoftheevaluation,thefollowingstate-mentshavebeenformulated.
Ford has undertaken, within the specifications of ISO 14040, a cradle to grave LCA with an expert panel review a posteriori. The study has been appropriately defined, and reviewed, in accord-ance to ISO 14040 (ref paragraph 7.3.3). The sources and quality of the data, as well as its interpretation are of a very high level. The development of a reduced list of environmental indicators, as part of Ford’s PSI, is valid and appropriate. The conclusions are sup-ported by the data. The use of sensitivity, dominance and Monte Carlo analyses on key elements is well done. According to the reviewers’ opinion the LCA-part of the study is consistent with ISO 14040. The two Life Cycle Costing (LCC) studies, which are part of Ford’s evaluation, are not covered by ISO 14040ff. This work, for which an international standard is not yet available, can, therefore, be considered as an environmental life cycle costing, from the first user’s perspective. This adds valuable information to
the comparative assessment of the models investigated. The same is true for the societal aspects covered in this study which aims, within the limits of present-day methodology, to provide a full sustainability assessment.
Prof. David Hunkeler and Prof. Walter KloepfferMarch 21st, 2006
Notebyeditor:“Prof.DavidHunkeleristhechairmanofSETACEurope’sWorkingGrouponLifeCycleCostingandDirectorofAQUA+TECHSpecialtiesSA.Until2002hewasProfessorattheSwissFederalInstituteofTechnologyLausanne.Davidwastheleadauthoronabookonlifecyclemanagementandhasdevel-opedtheLCMprogramsformultinationalsinbothEuropeandNorthAmerica.Hehasover200publicationsandseveralpatentsaswellasbeinghonoredforinnovationandentrepreneurship.HisfirmwasselectedasthetopenvironmentalfirminEuropein2002.ProfWalterKlöpfferistheeditor-in-chiefof‘TheInternationalJournalofLifeCycleAssessment’since1995.HeisprofessorattheJohannes-Gutenberg-UniversityinMainz.”
8.1 Executive Summary
Fordhasundertaken,withinthespecificationsofISO14040(1997),acriticalreviewaposteriori.Sinceanaccompanyingreview,assuggestedbySETAC,isnotobligatoryaccordingtoISO14040,theprocedurechosenisinaccordancewiththeinter-nationalstandard.
ISO14040statesthatwhilecriticalreviewsofanLCAareoptional,ingeneral,forcomparativeassertionsthataredisclosedtothepublicacriticalreviewshallbeconducted.Itshouldbenotedthattheterm“shall”isanextremelystrongoneintheISOcontextandmeans“must”.IS014040specifiesthatparagraphs7.3shouldbeconsultedindeterminingthereviewoptions.Para-graphs7.3.1and7.3.2refertoreviewswhichwillnotbeusedforcomparativeassertionandare,therefore,notapplicabletoFord’sLCA.
ThemajorityofISO14040criticalreviews,approximatelytwo-thirds,arecarriedoutaccordingtoISO140407.3.3,which
involvesanexpertpanel,asisthepresentcasefortheFordLCA.Themembersoftheexpertpanelmustbefamiliarwiththeentiredocumentationprovidedthoughitisnormalthatindividualmem-berswouldfocusoncertainaspects.ThishasbeenfollowedintheFordreview.Reviewpanelstypicallycomprisetwo-to-threeexpertsandFord’sspecificationoftwoexpertsis,therefore,with-inthisrange.Therefore,Ford’sselectionofreviewunder7.3.3isappropriate.
Asacommentitshouldbenotedthat7.3.3,accordingtoISO14040(1997),requiresonlyapanelthoughdoesnotsayanythingaboutthesize.Evidently,twoistheminimumnumberforapanel,asopposedtoasingleexpert(7.3.2).ISOFDIS14040(2006)pre-scribesaminimumofthreepanelmembersfor7.3.3,thoughthisnewstandard,whichwillsupersedethepresentone,isnotyetenacted.Therefore,the1997standardremainsvalidandapaneloftwoisappropriate.
8.2 Categorization of the Ford Study and the review process
ISO14040asksreviewerstoexamineifthemethodsusedtocon-ducttheLCAarescientificallyvalid,ifthedatausedisappropriateinrelationtothegoalandscope,iftheinterpretationsreasonably
reflectthelimitationsidentifiedandifthereportistransparent.ThediscussionofcompliancewithISO14040will,therefore,besub-dividedtoreflectthesepoints.
8.3 Compliance of the Ford Study with ISO 14040-43
PSI ��
ItisrelevanttonotethattheinternationalISOstandard“doesnotspecifyrequirementsonthegoalsorusesofLCA”.Therefore,acriticalreviewcan“neitherverifynorvalidatethegoalsthatarechosenforanLCA,ortheusestowhichLCAresultsareput”.Nonetheless,thegoalandscopemustbepartoftheoriginaldefi-nitionandthisshouldbereflectedinthereport.Thereviewerscan,therefore,commentthat,intheFordLCAthegoalandscopearedefinedinSection2.2.1.ThissectionspecifiesthegoalandfunctionalunitforFord’s“cradletograve”LCA.Thesystemboundariesofthisstudyarecorrectlydefinedfromtherawmateri-
alsextractiondowntotheend-of-lifephaseand,thus,defineatruecradle-to-graveLCA.Thegoalto“supportinternalproductdevelopment”aswellasexaminingthelifecycleperformanceandintegratingcostwithenvironmentisappropriateandreasonable.TheFunctionalUnitisdefined,inthesecondparagraph,inacom-pletelyappropriatemanner.Thefactthatdataare,inpart,derivedfroma“completeteardown”ofthevehicleisanexcellentpointforvalidationandcertainlygoesbeyondtherequirementsofISO14040andaddssignificantcredibilitytotheLCA.
8.3.1 Compliance with Standard Goal and Scope
Overallthequalityofdataanditstransparency,aswellastheextentofreferencesseemsappropriateforthestudy.Thedataseems,asstated,tomeettherequirementsforgeographicalcoverageandtheselectionofdatabasesisappropriate.
Thefocusonelementaryflows,aswellastheselectionofkeyemissions,wasteandresourcesisbackedupbyadetailedstudy(Ref6)andisreasonable.Furthermore,thediscussionofthescalingofPSIindicatorsinTable3-1,thoughnotrequiredbyISO14040,isexcellent.
Section2.5.1itemizes,specifically,thesourcesofdataandfractionfromliterature(58.2%),calculations(16.3%),estimates(16.1%),measurements(5.5%)andconfidentialmethods(3.9%).Thisbalanceisappropriate.Theuseofmixedthermoplasticsasanaverageisnecessaryastheunknownplasticsremainasignifi-cantmass.ToensurethatthisassumptiondoesnotchangetheresultsoftheLCA,theauthorshavecarriedoutasensitivitystudyassumingtheunknownplastictobevariousblends,attherequestofthereviewers.ThisindicatedthattheresultsoftheLCAareinsensitivetotheplasticscompositionandthatFord’sassumptionwasquitereasonable.Giventhatdatawerenotavail-ableforcordierite(catalyticconverter)thatthereviewpanelrequestedasensitivityanalysiselement.Theresultingdominance
analysisindicatedthattheinfluenceoftheproxydatausedforcordieriteisquitelowandthatthesedatamightrepresentaworstcaseassumptionwhenlookingatthetemperatureinvolved.Therefore,theoverallresultisnotlikelytobesensitivetothedatarelatedtothecatalyticconverter.ThedatapresentedintheAppendixis,otherwise,appropriate.
Therewassomediscussionbetweenthecriticalreviewpanelandthecommissioneraboutthequalityofthosedatarelevantforthesuppliers.Thesecontributealargefractionofthepartswhichfinallymakeuptheentirecarandshould–inprinciple–contributespecificdataregarding,forexampleenergyuseandemissions.Thesedataaredifficulttoobtainforreasonsofconfidentialityand,furthermore,suppliersmaychangeduringtheproductionofacar-model.Itseems,therefore,reasonabletouseaveragedatacoveringthesuppliedparts,aswasdoneinthisstudy.AscommunicatedbyDr.Wulf-PeterSchmidt–FordSustain-ability,Ford’ssupplychainmanagementrequiresthatthesupplierproductionsites(asaprerequisitetobecomeasupplier)havetobecertifiedaccordingtoISO14001–asareFord’sproductionsitesworld-wide.Thisensuresthattheseplantshaveanenvironmentalmanagementsystem.
8.3.2 Life Cycle Inventory, Data Quality, Data Accessibility
�.�.2.1 Data Quality
Theaccessibilitytotheoriginaldatawasnot,perse,granted,norcoulditbeinareviewofsuchlimitedscope,thoughalldatapost-LIRECARhasbeenprovided.However,theChairmanofthereviewpanelaskedforsupplementalevaluationstoevaluatetheFordLCAwithsimilarLCAshehasreviewedandcarriedoutintheimmediatepast(e.g.Trucks).Giventhis,itwasdecidedtorequestfromFordasensitivityanalysisonthelossrateofrefriger-ant.Ford,andinparticularDr.Schmidt,carriedoutsuchasensi-tivityanalysis,specificallylookingattheeffectofdoublingtherefrigerantlossassumption.Furthermore,Prof.DavidHunkeler
chairmanofthereviewpanelwasamemberofthethree-personreviewofLIRECAR,forwhichsomeofthebaselinedataofthepresentFordevaluationwerederived.Hehas,therefore,meticu-louslyevaluatedtheonehundredpluspagesofinventorydataprovidedbytheLIRECARconsortiumandisconvincedthatthedata,softwareusedtoanalyzetheinformationandassumptionsmadearereasonableandconsistentwithsimilarLCAscarriedoutforautomobilesor,ingeneral,productsforwhichtheusephasedominates.
Thereferencesareappropriate.
�.�.2.2 Accessibility to Original Data
�� PSI
TheLCIA,hasbeencarriedoutinaccordancetoacceptedmeth-ods,employingstandarddata,andusingcommontools.Theoverallapproachisalsoacceptable.
8.3.3 Life Cycle Impact Assessment (LCIA)
LCIA,accordingtoISO14042(2000),consistsofseveralsteps,bothmandatoryandoptional:•Selectionofimpactcategories,categoryindicatorsandcharac-
terizationmodels(mandatory)•AssignmentofLCIresults(classification,mandatory)•Calculationofcategoryindicatorresults(characterization,
mandatory)
•Calculationofthemagnitudeofcategoryindicatorresultswithrelativetoreferenceinformation(normalization,optional)
•Grouping(optional)•Weighting(optional,notallowedforcomparativeassertions
madeavailabletothepublic)•Dataqualityanalysis(mandatoryforcomparativeassertions
madeavailabletothepublic)
�.�.�.1 General Comments on LCIA
Themandatorystepshavebeenperformedisthisstudy,whichinvolvescomparativeassertionsmadeavailabletothepublic.TheLCIAisthereforeinaccordancewiththeinternationalstandardISO14042.
Itisstatedthat“weightingisnotdone”(Section2.2.3)inregardstoLCIAandthisisappropriateasitavoidscriticism(LCIAweight-ingis“subjective”inthesenseasitcannotbeprovedaccordingtoscientificmethods).
�.�.�.2 Specific comments on the LCIA
Theinitialstatementthatthestudyis“excludingelementaryflowscontributingtoenvironmentalimpactswherecurrentlynoscientif-icconsensusexistsformeasuringwithLCAs”wasmisleadingandcouldbeinterpretednegativelyagainstFord.FollowingaconferencecallwithForditseemedclearthatthisqualificationisintendedtonote,quitecorrectly,thatdataqualityisanissueintoxicology.Furthermore,itisafactthattheimpactcategories“Humantoxicity”and“Eco-toxicity”,asproposedinseveralhand-booksonLCA,remaindifficulttoquantifyandthereisnoconsen-susregardingtheindicatorsandthecharacterizationmodelstobeused.Thecorrecttreatmentoftheseimpactsisacurrentresearchtopic.Ford,therefore,cannotbecriticizedforomittingthesecategoriesatthepresenttime,althoughcarsemittoxicgasesandparticles.Thetoxicandeco-toxiceffectsofvolatile
organiccompounds(VOC)arepartlytakenintoconsiderationintheimpactcategory“photochemicalozoneformation”(summersmogformation)whichisincludedinthisstudy.Furthermore,the(eco-toxic)acidificationbyemittedacid-forminggases(SO2,NOx)isconsidered.ConsideringthestateofLCIAdevelop-ment,Fordcan,ingoodconscience,writethefollowing:
“This study does not transfer, to impacts, data for which the quality is highly questionable, such as those related to toxicity and landscape”. This phrase should replace the statement that the study is “excluding elementary flows contributing to environ-mental impacts where currently no scientific consensus exists for measuring with LCAs.”
�.�.�.� Appropriateness of Omissions of LCIA impact categories
8.3.4 Interpretation of the LCA Results and Transparency
Theoverallpresentationoftheresultsandtheirinterpretationarecompletelyinlinewiththedatacollectedaswellasimpactsandcostcalculated.Asanexample,Figure3.5communicateskeyindicators,whicharevalid,forvariousvehicleoptions.TheonlymetricwhichcouldbetabulatedbyFordinPSI,andisnot,is“totalwaste”.Figure3.7illustratesthatthismetricisrelativelyhighandthereforecouldbecommunicated.Clearly,thedecisionastowhatisaboveathresholdisnotabsolute,asthresholdsarearbi-trary.Totalwas,intheLCAofanautomobile,includesahighshareofoverburdenandtailingsfromminingandoreprocessing.Whileinthisspecificcase(FordGalaxy,FordS-MAX)therearenosignifi-cantdifferencesidentifiedbetweenthevehiclesregarding“totalwaste”(sensitivityanalysisidentifiedforthiscaseaminimumof
8%difference)itmightbedifferentforothercases.Therefore,thequestionofinclusionof“totalwaste”inPSIshouldbeanalyzedprevioustoapotentialcommunicationofPSIforothervehicles.
Inregardstotheinterpretation,thefollowingcommentsillus-trateFord’scommitmenttoensurethevalidityoftheresultstheyseektocommunicate:•ThedominanceanalysisofSection2.5.2isexcellentandpro-
videsasignificantauthorityforcomparativeassertions.Crudeoilandpreciousmetals,aspartofabioticdepletionpotentialcouldbeinthePSIsystemthoughtheauthorsarecorrectinomittingthemastheycontributeonlyapproximately1%ofthetotalenvironmentalimpactandthisisbelowanyacceptedthreshold.
�.�.�.1 Interpretation
PSI ��
•ThebreakevenanalysisinSection2.5.3isverygood.Inparticu-lartheidentificationoftradeoffsbetweentheusephaseandproductionisinformativeandcorrectlycarriedout.
•Thecalculation,usingMonte-CarloAnalysis,ofthestandarddeviationofvarioususephaseassumptionsiswellcarriedoutandinformative.Astheusephasecosthas,byfar,thelargeststandarddeviation,thiscouldbejustifiedinafootnote.
•ThefactthattheLCIAresultswerevalidatedusingasimplified,spreadsheet-basedsoftwarewithverysimilarresultsisanimportantstepforewordinthefieldandshouldbecommended.ThetoolshouldprovideameansforFordtoincreasetheuseofLCAwithintheirorganizationandindesign.Withoutseeing,explicitlytheExcelsheetthereviewerscannotcommentonit,perse.However,theexclusionofthesheetwouldinnomannerinfluencetheconclusionsofthereviewunderISO14040.
Thesevenconclusionsdrawn(Section3.5.3)arecompletelyrea-sonableandjustified.Theoverallconclusionsection(3.5.4)isalsoquitefine.ThefactthatthePSIresultsarepresented(inFig-
ure4-1andFigure4-2)intwospidergraphs,eachfortwocom-parativevehicles,isanexcellentcommunicationtool.
�.�.�.2 Conclusions and Transparency
8.3.5 Management of the Review Process
Section7.3.3ofISO14040notedthatthecommissioner(Ford)hastoselectanexternalindependentexperttoactasthechair-personofthereviewpanel.Fordhas,followingatenderprocess,selectedDavidHunkelerandthiscorrespondstothenormsinthestandard.ThefactthatFordprovidedthereviewpanel,anditschair,withadialogwiththeLCA-projectleaderisnot,itself,speci-fiedinISO14040,thoughisgenerallyrecommendedtoenhancethequalityofthereviewforexamplebySETAC.Therefore,Ford’sparticipationinthemanagementofthereviewprocesshasbeenentirelyaccordingtothestandard.
ISO14040statesthatthecommissioner(Ford)andpractitionermustprovideaccesstooriginaldata.Inallinstancesofrequestforadditionalinformationorconferencecalls,Dr.Schmidthasbeenreceptivetoprovideinformation.ISO14040alsostates,anditisimportanttoreiteratethat“thefactthatacriticalreviewhasbeenconductedshouldinnowayimplyanendorsementofanycomparativeassertionthatisbasedonanLCAstudy”.
8.4 COMMENTS ON LIFE CYCLE COSTING (NOT REQUIRED IN ISO 14040)
Thelifecyclecostingisquitediligentwithallcostcompletelyappropriatelycalculated.Thedepthofinclusionofdataacrossthelifecycleisappropriateandtheuseofdiscountingpossible.Thereviewers,whohaveextensiveexperienceinLCC,believethatthebestpossibleassumptionshavebeenmade.Fordcan,reasonably,calltheirLCCan“EnvironmentalLifeCycleCosting”accordingtotheto-be-publisheddeliberationsofaSETACwork-
inggroup.TheLCCresultspresentedinFigures3-10and3-11aretotallyreasonableascommunicationtools.ThoughoutsidethescopeofthepresentreviewtheLCCstudiescarriedoutbyFordseemtobeconsistentwiththosebeingdebatedandpro-posedinaSETACWorkingGroupofthesamenameandare,therefore,likelytobeveryclosetoaneventualCodeofPractice.
8.5 COMMENTS ON SOCIAL ASSESSMENT (NOT REQUIRED IN ISO 10404)
ThePSIis,incombiningenvironmental,economicandsocietalinformation,respectingtheBrundtlandandSETACvisionsofsus-tainability.Itshouldbenotedthatthesocietalandsocialassess-mentsarebothintheirinfancyandnormshavenotevenbeensuggested.Therefore,thefactthatFordhasincludedsocialaspectsissufficientcommendation.However,onecouldinthefutureconsideranemergingaxisinsocietalassessment,thatbeingemployment,asametric.Evenifoneweretoreducesoci-etalassessmenttoasmallsetofindicatorssuchasthoserepre-sentingaccesstoessentials,housing,educationandhealthcare,allarelinkedtoanindividual’semployment,orsociety’sabilityto
employ.Hence,acomponent,easilymeasurableforanorganiza-tionandabsolutelyjustifiablewouldbeproduct-basedemploy-mentthroughthelifecycle.Initspresentstate,thesocietalcomponentcanbeconsideredasanucleusforfurtherdevelop-mentofthis“thirdpillar”ofsustainabilityassessment.ItisquitelikelythatFord,whichhaveothermetricswhichaddresssustain-ability,havenotincludedlifecyclelaborwithinPSI.Overall,thechoiceofFordtohaveseveralindicatorsinplaceofonesuper-indicatorisinlinewiththethinkingofinternationalworkinggroupsandisappropriate.
�� PSI
8.6 RECOMMENDATIONS
Overall,thereviewershavefoundtheFordLCAtobeaverywellcarriedoutstudyinaccordancewithvariousnorms.Inlightofthepositivetoneofthisreply,thefollowingrecommendationisaimedatthelong-termevolutionandupgradingofthePSItool.
The generic life cycle inventory data, used within the LCA, should be periodically monitored and validated. This long term evolution should be carried out for data elements clearly above the thresh-old (so called hot-spots in LCA parlance). While recognizing the difficulty that requesting data from suppliers entails, periodic vali-dation of key materials and, perhaps also components, should be viewed as a means to improve the dialogue with the supply chain, a key element in life cycle management, and not as a bureaucratic exercise.
ThePSItoolcanbe,ingoodconscience,usedasabenchmark-ingtoolforFord’sautomobiles.Should,overtime,theLCIsignifi-cantlychange,oneshouldre-calculatetheexistingreferencevehiclesaccordingtoanymodifiedPSI.
Contactforcontentrelatedquestions:Dr.Wulf-PeterSchmidt,FordofEurope,Germany50725Köln,[email protected],+492219016202
Mediacontact:AdrianSchmitz,FordofEurope,Germany50725Köln,[email protected]+492219019929
Contacts
Printedon100%recycledpaperVegetableoilbasedprintinginks

Feel the difference
Feel the differenceFordS-MAX FordGalaxy
0�-200�
FordS-MAX
FordGalaxy