Embed Size (px)
Citation preview

Indones. J. Chem., 2015, 15 (3), 295 - 304
Wiwit Sri Werdi Pratiwi et al.
295
* Corresponding author. Tel/Fax : +62-87854042762Email address : [email protected]
PRODUCTION BY LINTNERIZATION-AUTOCLAVING AND PHYSICOCHEMICALCHARACTERIZATION OF RESISTANT STARCH III
FROM SAGO PALM (Metroxylon sagu Rottb)
Wiwit Sri Werdi Pratiwi1,2,*, Anil Kumar Anal2, and Surya Rosa Putra1
1Department of Chemistry, Sepuluh Nopember Institute of Technology (ITS)
Jl. Arief Rahman Hakim,Sukolilo, Surabaya 60111, Indonesia
2Food Engineering and Bioproccess Technology, Asian Institute of Technology
Klong Luang, Pathumthani 12120, Thailand
Received October 2, 2014; Accepted May 6, 2015
ABSTRACT
Indonesia is one of the biggest central distributions of sago starch. There are some characteristics of sagostarch which make it difficult to use in variation of foods. In this study, resistant starch type III (RS3) was producedfrom sago starch by using lintnerization-autoclaving (LA). Physicochemical characterizations of RS3 were comparedby native sago starch (NA), hydrolyzed starch by distilled water (DW) and lintnerized starch (L). Amylose contentdecreased after hydrolyzed by DW and L, but increasing by using LA. Protein and fat contents decreased afterhydrolysis, but crude fiber content increasing, the highest value was obtained lintnerized-autoclaved starch.Lintnerized-autoclaved starch has more compact and rigid structure. The RVA viscosity, swelling power and waterholding capacity values reduced after all treatments. Oil in water emulsions were also analyzed by mixture of RS3
and emulsifier (casein or SPI). Viscosities of emulsions from RS casein were lower than those of RS-SPI. Emulsioncapacity and emulsion stability values were better gotten using RS-SPI than RS-casein. The highest of emulsioncapacity was obtained 11.33%. For storage period, the lowest peroxide and anisidine values of mixture RS-emulsifier were resulted from 5% emulsifier + 5% RS + 5% fish oil.
Keywords: sago starch; lintnerization-autoclaving method; resistant starch; fish oil; emulsion
ABSTRAK
Indonesia merupakan salah satu pusat distributor terbesar pati sagu. Sifat dasar pati yang mudahtergelatinisasi membuat penggunaan pasti sagu sangat terbatas dalam produksi makanan. Dalam penelitian ini, patiresisten tipe III (RS3) diproduksi menggunakan hidrolisis asam yang diikuti dengan metode autoklaf. Karakterisasidari RS3 dibandingkan dengan pati sagu murni, dan sagu modifikasi lainnya. Kandungan amilosa menurun setelahdihidrolisis dengan air destilasi dan hidrolisis asam, tetapi meningkat saat dihidrolisis dengan asam yang diikutiproses autoklaf. Kandungan lemak dan protein menurun setelah proses hidrolisis tetapi kandungan serat meningkat,dan nilai serat tertinggi saat menggunakan metode autoklaf. Viskositas, daya kembang dan daya ikat air menurundibandingkan pati sagu asli dan nilai terendah didapat saat menggunakan metode autoklaf. Emulsi minyak dalam airjuga dianalisis dengan menggunakan campuran RS dan emulsifier (kasein atau SPI). Viskositas emulsi yang terbuatdari RS+kasein lebih rendah dari pada emulsi yang terbuat dari RS3+SPI. Nilai kapasitas emulsi dan stabilitasemulsi lebih bagus saat menggunakan emulsi campuran dari RS3-SPI dari pada RS+kasein. Nilai kapasitas emulsiterbesar adalah 11,33%. Selama proses waktu penyimpanan emulsi, nilai peroksida dan anisidin terendah yaituemulsi yang terbuat dari campuran RS+ emulsifier yang terbuat dari 5% emulsifier+ 5% RS3 + 5% minyak ikan.
Kata Kunci: pati sagu; metode hidrolisis asam-autoklaf; pati resisten; emulsi minyak ikan
INTRODUCTION
Sago starch is extract of the sago palm (Metroxylonsagu Rottb.). Starch is highly collected in the trunk of thesago palm, approximately 250 kg/dry weight plant. InSoutheast Asia, it has been considered as one of theimportant socioeconomic crops, whereby produce 60
million tones of sago starch annually [2]. Like otherbasic starches, characteristics of native sago starch arehigh viscosity, high clarity, low thermal stability,susceptible to acid condition, easily to be molded andgelatinization. In order to overcome the inherentdeficiency of native sago starch and improve its quality

Indones. J. Chem., 2015, 15 (3), 295 - 304
Wiwit Sri Werdi Pratiwi et al.
296
for novel food application, native sago starch needsmodification.
Resistant starch (RS) is one of the modifiedproducts and is resistant to hydrolyze by α-amylase. RS cannot be hydrolyzed in the small intestine, butfermented in the large intestine by colonic flora, and itsproduct consists of short chain fatty acids that enhancehealth of human digestion [3]. Besides that, RS canimprove the lipid and cholesterol metabolism. Somephysicochemical properties of RS are low water holdingcapacity, bland flavor, improves expansion andcrispness in food applications.
RS is classified to type I (inaccessible starch in acellular matrix), type II (native uncooked starch granulesthat form crystalline, and make them difficult tohydrolysis), type III (retrograded starch, which be formedin cooked), type IV (chemical modified starches) [4].Nowadays, the scientists interest of RS formationespecially utilization of RS in food production. RS hasstability in heating processing and also contains highnutrition. RS type III is generated by combination of thegelatinization-retrogradation process. Certain factorsinfluence RS type III formation, including amylosecontent and chain length, autoclaving temperature,storage time and temperature of starch gel [1].
Lintnerized is one of ways for RS3 formation.Lintnerized starch is obtained by mild acid hydrolysis ofα-1,4 and α-1,6 glycosides linkages from amylose and amylopectin. This method increases crystalline content,which becomes resistant by enzymatic hydrolysis.Reference [4] has investigated that resistant bananastarch is obtained 16% from this method, and thenautoclaved, its shows a lower solubility in water thannative starch and RS value is higher than only lintnerizedtreatment. Besides that, Aparicio’s research [4] hasshowed that resistant starch prepared by lintnerized-autoclaved contained slowly digestible carbohydrate.Zhao and Yang [5] suggested that utilization citric acid tode-branch on RS type III formation is better thanhydrochloric acid and acetic acid.
On the other hand, fish oil, which is rich source ofomega-3 poly-saturated fatty acids and very susceptibleto lipid oxidation is another important functionalcompound that is used in food applications, such as fishoil emulsion. Fish oil emulsion needs mixtures of proteinand carbohydrate to form the Millard reaction productsby increasing emulsifying properties and oxidativestability of fish oil emulsions [6]. RS which hascharacteristics such as less solubility, high crystallinityand stability in high process temperature can be used incombination with proteins to prepare fish oil emulsion tokeep oxidative stability of fish oil. Nasrin et al., [7]reported that oil in water emulsions prepared by mixtureof culled banana pulp resistant starch and soy protein
isolate (SPI) were the most stable than mixture ofHylon VII and SPI or using SPI only, resulting thelowest oxidation value which were occurred for storagetimes. In this study, RS production is utilized as mixtureof fish oil emulsion and also by comparing usingemulsifiers SPI and casein.
EXPERIMENTAL SECTION
Materials
Sago starch was brought from Indonesia,processed by Alini Company. All other chemicals (citricacid, NaOH, sodium maleate buffer, sodium acetatebuffer, sulfuric acid, o-dianisidine reagent, iodine,H2SO4, HCl, petroleum ether, bromocresol greenindicator, methyl red indicator, pancreatic α-amylase, amyloglucosidase, acetic acid, chloroform, potassiumiodide, iodine, sodium thiosulphate, casein, hylon VII,para-anisidine, glacial acetic, isooctane, fish oil) usedin this research were analytical grade.
Instrumentation
Spectrophotometer (Model UV2, Unicam,England), Soxtec system (Model HT6, Tecator,Sweden), muffle furnace (Model FSE 621-210D, SanyoGallenkamp, UK), Rapid Visco Analyser (Model 4,Newport Scientific Pvt., Ltd. Australia), ScanningElectron Microscopy (S-3400N HITACHI) with anaccelerating voltage of 20 kV.
Procedure
Lintnerization of starchThe modified methods of Nasrin et al. [7] were
used to produce lintnerized sago starch, which thenwas suspended into 1 N; 1.5 N; and 2 N citric acidsolution at 1:1.5 (w/v) ratios. The mixtures were heatedat 60 °C and used variation time of hydrolysis (3, 6, and12 h) and then, samples were neutralized with NaOH10% and washed properly by distilled water. Thesamples were dried at 40 °C for 2 days, cooled down,passed through 100 mesh sieves and stored indesiccators.
Hydrolysis starch by distilled waterWater hydrolysis was prepared according to Zhao
[5] with modification. Sago starch (10 g) is dispersed in40 mL of distilled water and the mixture is autoclavedat 121 °C for 1 h. hydrolysis sample was dried at 40 °Cfor 2 days, cooled down and milled to produce fineparticle through 100 mesh sieves and then stored intodesiccators.

Indones. J. Chem., 2015, 15 (3), 295 - 304
Wiwit Sri Werdi Pratiwi et al.
297
Preparation of RS3
Samples, including lintnerized starch andlintnerized-autoclaved starch were suspended in water(1:10 w/w) and gelatinized at 85 °C for 30 min. Sampleswere autoclaved at 135 °C for 30 min, cooled down andstore at 4 °C for 24 h. Autoclaving-storing treatmentswere repeated three times at same temperature andtime. Samples were dried at 50 °C, cooled down, milledand sieved through 100 meshes.
Preparation of fish oil emulsionMixture starch (using RS or using Hylon VII as
native starch rich amylose) and emulsifier (casein or soyprotein isolate) based on Table 1 were added with water60 °C to get aqueous suspensions (10% total solids,w/w), heated at 100 °C, cooled at room temperature andthen frozen and lyophilized. Freeze-dried materials wereadded fish oil and water based on Table 1, to obtain15% w/w emulsions. Each mixture was blended thenhomogenized. All emulsions were adjusted at pH 7.5,and then analyzed for emulsion stability, emulsioncapacity, viscosity and color value. Besides that, duringstorage the emulsions were analyzed peroxide valueand anisidine value.
Characterizations physicochemical propertiesResistant starch. The resistant starch analysis used themethods described by Nasrin [7]. Sample (100 mg) wasplaced into a centrifuge tube. Sodium maleate buffer 1 M(pH 6.0) containing pancreatic α-amylase (10 mg/mL) and amyloglucosidase (3 U/mL) was added 4 mL. Thetube was closed, mixed up on vortex mixer andincubated them in shaking water bath at 37 °C for 16 h.The reaction was stopped, added 4 mL ethanol (99%)and followed by centrifugation at 3000 rpm for 10 min.Supernatant was separated, then starch lump wasadded ethanol (50% v/v) 8 mL, stirred and centrifugedagain. Resistant starch is measured by adding 2 mLKOH 2 M, and added 8 mL sodium acetate buffer 1.2 M(pH 3.8) and 0.1 mL of amyloglucosidase (3000 U/mL).The mixture was incubated with continuous shaking at50 °C for 30 min. The glucose was determined byglucose oxidase assay. Sample was added glucoseoxidase peroxidase solution containing o-dianisidinereagent, and then incubated at 37 °C for 30 min. Sulfuricacids 12 N was added 2 mL to stop its reaction. Theabsorbance was measured by spectrophotometer(Model UV2, Unicam, England) at 540 nm.Amylose. Sample (100 mg) was put into 100 mLErlenmeyer. Ethanol 95% and NaOH 1 N were added1 mL and 9 mL, respectively. Mixture was heated for10 min in boiling water bath, cooled and volume oferlenmeyer was added water until reaching total 100 mLof that Erlenmeyer. Mixture was taken 5 mL and pouredinto other Erlenmeyer. Acetic acid 1 N and iodine solution
Table 1. Formulation of fish oil emulsionCompositions (% w/w)Emulsion
systems Emulsifier RS HylonVII
Fishoil
Water Totalsolid
E1 7.5 0 0 7.5 85 15E2 3.75 3.75 0 7.5 85 15E3 3.75 0 3.75 7.5 85 15E4 10 0 0 5 85 15E5 5 5 0 5 85 15E6 5 0 5 5 85 15
E1= 7.5% emulsifier (casein or SPI) + 7.5% fish oil; E2= 3.75%emulsifier + 3.75% RS + 7.5% fish oil; E3= 3.75% emulsifier + 3.75%Hylon VII + 7.5% fish oil; E4= 10% emulsifier + 5% fish oil; E5= 5%SPI + 5% RS + 5% fish oil; E6= 5% Hylon VII + 5% fish oil. 85% waterin all systems
were added 1 mL and 2 mL, respectively. Volume oferlenmeyer was made up to 100 mL with distilledwater, waited for 20 min and then absorbance wasmeasured at 620 nm by spectrophotometer (ModelUV2, Unicam, England).Crude Fiber. Samples 2 g were put into flask; added200 mL hot H2SO4, and then heated at 100 °C for30 min. Residue was separated by filter, mixed with200 mL NaOH 1.25% solution and heated-stirred againat 100 °C for 30 min. After cooling down, residue wasseparated and washed with hot water and ethanol95%. Residue was dried, weighed, incinerated at400 °C and reweighed. Crude fiber calculation [10]:
weight lost in furnaceCrude fiber = 100
weight of samplex (1)
Moisture. Sample 5 g was put into Petri disk whichknown weight, then put into an oven pre-set at 110 °Cfor 3 h. Sample was cooled in desiccators andreweighted, then returned into oven at 110 °C for30 min until constant weight was obtained [10].
weight of initial sample - weight of final sampleMoisture content = x 100
weight of initial sample(2)
Protein. Crude protein was determined by Kjeldahlmethod. Sample 0.5 g was put in digestion tube.Concentrated H2SO4 and catalyst (CuSO4 : K2SO4, 0.5 :1 w/w) was added 10 mL and 1 g, respectively, thendigested in a digester at 420 °C for 1 h to liberatednitrogen bond and form ammonium sulphate. Distilledwater and NaOH 40% were added 10 mL and 85 mLrespectively into the tube. The distillate 25 mL wasgotten, added 4% boric acid and indicator (mixing of0.1% (w/v) of bromocresol green and 0.1% (w/v) ofmethyl red. Titration used HCl 0.1 until color changes[10].
titration volume x N HCl x 14.007Total Nitrogen = x 100
weight of sample(3)
Protein content = % total N x 6.25 (4)Fat. Crude fat of 2 g sample was determined by AOACmethod [10] using Soxtec system (Model HT6, Tecator,Sweden). Crude fat was extracted from sample with

Indones. J. Chem., 2015, 15 (3), 295 - 304
Wiwit Sri Werdi Pratiwi et al.
298
60 mL Petroleum ether which put in weighted glass cupand evaporated 110 °C for 30 min for immersion, 30 minfor washing and 60 min for recovery time. Yield wasdried at 100 °C, cooled down and weighed.
weight of cup after extraction - initial weight of cupCrude fat = x 100
weight of sample(5)
Ash. Sample (5 g) was incinerated at 600 °C for 3 h inmuffle furnace (Model FSE 621-210D, SanyoGallenkamp, UK). Previously, silica dish was weighted.After incinerating process, the disk and sample wascooled in desiccator and weighed again.
weight of residues after incinerationAsh content = x 100
weight of sample(6)
Carbohydrate. Carbohydrate content was measuredfrom the total (100) minus of contents of protein, fat, ash,and fiber.Carbohydrate = 100 - (fiber + protein + fat + ash) (7)
Pasting propertiesPeak properties were measured by Rapid Visco
Analyser (Model 4, Newport Scientific Pvt., Ltd.Australia). Sample (2.5 g) were kept into canister andmixed with 25 mL distilled water. Suspended samplewas kept at 50 °C for 1 min, and then temperature wasincreased until reached 95 °C, kept for 3.2 min, and thendecreased to 50 °C. Sample was mixed andhomogenized with 960 rpm for 10 sec during starting oftest, then decrease 160 rpm and continued it throughout.
Swelling power and solubilityOne gram of sample was dispersed in 50 mL
distilled water in centrifuge tubes, then heated into waterbath at different temperatures (60–95 °C) for 30 min withcontinuous stirring. Sample was cooled, centrifuged at3000 rpm for 15 min. Supernatant was dried at 105 °Cfor 5 h. solubility of that sample can be calculated. While,for swelling determination, wet sample (sediments) wasweighted.
weight of dry sample in supernatantSolubility (%) = x 100
weight of dry sample(8)
weight of wet residueSwelling power (%) = x 100
weight of dry sample(9)
UV/Visible spectrometer analysisSample (1 g) was dispersed in 50 mL distilled
water then heated in water bath at 95 °C for 30 min withcontinuous shaking and then cooled at 25 °C.Gelatinized starch (10 mL) was put in Erlenmeyer,added distilled water 25 mL and neutralized with HCl0.1 M until pH 3. The suspension was mixed with 100mL distilled water and 0.5 mL of iodine solution. The
absorbance was measured at 190–900 nm by UVspectrophotometer ((Model UV2, Unicam, England) [6].
Scanning Electron MicroscopyThe sample particle is sprayed onto the surface of
metal plate covered with double-side tape, put into avacuum chamber. The sample is observed in a tool-coated SEM (S-3400N HITACHI) with an acceleratingvoltage of 20 kV.
Emulsion capacity and emulsion stabilitySample gotten in each emulsion was centrifuged
at 2,100 x g for 30 min. The ratio of the height of theemulsified phase to the height of total liquid wasemulsion capacity (%) After that, the homogenizedsample was incubated at 45 °C for 30 min andcentrifuged at 2,100xg for 30 min. The ratio of theheight of the emulsified phase to the height of totalliquid was emulsion stability (%).
Peroxide valueSample (2 mL) was dissolved with 20 mL acetic
acid-chloroform (3:2) solution. 0.25 mL of KI 95% wasadded, incubated shaking water bath 25 °C for 1 minand added 12 mL distilled water. Sample was titratedwith 0.01 N sodium thiosulphate solutions until thecolor changing (transparent). Indicator of soluble starch1% was used.
(S x M x 1000)Peroxide value (meq/L sample) =
mL of sample(11)
where, S = mL of sodium thiosulphate; M = 0.01,concentration of sodium thiosulphate
Anisidine valueSample (0.5 mL) was put in volumetric flask
25 mL and made up to volume with isooctane. Theabsorbance (Ab) of the resulting solutions at 350 nmwas determinate. Besides that 5 mL of each solutionwas pipette into a test tube and reagent also, and thenpara-anisidine solution (para-anisidine dissolved inacetic acid 0.25 g/100 mL solution) was added to eachtube and mixed well. After 10 min, the absorbance (As)of the sample solutions was read. Anisidine value wascalculated:
25 x (1.2 As-Ab)Anisidine value =
mL of sample(12)
Statistical analysisAll experiment will be done in triplicate, and
means ± in standard deviations. Analysis of varianceused ANOVA procedures.

Indones. J. Chem., 2015, 15 (3), 295 - 304
Wiwit Sri Werdi Pratiwi et al.
299
Table 2. RS contents of lintnerized starch and lintnerized-autoclaved starchRS value (%)Time of
hydrolysis (h)Concentration
of Acid (N) Lintnerized-autoclaved Lintnerized1 35.49 ± 0.003 1.24 ± 0.001
1.5 40.32 ± 0.002 1.24 ± 0.00332 40.32 ± 0.002 1.54 ± 0.0011 34.71 ± 0.001 1.24 ± 0.003
1.5 34.71 ± 0.003 0.96 ± 0.00462 40.32 ± 0.001 1.55 ± 0.0011 35.49 ± 0.001 1.10 ± 0.002
1.5 38.68 ± 0.004 0.72 ± 0.002122 40.32 ± 0.001 1.10 ± 0.004
Data were mean and standard deviation of three determinations
RESULT AND DISCUSSION
Resistant Starch Content
Resistant starch (RS) contents of lintnerized starchand lintnerized-autoclaved starch by variation oftime andcitric acid concentration are shown in Table 1. In thepresent study, time variations of hydrolysis did not affecton the amount of RS content whereas RS value wasaffected by concentrations of citric acid. Highest RScontents were obtained of lintnerized starch by citric acidconcentration of 2 N. Previous studies reported thatincreased concentration of hydrochloric acid andfollowed by autoclaving-cooling treatment affected RSvalue [5,7]. In contrast, RS yields were decrease ofvariation of time when sago starch was only hydrolyzedby citric acid without autoclaving-cooling treatment.Partial acid hydrolysis broke down the amylopectinstructure, generating short linear chains so thatincreasing the mobility of molecules. When autoclaving-cooling treatment, these chains rearranged and re-crystallized, forming resistant product which have tightlypacked structure stabilized by hydrogen bonding whileonly partial acid hydrolysis was treated, the resistantproduct cannot be formed. Therefore lintnerized starchgenerated low RS.
Chemical Composition
Chemical compositions (amylose, crude fiber,moisture, protein, fat, ash and carbohydrate) bothhighest RS value of lintnerized starch and lintnerized-autoclaved starch were compared by composition ofnative sago starch and hydrolyzed starch by distilledwater (Table 2). Amylose content of native starchobtained 41.14%. Amylose of lintnerized-autoclavedstarch was highest than other samples. Hydrolyzedstarch by distilled water followed autoclaving withoutcooling resulted lowest amylose content. RS value wasdecrease, after autoclaving [3]. Zhao [5] found effect ofcycle times of autoclaving-cooling of maize starch onRS. Maize starch was dispersed in distilled water then
autoclaved-cooled, increasing RS value. Amylosecontents of corn starch decreased (from 16.9% to13.3%) after hydrolyzed by acid [9]. Aparicio [4]explained the decreased of amylose content duringacid hydrolysis acid that acid attacked the amorphousregions mostly where amylose resides.
Native sago starch had the highest protein and fatthan others. Hydrolysis by citric acid decreasedsignificantly protein and fat contents. Also afterautoclaving-cooling treatment, protein and lipid contentdecreased, because heat treatment can denatureprotein and saponify fat which became soluble. Crudefiber content of lintnerized-autoclaved starch washighest than native and lintnerized starch. It wasrelated with re-associate the structure whengelatinization and retrogradation process. Moisturecontent of most native starches was around 12% atambient temperature and humidity conditions.Lintnerized-autoclaved starch had the lowest moisture(8.33 ± 0.1).
Microstructure Analysis
Scanning electron micrographs of native sagostarch, hydrolyzed starch by distilled water, lintnerizedand lintnerized-autoclaved starch were presented inFig. 1–4. The native starch granules were found to beoval to round shaped with well defined edgescompared other samples. From that figure also lookedthat native starch has the smallest granules. However,as shown in Fig. 2 and 3 the starch granules lost theirsmoothness and structural integrity. Moreover starchgranules of lintnerized starch are largely amorphousstructure. Starch granules of lintnerized-autoclavedwere dense and rigid structure, indicating it formedcrystalline structure after gelatinization andretrogradation process.
UV/Visible Spectra Analysis
UV/visible spectra exhibited the amylose-iodinecomplex at 550–600 nm. From the Fig. 5 there were the

Indones. J. Chem., 2015, 15 (3), 295 - 304
Wiwit Sri Werdi Pratiwi et al.
300
Fig 1. Granule morphology of sago starchFig 2. Granule morphology of hydrolyzed starch bydistilled water
Fig 3. Granule morphology of lintnerized starchFig 4. Granule morphology of lintnerized-autoclavedstarch
Fig 5. UV/visible spectra of native sago starch,hydrolyzed starch by distilled water (DW), lintnerizedstarch (L) and lintnerized-autoclaved starch (LA)
difference absorbance of native starch, hydrolyzedstarch by distilled water, lintnerized starch andlintnerized-autoclaved starch. The highest intensity ofpeak was reached by lintnerized-autoclaved starch
whereas the lowest intensity of peak was reached bylintnerized starch.
Pasting Properties
The pasting properties of native sago starch,hydrolyzed starch by distilled water, lintnerized starch,and lintnerized-autoclaved starch were analyzed byRVA (Table 3). All of the viscosity values (except peaktime and pasting temperature) of modified starchsamples were found to be less than those of the nativestarch. Pasting temperature (°C) of hydrolyzed starchby distilled water was higher than native starch whilepasting temperature of lintnerized starch andlintnerized-autoclaved starch were not detected. Thesevalues are similar with [7], when lintnerized starchusing 1 N hydrochloric acid still showed 87.5 °C ofpasting temperature but lintnerized starch used 1.5 Nand 2 N hydrochloric acid, the pasting temperatures(°C) were not detected. Acid hydrolysis causedreduction in the molecular weight of starch, thus theviscosity decreased significantly.
Indones. J. Chem., 2015, 15 (3), 295 - 304
Wiwit Sri Werdi Pratiwi et al.
301
Table 3. Chemical compositions of native sago starch, hydrolyzed starch by water (DW), lintnerized starch (L) andlintnerized-autoclaved starch (LA)
Amount of content (%)Chemicalcomposition Native DW L LA
Amylose 41.14 ± 0.006 30.14 ± 0.001 36.52 ± 0.001 57.20 ± 0.006Amylopectin 58.86 ± 0.006 69.86 ± 0.001 63.48 ± 0.001 42.8 ± 0.006Carbohydrate 97.33 ± 0.017 95.22± 0.001 97.31 ± 0.006 96.22 ± 0.025Protein 0.58 ± 0.058 0.35 ± 0.001 0.26 ± 0.001 0.15 ± 0.058Fat 1.67 ± 0.006 1.0 ± 0.000 0.83 ± 0.006 0.50 ± 0.000Ash 0.36 ± 0.000 1.44 ± 0.001 0.45 ± 0.002 0.32 ± 0.001Crude fiber 0.06 ± 0.005 1.99 ± 0.035 1.15 ± 0.015 2.5 ± 0.044
1. Data were mean and standard deviation of three determinations.2. Dry basis3. Production of lintnerization starch uses citric acid 2 N for 12 h.4. Production of lintnerization-autoclaved starch uses citric acid 2 N for 12 h, and it is autoclaved at
135 °C for 30 min and cooled 4oC. Autoclaving-cooling treatments were repeated three times atsame temperature and time.
Table 4. Pasting properties of native sago starch, hydrolyzed starch by distilled water, lintnerized starch andlintnerized-autoclaved starch.
SampleProperties
Native DW L LAPeak viscosity (RVU) 403.03 ± 34.95 75.00 ± 7.32 23.33 ± 5.46 15.25 ± 3.44Through (RVU) 146.17 ± 5.48 42.89 ± 1.69 22.17 ± 5.08 11.19 ± 1.48Break down viscosity (RVU) 256.86 ± 35.44 32.11 ± 5.71 1.17 ± 0.38 4.05 ± 4.79Final viscosity (RVU) 199.72 ± 8.07 50.28 ± 3.39 29.39 ± 5.92 13.22 ± 1.72Setback viscosity (RVU) 53.56 ± 5.58 7.39 ± 1.92 7.22 ± 1.71 2.03 ± 0.43Peak time (min) 3.49 ± 0.14 4.62 ± 0.17 6.71 ± 0.08 4.46 ± 2.91Pasting temperature (°C) 50.57 ± 0.39 68.92 ± 3.08 ND ND
Data were mean and standard deviation of three determinations.Native = sago starch; DW = hydrolyzed starch by distilled water; L= lintnerized starch; LA = lintnerized-autoclaved starch
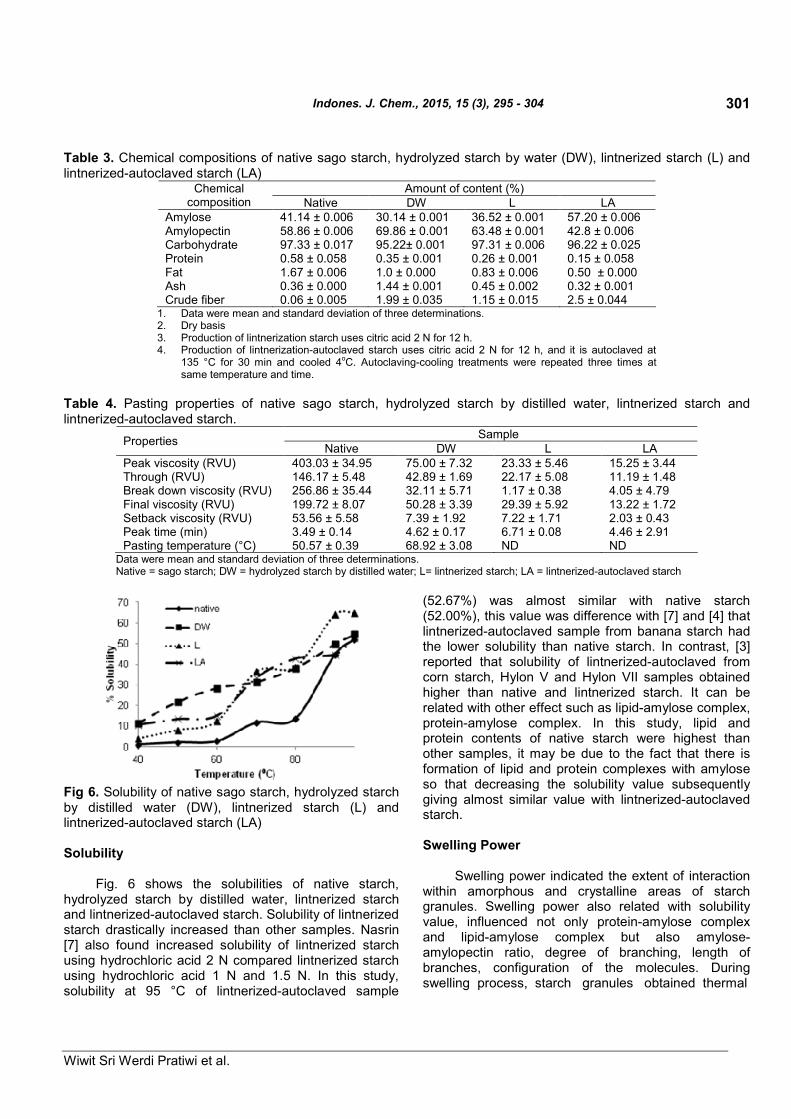
Fig 6. Solubility of native sago starch, hydrolyzed starchby distilled water (DW), lintnerized starch (L) andlintnerized-autoclaved starch (LA)
Solubility
Fig. 6 shows the solubilities of native starch,hydrolyzed starch by distilled water, lintnerized starchand lintnerized-autoclaved starch. Solubility of lintnerizedstarch drastically increased than other samples. Nasrin[7] also found increased solubility of lintnerized starchusing hydrochloric acid 2 N compared lintnerized starchusing hydrochloric acid 1 N and 1.5 N. In this study,solubility at 95 °C of lintnerized-autoclaved sample
(52.67%) was almost similar with native starch(52.00%), this value was difference with [7] and [4] thatlintnerized-autoclaved sample from banana starch hadthe lower solubility than native starch. In contrast, [3]reported that solubility of lintnerized-autoclaved fromcorn starch, Hylon V and Hylon VII samples obtainedhigher than native and lintnerized starch. It can berelated with other effect such as lipid-amylose complex,protein-amylose complex. In this study, lipid andprotein contents of native starch were highest thanother samples, it may be due to the fact that there isformation of lipid and protein complexes with amyloseso that decreasing the solubility value subsequentlygiving almost similar value with lintnerized-autoclavedstarch.
Swelling Power
Swelling power indicated the extent of interactionwithin amorphous and crystalline areas of starchgranules. Swelling power also related with solubilityvalue, influenced not only protein-amylose complexand lipid-amylose complex but also amylose-amylopectin ratio, degree of branching, length ofbranches, configuration of the molecules. Duringswelling process, starch granules obtained thermal

Indones. J. Chem., 2015, 15 (3), 295 - 304
Wiwit Sri Werdi Pratiwi et al.
302
Fig 7. Swelling power of native sago starch, hydrolyzedstarch by distilled water (DW), lintnerized starch (L) andlintnerized-autoclaved starch (LA)
E1= 7.5% emulsifier (casein or SPI) + 7.5% fish oil; E2= 3.75% emulsifier + 3.75%RS + 7.5% fish oil; E3= 3.75% emulsifier + 3.75% Hylon VII + 7.5% fish oil; E4=10% emulsifier + 5% fish oil; E5= 5% SPI + 5% RS + 5% fish oil; E6= 5% HylonVII + 5% fish oil.
Fig 8. Emulsion capacity of RS and Casein comparedEmulsion produced using RS and Soy Protein Isolate
E1= 7.5% emulsifier (casein or SPI) + 7.5% fish oil; E2= 3.75% emulsifier +3.75% RS + 7.5% fish oil; E3= 3.75% emulsifier + 3.75% Hylon VII + 7.5% fishoil; E4= 10% emulsifier + 5% fish oil; E5= 5% SPI + 5% RS + 5% fish oil; E6=5% Hylon VII + 5% fish oil
Fig 9. Emulsion stability of RS and Casein comparedEmulsion produced using RS and Soy Protein Isolate
E1= 7.5% SPI + 7.5% fish oil; E2= 3.75% SPI + 3.75% RS + 7.5% fish oil; E3=3.75% SPI + 3.75% Hylon VII + 7.5% fish oil; E4= 10% SPI + 5% fish oil; E5=5% SPI + 5% RS + 5% fish oil; E6= 5% Hylon VII + 5% fish oil
Fig 10. Peroxide value of emulsions from RS andCasein
energy which looses the intra granular bonds and thengranules absorbed water. The starch granule which hadlow molecular weight of amylose will soluble easily andreleased out of the granules into surrounding medium.By shaking way during process, it can faster break downinternal granular bonds so that it caused enormousswelling [7].
From Fig. 7, the lowest value of swelling power at95 °C was lintnerized-autoclaved starch (12.37%)whereas the highest value at the same temperature wasnative starch (27.62%). Swelling power of lintnerizedstarch was 21.71% and for hydrolyzed starch by distilledwater was reached 16.69%. In theoretically, lintnerized-autoclaved samples presented lower swelling power(lower water retention features) than native andlintnerized starch. Swelling power of lintnerized-autoclaved starch was lower than native and lintnerizedstarches [4,7].
Production Fish Oil Emulsions from RS and CaseinCompared Emulsion Produced Using RS and SoyProtein Isolate (SPI)
Emulsion capacity and emulsion stability valuesEmulsion capacities of fish oil emulsion made
from RS-casein and RS-SPI were showed in Fig. 8.The highest of emulsion capacity made from RS-caseinwas obtained 5.67% (3.75% casein + 3.75 RS + 7.5%fish oil) while the highest that of RS-SPI was obtained11.33% (5% SPI + 5% RS + 5% fish oil). In the presentstudy, when using 3.75% SPI + 3.75 RS + 7.5% fish oil,the result also gave almost similar (11.00%). Evenusing 5% casein + 5% RS + 5% fish oil, the value ofemulsion capacity gave almost similar (5.33%),compared using 3.75% casein + 3.75 RS + 7.5% fishoil. Emulsion capacity made from only emulsifier(casein or SPI) with fish oil showed the lower value.

Indones. J. Chem., 2015, 15 (3), 295 - 304
Wiwit Sri Werdi Pratiwi et al.
303
E1= 7.5% SPI + 7.5% fish oil; E2= 3.75% SPI + 3.75% RS + 7.5% fish oil; E3=3.75% SPI + 3.75% Hylon VII + 7.5% fish oil; E4= 10% SPI + 5% fish oil; E5= 5%SPI + 5% RS + 5% fish oil; E6= 5% Hylon VII + 5% fish oil
Fig 11. Peroxide value of emulsions from RS and SPI
E1= 7.5% casein + 7.5% fish oil; E2= 3.75% casein + 3.75% RS + 7.5% fish oil;E3= 3.75% casein + 3.75% Hylon VII + 7.5% fish oil; E4= 10% casein + 5% fishoil; E5= 5% casein + 5% RS + 5% fish oil; E6= 5% Hylon VII + 5% fish oil
Fig 12. Anisidine value of emulsions from RS andCasein
E1= 7.5% casein + 7.5% fish oil; E2= 3.75% casein + 3.75% RS+ 7.5% fish oil; E3= 3.75% casein + 3.75% Hylon VII + 7.5%fish oil; E4= 10% casein + 5% fish oil; E5= 5% casein + 5% RS+ 5% fish oil; E6= 5% Hylon VII + 5% fish oil
Fig 13. Anisidine value of emulsions from RS and RS
When compared emulsion from Hylon VII and emulsifier(casein or SPI), the emulsion capacity also showedlower value. These results indicated that RS mayimprove emulsifying characteristics. Emulsion capacityvalue of mixture Hylon VII and albumin was gotten 12%,this result was higher than using mixture of Hylon VIIand casein (3.33%), because the Ozturk’s researchdidn’t use the same amount of water in the emulsionsystem, thus the value of emulsion capacity was higherthat this research [3].
Emulsion stabilities (Fig. 9) also exhibited that thehighest value was gotten from mixture of emulsifier(Casein or SPI) and RS, but the higher value of emulsioncapacity was obtained when using mixture of RS andSPI (11.33%) than that of RS and casein (8.00%).However, emulsion made from RS-casein showedincreasing of fish oil load increased emulsion stabilityvalue.
Peroxide and Anisidine Values of RS and CaseinCompared Emulsion Produced Using RS and SoyProtein Isolate
Peroxide value (PV) and anisidine value (AV)were a measure of oxidation or rancidity. PV is anindicator of initial stages of oxidative change, wherebya lipid can be decay or still stable of hydroperoxideconcentration by monitoring the amount ofhydroperoxides as a function of time. Hydroperoxide iscalled as primary oxidation products and unstable, sothat being susceptible to decomposition become thesecondary oxidation products such as aldehydes,ketones, alcohols, and epoxy compounds. One ofMethods for knowing secondary oxidation products wasthrough anisidine value. AV method measures thecontent of aldehydes generated during thedecomposition of hydroperoxide.
From Fig. 10-13, PV and AV of each emulsionincreased with increasing storage time. Peroxidevalues of emulsions made from RS-casein at thestorage time were higher that these of emulsion madefrom RS-casein. Emulsion made from 5% SPI + 5% RS+ 5% fish oil (E2) had the lowest of peroxide value(1.67 meq/L) compared other emulsions (Fig. 10 and11) and also emulsion made from 5% casein + 5% RS+ 5% fish oil (E2) had the lowest of peroxide value(3.67 meq/L) if compared with emulsion made fromonly casein or mixture of casein and Hylon VII. At the9
thdays of storage period, PV of E2 made from
SPI + RS was 6.33 meq/L where as PV of E2 madefrom casein + RS was 6.67 meq/L. RS may contributein this emulsion so that resulting the lowest PV. RSwas high amount of crystallinity than Hylon VII whichwas only as native starch, thus emulsion made fromHylon VII had higher access of oxygen to oxidize the

Indones. J. Chem., 2015, 15 (3), 295 - 304
Wiwit Sri Werdi Pratiwi et al.
304
fish oil than emulsion made from RS. The highest of PVwas gotten emulsion made from 10% casein + 5% oil(25.00 meq/L) and also from 10% SPI + 5% fish oil(24.33meq/L). In this present study, emulsifier (casein orSPI) gave high effect because emulsion made from7.5% emulsifier (casein or SPI) + 7.5% fish oil result PV< 10 meq/L. Nasrin [13] reported that emulsion madeonly 7.5% SPI + 7.5% fish oil were more susceptible tooxidation that made by 10% SPI + 5% oil.
Anisidine values of each emulsion were shown inFig. 12-13. Each emulsion made from RS-casein hadlower value than made from RS-SPI. However, emulsionmade from 5% emulsifier (casein or SPI) + 5% RS+ 5%fish oil was lower value than other emulsion systems. Atthe 0
thday, the AV made from 5% SPI+ 5% Hylon VII+
5% fish oil were the highest value (4.86) compared otheremulsions (AV< 2).
CONCLUSION
Resistant starch type III (RS3) was produced fromsago starch by using variation of time and variation ofcitric acid concentration through lintnerization-autoclaving methods. Variation times were not affectresistant starch production, but variation of citric acidconcentrations resulted different of RS contents.
Physicochemical of RS were compared by nativesago starch, hydrolyzed starch by distilled water andlintnerized starch. Amylose content decreased afterhydrolyzed by distilled water and lintnerization, butincreasing by using lintnerization-autoclaving method.Protein and fat contents decreased after hydrolysis, butcrude fiber content increasing, the highest value wasobtained lintnerized-autoclaved starch. Lintnerized-autoclaved starch had compact and rigid structure thanothers. UV/visible spectra showed the absorbanceintensity decreased after lintnerization while increasedwhen treated with hydrolysis by distilled water andlintnerization-autoclaving method. The RVA viscosity,swelling power values reduced after all treatments. Thelowest of these values were obtained lintnerized-autoclaved starch.
Oil in water emulsions were also analyzed bymixture of RS and casein, compared also using mixtureof RS and SPI, for comparison emulsions were madefrom Hylon VII using emulsifier (casein or SPI). Emulsion
capacity and emulsion stability values were bettergotten using RS-SPI than using RS-casein. Thehighest of emulsion capacity was obtained 11.33% (5%SPI + 5% RS + 5% fish oil. For storage period, thelowest peroxide and anisidine values of mixture RS-SPIand RS-casein were resulted from 5% emulsifier(casein or SPI) + 5% RS + 5% fish oil, and the lowestpercentage of these values was exhibited emulsionusing mixture RS-SPI than RS-casein.
ACKNOWLEDGEMENT
We would like to thank DIKTI, Indonesiagovernment scholarship for providing financialsupports. (Joint Degree Program Sepuluh NopemberInstitute of Technology (ITS) and Asian Institute ofTechnology (AIT), B-18981/Kemsetneg/Setmen/KTLN/KL.00/09/2013).
REFERENCES
1. Lin, J.H., and Chang, Y.H., 2006, J. Agric. FoodChem., 54 (16), 5880–5886.
2. Singhal, R.S., Kennedy, J.F., Gopalakrishnan,S.M., and Kaczmarek, A., 2008, Carbohydr.Polym., 72 (1), 1–20.
3. Ozturk, S., Koksel, H., and Ng, P.K.W., 2011, J.Food Eng., 103 (2), 156–164.
4. Aparicio-Saguilán, A., Flores-Huicochea, E., Tovar,J., García-Suárez, F., Gutiérrez-Meraz, F., andBello-Pérez, L.A., 2005, Starch-Stärke, 57 (9),405–412.
5. Zhao, X.H., and Lin, Y., 2009, Eur. Food Res.Technol., 228 (6), 1015–1021.
6. Anal, A.K., and Singh, H., 2007, Trends Food Sci.Technol., 18, 240–251.
7. Nasrin, T.A.A., and Anal, A.K., 2014, FoodHydrocolloids, 35, 403–409.
8. AOAC, 2002, Official Method of Analysis, TheAssociation of Official Analytical Chemistry, AOAC,Virginia.
9. Xin, J.Y., Wang, Y., Liu, T., Lin, K., Chang, L., andXia, C.G., 2012, Int. J. Mol. Sci., 13 (6), 7226–7236.
10. Sandhu, K.S., Singh, N., and Lim, S.T., 2007, LWTFood Sci. Technol., 40 (9), 1527–1536.