Embed Size (px)
Citation preview
ARTICLE IN PRESS
0022-0248/$ - se
doi:10.1016/j.jcr
�Correspondi
fax: +8177 561
E-mail addre
Journal of Crystal Growth 275 (2005) e983–e987
www.elsevier.com/locate/jcrysgro
Production of transition metal-doped ZnO nanoparticles byusing RF plasma field
Takeshi Satoa,�, Hitoshi Suzukia, Osamu Kidoa, Mami Kurumadaa,Katsuya Kamitsujia, Yuki Kimuraa, Hiromichi Kawasakib,
Satoo Kanekoc, Yoshio Saitod, Chihiro Kaitoa
aDepartment of Nanophysics in Frontier Project, Ritsumeikan University, 1-1-1 Nojihigashi, Kusatsu-shi, Shiga 525-8577, JapanbHitachi Instruments Service Co., Ltd., Shimmachi 6-chome, Ome-shi, Tokyo 198-8611, JapancHitachi Instruments Service Co., Ltd., Yotsuya 4-chome, Shinjuku-ku, Tokyo 160-0004, Japan
dDepartment of Electron and Information Science, Kyoto Institute of Technology, Kyoto 606-8585, Japan
Available online 8 December 2004
Abstract
Transition metals, such as tungsten (W), molybdenum (Mo) and chromium (Cr), were doped into ZnO nanoparticles
using an RF plasma system. The resulting ZnO nanoparticles with the size of 30–50 nm changed from white to yellowish
or to orange depending on the doped transition metals. The doping position of these transition metals in the ZnO
crystal was the same as that determined in a previous paper (J. Crystal Growth 265 (2004) 149). It was found that light
with wavelength shorter than 385 nm can be removed by doping. The morphological change due to doping of elements
was discussed in terms of the difference of ionicity.
r 2004 Elsevier B.V. All rights reserved.
PACS: 32.30.Jc; 52.90.+z; 68.37.Lp; 78.67.Bf
Keywords: A1. Doping; A1. Nanostructures; B1. Oxides; B1. Zinc compounds
1. Introduction
ZnO particles are used in various applications,such as the white pigment of cosmetics, ultraviolet(UV)-cut material and conductive thin film [2–4].
e front matter r 2004 Elsevier B.V. All rights reserve
ysgro.2004.11.152
ng author. Tel.: +8177 561 2709;
3994.
ss: [email protected] (T. Sato).
In the case of using nanoparticle material, it isimportant to control the nanoparticle structure,morphology and size. In a previous study, by theflash evaporation method in a plasma field, wesucceeded in controlling the size of ZnO nanopar-ticles, and found that the characteristic morphol-ogy of ZnO nanoparticles produced in the plasmafield can efficiently filter out UV light withwavelength shorter than 385 nm [5]. However, in
d.
ARTICLE IN PRESS
T. Sato et al. / Journal of Crystal Growth 275 (2005) e983–e987e984
the case of using ZnO nanoparticles in cosmeticmaterial, the recombination radiation near 385 nmis pointed out to be a harmful effect. To eliminatethe effect of this recombination radiation, it isnecessary to dope transition metal into the ZnOnanoparticle. However, doping of the metal intothe nanoparticle cannot be accomplished by theconventional method. Recently, we found that theexternal field of a plasma can be used to dope thetransition metal W into ZnO nanoparticles [1]. Onthe basis of high-resolution transmission electronmicroscopic (HRTEM) images, the doped Watoms were discussed as being in the commensu-rate configuration in the ZnO crystal at thepositions equivalent to those in the cubic anti-fluoride structure [1].
In this study, Mo was doped in the ZnOnanoparticle using the RF plasma. Furthermore,W or Cr atoms were doped into the ZnOnanoparticle by the production method for mas-sive amounts of the functional nanoparticle basedon the flash evaporation method in the plasmafield.
2. Experimental procedure
The work chamber was a glass cylinder with a17 cm inner diameter and 33 cm height coveredwith a stainless-steel plate on the top andconnected to a high-vacuum exhaust through avalve at the bottom. The gas evaporation methodwas introduced in a plasma field. The smokeproduced by the gas evaporation method waspassed through the plasma field between twoplates of 5 cm� 5 cm. The Mo plate was set asthe electrode on the RF-output side. RF plasmawith a frequency of 13.56 MHz was used. The RFplasma was generated between the stainless-steeland Mo electrodes in a gap of 1 cm. The RF poweroutput was 100 W. Zn particles were evaporated ina mixture gas of argon (9.75T) and oxygen(0.25 T) passed through the plasma field. Sinceoxygen gas was included in the chamber, thesurface of the Mo plate will be oxidized in theplasma field. The vapor pressure of oxide is higherthan that of the metal. Therefore, the Mo oxidevapor was incorporated into the oxidation field of
Zn particles in the plasma field. The massproduction of particles was carried out by supply-ing the Zn powder on a heated boat at the top ofthe plasma (flash evaporation).
The resulting specimens were examined byelectron microscopy (Hitachi H-7100) andHRTEM (Hitachi H-9000NAR). The existenceof transition metal atoms was also checked usingan energy-dispersive X-ray (EDX) spectrometer(Horiba EMAX-5370) attached to the H-7100electron microscope. The collected specimens werealso optically characterized using UV-visible lighttransmittance (Hitachi U-3300).
3. Results and discussion
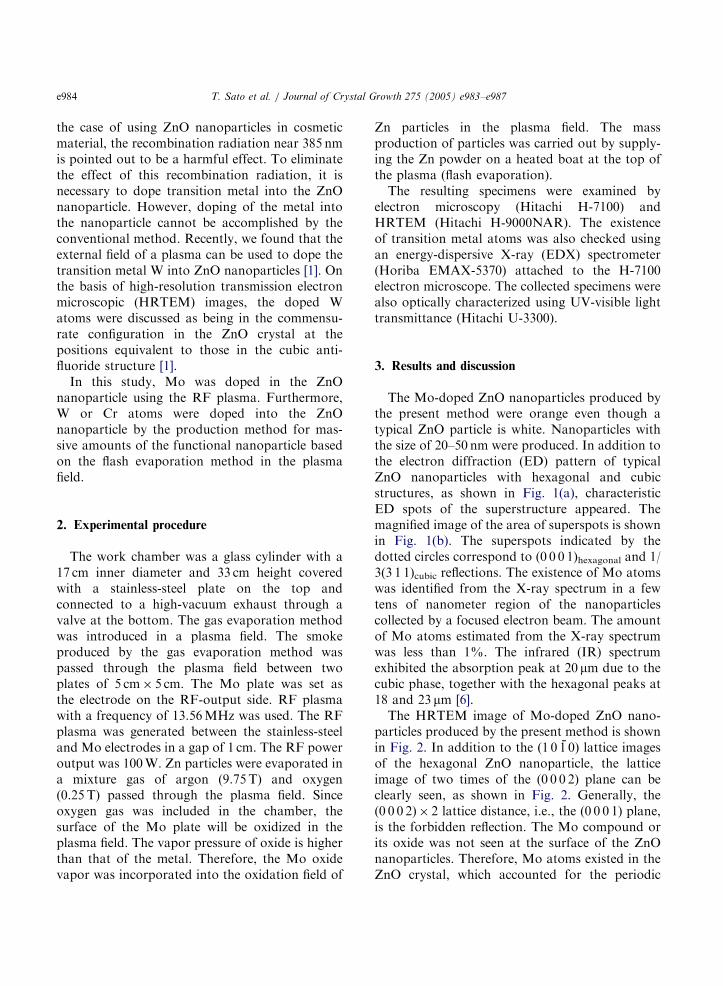
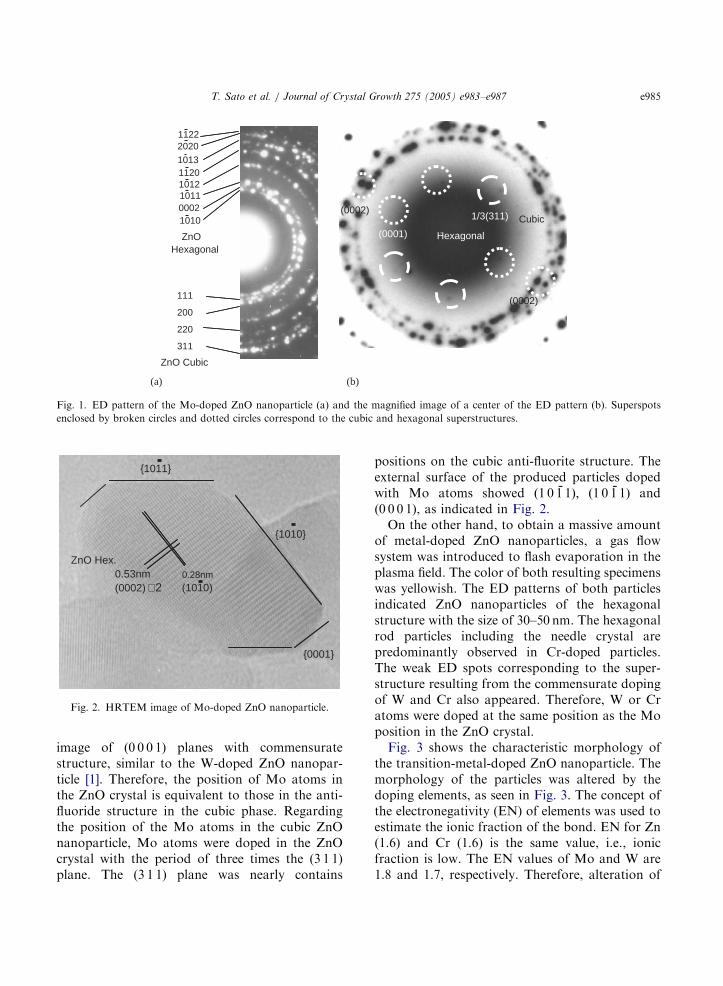
The Mo-doped ZnO nanoparticles produced bythe present method were orange even though atypical ZnO particle is white. Nanoparticles withthe size of 20–50 nm were produced. In addition tothe electron diffraction (ED) pattern of typicalZnO nanoparticles with hexagonal and cubicstructures, as shown in Fig. 1(a), characteristicED spots of the superstructure appeared. Themagnified image of the area of superspots is shownin Fig. 1(b). The superspots indicated by thedotted circles correspond to (0 0 0 1)hexagonal and 1/3(3 1 1)cubic reflections. The existence of Mo atomswas identified from the X-ray spectrum in a fewtens of nanometer region of the nanoparticlescollected by a focused electron beam. The amountof Mo atoms estimated from the X-ray spectrumwas less than 1%. The infrared (IR) spectrumexhibited the absorption peak at 20 mm due to thecubic phase, together with the hexagonal peaks at18 and 23 mm [6].
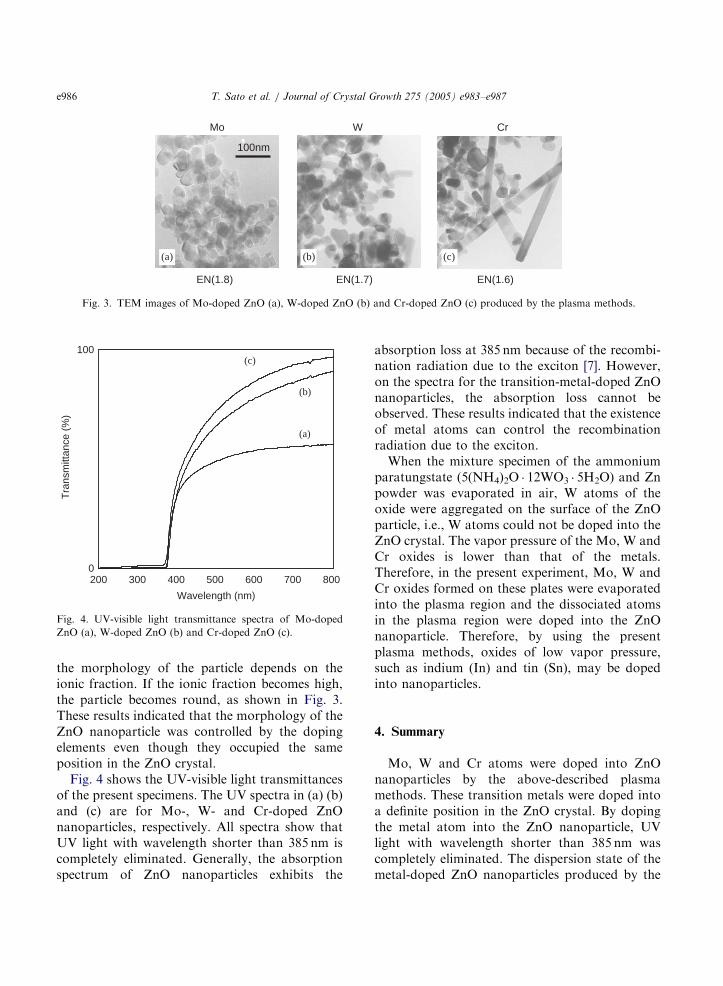
The HRTEM image of Mo-doped ZnO nano-particles produced by the present method is shownin Fig. 2. In addition to the ð1 0 1̄ 0Þ lattice imagesof the hexagonal ZnO nanoparticle, the latticeimage of two times of the (0 0 0 2) plane can beclearly seen, as shown in Fig. 2. Generally, the(0 0 0 2)� 2 lattice distance, i.e., the (0 0 0 1) plane,is the forbidden reflection. The Mo compound orits oxide was not seen at the surface of the ZnOnanoparticles. Therefore, Mo atoms existed in theZnO crystal, which accounted for the periodic
ARTICLE IN PRESS
Hexagonal
ZnO Cubic
ZnOHexagonal
1122
111
200
220
311
1/3(311) Cubic
(0001)
(0002)
2020
101311201012101100021010
(0002)
(a) (b)
Fig. 1. ED pattern of the Mo-doped ZnO nanoparticle (a) and the magnified image of a center of the ED pattern (b). Superspots
enclosed by broken circles and dotted circles correspond to the cubic and hexagonal superstructures.
0.53nm(0002) × 2
ZnO Hex.
(1010)0.28nm
{1010}
{0001}
{1011}
Fig. 2. HRTEM image of Mo-doped ZnO nanoparticle.
T. Sato et al. / Journal of Crystal Growth 275 (2005) e983–e987 e985
image of (0 0 0 1) planes with commensuratestructure, similar to the W-doped ZnO nanopar-ticle [1]. Therefore, the position of Mo atoms inthe ZnO crystal is equivalent to those in the anti-fluoride structure in the cubic phase. Regardingthe position of the Mo atoms in the cubic ZnOnanoparticle, Mo atoms were doped in the ZnOcrystal with the period of three times the (3 1 1)plane. The (3 1 1) plane was nearly contains
positions on the cubic anti-fluorite structure. Theexternal surface of the produced particles dopedwith Mo atoms showed ð1 0 1̄ 1Þ; ð1 0 1̄ 1Þ and(0 0 0 1), as indicated in Fig. 2.
On the other hand, to obtain a massive amountof metal-doped ZnO nanoparticles, a gas flowsystem was introduced to flash evaporation in theplasma field. The color of both resulting specimenswas yellowish. The ED patterns of both particlesindicated ZnO nanoparticles of the hexagonalstructure with the size of 30–50 nm. The hexagonalrod particles including the needle crystal arepredominantly observed in Cr-doped particles.The weak ED spots corresponding to the super-structure resulting from the commensurate dopingof W and Cr also appeared. Therefore, W or Cratoms were doped at the same position as the Moposition in the ZnO crystal.
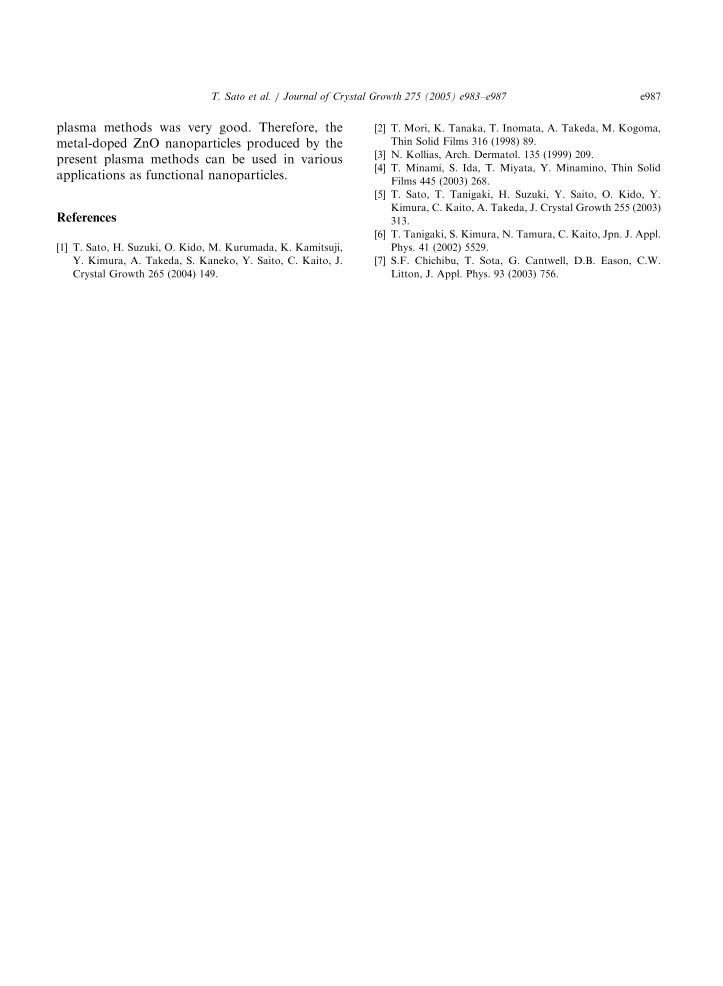
Fig. 3 shows the characteristic morphology ofthe transition-metal-doped ZnO nanoparticle. Themorphology of the particles was altered by thedoping elements, as seen in Fig. 3. The concept ofthe electronegativity (EN) of elements was used toestimate the ionic fraction of the bond. EN for Zn(1.6) and Cr (1.6) is the same value, i.e., ionicfraction is low. The EN values of Mo and W are1.8 and 1.7, respectively. Therefore, alteration of
ARTICLE IN PRESS
100nm
EN(1.8) EN(1.7) EN(1.6)
Mo W Cr
(a) (b) (c)
Fig. 3. TEM images of Mo-doped ZnO (a), W-doped ZnO (b) and Cr-doped ZnO (c) produced by the plasma methods.
Tra
nsm
ittan
ce (
%)
100
0200 300 400 500 600 700 800
Wavelength (nm)
(c)
(b)
(a)
Fig. 4. UV-visible light transmittance spectra of Mo-doped
ZnO (a), W-doped ZnO (b) and Cr-doped ZnO (c).
T. Sato et al. / Journal of Crystal Growth 275 (2005) e983–e987e986
the morphology of the particle depends on theionic fraction. If the ionic fraction becomes high,the particle becomes round, as shown in Fig. 3.These results indicated that the morphology of theZnO nanoparticle was controlled by the dopingelements even though they occupied the sameposition in the ZnO crystal.
Fig. 4 shows the UV-visible light transmittancesof the present specimens. The UV spectra in (a) (b)and (c) are for Mo-, W- and Cr-doped ZnOnanoparticles, respectively. All spectra show thatUV light with wavelength shorter than 385 nm iscompletely eliminated. Generally, the absorptionspectrum of ZnO nanoparticles exhibits the
absorption loss at 385 nm because of the recombi-nation radiation due to the exciton [7]. However,on the spectra for the transition-metal-doped ZnOnanoparticles, the absorption loss cannot beobserved. These results indicated that the existenceof metal atoms can control the recombinationradiation due to the exciton.
When the mixture specimen of the ammoniumparatungstate (5(NH4)2O � 12WO3 � 5H2O) and Znpowder was evaporated in air, W atoms of theoxide were aggregated on the surface of the ZnOparticle, i.e., W atoms could not be doped into theZnO crystal. The vapor pressure of the Mo, W andCr oxides is lower than that of the metals.Therefore, in the present experiment, Mo, W andCr oxides formed on these plates were evaporatedinto the plasma region and the dissociated atomsin the plasma region were doped into the ZnOnanoparticle. Therefore, by using the presentplasma methods, oxides of low vapor pressure,such as indium (In) and tin (Sn), may be dopedinto nanoparticles.
4. Summary
Mo, W and Cr atoms were doped into ZnOnanoparticles by the above-described plasmamethods. These transition metals were doped intoa definite position in the ZnO crystal. By dopingthe metal atom into the ZnO nanoparticle, UVlight with wavelength shorter than 385 nm wascompletely eliminated. The dispersion state of themetal-doped ZnO nanoparticles produced by the
ARTICLE IN PRESS
T. Sato et al. / Journal of Crystal Growth 275 (2005) e983–e987 e987
plasma methods was very good. Therefore, themetal-doped ZnO nanoparticles produced by thepresent plasma methods can be used in variousapplications as functional nanoparticles.
References
[1] T. Sato, H. Suzuki, O. Kido, M. Kurumada, K. Kamitsuji,
Y. Kimura, A. Takeda, S. Kaneko, Y. Saito, C. Kaito, J.
Crystal Growth 265 (2004) 149.
[2] T. Mori, K. Tanaka, T. Inomata, A. Takeda, M. Kogoma,
Thin Solid Films 316 (1998) 89.
[3] N. Kollias, Arch. Dermatol. 135 (1999) 209.
[4] T. Minami, S. Ida, T. Miyata, Y. Minamino, Thin Solid
Films 445 (2003) 268.
[5] T. Sato, T. Tanigaki, H. Suzuki, Y. Saito, O. Kido, Y.
Kimura, C. Kaito, A. Takeda, J. Crystal Growth 255 (2003)
313.
[6] T. Tanigaki, S. Kimura, N. Tamura, C. Kaito, Jpn. J. Appl.
Phys. 41 (2002) 5529.
[7] S.F. Chichibu, T. Sota, G. Cantwell, D.B. Eason, C.W.
Litton, J. Appl. Phys. 93 (2003) 756.


![NITRIC ACID ACTIVATION OF La-DOPED ZnO PHOTOCATALYST … · obtain N-ZnO powders. In our previous paper [15], we reported the superior performance of La-doped ZnO, compared to pure](https://img.pdfslide.net/doc/110x75/5ea2346ecddbf53ffe654432/nitric-acid-activation-of-la-doped-zno-photocatalyst-obtain-n-zno-powders-in-our.jpg)