Embed Size (px)
Citation preview


Production Practices and Quality Assessment of Food Crops
Volume 3

Production Practices andQuality Assessment of Food CropsVolume 3Quality Handling and Evaluation
Edited by
Ramdane DrisWorld Food Ltd.,Helsinki, Finland
and
S. Mohan JainFAO/IAEA Joint Division,International Atomic Energy Agency,Vienna, Austria
KLUWER ACADEMIC PUBLISHERSNEW YORK, BOSTON, DORDRECHT, LONDON, MOSCOW

eBook ISBN: 1-4020-2534-3Print ISBN: 1-4020-1700-6
©2004 Springer Science + Business Media, Inc.
Print ©2004 Kluwer Academic Publishers
All rights reserved
No part of this eBook may be reproduced or transmitted in any form or by any means, electronic,mechanical, recording, or otherwise, without written consent from the Publisher
Created in the United States of America
Visit Springer's eBookstore at: http://www.ebooks.kluweronline.comand the Springer Global Website Online at: http://www.springeronline.com
Dordrecht

CONTENTS
Preface
List of Authors
Enzymes and Quality Factors of Fruits and Vegetables Pankaj Kumar Bhowmik and Ramdane Dris
Volatile Flavours in Strawberries: A Description of the Components,and How to Analyse Them
Randi Utre Holt
Methods to Evaluate the Antioxidant ActivityVolker Böhm and Karin Schlesier
Essential Oil Drugs – Terpene Composition of Aromatic HerbsJens Rohloff
Integral Handling of BananaLourdes Yañez, Miguel Armenta and Efrain Mercado, Elhadi M. Yahiaand Porfirio Guttierrez
Economics and Organisation of Horticultural Postharvest ProductionZ. Kiss L., J. Bálint, M. Holló and M. Juhász
Handling Machinery and Damage Inflicted to the ProductF. Javier García-Ramos, Constantino Valero and Margarita Ruiz-Altisent
Mechanical Damage During Fruit Post-Harvest Handling: Technical andPhysiological Implications
Domingo Martinez-Romero, Maria Serrano, Angel Carbonell, Salvador Castillo, *Fernando Riquelme and Daniel Valero
Harvest and Postharvest Conditions for Apples and PearsCelia E. Benitez and Norma A. Pensel
Rapid Quality Evaluation Techniques of Horticultural CropsHidekazu Ito
Table Grape Postharvest Management and Safety IssuesAlfonso A. Gardea, Tania Carvallo, Bethzabet Sastré, Miguel A. Martínez-Téllez, Gloria M. Yépiz-Plascencia, Martha Díaz-Cinco and J. Antonio Orozco
vii–viii
ix–x
1–25
27–54
55–71
73–128
129–168
169–198
199–231
233–252
253–293
295–305
307–320
v

Fruit Postharvest Technology: Instrumental Measurement of Ripeness andQuality
Pilar Barreiro, Margarita Ruiz-Altisent, Constantino Valero and JavierGarcía-Ramos
Developmental Changes During Strawberry Fruit Ripening and Physico-Chemical Changes During Postharvest Storage
Wilfried Schwab and Thomas Raab
Processing of Horticultural Crops in the TropicsR. Madakadze, M. Masarirambi and E. Nyakudya
Quality Dynamics and Quality Assurance of Fresh Fruits and Vegetablesin Pre- and Postharvest
Susanne Huyskens-Keil and Monika Schreiner
Modification of Fruit Ripening by Genetic TransformationLech Michalczuk
Quality of Equilibrium Modified Atmosphere Packaged (EMAP) Fresh-Cut Vegetables
Liesbeth Jacxsens, Frank Devlieghere and Johan Debevere
vi Contents
321–340
341–369
371–399
401–449
451–472
473–523
PREFACE
Food quality is becoming an ever-increasing important feature for consumers andit is well known that some food crops are perishable and have a very short shelfand storage life. An effective quality assurance system throughout the handling stepsbetween harvest and retail display is essential to provide a consistently good qualitysupply of fresh food crops to the consumers and to protect the reputation of agiven marketing label. Food manufacturing companies all over the world are increas-ingly focussing on quality aspect of food including minimally processed food tomeet consumer demands for fresh-like and healthy food products. To investigate andcontrol quality, one must be able to measure quality-related attributes. Quality ofproduce encompasses sensory attributes, nutritive values, chemical constituents,mechanical properties, functional properties and defects. Successful postharvesthandling of crops requires careful coordination and integration of the various stepsfrom harvest operations to consumer level in order to maintain the initial productquality. Maturity at harvest is one feature of quality of perishable products, it hasgreat influence on their postharvest behavior during marketing. Safety assurance canbe part of quality assurance and its focus on minimizing chemical and microbialcontamination during production, harvesting, and postharvest handling of intactand fresh-cut of commodities. Essentially, electromagnetic (often optical) proper-ties relate to appearance, mechanical properties to texture, and chemical propertiesto flavor (taste and aroma). Rapid quantitative techniques to prepare food for analysisare necessary to optimize routine quality testing of foods during processing andstorage. At the same time the new mild preservation techniques used for producingminimally processed products can not ensure a very safe product. Therefore, addi-tional antimicrobial hurdles are necessary.
Many kinds of storing methods have been developed to improve the quality lifeof these commodities. The storability of some perishable commodities can beextended by the use of controlled atmosphere (CA) or modified atmosphere pack-aging (MAP) storages to enhance the shelf-life. However, the micro-atmosphereinside the package around the product is not actively controlled, but the O2 andCO2 concentrations are obtained by the combination of the respiration process ofthe produce and transport of these gases through the packaging film.
Eighteen chapters are included in this book, which are: Enzymes and QualityFactors of Fruits and Vegetables; Volatile Flavours in Strawberries: A Descriptionof The Components, and How to Analyse Them; Methods to Evaluate theAntioxidant Activity; Essential Oil Drugs-Terpene Composition of Aromatic Herbs;Fruit and Vegetables Harvesting Systems; Integral Handling of Banana; Economicsand Organisation of Horticultural Postharvest; Production; Handling Machineryand Damage inflicted to the Product; Mechanical Damage During Fruit Post-HarvestHandling: Technical and Physiological Implications; Harvest and PostharvestConditions for apples and Pears; Rapid quality evaluation techniques of horticul-tural crops; Table Grape Postharvest Management and Safety Issues; FruitPostharvest Technology: Instrumental Measurement of Ripeness and Quality;Developmental Changes During Strawberry Fruit Ripening and Physico-Chemical
vii

Changes During Postharvest Storage; Processing of horticultural Crops in theTropics; Quality Dynamics and Quality Assurance of Fresh Fruits and Vegetablesin Pre- and Postharvest; Modification of Fruit Ripening by Genetic Transformation;Quality of Equilibrium Modified Atmosphere Packaged (EMAP) Fresh-CutVegetables.
This book, covers various aspects of quality handling and assessment, includinghandling parameters, quality evaluation, CA and MAP storage conditions in abroad sense. It emphasises on developing better methods of monitoring qualityand safety attributes of fresh produce as part of a quality assurance system andquality assessment and maintenance. To meet the changing demands for quality,availability, cost, appearance and service the actors in the supply chain need tocooperate.
The editors wish to express their sincere gratitude to all authors for their valuablecontributions. We are grateful to Kluwer Academic Publishers for giving us an oppor-tunity to compile this book.
Ramdane Dris Ph.D. Shri Mohan Jain Ph.D.World Food Ltd. Plant Breeding and Genetics SectionMeri-Rastilantie 3C Joint FAO/IAEA Division FIN-00980 Helsinki Finland International Atomic Energy AgencyE-mail: [email protected] Wagramer Strasse [email protected] P.O. Box 200
A-1400 Vienna, AustriaE-mail: [email protected]
viii Preface
LIST OF AUTHORS
Pankaj Kumar Bhowmik, Faculty of Agriculture, Kagawa University, Miki-Cho,Kagawa 761-0701, Japan.
Ramdane Dris, World Food Ltd., Meri-Rastilantie 3 C, 00980 Helsinki, Finland.Holt, Randi Utne, Faculty of Technology, Sør-Trøndelag University College,
Trondheim, Norway.Volker Böhm and Karin Schlesier, Friedrich Schiller University Jena, Institute of
Nutrition, 07743 Jena, Germany.Jens Rohloff, The Plant Biocentre, Department of Biology, Faculty of Natural
Sciences and Technology, Norwegian University of Science and Technology(NTNU), 7491 Trondheim, Norway.
Margarita Ruiz-Altisent, Jaime Ortiz-Cañavate and Constantino Valero, Dept.Agricultural Engineering, Universidad Politécnica de Madrid, Spain.
Lourdes Yañez, Miguel Armenta and Efrain Mercado, Universidad AutónomaMetropolitana, México, D.F.
Elhadi M. Yahia, Facultad de Química, Universidad Autónoma de Querétaro, 6010,Querétaro, México.
Porfirio Guttierrez, Instituto Tecnológico de Tepic, Nayarit, México.Z. Kiss, L., Bálint, J., Holló, M. and Juhász, M., Szent Istvan University, Faculty
of Horticultural Sciences, Department of Farm Management and Marketing,Budapest, Hungary.
F. Javier García-Ramos, Constantino Valero and Margarita Ruiz-Altisent, PhysicalProperties Laboratory, Polytechnic University of Madrid, Av. Complutense s/nEdif. Motores, 28040 Madrid, Spain.
Domingo Martinez-Romero, Maria Serrano, Angel Carbonell, Salvador Castillo,Fernando Riquelme and Daniel Valero, Miguel Hernandez University, Ctra.Beniel, Km 3.2, 03312 Orihuela, Alicante, Spain. CEBAS-CSIC, Campus deEspinardo, 30100 Murcia, Spain.
Celia E. Benitez and Norma A. Pensel, Instituto de Tecnología de Alimentos,INTA, CC.77-B1708WAB-Morón, Bs.As., Argentina.
Hidekazu Ito, National Institute of Vegetable and Tea Science (NIVTS), Kusawa,Ano, Age, Mie 514-2392 Japan.
Alfonso A. Gardea, Tania Carvallo, Bethzabet Sastré, Miguel A. Martínez-Téllez,Gloria M. Yépiz-Plascencia, Martha Díaz-Cinco and J. Antonio Orozco, Centrode Investigación en Alimentación y Desarrollo A.C., P.O. Box 781, Cuauhtémoc,Chihuahua, México C.P. 31570, Mexico.
Pilar Barreiro, Margarita Ruiz-Altisent, Constantino Valero and Javier García-Ramos,Physical Properties Laboratory, LPF. Dept. de Ingeniería Rural – ETSIA,Universidad Politécnica de Madrid, Spain.
Wilfried Schwab and Thomas Raab, Lehrstuhl für Lebensmittelchemie, UniversitätWürzburg, Am Hubland, 97074 Würzburg, Germany.
R. Madakadze and M. Masarirambi, Department of Crop Science, Engineering,University of Zimbabwe, PO Box MP167, Mount Pleasant, Harare, Zimbabwe.
ix

E. Nyakudya, Department of Soil Science and Agricultural Engineering, Engineering,University of Zimbabwe, PO Box MP167, Mount Pleasant, Harare, Zimbabwe.
Huyskens-Keil, Susanne, Humboldt-University Berlin, Institute for HorticulturalSciences, Section Quality Dynamics/Postharvest Physiology, Lentzeallee 75, D-14195 Berlin, Germany.
Monika Schreiner, Institute of Vegetable and Ornamental Crops Großbeeren/Erfurte.V., Theodor-Echtermeyer-Weg 1, D-14979 Großbeeren, Germany.
Lech Michalczuk, Research Institute of Pomology and Floriculture, 96-100,Skierniewice, Poland. e-mail: [email protected].
Liesbeth Jacxsens, Frank Devlieghere and Johan Debevere, Laboratory of FoodMicrobiology and Food Preservation, Faculty of Agricultural and AppliedBiological Sciences, University of Ghent, Coupure links 653, 9000 Gent, Belgium.
x List of Authors

ENZYMES AND QUALITY FACTORS OF FRUITS ANDVEGETABLES
PANKAJ KUMAR BHOWMIKFaculty of Agriculture, Kagawa University, Miki-Cho, Kagawa 761-0701, Japan
RAMDANE DRISWorld Food Ltd. Meri-Rastilantie 3 C, 00980 Helsinki. Finland.E-mail: [email protected]; www.world-food.net
1. INTRODUCTION
In harvested plant products, quality is the composite of those characteristics thatdifferentiate individual units of the product and have significance in determining theunits’ degree of acceptability to the user (Arthey, 1975; Kramer and Twigg, 1970).The degree of acceptability of fresh fruits and vegetables and their products is acombination of attributes, properties, or appearances that give each commodity valuein terms of human food. The relative importance of each quality factors dependsupon the commodity and its intended use and varies among producers, handlers, andconsumers. To producers a given commodity must have high yield and good appear-ance, must be easy to harvest, and must withstand long distance shipping to markets.Appearance quality, firmness and shelf life are important from the point of viewof wholesale and retail marketers. Consumers judge quality of fresh fruits andvegetables on the basis of appearance and firmness at the time of initial purchase.Subsequent purchases depend upon the consumer’s satisfaction in terms of flavorquality of the product (Kader, 1999). But fruits and vegetables quality declinesrapidly after harvest, especially if proper postharvest handling procedures are notfollowed. Changes in color, texture, nutrition, and flavor all affect the market qualityof the fruits and vegetables; meanwhile quality of processed products using superiorfruits and vegetables is reduced. Any attribute or characteristic that make fruit attrac-tive and pleasant to eat adds to its desirable quality. Certain fruits including grapesand citrus fruits attain optimal quality at the time of harvest and undergo deterio-rative changes during storage. Postharvest techniques cannot further improve thequality of these fruits. However, other fruits including pears and bananas go throughthe ripening process during the postharvest period and improve in eating qualitybecause of an increase in juiciness, development of flavor and conversion of starchto sugars. Quality of these fruits declines rapidly after they are fully ripe. Thus,the postharvest behavior and quality retention vary from one commodity to another(Wang, 1999).
Changes that cause quality deterioration after harvest include high respirationrate, high metabolic activity, moisture losses, softening, yellowing, and/or loss offlavor and nutritional value. Factors that accelerate quality deterioration are mechan-ical injury, physical disorders, and pathological diseases. Biochemical changesunderlying postharvest deterioration in quality encompass oxidative damage and free
R. Dris and S. M. Jain (eds.), Production Practices and Quality Assessment of Food Crops,
© 2004 Kluwer Academic Publishers. Printed in the Netherlands.
1
Vol. 3, “Quality Handling and Evaluation”, pp. 1–25.

radical injury, membrane lipid per-oxidation, and cell wall degradation (Wang, 1999).Enzymes in fruits and vegetables are mainly responsible for these unfavorablechanges. A number of enzymes are associated with numerous biochemical andphysiological processes that alter the color, flavor, aroma, texture and other qualityfactors of fruits and vegetables. Deterioration of all these quality factors beginsafter the fruits and vegetables reach maturity and are harvested and stored. Butone of these factors is often more important than others. In tomatoes, it is soft-ening caused by the pectic enzymes. In fruits, such as peaches, apples and avocadoes,it is browning due to polyphenol oxidase. In green leafy vegetables it is and aromadeterioration, but may include discoloration. For better harvest and quality evalu-ation of fruits and vegetables it is important to understand the biochemical andphysiological processes and the associated enzymes that alter these quality factors.This chapter covers the major quality factors of fruits and vegetables, looks atthe biochemical and physiological changes that occur after harvest, and outlinesa number of the important enzymes that accelerate these postharvest qualityalterations.
2. QUALITY COMPONENTS AND RESPONSIBLE ENZYMES OFFRESH FRUITS AND VEGETABLES
The various components of quality and the responsible enzymes for quality dete-rioration listed in Table 1 are used to evaluate commodities. The relative importanceof each quality factor depends upon the commodity and its intended use. It isimportant to define the interrelationships among each commodity’s quality com-ponents and to correlate with responsible enzymes. This information is essentialspecifically for identifying optimal postharvest handling procedures to providehigh-quality fruits and vegetables for the consumer. In most commodities, therate of deterioration in nutritional quality (especially vitamin C content) is fasterthan that in flavour quality, which in turn is lost faster than textural quality andappearance quality. Thus, the postharvest life of a commodity based on appear-ance quality is often longer than its postharvest life based on maintenance of goodflavour.
3. COLOR AS A QUALITY FACTOR
The color of an agricultural product probably contributes more to the assessmentof quality than any other single factor. Consumers have developed distinct corre-lations between color and the overall quality of specific products. A number ofpreharvest and postharvest factors including enzymes can affect the color of har-vested products. The most important enzyme responsible for alteration of color infruits and vegetables is polyphenol oxidase (EC 1.10.3.1, PPO).
2 P. K. Bhowmik and R. Dris

3.1. Polyphenol oxidase and enzymatic browning
Polyphenol oxidase is a generic term for the group of enzymes that catalyze theoxidation of phenolic compounds to produce a brown color in vegetables andfruits (Whitaker and Lee, 1995). This copper enzyme catalyses the oxidation of o-diphenols to o-quinones and the o-quinones condensed spontaneously with othero-quinones and with many constituents of foods such as proteins, reducing sugars,etc. to form high molecular weight polymers which precipitate yielding the brown,red, or dark pigments characteristic of browned fruits and vegetables tissues(McEvily et al., 1992).
Catechol + oxygen ------ PPO ------> benzoquinone + water ------> melanins
Undesirable enzymatic browning caused by PPO is of great concern, as theproducts are less acceptable to consumers. The enzymes are often referred to as PPO,catechol oxidase, phenolase, tyrosinase, and cresolase. A survey of recent reportson the enzyme in fruits and vegetables and their products adds several new speciesto an already long list of those previously reported (Mayer et al., 1979, 1987).The recent literature abounds with more studies on PPO in deciduous fruits, grapes,potatoes, avocados, olives, bananas, mangoes and mushrooms. The enzymes areabundant in tubers, storage roots, and fruits. High levels of enzyme are usually foundin tissues that are also reach in phenolic compounds. The levels of PPO and itssubstrates often change markedly during the lifecycle of the plant particularly infruits and vegetables. Multiple forms of PPO are invariably found in extracts of freshfruits and vegetables.
Enzymes and Quality Factors of Fruits and Vegetables 3
Table 1. Quality components and responsible enzymes of fresh fruits and vegetables.
Main factors Components Responsible enzymes
Appearance Color Polyphenol oxidase
Texture Firmness, hardness, softness β-Galactosidase,Polygalacturonase,Pectin methyl esterase,
Toughness, fibrousness CellulasePhenylalanineammonia lyase,Peroxidase
Flavour Off-flavours Peroxidase,Off-odours Lypoxygenase
Nutritional value Carbohydrates Invertase,Sucrose synthase,Sucrosephosphate synthase,Glutamine synthetase
ProteinsLipidsVitaminsMinerals

Apples are one of the most common fruits worldwide and hence there is con-siderable interest in apple PPO as a cause of excessive enzymatic browning. It isconsidered that the polyphenols in apple are oxidized to their corresponding quinonesby polyphenol oxidase and that these quinones are then polymerized with otherquinones and amines to form brown pigments. In mature apple, polyphenol con-centration, PPO activity, or both determine the degree of enzymatic browning. Itdepends on the variety of apple that either substrate or PPO activity is a determi-nant of enzymatic browning (CoSeteng and Lee, 1987). Western blotting analysishas shown that various cultivars of apple have the same PPO. The PPO was mainlylocated around the core of the fruit, shown by the nitrocellulose tissue print method.This localization of PPO corresponded to intense browning around the core. Murataet al. (1995) found that immature apple turned strongly and uniformly brown,while the mature one browned weakly and only around the core. Both polyphenolcontent and PPO activity in the immature apple were much higher than those inthe mature apple, and active PPO was mainly localized near the core in the matureapple, while it was uniformly distributed in immature apple.
Pear fruits always have a higher incidence of browning in the core than in theflesh. Furthermore, flesh browning has never been observed without prior to corebrowning, which suggests that browning begins in the core and then processesoutwards. Thus symptoms are similar to those core breakdown (CB) or brownheart (BH) in various pear cultivars as described by Porrit et al. (1982). Browningof the core and flesh areas depended on harvest date – the earlier the picking date,the higher the browning. In contrast to browning potential, which declined steadilyduring storage, PPO activity in flesh increased. No difference was found betweenthe two storage atmospheres (controlled atmosphere and ultra low oxygen atmos-phere). ULO-stored fruits showed the higher incidence in internal disorders. PPOactivity was clearly inhibited in BH-damaged fruit but transiently increased in CB-damaged fruits. These results indicated that enzymatic browning and PPO are notdirectly correlated with the BH and CB disorders and not directly involved in theirformation (Laarigaudiere et al., 1998).
In potato, PPO is the major cause of enzymatic browning (Hunt et al., 1993). PPOis particularly apparent in potato tubers, where the enzyme is localized withinamyloplasts of the tuber cells. Thygesen et al. (1995) reported that PPO activityper tuber continued to increase throughout tuber development but was highest ona fresh weight basis in developing tubers. PPO activity was greatest at the tuberexterior, including the skin and cortex tissue 1 to 2 mm beneath the skin. A possibleapproach to reducing PPO activity and the consequent enzymatic browning reac-tions in potatoes is to characterize and inactive the genes coding for PPO. Suchinactivation was achieved by generating antisense RNA specific for target enzymes(Hunt et al., 1993). Less PPO activity was observed at the lower temperature. Thegreater the activity, the greater the transformation of monomeric polyphenolsto polymeric ones. The higher PPO activity at the higher storage temperature mayaccount for the greater discoloration due to transformation of polyphenols topolymeric pigments at that temperature. Matheis et al. (1987) found a correlationbetween tyrosine, the activity of PPO, and the rate of browning in different potatovarieties.
4 P. K. Bhowmik and R. Dris

Browning is one of the main causes of quality loss during the postharvest storageof head lettuce and minimally processed lettuce (Iiker et al., 1977; Mateos et al.,1993). Extensive investigations have been conducted to understand the biochem-ical basis of lettuce browning and to find physical or chemical treatments to preventthese discolorations (Hyodo et al., 1978; Fujita et al., 1991). Wounding generallyinduces increased phenylalanine ammonia-lyase (PAL, EC 4.3.1.5) activity andincreased phenolic metabolism in many plant tissues. In addition, wounding inducescellular departmentalization, which allows mixing of phenolic substrates and PPO,leading to the development of browning (Mayer, 1987). Lettuce butt discolorationis a type of browning induced by wounding. Harvesting lettuce entails woundingthe stem end, inducing all the above-mentioned changes leading to the formationof brown pigments and butt discoloration. Similar changes also occur in iceberglettuce midribs during the storage of minimally processed cut lettuce (Mayer,1987). Stem tissue near the harvesting cut exhibited increased PAL activity and accu-mulation of caffeic acid derivatives. These o-diphenols can be oxidized by theenzyme PPO to produce brown pigments (Franciso et al., 1997).
3.2. Inhibition of enzymatic browning
PPO-catalyzed browning of vegetables and fruits can be prevented by heat inacti-vation of the enzyme, exclusion or removal of one or both of the substrates (O2
and phenols), lowering the pH to 2 or more units below the optimum, or addingcompounds that inhibit PPO or prevent melanin formation (Whitaker and Lee, 1995).Many inhibitors of PPO are known, but only a few have been considered as poten-tial alternatives to sulphites.
The most attractive way to inhibit browning would be ‘natural’ methods, suchas the combination of certain salad ingredients with each other. Lozano-de-Gonzalezet al. (1993) have obtained promising results with pineapple juice. It appears tobe a good potential alternative to sulphites for the prevention of browning in freshapple rings. Treatment of white grapes and cut fruits with honey has been shownto inhibit PPO activity and browning. The inhibitory effect was due to a peptideof MW 600 (Oszmianski and Lee, 1990).
The browning susceptibility of potatoes could also be reduced to some extentby heat treatment (2 weeks at + 15 °C) before peeling. This is mainly due to thefact that the amount of reducing sugars decreases during the heat treatment (Mattilaet al., 1995). The results of recent research in browning prevention of potatoes,apples and iceberg lettuce are presented in Tables 1, 2 and 3, respectively.
Chemical treatment. The sulphydryl (SH or thiol) compound such as cysteine, N-acetyl-L-cysteine, and reduced glutathione, as well as ascorbic and citric acids,are good inhibitors of the enzyme PPO that catalyzes enzymatic browning in fruitsand vegetables (Dudley and Hotchkiss, 1989; Friedman, 1991; Golan-Goldhirsh etal., 1994; Langdon, 1987; Muneta, 1981). SH-containing amino acids and peptidesare good inhibitors of enzymatic browning in freshly prepared and commercialfruit juices, apple, fresh and dehydrated potatoes (Friedman and Bautista, 1995).
Browning resulted from PPO was reduced by washing the cut stem of lettuce
Enzymes and Quality Factors of Fruits and Vegetables 5

heads with solutions of 0.3M calcium chloride (Francisco et al., 1997). Jin-cheolet al. (1999) investigated treatments to control enzymatic browning of minimallyprocessed lotus roots. Enzymatic browning of external and cut surface of pre-cutlotus roots (PLRs) were delayed by dipping them in 3% solution of ascorbic acid,erythorbic acid, and citric acid and 0.5% acetic acid solution. The solutions mixedwith several browning inhibitors were more effective in browning inhibition of PLRsthan those added with only one of the browning inhibitor alone. Application ofglutathione in combination with citric acid may slow down the browning of litchifruit (Yueming et al., 1999).
The enzyme activity from loquat was markedly inhibited by sodium ascorbate,dithyldithiocarbamate, metabisulfide, dithiothreitol, mercaptoethanol, NaF, NaN3, L-cysteine, and reduced glutahione (Ding et al., 1998). Cabbage PPO activity werealso inhibited by sodium dithyldithiocarbamate and potassium cyanide, but NaCI,NaF, BaCI2, and ZnSO4 were poor inhibitors of PPO from cabbage (Fujita et al.,1997)
Physical treatment. Controlled Atmosphere (CA) or Modified Atmosphere (MA)– In avocados, mangoes and pineapples the browning is primarily internal and dueto enzymatic oxidation. The use of CA in these subtropical fruits has contributedsignificantly to improvement of quality in export fruits (Kruger et al., 1999). Paulland Rohrbach (1982) found that incidence of internal browning was reduced on‘Smooth Cayene’ pineapple fruit coated in wax and stored at 8 °C for 28 daysfollowed by 7 days at 22 °C. Pineapple wrapped with 0.030 or 0.020 mm thickPVC foil had lower levels of PPO and POD activity and higher textural values,and internal browning was reduced.
Statistically valid evidence of the effectiveness of high-O2 modified atmospherepackaging (MAP) was provided by Day (1997) with iceberg lettuce. This so-called‘oxygen shock’ or ‘gas shock’ treatment has been found to be particularly effec-tive in inhibiting enzymatic browning, preventing anaerobic fermentation reactions,and inhibiting aerobic and anaerobic microbial growth. It is hypothesized thathigh O2 levels may cause substrate inhibition of PPO or, alternatively, high levelsof colorless quinones subsequently formed may cause feedback production ofPPO.Oxygen concentrations in the atmosphere surrounding a product can be reducedby MAP. While this approach can delay browning, excessive reduction of oxygenwill damage the product by inducing anaerobic metabolism, leading to breakdownand off-flavor formation.
A packaging atmosphere of 20% CO2 and 80% N2 with citric and ascorbic acidsas browning inhibitors gave the best sensory quality of sliced potatoes after 7days’ storage. Oxygen concentrations in the package headspace were less than1.5% during a 7-day storage period (Laurila et al., 1998). According to Ahvenainenet al. (1998), the quality retention of peeled potatoes was as good in vacuum asin gas (20% CO2 + 80% O2). Gunes and Lee (1997) showed that active modifica-tion of the atmosphere inside the package was necessary to extend the shelf lifeof the potatoes but MAP alone did not prevent browning. Dipping treatment wasessential in packaged potatoes. A carbon monoxide (CO) gas atmosphere wasfound to inhibit mushroom PPO reversibly. Use of this compound in a modified-
6 P. K. Bhowmik and R. Dris

atmosphere packaging system would require measures to ensure the safety of packingplant workers. High-pressure treatment of potatoes and apples at 800 MPa causedlittle browning but both foods took on a cooked appearance (Gomes and Ledward,1996).
Other methods. One possible ‘packaging’ method for extending the postharveststorage life of lightly processed fruits and vegetables is the use of edible coatings,i.e. thin layers of material which can be eaten by the consumer as part of thewhole food product. At least theoretically, coatings have the potential to reducemoisture loss, restrict ingress of oxygen, lower respiration, retard ethylene pro-duction, seal in flavor volatiles, and carry additives that retard discoloration andmicrobial growth (Baldwin et al., 1995).
Antioxidants are added to edible coatings to protect against oxidative rancidity,degradation and discoloration. Nisperos-Carriedo et al. (1988) found that ediblecoatings reduced enzymatic browning in whole and sliced mushrooms. Furtherimprovement in the anti browning property of the coating was accomplished withthe incorporation of an antioxidant and a chelator (1% ascorbic acid, 0.2% calciumdisodium ethylene diaminetetraacetic acid). Various sulphated polysaccharides,including carrageenans, amylose sulphate and xylan sulphate, were found to be effec-tive as browning inhibitors with diced apple (Tong and Hicks, 1991). Use of NatureSeal 1020, a cellulose-based edible coating, as a carrier of antioxidants, acidu-lants and preservatives prolonged the storage life of cut apple and potato by aboutone week when stored in over wrapped trays at 4 °C. Ascorbic acid delayed browningmore effectively when applied in an edible coating than in an aqueous solution(Baldwin et al., 1996).
It is expected that a biological preservation method may enjoy better consumeracceptance than preservation methods that use traditional chemical preservatives(Schillinger et al., 1996). Lactic acid bacteria (LAB) produce a variety of lowmolecular mass compounds including acids, alcohols, carbon dioxide, diacetyl,hydrogen peroxide and other metabolites. Bacteriocin-producing LAB show poten-tial for minimally processed foods (Schillinger et al., 1996). Hurdle technology usingnatural preservatives, e.g. inhibitors produced by LAB, may also work as browninginhibitors. The matching of correct processing methods and ingredients to each othershould be applied to a greater extent in minimal processing of produce.
4. TEXTURE AS A QUALITY FACTOR
Texture is probably the most elusive quality factor of fruits and vegetables. Scientistshave different definitions for food texture. In food chemistry, texture of fruits andvegetables represent the biomolecules involved in the cellular structure of cell walls.Changes in firmness and texture are largely attributed to alterations in the compo-sition and structure of cell wall polysaccharides. Because these modificationsinfluence the postharvest properties (i.e. storage time and expense, handling damage,and desirability to the consumer) of important food crops and, consequently, areof great commercial importance. Research in recent years has focused on identifying
Enzymes and Quality Factors of Fruits and Vegetables 7
8 P. K. Bhowmik and R. Dris
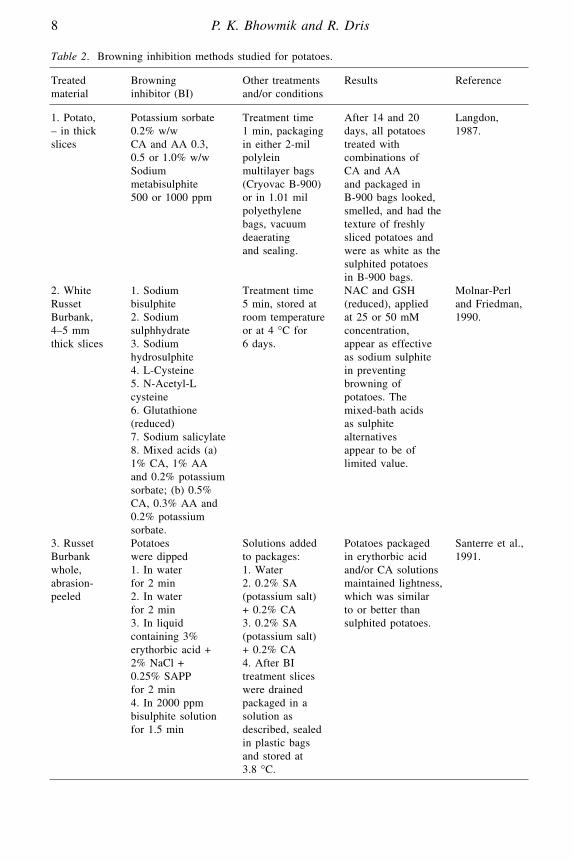
Table 2. Browning inhibition methods studied for potatoes.
Treated Browning Other treatments Results Referencematerial inhibitor (BI) and/or conditions
1. Potato, Potassium sorbate Treatment time After 14 and 20 Langdon, – in thick 0.2% w/w 1 min, packaging days, all potatoes 1987.slices CA and AA 0.3, in either 2-mil treated with
0.5 or 1.0% w/w polylein combinations of Sodium multilayer bags CA and AA metabisulphite (Cryovac B-900) and packaged in 500 or 1000 ppm or in 1.01 mil B-900 bags looked,
polyethylene smelled, and had thebags, vacuum texture of freshly deaerating sliced potatoes and and sealing. were as white as the
sulphited potatoes in B-900 bags.
2. White 1. Sodium Treatment time NAC and GSH Molnar-Perl Russet bisulphite 5 min, stored at (reduced), applied and Friedman, Burbank, 2. Sodium room temperature at 25 or 50 mM 1990.4–5 mm sulphhydrate or at 4 °C for concentration, thick slices 3. Sodium 6 days. appear as effective
hydrosulphite as sodium sulphite 4. L-Cysteine in preventing 5. N-Acetyl-L browning of cysteine potatoes. The 6. Glutathione mixed-bath acids (reduced) as sulphite 7. Sodium salicylate alternatives 8. Mixed acids (a) appear to be of 1% CA, 1% AA limited value.and 0.2% potassiumsorbate; (b) 0.5% CA, 0.3% AA and0.2% potassium sorbate.
3. Russet Potatoes Solutions added Potatoes packaged Santerre et al., Burbank were dipped to packages: in erythorbic acid 1991.whole, 1. In water 1. Water and/or CA solutions abrasion- for 2 min 2. 0.2% SA maintained lightness,peeled 2. In water (potassium salt) which was similar
for 2 min + 0.2% CA to or better than 3. In liquid 3. 0.2% SA sulphited potatoes.containing 3% (potassium salt) erythorbic acid + + 0.2% CA 2% NaCl + 4. After BI 0.25% SAPP treatment slices for 2 min were drained 4. In 2000 ppm packaged in a bisulphite solution solution as for 1.5 min described, sealed
in plastic bags and stored at 3.8 °C.

enzyme activities that are rate limiting in the promotion of fruit deterioration. Thedegradation during natural physiological transitions or artificial processing opera-tions may also alter textural quality of fruits and vegetables. As with other qualityfactors, a number of enzymes can affect the texture.
4.1. Fruit softening and ripening
Ripening is a complex process involving major transitions in fruit developmentand metabolism. Although ripening hallmarks the initiation of fruit senescence,previous theories emphasizing the deteriorative aspects of ripening have been super-seded by the view that ripening represent a well-coordinated process of organdifferentiation that is genetically programmed. Because this developmental transi-tion involves coordinated changes in a number of biochemical pathways, theregulation of ripening has extensively studied as a model in plant development.Because ethylene regulates at least part of this developmental transition, ethyleneresponses, and ethylene-regulated gene expression have been extensively studiedin ripening fruit.
In addition to other biochemical transitions such as pigment biosynthesis and pro-duction of volatiles, softening accompanies the ripening of many fruit. It has beenconsidered that the process of fruit softening is commercially important because itoften indicates early harvest of fruit to avoid damage in subsequent handling.Textural changes result primarily from changes in cell wall structure. Ultimately,excessive softening and the associated enhancement in pathogen susceptibilitylimit the postharvest life of many fruit.
The apparent changes in molecular size of cell wall polymers that accompanyfruit ripening implicate the action of enzymes capable of degrading specific cell wallcomponents. Consequently, the activity of ripening-induced cell wall hydrolyses has
Enzymes and Quality Factors of Fruits and Vegetables 9
Table 2. Continued.
Treated Browning Other treatments Results Referencematerial inhibitor (BI) and/or conditions
4. Russet 1. Conventional: Peeled tubers were The experimental Sapers and Burbank 4% AA, 1% CA, briefly stored in treatment was Miller, 1992.plugs, about 1% SAPP and a holding solution more effective 2.2 cm in 0.2% CaCl2 containing 2% than the diameter, 2. Experimental: SAPP and 0.25% conventional 0.95 cm 2.5% AA, 1% CA, NaCl prior to dip. The storage dice and 1% SAPP, 0.2% further treatment. life of samples pre-peeled CaCl2, 1.9% AAP Treatment time was extended by tubers (Na salt), 1.5% 1.5 or 5 min (plugs) about 1 week prepared by AATP (Na salt), and 5 min (dices), to 9 days for abrasion and adjusted to placing the treated plugs and 13 days peeling or pH 2 with HCl samples in covered for dice. The use high pressure or H3PO4 crystallizing dishes of H3PO4 for pH steam peeling 3. Control sample (plugs) and in adjustment proved
was dipped in plastic bags (dices), more effective than water for 20 s stored at 4 °C. adjustment with HCl.

10 P. K. Bhowmik and R. Dris
Table 3. Browning inhibition methods studied for apples.
Treated Browning Other treatments Results Reference material inhibitors (BI) and/or conditions
1. Apple, Different Treatment time AAP and AATP Sapers et al., (Red concentrations of 90 s, control showed considerable 1989.Delicious, AAP, AA, AATP, sample 10 s promise as inhibitors Winesap) CINN, SPORIX, in water, of enzymatic cut surface NaA alone or in stored at room browning at the cutof plugs combination temperature for surface of raw apple,(22 mm were used. Dips 2, 6 and 24 h. but were ineffective diameter). containing (Browning in apple juice. Plugs water-soluble AA inhibitors were Dips containing were cut derivatives were also tested combinations of transversely prepared with in the juice Sporix and AA were at their distilled water or system.) highly effective in midpoints. 1% CA solution. inhibiting enzymatic
browning on the cut surface ofapple plugs.
2. Apple 1. Sodium Concentrations: NAC and GSH Molnar-Perl (Washington bisulphite 5, 10, 25 and (reduced), applied and Friedman, Golden, 2. Sodium 50 mM (adjusted at 25 or 50 mM 1990.Red Delicious) sulphhydrate to pH 7). concentration, 4–5 mm slices 3. Sodium Immersed for appear as effective
hydrosulphite 1–2 min, placed as sodium sulphite 4. L-Cysteine in culture dishes in preventing 5. NAC (A values) or in browning of 6. GSH (reduced) plastic bags that apples. The 7. Sodium salicylate were evacuated mixed organic 8. Mixed acids (B values). acids were (a) 1% CA, 1% AA effective only and 0.2% potassium for a short period.sorbate; (b) 0.5% CA, 0.3% AA and 0.2% potassium sorbate.
3. Apple i-, k- and Treatment time Carrageenans or Tong and (Granny l-carrageenan 10 min, covered CA alone did not Hicks, 1991.Smith, Red (0.5%) and and stored at 3 °C inhibit browning. Delicious) CA (0.5%) for up to 10 days The mixture of i-, cubes, 1 cm3 either alone or k- or l-carrageenan
in combination and CA delayed browning for up to 7 days with Granny Smith apple dice and for up to 3 days with Red Delicious. There appeared to be no significant difference in effectiveness of the 3 carrageenans.

been the subject of intense study for several decades. Such studies have focusedon the relatively few enzymes that accumulate to high levels in particular fruit.
4.1.1. β-Galactosidases and cell wall modification
β-Galactosidases (EC 3.2.1.23) constitute a widespread family of enzymes charac-terized by their ability to hydrolyze terminal, nonreducing β-D-galactosyl residuesfrom β-D-galactosides. Several β-galactosidases, sometimes referred to as exo-galac-tanases, have been purified from plants and shown to possess in vitro activity againstextracted cell wall material via the release of galactose from wall polymers con-taining β (1 → 4)-D-galactan. The most conspicuous and important processes relatedto postharvest quality of climacteric fruit are the changes in texture that occur duringripening. Because of the critical relationship that deleterious changes in texture have
Enzymes and Quality Factors of Fruits and Vegetables 11
Table 3. Continued.
Treated Browning Other treatments Results Reference material inhibitors (BI) and/or conditions
4. Apple 1. 1% solution 1. Treatment time 1. Papain inhibited Luo, 1992.(McIntosh/ (w/v) of papain, 2 min. Slices browning of apple Delicious) ficin and bromelain were drained and slices (12 h). Apple slices, were prepared with placed in vented slices treated with 15 mm deionized water plastic boxes over ficin become grey diameter × 2. Papain solutions: water-saturated instead of brown. 15 mm thick 0.4, 0.6, 0.8, 1.0, paper towels Bromelain treatment
1.2, 1.4 and 1.6% covered with rendered apple 3. Buffered 1.0% plastic film to slices redder than papain with pH prevent moisture white or brown. 5.4–7.0: a buffer loss, stored at 2. Either 1.0% solution of 0.1 M 22–25 °C. papain with a citric acid or 0.1 M 2. Treatment 2-min dip or sodium phosphate times 2 or 5 min, 0.8% papain with 4. AA: 0.5–2.0%, otherwise as a 5-min dip may papain 0.5–2.0%, mentioned above. provide adequate and their 3 and 4. protection from combinations Treatment time browning for 12 h
2 min and other at room temperature.procedures as 3. No difference mentioned above. in inhibition of
browning among papain solutions prepared with 2 buffers at different pH values. Apple slices treated with buffered papain solutions had less browning than those prepared with deionized water.
12 P. K. Bhowmik and R. Dris
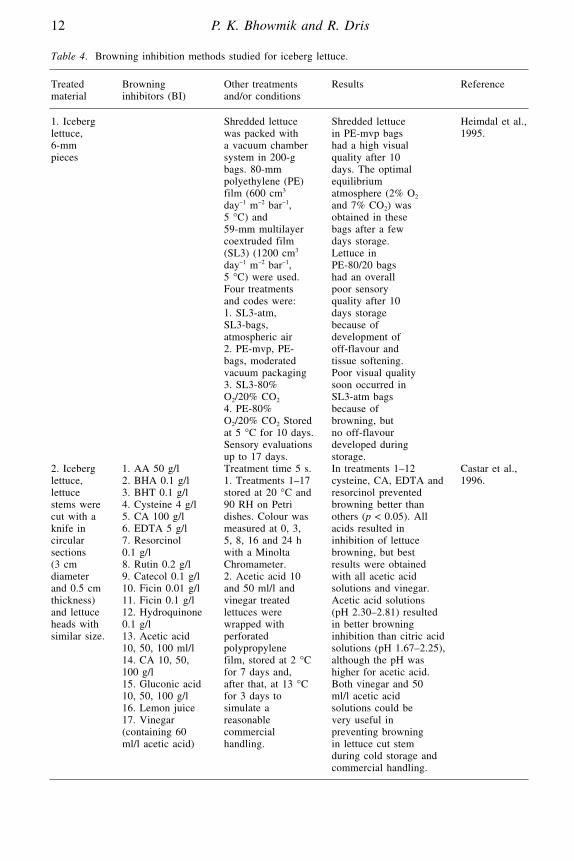
Table 4. Browning inhibition methods studied for iceberg lettuce.
Treated Browning Other treatments Results Referencematerial inhibitors (BI) and/or conditions
1. Iceberg Shredded lettuce Shredded lettuce Heimdal et al., lettuce, was packed with in PE-mvp bags 1995.6-mm a vacuum chamber had a high visual pieces system in 200-g quality after 10
bags. 80-mm days. The optimal polyethylene (PE) equilibrium film (600 cm3 atmosphere (2% O2
day–1 m–2 bar–1, and 7% CO2) was 5 °C) and obtained in these 59-mm multilayer bags after a few coextruded film days storage. (SL3) (1200 cm3 Lettuce in day–1 m–2 bar–1, PE-80/20 bags 5 °C) were used. had an overall Four treatments poor sensory and codes were: quality after 10 1. SL3-atm, days storage SL3-bags, because of atmospheric air development of 2. PE-mvp, PE- off-flavour and bags, moderated tissue softening. vacuum packaging Poor visual quality3. SL3-80% soon occurred in O2/20% CO2 SL3-atm bags 4. PE-80% because of O2/20% CO2 Stored browning, but at 5 °C for 10 days. no off-flavour Sensory evaluations developed during up to 17 days. storage.
2. Iceberg 1. AA 50 g/l Treatment time 5 s. In treatments 1–12 Castar et al., lettuce, 2. BHA 0.1 g/l 1. Treatments 1–17 cysteine, CA, EDTA and 1996.lettuce 3. BHT 0.1 g/l stored at 20 °C and resorcinol prevented stems were 4. Cysteine 4 g/l 90 RH on Petri browning better than cut with a 5. CA 100 g/l dishes. Colour was others (p < 0.05). All knife in 6. EDTA 5 g/l measured at 0, 3, acids resulted incircular 7. Resorcinol 5, 8, 16 and 24 h inhibition of lettuce sections 0.1 g/l with a Minolta browning, but best (3 cm 8. Rutin 0.2 g/l Chromameter. results were obtained diameter 9. Catecol 0.1 g/l 2. Acetic acid 10 with all acetic acid and 0.5 cm 10. Ficin 0.01 g/l and 50 ml/l and solutions and vinegar. thickness) 11. Ficin 0.1 g/l vinegar treated Acetic acid solutions and lettuce 12. Hydroquinone lettuces were (pH 2.30–2.81) resulted heads with 0.1 g/l wrapped with in better browning similar size. 13. Acetic acid perforated inhibition than citric acid
10, 50, 100 ml/l polypropylene solutions (pH 1.67–2.25),14. CA 10, 50, film, stored at 2 °C although the pH was 100 g/l for 7 days and, higher for acetic acid.15. Gluconic acid after that, at 13 °C Both vinegar and 5010, 50, 100 g/l for 3 days to ml/l acetic acid 16. Lemon juice simulate a solutions could be17. Vinegar reasonable very useful in (containing 60 commercial preventing browningml/l acetic acid) handling. in lettuce cut stem
during cold storage and commercial handling.
to quality and postharvest shelf life, emphasis has been placed on studying the mech-anisms involved in the loss of firmness that occurs during fruit ripening. Althoughfruit softening may involve changes in turgor pressure, anatomical characteristics,and cell wall integrity, it is generally assumed that cell wall disassembly leadingto a loss of wall integrity is a critical feature. The most apparent changes, in termsof composition and size, occur in the pectic fraction of the cell wall (Seymourand Gross, 1996), which include increased solubility, depolymerization, deesterifi-cation, and a significant net loss of neutral, sugar-containing side chains (Huber,1983; Fischer and Bennett, 1991; Seymour and Gross, 1996).
The best-characterized pectin-modifying enzymes are Polygalacturonase (PG; EC3.2.1.15) and Pectinmethylesterase (PME; EC 3.1.1.11). Among the other knownpectin modifications that occur during fruit development, one of the best charac-terized is the significant net loss of galactosyl residues that occurs in the cell wallsof many ripening fruit (Gross and Sams, 1984; Kim et al., 1991; Seymour and Gross,1996). Although some loss of galactosyl residues could result indirectly from theaction of PG, β-galactosidase (exo β-[1 → 4]-D-galactopyranosidase; EC 3.2.1.23)is the only enzyme identified in higher plants capable of directly cleaving (1 → 4)galactan bonds, and probably plays a role in galactan side chain loss (DeVeau etal., 1993; Carey et al., 1995; Carrington and Pressey, 1996). No endo-acting galac-tanase has yet been identified in higher plants.
The view that β-galactosidase is active in releasing galactosyl residues fromthe cell wall during ripening is supported by the dramatic increase in free Gal, aproduct of β-galactosidase activity (Gross, 1984), and a concomitant increase inβ-galactosidase II activity in tomatoes during ripening (Carey et al., 1995). β-Galactosidases are generally assayed using artificial substrates such as p-nitrophenyl– D-galactopyranoside, 4-methylumbelliferyl – D-galactopyranoside, and X-Gal.However, it is clear that β-galactosidase II is also active against natural substratessuch as (1 → 4) galactan (Pressey, 1983; Carey et al., 1995; Carrington and Pressey,1996). β-Galactosidase proteins have been purified and characterized in fruits oftomato (Pressy, 1983; Carey et al., 1995; Carrington and Pressy, 1996), kiwifruit(Ross et al., 1993), coffee (Golden et al., 1993), persimmon (Kang et al., 1994),apple (Ross et al., 1994), muskmelon (Ranwala et al., 1992), avocado (De Veauet al., 1993), kiwifruit (Ross et al., 1993), mango (Ali et al., 1995) and Japanesepear (Kitagawa et al., 1995).
Although there are β-galactosidase isozymes in the fruit, it appears that not allthe enzymes participate in the significant loss of galactosyl residues from the cellwall during fruit softening. For instance, among the three β-galactosidase isozymes(β-galactosidase I, II and III) found in tomato fruit, only β-galactosidase II isactive against the native tomato fruit cell wall containing β-(14)-galactan and respon-sible for the fruit softening (Pressy, 1983; Carey et al., 1995; Carrington andPressy, 1996). In the case of Japanese pear, Kitagawa et al. (1995) have shownthat there are five fractions that exhibited the β-galactosidase activity and fractionIII gave the highest activity of hydrolyzing galactosyl residues from either trans-1, 2-cyclohexanediamine-N, N, N′, N′-tetraacetic acid (CDTA)- or Na2CO3-solublenative cell wall polysaccharides containing β-(14)-galactan of Japanese pear fruit.Their results strongly suggested that the β-galactosidase in fraction III (β-galac-
Enzymes and Quality Factors of Fruits and Vegetables 13

tosidase III, β-GAL III), which has been purified and characterized, might playthe most important role in the softening of Japanese pear fruit.
4.1.2. Polygalacturonase and pectin disassembly in ripening fruit
Polygalacturonase (PG; EC 3.2.1.15) is the major enzyme responsible for pectindisassembly in ripening fruit. PG catalyzes the hydrolytic cleavage of -(1–4) galac-turonan linkages and is a key enzyme involved in the large changes in pectin structurethat accompany the ripening of many fruit (Fischer and Bennett, 1991). Pectinsare a major class of cell wall polysaccharides that are degraded during ripening,undergoing both solubilization and depolymerization.
In tomato the majority of ripening-associated pectin degradation is attributableto the cell wall hydrolase PG. Transgenic tomato plants with altered PG geneexpression indicated that PG-dependent pectin degradation is neither required norsufficient for tomato fruit softening to occur (Sheehy et al., 1988; Smith et al., 1988;Giovannoni et al., 1989). However, data from experiments using fruit of the sametransgenic lines strongly suggested that PG-mediated pectin degradation is impor-tant in the later, deteriorative stages of ripening and in pathogen susceptibility oftomato fruit (Schuch et al., 1991; Kramer et al., 1992).
In melon (Cucumis melo) substantial amounts of pectin depolymerization andsolubilization take place during ripening (McCollum et al., 1989; Ranwala et al.,1992; Rose et al., 1998), implicating a role for PG in ripening-associated cell walldisassembly in melons. As reported for other cultivars, Charentais melons exhibitsubstantial solubilization and a downshift in the molecular-mass profile of water-soluble pectins, but this is associated with the later stages of ripening, after softeningis initiated (Rose et al., 1998). By utilizing a molecular approach to analyze PGin melon, Kristen et al. (1998) have identified and characterized a multigene familyencoding putative PGs from Charentais melon, including three PG homologs thatare expressed abundantly during fruit ripening. The pattern of PG gene expressioncorrelates temporally with the depolymerization of water-soluble pectins and anincrease in pectin-degrading enzyme activity. They have also identified three addi-tional PG homologs and shown to be expressed in mature anthers and fruit-abscissionzones, tissues that, similar to ripening fruit, are undergoing cell separation. Themost abundant ripening-associated putative PG mRNA, MPG1, was expressed inthe filamentous fungus Aspergillus oryzae. The culture filtrate from the trans-formed A. oryzae strain XMPG1 exhibited endo-PG activity, further supporting arole for endo-PG in ripening-associated pectin disassembly in Charentais melonfruit.
PG activity is also high in fruit other than tomato and melon, such as avocado(Persea americana) and peach (Prunus persica). In peach three distinct activities havebeen identified, two of which cleave the substrate by an exo mode of action, andone that hydrolyzes the pectin backbone in an endo fashion (Downs et al., 1992).In contrast to tomato, in which exo-PG activity is present during early fruit devel-opment and remains constant during ripening, exo-PG activities in peach are ripeningregulated (Pressey, 1987; Downs et al., 1992). Endo-PG activity in peach is asso-
14 P. K. Bhowmik and R. Dris

ciated with the freestone character, and a genetic linkage between freestone andendo-PG has recently been identified (Lester et al., 1996).
Avocado fruit have high levels of PG activity that are temporally correlated tosolubilization and depolymerization of polyuronides during fruit ripening (Huberand O’Donoghue, 1993). In contrast, a number of fruit have been reported to lackendo-PG activity, including strawberry (Fragaria ananassa) (Huber, 1984), apple(Malus domestica) (Bartley, 1978), persimmon (Diospyros kaki) (Cutillas-Iturraldeet al., 1993), and melon (McCollum et al., 1989). In many of these fruit, ripening-associated pectin depolymerization does not occur, and other enzymes may catalyzepectin solubilization. Alternatively, PG activity may be present but at as-yet-unde-tectable levels. For example, apple pectins are disassembled at the late stages ofripening (Knee, 1973), and recently, under rigorous examination, endo-PG activityand PG mRNA accumulation have been detected but the levels are much lowerthan that observed in tomato (Wu et al., 1993).
In strawberry, three different PG activities were detected and partially purified,two of which were exo-PGs and one of which was endo acting (Nogata et al.,1993). In melon (McCollum et al., 1989; Rose et al., 1998) and persimmon (Cutillas-Iturralde et al., 1993), pectins are extensively depolymerised during ripening but PGactivity is low or undetectable. It has been suggested that in melon, pectin depoly-merization results from -galactosidase activity because cell wall pectins extractedfrom preripe fruit undergo a downshift in Mr when treated with a partially purified-galactosidase extract (Ranwala et al., 1992). However, the characterization ofripening-regulated mRNAs that encode functional PGs in melon suggests that pectindisassembly during the late stages of fruit softening may be at least in part PG depen-dent (Hadfield et al., 1998).
It is important to note that even very low levels of PG may be sufficient to catalyzeextensive pectin disassembly. This became apparent in transgenic antisense tomatofruit, in which reductions in PG activity of 80% had little impact on pectin struc-ture, indicating that in tomato PG is present in at least 5-fold excess (Smith et al.,1990). It is therefore possible that the disassembly of pectin is PG dependent, evenin fruit with very low levels of PG activity.
4.1.3. Pectin methyl esterase and fruit ripening
The plant enzyme pectin methylesterase (PME; EC 3.1.1.11) plays a central rolein all processes requiring remodelling of plant cell wall being involved in the cellextension and growth and in the fruit ripening process (Richard and Noat, 1986).Recently it has been reported that PME regulates methanol and ethanol levels inripening tomato fruit (Frenkel et al., 1998). Highly methylated pectins arede-esterified by PME before PG action. The enzyme is involved in the first stepof the fruit ripening process by producing pectin with a lower degree of methyla-tion which, in turn, becomes the substrate of polygalacturonase.
Burridge et al. (1996) calculated total PME levels in a number of fruit usingan autotitrator (Figure 1). PME appears to be present in all of the samples assayed,although in varying quantities. Tomato has a very high level of PME. PME and
Enzymes and Quality Factors of Fruits and Vegetables 15

PG activity increased during tomato ripening, with a highly negative linear corre-lation between activities of the two enzymes and firmness. In very early ripeningfruit, PME activity was more closely related to softening than PG, whereas in normalearly ripening fruits, PG activity was slightly closely linked to the loss of firmnessthan PME. During ripening of mango, PG activity increased significantly, thendeclined after reaching a maximum, but PME activity decreased gradually throughoutthe ripening process (Zhou et al., 1996).
16 P. K. Bhowmik and R. Dris
Figure 1. Total PME activity in a number of fruit tissues (after Burridge et al., 1996). These figurescan only be taken as a rough guide to the total activity as the extractions were not optimised for eachfruit.

4.1.4. Cellulase and fruit ripening
In addition to above hydrolyases, cellulase also plays an important role in ripeningand softening of fruit. The delicate nature of raspberry fruits is a major difficultyfor growers and processors. The ripe fruit are easily ruptured during harvesting,transport and commercial operations (Reeve et al., 1965; Jennings, 1998; Joles etal., 1994). Continued softening after harvesting exacerbates this problem and is acontributory factor to their extremely short shelf-life (Barritt et al., 1980; Sjulinand Robbins, 1987). The softening of fruit appears to be a multicomponent process.Underneath the epidermis and hypodermis the thin walled mesocarp cells becomedistended during fruit expansion and the delicate nature of these cells contributesto the textural changes (Reeve, 1954; Jennings, 1998). Abeles and Takeda (1989)have described that cellulase activity increases during the ripening of the closelyrelated black berry.
To investigate whether there was any relationship between cellulase activityand the breakdown of druplet mesocarp walls, the outer red drupelets and inner whitereceptacles were assayed throughout development. Surprisingly most cellulaseactivity per gram of tissue was located in the receptacle rather than the drupeletsat each stage. Receptacle cellulase activity increased progressively (Sexton et al.,1997). During the ripening of raspberry fruit there is a progressive weaking of the70–80 abscission zones that attach the drupelets to the central receptacle (Burdonand Sexton, 1990). The force necessary to rupture these abscission zones decreasesas the fruit ripen until ultimately the berry will often fall if touched. Since cellu-lase is implicated in the wall breakdown associated with abscission (Brummell etal., 1994), it seemed possible that this could be its role during raspberry fruit mat-uration. At each stage of development the total cellulase is left on the two fracturefaces. The surface of the purple ripe receptacles containing the abscission zone tissuehad 20 times the activity of the rest of the drupelet (Sexton et al., 1997).
Cellulase activity increases markedly during softening of raspberry drupelets.Similar changes have been found in ripening avocados (Awad and Young, 1979),strawberries (Abeles and Takeda, 1990), blackberries (Abeles and Takeda, 1989),peaches (Hinton and Pressey, 1974), mangoes (Abu-Sarra and Abu-Goukh, 1992)and tomatoes (Brummell et al., 1994). The level of cellulase in the drupelets ofripe raspberries are similar to those in tomato, about half those found in mango,but only 0.3% of those found in avocado. In spite of these correlations the preciserole of cellulase in the wall breakdown accompanying fruit softening is far fromclear (Brummell et al., 1994). Weakening of the abscission zones in each of thisdrupelet stipes occurs as the fruit ripens (Mackenzie, 1979; Burdon and Sexton,1990). After abscission, the abscission zone cells are left attached both to the innersurface of the core of drupelets and to the surface of the receptacles. The highconcentrations of cellulase associated with both these location suggests that theenzyme is also involved in abscission zone weakening. The activity of cellulase fromcherimoya increased three-fold concomitantly with the highest drop in flesh firmness(Sanchez et al., 1998).
Enzymes and Quality Factors of Fruits and Vegetables 17
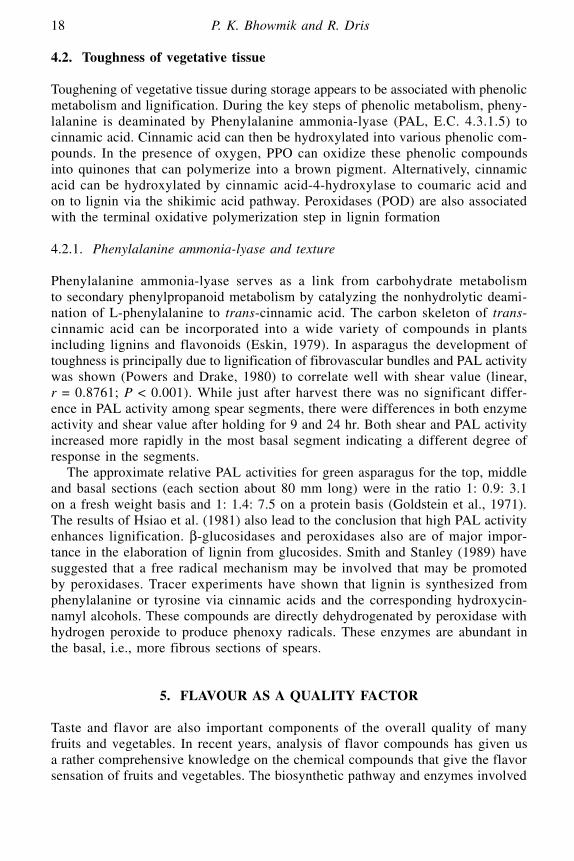
4.2. Toughness of vegetative tissue
Toughening of vegetative tissue during storage appears to be associated with phenolicmetabolism and lignification. During the key steps of phenolic metabolism, pheny-lalanine is deaminated by Phenylalanine ammonia-lyase (PAL, E.C. 4.3.1.5) tocinnamic acid. Cinnamic acid can then be hydroxylated into various phenolic com-pounds. In the presence of oxygen, PPO can oxidize these phenolic compoundsinto quinones that can polymerize into a brown pigment. Alternatively, cinnamicacid can be hydroxylated by cinnamic acid-4-hydroxylase to coumaric acid andon to lignin via the shikimic acid pathway. Peroxidases (POD) are also associatedwith the terminal oxidative polymerization step in lignin formation
4.2.1. Phenylalanine ammonia-lyase and texture
Phenylalanine ammonia-lyase serves as a link from carbohydrate metabolismto secondary phenylpropanoid metabolism by catalyzing the nonhydrolytic deami-nation of L-phenylalanine to trans-cinnamic acid. The carbon skeleton of trans-cinnamic acid can be incorporated into a wide variety of compounds in plantsincluding lignins and flavonoids (Eskin, 1979). In asparagus the development oftoughness is principally due to lignification of fibrovascular bundles and PAL activitywas shown (Powers and Drake, 1980) to correlate well with shear value (linear,r = 0.8761; P < 0.001). While just after harvest there was no significant differ-ence in PAL activity among spear segments, there were differences in both enzymeactivity and shear value after holding for 9 and 24 hr. Both shear and PAL activityincreased more rapidly in the most basal segment indicating a different degree ofresponse in the segments.
The approximate relative PAL activities for green asparagus for the top, middleand basal sections (each section about 80 mm long) were in the ratio 1: 0.9: 3.1on a fresh weight basis and 1: 1.4: 7.5 on a protein basis (Goldstein et al., 1971).The results of Hsiao et al. (1981) also lead to the conclusion that high PAL activityenhances lignification. β-glucosidases and peroxidases also are of major impor-tance in the elaboration of lignin from glucosides. Smith and Stanley (1989) havesuggested that a free radical mechanism may be involved that may be promotedby peroxidases. Tracer experiments have shown that lignin is synthesized fromphenylalanine or tyrosine via cinnamic acids and the corresponding hydroxycin-namyl alcohols. These compounds are directly dehydrogenated by peroxidase withhydrogen peroxide to produce phenoxy radicals. These enzymes are abundant inthe basal, i.e., more fibrous sections of spears.
5. FLAVOUR AS A QUALITY FACTOR
Taste and flavor are also important components of the overall quality of manyfruits and vegetables. In recent years, analysis of flavor compounds has given usa rather comprehensive knowledge on the chemical compounds that give the flavorsensation of fruits and vegetables. The biosynthetic pathway and enzymes involved
18 P. K. Bhowmik and R. Dris

in biogenesis of flavor compounds of many fruits and vegetables have also madeprogress. The enzymes involved in off-flavor formation in fruits and vegetablesare peroxidases and lypoxygenases.
Peroxidases are enzymes whose primary function is the oxidation of phenolicmoieties at the expense of hydrogen peroxide. Peroxidases are believed to be respon-sible for a more general deterioration in flavor, color, texture and the loss of somenutritional qualities in raw and processed fruits and vegetables through free radicalinitiated reactions (Haard, 1977; Burnette, 1977). A direct relationship betweenperoxidase activity and off-flavour development in peas was claimed in 1958 byWagenknecht and Lee and later by Pinsent (1962). Active peroxidase is believedto spoil fruits and vegetables at temperatures as low as –18 °C and at low moisturelevels the development of off-flavours is often associated with the oxidation ofindigenous lipids and the phenolic constituents (Sessa and Anderson, 1981). It hasbeen suggested that a significant negative correlation between peroxidase activityand the flavour scores of high and low yield orange juices indicates that it mightbe possible to use peroxidase activity as an index of potential adverse flavour(Bruemmer et al., 1976). For string beans, the qualitative peroxidase test was foundto be the best index of adequate blanching. Capsacinoides responsible for hot flavourin chile pepper was found negatively correlated with peroxidase activity that mightindicate that this enzyme is involved in capsaicinoid degradation (Margarita andElhadlli, 1998).
Lypoxygenases on the other hand, catalyze the oxidation of polyunsaturatedfatty acids to first produce free radicals and subsequently after oxygenation con-jugated unsaturated hydroperoxy acids. Lypoxygenases are of interest to the scientistboth due to their role in the genesis of flavor and aroma compounds in fruits andvegetables and their ability to form free radicals that can attack other constituentssuch as vitamins, colors, phenolics, and proteins. Lipoxygenase-produced aromacompounds are desirable in many fruits and vegetables but may also give rise to off-flavors, particularly in broccoli and asparagus. The large activity of lypoxygenasesfor broccoli and asparagus compared to other vegetables would explain the increasedcolor losses and off-flavor development during frozen storage of non-blanched orunderblanched products (Halpin and Lee, 1987; Sheu and Chen, 1991). Off-flavorsin green beans have been attributed to lypoxygenase activity and it has been claimedthat the enzyme is responsible for off-flavor development in carrots (Morales-Blancaset al., 2002).
6. NUTRITIONAL QUALITY
The most important nutritive values of fruits and vegetables are their content ofvitamin C, minerals and fiber. Various amounts of other vitamins and nutrientsexist in fruits and vegetables that play a significant role in human nutrition. Butthe nutritive value of fruits and vegetables vary due to many factors. Enzymesin fruits and vegetables along with other factors like varieties, maturities andcultural practices are responsible for quality deterioration in mature fresh fruitsand vegetables. Various enzymes like carbohydrate metabolizing group-invertase,
Enzymes and Quality Factors of Fruits and Vegetables 19

sucrose synthase, sucrose phosphate synthase; amino acid metabolizing group-glutamine synthetase, glutamate dehydrogenase, along with the above mentionedenzymes are responsible for the deterioration of total carbohydrates, dietary fiber,proteins and individual amino acids, lipids and individual fatty acids, vitaminsand minerals in fruits and vegetables.
7. CONCLUSIONS
Enzymes are responsible for most of the hundreds of reactions responsible for thequality of fruits and vegetables. These enzymes are highly efficient and capableof converting 102–107 moles of substrate to product per mole of enzyme each minuteat ambient temperature. Enzyme activities do not cease when the ideal qualitycharacteristics of fruits and vegetables have been achieved. After harvest, manyof the enzymes continue to act on remaining substrates and the rates of the reac-tions are sometimes accelerated by the general senescence of the tissue and bydamage during harvesting and storage.
The quality factors to be maintained are color, flavor, aroma, texture and nutri-tion. Deterioration of all these quality factors begins after the fruits and vegetablesreach maturity and is harvested and stored. But one of these factors is often moreimportant than others. In tomatoes, it is softening caused by the pectic enzymes.In damaged fruit, such as peaches, apples and avocadoes, it is browning due to poly-phone oxidize. In green leafy vegetables it is flavor and aroma deterioration.
It is the intention of scientists to either lessen these enzyme activities or to enhancequality factors by processing. All processing technologies are to stop the physio-logical and enzymatic activities with minimum disruption of cellular structures.Kohman, in 1928 (Kohman, 1928) was among the first to note that a short heat treat-ment could prolong refrigerated and frozen storage of plant materials. Shortlythereafter, it was shown that the increased storage time resulted from inactivationof the enzymes in fruits and vegetables. Complete inactivation of all enzymes byheat treatment is easily achieved. But heating can cause undesirable losses in color,texture, flavor, aroma and nutritive quality. For maximum quality retention, clearlythe need is for sufficient heat treatment to stabilize the product against enzymaticdeterioration but at the same time to minimize quality losses due to heating. Thisneed was met by selection of an endogenous enzyme as an indicator of adequateheat treatment.
REFERENCES
Abeles, F. B. and F. Takeda (1989). Increased cellulase activity during blackberry fruit ripening.Hort Science 24: 851–852.
Abeles, F. B. and F. Takeda (1990). Cellulase activity and ethylene in ripening strawberry and applefruits. Scientia Horticulturae 42: 269–275.
Abu-Sarra, A. F. and A. F. Abu-Goukn (1992). Changes in pectinesterase, polygalacturonase andcellulase activity during mango fruit ripening. J. Horti. Sci. 67: 561–568.
Ahvenainen, R. T., E. U. Hurme, M. Hog, E. H. Skytt and E. K. Laurila (1998). Shelf-life of pre-
20 P. K. Bhowmik and R. Dris
peeled potato cultivated, stored and processed by various methods. Journal of Food Protection61: 591–600.
Ali, Z. M., S. Armugam and H. Lazan (1995). β-Galactosidase and its significance in ripening mangofruit. Phytochemistry 38: 1109–114.
Arthey, V. D. (1975). Quality of Horticultural Products. Butterworths, London, pp. 228–265.Awad, M. and R. E. Young (1979). Postharvest variation in cellulase, polygalacturonase and pectin
methyesterase in avocado fruits in relation to respiration and ethylane Production. Plant Physiol.64: 306–308.
Bartley, I. M. (1978). Exo-polygalacturonase of apple. Phytochemistry 12: 213–216. Baldwin, E. A., M. O. Nisperos-Carriedo and R. A. Baker (1995). Use of edible coatings to preserve
quality of lightly (and slightly) processed products. Critical Reviews in Food Science and Nutrition35: 509–524.
Baldwin, E. A., M. O. Nisperos, X. Chen and R. D. Hagenmaier (1996). Improving storage life ofcut apple and potato with edible coating. Postharvest Biology and Technology 9: 151–163.
Barrit, B. H., L. C. Torre, H. S. Pepin and H. A. Daubeny (1980). Fruit measurments in red rasp-berry. Hort Sicence 15: 38–39.
Bodon, J. N. and R. Sexton (1990). The role of ethylane in the shedding of red raspbeery fruit. Annals.of Botany 66: 111–120.
Brummell, D. A., C. Lashbrook and A. B. Bennett (1994). Plant endo-1,4-β-D galacturonase. Structure,properties and physiological function. Am. Chem. Soc. Symposium 566: 100–129.
Bruemmer, J. H., B. Roe and E. R. Bowen (1976). Peroxidase reactions and orange juice quality. J.Food Sci. 41: 186.
Burnette, F. S. (1977). Peroxidase and its relationship to food flavour and quality, a review. J. FoodSci. 42: 1–7.
Burridge, B., M. Los and G. A. Tucker (1996). Multiple Forms of Pectinesterase are Present in Tomatoand Other Fruit. Presented in poster form at the April 1996 pre-doctoral meeting of the BiochemicalSociety (at Liverpool John Moores University).
Castar, M., M. I. Gil, F. Art and F. A. Tom-Barber (1996). Inhibition of browning of harvested headlettuce. Journal of Food Science 61: 314–316.
Carey, A. T., K. Holt, S. Picard, R. Wilde, G. A. Tucker, C. R. Bird, W. Schuch and G. B. Seymour(1995). Tomato exo β-(1 → 4)-D-galactanase. Isolation, changes during ripening in normal andmutant tomato fruit, and characterization of a related clone. Plant Physiol. 108: 1099–1107.
Carrington, C. M. and R. Pressey (1996). β-Galactosidase II activity in relation to changes in cellwall galactosyl composition during tomato ripening. J Am Soc Hortic Sci. 121: 132–136.
CoSeteng, M. Y. and C. Y. Lee (1987). Changes in apple polyphenoloxidase and polyphenol concen-trations in relation to degree of browning. J. Food Sci. 52: 985–989.
Day, B. P. F. (1997). High oxygen modified atmosphere packaging: a novel approach for fresh preparedproduce packaging. In B. Blakistone (ed.), Packaging Yearbook 1996. NFPA (National FoodProcessors Association), pp. 55–65.
DeVeau, E. J., K. C. Gross, D. J. Huber and A. E. Watada (1993). Degradation and solubilization ofpectin by β-galactosidases purified from avocado mesocarp. Physiol. Plant 87: 279–285.
Ding, C. K., K. Chachin, Y. Ueda and R. Mochioka (1998). Changes in Polyphenol Concentrationsand Polyphenoloxidase Activity of Laqut Relate to browning. J. Japan Soc. Horti. Sci. 67: 360–366.
Downs, C. G., C. J. Brady and A. Gooley (1992). Exopolygalacturonase protein accumulates late inpeach fruit ripening. Physiol. Plant 85: 133–140.
Dudley, E. D. and J. H. Hotchkiss (1989). Cysteine as an Inhibitor of Polyphenoloxidase. J. FoodBiochem. 13: 65–75.
Eskin, N. A. M. (1979). Plant Pigments, Flavors and Textures. Academic Press, New York, pp. 219–256.Fischer, R. L. and A. B. Bennett (1991). Role of cell wall hydrolases in fruit ripening. Annu Rev
Plant Physiol. Plant Mol. Biol. 42: 675–703. Francisco, A. T., I. G. Maria, C. Marisol, A. Francisco and M. E. Saltveit (1997). Effect of Selected
Browning Inhibitors on Phenolic Metabolism in Stem Tissue of Harvest Lettuce. J. Agri. Food Chem.45: 583–589.
Frenkel, C., J. S. Peters, D. M. Tieman, M. E. Tiznado and A. K. Handa (1998). Pectin methylesterase
Enzymes and Quality Factors of Fruits and Vegetables 21

regulates methanol and ethanol accumulation in ripening tomato (Lycopersicon esculentum) fruit.J. Biol. Chem. 273: 4293–4295.
Friedman, M. (1991). Prevention of adverse effects food browning. Adv. Exp. Med. Biol. 199:171–215.
Fujita, S., T. Tono and H. Kawahara (1991). Purification and properties of polyphenol oxidase inhead lettuce. J. Sci. Food Agric. 55: 643–651.
Fujita, S., N. B. Saari, M. Maegawa, N. Samura, N. Hayashi and T. Tono (1997). Isolation andcharacterization of two phloroglucinol oxidases from cabbage. J. Agri. Food Chem. 45: 59–63.
Friedman, M. and F. F. Bautista (1995). Inhibition of polyphenoloxidase by thiols in the absence andpresence of potato tissue suspensions. J. Agri. Food Chem. 43: 69–76.
Giovannoni, J. J., D. DellaPenna, A. B. Bennett and R. L. Fischer (1989). Expression of a chimericpolygalacturonase gene in transgenic rin (ripening inhibitor) tomato fruit results in polyuronide degra-dation but not fruit softening. Plant Cell 1: 53–63.
Golan-Goldhirsh, A. and V. Kahn (1984). Relation between structure of polyphenoloxidase and pre-venting of browning. In M. Friedman (ed.), Nutritional and Toxiological Aspects Food Safety.Plenum, New York, pp 457–458.
Golden, K. D., M. A. John and E. A. Kean (1993). β-Galactosidase from Coffea arabica and its rolein fruit ripening. Phytochemistry 34: 355–360.
Goldstein, L. D., P. H. Jennings and H. V. Marsh (1971). A preliminary investigation of L-phenylalanineammonia lyase activity in asparagus: Distribution and response to storage, excision and incuba-tion. Plant and Cell Physiol. 12: 657–661.
Gomes, M. R. A. and D. A. Ledward (1996). Effect of high-pressure treatment on the activity ofsome polyphenol oxidases. Food Chemistry 56: 1–5.
Gross, K. C. (1984). Fractionation and partial characterization of cell walls from normal and non-ripeningmutant tomato fruit. Physiol. Plant 62: 25–32.
Gross, K. C. and C. E. Sams (1984). Changes in cell wall neutral sugar composition during fruit ripening:a species survey. Phytochemistry 23: 2457–2461.
Gunes, G. and C. Y. Lee (1997). Colour of minimally processed potatoes as affected by modified atmos-phere packaging and antibrowning agents. J. Food Sci. 62: 572–575, 582.
Hadfield, K. A., J. K. C. Rose, D. S. Yaver, R. M. Berka and A. B. Bennett (1998). Polygalacturonasegene expression in ripe melon fruit supports a role for polygalacturonase in ripening-associated pectindisassembly. Plant Physiol. 117: 363–373.
Haard, N. F. (1977). Physiological roles of peroxidase in postharvest fruitsand vegetables, in Enzymesand Food Beverage Processing, Ory, R. L. and St, Angelo, eds., ACS Symposium Series 47: 143.
Halpin, B. E. and C. Y. Lee (1987). Effect of blanching on enzyme activity and quality changes ingreen peas. J. Food Sci. 52: 1002–1005.
Heimdal, H. K., L. Poll and L. M. Larsen (1995). Biochemical changes and sensory quality of shreddedand MA-packaged iceberg lettuce. J. Food Sci. 60: 1265–1268, 1276.
Hinton, D. M. and R. Pressey (1974). Cellulase activity in peach during ripening. J. Food Sci. 39:783–785.
Hsiao, P. H., J. C. Su and H. Y. Sung (1981). Changes in enzyme activities and levels of metabolitesof asparagus spears after harvest. J. Chin. Agr. Chem. Soc. 19: 1–11.
Huber, D. J. (1983). The role of cell wall hydrolases in fruit softening. Hortic. Rev. 5: 169–219.Huber, D. J. (1984). Strawberry fruit softening: the potential roles of polyuronides and hemicellu-
loses. J Food Sci. 49: 1310–1315.Huber, D. J. and E. M. O’Donoghue (1993). Polyuronides in avocado (Persea americana) and tomato
(Lycopersicon esculentum) fruits exhibit markedly different patterns of molecular weight down-shifts during ripening. Plant Physiol. 102: 473–480.
Hunt, M. D., N. T. Eannetta, Y. Haifeng, S. M. Newman and J. C. Steffens (1993). cDNA cloningand expression of potato polyphenol oxidase. Plant Mol. Biol. 21: 59–68.
Hyodo, H., H. Kuroda and S. F. Yang (1978). Induction of phenylalanine ammonia-lyase and increasein phenolics in lettuce leaves in relation to the development of russet spotting caused by ethylene.Plant Physiol. 62: 31–35.
Ilker, Y., A. A. Kader, R. Ilker and L. L. Morris (1977). Anatomy of lettuce tissue affected by threephysiological disorders. J. Am. Soc. Hortic. Sci. 102: 426–428.
22 P. K. Bhowmik and R. Dris
Jennings, D. L. (1988). Raspberries and Blackberries: Their Breeding, Diseases, and Growth. AcademicPress, London and San Diego.
Jin-Cheol, L. and E. Jong-Bang (1999). Inhibition of enzymatic browning in precut lotus roots bybrowning inhibitors and vaccum packaging. Acta Hortic. 483: 349–353.
Joles, D. W., A. C. Cameron, A. Shirazui, P. D. Petracek and R. M. Beaudry (1994). Modifiecatomasphere packaging of heritage red raspbeery fruit: Respiratoyr response to reduced oxygen,enhanced carbondioxide and temperature. J. Am. Soci. Horti. Science 119: 540–545.
Kader, A. A. (1999). Fruit maturity, ripening, and quality relations. Acta Hortic. 485: 203–221.Kang, I. K., S. G. Suh, K. C. Gross and J. K. Byun (1994). N-terminal amino acid sequence of per-
simmon fruit β-galactosidase. Plant Physiol. 105: 975–979. Kim, J., K. C. Gross and T. Solomos (1991). Galactose metabolism and ethylene production during
development and ripening of tomato fruit. Post. Biol Technol 1: 67–80. Kitagawa, Y., Y. Kanayama and S. Yamaki (1995). Isolation of β-galactosidase fraction from Japanese
pear: Activity against native cell wall polysaccharides. Physiol. Plant 93: 545–550.Knee, M. (1973). Polysaccharide changes in cell walls of ripening apples. Phytochemistry 12: 1543–1549.Kramer, A. and B. A. Twigg (1970). Quality control for the food industry, vol. 1. AVI, Westport,
Conn, p. 556.Kramer, M., R. Sanders, H. Bolkan, C. Waters, R. E. Sheehy and W. R. Hiatt (1992). Postharvest
evaluation of transgenic tomatoes with reduced levels of polygalacturonase: processing, firmness anddisease resistance. Post. Biol. Tech. 1: 241–255.
Kristen, A., K. C. Jocelyn, S. Debbie, M. B. Randy and A. B. Bennett (1998). Polygalacturonasegene expression in ripe melon fruit supports a role for polygalacturonase in ripening-associated pectindisassembly. Plant Physiol. 117: 363–373.
Kruger, F. J., L. Tait, M. Kritzinger, M. Bezuidenhot and V. Claassens (1999). Postharvest browningin South African subtropical export tropical. Acta Horti. 485: 225–229.
Langdon, T. T. (1987). Prevention of browning in prepared potatoes without the use of sulfitingagents. Food Technology 41: 64–67.
Laarigaudiere, C., I. Lentheric and M. Vendrell (1998). Relationship between enzymatic browningand internal disorders in controlled-atmosphere stored pears. J. Sci. Food Agri. 78: 232–236.
Laurila, E., E. Hurme and R. Ahvenainen (1998). The shelf-life of sliced raw potatoes of various cultivarvarieties – substitution of bisulphites. Journal of Food Protection (in press)
Lester, D. R., W. B. Sherman and B. J. Atwell (1996). Endopolygalacturonase and the melting flesh(M) locus in peach. J. Am. Soc. Hortic. Sci. 121: 231–235.
Lozano-de-Gonzalez, P. G., D. M. Barrett, R. E. Wrolstad and R. W. Durst (1993). Enzymatic browninginhibited in fresh and dried apple rings by pineapple juice. J. Food Sci. 58: 399–404.
Luo, Y. (1992). Enhanced control of enzymatic browning of apple slices by papain. Dissertation,Washington State University, Pullman, USA.
Mateos, M., M. Cantwell and A. A. Kader (1993). Phenolic metabolism and ethanolic fermentationof inact and cut lettuce exposed to CO2-enriched atmospheres. Postharvest Bio. Technol. 3: 225–233.
McCollum, T. G., D. J. Huber and D. J. Cantliffe (1989). Modification of polyuronides and hemicel-luloses during muskmelon fruit softening. Physiol. Plant 76: 303–308.
Margarita, C-P. and M. Y. Elhadi (1998). Changes in Capsaicinoids during development, maturation,and senescence of chile peppers and relationwith peroxidase activity. J. Agric. Food Chem. 46:2075–2079.
Matheis, G. (1987). Polyphenoloxidase and browning of potatoes. Enzymactic browning and potato con-stituents. Chem. Mikrobiol. Technol. Lebensm. 11: 33–41.
Mattila, M., R. Ahvenainen and E. Hurme (1995). Prevention of browning of pre-peeled potato. In J.de Baerdemaeker, B. McKenna, M. Janssens, A. Thompson and Z. Somogyi (eds.), COST 94.Post-harvest treatment of fruit and vegetables. Proceedings of a workshop on systems and opera-tions for postharvest quality, Leuven, Belgium, 14–15 September 1993. Commission of the EuropeanCommunities, pp. 225–234.
Mackenzie, K. A. D. (1979). The structure of the red raspberry in relation to abscission. Annals of Botany43: 355–362.
Mayer, A. M. and E. Harel (1979). Polyphenol oxidase in plants. Phytochemistry 18: 193–215.Mayer, A. M. (1987). Polyphenol oxidases in plants – recent progress. Phytochemistry 26: 11–20.
Enzymes and Quality Factors of Fruits and Vegetables 23
McEvily, A. J., R. Iyenger and T. Gross (1992). Inhibition of Polyphenol oxidase by Phenolic com-pounds. In Phenolic compounds in food and their effect on health, ACS Symposium Series 507,Washington, DC, USA.
Molnar-Perl, I. and M. Friedman (1990). Inhibition of browning by sulfur amino acids. Part 3. Applesand potatoes. J. Agril. Food Chem. 38: 1652–1656.
Morales-Blancas, E. F., V. E. Chandia and L. Cisneros-Zevalloos (2002). Thermal inactivationkinetics of peroxidase and lipoxygenase from broccoli, green asparagus and carrots. J. Food Sci.67: 146–154.
Muneta, P. C. (1981). Comparison of inhibition of tyrosine oxidation in the enzymatic blackening ofpotatoes. Am. Potato J. 38: 1202–1204.
Murata, M., M. Tsurutani, M. Tomita, S. Homma and K. Kaneko (1995). Relationship between appleripening and browning: Changes in polyphenol content and polyphenol oxydase. J. Agril. Food Chem.43: 1115–1121.
Nisperos-Carriedo, M. O., E. A. Baldwin and P. E. Shaw (1988). Development of an edible coatingfor extending post harvest life of selected fruits and vegetables. Proceedings of the Florida StateHorticultural Society 104: 122–125.
Nogata, Y., H. Ohta and A. G. J. Voragen (1993). Polygalacturonase in strawberry fruit. Phytochemistry34: 617–620.
Oszmianski, J. and C. Y. Lee (1990). Inhibition of polyphenol oxidase activity and browning byhoney. J. Agril. Food Chem. 38: 1892–1895.
Paul, R. E. and K. G. Rohrbach (1982). Juice characteristic and internal atomosphere of waxed smoothcayenne pineapple fruits. J. Am. Sci. Hort. Sci. 107: 448–452.
Pinsent, B. R. W. (1962). Peroxidase regeneration and its effect on quality in frozen peas and thawedpeas. J. Food Sci. 27: 120–123.
Powers, J. R. and S. R. Drake (1980). Effect of cut and field-holding conditions on activity ofPhenylalanine ammonia lyase and texture in fresh asparagus spears. J. Food Sci. 45: 509–510,513.
Pressey, R. (1983). β-Galactosidases in ripening tomatoes. Plant Physiol. 71: 132–135.Pressey, R (1987). Exopolygalacturonase in tomato fruit. Phytochemistry 26: 1867–1870. Porritt, S. W., M. Meheriuk and P. D. Lindster (1982). Postharvest disorders of apples and pears. Agr
Can Pub no. 1737.Ranwala, A. P., C. Suematsu and H. Matsuda (1992). The role of β-galactosidases in the modifica-
tion of cell wall components during muskmelon fruit ripening. Plant Physiol. 100: 1318–1325.Reeve, R. M. (1954). Fruit histogenesis in rubus strigosius. I. Outer epidermis, pulp and receptacle
parenchyma. Ame. J. Bot. 41: 153–156.Reeve, R. M., E. Wolford and C. C. Nimmo (1965). The view of fruit structure and the processing of
raspbeery. Hortscience 27: 331–333.Ricard, J. and G. Noat (1986). Electrostatic effects and the dynamics of the enzyme reactions at the
surface of plant cells. 1. A theory of the ionic control of a complex multi-enzyme system. Eur. J.Biochem. 155: 183–190.
Rose, J. K. C., K. A. Hadfield and A. B. Bennett (1998). Temporal sequence of cell wall disassemblyin rapidly ripening melon fruit. Plant Physiol. 117: 345–361.
Ross, G. S., R. J. Redgwell and E. A. MacRae (1993). Kiwifruit β-galactosidase: isolation and activityagainst specific fruit cell-wall polysaccharides. Planta 189: 499–506.
Ross, G. S., T. Wegrzyn, E. A. MacRae and R. J. Redgwell (1994). Apple β-galactosidase. Activityagainst cell wall polysaccharides and characterization of a related cDNA clone. Plant Physiol.106: 521–528.
Sanchez, J. A., J. P. Zamorano and R. Alique (1998). Polygalacturonase, cellulase and invertase activ-ities during cherimoya fruit ripening. J. Horti. Sci. & Biotech. 73: 87–92.
Santerre, C. R., T. F. Leach and J. N. Cash (1991). Bisulfite alternatives in processing abrasion-peeledrusset burbank potatoes. J. Food Sci. 56: 257–259.
Sapers, G. M., K. B. Hicks, J. G. Phillips, L. Garzarella, D. L. Pondish, R. M. Matulaitis, T. J.McCormack, S. M. Sondey, P. A. Seib and Y. S. El-Atawy (1989). Control of enzymatic browningin apples with ascorbic acid derivatives, polyphenol oxidase inhibitors, and complexing agents. J.Food Sci. 54: 997–1002, 1012.
24 P. K. Bhowmik and R. Dris
Sapers, G. M. and R. L. Miller (1992). Enzymatic browning control in potato with ascorbic acid-2-phos-phates. J. Food Sci. 57: 1132–1135
Schillinger, U., R. Geisen and W. H. Holzapfel (1996). Potential of antagonistic microorganisms andbacteriocins for the biological preservation of foods. Trends in Food Science and Technology 7:158–164.
Schuch, W., J. Kanczler, D. Robertson, G. Hobson, G. Tucker, D. Grierson, S. Bright and C. Bird (1991).Fruit quality characteristics of transgenic tomato fruit with altered polygalacturonase activity.Hortscience 26: 1517–1520.
Sessa, D. J. and R. L. Anderson (1981). Soybean peroxidases: purification and some properties. J. Agric.Food Chem. 29: 960.
Sexton, R., M. Jane, N. Palmer and L. Susan (1997). Cellulase, fruit softening and abscission in redraspberry (Rubus idaeus L. cv Glen Clova). Annals of Botany 80: 371–376.
Seymour, G. B. and K. C. Gross (1996). Cell wall disassembly and fruit softening. Postharvest NewsInfo 7: 45N–52N.
Sheehy, R. E., M. Kramer and W. R. Hiatt (1988). Reduction of polygalacturonase activity in tomatofruit by antisense RNA. Proc Natl Acad Sci USA 85: 8805–8809.
Sheu, S. C. and A. O. Chen (1991). Lypoxygenase as blanching index for frozen vegetable soybeans.J. Food Sci. 56: 448–451.
Sjulin, T. M. and J. Robbins (1987). Effect of maturity, harvest date and storage time on postharvestquality of red raspbeery. HortScience 25: 679–681.
Smith, J. L. and D. Stanley (1989). Toughening in blanched asparagus: identification of phenoliccompounds and evidence for a free radical mechanism. J. Food Biochem. 13: 271.
Smith, C. J. S., C. F. Watson, J. Ray, C. R. Bird, P. C. Morris, W. Schuch and D. Grierson (1988).Antisense RNA inhibition of polygalacturonase gene expression in transgenic tomatoes. Nature334: 724–726.
Smith, C. J. S., C. F. Watson, J. Ray, C. R. Bird, G. B. Seymour, J. E. Gray, C. Arnold, G. A. Tucker,W. Schuch and S. Harding (1990). Inheritance and effect on ripening of antisense polygalactur-onase genes in transgenic tomatoes. Plant Mol. Biol. 14: 369–379.
Tong, C. B. S. and K. B. Hicks (1991). Sulfated polysaccharides inhibit browning of apple juice anddiced apples. J. Agric. Food Chem. 39: 1719–1722.
Thygesen, P. W., I. B. Dry and S. P. Robinson (1995). Polyphenol oxidase in potato. A multigene familythat exhibits differential expression patterns. Plant Phyisiol. 109: 525–531.
Wagenknecht, A. C. and F. A. Lee (1958). Enzyme action and off-flavour in frozen peas. Food Res.23: 25.
Wang, C. Y. (1999). Postharvest quality decline, quality maintenance and quality evaluation. ActaHorticulturae 485: 389–340.
Whitaker, J. R. and C. Y. Lee (1995). Recent advances in chemistry of enzymatic browning. In C. Y.Lee and J. R. Whitaker (eds.), Enzymatic browning and its prevention. ACS Symposium Series600, Washington, DC, USA, pp. 2–7.
Wu, Q., M. Szakacs-Dobozi, M. Hemmat and G. Hrazdina (1993). Endopolygalacturonase in apples(Malus domestica) and its expression during fruit ripening. Plant Physiol. 102: 219–225.
Yueming J., P. Zauberman and Y. Fuchs (1999). Purification of polyphenoloxidase and the browningcontrol of litchi fruit by glutathione and citric acid. J. Sci. Food Agric. 79: 950–954.
Zhou, Y., Y. Tang, X. Tan and J. Guo (1996). Effects of exogenous ABA,GA3 and cellwall-degradingenzyme activity, carotenoid content in ripening mango fruit. Zhiwu Shengli Xuebao 22: 421–426.
Enzymes and Quality Factors of Fruits and Vegetables 25
VOLATILE FLAVOURS IN STRAWBERRIES: A DESCRIPTION OF THE COMPONENTS, AND HOW TO ANALYSE THEM
RANDI UTRE HOLTFaculty of Technology, Sør-Trøndelag University College, Trondheim, Norway
1. INTRODUCTION
1.1. The strawberry, Fragaria Linnaeus
The genus Fragaria Linnaeus belongs to the Rose family (Rosaceae, subfamilyRosoideae, tribe Potentilleae). There are three native European species of FragariaF. vesca L., the wood strawberry, F. viridis L., the bitter tasted, green strawberry andthe musk-flavoured strawberry, F. moschata L. (Høeg, 1984). The cultivated straw-berries, Fragaria × ananássa Duchesne, was in 1766 recognised as a hybrid betweena female from Chile, F. chiloensis, and a male from North America, F. virginiana.The resemblance of the new strawberry to the pineapple in fragrance, taste and berryshape gave it its name (Darrow, 1966).
A strawberry is a dynamic system whose chemical composition changes con-stantly due to enzymatic and chemical processes. The exact composition of astrawberry may vary between cultivars, growth, storage conditions and years. Asan example, the vitamin C content in strawberries differ greatly, ranging from 39mg to 89 mg/100 g (Darrow, 1966). Reports from Denmark show variations from33.1 mg vitamin C/100 g Senga Sengana in 1991 to 73.7 mg vitamin C/100 g Zephyrin 1990 (Kidmose et al., 1996). Berries ripening in the sun have a higher vitaminC content than those ripening in the shade. After picking, damaged berries tend tolose vitamin C rapidly. Uninjured berries lose no vitamin C for at least three dayswhen stored at 6 °C to 24 °C. Capped berries at 24 °C lose between 10% and15% of vitamin C in twenty-four hours, and between 85% and 90% in forty-eighthours (Darrow, 1966).
1.2. Flavour; taste, smell and volatile flavour components
There are several definitions of flavour. Some emphasise the idea that flavour is a‘total’ experience that arises from stimulation of the sense of taste, the sense of smelland other senses (Thomson, 1986). The British Standards Institution defines it as‘The combination of taste and odour. It may be influenced by sensations of pain,heat and cold, and by tactile sensations’. Sensory methods, smell and taste, arevery old criteria used in evaluating food. Benzaldehyde, isolated from bitter almonds,was the first flavour component to be identified in 1832. About 50 years later vanillinwas the first flavour component to be synthesised, and thereby started the flavourindustry (Maarse, 1991).
R. Dris and S. M. Jain (eds.), Production Practices and Quality Assessment of Food Crops,
© 2004 Kluwer Academic Publishers. Printed in the Netherlands.
27
Vol. 3, “Quality Handling and Evaluation”, pp. 27–54.
It seems that strawberry flavour is due to a complex mixture of both organicand inorganic components. Dirink et al. (1984) found different amounts of sulphurcomponents: methane thiol, dimethyl sulphide, methyl thiol acetate, dimethyldisulphide and methyl thiol butanoate, in several strawberry varieties. They found85 ng sulphur/L of headspace, the gas phasee above the berries, in the varietyPrimella, 150 ng/L in Korona and 1123 ng/L in Souvenir. Dirink et al. relatedthese differences to differences in intensity of strawberry flavour. Varieties withthe highest concentration of sulphur-components were found to have the most intensestrawberry flavour.
The first study reported of strawberry flavour was in late 1930s by A. Coppensand L. Hoejenbos. They extracted 445 kg of strawberry with diethyl ether and endedup with 86 g of neutral oil from which they could identify twelve componentspositively (Maarse, 1991). In 1990, 360 components were identified in strawber-ries (Latrasse, 1991).
Taste is the perception of sensory characters and usually implies saltiness, sweet-ness, acidity (sourness) and bitterness. The fifth taste, umami, is defined as thetaste of a group of amino acids and nucleotides (Kato et al., 1989). Some also includeelectric, alkaline and metallic as ‘subqualities’ of taste (Thomson, 1986). Receptorsof the sense of taste are the gustatory cells gathered in taste buds located on thetongue (Ache, 1991).
Sweet and sour are the major non-volatile flavour components in strawberry. 75%of the carbohydrate (about 6% of the berry weight) in strawberries is sugar: sucrose,glucose and fructose. The relative amount of sugar increases with maturation andis influenced solely by the amount of light to which the plants are subjected duringthe day (Went, 1957). The sugar composition varies with the degree of ripening. Theconcentration of glucose and fructose are high, while the concentration of sucroseis low early in strawberry growth. The total amount of sugar increases by matura-tion and likely increases fruit sweetness and enlargement. The expansion of fruitcells is influenced by turgor pressure partly due to the concentration of sugar. In ripefruit the concentration of sucrose is much elevated compared to immature straw-berries. More than 70% of total sugar content is accumulated in the vacuole ofthe strawberry tissue (Ofosu-Anim and Shohei, 1994). Some fruits, e.g. bananasand pears, store carbohydrates as starch, they must be picked when green and hardin order to become firm fruit with a good quality (Teranishi, 1989). Strawberrieshave no starch reserve to act as sugar source during ripening, but are dependenton rapid importation of carbohydrates from the plant. This transport can only occurif the fruit is attached to the plant and the leaf structures are adequate and biosyn-thetically active (Wyllie et al., 1995). To obtain desirable concentrations of sugar,strawberries should be picked at fully ripe conditions.
The amount of titratable acid is an important quality parameter for strawberriesand is expressed as g citric acid in 100 g of strawberries. The level will decreaseduring ripening (Went, 1957), but will vary significantly among cultivars andbetween years. In one experiment 100 g Zephyr contained 1.13 g titratable acid in1990, and 0.85 g in 1991. The corresponding results for 100 g Korona (in 1990and 1991) were 0.83 g and 0.73 g, respectively (Kidmose et al., 1996). An averagepH of 3.35 (3.28–3.42) was found in ripe strawberries from measuring six cultivated
28 Randi Utre Holt

varieties. When ripe strawberries were frozen and then thawed, the amount oftitratable acids was found to increase (Hirvi, 1983). Hexanoic acid was elevatedin most varieties.
The human sense of smell, the olfactory sense, is qualitatively more diversethan that of taste, more than 17 000 different odour qualities can be distinguished(Thomson, 1986). The sense of smell is also more sensitive than taste. The humannose can detect certain volatile components at concentrations as low as 10–18 molar.Receptors for the olfactory sense are special neurones in the nasal cavity, theolfactory epithelium. Chemical stimuli are generally thought to bind to membrane-associated proteins on the surfaces of the receptor cells. Chemo-sensitivity showsa high degree of specificity in the nature of receptor proteins, as enantiomericdiscrimination. Humans can discriminate the enantiomeric forms of many differentchiral components, such as the D- and L-isomers of carvone, which are perceivedas the odour of caraway and spearmint, respectively, even though the two mole-cules differ only in being mirror images of each other (Ache, 1991).
1.3. Volatile flavour components
Humans are quite sensitive to volatile materials. Volatile flavours act as chemicalmessengers on human beings. Some foods are liked or disliked because of mate-rials present in very small concentrations. Components responsible for strawberryflavour constitute a very small part of the berry and they cover a large range ofchemicals, mostly esters, carbonyls, alcohols and inorganic compounds. There aresignificant differences among varieties regarding concentration and compositionof volatiles. Volatiles in wild European strawberries have a very different compo-sition than that of cultivated species (Drawert et al., 1973; Pyysalo et al., 1979; Hirvi,1983). Cultivated species are more similar to the North American wild species F.virginiana and F. chiloensis (Drawert et al., 1973).
Two terms are connected to volatile flavour analyses: ‘Aroma value’ and‘Threshold value’. Threshold value is the minimum quantity of a component thatcauses an odour detectable by a specific percentage of panel members (Teranishiet al., 1971). ‘Aroma value’ is the ratio of concentration to threshold value of acertain component. A. F. Thomas defined this term in 1963. Guadagni (1966)called it ‘odour unit’ and Mulders (1973) used the name ‘odour value’ for thesame definition. Some authors have criticised the use of odour /aroma values, statingthat threshold value may be complicated to determine and factors such as carriergas, interactions and synergism between different components, may influence thecontribution of different components to the total flavour (Hirvi, 1983). However,in spite of these limitations, these units make it possible to assess the relativecontribution of different components to the odour intensity of a total volatileisolate.
Näf et al. (1990) stated that 358 flavour volatiles were identified in strawberryaroma, and their relative quantity is 10 ppm (0.001%) of total weight. Esters, 131components, are responsible for the fruity and floral notes. Alcohols, 56 compo-nents, may function as enhancers for other flavour volatiles, as they do in perfumes.Linalool is the only alcohol, which directly contribute to the flavour character.
Volatile Flavours in Strawberries 29

Carbonyls (12 aldehydes and 16 ketones) are considered secondary products, becausetheir concentration increase with cell damages. 46 different acids are identified,of which only 2-methylbutanoate has the characteristic strawberry flavour, theother acids are found in concentrations lower than their threshold values (Latrasse,1991). Lactones, furanones and inorganic compounds, many of which are sulphurcontaining, contribute the flavour of strawberries.
The main volatile components in strawberries, qualitatively and quantitatively,are esters formed from volatile organic acids with an even carbon number such asacetic, butanoic and hexanoic acid (Schreier, 1980; Dirink et al., 1984; Perez etal., 1992; Olias et al., 1995). Methyl- and ethyl butanoate, methyl hexanoate andhexyl acetate are, according to Perez et al. (1992), main contributors to the aromaof strawberry. Ethyl hexanoate (sweet fruity and refreshing note) is found to havea high aroma value in some cultivars but is not registered in wild strawberries.
As the strawberry ripens there is an increase in the synthesis of flavour compo-nents (Perez et al., 1992). Post harvest development of under-ripe strawberriesshow that they become fully red in colour, but they remain hard, high in acid, lowin sugar and lack ripe strawberry aroma. Although aroma synthesis begins as colourdevelops, the concentration never reaches that of ripe fruit (Miszczak et al., 1995).Table 1 shows flavour components most frequently reported in strawberries. Theconcentrations listed were found by Larsen et al. (1992) from studying eight dif-ferent cultivars at full ripe stages. Samples were prepared by liquid extraction,with diethyl ether and n-pentane, from strawberry press juice and analysed bycapillary GC/MS.
2,5-dimethyl-4-methoxy-3(2H)-furanone, ‘mesifurane’, and 2,5-dimethyl-4-hydroxy-3(2H)-furanone, ‘furaneol’, are considered among the most importantvolatiles in wild strawberries (Sanz et al., 1995). These components are not foundin all cultivated varieties (Dirink et al., 1977; Schreier, 1980; Fischer andHammerschmidt, 1992; Larsen et al., 1992). Where they are found, they appear asracemic forms. Each enantiomer has different threshold values and different sensorycharacteristics even though they vary only in the position of one methyl group(Fischer and Hammerschmidt, 1992).
1.4. Volatile flavour components and secondary metabolism
Hartmann (1996) distinguishes between metabolic pathways in plants that are essen-tial to growth and development (i.e. primary metabolism) and those that arenon-essential in this context (i.e. secondary metabolism). Secondary plant metabo-lites function as chemical signals in the ecosystem. Their functions concern allaspects of the plants’ chemical interaction with the environment: defence, protec-tion against physical effects, attraction and stimulation.
Primary metabolism is functionally indispensable for the individual, and isuniform, universal and conservative. It must be stringently maintained stable toensure the structural and functional integrity of the organism.
Secondary plant metabolism is entirely different; it is not necessary for growthand development of the individual, but essential for survival of a population. It isunique, diverse and adaptive (Hartmann, 1996). Secondary pathways often consti-
30 Randi Utre Holt

tute a basic route, leading to one or a few key-metabolites (P in Figure 1) that arediversified by enzymatic transformation (P1 to P5 in Figure 1).
One of the unique features of the secondary metabolism is the high ‘degree offreedom’, in the chemical sense, of its components. A certain constituent can varyqualitatively and quantitatively or may disappear without disastrous consequencesfor the growth of the producing plant. This ability of variation is the prerequisitefor diversification under selective pressure of a competing and changing environ-ment (Hartmann, 1996). Volatile flavour components are considered secondarymetabolites.
Basic routes and transformations are often separated in location or time of devel-opment. As an example menthone is produced during the early stages of mint leaf
Volatile Flavours in Strawberries 31
Table 1. Concentrations of volatile flavour components in cultivated strawberry and characterisationof the fragrance (Larsen et al., 1992).
Component concentration (mg/kg) Fragrance characterisation
Esters
ethyl acetate 00.5–1.9 contact gluebutyl acetate 0.05–0.24 apple, gluehexyl acetate 0.04–0.1 banana, apple, pearmethyl butanoate 0.00–7.5 fruity, cheeseethyl butanoate 00.0–4.5 fruity, sweet, cheesemethyl hexanoate 00.0–0.56 fruityethyl hexanoate 0.03–0.5 fruity, fruit gum
Alcohols
hexanol 0.00–0.4 green, heavy, nutstrans-2-hexenol 0.07–0.5 green, fruity, burnedlinalool 00.1–0.5 lemon peel, flowersnerolidol 0.34–0.8 pine
Carbonyls
hexanal 00.3–1.4 green, sourtrans-2-hexenal 02.5–5.4 green grass, almond2-pentanone 0.13–3.1 kerosene, solvents2-heptanone 0.00–0.17 Danish blue cheese
Acids
acetic acid 01.5–146 vinegarpropanoic acid 0.00–0.66 fruitybutanoic acid 01.1–18 sourhexanoic acid 0.02–15 sour sweet2-methyl propanoic acid 00.5–2.5 sourish, burnt2-methyl butanoic acid 02.6–12 fruity, sourish
Others
2,5dimethyl-4methoxy3(2H)furanone 0.00–11.5 bread crust2,5dimethyl-4hydroxy3(2H)furanone 0.05–55 burnt, sweet, caramelγ-decalactone 0.00–2.8 peach

development and is further transformed into menthol, menthyl esters and mentho-furane in maturing mint leaves, which no longer de novo synthesise monoterpenes.Generally these transformations are simple chemical modifications which arecatalysed by highly substrate specific enzymes. Usually there is no need for sec-ondary compounds to undergo rapid ‘turnover’, they are to be synthesised for storageat the right place and time in concentrations needed to fulfil their functions(Hartmann, 1996).
Problems with biochemical instability and phytotoxity of individual flavourcompounds are resolved in the intact plant by compartmentalization and cellspecialisation. Often a physical separation between synthesis and storage is alsoprovided. E.g. monoterpenes are phytotoxic, in the plant they are sequestered extra-cellularly in the space between cell wall and cuticle of the secretory cells of theoil glands (Rhodes et al., 1992). Water soluble secondary compounds (e.g. furanonesand mesifurans) are stored in cell vacuoles. Specific membrane-carriers and otherbiochemical mechanisms are needed to maintain the often extremely high vacuolarconcentrations of certain components. Lipophilic compounds accumulate in glan-dular trichomes (e.g. the monoterpenes of mint), in resin ducts (e.g. in pine trees)or secretory cavities (e.g. in orange peels). All these compartments contain largeintercellular space, lined by specialised epithelial cells that synthesise and specifi-cally secrete the lipophilic compound into the extra cellular space (Hartmann, 1996).
1.5. Metabolism of flavour volatiles in strawberry
There are three main types of organic volatile metabolites formed by strawberryfruit: esters, alcohols and saturated carbonyls. Esters are produced from aliphaticalcohols [e.g. (Z)-3-3-hexenyl acetate from (Z)-3-hexen-1-ol]. Alcohols are formedby the reduction of aliphatic aldehydes (e.g. 1-hexanol from hexanal). Saturatedproducts develop from reduction of carbon-carbon double bonds conjugated withan aldehyde or ketone carbonyl moiety [e.g. 2-nonanone from (E)-nonen-2-one](Hamilton-Kemp et al., 1996)
Radioactive tracer works show that amino acids are the precursors of many of
32 Randi Utre Holt
Figure 1. The dynamic of pathways in secondary metabolism. A, B and C are intermediates of basicpathways. P is the key-intermediate. P1 to P5 are transformation products (Hartmann, 1996).

the aroma volatile components formed in strawberries during ripening (Wyllie et al.,1995). Valine can be converted to esters containing the 2-methylpropyl structure,isoleucine to esters containing the 2-methylbutyl structure. Alanin can supply theesterification reactions with both the ethyl group and the acetate group found inmany of the aroma volatiles, and methionine is the precursor for ethylene, theripening hormone.
Each plant has its own set of enzymes and pH, thereby producing differentvolatiles from the same unsaturated fatty acid, mostly linoleic acid and olenicacids. Unsaturated fatty acids are an essential part of every plant cell usually inthe form of triglycerid, phospholipid or lipoprotein. As an example C6 compoundsas hexanol, hexanal and trans-2-hexenal are formed through enzymatic oxidationof linoleic acid and linolenic acid. The fragrance of these C6 compounds aredescribed as having a ‘green’ note.
Olias et al. (1995) studied the substrate specificity of alcohol acyltransferase(AAT) purified from strawberry tissue. The enzyme showed highest activity withhexyl alcohols and butyl-Coenzyme A. The enzyme was more active to straight-chain alcohols (e.g. pentyl alcohol) than against branched chain alcohols (e.g.2-pentyl alcohol) of the same carbon number. A clear correlation between estercomposition and alcohol specificity was found. The work suggested that the sub-strate specificity of the AAT enzyme could be a key factor in aroma biogenesis offruits.
Ueda et al. (1992) reported that the pattern of ester formation in strawberrieswas due to the alcohol specifics of the enzyme and the amount of alcohols avail-able in the same fruit. Yamashita et al. (1975) found that an incubated, whole,intact strawberry would absorb added aliphatic alcohols and acids from the atmos-phere and convert them into carboxyl esters. The ester production was increasedif the berry was cut into two to six pieces prior to incubation. This formation didnot occur if the berries were heated or homogenised, or were at an unripe stage.The ester-forming enzyme system was found to develop at the later stages ofmaturity.
All fruit tissue also contains high levels of esterase activity, the enzyme whichcatalyses the reverse reaction of AAT. Fruits with high values of esterase activity(e.g. bananas) were shown to have low AAT activity (Olias et al., 1995).
Individual flavour components are responsible for taste and smell, while thetotal sensation determined from sensory analyses is a result of the integration ofall the flavour stimuli in a mixture.
2. ANALYSIS
The amount of flavour volatiles measured in a berry may depend on the analyt-ical technique used. Isolation, identification and quantitative determination of flavourcomponents are complex problems. In order to measure small variations with ahigh degree of reliability, the methods chosen must be selective and precise inevery sequence of the procedure involved.
As major fruit flavour impact components are volatile, capillary gas chro-
Volatile Flavours in Strawberries 33

matography (GC) is a natural choice to separate the components in complex mixtures.Mass spectrometry (MS), furrier transformed IR (FTIR) or flame ionisation (FI)can be suitable detectors for these analyses. Multidimensional GC with a secondchiral column, which is able to separate enantiomeric components, can provide infor-mation about which enantiomere is more abundant in a particular fruit.
When interpreting a chromatogram from a fruit analysis, it is important to knowhow the sample preparation was performed, and to understand how different samplepreparation techniques will effect the components to be investigated. It can be achallenge finding an adequate method for sample preparation.
Dirinck et al. (1977) realised the importance of isolating the volatiles for thestrawberry in a representative way. Inspired by pollution chemistry, an adsorbingagent of poly aromatic polar polymer, Tenax GC, was chosen for collecting volatilesfrom the dynamic headspace over homogenised strawberries. Helium was used asa ‘collecting’ gas. Samples were injected into the GC by heating the adsorbent whilehelium flowed through the adsorbent. Strawberry flavour was found mainly to consistof volatile organic esters. Hirvi and Honkanen (1982) found fewer components whenvolatiles were isolated by adsorption on Tenax GC, than when solvent extractionwas used as sample preparation technique before GC separation. Steam distilla-tion extraction is avoided today as it is known to thermally decompose certaincompounds. Ulrich et al. (1995) used freon extraction and capillary GC/MS. Theyidentified 120 volatiles, and found that each strawberry variety had its own quan-titative ‘fingerprint’ pattern.
‘Purge and trap’ methods also called ‘dynamic headspace’, are techniques wherea continuous flow of inert gas is used to carry out the extraction of the sample.During 5–10 hours of purging, a large volume of gas, often 300–600 l of nitrogengas, flows through a two chambered sample tube filled with an adsorbent ofsynthetic porous polymer, e.g. Porapak Q. Such sample tubes consisted of twochambers containing e.g. 150 mg and 75 mg adsorbent, respectively. The adsor-bent retains volatile flavour components, while it neglects water and nitrogen.Figure 2 illustrates a ‘dynamic headspace’ apparatus where 1. gas, 2. valve, 3.flow meter, 4. gas purifier (charcoal), 5. glass container with berries, 6. glass rings,7. adsorption chambers. The concentrated components are extracted from theadsorbing material with a small (1 ml) volume of solvent and introduced to acapillary GC by a syringe.
Basically, all current sample preparation methods require transfer of the volatilecomponents to a trapping system of some sort with rejection of water. Traditionalpreparation techniques, such as liquid extraction (e.g. Soxhlet extraction), havethe disadvantage of using toxic organic solvents. To avoid toxic organic solvents,gas phase sample preparation methods, such as static headspace and purge andtrap extraction (dynamic headspace) have been widely used. Static headspacesampling is low in sensitivity because it lacks a concentrating effect. ‘Purge andtrap’ is found to extract a lot of components from the strawberry sample, but itmay become time consuming. In the literature dynamic headspace is reported tobe a widely used sample preparation technique for volatile flavour components(Dirinck et al., 1984; Maarse, 1991; Ueda et al., 1992; Buttery and Ling, 1996).
Another gas-based sample preparation technique is supercritical fluid extrac-
34 Randi Utre Holt
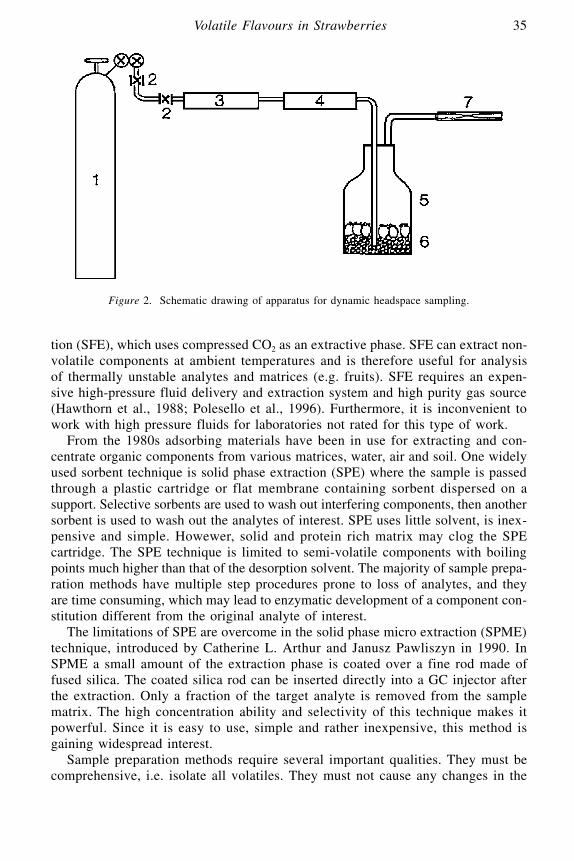
tion (SFE), which uses compressed CO2 as an extractive phase. SFE can extract non-volatile components at ambient temperatures and is therefore useful for analysisof thermally unstable analytes and matrices (e.g. fruits). SFE requires an expen-sive high-pressure fluid delivery and extraction system and high purity gas source(Hawthorn et al., 1988; Polesello et al., 1996). Furthermore, it is inconvenient towork with high pressure fluids for laboratories not rated for this type of work.
From the 1980s adsorbing materials have been in use for extracting and con-centrate organic components from various matrices, water, air and soil. One widelyused sorbent technique is solid phase extraction (SPE) where the sample is passedthrough a plastic cartridge or flat membrane containing sorbent dispersed on asupport. Selective sorbents are used to wash out interfering components, then anothersorbent is used to wash out the analytes of interest. SPE uses little solvent, is inex-pensive and simple. Howewer, solid and protein rich matrix may clog the SPEcartridge. The SPE technique is limited to semi-volatile components with boilingpoints much higher than that of the desorption solvent. The majority of sample prepa-ration methods have multiple step procedures prone to loss of analytes, and theyare time consuming, which may lead to enzymatic development of a component con-stitution different from the original analyte of interest.
The limitations of SPE are overcome in the solid phase micro extraction (SPME)technique, introduced by Catherine L. Arthur and Janusz Pawliszyn in 1990. InSPME a small amount of the extraction phase is coated over a fine rod made offused silica. The coated silica rod can be inserted directly into a GC injector afterthe extraction. Only a fraction of the target analyte is removed from the samplematrix. The high concentration ability and selectivity of this technique makes itpowerful. Since it is easy to use, simple and rather inexpensive, this method isgaining widespread interest.
Sample preparation methods require several important qualities. They must becomprehensive, i.e. isolate all volatiles. They must not cause any changes in the
Volatile Flavours in Strawberries 35
Figure 2. Schematic drawing of apparatus for dynamic headspace sampling.

nature of the volatiles, and they should be fast enough to be practical for largenumbers of analyses
3. SOLID PHASE MICRO EXTRACTION
The solid-phase micro extraction (SPME) technique involves exposing a fused silicafibre that has been coated with a stationary phase to a liquid solution or gas samplecontaining organic analytes. The technique was commercialised in 1993 by Supelco(Inc. Belmont, PA, USA) (Theodoridis et al., 2000). The device used for thissampling technique is shown in Figure 3. The organic analytes pass from the sampleinto the stationary phase until equilibrium is reached. The fibre is then removed fromthe sample and the analytes are thermally desorbed in the injector of a gas chro-matograph.
The complete user ready fibre assembly is shown in Figure 3. The fibre holderconsisting of a stainless steel barrel, a black polymeric plunger, an adjustable depthgauge with needle guide, and a stainless steel retaining nut Figure 3 A. The fibreassembly has an outer septum-piercing needle with a flanged brass ferrule, aninner fibre attachment needle with a coated fused silica extraction fibre secured atone end and a colour coated hub in the other Figure 3B. A tensioning spring islocated between the hub and the sealing septum.
The fibre can move inside a support needle, which serves as a septum-piercing
36 Randi Utre Holt
Figure 3. SPME sampling device.

device. Once inside the sample to be analysed or in the injection chamber of theGC, the fibre is pushed out of the needle and exposed to the environment in question.
In headspace-SPME, there are two processes involved: the release of analytesfrom their matrix and the absorption of analytes by the fibre coating (Zhang andPawliszyn, 1995). For any quantitative extraction to be successful, the majority ofthe analyte molecules must be released into the headspace. Then extraction candeplete the sample only if the fibre coating has very large partition coefficientsfor target analytes and there are minute amounts of target analyte in the sample.Amounts of analyte extracted into the coating from the same vial at equilibrium,using direct (from the aqueous solution) or headspace sampling, are identical(Pawliszyn, 1997).
The driving force in the transfer of the analyte from the gas phase to the coatingis the increase in thermodynamic entropy (Zhang and Pawliszyn, 1995). Equilibriumis established when transfer of an infinite small amount of the analyte betweenthe gas phase and the coating will not result in any further change in entropy.
The minimum equilibrium time (t) can be calculated if the thickness of the fibrecoating, and the smallest diffusion coefficients (Df) of the components of interestare known. Equation (1) can be used if the mass transfer of all components understudy follows a simple transport model, where diffusion in the fibre is the rate-controlling step. If other transport steps are controlling the absorption rate, other andmore complicated equilibrium criteria must be used (Pawlinszyn, 1997).
t = 0.8(thickness of coating)2/Df (1)
For 100 µm fibre coating, an absorption time of 21–24 minutes is sufficient toreach absorption equilibrium for many strawberry volatiles that follow the simpleabsorption model to reach equilibrium, but not for all components usually present
Volatile Flavours in Strawberries 37
Figure 4. (A) SPME absorption from sample headspace and (B) SPME desorbtion in a GC injectionport (Penton and Kern, 1994).

in a strawberry. For quantitative analysis it therefore is important to use a prede-termined and very exact absorption period (Holt, 2001). For strawberry volatileanalysis the sample vial, containing standards or strawberries and a magnetic bar,may be placed on a magnetic stirrer. After being equilibrated for one hour at roomtemperature, the fibre will be inserted through the vial septum and introduced intothe headspace, the gas phase above the sample in the vial. A desorption time oftwo minutes at 240 °C during split less injection may be employed. Leaving thefibre in the injector chamber for an additional ten minutes will remove residuesof adsorbed components.
3.1. Description of fibre coating
The main commercial available coatings are the apolar phase polydimethylsiloxane(PDMS), the more polar phase polyacrylate (PA), and combinations of these withdivinylbenzene (DVB) or carbowax (CW). The coatings come in different filmthickness from 7 to 100 µm. Selection of coating is mainly based on the principle‘like dissolves like’. The extraction yield of mixed phases is higher compared toPDMS, but their life-time is limited. The sorption process of the available mixedfibresis based on adsorption rather than absorption as is the case for PDMS andPA-coated fibres. This means that co-extracted compounds can more easily inter-fere with the compounds of interest (Theodoridis et al., 2000). Coating thicknessis selected according to efficiency and capacity required. A picture of a cross sectionof a SPME fibre with 100 µm polydimethylsiloxane (PDMS) coating is shown inFigure 5.
38 Randi Utre Holt
Figure 5. Cross section of SPME fibre with PDMS coating (100 µm). Scanning electron microscopy.

The texture of the amorphous coating has the resemblance of a rigid gel. Beforethe fibre was prepared, the tip was cut with a scalpel, which damaged the silica fibrecore seen in the middle of the cylinder. The polymere coating is seen as the 100(m thick homogenous layer surrounding the core. The diameter of the silica corewas measured to be 100 µm. These measurements confirm the specifications ofthe manufacturer. The length of the fibre coating was measured to be 10.6 mmwith use of a slide calliper and a magnifying glass. These measurements definesthe fibre coating volume, Vfibre = 0.666 µl.
3.2. Repeatability of retention times and component area response
In a study of the content of volatile flavour components in strawberry various straw-berry samples were prepared and analysed by headspace SPME and GC/MS (Holt,2001). The linearity of the area response to component concentration was testedby making several chromatograms of pure standards of variable concentration, dis-solved in ‘strawberry syrup’. Strawberry syrup was made to simulate the matrixof real strawberries without any flavour components present. For each of the testedcomponents, plots of area response vs. concentration were made. An example ofthe area response for some components is shown in Figure 6.
The area response for the different components was calculated with a repeata-bility of between 3% and 7% (RSD%). With even better controlled experimentalprocedures regarding factors such as temperature, sample stirring intensity, place-ment of fibre in the vial and equilibration time, it is believed that the quantitativereproducibility by SPME can be further improved.
Volatile Flavours in Strawberries 39
Figure 6. Area response vs. concentration for four volatile components SPME/GC/MS (Holt 1999).
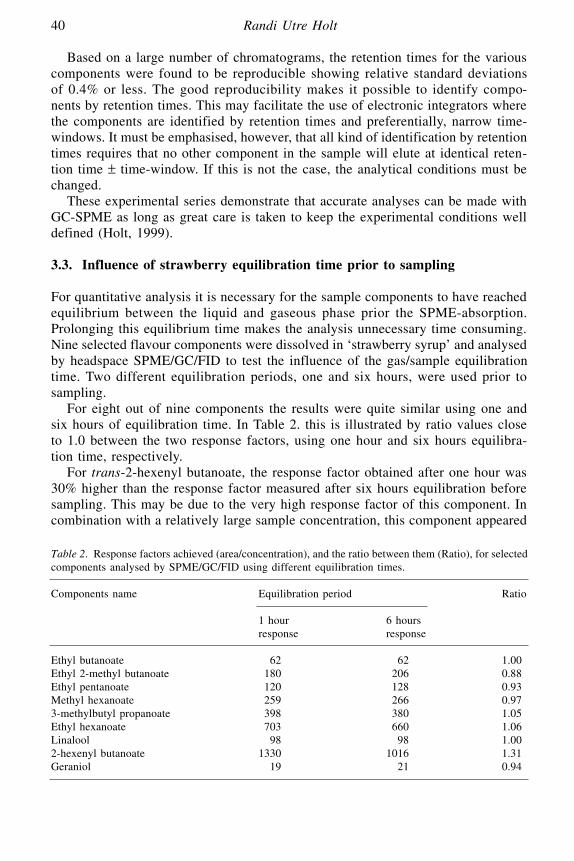
Based on a large number of chromatograms, the retention times for the variouscomponents were found to be reproducible showing relative standard deviationsof 0.4% or less. The good reproducibility makes it possible to identify compo-nents by retention times. This may facilitate the use of electronic integrators wherethe components are identified by retention times and preferentially, narrow time-windows. It must be emphasised, however, that all kind of identification by retentiontimes requires that no other component in the sample will elute at identical reten-tion time ± time-window. If this is not the case, the analytical conditions must bechanged.
These experimental series demonstrate that accurate analyses can be made withGC-SPME as long as great care is taken to keep the experimental conditions welldefined (Holt, 1999).
3.3. Influence of strawberry equilibration time prior to sampling
For quantitative analysis it is necessary for the sample components to have reachedequilibrium between the liquid and gaseous phase prior the SPME-absorption.Prolonging this equilibrium time makes the analysis unnecessary time consuming.Nine selected flavour components were dissolved in ‘strawberry syrup’ and analysedby headspace SPME/GC/FID to test the influence of the gas/sample equilibrationtime. Two different equilibration periods, one and six hours, were used prior tosampling.
For eight out of nine components the results were quite similar using one andsix hours of equilibration time. In Table 2. this is illustrated by ratio values closeto 1.0 between the two response factors, using one hour and six hours equilibra-tion time, respectively.
For trans-2-hexenyl butanoate, the response factor obtained after one hour was30% higher than the response factor measured after six hours equilibration beforesampling. This may be due to the very high response factor of this component. Incombination with a relatively large sample concentration, this component appeared
40 Randi Utre Holt
Table 2. Response factors achieved (area/concentration), and the ratio between them (Ratio), for selectedcomponents analysed by SPME/GC/FID using different equilibration times.
Components name Equilibration period Ratio
1 hour 6 hoursresponse response
Ethyl butanoate 0062 0062 1.00Ethyl 2-methyl butanoate 0180 0206 0.88Ethyl pentanoate 0120 0128 0.93Methyl hexanoate 0259 0266 0.973-methylbutyl propanoate 0398 0380 1.05Ethyl hexanoate 0703 0660 1.06Linalool 0098 0098 1.002-hexenyl butanoate 1330 1016 1.31Geraniol 0019 0021 0.94
as a huge peak in the chromatogram that could hide other components included inthe measured area reported. It may also have reached the upper limit of the detec-tors linearity, and hence the area reported is not valid for this particular peak.These results were obtained using ‘strawberry syrup’ as matrix.
3.4. Internal standards
Internal standards are pure components added to the sample to be analysed. Inquantitative analysis internal standards, of known concentrations, may be addedin order to estimate a correction compensating for loss of solutes during samplepreparation and analyses. In qualitative analysis, internal standards can be conve-nient guides for peak identification. When analysing e.g. strawberries, possibleinternal standards should be chosen among chemicals absolutely inert towardstrawberry enzymes. For quantitative analysis by SPME internal standards are notmandatory.
4. ANALYSIS OF STRAWBERRIES
Volatiles from berries of six cultivated strawberry varieties: Korona, Bounty, SengaSengana, Nora, Jonsok, and Glima were analysed by SPME (PDMS fibre)/ GC/FIDand SPME/GC/MS (Holt, 1999). The results are shown in Table 3 and are comparedwith results reported in the literature. All strawberries were grown in an open fieldarea, harvested when fully ripe and analysed one day after harvest (day 1). 22%of the volatile components were present in all six strawberry varieties, while 26%were found to be unique for one or two of the varieties, representing componentsthat are variety specific. An example of the latter is the peak number 26 at tR = 32.84minutes (γ-decalactone, fragrance of peach and coconut), which was detected onlyin Korona and Nora by this method. Ulrich et al. (1995) reported finding highconcentrations of γ-decalactone in Korona and no γ-decalactone in Senga Sengana.Douillard and Guichard (1989) reported very low amounts of γ-decalactone in SengaSengana when using ‘purge and trap’ sample preparation method together withgas chromatography.
Ueda and Bai (1993) reported that ethyl acetate and ethyl butanoate evolve atvery low rates in fresh berries kept under air. An increase of these two esters wereseen when strawberries were kept at room temperature with a high (20%) CO2 atmos-phere. The increase of these two volatiles contributed to an off-flavour to the berries.When using SPME, ethyl acetate was neither found in fresh berries, nor in mashberries stored in a vial for one day at 4 °C (Holt, 1999). Song et al. (1998) reportedto find ethyl acetate in the headspace above whole, ripe strawberries by use ofSPME/GC/FID.
Figure 7 and Figure 8 are the results from analysing volatiles from berries ofthe strawberry cultivars Korona and Glima, respectively. The analyses were per-formed by the use of non-polar SPME and gas chromatography. The berries weregrown in an open field area, harvested at fully ripe stage and analysed one dayafter harvest.
Volatile Flavours in Strawberries 41
By use of SPME/GC ethyl butanoate (fragrance of strawberry, pineapple andbanana) was detected in all cultivars, except Nora. The amount is however lowestin fresh berries and is found to increase during storage (Holt, 1999). Several workers(Schreier, 1980; Hirvi, 1983; Larsen et al., 1992) reported ethyl butanoate as beinga contributor to strawberry flavour. They all used dynamic headspace as samplepreparation technique. Ulrich et al. (1995) found minor amounts of ethyl butanoatein 60% of the 14 varieties they investigated, and the concentration was higher inSenga Sengana than in Korona. The same results were found by SPME/GC/MS(Holt, 1999). Ethyl butanoate was not found when Douillard and Guichard (1989)studied frozen berries of 14 different cultivars.
Methyl butanoate (fruity, sweet) is reported to be among the components with thehighest ‘odour value’ in the wild strawberry species F. vesca L. (Pyysalo andHonkanen, 1979), even though its concentration is low (Ulrich et al., 1995). Larsenet al. (1992) considered methyl butanoate to be one of the cultivar specific volatilesin strawberries, while Perez (1992) listed it among the main contributors to straw-berries in general. Investigations by Ulrich et al. (1995) show that the concentration
42 Randi Utre Holt
Table 3. Relative area response (%) for flavour volatiles in different strawberry cultivars analysedby non-polar SPME/GC/FID (Holt, 1999).
Peak Name of component tR Senga Jonsok Nora Glima Bounty Koronano. (min) area% area% area% area% area% area%
ethyl acetate 03.4101 methyl butanoate 04.68 05.0 03.1 03.002 ethyl butanoate 07.63 04.1 01.7 03.6 01.1 02.303 trans-2-hexenal 10.12 07.5 01.1 02.504 methyl hexanoate 14.1 05.2 01.4 01.9 07.1 01.205 butyl butanoate 18.27 00.806 ethyl hexanoate 18.45 04.7 16.8 03.1 19.1 09.6 07.307 hexyl acetate 19.18 03.4 11.6 17.4 02.9 11.9 14.008 trans-2-hexenyl acet 19.36 07.6 26.8 26.1 07.4 31.3 23.909 limonene 21.66 00.910 linalool 23.98 03.9 01.0 00.7 03.911 unknown 24.28 00.8 00.812 unknown 24.41 00.9 01.0 00.5 01.213 unknown 25.68 00.914 benzyl acetate 27.18 00.3 00.4 00.6 00.1 00.215 hexyl butanoate 27.36 08.5 07.5 11.6 11.3 03.6 13.616 2-hexenyl butanoate 27.45 23.1 17.2 15.8 30.5 09.4 20.717 ethyl octanoate 27.87 08.0 01.1 00.4 01.7 00.518 octyl acetate 28.23 11.9 05.2 07.3 07.8 05.1 00.919 unknown 28.52 00.7 00.4 00.920 unknown 28.71 00.9 00.4 00.5 00.521 unknown 29.67 01.8 00.622 unknown 29.74 00.8 02.723 hexyl hexanoate 31.47 00.7 01.1 00.7 00.9 01.624 octyl butanoate 31.52 01.9 02.4 03.6 04.6 03.4 02.825 2-hexenyl hexanoate 31.77 02.4 01.3 01.126 gamma-decalactone 32.84 05.6 04.827 cis-nerolidol 34.23 02.9 03.0 00.4 01.4 06.2
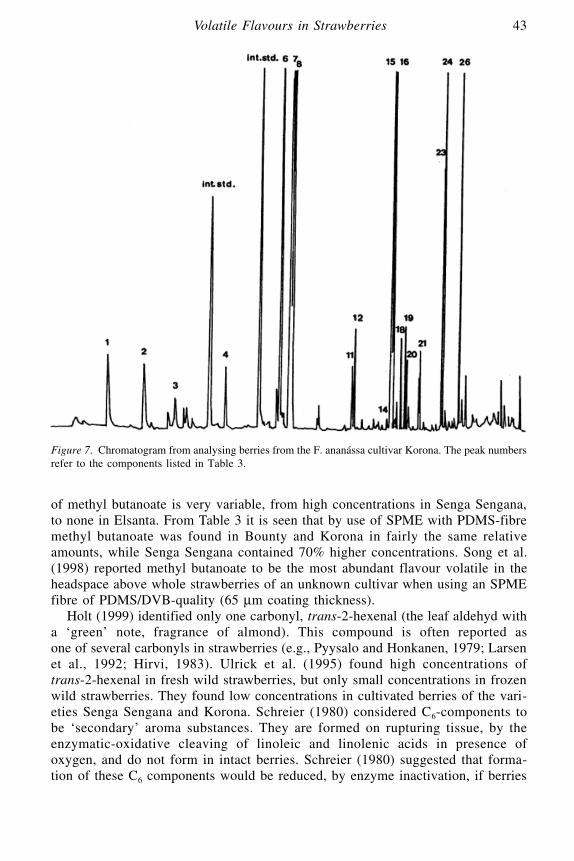
of methyl butanoate is very variable, from high concentrations in Senga Sengana,to none in Elsanta. From Table 3 it is seen that by use of SPME with PDMS-fibremethyl butanoate was found in Bounty and Korona in fairly the same relativeamounts, while Senga Sengana contained 70% higher concentrations. Song et al.(1998) reported methyl butanoate to be the most abundant flavour volatile in theheadspace above whole strawberries of an unknown cultivar when using an SPMEfibre of PDMS/DVB-quality (65 µm coating thickness).
Holt (1999) identified only one carbonyl, trans-2-hexenal (the leaf aldehyd witha ‘green’ note, fragrance of almond). This compound is often reported asone of several carbonyls in strawberries (e.g., Pyysalo and Honkanen, 1979; Larsenet al., 1992; Hirvi, 1983). Ulrick et al. (1995) found high concentrations oftrans-2-hexenal in fresh wild strawberries, but only small concentrations in frozenwild strawberries. They found low concentrations in cultivated berries of the vari-eties Senga Sengana and Korona. Schreier (1980) considered C6-components tobe ‘secondary’ aroma substances. They are formed on rupturing tissue, by theenzymatic-oxidative cleaving of linoleic and linolenic acids in presence ofoxygen, and do not form in intact berries. Schreier (1980) suggested that forma-tion of these C6 components would be reduced, by enzyme inactivation, if berries
Volatile Flavours in Strawberries 43
Figure 7. Chromatogram from analysing berries from the F. ananássa cultivar Korona. The peak numbersrefer to the components listed in Table 3.
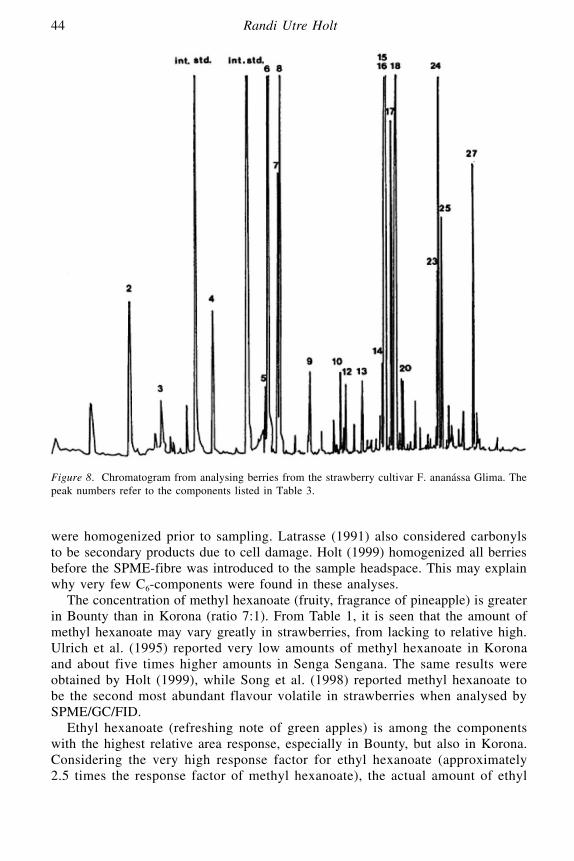
were homogenized prior to sampling. Latrasse (1991) also considered carbonylsto be secondary products due to cell damage. Holt (1999) homogenized all berriesbefore the SPME-fibre was introduced to the sample headspace. This may explainwhy very few C6-components were found in these analyses.
The concentration of methyl hexanoate (fruity, fragrance of pineapple) is greaterin Bounty than in Korona (ratio 7:1). From Table 1, it is seen that the amount ofmethyl hexanoate may vary greatly in strawberries, from lacking to relative high.Ulrich et al. (1995) reported very low amounts of methyl hexanoate in Koronaand about five times higher amounts in Senga Sengana. The same results wereobtained by Holt (1999), while Song et al. (1998) reported methyl hexanoate tobe the second most abundant flavour volatile in strawberries when analysed bySPME/GC/FID.
Ethyl hexanoate (refreshing note of green apples) is among the componentswith the highest relative area response, especially in Bounty, but also in Korona.Considering the very high response factor for ethyl hexanoate (approximately2.5 times the response factor of methyl hexanoate), the actual amount of ethyl
44 Randi Utre Holt
Figure 8. Chromatogram from analysing berries from the strawberry cultivar F. ananássa Glima. Thepeak numbers refer to the components listed in Table 3.
hexanoate is about the same as methyl hexanoate, both for Korona and Bounty. Ethylhexanoate is a component that varies extremely between strawberry varieties, veryhigh concentrations are reported in some cultivars (Maarse, 1991; Larsen et al.,1992), but ethyl hexanoate is totally lacking in wild strawberries (Maarse, 1991).Song et al. (1998) found small amounts of ethyl hexanoate and Ibañez et al. (1998)found no ethyl hexanoate when analysing strawberries (unknown cultivar) by theuse of SPME/GC/FID.
Trans-2-hexenyl acetate is found to be peak number 8 in the chromatograms. Thispheromone component, with fragrance of banana, was considered by Schreier (1980)and Maarse (1991) to be a major impact component in cultivated strawberries.Douillard and Guichard (1989) reported trans-2-hexenyl acetate to be especially richin Senga Sengana and Bogota. None of these authors used SPME as a sample prepa-ration method, but instead liquid-liquid extraction. Bocchio and Fellous (1987) foundtrans-2-hexenyl acetate in five out of 12 strawberry varieties when examined byGC/MS and using dynamic headspace with the adsorbing agent Tenax to collectthe volatiles. Verhoeven et al. (1997) reported trans-2-hexenyl acetate to be foundwhen volatiles were sampled by immersing the SPME-fibre into the flesh of thestrawberry and analysing by GC/MS. Trans-2-hexenyl acetate was not detected ina diethyl ether extract of the SPME fibre content. Trans-2-hexenyl acetate there-fore was explained to be one of several artefacts formed in the GC injection portdue to carbohydrates (sugars) and amino acids from the fruit juice covering the fibre.
Holt (1999), using headspace-SPME/GC/FID, detected very low levels of trans-2-hexenyl acetate in strawberries analysed 6 hours after harvest. The concentrationincreased in samples stored in glass vials at 4 °C for 24 hours after harvest. TheFID area response increased from 3 to 614 (homogenised berries) and from 3 to211 (whole berries) during storage. These changes were found in Korona berriesgrown in an open field area. Analyses of Korona, grown in a greenhouse, showedall very low levels of trans-2-hexenyl acetate (FID area response from 2 to 7).All analyses were performed by the same SPME/GC procedure. It is therefore dif-ficult to consider trans-2-hexenyl acetate as an artefact. The component is mostprobably present, but less abundant than what is seen depicted in Table 3 due toan extremely high area response in the SPME/GC system. No author has reportedit to make up close to 32% of the flavour volatiles in any strawberry cultivar.
The monoterpene limonene (abundant in oil of lemon and orange) was only foundin the strawberry cultivar Glima by Holt (1999). This component is reportedly foundin a few other strawberry cultivars, e.g. Korona (Doillard and Guichard, 1989).Limonene was not found by Song et al. (1998), nor by Ibañez (1998) when theyanalysed unknown strawberry cultivars by the use of SPME and GC/FID.
Only two alcohols, linalool and nerolidol, were found by the use of SPME inberries one day after harvest, cf. Table 3. No alcohols were found in Korona atthese conditions. When storing the Korona at 4 °C for more than six days afterharvest, geraniol (floral fragrance of Geranium) was found in these berries.According to Näf et al. (1990) only one alcohol, linalool (note of lavender and orangeflower), contributed to the flavour of strawberries. Hirvi (1983) included linaloolamong the important flavour components in cultivated strawberries. Larsen et al.(1992) examined six strawberry varieties and found four alcohols (Table 1), among
Volatile Flavours in Strawberries 45

which linalool was considered a general constituent in cultivated strawberries.Bocchio and Fellous (1987) found linalool in seven out of 12 strawberry cultivarswhen using dynamic headspace sample preparation technique. By use of SPME, richamount of linalool was found in all analyses (more than 50 analyses) of Bounty,but never detected in Korona (more than 50 analyses) (Holt,1999). Neither Bountynor Korona were included in the work of Larsen et al. (1992).
Benzyl acetate (phenylmethyl acetate) is a liquid with a pear like fragrance, whichoccurs in a number of plants, particularly jasmine (Merck Index, 1989). Benzylacetate was reported by Schreier (1980) to be present in three types of Senga, every-where in very low concentrations (0.02–0.1 mg/kg berries). In most of thechromatograms benzyl acetate was seen as a peak at tR 27.18 minutes. The peak areahad to be estimated manually where it was below the threshold value set for the inte-grator used (Holt, 1999)
Hexyl butanoate is produced by enzymatic degradation of fatty acids and has aflavour note like Golden Delicious apples (Schrödter, 1990). Hexyl butanoate wasfound in all six strawberry cultivars when using SPME (Table 3). Hexyl butanoatewas not among the volatile flavour components in cultivated strawberries foundby Larsen et al. (1992) listed in Table 1, but was reported by Douillard and Guichard(1989) as being rich in frozen Senga Sengana. Schreier (1980) found barelydetectable amounts of hexyl butanoate in his investigation of both fresh and frozenSenga Sengana. Both works used liquid-liquid extraction.
Table 3 gives the impression that trans-2-hexenyl butanoate is a main volatileconstituent in all six strawberry cultivars collected by SPME. The component ispresent in all samples tested, but in moderate concentrations. The response factorof trans-2-hexenyl butanoate is extremely high when using a poly dimethyl siloxanefibre. Trans-2-hexenyl butanoate is reported to be found in several strawberry cul-tivars, with the highest concentrations in Senga Sengana (Douillard and Guichard,1992). The SPME method also recorded highest concentrations of trans-2-hexenylbutanoate in Senga Sengana, but similar high consentrations were also found inGlima and Korona.
Douillard and Guichard (1989) found high concentrations of ethyl octanoate inonly one out of fourteen investigated strawberry cultivars. Ethyl octanoate wasdetected in Senga Sengana by use of liquid-liquid extraction (Schreier, 1980) andfound in Senga Sengana, Jonsok, Nora, Glima and in Bounty when using SPME(Holt, 1999).
Douillard and Guichard (1989) found rich amount of hexyl hexanoate in twocultivars, while Schreier (1980) found barely detectable amounts in three Senga vari-eties when using liquid-liquid extraction. Hexyl hexanoate was found in all cultivarsexcept Senga Sengana when using SPME (Holt, 1999).
Schreier (1980), using liquid-liquid extraction, and Bocchio and Fellous (1987),using dynamic headspace, reported octyl butanoate to be present in strawberriesin only minute amounts. The reason why octyl butanoate was easily detected inall cultivars by Holt (1999) is most probably due to the very high response factorsfor butanoate esters in general when using non-polar PDMS-coating for the SPMEfibre.
2-Hexenyl hexanoate was by Schreier (1989) found in relatively high amounts
46 Randi Utre Holt
in tree varieties of Senga, but not found by Douillard and Guichard (1989) in anyfrozen berries. Holt (1999) detected 2-hexenyl hexanoate in Senga Sengana andabout half that amount in Jonsok and Glima, while no 2-hexenyl hexanoate wasfound in Korona, Bounty and Nora.
The cyclic ester γ-decalactone (fragrance of peach and coconut) is considered acultivar specific component (Schreier, 1980; Larsen et al., 1992; Fischer andHammerschmidt, 1992; Ulrich et al., 1995). As seen in Table 3 γ-decalactone wasnot detected in Bounty among others, but in berries of the cultivated strawberryvariety Korona, confirming the results obtained by Ulrich et al. (1995). Schreier(1992) reported rich amounts of γ-decalactone in Korona, and had analysed it tobe purely (100%) the enantiomeric R-composition, no S-configuration was foundnaturally in Korona. The overview (Schreier, 1992) showed γ-decalactone to bepresent in several strawberry cultivars and in Fragaria vesca, mainly the R-enan-tiomeric composition (97.5% R-form in Fragaria vesca).
Nerolidol (rose fragrance) was listed by Larsen et al. (1992) among the alcoholsfound in strawberries, but not considered a general strawberry component. Nerolidolwas, by SPME/GC, found in five of the six cultivars, and in very variable amounts.Nerolidol was never detected in any of the 50 analyses done on Korona (Holt, 1999).
Schreier (1980), Dirink et al. (1984), Perez et al. (1992) and Olias et al. (1995)claimed that the main volatile components in berries of strawberry were estersfrom organic acids with an even carbon number. Among the twenty identifiedcomponents listed in Table 3, fifteen (75%) were esters from aliphatic organicacids with even carbon numbers (C2–C8).
Olias et al. (1995), divided the most abundent esters into butanoates (43%), hexa-noates (38%) and acetates (9%), measured in ng ester/g berries by dynamicheadspace method. The work by Holt (1999) only considered relative response areas.The response factors obtained by SPME were found to be very different for indi-vidual components, so to compare the distribution of different esters in preciseamounts, the SPME results have to be converted into ng/g berries by external cal-ibration of all components present in the berries. This was not done since all thestrawberry flavour volatiles were not readily available in a pure form. A compar-ison by adding up the numbers of esters from different acids gave the followingdistribution: 3 components (21%) acetates, 6 components butanoates (43%), 29%hexanoates and one (7%) octanoate. Näf et al. (1990) and Hamilton-Kemp et al.(1996) found esters, alcohols and saturated carbonyls to be the three main typesof volatile metabolites formed by the berries of strawberry. In both reports esterswere considered the main contributors to strawberry flavour.
No aliphatic C6-alcohols were found in berries when using non-polar SPME-fibreas sample preparation method (Holt, 1999), but are often reported by analystsusing others methods. One explanation for this is the poor ability for the PDMS-phase to absorb C6-alcohols, even from standard mixtures (Holt, 1999).
Larsen et al. (1992) included six acids among flavour components in cultivatedstrawberries (Table 1). while Latrasse (1991) found that only one of them was presentin concentrations above their threshold value and therefore part of the strawberryflavour. In the work of Holt (1999), using non-polar SPME-fibre and low polarityGC-column, no efforts were made to examine acidic constituents in strawberries.
Volatile Flavours in Strawberries 47

The aroma of the wild strawberry species F. vesca L. and F. moscata L. is verypleasant and highly appreciated. The three most important components respon-sible for the differences between the aromas of F. vesca L. and cultivated strawberriesare the three components: methyl antranilate, carvyl acetate and myrtenol (Drawertet al., 1973, Hirvi, 1983). As expected, none of these three components were foundin cultivated strawberries by use of headspace SPME/GC (Ibáñez et al., 1998;Holt, 1999)
The most important volatile flavour component of wild strawberry, F. vesca L.,2,5-dimethyl-4-methoxy-3(3H)-furanone (mesifurane), has been reported in remark-ably variable concentrations in cultivated strawberries (Hirvi, 1983; Larsen et al.,1992; Ulrich et al., 1995). The reason for this may be different growth conditionsand different methods for sample preparations and analyses. Ulrich et al. (1995)found mesifurane in Korona. The component is water soluble and thermally unstable.In addition to strawberries, mesifurane has been identified in pineapple, raspberry,and as an off-flavour in grape and grape wine and in aged orange juice (Hirvi, 1983).Furanones were neither found by Holt (1999), nor by Ibáñez et al. (1998), using anon-polar SPME fibre. The components could not be detected by non-polarSPME/GC, even when adsorbed from a pure standard sample (Holt, 1999). Sanzet al. (1994) determined high amounts of both furanol and mesifurane in strawberriesby the use of HPLC and Song et al. (1998) reported to find mesifurane when usinga medium-polar SPME fibre, PDMS/DVB, collecting volatiles from whole straw-berries, analysing them by capillary GC, cooling the first 20 cm of the column tominus 100 °C.
4.1. Comparison of SPME and dynamic headspace
Volatiles from berries of the strawberry cultivar Bounty, grown in an open fieldarea, have been collected by the use of dynamic headspace, the ‘purge and trap’method, and by the use of non-polar SPME fibre (Holt, 1999). The berries werecut in four pieces for the dynamic headspace sampling. Fresh berries from Bountywere mashed before the volatiles were collected by SPME. The results from theseanalyses were labelled ‘day 0’. Intact berries were stored for seven days in a closedglass jar, and then cut into pieces before SPME sampling. The resultsfrom these analyses were labelled ‘day 7’. The results are presented in Figure 9and Figure 10.
Three (12%) out of the 25 components were detected only when the volatileswere collected by dynamic headspace, among witch 1-hexanol and 2-heptanone werefound. These components are reported in the literature as strawberry volatiles(Schreier, 1980; Larsen et al., 1992), and are most likely present in the berry, butare not easy absorbed by the polydimethyl siloxane coating of the SPME fibreused. This shows the advantages of using a fibre composed of both a polar and anon-polar phase, like the PDMS/DVB phase.
Twelve components (48%) were found in all three analyses. Most of them werevolatiles with relatively high boiling points (above 175 °C). Two components(8%) were found only when the volatiles were collected by SPME from freshberries. These components were not identified, but identical peaks were seen in
48 Randi Utre Holt

Volatile Flavours in Strawberries 49
Figure 9. Relative area response of some low boiling point (<190 °C) volatile flavour compounds instrawberries when using different sample preparation methods.
Figure 10. Relative area response of flavour compounds with boiling points above 190 °C found instrawberries when using different sample preparation methods.
chromatograms recorded of other strawberry cultivars using SPME/GC. Thesecomponents have relatively high boiling points (200 °C–250 °C). These componentswere not absorbed by the SPME fibre from berries stored in a closed compart-ment for seven days, indicating that these components might have decomposedduring storage. They are also lost during sample preparation by the dynamic head-space method.
Interesting results from Figure 9 and Figure 10 are the seven components (28%)that are found when using dynamic headspace, but lacking when SPME was usedto collect the volatiles from fresh strawberries. These components are also presentwhen volatiles are collected by SPME from strawberries that have been stored forseven days in a closed container. Most of these components have relatively lowboiling points, lower than 140 °C, and might be products from enzymatic decom-position of higher molecular weight components during storage. It seems as ifthe nitrogen rich atmosphere imposed on the berries during dynamic headspace(0.3–0.6 m3 in 6–8 hours), has accelerated these decomposition rates.
The comparison between the two methods shows that SPME offers many advan-tages compared to the conventional technique, dynamic headspace sampling. By useof SPME the sampling period is substantially reduced, and no organic solvent isneeded to extract the flavour volatiles from the absorbing agent. The equipmentinvolved is also simpler for SPME.
By the use of SPME no formation of components due to reactions in the con-tainer during sampling is likely to occur. Some alcohols and ketones were collectedduring dynamic headspace sampling, but not with SPME (Holt, 1999). It is believedthat this is more a question of the type of absorbing agent rather than propertiesinherent to the technique. By changing the type of absorbing coating of the SPME-fibre, better absorption of hydrophilic components could be obtained. There is noreason to believe that a fully developed SPME procedure should offer less accuracythan dynamic headspace. With this background it can be concluded that the SPME-fibre technique is a powerful sampling technique.
4.2. Practical utilisation of a fully developed method
The SPME sample preparation technique combined with GC has proved to be a goodmean for the qualitative description of non-polar strawberry volatiles (Holt, 1999).By using a polar fibre and a polar GC stationary phase, it is likely that polar volatilescan be determined in the same way.
Due to its simplicity in sample preparation, relatively low time requirements,and absence of analytical artefacts, the SPME/GC system developed can be anefficient tool in quality control during strawberry cultivation and storage, with respectto non-polar volatile flavour components.
This simple and fast technique allows a large number of analyses to be madeon the crops studied, providing the analyst with a vast amount of data for para-meter monitoring.
The method can be used to investigate how controllable parameters effect thedevelopment of strawberry flavours. For strawberries grown in an open field area,controllable growth parameters are e.g. fertilization, draining and design of growth
50 Randi Utre Holt

area. For green house growth there are numerous parameters to be varied, e.g. inten-sity and length of light, temperature and irrigation.
In addition to determine growth parameters that influence the quality of straw-berries during growth, changes in flavour volatiles may be monitored during storagefor the purpose to monitoring how various storage parameters, e.g., temperature,light, humidity etc. effect the composition and content of strawberry volatiles.
For the complete product cycle from growth to consumption, the optimum com-bination of parameters can be identified for the strawberry species under study.
A systematic study of strawberry quality versus composition of flavour volatilesmay reveal that certain components are good indicators for strawberry quality.Such components have not been identified, but the present SPME technique opensthe way for such relationship to be identified. The use of the method is dependenton the establishment of the relationship between the quality and the content of flavourvolatiles. Quality testing may then be limited to these key components, makingthe test procedure even simpler.
ACKNOWLEDGEMENT
Special thanks are given to professor Tor-Henning Iversen and his staff at the PlantBiocentre, Department of Botany, NTNU, for using their laboratory facilities, andfor giving me access to their great selection of different strawberry varieties, bothgreenhouse grown, and grown in open field areas.
REFERENCES
Ache, B.W. (1991). Phylogeny of smell and taste. In T. V. Getchell, R. L. Doty, L. M. Bartoshukand J. B. Snow Jr. (eds.), Smell and taste in health and disease. Reven Press, New York.
Bocchio, F. and R. Fellous (1987). Anlyse de données appliquée aux profils chromatographiques defraises. Parfums, cosmétiques arómes 76: 71–78.
Buttery, R. G. and L. C. Ling (1996). Methods for isolating food and plant volatiles (chapter 23). InG. R. Takeoka, R. Teranishi, P. J. Williamsand and A. Kobayashi (eds.), Biotechnology for improvedfoods and flavours. ACS symposium series 637, American Chemical Society, Washington, DC,USA.
Darrow, G. M. (1966). The strawberry, 1st ed. The New England Institute for Medical Research,USA.
Dirinck, P., L. Schreyen and N. Schamp (1977). Aroma quality evaluation of tomatoes, apples and straw-berries. Journal of Agriculture and Food Chemistry 25(4): 759–762.
Dirinck, P., H. De Pooter, G. Willaert and N. Schamp (1984). Application of a dynamic headspaceprocedure in fruit flavour analysis. In P. Schreier (ed.), Analysis of volatiles. Walter de Gruyter &Co., Germany.
Douillard, C. and E. Guichard (1989). Comparison by multidimensional analysis of concentrations ofvolatile components in fourteen frozen strawberry varieties. Sciences des Aliments 9: 53–76.
Douillard, C. and E. Guichard (1990). The aroma of strawberry (Fragaria ananássa): Characterisationof some cultivars and influence of freezing. Journal of Science and Food Agriculture 50: 517–531.
Drawert, F., R. Tressl, G. Staudt and H. Köppler (1973). Gaschromatographisch-massenspektrometrischeDifferenzierung von Erdbeerarten. Zeitschrift für Naturforschung 28c: 488–493.
Fischer, N. and F. J. Hammerschmidt (1992). A contribution to the analysis of fresh strawberry flavour.Chem. Mikrobiologi. Technologi und Lebensmittel 14: 141–148.
Volatile Flavours in Strawberries 51

Hamilton-Kemp, T. R., D. D. Archbold, J. H. Loughrin, R. W. Collins and M. E. Byers (1996).Metabolism of natural volatile components by strawberry fruit. Journal of Agriculture and FoodChemistry 44: 2802–2805.
Hartmann, T. (1996). Diversity and variability of plant secondary metabolism: a mechanistic view. InE. Städler, M. Rowell-Rahier and R. Baur (eds.), Proceedings of the 9th International symposiumon insect-plant relationships. Kluwer Academic Publishers, Dordrecht, The Netherlands.
Hawthorne, S. B., M. S. Krieger and D. J. Miller (1988). Analysis of flavor and fragrance compo-nents using supercritical fluid extraction coupled with gas chromatography. Analytical Chemistry 60:472–477, ACS.
Hirvi, T. and R. Honkanen (1982). The volatiles of two new strawberry cultivars, ‘Annelie’ and‘Alaska Pioneer, obtained by back-crossing of cultivated strawberries with wild strawberries. Fragarievesca, Rügen and Fragaria virginiana, Zeitschrift für Lebensmittel-Untersuchung und -Forschung175: 113–116, J. F. Bergmann Verlag.
Hirvi, T. (1983). Mass fragmentographic and sensory analyses in the evaluation of the aroma of somestrawberry varieties. Lebensmittel-Wissenschaft und Technologie 16: 157–161.
Holt, R. U. (1999). Development of a method for analysing volatile flavour components in straw-berry using solid phase micro extraction and gas chromatography, MSc. Dissertation, The plantbiocentre, NTNU, Trondheim, Norway.
Holt, R. U. (2001). Mechanisms effecting analysis of volatile flavour components by solid-phasemicroextraction and gas chromatography. Journal of Chromatography A 937: 107–114.
Høeg, O. A. (1984). Våre medisinske planter, trollskap, tradisjon og legekuns, 1st ed., 2. setting, DetBeste a/s, Oslo.
Ibáñez, E., S. López-Sebastián, E. Ramos, J. Tabera and G. Reglero (1998). Analysis of volatile fruitcomponents by headspace solid-phase microextraction. Food Chemistry 63(2): 281–286.
Kato, H., M. R. Rhue and T. Nishimura (1989). Role of free amino acids and peptides in food taste.In R. Teranishi, R. G. Buttery and F. Shahidi (eds.), Flavor chemistry trends and developments. ACSsymposium series 388, ACS, Washington DC.
Kidmose, U., H. Andersen and O. Vang-Petersen (1996). Yield and quality attributes of strawberrycultivars grown in Denmark 1990–1991. Fruit Varieties Journal 50(3): 160–167.
Larsen, M., L. Poll and C. E. Olsen (1992). Evaluation of the aroma composition of some strawberry(Fragaria ananássa Duch.) cultivars by use of odour threshold values. Zeitschrift für Lebensmittel-Untersuchung und -Forschung 195: 536–539.
Latrasse, A. (1991). Fruits III. In H. Maarse (ed.), Volatile components in food and beverages. MarcelDekker, Inc., New York.
Maarse, H. (1991). History of flavor research (chap 1). In H. Maarse (ed.), Volatile components infood and beverages. Marcel Dekker, Inc. New York.
Merck Index (1989). Budavari, S. (ed.) An encyclopedia of chemicals, drugs, and biologicals, 11th.ed., Merck & Co., Inc., N.J., USA.
Miszczak, A., C. F. Forney and R. K. Prange (1995). Development of aroma volatiles and color duringpostharvest ripening of ‘Kent’ Strawberries. Journal of the American Society for Horticultural Science20(4): 650–655.
Näf, F., R. Näf and G. Uhde (1990). Synthesis of nature-identical flavour chemicals. In Y. Bessièreand A. F. Thomas (eds.), Flavour Science and Tecnology, 6th Flavour symposium, J. Wiley &Sons, Chichester.
Ofosu-Anim, J. and Y. Shohei (1994). Sugar content, compartmentation and efflux in strawberrytissue. Journal of the American Society for Horticultural Science 119(5): 1024–1028.
Olias, J. M., C. Sanz, J. J. Rios and A. G. Pérez (1995). Substrate specificity of alcohol acyltrans-ferase from strawberry and banana fruits. In R. L. Rouseff and M. M. Leahy (eds.), Fruit flavor,biogenesis, characterization and authentication. American Chemical Society symposium series,vol. 596. Chicago, USA.
Pawlinszyn, J. (1997). Solid Phase Micro Extraction theory and practice. Wiley-VCH, Inc., NewYork.
Penton, Z. and H. Kern (1994). GC determination of pesticides with automated SPME, Presented onposter at 16th Int. symposium on capillary chromatography, Varian.
Pérez, A. G., J. J. Rios, C. Sanz and J. M. Olías (1992). Aroma components and free amino acids in
52 Randi Utre Holt

strawberry variety chandler during ripening. Journal of Agricultural and Food Chemistry 40:2232–2235. American Chemical Society.
Pérez, A. G., R. Olías, C. Sanz and J. M. Olías (1996). Furanones in strawberries: evolution duringripening and postharvest shelf life. Journal of Agricultural and Food Chemistry 44: 3620–3624.American Chemical Society.
Polesello, S., F. Lovati, A. Rizzolo and C. Rovida (1993). Supercritical Fluid Extraction as apreparative tool for strawberry aroma analysis. Journal of High Resolution Chromatography 16:555–559.
Pyysalo, T. and E. Honkanen (1979). Differences between the volatile compounds of cultivated and wildstrawberries (Fragaria vesca L.). In D. G. Land and H. E. Nursten (eds.), Progress in flavour research.Applied Science Publishers LTD, London.
Rhodes, M. J. C., A. Spencer, J. D. Hamill and R. J. Robins (1992). Flavour improvement troughplant cell culture, In R. L. S. Patterson, B. V. Charlwood., G. Mac Leod and A. A. Williams(eds.), Bioformation of flavours. The Royal Society of Chemistry, Great Britain, Bookcraft Ltd.
Sanz, C., A. G. Pérez and D. G. Richardson (1994). Simultaneous HPLC determination of 2,5-Dimethyl-4-hydroxy-3 (2H)-furanone and related flavor components in strawberries. Journal of Food Science59(1): 139–141.
Sanz, C., D. G. Richardson and A. G. Pérez (1995). 2,5-Dimethyl-4-hydroxy-3(2H)-furanone andderivatives in strawberries during ripening (chap. 24). In R. L. Rouseffand and M. M. Leahy (eds.),Fruit flavors, biogenesis, characterization and authentication. American Chemical Society sym-posium series, vol. 596, Chicago.
Schreier, P. (1980). Quantitative composition of volatile constituents in cultivated Strawberries Fragariaananássa cv. Senga Sengana, Senga Litessa and Senga Gourmella. Journal of the Science of Foodand Agriculture 31: 487–494.
Schreier, P. (1992). Bioflavours: An overview. In R. L. S. Patterson, B. V. Charlwood, G. MacLeodand and A. A. Williams (eds.), Bioformation of flavours. The Royal Society of Chemistry, GreatBritain, Bookcraft Ltd.
Schrödter, R. (1990). Importance of fat and fat degradation in the development of flavour concen-trates. In Y. Bessière and A. F. Thomas (eds.), Flavour science and technology. John Wiley &Sons, Chichester, England.
Song, J., L. Fan and R. M. Beaudry (1998). Application of Solid Phase Microextraction and GasChromatography/Time-of-flight Mass Spectrometry for Rapid Analysis of Flavor Volatiles in Tomatoand Strawberry fruits. Journal of Agriculture and Food Chemistry 46: 3721–3726.
Teranishi, R., I. Hornstein, P. I. Issenberg and E. L. Wick (1971). Flavor research, principles andtechniques. Marcel Dekker, Inc., New York.
Teranishi, R. (1989). New Trends and developments in flavor chemistry. In R. Teranishi, R. G. Butteryand F. Shahidi (eds.), Flavor chemistry, trends and developments, ACS symposium series 388.Washington, DC.
Theodoridis, G., E. H. Koster and G. J. de Jong (2000). Solid-phase microextraction for the analysisof biological samples, Review. Journal of Chromatography B 745: 49–82.
Thomson, D. M. H. (1986). The meaning of flavour (paper1). In G. G. Birch and M. G. Lindley(eds.), Developments in food flavours. Elsevier Applied Science Publisher Ltd., England.
Ueda, Y., A. Tsuda, J.-H. Bai, N. Fujishita and K. Chachin (1992). Characteristic pattern of aromaester formation from banana, melon, and strawberry with reference to the substrate specificityof ester synthetase and alcohol contents in pulp. Nippon Shokuhin Kogyo Gakkaishi 39(2):183–187.
Ueda, Y. and J.-H. Bai (1993). Effect of short term exposure of elevated CO2 on flesh firmness andester production of strawberry. Journal of the Japanese Society of Horticultural Science 62(2):457–464, Osaka.
Ulrich, D., A. Kapp and E. Hoberg (1995). Analyse des Erdbeeraromas – Quantifizierung der flüchtigenKomponenten in Kulturerdbeervarietäten und der Walderdbeere. Zeitschrift für Lebensmittel-Untersuchung und -Forschung 200: 217–220. Germany.
Verhoeven, H., T. Beuerle and W. Schwab (1997). Solid-Phase Microextraction: Artefact formationand its avoidance. Chromatographia 46(1–2): 63–66. Vieweg & Sohn Verlagsgesellschaft mbH,Wiesbaden.
Volatile Flavours in Strawberries 53

Went, F. W. (1957). The Experimental Control of Plant Growth, 1st ed. The Ronald Press Company,New York.
Wyllie, S. G., D. N. Leach, Y. Wang and R. L. Shewfelt (1995). Key aroma components in melons.In R. L. Rouseff and M. M. Leahy (eds.), Fruit flavors, biogenesis, characterization, and authen-tication. ACS, Chicago.
Yamashita, I., Y. Nemoto and S. Yoshikawa (1975). Formation of volatile esters in strawberries.Agricultural Biology and Chemistry 39(12): 2303–2307.
Zhang, Z. and J. Pawliszyn (1995). Quantitative extraction using an internally cooled Solid PhaseMicroextraction device. Analytical Chemistry 67: 34–43.
54 Randi Utre Holt
METHODS TO EVALUATE THE ANTIOXIDANT ACTIVITY
VOLKER BÖHM AND KARIN SCHLESIERFriedrich Schiller University Jena, Institute of Nutrition, 07743 Jena, Germany
1. INTRODUCTION
Primarily, antioxidants have been and are of interest to the food industry becausethey prevent rancidity. Lateron, biologists and clinicians became interested inantioxidants also due to their protective potential within the human body againstdamage by reactive oxygen species. Thus, antioxidants are more than chain-breakingmolecules within the reaction of lipid peroxidation. Halliwell et al. defined anti-oxidants as ‘any substance that, when present at low concentrations compared tothose of an oxidizable substrate, significantly delays or prevents oxidation of thatsubstrate’ (Halliwell et al., 1995).
Phytochemicals with their antioxidative potential are regarded as protective foodcomponents. They are counterparts to oxidative stress, a cause of many degenera-tive diseases as e.g. cardiovascular diseases, cancer and cataract (Kinsella et al.,1993). In the last years, many analytical methods have been developed to deter-mine the antioxidant activity in all kind of matrices. This chapter describes mostof these assays as well as fields of application and the small number of existing com-parisons of methods.
2. THIOBARBITURIC ACID REACTIVE SUBSTANCES (TBARS) ASSAY
This assay is a commonly used method for the detection of lipid peroxidation.Malondialdehyde is formed as a result of lipid peroxidation and reacts with thio-barbituric acid to form a pink pigment that has an absorbance maximum at532 nm. The TBARS reaction is not a specific one. Many other substances, includingother alkanals, protein, sucrose, and urea may react with thiobarbituric acid toform coloured species that can interfere with this assay. Further enhancement inspecificity has been achieved by the high-performance liquid chromatographicseparation of the complex prior to measurement. Extraction of the malondialde-hyde prior to formation of the chromogen and/or derivative spectrophotometry areother approaches. Jardine et al. (2002) were the first, who investigated the mainTBARS reaction products by using LC-MS. Linoleic acid was used as a model lipid,and oxidation was induced by Cu(II)-ions. The pink pigment is considered to be acondensation product of thiobarbituric acid and malondialdehyde in a 2:1 molar ratio.In addition, they found an unstable yellow product exhibiting strong absorption at455 nm.
Different ginger constituents were analysed on their antioxidant activity byusing the TBARS assay (Kikuzaki and Nakatani, 1993) as well as rosmary extracts(Basaga et al., 1997) and rosmary and savory in meat products (Lindberg Madsen
R. Dris and S. M. Jain (eds.), Production Practices and Quality Assessment of Food Crops,
© 2004 Kluwer Academic Publishers. Printed in the Netherlands.
55
Vol. 3, “Quality Handling and Evaluation”, pp. 55–71.

et al., 1996). Martinéz-Botas et al. (1998) investigated several red wines on theirantioxidant potential. Recently, Zeyuan et al. (1998) showed antioxidant ability ofgreen and black tea in blood of rats. Red wine had an antioxidant effect on humanred blood cells (Tedesco et al., 2000).
2.1. LDL oxidation assay
Oxidative modification of human low density lipoprotein (LDL) is considered tobe an important event in atherogenesis. In-vitro oxidation of LDL can be mediatedby cells or in cell-free media, traces of transition metal ions strongly catalyse theoxidating. Oxidation of LDL is a lipid peroxidation process in which the polyun-saturated fatty acids of LDL are successively degraded to a variety of products.The kinetics can be measured continuously by monitoring the change of the234 nm diene absorbance, which develops in LDL during oxidation through theformation of conjugated fatty acid hydroperoxides. The time-course shows three con-secutive phases, a lag-phase during which the diene absorption increases only weakly,a propagation phase with a rapid increase of the diene absorbance and finally adecomposition phase. The increase of the dienes is highly correlated with the increaseof MDA or lipid hydroperoxides. The duration of the lag-phase is determined bythe endogenous antioxidants contained in LDL. This Cu2+-mediated LDL oxida-tion assay was first developed by Esterbauer et al. (1989) and has many advantagescompared to other methods determining LDL oxidation (increase in thiobarbituricacid-reactive substances (TBARS) and peroxides, decrease in antioxidants, etc.).A lot of different in vitro methods for the determination of LDL oxidation arereviewed by Puhl et al. (1994).
Unfortunately, ultracentrifugation, the most widely used procedure for LDLisolation, is time consuming and preservatives like EDTA are regularly includedin the high-salt solutions to limit oxidation. Isolated LDL are often extensivelydialysed in order to remove these compounds prior to the oxidation assay. A studyof Scheek et al. (1995) showed a 56–66% reduction in the concentrations of β-carotene, lycopene and α-tocopherol due to dialysis for 22 hours. Gelfiltration, asproposed by Puhl et al. (1994), might be a reliable alternative to dialysis.
A more sensitive method was recently published by Hofer et al. (1995). Theyincubated LDL with vesicles of fluorescent phospholipids, as e.g. the phos-phatidylcholine derivative of diphenylhexatriene (DPHPC) for at least 6 hours. Uponoxidation of DPHPC, its fluorescence decreases. The measured lag phases werehighly correlated to the corresponding values as determined by diene formation. Dueto the high sensitivity, this assay is also applicable to complex lipoproteins suchas diluted (100 fold dilution) serum. It is superior to other methods because itmeasures the oxidative degradation of a single and defined lipid molecule comparedto the overall lipid oxidation in biological lipid assemblies.
Regnström et al. (1993) compared the diene formation in human serum exposedto copper ions to that in LDL. Its modification does not require a preparative ultra-centrifugation of LDL, which is time consuming and expensive. In addition, theoriginally published method (Esterbauer et al., 1989) does not determine the influ-ence of water soluble antioxidants and other lipoproteins except LDL. Human serum
56 V. Böhm and K. Schlesier

was diluted to a final concentration of 0.67% (v/v) prior to the assay. Serum con-centrations above approximately 3% had an absorbance at 234 nm outside therange of the spectrophotometer. The increase in absorbance at 234 nm in serum afterexposure to Cu2+ was found to depend on the presence of lipoproteins and wasstrongly related to the serum levels of TBARS. No correlation was found betweenserum and LDL susceptibility to oxidation. This difference may be due to theinfluence of water soluble antioxidants or to the presence of other lipoproteins.
The LDL oxidation assay is one of the most used assays to determine anti-oxidant activity. Besides grapes (Meyer et al., 1997), grape juices (Frankel et al.,1998), and wines (Vinson et al., 1995; Frankel et al., 1995) chocolate (Waterhouseet al., 1996) was analysed on antioxidant activity. Further studies investigated humanplasma after consumption of red wine (Fuhrman et al., 1995), green or black tea(van het Hof et al., 1997) or chocolate (Kondo et al., 1996).
2.2. TEAC assay
During the last decade, the TEAC (Trolox Equivalent Antioxidant Capacity) assayis one widely used in vitro assay for the determination of antioxidant activity. In1993, Miller et al. developed this test to monitor the antioxidant status in prema-ture neonates. They used the peroxidase activity of metmyoglobin to oxidize2,2′-Azinobis-(3-ethylbenzothiazoline-6-sulphonic acid) (ABTS) in the presenceof hydrogen peroxide. This oxidation forms the long-lived radical cation ABTS•+
with absorption maxima at 650, 734 and 820 nm. More details on this chromogentogether with kinetic investigations on the reaction of peroxidase with ABTS canbe found in a paper from 1975 (Childs and Bardsley). In the presence of antioxi-dant reductants and hydrogen donors the absorbance of ABTS•+ is quenched to anextend related to the antioxidant capacity. Miller et al. (1993) used Trolox, a water-soluble vitamin E analogue, to standardize the assay and measured the absorbanceat 734 nm exactly 6 min after starting the oxidation. In contrast, some other labo-ratories as e.g. that of the authors of this chapter measured the lag phase until theformation of the bluegreen coloured ABTS•+ starts (Schlesier et al., 2002). Anotherpoint critically discussed is the overlay of two mechanisms in this assay. In additionto the delay of radical formation, the radical quenching capability is measured aswell. Some antioxidants are able to delay the formation of ABTS•+, others quenchthe formed radical cation and some are able to do both (Strube et al., 1997). Thisfirst version of the TEAC assay also can only be used for hydrophilic antioxi-dants. Recently, Alonso et al. (2002) developed a new method based on theaccelerated electrochemical oxidation of ABTS. A constant current of 10 mA inten-sity is applied to the mixture of sample solution and ABTS solution and theabsorbance at 414 and 734 nm is continuously recorded. The final point of theassay is taken to be the moment when ABTS begins to oxidize. At this moment,the spectrum of the ABTS radical cation begins to appear, with the absorbance at414 and 734 nm increasing, and the quotient Abs(414)/Abs(734) becoming constant.Depending on the degree of antioxidant power of the sample added, the formationof the radical cation is delayed.
Some years later, Miller et al. (1996) described a modified TEAC assay, able
Methods to Evaluate the Antioxidant Activity 57

to determine the antioxidant activity of carotenoids, one class of lipophilic anti-oxidants. This modified procedure use the preformed ABTS•+ which has beenprepared by passing an aqueous solution of ABTS through manganese dioxide.The membrane filtered filtrate has to be diluted in phosphate buffered saline (PBS)to an absorbance of 0.70 ± 0.02 at 734 nm. Carotenoids were dissolved in acetoneand diluted to a concentration of approximately 100 µM in 90% hexane/10% acetone.After addition of 1.0 mL of ABTS•+ solution to aliquots of Trolox or the carotenoids,the solution was vortex mixed for exactly 30 s. The absorbance at 734 nm was takenexactly 1 min after initiation of mixing. In order to improve the handling of thisprocedure, the author of this chapter has modified it slightly. After addition of1.0 mL of ABTS•+ solution to 100 µL sample solution in hexane, the mixturehas to be vortex mixed for exactly 30 s. A centrifugation at 14000 rpm for 1 minfollows. The absorbance of the lower hydrophilic green-coloured layer ismeasured at 734 nm exactly 2 min after initiation of mixing (Böhm et al., 2002).This lipophilic version of the TEAC assay only determines the radical quenchingability of antioxidants.
A similar approach was described by Pellegrini et al. (1999). The ABTS•+ hasbeen prepared by reacting ABTS with potassium persulfate. This mixture is allowedto stand in the dark at room temperature for 12–16 h before use. Prior to the assay,the solution is diluted in ethanol to give an absorbance at 734 nm of 0.70 ± 0.02.After vortex mixing ABTS•+ and sample solution for exactly 30 s the absorbancereading was taken exactly 1 min after initiation of mixing and thereafter everyminute. These time dependent measurements showed that the reaction is completeafter 1 min. In addition to this lipophilic application, the potassium persulfate versionof the TEAC assay is also applicable to water soluble antioxidants (Re et al.,1999). In contrast to the method using manganese dioxide as oxidant (Miller etal., 1996) this method only produces the radical monocation whereas manganesedioxide has the potential to form the radical (Re et al., 1999).
The TEAC assay in its hydrophilic version was often used to analyse bever-ages on their antioxidant activity. Miller et al. (1995) investigated the influence ofstorage on the antioxidant activity of apple juice. Red wines were analysed ontheir antioxidant activity in Italy (Simonetti et al., 1997; Pellegrini et al., 2000).Liebert et al. (1999) analysed green and black tea on their antioxidant potential usingdifferent brewing conditions. 41 red wines, 9 white wines, 25 teas, and 29 fruit juiceswere investigated on their antioxidant potential by Henn and Stehle (1998). Recentstudies used the TEAC assay to analyse fruits and vegetables (Paganga et al.,1999) and blueberries as well as blackberries (Sellappan et al., 2002).
2.3. �-carotene bleaching assay
This assay is based on the coupled oxidation of β-carotene and linoleic acid, firstdeveloped by Marco (1968). It consists of measuring the bleaching of β-caroteneresulting from oxidation by degradation products of linoleic acid.
The method modified by Taga et al. (1984) uses a solution of β-carotene inchloroform showing an absorbance at 470 nm between 0.60 and 0.90. One millil-itre of this solution is added to 20 mg linoleic acid and 200 mg Tween 40. After
58 V. Böhm and K. Schlesier
removing the chloroform using a rotary evaporator at 40 °C, 50 mL of oxygenateddistilled water are slowly added with vigorous agitation to form an emulsion. FivemL of this emulsion are added to 0.2 mL of the antioxidant solution. Absorbanceat 470 nm is measured at 0 min and every 15 min until the reading of the blanksample without antioxidant is below 0.03. The cuvettes are heated at 50 °C betweenthe absorbance measurements.
Kanner et al. (1994) used the β-carotene bleaching assay to analyse grapes andwines on their antioxidant activity. Further applications are Rooibos tea (von Gadowet al., 1997), fruits, vegetables, and grain products (Velioglu et al., 1998) as wellas also common vegetables (Gazzani et al., 1998).
2.4. DPPH assay
In its radical form, DPPH• (2,2-Diphenyl-1-picryl-hydrazyl) has an absorption bandat 515 nm which dissappears upon reduction by an antiradical compound.
100 µL antioxidant solution in methanol are added to 3.9 mL of a methanol DPPH•
solution. The decrease in absorbance is determined at 515 nm at 0 min,1 min and every 15 min until the reaction reaches a plateau. Antiradical activityis defined as the amount of antioxidant necessary to decrease the initial DPPH•
concentration by 50% (Efficient concentration = EC50 ((mol/L) AO/(mol/L) DPPH•)).The antiradical power (ARP) is defined as 1/EC50: The larger the ARP, the moreefficient the antioxidant (Brand-Williams et al., 1995). Due to different reactionkinetics depending on the nature of the antioxidant, Brand-Williams et al. (1995)analysed the antiradical acitvities at the steady state, while others determined theEC50 after 30 min of reaction time. For those compounds reacting rapidly with theDPPH radical no difference was observed in the ARP in contrast to slower kineticbehaviour of others.
Recently, an on-line HPLC-DPPH method was developed (Bandoniene andMurkovic, 2002). After RP-separation of polyphenolics and their UV-detection at280 nm, a postcolumn reaction with a methanolic solution of DPPH stable radicaltook place. The induced bleaching was detected as a negative peak photometri-cally at 515 nm. The length of the capillary for the postcolumn reaction and the flowrate of the reagent solution were adjusted to achieve a reaction time of 0.6 min.
The DPPH assay was used for example to determine the antioxidant activity ofvarious tea extracts (Yen and Chen, 1995), different vegetable oils (Espín et al.,2000) and several vegetables (Chu et al., 2000).
2.5. DMPD assay
This method for measuring the antioxidant activity of hydrophilic compounds usesN,N-Dimethyl-p-phenylenediamine (DMPD). The radical cation of this compoundgives a stable coloured solution. An inhibition of colour formation can be observedin the presence of antioxidants. This assay reflects the ability of radical hydrogen-donors to scavenge the single electron from DMPD•+.
The coloured radical is formed by adding ferric chloride to the DMPD solution(Fe3+:DMPD ratio 1:10). The absorbance of this solution is measured at 505 nm
Methods to Evaluate the Antioxidant Activity 59

and is constant up to 12 h at room temperature. Fifty microliters of the antioxi-dant solution are added to 1 mL DMPD•+ solution. The absorbance at 505 nm ismeasured after 10 min at 25 °C under continuous stirring. Antioxidant activity iscalculated as percentage of the uninhibited radical solution according to the equation:
antioxidant activity (%) = (1 – (E505sample/E505DMPD•+)) × 100
This antioxidant activity can be expressed in relation to Trolox (Fogliano et al.,1999).
This assay was used by Leonardi et al. (2000) to analyse four different typesof fresh consumption tomatoes on their hydrophilic antioxidant activity. Foglianoet al. (1999) determined the antioxidant activity in Italian wines by using the DMPDassay.
2.6. TRAP assay/ORAC assay
The ‘Total Radical-trapping Antioxidant Parameter’ (TRAP) assay was first usedby Wayner et al. (1985). They added ABAP [2,2′-Azo-bis-(2-amidinopropanehydrochloride)] to human plasma. ABAP (= AAPH) decomposes thermally to yielduseful quantities of peroxyl radicals at a known and constant rate. The length of timethat oxygen uptake was inhibited by plasma antioxidants was measured using anoxygen electrode. The TRAP value is defined as the number of moles of peroxylradicals trapped per litre of fluid. The TRAP value is calculated using Trolox asstandard and its stoichiometric factor of 2.0 (two peroxyl radicals are trapped permolecule of Trolox).
A few years later, Cao et al. (1993) used the fluorescent protein B-phycoery-thrin (B-PE) to measure the total ‘Oxygen-radical Absorbing Capacity’ (ORAC).20 µL sample solution were mixed with 2 mL of a mixture of B-phycoerythrinand ABAP. Once ABAP was added, the reaction mixture was incubated at 37 °C.Fluorescence was measured every 5 min at the emission wavelength of 565 nmand excitation at 540 nm. A Trolox solution was used as standard. The ORACvalue refers to the net protection area under the quenching curve of B-PE in thepresence of an antioxidant. One ORAC unit has been assigned the net protectionprovided by 1 µM Trolox in final concentration. In contrast to the first developedassay, in this version the reaction is driven to completion. All non-protein antiox-idants and most of the protein in plasma samples are oxidized by the peroxyl radical.
A little bit later, Ghiselli et al. (1995) introduced another version of the TRAPassay, also using a fluorescent protein. They again measured the lag time to avoidinterferences from plasma proteins or lipids. As used in the authors lab (Schlesieret al., 2002), 750 µL R-Phycoerythrin solution, 250 µL buffer and 50 µL antioxi-dant solution are added in fluorescence cuvettes, mixed and maintained at 37 °Cfor 10 min. The oxidation reaction is started by adding ABAP solution to thecuvettes. The decay of R-Phycoerythrin is monitored every 5 min until the fluo-rescence signal decreases regularly. The TRAP value is calculated using Trolox asstandard (stoichiometric factor: 2.0).
60 V. Böhm and K. Schlesier

In contrast to (Wayner et al., 1985) the two methods using a fluorescent proteindo not measure the ability of plasma to break the lipid peroxidation chain trig-gered by ABAP. The method developed by Wayner et al. (Wayner et al., 1985) aswell as that introduced by Cao et al. (1993) determine in addition to antioxidantmolecules the antioxidant ability of proteins. Within the ORAC assay, the oxida-tive damage inflicted to the protein is also measured by prolonging the determinationbeyond the lag phase.
Recently, an improved version of the ORAC assay was published (Ou et al., 2001).These authors used fluorescein instead of B-phycoerythrin (B-PE) as fluorescentprobe. They got higher ORAC values compared to the method using B-PE. Thisdifference is caused for example by the photoinstability of B-PE. In addition, B-PE interacts with polyphenols due to the nonspecific protein binding. Moreover, itis more expensive than fluorescein. Thus, the ORAC assay using fluorescein providesa direct measure of hydrophilic chain-breaking antioxidant capacity against peroxylradical.
Based on the ORAC assay using fluorescein, Huang et al. (2002) expanded thisassay to lipophilic antioxidants. They introduced randomly methylated β-cyclodex-trin (RMCD) as a molecular host to enhance the solubility of lipophilic antioxidantsin aqueous solution. Seven percent RMCD (w/v) in a 50% acetone-water mixturewas found to sufficiently solubilize vitamin E compounds and other lipophilicphenolic antioxidants in 75 mM phosphate buffer (pH 7.4). This modified procedurefor lipophilic compounds does, however, not measure the antioxidant activity ofcarotenoids.
As a complement to the ORAC assay that provides peroxyl radical chain-breakingcapacity, the HORAC (hydroxyl radical averting capacity) assay was developedrecently by Ou et al. (2002). The ORAC assay is validated for the determinationof peroxyl radical absorbance capacity. The HORAC assay, in contrast, is able toanalyse the hydroxyl radical prevention capacity. Hydroxyl radicals are generatedinvolving oxidizable metal ions such as Co(II) and hydrogen peroxide. This mixtureis a strongly oxidizing and hydroxylating reagent. The sample is mixed with thefluorescein reagent and incubated for 30 s. Hydrogen peroxide is added and mixedwith the previous solutions for further 30 s. After reading the initial fluorescence,the reaction is started by addition of cobalt(II) fluoride solution. The HORACvalue is calculated using the area under the fluorescence decay curve. It is expressedas micromoles of gallic acid equivalents (GAE) per gram or per liter. In contrastto Fe(II) or Cu(II) which are together with H2O2 not a stable source of hydroxylradicals, Co(II) salts are stable under physiological conditions.
The ORAC assay is one widely used method to determine the antioxidant activity,resulting in numerous applications. Besides fruit and vegetables (Wang et al., 1997),vegetables and tea extracts (Cao et al., 1996), fruits and fruit juices (Wang et al.,1996), and 39 different herbs (Zheng and Wang, 2001) Serafini et al. (1996)measured the effect of green and black tea consumption on the antioxidant capacityof human plasma. Ghiselli et al. (2000) investigated the influence of beer con-sumption on the antioxidant capacity in human plasma.
Methods to Evaluate the Antioxidant Activity 61

2.7. Fluorometric assay for aqueous and lipid antioxidants
Most of the assays used to measure antioxidant activity as well as plasma oxidiz-ability are based on aqueous radical initiators and on hydrophilic markers. Thesemethods are unable to determine the antioxidant capacity of lipid substances andof the lipid compartment of plasma. Aldini et al. (2001) developed a fluorometricmethod to selectively measure both aqueous and lipid compartment oxidizabilityin plasma. They used the azo compound 2,2′-azobis(4-methoxy-2,4-dimethyl-valeronitrile) (MeO-AMVN) as a lipid soluble radical initiator and 4,4-difluoro-5-(4-phenyl-1,3-butadienyl)-4-bora-3a,4a-diaza-s-indacene-3-undecanoic acid (C11-BODIPY 581/591) as a lipophilic fluorescence probe to monitor the lipidcompartment plasma oxidation. The red fluorescence decrease (λex = 580 nm,λem = 600 nm) of BODIPY and the green fluorescence increase (λex = 500 nm,λem = 520 nm) of the oxidation product are measured. MeO-AMVN showed advan-tages as a lipophilic radical-inducer compared to AMVN, which interfered withthe analysis due to the formation of a cloudy precipitate. The aqueous plasma oxida-tive reaction was monitored using 2,2′-azo-bis(2-amidinopropane)hydrochloride(ABAP, AAPH) as the aqueous peroxyl radical generator and 2,7′-dichlorodihy-drofluorescein (DCFH) as the marker of the oxidative reaction. The highlyfluorescent compound 2,7’-dichlorofluorescein (λex = 500 nm, λem = 520 nm) isformed in a 2-electron oxidation of DCFH.
2.8. PCL assay
In the PCL assay (Photochemoluminescence), the photochemical generation offree radicals is combined with the sensitive detection by using chemolumines-cence. This reaction is induced by optical excitation of a photosensitizer S whichresults in the generation of the superoxide radical O2
•– (Popov and Lewin, 1999):
S + hν + O2 → [S*O2] → S•+ + O2•–
The free radicals are visualised with a chemiluminescent detection reagent.Luminol works as photosensitizer as well as oxygen radical detection reagent. Thisreaction takes place in the Photochem®. Besides water soluble antioxidants (ACW)lipid soluble ones (ACL) can be measured as well. It is also possible to removethe uric acid, the main antioxidant in human plasma, by incubating the samplewith uricase (ACU).
Giving the conditions of the ACW assay as example, 1.5 mL buffer, 1 mL waterand 25 µL photosensitizer solution are mixed with 10 µL sample and measured.The resulting lag phases are calculated based on those of ascorbic acid or Troloxas standard.
Photochemoluminescence measurement was for example used by Hempel et al.(1999) to determine the effect of a parsley extract on the antioxidantive capacityof plasma in rats. Ivanov et al. (2001) used this method to analyse red wine on itsantioxidant activity.
62 V. Böhm and K. Schlesier
2.9. Chemiluminescence
Quenching of chemiluminescence has been used as well to evaluate the antioxi-dant ability of various antioxidants. Hirayama et al. (1997) used lipid hydroperoxideand isoluminol/microperoxidase reagent to generate chemiluminescence. Anti-oxidants quenched the signal depending on the dose. Lipid hydroperoxide reactswith microperoxidase to an oxyradical (LO•), which further reacts with isoluminolto a semiquinone radical. This radical oxidizes oxygen to O2
–•. The chemilumines-cence derives from isoluminol endoperoxide. Using a constant amount of lipidhydroperoxide (oxyradical donor: cumene hydroperoxide), the ability of antioxidantscan be estimated as the decrease in chemiluminescence.
Robinson et al. (1997) used an enhanced chemiluminescent assay to determineantioxidant activity. This assay is based on the chemiluminescent substrate luminol,oxidised by hydrogen peroxide. The addition of an enhancer phenol (e.g. p-iodophenol) produces a more intense, prolonged and stable light emission. Thecontinuous light emission, depending on the constant production of free radical inter-mediates, is supressed depending on the dose by antioxidants. When all antioxidantshave been consumed, the light emission is restored. This lag phase is directly relatedto the concentration of the antioxidants present in the reaction mixture.
Different black teas were analysed on their antioxidant potential using enhancedchemiluminescence by Robinson et al. (1997). This assay was also used by Maxwell(1997) to investigate how red wine consumption affected the antioxidant capacityof human plasma.
2.10. ESR assay
The electron spin resonance (ESR) spin trapping assay determines how antioxi-dants inhibit the initiation of free radical processes. Hydroxyl radicals were generatedeither by the Fenton reaction or photochemically by homolytical cleavage ofhydrogen peroxide by UV light. Antioxidants diminish the ESR signal dependingon their activity. Lindberg Madsen et al. (1996) used this technique to analyse dif-ferent spices on their antioxidant potential. Savory showed the highest activity whilemarjoram and basil had only a low antioxidant capacity. This method was alsoused by Gardner et al. (1998) to analyse green and black teas on their antioxidantpotential.
2.11. FRAP assay
The ‘Ferric Reducing Ability of Plasma’ (FRAP) assay is a simple measurementof the reducing ability of antioxidants. In contrast to many other test systems itdoes not use any radical. Thus, only the reducing ability of antioxidants and notthe radical quenching capacity of them is measured.
This assay was first described in 1996 by Benzie and Strain (1996). They usedan automatic analyzer to perform the assay. 10 µL sample and 30 µL water wereadded to 300 µL FRAP reagent, consisting of ferric chloride and 2,4,6-Tripyridyl-s-triazine (TPTZ). Absorbance readings at 593 nm were taken after 0.5 s and every
Methods to Evaluate the Antioxidant Activity 63
15 s thereafter during the monitoring period of 8 min. The change in absorbancebetween the final and the initial reading was calculated for each sample and relatedto a Fe(II) standard solution tested in parallel. Some years later Benzie and Szeto(1999) used the same assay to determine the total antioxidant capacity of tea andmentioned it ‘Ferric Reducing/Antioxidant Power’ assay. Slight modifications (Pool-Zobel et al., 1999) made it possible to use a microplate reader, more common inlabs than a centrifugal analyzer. Microtiter plates were also used by the authorslab (Schlesier et al., 2002). 30 µL water and 10 µl antioxidant solution are mixedwith 200 µL FRAP reagent. The absorbance is taken after 8 min. The reducing abilityis calculated using the absorbance difference between sample and blank and a parallelmeasured Fe(II) standard solution.
Benzie and Strain (1999) also published another modification of the FRAP assaycalled the FRASC (ferric reducing/antioxidant power and ascorbic acid concentra-tion) assay. Using this assay, three indices of antioxidant status – the total reducingpower, the absolute concentration of ascorbic acid, and the relative contributionof ascorbic acid to the antioxidant power – can be determined simultaneously. Inthe FRASC assay, acorbic acid in one of a pair of sample aliquots is selectivelydestroyed by ascorbate oxidase (EC 1.10.3.3). Reagents are otherwise the same asin the FRAP assay. The absorbance change of a sample with added ascorbate oxidaseis substracted from the absorbance change of a matching aliquot of sample towhich water, rather than ascorbate oxidase, was added. The difference is due specif-ically to ascorbic acid. Ascorbic acid has a stoichiometric factor of 2.0 by usingFe(II) standards for the calculation of ascorbic acid concentration (1000 µM of FRAPis equivalent to 500 µM of ascorbic acid).
Pulido et al. (2000) investigated the effects of different solvents on the FRAPvalue. They used different antioxidants in water as well as in methanol. The Fe(II)standard was also dissolved either in water or in methanol. Differences in theFRAP values were shown when antioxidants were dissolved in water or in methanoland the FRAP values calculated using Fe(II) calibration solutions (aqueous ormethanolic). An underestimation of the ferric reducing ability of samples in alco-holic media occurred when compared to an Fe(II) aqueous standard curve. Therefore,care should be taken when non-aqueous samples are analysed.
Gardner et al. (2000) used the FRAP assay to analyse eight different fruit andvegetable juices on their antioxidant potential.
2.12. Electrochemical assay
This method is based on a flow injection system with an electrochemical detectorequipped with a glassy carbon working electrode operating amperometrically at apotential of +0.5 V (Buratti et al., 2001). Flow injection experiments were performedin amperometry, which is based on the oxidation or reduction of an electroactivecompound at the working electrode while a constant potential is applied. Themeasured current is a direct measurement of the electrochemical reaction rate.Samples were dissolved in an appropriate volume of the carrier solution. The elec-trochemical method was successfully employed for the direct, rapid (60 samples/h)and reliable monitoring of antioxidant power in lipophilic food extracts. In contrast,
64 V. Böhm and K. Schlesier

most other methods can only be used for hydrophilic extracts. Buratti et al. (2001)showed a good correlation between amperometric results and TEAC results of dif-ferent vegetables.
2.13. Briggs-Rauscher reaction assay
A new method for monitoring the relative activity of antioxidants has been presentedrecently by Cervellati et al. (2001). The method is based on the inhibitory effectsof free-radical scavengers on the oscillations of the Briggs-Rauscher (BR) reaction.The BR oscillating system consists of the iodination and oxidation of an organicsubstrate (in general, malonic acid or its derivatives) by acidic iodate in the presenceof hydrogen peroxide and with the Mn2+-ion as catalyst. The antioxidant lead toan immediate cessation of oscillation and after some time, the so called inhibitiontime, the oscillatory behaviour is regenerated. The BR reaction shows good ampli-tude, frequency, and duration of oscillations at a pH around 2.
Höner et al. (2002) used the Briggs-Rauscher reaction assay to analyse 16 whitewines on their antioxidant activity. The inhibition time was well correlated withthe total phenolics content of the wines.
3. COMPARATIVE STUDIES
The large number of various test systems to determine antioxidant activity madeit necessary to compare these different reacting assays. However, until now only asmall number of comparative investigations exist.
Prior and Cao (1999) compared a large number of assays discussing their reactionprinciples. This comparison included among others FRAP, TEAC, TRAP, and crocinbleaching assay (similar to β-carotene bleaching), all compared to the authors ORACassay. However, they did not present any result. Wiseman et al. (1997) reviewed alot of studies determining antioxidant activity of tea polyphenols. Most investiga-tions were done with green tea catechins using the TEAC, DPPH, and LDL oxidationassay. Epigallocatechin gallate and epicatechin gallate showed the highest activityin all assays, being more potent than vitamin C and E. Thus, tea beverage has greaterin vitro antioxidant activity than most fruits and vegetables per serving.
An experimental comparison was done in 1998 by Cao et al. They analysed humanserum and urine after consumption of strawberries, spinach, red wine, and vitaminC using ORAC, FRAP and TEAC assay. The total antioxidant capacity of serumincreased significantly by 7–25% during the 4-h period following consumption.ORAC values in urine increased significantly by 10–45% for strawberries, spinach,and vitamin C. In 2000, another comparison using TEAC, FRAP and ORAC assaywas done by Rice-Evans (2000). After discussing these three methods theoreti-cally, the author compared results of plasma and serum showing similar valuesfor plasma in the FRAP assay and plasma or serum in the TEAC assay. Considerablylower values resulted in serum in the FRAP assay and in the ORAC assay (after pre-cipitation of protein). Investigations with uric acid, α-tocopherol and ascorbateshowed comparable results for the three assays. In contrast, albumin and bilirubin
Methods to Evaluate the Antioxidant Activity 65

responded very differently. Proteggente et al. (2002) analysed various fruits andvegetables on their antioxidant activity by using the TEAC assay (with pre-gener-ated ABTS radical cation), the FRAP assay, and the ORAC assay. The TEAC, FRAPand ORAC values for each sample were relatively similar and well-correlated withthe total phenolic and vitamin C contents. Fruits rich in anthocyanins (strawberry,raspberry, red plum) showed the highest antioxidant activities. Vinson et al. (2001)compared the antioxidant activity of fruits and vegetables, determined by usingTEAC, ORAC, and LDL oxidation assay, with the content of total phenolics. Theyshowed a good correlation between ORAC values and total phenolics content as wellas a correlation between TEAC values and LDL oxidizability. In contrast, Ou etal. (2002) showed different antioxidant activity trends for 927 freeze-dried vegetablesamples, using the ORAC assay and the FRAP assay. Besides a cultivation depen-dency of the ORAC and FRAP values there was an irregular relationship betweenORAC and FRAP values. Recently Schlesier et al. (2002) used TEAC, TRAP, DPPH,DMPD, PCL, and FRAP assay to analyse gallic acid, uric acid, ascorbic acid, andTrolox on their antioxidant activity. Gallic acid, representing the group of polyphe-nols, was the strongest antioxidant in all test systems with exception of the DMPDassay with ascorbic acid being the most active antioxidant compared to the otherthree compounds. Most of the assays determine the antioxidant activity in the micro-molar range needing minutes to hours. Only one assay, the PCL assay, is able toanalyse the antioxidant activity in the nanomolar range. Schlesier et al. (2002)analysed in addition to the four standard compounds different beverages to evaluatethe six test systems. Black currant juice showed highest activity compared to tea,apple juice and tomato juice. Stupans et al. (2002) analysed different polyphenols,relevant for typical components of the Mediterranean diet, on their antioxidant poten-tial. They used the DPPH assay, the LDL oxidation assay, and an assay to estimatethe generation of reactive oxygen species (formation of the fluorescent 2′7′-dichlo-rofluorescein). These investigations resulted in different rankings depending onthe test system used. Thus, activity in one test does not necessarily correlate withactivity in another.
4. CONCLUSIONS
Nowadays, phytochemicals with their antioxidative potential are regarded as pro-tective food components. Thus in die last years, many analytical methods havebeen developed to determine the antioxidant activity in all kind of matrices.
The TBARS assay is a commonly used method for the detection of lipid per-oxidation. However, this reaction is not a specific one. Another possibility to analysethe grade of lipid peroxidation is the LDL oxidation assay, which uses the ex vivooxidative modification of human low density lipoproteins.
During the last decade a lot of methods using radicals have been developed.Besides the TEAC assay, using die green coloured ABTS radical cation, die DPPHassay and the DMPD assay arc two further test systems using spectrophotometry.
The TRAP assay and die ORAC assay arc two similar fluorimetric test systems,using as fluorescent R-/B-phycoerythrin or fluorescein. Another recently devel-
66 V. Böhm and K. Schlesier
oped fluorimetric assay is able to analyse aqueous and lipid antioxidants by usingdifferent radical initiators and fluorescent probes.
Photochemoluminescence is the principle of a more sensitive test system,combining photochemical generation of free radicals with the sensitive chemolu-minescence detection. Quenching of chemoluminescence by antioxidants was as wellused to evaluate the antioxidant potential of various substances.
Further possible test systems are the electron spin resonance spin trapping assayand the FRAP assay as well as an electrochemical assay. A new method for mon-itoring the relative activity of antioxidants uses die inhibitory effects of free-radicalscavengers on the oscillations of the Briggs-Rauscher reaction.
Only a few investigations have been done which compared these different reactingassays. All existing comparison studies clearly showed differences from test totest. Thus, it is strongly recommended to use more than one assay to determinethe antioxidant potential of food extracts or plasma samples within human inter-vention studies. However, a ranking within each assay is possible. There are stillproblems to transfer these in vitro results to processes in the human organism.
REFERENCES
Aldini, G., K.-J. Yeum, R. M. Russell and N. I. Krinsky (2001). A method to measure the oxidiz-ability of both the aqueous and lipid compartments of plasma. Free Radical Biology & Medicine31: 1043–1050.
Alonso, A. M., C. Domínguez, D. A. Guillén and C. G. Barroso (2002). Determination of antioxidantpower of red and white wines by a new electrochemical method and its correlation with polyphe-nolic content. Journal of Agricultural and Food Chemistry 50: 3112–3115.
Bandoniene, D. and M. Murkovic (2002). On-line HPLC-DPPH screening method for evaluation ofradical scavenging phenols extracted from apples (Malus domestica L.). Journal of Agriculturaland Food Chemistry 50: 2482–2487.
Basaga, H., F. Acikel and C. Tekkaya (1997). Antioxidative and free radical scavenging properties ofrosmary extract. Lebensmittel-Wissenschaft & Technologie 30: 105–108.
Benzie, I. F. F. and J. J. Strain (1996). The ferric reducing ability of plasma (FRAP) as a measure of‘antioxidant power’: The FRAP assay. Analytical Biochemistry 239: 70–76.
Benzie, I. F. F. and J. J. Strain (1999). Ferric reducing/antioxidant power assay: Direct measure oftotal antioxidant activity of biological fluids and modified version for simultaneous measurementof total antioxidant power and ascorbic acid concentration. Methods in Enzymology 299: 15–27.
Benzie, I. F. F. and Y. T. Szeto (1999). Total antioxidant capacity of teas by the ferric reducing/antioxidant power assay. Journal of Agricultural and Food Chemistry 47: 633–636.
Böhm, V., N. L. Puspitasari-Nienaber, M. G. Ferruzzi and S. J. Schwartz (2002). Trolox equivalentantioxidant capacity of different geometrical isomers of α-carotene, β-carotene, lycopene, andzeaxanthin. Journal of Agricultural and Food Chemistry 50: 221–226.
Brand-Williams, W., M. E. Cuvellier and C. Berset (1995). Use of a free radical method to evaluateantioxidant activity. Lebensmittel-Wissenschaft & Technologie 28: 25–30.
Buratti, S., N. Pellegrini, O. V. Brenna and S. Mannino (2001). Rapid electrochemical method forthe evaluation of the antioxidant power of some lipophilic food extracts. Journal of Agriculturaland Food Chemistry 49: 5136–5141.
Cao, G., H. M. Alessio and R. G. Cutler (1993). Oxygen-radical absorbance capacity assay for antiox-idants. Free Radical Biology & Medicine 14: 303–311.
Cao, G., R. M. Russell, N. Lischner and R. L. Prior (1998). Serum antioxidant capacity is increasedby consumption of strawberries, spinach, red wine or vitamin C in elderly women. Journal ofNutrition 128: 2383–2390.
Methods to Evaluate the Antioxidant Activity 67

Cao, G., E. Sofic and R. L. Prior (1996). Antioxidant capacity of tea and common vegetables. Journalof Agricultural and Food Chemistry 44: 3426–3431.
Cervellati, R., K. Höner, S. D. Furrow, C. Neddens and S. Costa (2001). The Briggs-Rauscher reactionas a test to measure the activity of antioxidants. Helvetica Chimica Acta 84: 3533–3547.
Childs, R. E. and W. G. Bardsley (1975). The steady-state kinetics of peroxidase with 2,2′-azino-di-(3-ethyl-benzthiazoline-6-sulphonic acid) as chromogen. Biochemical Journal 145: 93–103.
Chu, Y.-H., C.-L. Chang and H.-F. Hsu (2000). Flavonoid content of several vegetables and their antiox-idant activity. Journal of the Science of Food and Agriculture 80: 561–566.
Espín, J. C., C. Soler-Rivas and H. J. Wichers (2000). Characterization of the total free radical scav-enger capacity of vegetable oils and oil fractions using 2,2-diphenyl-1-picrylhydrazil radical. Journalof Agricultural and Food Chemistry 48: 648–656.
Esterbauer, H., G. Striegl, H. Puhl and M. Rotheneder (1989). Continuous monitoring of in vitro oxi-dation of human low density lipoprotein. Free Radical Research Communications 6: 67–75.
Fogliano, V., V. Verde, G. Randazzo and A. Ritieni (1999). Method for measuring antioxidant activityand its application to monitoring the antioxidant capacity of wines. Journal of Agricultural and FoodChemistry 47: 1035–1040.
Frankel, E. N., C. A. Bosanek, A. S. Meyer, K. Silliman and L. L. Kirk (1998). Commercial grape juicesinhibit the in vitro oxidation of human low-density lipoproteins. Journal of Agricultural and FoodChemistry 46: 834–838.
Frankel, E. N., A. L. Waterhouse and P. L. Teissedre (1995). Principal phenolic phytochemicals inselected California wines and their antioxidant activity in inhibiting oxidation of human low-density lipoproteins. Journal of Agricultural and Food Chemistry 43: 890–894.
Fuhrman, B., A. Lavy and M. Aviram (1995). Consumption of red wine with meals reduces the sus-ceptibility of human plasma and low-density lipoprotein to lipid peroxidation. American Journalof Clinical Nutrition 61: 549–554.
Gardner, P. T., D. B. McPhail and G. G. Duthie (1998). Electron spin resonance spectroscopic assess-ment of the antioxidant potential of teas in aqueous and organic media. Journal of the Science ofFood and Agriculture 76: 257–262.
Gardner, P. T., T. A. C. White, D. B. McPhail and G. G. Duthie (2000). The relative contribution ofvitamin C, carotenoids and phenolics to the antioxidant potential of fruit juices. Food Chemistry68: 471–474.
Gazzani, G., A. Papetti, G. Massolini and M. Daglia (1998). Anti- and prooxidant activity of watersoluble components of some common diet vegetables and the effect of thermal treatment. Journalof Agricultural and Food Chemistry 46: 4118–4122.
Ghiselli, A., F. Natella, A. Guidi, L. Montanari, P. Fantozzi and C. Scaccini (2000). Beer increasesplasma antioxidant capacity in humans. Journal of Nutritional Biochemistry 11: 76–80.
Ghiselli, A., M. Serafini, G. Maiani, E. Azzini and A. Ferro-Luzzi (1995). A fluorescence-based methodfor measuring total plasma antioxidant capability. Free Radical Biology & Medicine 18: 29–36.
Halliwell, B., R. Aeschbach, J. Löliger and O. I. Aruoma (1995). The characterization of antioxi-dants. Food and Chemical Toxicology 33: 601–617.
Hempel, J., H. Pforte, B. Raab, W. Engst, H. Böhm and G. Jacobasch (1999). Flavonols and flavonesof parsley cell suspension culture change the antioxidative capacity of plasma in rats. Nahrung43: 201–204.
Henn, T. and P. Stehle (1998). Gesamtphenolgehalt und antioxidative Kapazität handelsüblicherGetränke. Ernährungs-Umschau 45: 308–313.
Hirayama, O., M. Takagi, K. Hukumoto and S. Katoh (1997). Evaluation of antioxidant activity bychemiluminescence. Analytical Biochemistry 247: 237–241.
Hofer, G., D. Lichtenberg and A. Hermetter (1995). A new fluorescence method for the continuousdetermination of surface lipid oxidation in lipoproteins and plasma. Free Radical Research 23:317–327.
Höner, K., R. Cervellati and C. Neddens (2002). Measurements of the in vitro antioxidant activityof German white wines using a novel method. European Food Research and Technology 214:356–360.
Huang, D., B. Ou, M. Hampsch-Woodill, J. A. Flanagan and E. K. Deemer (2002). Development andvalidation of oxygen radical absorbance capacity assay for lipophilic antioxidants using randomly
68 V. Böhm and K. Schlesier

methylated β-cyclodextrin as the solubility enhancer. Journal of Agricultural and Food Chemistry50: 1815–1821.
Ivanov, V., A. C. Carr and B. Frei (2001). Red wine antioxidants bind to human lipoproteins and protectthem from metal ion-dependent and -independent oxidation. Journal of Agricultural and FoodChemistry 49: 4442–4449.
Jardine, D., M. Antolovich, P. D. Prenzler and K. Robards (2002). Liquid chromatography-mass spec-trometry (LC-MS) investigation of the thiobarbituric acid reactive substances (TBARS) reaction.Journal of Agricultural and Food Chemistry 50: 1720–1724.
Kanner, J., E. Frankel, R. Granit, B. German and J. E. Kinsella (1994). Natural antioxidants in grapesand wines. Journal of Agricultural and Food Chemistry 42: 64–69.
Kikuzaki, H. and N. Nakatani (1993). Antioxidant effects of some ginger constituents. Journal ofFood Science 58: 1407–1410.
Kinsella, J. E., E. Frankel, B. German and J. Kanner (1993). Possible mechanisms for the protectiverole of antioxidants in wine and plant foods. Food Technology 47: 85–89.
Kondo, K., R. Hirano, A. Matsumoto, O. Igarashi and H. Itakura (1996). Inhibition of LDL oxidationby cocoa. The Lancet 348: 1514.
Leonardi, C., P. Ambrosino, F. Esposito and V. Fogliano (2000). Antioxidative activity and carotenoidand tomatine contents in different typologies of fresh consumption tomatoes. Journal of Agriculturaland Food Chemistry 48: 4723–4727.
Liebert, M., U. Licht, V. Böhm and R. Bitsch (1999). Antioxidant properties and total phenolicscontent of green and black tea under different brewing conditions. Zeitschrift für Lebensmittel-Untersuchung und -Forschung A 208: 217–220.
Lindberg Madsen, H., L. Andersen, L. Christiansen, P. Brockhoff and G. Bertelsen (1996). Antioxidativeactivity of summer savory (Satureja hortensis L.) and rosmary (Rosmarinus officinalis L.) in minced,cooked pork meat. Zeitschrift für Lebensmittel-Untersuchung und -Forschung 203: 333–338.
Lindberg Madsen, H., B. Rud Nielsen, G. Bertelsen and L. H. Skibsted (1996). Screening of antiox-idative activity of spices. A comparison between assays based on ESR spin trapping andelectrochemical measurement of oxygen consumption. Food Chemistry 57: 331–337.
Marco, G. J. (1968). A rapid method for evaluation of antioxidants. Journal of the American OilChemists’ Society 45: 594–598.
Martinéz-Botas, J., H. Ortega, P. Carrero, D. Gómez-Coronado and M. A. Lasuncíon (1998). Wineflavonoids prevent the accelerated peroxidation in minimally-modified LDL and cytotoxicity toproliferating lymphocytes. In R. Armado, H. Andersson, S. Bardócz and F. Serra (eds.), COST916 – Polyphenols in Food. European Commission, Directorate-General XIII, Luxembourg, pp.227–231.
Maxwell, S. R. J. (1997). Wine antioxidants and their impact on antioxidant activity in vivo. ACSSymposium Series 661: 150–165.
Meyer, A. S., O.-S. Yi, D. A. Pearson, A. L. Waterhouse and E. N. Frankel (1997). Inhibition ofhuman low-density lipoprotein oxidation in relation to composition of phenolic antioxidants in grapes(Vitis vinifera). Journal of Agricultural and Food Chemistry 45: 1638–1643.
Miller, N. J., A. T. Diplock and C. A. Rice-Evans (1995). Evaluation of the total antioxidant activityas a marker of the deterioration of apple juice on storage. Journal of Agricultural and Food Chemistry43: 1794–1801.
Miller, N. J., C. Rice-Evans, M. J. Davies, V. Gopinathan and A. Milner (1993). A novel method formeasuring antioxidant capacity and its application to monitoring the antioxidant status in prema-ture neonates. Clinical Science 84: 407–412.
Miller, N. J., J. Sampson, L. P. Candeias, P. M. Bramley and C. A. Rice-Evans (1996). Antioxidantactivities of carotenes and xanthophylls. FEBS Letters 384: 240–242.
Ou, B., M. Hampsch-Woodill, J. Flanagan, E. K. Deemer, R. L. Prior and D. Huang (2002). Novelfluorometric assay for hydroxyl radical prevention capacity using fluorescein as the probe. Journalof Agricultural and Food Chemistry 50: 2772–2777.
Ou, B., M. Hampsch-Woodill and R. L. Prior (2001). Development and validation of an improved oxygenradical absorbance capacity assay using fluorescein as the fluorescent probe. Journal of Agriculturaland Food Chemistry 49: 4619–4626.
Ou, B., D. Huang, M. Hampsch-Woodill, J. A. Flanagan and E. K. Deemer (2002). Analysis of antiox-
Methods to Evaluate the Antioxidant Activity 69
idant activities of common vegetables employing oxygen radical absorbance capacity (ORAC) andferric reducing antioxidant power (FRAP) assays: A comparative study. Journal of Agriculturaland Food Chemistry 50: 3122–3128.
Paganga, G., N. Miller and C. A. Rice-Evans (1999). The polyphenolic content of fruit and vegeta-bles and their antioxidant activities. What does a serving constitute? Free Radical Research 30:153–162.
Pellegrini, N., R. Re, M. Yang and C. Rice-Evans (1999). Screening of dietary carotenoids andcarotenoid-rich fruit extracts for antioxidant activities applying 2,2′-azinobis(3-ethylenebenzothia-zoline-6-sulfonic acid) radical cation decolorization assay. Methods in Enzymology 299: 379–389.
Pellegrini, N., P. Simonetti, C. Gardana, O. Brenna, F. Brighenti and P. Pietta (2000). Polyphenol contentand total antioxidant activity of Vini novelli (young red wines). Journal of Agricultural and FoodChemistry 48: 732–735.
Pool-Zobel, B. L., A. Bub, N. Schröder and G. Rechkemmer (1999). Anthocyanins are potent antiox-idants in model systems but do not reduce endogenous oxidative DNA damage in human coloncells. European Journal of Nutrition 38: 227–234.
Popov, I. and G. Lewin (1999). Antioxidative homeostasis: Characterization by means of chemilumi-nescent technique. Methods in Enzymology 300: 437–456.
Prior, R. L. and G. Cao (1999). In vivo total antioxidant capacity: Comparison of different analyticalmethods. Free Radical Biology & Medicine 27: 1173–1181.
Proteggente, A. R., A. Sekher Pannala, G. Paganga, L. van Buren, E. Wagner, S. Wiseman, F. van dePut, C. Dacombe and C. A. Rice-Evans (2002). The antioxidant activity of regularly consumedfruit and vegetables reflects their phenolic and vitamin C composition. Free Radical Research 36:217–233.
Puhl, H., G. Waeg and H. Esterbauer (1994). Methods to determine oxidation of low-density lipopro-teins. Methods in Enzymology 233: 425–441.
Pulido, R., L. Bravo and F. Saura-Calixto (2000). Antioxidant activity of dietary polyphenols as deter-mined by a modified ferric reducing/antioxidant power assay. Journal of Agricultural and FoodChemistry 48: 3396–3402.
Re, R., N. Pellegrini, A. Proteggente, A. Pannala, M. Yang and C. Rice-Evans (1999). Antioxidantactivity applying an improved ABTS radical cation decolorization assay. Free Radical Biology &Medicine 26: 1231–1237.
Regnström, J., K. Ström, P. Moldeus and J. Nilsson (1993). Analysis of lipoprotein diene formationin human serum exposed to copper. Free Radical Research Communications 19: 267–278.
Rice-Evans, C. A. (2000). Measurement of total antioxidant activity as a marker of antioxidant statusin vivo: Procedures and limitations. Free Radical Research 33: S59–66.
Robinson, E. E., S. R. J. Maxwell and G. H. G. Thorpe (1997). An investigation of the antioxidantactivity of black tea using enhanced chemiluminescence. Free Radical Research 26: 291–302.
Scheek, L. M., S. A. Wiseman, L. B. M. Tijburg and A. van Tol (1995). Dialysis of isolatedlow density lipoprotein induces a loss of lipophilic antioxidants and increases the susceptibility tooxidation in vitro. Atherosclerosis 117: 139–144.
Schlesier, K., M. Harwat, V. Böhm and R. Bitsch (2002). Assessment of antioxidant activity by usingdifferent in vitro methods. Free Radical Research 36: 177–187.
Sellappan, S., C. C. Akoh and G. Krewer (2002). Phenolic compounds and antioxidant capacity ofGeorgia-grown blueberries and blackberries. Journal of Agricultural and Food Chemistry 50:2432–2438.
Serafini, M., A. Ghiselli and A. Ferro-Luzzi (1996). In vivo antioxidant effect of green and black teain man. European Journal of Clinical Nutrition 50: 28–32.
Simonetti, P., P. Pietta and G. Testolin (1997). Polyphenol content and total antioxidant potential ofselected Italian wines. Journal of Agricultural and Food Chemistry 45: 1152–1155.
Strube, M., G. R. M. M. Haenen, H. van den Berg and A. Bast (1997). Pitfalls in a method for assess-ment of total antioxidant capacity. Free Radical Research 26: 515–521.
Stupans, I., A. Kirlich, K. L. Tuck and P. J. Hayball (2002). Comparison of radical scavenging effect,inhibition of microsomal oxygen free radical generation, and serum lipoprotein oxidation of severalnatural antioxidants. Journal of Agricultural and Food Chemistry 50: 2464–2469.
70 V. Böhm and K. Schlesier

Taga, M. S., E. E. Miller and D. E. Pratt (1984). Chia seeds as a source of natural lipid antioxidants.Journal of the American Oil Chemists’ Society 61: 928–931.
Tedesco, I., M. Russo, P. Russo, G. Iacomino, G. L. Russo, A. Carraturo, C. Faruolo, L. Moio andR. Palumbo (2000). Antioxidant effect of red wine polyphenols on red blood cells. Journal ofNutritional Biochemistry 11: 114–119.
van het Hof, K. H., H. S. M. de Boer, S. A. Wiseman, N. Lien, J. A. Weststrate and L. B. M. Tijburg(1997). Consumption of green or black tea does not increase resistance of low-density lipoproteinto oxidation in humans. American Journal of Clinical Nutrition 66: 1125–1132.
Velioglu, Y. S., G. Mazza, L. Gao and B. D. Oomah (1998). Antioxidant activity and total phenolicsin selected fruits, vegetables, and grain products. Journal of Agricultural and Food Chemistry 46:4113–4117.
Vinson, J. A. and B. A. Hontz (1995). Phenol antioxidant index: Comparative antioxidant effective-ness of red and white wines. Journal of Agricultural and Food Chemistry 43: 401–403.
Vinson, J. A., J. Proch and P. Bose (2001). Determination of quantity and quality of polyphenolantioxidants in foods and beverages. Methods in Enzymology 335: 103–115.
von Gadow, A., E. Joubert and C. F. Hansmann (1997). Effect of extraction time and additionalheating on the antioxidant activity of Rooibos tea (Aspalathus linearis) extracts. Journal ofAgricultural and Food Chemistry 45: 1370–1374.
Wang, H., G. Cao and R. L. Prior (1996). Total antioxidant capacity of fruits. Journal of Agriculturaland Food Chemistry 44: 701–705.
Wang, H., G. Cao and R. L. Prior (1997). Oxygen radical absorbing capacity of anthocyanins. Journalof Agricultural and Food Chemistry 45: 304–309.
Waterhouse, A. L., J. R. Shirley and J. L. Donovan (1996). Antioxidants in chocolate. The Lancet348: 834.
Wayner, D. D. M., G. W. Burton, K. U. Ingold and S. Locke (1985). Quantitative measurement ofthe total, peroxyl radical-trapping antioxidant capability of human blood plasma by controlled per-oxidation. FEBS Letters 187: 33–37.
Wiseman, S. A., D. A. Balentine and B. Frei (1997). Antioxidants in tea. Critical Reviews in FoodScience and Nutrition 37: 705–718.
Yen, G.-C. and H.-Y. Chen (1995). Antioxidant activity of various tea extracts in relation to their antimu-tagenicity. Journal of Agricultural and Food Chemistry 43: 27–32.
Zeyuan, D., T. Bingyin, L. Xiaolin, H. Jinming and C. Yifeng (1998). Effect of green tea and blacktea on the blood glucose, the blood triglycerides, and antioxidation in aged rats. Journal ofAgricultural and Food Chemistry 46: 3875–3878.
Zheng, W. and S. Y. Wang (2001). Antioxidant activity and phenolic compounds in selected herbs.Journal of Agricultural and Food Chemistry 49: 5165–5170.
Methods to Evaluate the Antioxidant Activity 71
ESSENTIAL OIL DRUGS – TERPENE COMPOSITION OFAROMATIC HERBS
JENS ROHLOFFThe Plant Biocentre, Department of Biology, Faculty of Natural Sciences and Technology,Norwegian University of Science and Technology (NTNU), 7491 Trondheim, Norway
1. INTRODUCTION
‘Essential Oils are the Winds of Gods and we Earthly Souls are the Chosen Onesto be tempted by their Enticing Breath’ – Nothing is more beguiling to our sensesand touches us more intimately than the fragrance from flowers and aromaticessences. But what mesmerizes us into that state of pleasant sensation and dreamingand why do we perceive other kinds of scents as unpleasant, let alone disgusting?Question about the nature of things and their material composition are surely asold as the attempts to give the answers meaning through religious faith and meta-physical explanations. The search for knowledge and intellectual curiosity are a basichuman traits and, naturally, answers are not long coming. However, the kind ofresults we get from our investigations, not only depend on the questions proposed,but are equally determined by the means and tools we make use of to achievesatisfactory results. Seen from a scientific point of view, researchers have at theirdisposal a vast tool box of analytical instruments and devices for studying essen-tial oils (EO).
Raw materials for essential oil production often come from temperate orMediterranean climates, although terpene structures appear throughout the plantkingdom all over the world and can even be found in species growing underunfavourable conditions in deserts or arctic climates. The economic importance ofaromatic plants can be traced back to the ancient world when essences and fragranceswere sold as valuable goods. Archaeological discoveries revealed evidence thatthe basic knowledge for EO production by distillation has been known for over4000 years. The essences from the Orient, Arabia and South-Asia were handledas treasures and sold on the European markets in ancient Greece and in Old Rome.Not only were the fragrance and food flavour properties of aromatic plants inter-esting to the alchemists of the Renaissance who began studying indigenous plantsof Central Europe, the medicinal attributes of EOs were especially attractive. Theinvention of the printing press in the 15th century resulted in the knowledge andwisdom that had been recorded in various herbal works being printed between1450 and 1650.
The later Industrial Revolution went hand-in-hand with the scientific revolu-tion in replacing alchemy with modern chemistry based on logical deductions andanalytical methods. In the beginning of the 20th century, herbal and aromaticmedicine lost much of its importance based on the discoveries of an up-coming,inventive pharmaceutical industry, which was introducing synthetic derivates ofnatural bioactive compounds. The implication of EOs for modern phytopharmacy
R. Dris and S. M. Jain (eds.), Production Practices and Quality Assessment of Food Crops,
© 2004 Kluwer Academic Publishers. Printed in the Netherlands.
73
Vol. 3, “Quality Handling and Evaluation”, pp. 73–128.
was revived by laying the foundations for aromatherapeutical applications inFrance and England in the 1920s. Being a source for medicinal applications, EOquality requirements have been manifestated themselves in guidelines and mono-graphs of phamacopeias in several countries and communities (e.g. AFNOR, 1996;Council of Europe, 2002; Martindale and Sweetman, 2002). Changed consumerdemands, raised public interest, health consciousness and, last but not least, thecapability of EOs in biotechnology has blown new wind under the wings of modernphytomedicine.
These trends have also been recognized in peripheral areas of Europe such asScandinavia, through the encouragement of cultivation, processing, marketing anddistribution of aromatic herbs and medicinal plants. In Norway, the national project,‘Norwegian Herb Production (NUP)’, was carried out during the period from1994–1998. The project was supported by the Norwegian Research Council (NFR)and national development funds, focussing on precisely these tasks to meet poten-tial market opportunities. Production, composition and quality characteristics of EOsfrom chamomile, lemon balm, oregano, peppermint, sachalinmint, thyme and yarrowhave been investigated (Iversen, 1994; Iversen et al., 1994a and 1994b; Iversenand Steen, 1996 and 1997; Iversen and Rohloff, 1997) and cultivation guidelinesstressing geographic and climatic needs have been devised (Dragland and Galambosi,1996; Iversen and Rohloff, 1998). The fundamentals of routine isolation, separa-tion and analysis techniques for EOs and aroma volatiles in general were establishedat The Plant Biocentre and constituted the basis for a scientific network betweenuniversity, research institutions and private companies. Aromatic herbs such asMentha × piperita L. (Rohloff, 1999; Rohloff et al., 2000b), Mentha sachalinensis(Briq.) Kudô (Rohloff et al., 2000b; Rohloff, 2002a), Achillea millefolium L. (Rohloffet al., 2000a) and Rhodiola rosea L. (Rohloff, 2002b; Rohloff et al., 2002c) havebeen studied in detail by applying solid-phase microextraction (SPME) and gas chro-matography-mass spectrometry (GC-MS) as the favoured analytical tools-of-choice.
The following gives an introduction into the fascinating world of essential oils(Chapter 2). An overview of developments and reports on recent essential oil researchis given with focus on solid-phase microextraction (SPME) by outlining devices,procedures, extraction parameters and applicability for EO volatile detection withinplant research and food quality control (Chapter 3). This review emphasises theapplications of SPME by presenting many hitherto unpublished results from studieson aromatic plants carried out in the author’s laboratory at the Plant Biocentre inTrondheim, Norway, over the past 5 years (Chapter 4) before proceeding to futureprospects and trends within EO production, analysis and applications (Chapter 5).
2. SCENT AND SIGNAL ✧ THE WORLD OF ESSENTIAL OILS
2.1. Structures and biosynthesis
Plant primary products refer to the chemical groups of carbohydrates, proteins,nucleic acids, fats and lipids. Their functions are related to structure, physiologyand genetics, which imply their crucial role in plant development. In contrast,
74 Jens Rohloff

secondary metabolites normally occur as minor compounds in low concentrations.They are involved in signalling mechanisms and plant defence and show quitecharacteristic patterns in their relationship to plant family or genus and thus, under-score their importance for chemotaxonomical and systematic determinations.Although many of these metabolites show structural similarities to primary products,one can divide secondary metabolites into the main chemical groups: terpenoids,alkaloids, phenolics, rare amino acids, plant amines and glycosides.
The chemical structure of the terpenoids is based on up to five C5-isopreneunits (CH2=C(CH3)-CH=CH2), which lead to higher molecular structures of theisoprenoids through elongation and cyclization such as gibberellins, steroids,carotenoids and rubber, etc. The so-called biogenetic isoprene rule describes thebasic carbon skeleton of terpenic and isoprenic structures by dividing them intothe following classes:
monoterpenes 2 units C10
sesquiterpenes 3 units C15
diterpenes 4 units C20
sesterpenes 5 units C25
triterpenes 6 units C30
tetraterpenes 8 units C40
polyterpenes > 8 units
Newer findings provide evidence for the existence of compartimentation andenzymatic independence of two crucial biosynthesis pathways of terpenoids –the classical MAD route (mevalonate-dependent; Waterman, 1993; Schmidt, 1998;Kribii et al., 1999; Loza-Tavera, 1999) and the commonly accepted MAI route(mevalonate-independent; Rohmer et al., 1996; Keskitalo, 1999; Kreuzwieser etal., 1999; Sangwan et al., 2001; Dewick, 2002), also termed as the deoxy-xylulosephosphate (DOXP) pathway. In their multidisciplinary book about natural terpenoids,Harrewijn and co-authors (2001) give a detailed overview of possible ways forthe evolutionary-originated development of biosynthetic pathways, discussingthe alternatives for the production of the central terpenoid precursors isopentenyldiphosphate (IPP) and dimethylallyl diphosphate (DMAPP). Studies with theisotopic-labelled precursors DOXP and mevalonic acid have been carried out (Pielet al., 1998) to describe the different pathways for monoterpenes (Lichtenthaler,1999; Dewick, 2002). Monoterpenes, diterpenes and even more complex struc-tures such as carotenoids are produced in plastides via geranyl diphosphate (GPP),whereas sesquiterpenes, triterpenes and sterols derive from cytosolic synthesis viafarnesyl diphosphate (FPP). Despite their site-specific synthesis and complexity,monoterpenes and sesquiterpenes show structural similarities and form the main poolof compounds found in essential oils of aromatic herbs. Aliphatic hydrocarbons suchas acids, aldehydes and acids and the phtaloids normally occur in lesser amounts.According to cyclization structure and functional groups, monoterpenes andsesquiterpenes can be divided into the following classes (Figure 1).
High concentrations of phenylpropanoids or more strictly, phenylpropenes, canoften be found in tropical spices. These compounds derive from the shikimicacid pathway and are based on the intermediate (E)-cinnamic acid, which leads to
Essential Oil Drugs – Terpene Composition of Aromatic Herbs 75

differentiated structures through side chain modification and functional groups,isomeric variation and different levels of oxidation. Significant phenylpropenesare cinnamic acid esters, the isomers anethole and estragole, eugenol, myristicine,elimicine, safrole and apiole. Important phenylpropene structures due to flavourproperties from commercially valuable herbs and spices are presented in Figure 2.
2.2. Plant sources and production
Whilst the chemical structures of terpenoids can be found throughout the plantand animal kingdom, the occurrence of essential oils (EO) is restricted to over2000 plant species from about 60 different families and only about 100 speciesare the basis for the economically important production of essential oils in the world(Lawless, 1996). Among the aromatic plants, spices, for example nutmeg, maze,
76 Jens Rohloff
Figure 1. Classification of monoterpenes and sesquiterpenes.

Essential Oil Drugs – Terpene Composition of Aromatic Herbs 77
Fig
ure
2.
Impo
rtan
t ph
enyl
prop
enes
of
EO
s fo
und
in h
erbs
and
spi
ces.

cardamom and clove, mostly derived from tropical plants and used for the seasoningof foods, are especially well known for quite high essential oil concentrations ofup to 20% (Richards, 1991). One has to make a distinction between oils andoleoresins, which are a mixture of fats, waxes and EO, but often represent a highermarketable value of the plant extractives. The ability to accumulate EOs is quitehigh in both Gymnosperms and Angiosperms, although the most commercially impor-tant EO plant sources are related to the latter. Except for the conifers and junipers,most of the aromatic plants and EO commodities in terms of world trade are relatedto the families of Labiatae, Umbelliferae and Compositae (Hay and Svoboda, 1993).
The storage of essential oils in higher plants is not restricted to specializedplant parts. EOs occur in both roots, stems, leaves, flowers and seeds, or in theplant as a whole. Both epidermal or mesophyll tissue can function as the site ofterpene biosynthesis in general, whereas typical storage cells or cell structurescharacterize the taxonomic group of aromatic plants: Oil cells, secretory glands,ducts and canals and the Labiatae-typical glandular trichomes (capitate and peltateglands). Depending on morphological structures, varying secondary metabolism andthus, determined signalling and defence functions of EOs in plant organs, the pro-nounced alteration gives the ability to obtain essential oil qualities that are quitedifferent from one and the same plant. Some examples of multi-purpose aromaticherbs, spices and medicinal plants are given in Table 1.
One has to make a distinction between the tools and techniques used for theproduction and those for the analysis of EOs. Although the technical equipment
78 Jens Rohloff
Table 1. Examples of multi-purpose plants used for flavouring and EO production.
Botanical name English name EO plant organs Others
Abies and Picea sp. fir and spruce needles and oleoresins from branches wood (turpentine)
Angelica archangelica L. angelica roots, leaves and seeds nutrient (leaves)Arnica sp. arnica roots and flowers –Cinnamon camphora L. camphor tree wood and leaves –Cinnamon sp. cinnamon bark, stems and leaves –Cupressus sp. cypress species needles, branches –
and conesFoeniculum vulgare Mill. (sweet) fennel seeds nutrient (stem)Juniperus sp. juniper species needles and berries EOs and oleoresins
from woodLaurus nobilis L. sweet bay leaves, twigs and –
(laurel) berriesLevisticum officinale Koch. lovage roots, leaves and stems nutrient (leaves)Myristica fragrans Houttuyn nutmeg and maze seeds and arils –Petrosinellum crispum parsley roots and leaves nutrient (root, leaf )(Mill.) Nyman oleoresin (seeds)Pimenta dioica (L.) Merr. pimento leaves and berries oleoresin (berries)Pinus sp. pine needles and oleoresins from
branches wood (turpentine)Syzygium aromaticum (L.) clove flower buds and leaves oleoresin (buds)Merr. et Perry

for distillation, extraction and pressing is used for both purposes, the aim establishesthe difference. Industrial-scale EO extraction focuses on mass production whilstlaboratory applications often work on a micro-scale in order to isolate small quan-tities within a short time for qualitative and quantitative analyses. EOs are perdefinition produced from raw plant material by distillation or pressing (Table 2).Strictly speaking, EOs that are isolated by the use of solvents, sub- or supercrit-ical CO2 extraction are not genuine essential oils since non-volatile and waxycomponents have to be removed by fractionation (Lawrence, 2002).
2.3. Factors affecting EO quality
Since often only one or a few components are responsible for the desired effector application, importance has been attached to the characterization and analysisof EOs in recent decades. Besides cosmetics, perfumes and flavouring, EOs havebeen studied with regard to their antimicrobial (Hirasa and Takemasa, 1998; Cowan,1999) and antioxidant properties (Hirasa and Takemasa, 1998; Stashenko et al.,2002). Several terpenes are known to be important mediators in plant-insect-inter-actions (Harrewijn et al., 2001) and their capability for biological control for pestand disease management in plant production is an area of growing interest (e.g.Isman, 2000; Quintanilla, 2002; Quintanilla et al., 2002). EOs show physiological(Hirasa and Takemasa, 1998), anti-tubercular (Cantrell et al., 2001) and anti-tumoureffects (Loza-Tavera, 1999). Their biosynthetic production through biotechnologicalapplications (Deans and Svoboda, 1993; Hsu and Yang, 1996; Nishimura and Noma,1996; Kribii et al., 1999; Barkovich and Liao, 2001; Nagata and Ebizuka, 2002)and synthesis of new terpenoids (Gautschi et al., 2001) have been investigated.
Despite the utilization of terpenoids in biomedical, agricultural and biotechno-logical applications, Sections 2.3 and 2.4 and particularly, Chapter 4, will focuson essential oil quality and variability of oil composition. Although EOs may beproduced from an endemic population, there can be several reasons why the com-position and thus, the EO quality from aromatic plants might differ greatly. Genetic,physiological and environmental factors as well as processing conditions, whichare presented in Table 3, may play an important role (Hay, 1993; Hay and Svoboda,1993; Rohloff, 1999 and 2002a; Rohloff et al., 2000a and 2002c; Lawrence, 2002).
Infraspecific and intervarietal differences can be observed in both morphology
Essential Oil Drugs – Terpene Composition of Aromatic Herbs 79
Table 2. Classical techniques for high-yield production of EOs and aromatic extracts.
Product Technique
Essential Oil Distillation steam distillationhydrodistillation
Pressing hotcold
Aromatic Extract Solvent Extraction resins, concrètes, absoluesEnfleurage pomades, absoluesCO2-extraction resins, aromatic essencesAlcoholic Extraction tinctures

and chemical structures, which establish the basis for determining importantchemically defined populations or chemotypes (Hay and Svoboda, 1993). Despitearomatherapeutic demands, which require that the medicinal value of an essentialoil be based on its complete composition rather than its constituent parts(Franchomme et al., 1990), one still has to consider the chemical specification ofEOs with regard to toxic concentrations of single constituents (Tisserand and Balacs,1995; Lawless, 1996; Price and Price, 1999). Table 4 gives an overview about themain chemotypes of important aromatic herbs.
Not only ontogenesis but especially intraspecific variation, i.e. differences betweenindividuals from identical species, has to be taken into account for the use ofappropriate numbers of plant samples when determining EO quality regarding theirterpene and phenylpropene composition. There is not even a correlation betweenmorphological and chemical characters (Franz, 1993), which makes it difficult andintricate to characterize chemotypes on a phenotypic basis. The influence of envi-ronmental factors on chemotypic differentiation has been reported widely. Dependingon different light conditions and temperatures, Massoud (1989) reported varyingoil yield and expression of bisabolol and chamazulene in chamomile, and Franz(1993) described the geographical distribution of chamomile chemotypes throughoutMediterranean regions. When viewed on a microscale, temperature and light con-dition changes during a period of a day might be responsible for distinct variationsof EO yield and composition as well (Fahlen et al., 1997; Silva et al., 1999;Rodrigues et al., 2002). Taking newer scientific reports on coriander (Coriandrumsativum L.) as an example and starting point, one might explore the whole com-plexity of questions related to EO composition, biosynthesis, production, quality,analysis and processing (Table 5).
The idea of ‘essential oils as a pure, natural product from raw plant materials’aquires another dimension when reading Lawrence’s article (2002) about the pro-duction and standardization of commercial EOs. Standardization is carried out byblending EOs in order to improve composition consistency of the oils and tominimize seasonal and geographical variations. On the other hand, adulteration,through the addition of synthetic components, oil fractions or oils or even other,‘foreign’ natural products, is carried out for financial gain. In any case, the
80 Jens Rohloff
Table 3. Factors influencing the composition of commercial EOs.
Factor Description
Genetics Taxon clone, hybrid, cultivar, populationInfraspecific chemotypes (distinct populations within a species)
Physiology Ontogenetic developmental changes (vegetative < > generative)Plant organ morphological differences (root, leaf, flower, seed)
Environment Climate light, temperature, edaphic factorsOrigin latitude, height above MSL, country, continentAgriculture cultivation technique, fertilizer, irrigation, harvest time
Processing EO isolation distillation, extraction, maceration, pressing, enfleurageStorage effects of aging, ∆T, rH etc. on raw material or EO Adulteration/Standardization EO blending prior to distillation/directly into the EO

genuineness and character of the EO is reduced with regard to olfaction, anti-oxidant properties and biomedical applicability. Thus, when demanding pure, high-quality EOs, the use of advanced analytical tools for revealing the source authenticityand possible adulteration, is inevitable.
2.4. ‘Norwegian Herb Production (NUP)’ 1994–1998
As part of the project ‘Norwegian Herb Production (NUP)’ in the period between1994–1998, research has been carried out at the author’s laboratory at The PlantBiocentre on essential oil yield and composition of the following aromatic herbs:chamomile (Chamomilla recutita L.), lemon balm (Melissa officinalis L.), oregano(Origanum vulgare L.), peppermint (Mentha × piperita L.), sachalinmint (Menthasachalinensis Briq. (Kudô)), thyme (Thymus vulgaris L.) and yarrow (Achillea mille-folium L.). The study was partly financed by the Norwegian Research Council (NFR)and addressed to give a better understanding of cultivation and processing needswith regard to fertilization, winter hardiness, dry matter, EO yield and EO qualitydepending on harvest time and genotype of the selected herbs and cultivars. Theresults presented have not been published before in scientific media, and will beused to discuss the influence of environmental factors as already mentioned inChapter 2.3, Factors affecting EO Quality.
Essential Oil Drugs – Terpene Composition of Aromatic Herbs 81
Table 4. Chemotypical variation of some economically important aromatic herbs and spices, updatedafter Boelens (1991), Franz (1993) and Lawless (1996).
Botanical name English name Main chemotype
Achillea millefolium L. yarrow (pro)azulene, azulene-free, caryo-phyllene, germacrene D, farnesene
Artemisia vulgaris L. common worm-wood α-/β-thujone, 1,8-cineole, linalool camphorAnethum graveolens L. dill carvone, limonene, phellandreneCarum carvi L. caraway carvone, limoneneChamomilla recutita L. chamomile bisabolol, bisabololoxide A/B, bis
abolonoxide ACuminum cyminum L. cumin cumin aldehyde, pineneFoeniculum vulgare L. sweet fennel anethole, fenchone, limonene, estragolevar. dulceLavandula angustifolia Mill. lavender linalool, linalyl acetateMelissa officinalis L. lemon balm geraniol, citronellolMentha × piperita L. peppermint menthol, carvone, limonene, linaloolMentha spicata L. spearmint carvone, menthone, piperitoneOcimum basilicum L. sweet basil estragole, linalool, eugenol camphor,
methyl cinnamateOriganum majorana L. marjoram terpineol, sabinene hydrateOriganum vulgare L. oregano carvacrol, thymolRosmarinum officinalis L. rosemary verbenone, 1,8-cineole, α-pineneSalvia officinalis L. Dalmatian sage α-/β-thujone, thujone-free, 1,8-cineole,
camphorThymus vulgaris L. thyme thymol, carvacrol, linalool, geraniol,
thujanol, terpineolValeriana officinalis L. valerian valeranone, valeranal, cryptofauronol

Figures 3 and 4 represent results from the pre-project period in 1994 and showthe essential oil composition of four different herbs with regard to fertilizer man-agement and geographic locality of the trial fields. The trials were carried out infour counties: Møre- and Romsdal in the southern region of central Norway at62°–63°N, South-Trøndelag at 63°–65°N, North-Trøndelag at 64°–65°N andNordland in northern Norway at a latitude between 65°–69°N. The EO was obtainedby hydrodistillation from dried plants and analysed by GC-FID (oregano, thyme)and GC-MS (chamomile, lemon balm).
Using fertilizer use for comparison (Figure 3), high variation was observedwhen averaging the results from the different counties, and no distinct trends couldbe found with regard to differing light conditions, day length and/or temperatureeffects. Data on thyme and oregano were most consistent and showed the loweststandard deviation. Both species belong to the Labiateae family and are closelyrelated to each other with regard to the occurrence of the terpenoid phenols thymoland carvacrol, which were increased under organic culture. In general, the chemo-typic distribution of the main-character terpenes of the studied herbs was onlyslightly affected, although tendencies of environment-dependant increased or
82 Jens Rohloff
Table 5. Various analytical approaches and applications regarding the EO composition of coriander(Coriandrum sativum L.).
Genotype Evaluation of coriander (Coriandrum sativum) collection for essential oil – Kalraet al., 1999
Origin Compositional differences of coriander fruit oils from various origins – Pino etal., 1993
Cultivation Coriander essential oil composition from two genotypes grown in different environmental conditions – Gil et al., 2002
Plant organ Essential oil composition of cilantro – Potter, 1996Ontogenesis Commercial essential oils: truths and consequences – Lawrence, 2002Symbiosis Mycorrhization of coriander (Coriandrum sativum L.) to enhance the concentra-
tion and quality of essential oil – Kapoor et al., 2002Production Coriander spice oil: Effects of fruit crushing and distillation time on yield and
composition – Smallfield et al., 2001Biotechnology Production of volatile compounds in suspension cell cultures of Coriandrum sativum
L. and Levisticum officinale Koch – Hsu and Yang, 1996Analysis Extraction of coriander seed oil by CO2 and propane at super- and subcritical
conditions – Illes et al., 2000Storage Influence of the duration and conditions of storage on the composition of the
essential oil from coriander seeds – Misharina, 2001Drying Microwave drying of selected greens and their sensory characteristics – Fathima
et al., 2001Adulteration GC-IRMS in the authenticity control of the essential oil of Coriandrum sativum
– Frank et al., 1995Olfaction Sedative effect on humans of inhalation of essential oil of linalool: Sensory
evaluation and physiological measurements using optically active linalools –Sugawara et al., 1998
Pharmacology Coriandrum sativum – effect on lipid metabolism in 1,2-dimethyl hydrazine inducedcolon cancer – Chithra and Leelamma, 2000
Preservation Evaluation of antilisterial action of cilantro oil on vacuum packed ham – Gill etal., 2002

Essential Oil Drugs – Terpene Composition of Aromatic Herbs 83
Sour
ce:
Iver
sen
et a
l., 1
994a
and
199
4b
Fig
ure
3.
EO
com
posi
tion
of
the
arom
atic
her
bs c
ham
omil
e, l
emon
bal
m,
oreg
ano
and
thym
e, g
row
n in
Nor
way
in
1994
(N
UP
-pro
ject
) w
ith
rega
rd t
o fe
rtil
izat
ion.
Hor
izon
tal
bars
ind
icat
e st
anda
rd d
evia
tion
of
aver
age
valu
es f
rom
all
tri
al f
ield
s.
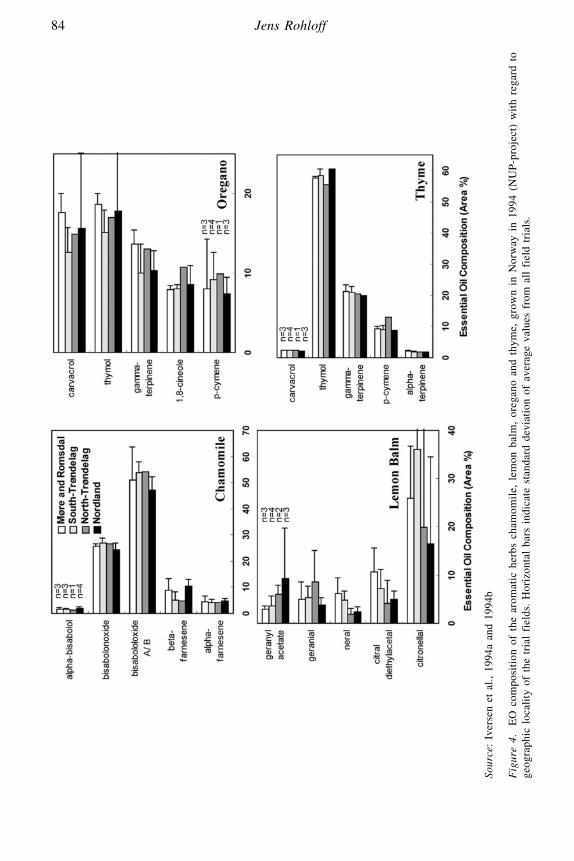
84 Jens Rohloff
Sour
ce:
Iver
sen
et a
l., 1
994a
and
199
4b
Fig
ure
4.
EO
com
posi
tion
of
the
arom
atic
her
bs c
ham
omil
e, l
emon
bal
m,
oreg
ano
and
thym
e, g
row
n in
Nor
way
in
1994
(N
UP
-pro
ject
) w
ith
rega
rd t
oge
ogra
phic
loc
alit
y of
the
tri
al f
ield
s. H
oriz
onta
l ba
rs i
ndic
ate
stan
dard
dev
iati
on o
f av
erag
e va
lues
fro
m a
ll f
ield
tri
als.

decreased concentration of terpenes could be observed (Table 4: lemon balm andthyme). The effect of differing light conditions was not confirmed by more detailedstudies on two peppermint clones in the trial period 1995–1996 (Rohloff et al.,2000b), in contrast to studies on Mentha species by Voirin and co-workers (1990)and Fahlen and co-authors (1997) reporting altered terpene biosynthesis as aneffect of photoperiod and day length. EO yield seemed to be decreased in thenorthern county, Nordland, compared to the trial fields in central Norway exceptfor data on oregano, which is in accordance with studies on peppermint (Rohloffet al., 2000b), whereas the effect of fertilization was not distinct enough (seeTable 6).
Based on the results from the pre-project, the NUP-project was extended by morefield trials during the period 1995–1996 covering the Norwegian latitudes from 59°Nto 67°N. In addition, the herbs sachalinmint (variety ‘Mentolcsepp’) and yarrowwere introduced in the project. The main task was to study the EO yield and com-position of six aromatic herbs with focus on developmental stage and optimal harvesttime (Table 7).
With the exception of lemon balm, the EO yield was lowest in the vegetativegrowth stage. Peppermint and yarrow showed high oil production in full bloom,whereas observations for the other herbs indicated that early flowering would bethe optimal time for harvest. Table 8 shows the complexity and importance of
Essential Oil Drugs – Terpene Composition of Aromatic Herbs 85
Table 6. EO production of the aromatic herbs chamomile, lemon balm, oregano and thyme, grown inNorway in 1994 (NUP-project) with regard to fertilization and geographic locality of the trial fields.
Plant species Chamomile Lemon Balm Oregano Thyme
Mineral fertilizer (n = 3/4) 0.63 0.14 0.37 2.91Organic culture (n = 4/5) 0.56 0.15 0.49 2.60Møre- and Romsdal (n = 2/3) 0.60 0.18 0.48 2.97South-Trøndelag (n = 3/4) 0.63 0.15 0.36 2.86North-Trøndelag (n = 1/2) 0.60 0.10 0.37 3.20Nordland (n = 3/4) 0.53 0.08 0.50 2.17
Source: Iversen and Steen, 1996 and 1997.
Table 7. EO production (in %) of six aromatic herbs grown in Norway during the period 1995–1996(NUP-project) with regard to ontogenetic effects and harvest time.
Growth stage Vegetative Early bloom Full bloom
Lemon Balm 0.12 0.13 0.08Oregano 0.40 0.55 0.53Peppermint clone ‘Hardanger’ 1.65 1.88 2.40Peppermint clone ‘Tøyen’ 1.60 1.65 1.85Sachalinmint cv. ‘Mentolcsepp’ 2.47 3.09 2.68Thyme 2.95 3.31 3.20Yarrow 0.14 0.13 0.34
Source: Iversen and Steen, 1996 and 1997

ontogenetic effects on selected terpenes and EO quality in general. The mentholcontent of mint species, e.g., increased dramatically from the vegetative stage to fullflowering, i.e. the plants should be harvested in full bloom to obtain EOs with adesirable high menthol and low menthone content. On the other hand, high con-centrations of the undesirable menthofuran in mint flowers compared to leaf oil(Rohloff, 1999), favour an earlier harvesting.
Comparable trends could be found for lemon balm (citronellal), thyme (thymol,carvacrol) and the complex oil of yarrow (β-pinene) (see Rohloff et al., 2000a),while a decreasing effect on phenol concentrations was observed for oregano.Lawrence (2002) reports similar ontogenetic effects with regard to terpene distrib-ution, presenting examples on Tagetes minuta and Coriandrum sativum andsimultaneously pointing out that environmental effects might be more pronouncedin temperate and sub-tropical zones. Again, the summarised results from the NUP-project underscore the importance of knowledge and experience from plant researchstudies, for the elaboration of plant grower guidelines for the cultivation of aromaticplants (Dragland and Galambosi, 1996; Iversen and Rohloff, 1998). On the back-ground of SPME analysis, Chapter 3, Essential Oil Research, and Chapter 4,HS-SPME Applications, continue to outline the influence of physiological andenvironmental factors and the effect of processing on the EO volatile compositionof plants and plant food products.
86 Jens Rohloff
Table 8. Characteristic terpenes of six aromatic herbs grown in Norway during the period 1995–1996(NUP-project) with regard to ontogenetic effects and harvest time.
Species Terpene Vegetative Early bloom Full bloom
Lemon Balm citronellal 19.84 29.43 23.19neral 17.27 17.53 15.86geranial 25.99 24.14 24.29
Oregano γ-terpinene 11.47 10.05 04.27thymol 08.23 06.60 05.07carvacrol 06.43 04.60 01.50
Peppermint cv. ‘Hardanger’ 1,8-cineole 05.24 05.32 05.20menthone 30.60 31.06 19.65menthol 39.34 44.85 55.15
Peppermint cv. ‘Tøyen’ 1,8-cineole 04.30 05.93 05.50menthone 43.28 27.60 19.60menthol 37.03 46.50 54.45
Sachalinmint menthone 14.36 12.04 10.30isomenthone 04.23 04.36 03.95menthol 74.52 78.30 83.58
Thyme γ-terpinene 19.79 19.57 13.94thymol 50.05 57.23 66.60carvacrol 02.14 02.30 07.47
Yarrow β-pinene 05.15 02.20 16.191,8-cineole 05.80 04.23 05.97α-farnesene 08.19 10.12 02.09
Source: Iversen and Steen, 1996 and 1997.

3. ESSENTIAL OIL RESEARCH ✧ SOLID-PHASEMICROEXTRACTION
3.1. Devices and procedures
Solid-phase microextraction (SPME) is a relatively new extraction technique forthe isolation and analysis of chemical compounds of different origins and structures.Since its introduction by Belardi and Pawliszyn (1989) and further developmentsin the early 1990s (Arthur et al., 1992a and 1992b; Louch et al., 1992; Buchholzand Pawliszyn, 1993; Zhang and Pawliszyn, 1993), this technique has undergonea process of innovation due to new approaches and devices. The following sectiongives a brief overview about accessories and developments before stressing thequestion about SPME applications in modern food analysis and focussing on thedetermination and quality control of aromatic herbs and medicinal plants. To geta better idea of the techniques and applications mentioned, essential terms andexpressions are underlined.
SPME is a solvent-free and non-destructive sample preparation technique, wherethe analytes are extracted from a solvent, fluid or solid partitioned in a sample/air/extraction fibre–system (headspace HS) or a sample/extraction fibre–system(direct immersion DI). The SPME procedure is followed by gas or liquid chro-matography or electrophoresis (Supelco, 2001). Due to the multifunctionality ofthe extraction process (HS, DI), most of the reported applications deal with GCanalysis coupled with the most common detection methods (MS, FID, NPD, etc.),and only a few number of applications have been developed for LC, HPLC and otherseparation techniques. If not mentioned otherwise, the following section exclusivelydescribes GC separations. GC-MS detection in total-ion-count (TIC) modus has beenchiefly applied, but mass-selective ion monitoring (SIM) for the detection of struc-ture-characteristic compounds has also been applied (e.g. Wang et al., 1997; Butzkeet al., 1998; Curren and King, 2001; Moeller and Kraemert, 2002). Commonly,SPME injection is followed by chromatographic separation but newer conceptsfor the measurement of total volatile compounds of food by directly linking the injec-tion port to the detector – flame ionisation detector FID (Azodanlou et al., 1999)or nitrogen phosphorus detector NPD and FID (Béné et al., 2001) – have alsobeen investigated.
The analyte extraction is not exhaustive, i.e. small quantities down to ppt-levelscan be detected by fibre absorption or adsorption (Camarasu et al., 1998; Lloyd etal., 1998; Miller and Stuart, 1999; Alpendurada, 2000; Curren and King, 2001;Ho and Hsieh, 2001; Holt, 2001) which allows multiple testing of identical samplesif the initial sample concentration is high enough. The non-destructive characterof SPME allows the monitoring of volatile compounds from living organisms suchas plants (Kreuzwieser et al., 1999; Müller et al., 1999; Vercammen et al., 2000;An et al., 2001; Zini et al., 2001; Flamini et al., 2002), in vitro cultures of plants(Alonzo et al., 2001; Maes et al., 2001), insects (Borg-Karlson and Mozuraitis, 1996;Auger et al., 1998; Jones and Oldham, 1999), microorganisms (Arnold and Senter,1998; Demyttenaere et al., 2000; Demirci et al., 2001; Demyttenaere et al., 2001;Fravel et al., 2002), algae in surface water (Watson et al., 1999) and enzymatic
Essential Oil Drugs – Terpene Composition of Aromatic Herbs 87

processes (Jarvenpaa et al., 1998; Cass et al., 2000; Freire et al., 2001; Viannaand Ebeler, 2001; Mallouchos et al., 2002). The screening of volatile compoundsfrom leaves and flowers of Fragaria by SHS-SPME sampling over a period ofthree days gave reliable results about metabolic changes and induced sesquiter-pene production as an effect of wounding/piercing of leaf and flower stems (Rohloff,2002; unpublished results).
SPME offers also a promising tool for the control of quality and shelf life of freshor processed food products with regard to ripening, aging and storage of fruits(Ibanez et al., 1998; Wan et al., 1999; Beaulieu and Grimm, 2001; Fallik et al., 2001;Holt, 2002; Koprivnjak et al., 2002; Lamikanra et al., 2002), must (Sala et al., 2000),cheese (Lecanu et al., 2002), oxidative reactions in milk (Marsili, 1999a and 1999b)and vegetable oils (Stashenko et al., 2002). The importance of terpene-containinggrassland herbs for the quality of milk aroma has been investigated by Cornu andco-workers (2001). Off-flavour or off-odour effects as mentioned for dairy productsplay also an important role for other food products such as juice (Miller and Stuart,1999; Rousseff and Cadwallader, 2001), seasoned spaghetti (Roberts and Pollien,1997) or pharmaceutical products (Sides et al., 2001).
The sampling itself may be carried out in-laboratory or on-site as discussed byPawliszyn (2001), e.g. Müller, Górecki and Pawliszyn (1999) described a newfield SPME sampler equipped with a two-leaf closure for preservation of the analytes(organic solvents) and Namiesnik and co-workers (2000) described the analysis ofatmospheric, indoor and workplace air. Gas-tight SPME sampling has been inves-tigated, offering greater fibre sensitivity in HS applications (Camarasu et al., 1998).Ruiz and co-workers (2001) reported the development of a promising device thatallows direct SPME sampling from solids without sample preparation through pro-tection of the fibre in the core, in contrast to fibre-contact sampling reported byVerhoeven and co-workers (1997) and Grassi and co-authors (2002). A newermicroextraction technique – in-tube SPME – offers the same advantages as fibreSPME, and is based on the extraction of analytes by using an open tubular fused-silica column and separation on HPLC or LC systems (Kataoka et al., 2000; Lordand Pawliszyn, 2000; Kataoka, 2002). The challenging problem about the extrac-tion of polar compounds from biological matrices can be met by derivatizationtechniques (Matich, 1999; Lord and Pawliszyn, 2000; Mills and Walker, 2000) wherethe derivatization takes place in the sample matrix, on-fibre or in the GC injec-tion port. SPME also allows for combining procedures with other sampling orextraction techniques, e.g. microwave-assisted extraction MAE (MAE-SPME)coupled with GC (Roberts and Pollien, 1997; Wang et al., 1997; Ho and Hsieh, 2001)or HPLC analysis (Falqui-Cao et al., 2001), accelerated solvent extraction ASE(ASE-SPME) (Wennrich et al., 2001), steam distillation (SD-HS-SPME) (Page, 1999)and cryo-trapping of volatiles (Jaillais et al., 1999). The thermal desorption ofanalytes is normally carried out by manual fibre injection into the GC, but severalapplications dealing with automated SPME and injection for routine analyses for thedetection of contaminants and quality control have been reported for both fibre(Arthur et al., 1992a; Penton, 1994; Butzke et al., 1998; Coleman et al., 1998;Coleman and Lawrence, 2000; Pham-Tuan et al., 2001; Zini et al., 2002) and in-tube SPME applications (Kataoka, 2002). Elmore and co-workers (2001) describe
88 Jens Rohloff

the potentials of two-fibre SPME by using two different coatings and simultaneousGC injection.
Apart from the applicability and flexibility of the described analytical approaches,the performance of the SPME procedure depends undoubtedly on strict control ofthe parameters of the chosen method to obtain accurate and repeatable results.
3.2. Extraction parameters
Many factors are responsible for the efficiency of the extraction process whencarrying out HS-SPME coupled with GC analysis: fibre coating and selectivity,sample matrix and size, HS volume, pH, salt concentration and agitation (Matich,1999; Kataoka et al., 2000). Temperature effects and extraction time will be dis-cussed in detail in concerning questions about equilibrium time, concentration andanalyte linearity in Chapter 4.2. The choice of polarity of the fibre type is espe-cially crucial for an optimised SPME procedure with regard to the chemical andphysical properties of the analytes being extracted. Polydimethylsiloxane (PDMS),divinylbenzene (DVB), carboxene (CAR), carbowax (CW) and polyacrylate (PA)are the most common fibre coatings. PDMS was the first commercially accessibletype that was widely applied for non-polar analytes, whereas coatings such asDVB, CW and PA are recommended for polar compounds and general use asshown for PA (e.g. Chin et al., 1996; Vercammen et al., 2000). CAR coating showsgood applicability for the extraction of gaseous and highly volatiles and trace com-pounds. About 30 different fibre types and combinations of coatings are accessiblein order to cover a broad range of analyte polarities. Many authors point out thatcombined fibre coatings offer greater advantages for the extraction of volatilesfrom complex matrices (Miller and Stuart, 1999; Hill and Smith, 2000; Jelen etal., 2000; Curren and King, 2001; Elmore et al., 2001) and mention the better storagecapacity of combined coatings (Müller et al., 1999). Bicchi and co-workers (2000b)investigated the influence of fibre coating in HS-SPME-GC analyses of aromaticand medicinal plants and emphasized the use of combined coatings of non-polar(polar components. Disadvantages of the fibre coatings used might be artefactformation (Verhoeven et al., 1997; Baltussen et al., 2002) and characteristic back-ground signals (bleeding) of cyclic siloxanes from PDMS, PA degradation productsand phtalates as investigated by Vercammen and co-workers (2000) and phtalatesand benzene derivates from PDMS/DVB and siloxanes from pure PDMS fibres asobserved by the present author (unpublished results). In addition, the individual fibrecharacteristics and extraction performance may differ from batch to batch, whichmakes fibre optimisation and method testing inevitable for continuous sampling.
SPME fibres differ not only in the polarity of the stationary phase, but also inthe thickness of the fibre. Pure PDMS coatings e.g., can be obtained with 100, 30or 7 µm film thickness, thus influencing the amount of extracted analytes. Otherfactors such as extraction time, temperature conditions and sample concentrationplay an important role as well. Questions related to DI vs. HS sampling have alreadybeen emphasised by Yang and Peppard (1994), underscoring the suitability of HS-SPME for more volatile compounds. On the other hand, DI-SPME is morerecommendable for the sampling of less-volatile compounds, but non-volatile com-
Essential Oil Drugs – Terpene Composition of Aromatic Herbs 89
pounds remaining on the fibre, thus affecting reproducibility, fibre lifetime and detec-tion background, may be disadvantageous (Kataoka et al., 2000; Lord and Paliszyn,2000). Since the sample matrix in normal cases consists of a mixture of com-pounds with varying polarity, boiling point and molecular weight, the percentagecontribution of analytes on-fibre might reflect quite differing component distribu-tions depending on extraction time under the given sampling condition. Varyinganalyte affinity towards solid sorbents (Lord and Pawliszyn, 2000) or non-polarcoatings (Rohloff, 2002a) can result in displacement effects such as a factor oftime. Sample weight might also affect the competition of compounds towards thefibre, especially when the sample volume is very small (with a relatively higherheadspace volume and vice versa), i.e. the headspace concentration of analytes issignificantly decreased by SPME (Kovacevic and Kac, 2001). Therefore, calibra-tion methods are indispensable when it comes to quantification. The use of externalor internal standards, isotopic labelling or standard-addition through re-analysishas been discussed by Lord and Pawliszyn (2000). Freire and co-authors (2001)point out the greater advantages of the internal standard method compared to standardaddition, which was applied by Shang and co-workers (2002) and minimized errorswith regard to the extraction and injection process. External calibration has also beenapplied (Buszewski and Ligor, 2001), although this option might only be useful whenstudying simple matrices with low variability.
SPME shows high sensitivity towards volatile organic compounds compared withclassical headspace techniques such as SHS, DHS, purge-and-trap, direct thermaldesorption (DTD) and gas-tight sampling. Many authors point out the strength ofSPME for qualitative analyses (Coleman and Lawrence, 1997) and its applica-bility for the extraction of less volatile and/or polar compounds (Matich et al.,1996; Miller and Stuart, 1999; Bicchi et al., 2000b; Vercammen et al., 2000),although SPME might discriminate highly volatile and/or trace compounds (Arnaultet al., 2000; Vercammen et al., 2000). Besides a rise in temperature for the induc-tion of increased diffusion coefficients and head space concentrations of analytesand decreased equilibrium time (Lord and Pawliszyn, 2000), one might changethe ionic strength of liquid samples, with e.g. sodium chloride (NaCl) to increasethe sensitivity of SPME (Harmon, 1997). The salting-out effect can improve therecovery of the aroma impact compound furaneol (2,5-dimethyl-4-hydroxy-3(2H)-furanone) from strawberries which is difficult to extract by common HS-SPME(Ulrich et al., 1995), when using 25% NACl (w/v) in strawberry juice samples(Rohloff et al., 2002b). In general, liquid samples should be agitated by contin-uous stirring throughout the equilibrium and extraction period to reduce equilibrationtime (Matich, 1999) and to improve accuracy and method standardization in routinelaboratory work (Holt, 2001). When comparing HS-SPME of Fragaria samples fromcut strawberries or juice, one might prefer liquid instead of solid phases becauseof the possibility that magnetic stirring will result in shorter analysis time andbetter reproducibility (Rohloff, 2001; unpublished results). The volatility of analytescan also be positively affected by adjustment of the pH of liquid samples dependingon whether one whishes to extract acidic (pH ↑) or basic analytes (pH ↓) (Kataokaet al., 2000). In fact, in the case of HS-SPME analysis of solid samples such as dried
90 Jens Rohloff

or processed plant products, the choice of optimal fibre type, equilibrium and extrac-tion temperature and time plays a crucial role.
3.3. SPME detection of EO volatiles in plants and food products
SPME can be utilized for various applications and approaches in food analysis,and quality control is one of the key words. Although this technique allows forthe analysis of less volatile or thermal labile compounds coupled with liquid chro-matography (LC), most all the methods have been developed based on theDI- and HS-SPME of food volatile compounds and contaminants coupled withgas chromatography (GC). Applications of solid-phase microextraction withinenvironmental and biomedical/pharmaceutical research have been reported andreviewed elsewhere and will not be discussed here (environmental: Chai andPawliszyn, 1995; Nilsson et al., 1995; Sedlakova et al., 1998; Page, 1999; Pageand Lacroix, 2000; Alpendurada, 2000; Moeder et al., 2000; Beltran et al., 2000;Buszewski and Ligor, 2002; biomedical: Lord and Pawliszyn, 2000; Mills andWalker, 2000; Snow, 2000; Theodoridis et al., 2000; Ulrich, 2000; Pawliszyn, 2001).The following table summarizes the different kinds of applications for plant and foodanalysis (Table 9), which have been exhaustively discussed and reviewed (Harmon,1997; Braggins et al., 1999; Matich, 1999; Pawliszyn, 1999; Kataoka et al., 2000;Sides et al., 2000; Rouseff and Cadwallader, 2001; Supelco, 2001).
Since the main constituents of EOs – monoterpenes, sesquiterpenes and phenyl-propenes – partly show high volatility, it is not surprising that a number of (almost50) plant species or species groups have been investigated by SPME-GC tech-niques (Table 10).
HS-SPME is not only a proven tool for EO volatile screening and quality assess-ment of food products, but has also the advantage of being a technique for themonitoring of biological processes such as biosynthesis of secondary metabolites,ontogenesis and ripening and post harvest changes on the other hand, which arerelated to storage and processing of plant products (Table 10). Biosynthetic studiesdealing with the enantiomeric distribution of certain monoterpene hydrocarbons haveespecially attracted attention in the past 5 years. Since chiral compounds in EOsoccur with characteristic enantiomeric patterns due to the enzymatically controlledbiosynthesis (Lawrence, 2002) and due to the fact that their flavour properties aredirectly linked to their optical activity, SPME might be applied for the control ofaroma impact volatiles in food (Ebeler et al., 2001), thus, facilitating EO volatileanalysis with regard to plant source determination (Wust and Mosandl, 1999;Coleman and Lawrence, 2000) and the adulteration of EOs. The work of Fuchsand co-authors has focussed on monoterpene biogenesis from the p-menthane groupin different plant sources (Fuchs et al., 1999a and 1999b; Fuchs et al., 2000; Fuchset al., 2001a, 2001b and 2001c), but also monoterpene-ethers such as rose oxide(Wust et al., 1996) and microbial transformations have been studied (Demirci etal., 2001). The occurrence of EO volatiles in plants is not exclusively linked toaromatic herbs. Monoterpenes such as α- and β-pinene, β-myrcene, limonene, α-and β-phellandrene and sesquiterpenes, such as α- and β-caryophyllene, just to
Essential Oil Drugs – Terpene Composition of Aromatic Herbs 91

mention a few, are widely distributed throughout the plant kingdom and especiallyin conifers.
Many berry and fruit-bearing species are known for their relatively high contentsof important monoterpene alcohols: linalool, citronellol, nerol, geraniol and nerolidol.These compounds along with other monoterpenes and hydrocarbon esters mightbe used as markers for wine flavour analysis (Penton, 1995; Muranyi and Kovacs,2000; Buszewski and Ligor, 2001; Freire et al., 2001; Rocha et al., 2001; Schneider
92 Jens Rohloff
Table 9. SPME applications for the detection and analysis of flavour and aroma volatiles from plants,plant products and food in general.
SPME application Important analytes
Vegetables and fruits
apple, strawberry, tomato, kiwi, melon, etc. – hydrocarbons, alcohols, acids, esters, ketones,aldehydes, terpenes and pesticides
onion, truffle, vegetables in general – hydrocarbons, alcohols, acids, esters, S-containing volatiles and pesticides
herbs, spices, medicinal plants – terpenes, phenylpropenes, phenols,hydrocarbons and esters
tobacco – aldehydes, terpenes and phenolsvegetable oils – fatty acids, alcohols, aldehydes, ketones and
VOC contaminantshoney – hydrocarbons, alcohols, acids, ketones,
aldehydes, terpenes and pesticides
Juices and Soft drinks
orange, tomato, strawberry etc. – alcohols, acids, esters, ketones, aldehydes andterpenes
must – pyrazines and S-containing volatilescoffee – pyrazines and pyridines
Alcoholic beverages
wine – alcohols, acids, esters, terpenes, S-containingvolatiles (isothiocyanates, thiazoles), phenolsand pesticides
vodka, sake, whiskey, etc. – esters, alcohols and fatty acidsbeer – alcohols, esters, S-containing volatiles and
terpenes
Dairy products
cheese – fatty acids and lactonesmilk – fatty acids and aldehydeswhey protein – fatty acids and diacetyl
Living plants
flowers – alcohols, esters, aldehydes, terpenes andS-containing volatiles
leaves – alcohols, esters, acids, aldehydes, terpenesand phenylpropenes
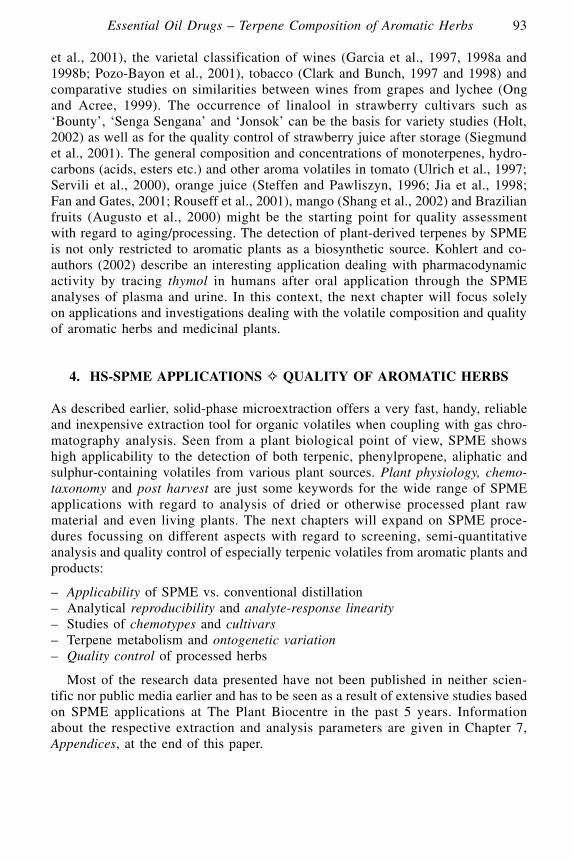
et al., 2001), the varietal classification of wines (Garcia et al., 1997, 1998a and1998b; Pozo-Bayon et al., 2001), tobacco (Clark and Bunch, 1997 and 1998) andcomparative studies on similarities between wines from grapes and lychee (Ongand Acree, 1999). The occurrence of linalool in strawberry cultivars such as‘Bounty’, ‘Senga Sengana’ and ‘Jonsok’ can be the basis for variety studies (Holt,2002) as well as for the quality control of strawberry juice after storage (Siegmundet al., 2001). The general composition and concentrations of monoterpenes, hydro-carbons (acids, esters etc.) and other aroma volatiles in tomato (Ulrich et al., 1997;Servili et al., 2000), orange juice (Steffen and Pawliszyn, 1996; Jia et al., 1998;Fan and Gates, 2001; Rouseff et al., 2001), mango (Shang et al., 2002) and Brazilianfruits (Augusto et al., 2000) might be the starting point for quality assessmentwith regard to aging/processing. The detection of plant-derived terpenes by SPMEis not only restricted to aromatic plants as a biosynthetic source. Kohlert and co-authors (2002) describe an interesting application dealing with pharmacodynamicactivity by tracing thymol in humans after oral application through the SPMEanalyses of plasma and urine. In this context, the next chapter will focus solelyon applications and investigations dealing with the volatile composition and qualityof aromatic herbs and medicinal plants.
4. HS-SPME APPLICATIONS ✧ QUALITY OF AROMATIC HERBS
As described earlier, solid-phase microextraction offers a very fast, handy, reliableand inexpensive extraction tool for organic volatiles when coupling with gas chro-matography analysis. Seen from a plant biological point of view, SPME showshigh applicability to the detection of both terpenic, phenylpropene, aliphatic andsulphur-containing volatiles from various plant sources. Plant physiology, chemo-taxonomy and post harvest are just some keywords for the wide range of SPMEapplications with regard to analysis of dried or otherwise processed plant rawmaterial and even living plants. The next chapters will expand on SPME proce-dures focussing on different aspects with regard to screening, semi-quantitativeanalysis and quality control of especially terpenic volatiles from aromatic plants andproducts:
– Applicability of SPME vs. conventional distillation– Analytical reproducibility and analyte-response linearity– Studies of chemotypes and cultivars– Terpene metabolism and ontogenetic variation– Quality control of processed herbs
Most of the research data presented have not been published in neither scien-tific nor public media earlier and has to be seen as a result of extensive studies basedon SPME applications at The Plant Biocentre in the past 5 years. Informationabout the respective extraction and analysis parameters are given in Chapter 7,Appendices, at the end of this paper.
Essential Oil Drugs – Terpene Composition of Aromatic Herbs 93

94 Jens Rohloff
Table 10. SPME applications for different plant sample matrices for the study of EO volatiles withregard to biosynthesis, chemotaxonomy and quality control.
Plant species Matrix Application Reference
anise drops quality control Czerwinski et al., 1996arnica root, leaf, terpene screening Rohloff,1999* [Figures 10,
flower ontogenetic variation Table 15 ]bay tree leaf terpene screening Diaz-Maroto et al., 2002bblack pepper fruit terpene screening Harmon, 1997brown boronia flower volatile monitoring MacTavish et al., 2000buchu stem terpene biosynthesis Fuchs et al., 2001c
enantiomeric analysiscedar EO terpene screening Coleman and Lawrence,
quality control 1997Coleman et al., 1998Coleman and Lawrence, 2000
chamomile flower terpene screening Rohloff, 1998* [Table 11]cinnamon sp. bark species identification Miller et al., 1996bark terpene screening Yang and Peppard, 1995costmary EO terpene screening Gallori et al., 2001
essences quality controlcurry powder terpene screening Harmon, 1997dill herb terpene screening Rohloff, 1998* [Table 11,
Figures 5 and 6] and herb variety fingerprinting Rohloff, 1998* [Figures 9]
echinacea sp. herbal terpene screening Rohloff, 1999* [Table 18]remedy quality control
eucalyptus sp. leaf leaf volatile Zini et al., 2001monitoring
leaf terpene screening Zini et al., 2002leaf leaf volatile monitoring Wirthensohn et al., 2000
fennel seed variety fingerprinting Krüger and Zeiger, 1996Fraser fir leaf terpene screening Vereen et al., 2000geranium sp. herb terpene biosynthesis Wust et al., 1996
enantiomeric analysisherb terpene biosynthesis Fuchs et al., 2001b
enantiomeric analysisginger EO terpene screening Supelco, 1998gourd sp. flower terpene screening Fernando and Grun, 2001grassland herb plant society volatiles Cornu et al., 2001guava fruit flavour screening Paniandy et al., 2000hops cones variety fingerprinting Field et al., 1996;
Kac and Kovacevic, 2000Kovacevic and Kac, 2001Rohloff, 2001* [Table 12]
cones terpene screening Kenny, 2000jasmine sp. plant terpene screening Vercammen et al., 2000
in-vivo studylavender flower terpene screening An et al., 2001
in-vivo studylemon EO terpene screening Supelco, 1998moss leaf terpene screening Saglam et al., 2001oregano herb terpene screening Diaz-Maroto et al., 2002bosage orange fruit terpene screening Peterson et al., 2002

Essential Oil Drugs – Terpene Composition of Aromatic Herbs 95
Table 10. Continued.
Plant species Matrix Application Reference
peppermint leaf terpene screening Rohloff, 1999 [Table 13]flower ontogenetic variationleaf, flower terpene screening Rohloff, 1998* [Table 11]
peppermint herb detection menthol Ligor and Buszewski, 1999leaf terpene biosynthesis Fuchs et al., 1999a,
enantiomeric analysis 1999b, 2000, 2001amint EO EO quality control Coleman et al., 2002
EO terpene screening Coleman and Lawrence, 2000enantiomeric analysis
mint EO in food candies, menthol – menthone Ligor and Buszewski, products drops, etc. quality control 1999
drops quality control Czerwinski et al., 1996menthol quality control Coleman and Lawson, 1998chocolate quality control Supelco, 1998chew.gum quality control Supelco, 1998
phlox sp. bud ontogenetic variation Irwin and Dorsett, 2002flower volatile monitoring
pine sp. leaf terpene screening Schäfer et al., 1995species identification
wood, terpene volatile Flechtmann et al., 1999bark monitoring
rosemary herb terpene screening Bicchi et al., 2000a+bEO terpene screening Coleman and Lawrence,
enantiomeric analysis 2000rose root rhizome terpene screening Rohloff, 2002b
root Rohloff et al., 2002csachalinmint leaf and ontogenetic variation Rohloff et al., 2002a
flower [Figure 7, Table 14]leaf method development Rohloff, 2000* [Figure 8]
sage herb terpene screening Bicchi et al., 2000a+bleaf wounding physiology Zabaras and Wyllie, 2001
spearmint EO quality control Supelco, 1998EO terpene screening Coleman and Lawrence,
enantiomeric analysis 2000spearmint EO chew.gum quality control Supelco, 1998in food productsspruce bark terpene screening Pettersson, 2001
damage physiologystrawberry leaf volatile monitoring Rohloff, 2002*
flower in-vivo studysweet basil leaf terpene screening Rohloff, 1998* [Table 11]
quality controlleaf leaf terpene screening Rohloff, 1997* [Table 16]
terpene screening Diaz-Maroto et al., 2002bthyme terpene screening Bicchi et al., 2000a+btobacco leaf variety fingerprinting Clark and Bunch, 1998valerian root terpene screening Bicchi et al., 2000a+bviola sp. flower terpene screening Flamini et al., 2002
in-vivo studyyarrow leaf ontogenetic variation Rohloff et al., 2000a
flower
* Unpublished results.

4.1. SPME vs. distillation: Peppermint, Chamomile, Basil and Dill
HS-SPME requires a minimum of laboratory equipment, in most cases no chemi-cals, and thus may compete with common EO isolation techniques such ashydrodistillation and steam distillation. As part of the biochemical studies at ThePlant Biocentre, both techniques have been simultaneously used in EO volatileanalyses in order to develop appropriate methods for different purposes. Additionally,HS-SPME has been introduced as a tool for routine laboratory analyses for straw-berry flavour screening (Holt, 2001 and 2002; Rohloff et al., 2002a and 2002b).Although disadvantages such as analyte-selectivity, analyte-discrimination andsample-dependant reproducibility are factors that limit the applicability, SPMEmay be applied successfully to the screening and semi-quantitative analysis ofterpenic volatiles as an alternative technique to distillation. As part of the nationalproject ‘Norwegian Herb Production (NUP)’ during the period from 1994–1998, pre-liminary tests have been carried out on selected essential oil drugs that offermarketing opportunities. Traditional herbs such as Mentha × piperita L., clones‘Hardanger’ and ‘Tøyen’), Matricaria recutita L., Ocimum basilicum L. and Anethumgraveolens L. were analysed by HD sampling and HS-SPME.
Both techniques have been simultaneously applied in order to cover a broaderrange of analytical tools for terpene screening and identification of trace compoundsin aromatic herbs (Rohloff, 1999; Rohloff et al., 2000a; Rohloff, 2002a; Rohloffet al., 2002c). Eighty-six compounds were identified in rose root (Rhodiola roseaL.) based on EO analysis and HS-SPME (Rohloff, 2002b). Coleman and Lawrence(1997) carried out analyses of cedar wood EO comparing distillation, SHS-SPME,DHS on Tenax and SHS-gas-tight sampling. The characteristic main compoundsα- and β-cedrene and thujopsene were detected by all methods with the exceptionof SHS sampling. The compound ratios were good reflected by both DHS and SPME,while the SPME method showed high affinity to α-pinene (32.4%) compared tothe EO samples (0.8%). On the other hand, the RSD values from SPME samplingwere relatively low (5.6%) in contrast to DHS (10.5%) and EO (3.1%). Schäferand co-workers (1995) studied needles of four Pinus species by applying both HS-SPME and SDE and reported a good estimation of monoterpene concentrations,but simultaneously pointed out the disadvantage of SPME when analysing multi-component mixtures with a wide range of boiling points and thus, distributionconstants. Field and co-workers (1996) showed that HS-SPME might provide asgood humulene/caryophyllene ratios in hops (Humulus lupulus L.) as those obtainedby conventional SD and pentane extraction. Additionally, Kovacevic and Kac (2001)compared SD and HS-SPME methods for the determination and characterizationof hop varieties by detecting the myrcene/humulene ratios (see also Section 4.3,Identification of Chemotypes and Cultivars: Dill and Hops). Paniandy and co-workers (2000) observed that more compounds could be identified in oil samplesof guava fruits (Psidium guajava L.) compared to HS-SPME which is in accor-dance with the authors reports on rose root (Rohloff, 2002b). On the other hand,SPME revealed the occurrence of aldehydes, terpenes and phenylpropenes in guavathat were not covered by SD analysis. It has to be mentioned that SPME offers analternative method for determining EO volatiles when only very small sample
96 Jens Rohloff
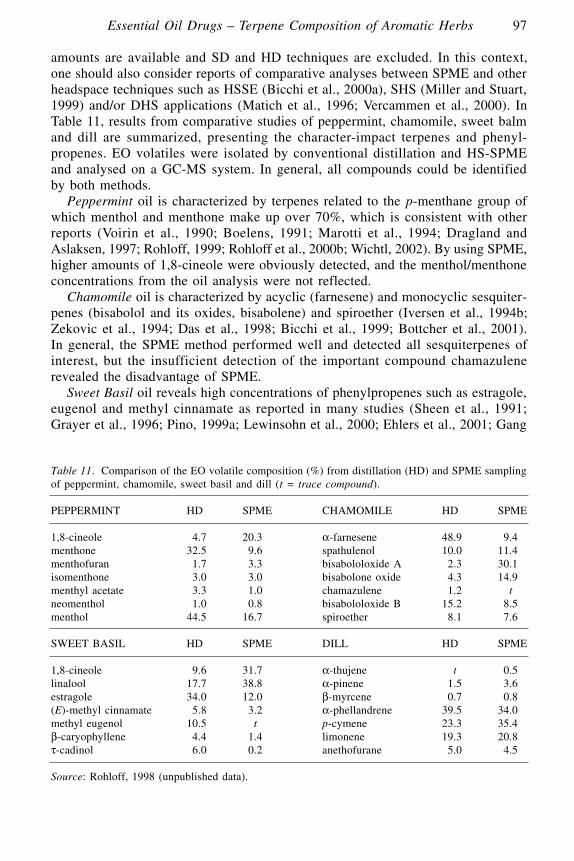
amounts are available and SD and HD techniques are excluded. In this context,one should also consider reports of comparative analyses between SPME and otherheadspace techniques such as HSSE (Bicchi et al., 2000a), SHS (Miller and Stuart,1999) and/or DHS applications (Matich et al., 1996; Vercammen et al., 2000). InTable 11, results from comparative studies of peppermint, chamomile, sweet balmand dill are summarized, presenting the character-impact terpenes and phenyl-propenes. EO volatiles were isolated by conventional distillation and HS-SPMEand analysed on a GC-MS system. In general, all compounds could be identifiedby both methods.
Peppermint oil is characterized by terpenes related to the p-menthane group ofwhich menthol and menthone make up over 70%, which is consistent with otherreports (Voirin et al., 1990; Boelens, 1991; Marotti et al., 1994; Dragland andAslaksen, 1997; Rohloff, 1999; Rohloff et al., 2000b; Wichtl, 2002). By using SPME,higher amounts of 1,8-cineole were obviously detected, and the menthol/menthoneconcentrations from the oil analysis were not reflected.
Chamomile oil is characterized by acyclic (farnesene) and monocyclic sesquiter-penes (bisabolol and its oxides, bisabolene) and spiroether (Iversen et al., 1994b;Zekovic et al., 1994; Das et al., 1998; Bicchi et al., 1999; Bottcher et al., 2001).In general, the SPME method performed well and detected all sesquiterpenes ofinterest, but the insufficient detection of the important compound chamazulenerevealed the disadvantage of SPME.
Sweet Basil oil reveals high concentrations of phenylpropenes such as estragole,eugenol and methyl cinnamate as reported in many studies (Sheen et al., 1991;Grayer et al., 1996; Pino, 1999a; Lewinsohn et al., 2000; Ehlers et al., 2001; Gang
Essential Oil Drugs – Terpene Composition of Aromatic Herbs 97
Table 11. Comparison of the EO volatile composition (%) from distillation (HD) and SPME samplingof peppermint, chamomile, sweet basil and dill (t = trace compound).
PEPPERMINT HD SPME CHAMOMILE HD SPME
1,8-cineole 04.7 20.3 α-farnesene 48.9 09.4menthone 32.5 09.6 spathulenol 10.0 11.4menthofuran 01.7 03.3 bisabololoxide A 02.3 30.1isomenthone 03.0 03.0 bisabolone oxide 04.3 14.9menthyl acetate 03.3 01.0 chamazulene 01.2 00tneomenthol 01.0 00.8 bisabololoxide B 15.2 08.5menthol 44.5 16.7 spiroether 08.1 07.6
SWEET BASIL HD SPME DILL HD SPME
1,8-cineole 09.6 31.7 α-thujene 00t 00.5linalool 17.7 38.8 α-pinene 01.5 03.6estragole 34.0 12.0 β-myrcene 00.7 00.8(E)-methyl cinnamate 05.8 03.2 α-phellandrene 39.5 34.0methyl eugenol 10.5 00t p-cymene 23.3 35.4β-caryophyllene 04.4 01.4 limonene 19.3 20.8τ-cadinol 06.0 00.2 anethofurane 05.0 04.5
Source: Rohloff, 1998 (unpublished data).

et al., 2001; De La Pena et al., 2002; Diaz-Maroto et al., 2002a and 2002b).Incomplete and insufficient recovery of important EO volatiles were also observedhere, in this case the chemical class of phenylpropene structures, of which methyleugenol was only detected in trace amounts.
Dill herb oil is often used in food flavouring being described by many researchgroups (Halva, 1987; Halva et al., 1988; Boelens, 1991; Strunz et al., 1992; Pinoet al., 1995; Pino, 1999b; Wust and Mosandl, 1999; Bailer et al., 2001). In the presentstudy, the applied method reflected the ‘real’ oil composition from HD sampling andunderscored the applicability and usefulness of information one can gain whenapplying HS-SPME.
It has to be noted that the presented results were obtained by applying the samemethod for all samples without finding suitable extraction parameters that couldmatch the results from oil analyses. This study underscores the problems one mighthave to deal with when using HS-SPME for the analysis of complex EO matriceswith regard to varying boiling points, partition coefficients and affinity to the chosenfibre type.
4.2. Extraction time and concentration: Dill and Sachalinmint
Apart from the choice of fibre type, the use of suitable extraction conditions withregard to equilibrium time and temperature is crucial for successful HS-SPME appli-cations. Many reports describe an equilibration procedure before the properextraction by HS-SPME. Complete equilibration is attained when the partitioningof volatiles between the sample matrix and the headspace atmosphere stabilizes.When exposing the SPME fibre to the headspace, the analytes will then partitionbetween the matrix, headspace and fibre coating and a new equilibrium must settle.Since only negligible amounts of analytes are on-fibre after exposure and the dis-tribution of analytes in the sample matrix is almost unchanged (presuming the sampleweight or volume is sufficient), the chemist might decide to drop sample equili-bration and to begin directly with the extraction. In this case, one might meet theproblem of discriminating effects, i.e. highly volatile compounds would partitioneasier into the gaseous phase and into the fibre. When using liquid absorption phasessuch as PDMS, one can wait until the equilibrium has been reached, whereas theuse of solid coatings with high polarity and crystalline structure, e.g. CAR, mightdiscriminate semivolatiles since adsorption sites on the fibre are already occupied.In one way, equilibrating before extraction is the best choice when dealing withHS-SPME.
DHS- and SHS-SPME applications using unequilibrated conditions (the socalledbreakthrough-mode) have been widely reported and are useful for volatile screeningpurposes and qualitative analyses (e.g. Rohloff, 1999; Coleman and Lawrence, 2000;Coleman and Lawrence, 2002; Rohloff, 2002a; Zini et al., 2002). A temperatureincrease will lower equilibrium time, but on-fibre analyte concentrations will bedecreased as a temperature effect (Nilsson et al., 1995; Jia et al., 1998). One couldapply extremely short extraction times of only a few seconds or minutes (Colemanand Lawrence, 1997; Rohloff, 2002a) to obtain sufficient sensitivity. Lord andPawliszyn (2000) point out that SPME in the breakthrough-mode is controlled by
98 Jens Rohloff

diffusion in contrast to partition-based extraction under equilibrated conditions.The accumulation of late eluting compounds is favoured by the latter as can seenin Figures 5 and 6 (anethofuran).
For monoterpenes, an extraction time of about 10 min is often suitable, becauseanalyte partitioning starts to stabilize, and in most cases, extraction times of 30min are enough to reach equilibrium conditions. Ligor and Buszewski (1999)obtained the stabilization of menthol concentrations after 20–25 min.
Essential Oil Drugs – Terpene Composition of Aromatic Herbs 99
A: � α-phellandrene, � limonene, × p-cymene. B: + α-thujene, � α-pinene, � β-myrcene, � anethofuran.
Figure 5. Effect of varying SPME exposure times on the fibre extraction efficiency with regard tocharacteristic terpenes from dill herb (Anethum graveolens L.).

100 Jens Rohloff
Source: Rohloff, 1997 (unpublished data)
Figure 6. Effect of varying SPME exposure times (1, 1.5, 5, 10 and 15 min) on GC-MS detection(area %) of anethofuran from dill herb (Anethum graveolens L.).

However, exceptions such as the continually increasing area response of thesesquiterpenes α- and β-caryophyllene from hops on a GC-FID system after 5 hexposure have been reported (Fields et al., 1996). Figures 5 and 6 illustrate the effectof different exposure times varying from 1 min up to 15 min, when analysing dillherb samples on a GC-MS system. The amounts of the character-impact compoundanethofuran were still increasing after 15 min, whereas monoterpenes such as β-myrcene and p-cymene decreased. The ability to detect higher-boiling EO volatilesby increased fibre exposure times is clearly demonstrated in Figure 6.
Similar effects could also be observed when using SPME extraction times under1 min (Figure 7). Sachalinmint EO is characterized by low complexity, with mentholas the dominating compound – up to or over 80% – of the oil. The increase offibre exposure time from 10 sec to 5 min resulted in still increasing amounts ofmenthol, while the fibre absorpstion of neomenthol and limonene continuouslydecreased. Of course, unequilibrated conditions will not reflect the real distribu-tion of monoterpenes, as shown by the example of sachalinmint. One has to makea decision, whether it is suitable to operate with equilibrium phases or to operatein the breakthrough-mode, i.e. method development is inevitable when carryingout analyses of samples of unknown composition.
Despite differing extraction time profiles, the HS-SPME procedure shows strictlinearity over a wide concentration range concerning different chemical structures(Alpendurada, 2000) such as hydrocarbons, aldehydes, ketones, esters and alcohols(Jelen et al., 2000; Holt, 2001 and 2002), benzothiazoles (Bellavia et al., 2000),isothiocynates (Gandini and Riguzzi, 1997; Liu, 2000; Figure 8) and terpenes
Essential Oil Drugs – Terpene Composition of Aromatic Herbs 101
Source: Rohloff, 2002a (reprinted with permission from J. Agric. Food Chem. 50: 1543–1547,© 2002 American Chemical Society ACS)
Figure 7. Headspace SPME sampling of sachalinmint samples (n = 5) under unequilibrated condi-tions using extraction times between 10 s and 5 min.

(Figure 8). Viewed from the background of partitioning effects, quantitative analysesof plant samples using HS-SPME seem to be rather complicated in contrast toenvironmental (Lloyd et al., 1998; Curren and King, 2001) or biomedical applica-tions (Lord and Pawliszyn, 2000; Snow, 2000) when only one or a few analytes haveto be traced. Consequently, equilibrium conditions should be preferred when quan-tifying complex sample matrices, and one has to take into account that the standarddoes not interfere with the sample when using the internal standard or standard-addition method.
4.3. Identification of chemotypes and cultivars: Dill and Hops
As already pointed out, SPME offers an excellent tool for fast and reliable quali-tative analyses and shows high applicability for the screening of terpene volatilesfrom different sources with the aim of identifying chemotypes and cultivars.Applications for herbs and medicinal plants (Field et al., 1996; Krüger and Zeiger,1996; Kovacevic and Kac, 2001; Rohloff et al., 2002c), flower aroma volatiles(Guidotti and Vitali, 1998; Verzera et al., 2000), fruits and berries (Ulrich et al.,1997; Beaulieu and Grimm, 2001; Holt, 2002), wine (Garcia et al., 1998a and 1998b;Vas et al., 1998; Pozo-Bayon et al., 2001), coffee (Freitas et al., 2001) and tobacco(Clark and Bunch, 1998) have been described. In Figure 9 the example of GC-MS profiles of dill herb from two different cultivars, ‘Superdukat’ and ‘Aros’ isgiven. Monoterpenes such as α-pinene, β-myrcene, α-phellandrene, p-cymene andlimonene occurred in both samples, whereas the characteristic aroma compoundanethofuran (or dill ether) was only detected for ‘Superdukat’. In fact, the lack ortraces of anethofuran might be disadvantageous for flavouring properties, and thecultivars showed quite different amounts of important monoterpenes.
The analysis of hops was already mentioned in another context, since HS-SPMEapplications have been described for this species (Field et al., 1996; Kenny, 2000;Kovacevic and Kac, 2001). The commercial value of hops for the brewing of beer
102 Jens Rohloff
Source: Rohloff, 2000 (unpublished data) Source: Rohloff, 2001 (unpublished data)
Figure 8. Linearity of area response (%) vs. concentration for menthol-spiked sachalinmint samples(A) and butyl isothiocyanate standards (B) using HS-SPME.
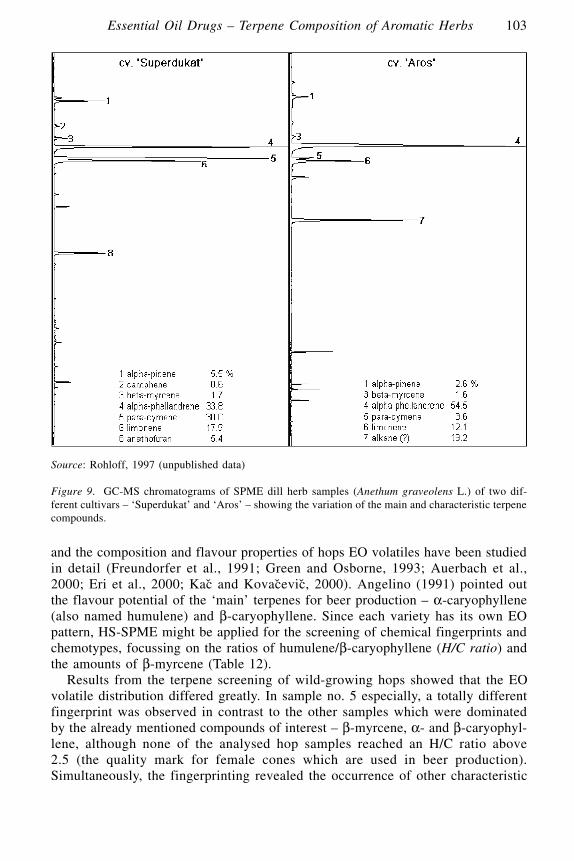
and the composition and flavour properties of hops EO volatiles have been studiedin detail (Freundorfer et al., 1991; Green and Osborne, 1993; Auerbach et al.,2000; Eri et al., 2000; Kac and Kovacevic, 2000). Angelino (1991) pointed outthe flavour potential of the ‘main’ terpenes for beer production – α-caryophyllene(also named humulene) and β-caryophyllene. Since each variety has its own EOpattern, HS-SPME might be applied for the screening of chemical fingerprints andchemotypes, focussing on the ratios of humulene/β-caryophyllene (H/C ratio) andthe amounts of β-myrcene (Table 12).
Results from the terpene screening of wild-growing hops showed that the EOvolatile distribution differed greatly. In sample no. 5 especially, a totally differentfingerprint was observed in contrast to the other samples which were dominatedby the already mentioned compounds of interest – β-myrcene, α- and β-caryophyl-lene, although none of the analysed hop samples reached an H/C ratio above2.5 (the quality mark for female cones which are used in beer production).Simultaneously, the fingerprinting revealed the occurrence of other characteristic
Essential Oil Drugs – Terpene Composition of Aromatic Herbs 103
Source: Rohloff, 1997 (unpublished data)
Figure 9. GC-MS chromatograms of SPME dill herb samples (Anethum graveolens L.) of two dif-ferent cultivars – ‘Superdukat’ and ‘Aros’ – showing the variation of the main and characteristic terpenecompounds.

aroma volatiles, e.g. α-farnesene, which was only detected in samples no. 2 and 8and which, in addition might contribute to the aroma when using hop for flavouring.
4.4. Ontogenetic differentiation: Peppermint, Sachalinmint and Arnica
The distinct effect of ontogenetic development has already been discussed in detailin Chapter 2.4, ‘Norwegian Herb Production (NUP)’ 1994–1998, and will onlybe discussed here with relation to HS-SPME applications. As already describedearlier, this technique can be used to screen the volatile composition of plant sampleswithin short time intervals for the detection of biosynthetic and thus, qualitativechanges (Beaulieu and Grimm, 2001; Maes et al., 2001). Mentha species such aspeppermint and sachalinmint have been exhaustively studied at the Plant Biocentrein order to gain information about the variation of EO quality and compositionwith regard to growth stage and the portion of the different plant organs beingharvested (Rohloff, 1999; Rohloff, 2002a). Lawrence (2002) pointed out thewithin-plant variation of EO volatiles, as shown for Mentha pulegium and Melissaofficinalis, which might be of critical importance when taking plant samples forchemical analyses. This fact is illustrated in Tables 13 and 14, which present resultsfrom HS-SPME sampling of peppermint and sachalinmint when the leaves andflowers were collected from different stem positions. Evidently variations from basalleaves to top leaves and flowers can be observed, e.g. in the amounts of mentholand menthone. It has to be noted that highest concentrations of the undesirablementhofuran were detected in the flowers (Table 13).
104 Jens Rohloff
Table 12. Chemotypic variation (in %) of HS-SPME-detected mono- and sesquiterpenes in hop cones(Humulus lupulus L.) collected from wild-growing plants in Norway.
Compound 01 2 3 4 5 6 7 8
α-phellandrene 00.4 00.3 00.5 00.5 00.5 00.5 00.7 00.6β-myrcene 57.5 23.8 39.0 36.4 36.6 39.8 44.2 49.8limonene 00.1 0– 00.2 0– 0– 0– 0– 0–β-phellandrene 00.7 0– 00.2 0– 0– 0– 0– 0–(E)-ocimene 00.4 00.3 01.0 01.3 01.5 0– 00.6 00.4α-copaene 00.4 00.6 0– 00.6 00.5 00.7 00.5 00.51-octen-3-ol 0– 00.3 0– 00.2 00.5 0– 0– 00.5α-cadinene 00.6 01.0 00.6 00.9 00.8 03.3 00.8 00.6β-caryophyllene 11.7 20.1 12.0 16.5 09.4 12.5 12.1 15.82-undecanone 00.5 00.3 05.6 00.5 04.8 00.3 00.8 0–α-caryophyllene 19.0 34.5 21.1 31.0 02.6 20.0 23.0 24.4γ-selinene 00.4 00.7 00.8 01.0 01.7 00.8 02.9 01.0γ-muurolene 01.0 01.6 01.6 01.6 02.4 01.5 01.5 01.4β-selinene 01.8 02.9 03.1 02.3 06.5 03.4 02.5 0–α-selinene 01.6 03.0 03.1 02.3 06.8 03.2 02.1 0–α-farnesene 0– 00.2 0– 0– 0– 0– 0– 01.6δ-cadinene 01.5 02.8 01.2 02.3 01.8 01.6 02.1 02.0
Identified (%) 97.6 92.4 90.0 97.4 76.4 87.6 93.8 98.6
Source: Rohloff, 2001 (unpublished data; with permission of Steinar Dragland, Planteforsk).

Results from the EO volatile screening from sachalinmint showed similar ten-dencies regarding the distribution of menthol and menthone throughout the plant,whereas only trace amounts of menthofuran could be detected (Table 14).
These results provide not only useful information for the correct sampling ofplants or plant parts for EO analysis, but might be the starting point for further inves-tigation of aromatic herbs with regard to more advanced harvesting techniques toobtain special EO qualities. Another example of varying EO composition is givenin Figure 10 and Table 15, which present results from HS-SPME sampling ofarnica (Arnica montana L.). Arnica is a famous medicinal plant that has been usedfor centuries for antiseptic, antiphlogistic and antirheumatic applications. Terpenesfrom arnica have been analysed by different methods (Güntzel et al., 1967; Rinn,1970; Willuhn, 1972; Stausberg, 1994) and the occurrence of active metaboliteswithin the chemical group of sesquiterpenelactones found in different plant organshas been studied (Leven and Willuhn, 1987; Leven, 1988; Willuhn and Leven, 1991;Stausberg, 1994).
Essential Oil Drugs – Terpene Composition of Aromatic Herbs 105
Table 13. Characteristic terpene volatiles from flowers and leaves of peppermint (clone ‘Hardanger’)detected by HS-SPME (area response %).
Compound Flowers Leaves 1–3 Leaves 4–5 Leaves 6–7 Leaves 8–9
limonene 09.8 08.4 08.9 10.0 10.11,8-cineole 07.1 22.1 22.7 20.4 15.9p-cymene 01.9 02.6 02.9 03.1 02.6(E)-p-menth-2-en-1-ol 00.8 02.3 02.3 03.1 03.2menthone 38.1 32.9 14.4 10.3 06.7menthofuran 12.6 02.6 04.4 03.7 02.7isomenthone 03.4 03.7 02.9 03.0 02.4menthyl acetate 00.3 00.6 00.7 01.0 01.6neomenthol 01.4 01.8 01.9 02.7 03.2β-caryophyllene 00.2 00.7 01.1 01.3 01.1menthol 08.3 10.5 14.0 19.6 22.5pulegone 00.9 0– 00.3 00.2 00.2piperitone 00.2 00.2 00.2 00.2 0–
Source: Rohloff, 1999.
Table 14. Terpene composition (area response %) of sachalinmint leaves (and flowers) with regardto plant height: A – 0–20 cm; B – 20–40 cm; C – 40–60 cm; D – 60–80 cm.
Compound A B C D
menthol 58.90 ± 3.25 48.54 ± 2.44 65.28 ± 2.42 71.46 ± 1.93menthone 12.90 ± 1.06 13.34 ± 1.91 10.98 ± 0.64 06.21 ± 0.43isomenthone 05.32 ± 0.50 06.58 ± 0.21 06.50 ± 0.71 06.83 ± 0.39menthyl acetate 00.68 ± 0.03 00.74 ± 0.03 01.14 ± 0.25 02.15 ± 0.13neomenthol 01.42 ± 0.11 01.55 ± 0.12 01.88 ± 0.12 02.21 ± 0.08piperitone 01.31 ± 0.10 01.43 ± 0.35 01.68 ± 0.04 01.89 ± 0.12
Source: Rohloff, 2002a (reprinted with permission from J. Agric. Food Chem. 50: 1543–1547,© 2002 American Chemical Society ACS).
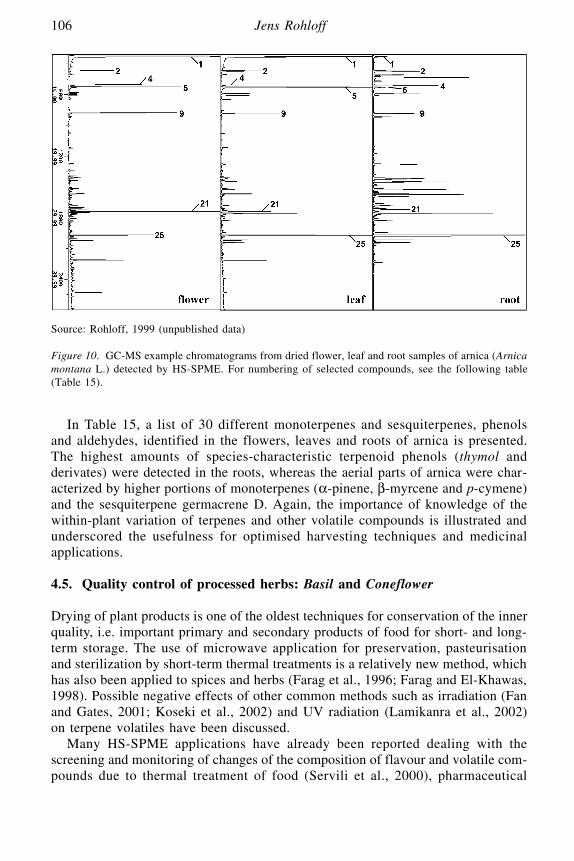
In Table 15, a list of 30 different monoterpenes and sesquiterpenes, phenolsand aldehydes, identified in the flowers, leaves and roots of arnica is presented.The highest amounts of species-characteristic terpenoid phenols (thymol andderivates) were detected in the roots, whereas the aerial parts of arnica were char-acterized by higher portions of monoterpenes (α-pinene, β-myrcene and p-cymene)and the sesquiterpene germacrene D. Again, the importance of knowledge of thewithin-plant variation of terpenes and other volatile compounds is illustrated andunderscored the usefulness for optimised harvesting techniques and medicinalapplications.
4.5. Quality control of processed herbs: Basil and Coneflower
Drying of plant products is one of the oldest techniques for conservation of the innerquality, i.e. important primary and secondary products of food for short- and long-term storage. The use of microwave application for preservation, pasteurisationand sterilization by short-term thermal treatments is a relatively new method, whichhas also been applied to spices and herbs (Farag et al., 1996; Farag and El-Khawas,1998). Possible negative effects of other common methods such as irradiation (Fanand Gates, 2001; Koseki et al., 2002) and UV radiation (Lamikanra et al., 2002)on terpene volatiles have been discussed.
Many HS-SPME applications have already been reported dealing with thescreening and monitoring of changes of the composition of flavour and volatile com-pounds due to thermal treatment of food (Servili et al., 2000), pharmaceutical
106 Jens Rohloff
Source: Rohloff, 1999 (unpublished data)
Figure 10. GC-MS example chromatograms from dried flower, leaf and root samples of arnica (Arnicamontana L.) detected by HS-SPME. For numbering of selected compounds, see the following table(Table 15).

products (Besse et al., 2001; Coran et al., 2001; Karaisz and Snow, 2001) andspices (Roberts and Pollien, 1997). Flavour loss as an effect of microwave treatmenthas been reported by Roberts and Pollien (1997) and the influence of irradiation(Koseki et al., 2002) and microwave (Antonelli et al., 1998; Silva et al., 1999; Yousifet al., 1999; Di Cesare et al., 2001) on EO volatiles of sweet basil (Ocimum basilicumL.) has been observed. In Table 16 an example of the effects of short-term thermaltreatment of pre-dried basil samples on monoterpene, sesquiterpene and phenyl-propene composition is given. The amount of SPME-extracted compounds shiftedfrom monoterpenes volatiles to less volatile sesquiterpenes and phenylpropenes, andthe portion of 1,8-cineole was distinctly decreased. It has to be noted that the detectedamounts of monoterpenes in the control group might be too high (due to short SPMEexposure time of 1 min), and the area response of character-impact compoundswith phenylpropene structure (estragole, methyl cinnamate, methyl eugenol) was notproperly reflected by HS-SPME. However, it was shown that short-term microwaving
Essential Oil Drugs – Terpene Composition of Aromatic Herbs 107
Table 15. Distribution of terpene volatiles and thymol derivates from dried flowers, leaves and rootsof arnica (Arnica montana L.) detected by HS-SPME.
No. Compound Flowers Leaves Roots
01 α-pinene 25.3 29.1 01.002 β-pinene 04.1 04.4 04.403 sabinene 00.5 00.5 02.504 α-phellandrene 06.3 01.3 07.005 β-myrcene 09.5 14.3 00.606 α-terpinene 0– 0– 07.507 limonene 02.0 02.2 03.708 β-phellandrene 01.8 02.2 00.209 p-cymene 08.7 04.2 03.510 terpinolene 0– 0– 00.911 6-methyl-5-hepten-2-one 00.4 00.3 0–12 (E)-2-hexen-1-ol 00.4 00.4 0–13 nonanal 00.7 0– 0–14 acetic acid 00.5 0– 0–15 decanal 01.5 0– 0–16 bornyl acetate 0– 0– 00.417 β-caryophyllene 01.5 02.7 05.518 thymol methyl ether 00.2 0– 01.619 α-caryophyllene 00.4 00.6 00.820 (E)-β-farnesene 0– 00.7 00.421 germacrene D 08.1 05.2 02.022 dodecanal 01.3 03.9 0–23 germacrene B 00.3 0– 0–24 α-farnesene 00.5 00.7 00.325 thymol isobutyrate 01.4 11.2 20.026 tetradecanal 00.3 00.2 0–27 8,9-didehydro thymol isobutyrate 00.3 01.1 01.628 (E)-nerolidol 00.3 0– 0–29 hexadecanal 00.2 0– 0–30 thymol 00.3 01.1 01.5
Source: Rohloff, 1999 (unpublished data).

clearly led to dramatic changes of basil aroma volatiles, which might be disad-vantageous for the flavour properties of this herb.
Another method for the conservation and processing of medicinal plants is theEtOH-extraction of active metabolites. One of the most commonly used plantimmunostimulants nowadays is Echinacea, or coneflower, used for the treatmentof colds and flu. Three different species are of medicinal interest due to their contentof effective alkylamides and polysaccharides: E. purpurea (L.) Moench, E. angus-tifolia DC. and E. pallida Nutt. The occurrence of their active compounds andbiochemistry has been reported (Bauer et al., 1988a and 1988b; Bauer and Remiger,1989; Bauer and Wagner, 1990) and their EO composition has been described (Bauerand Wagner, 1990; Schulthess et al., 1991; Wagner, 1995; Mazza and Cottrell, 1999;Millard et al., 1999). As part of a quality screening study, eight commerciallyaccessible herbal remedies and preparations mainly produced from red coneflower
108 Jens Rohloff
Table 16. Variation in monoterpene, sesquiterpene and phenylpropene composition (area response%) of dried samples (40 °C) of sweet basil (Ocimum basilicum L.) after microwave treatment detectedby HS-SPME (t = trace compound).
Compound Control Microwave Microwave15 sec 30 sec
α-pinene 01.5 00.4 00.2sabinene 00.2 0t 0tβ-pinene 01.0 00.9 01.0β-myrcene 03.7 0t 0t1,8-cineole 30.2 03.9 02.9linalool 38.5 25.3 24.3camphor 00.8 00.5 0testragole 11.3 19.1 12.2(Z)-methyl cinnamate 0t 00.2 00.2α-copaene 00.3 01.3 00.9eugenol 00.1 00.8 00.3(E)-methyl cinnamate 03.4 10.2 15.0methyl eugenol 00.3 04.2 01.8β-caryophyllene 01.3 05.0 05.0(Z,E)-α-bergamotene 03.4 09.9 14.1α-caryophyllene 00.3 01.3 01.2(Z)-β-farnesene 00.1 00.7 00.4germacrene D isomer 00.1 00.6 00.6germacrene D 00.7 02.6 02.5β-selinene 0t 00.6 00.6valencene 00.3 01.0 01.3viridiflorene 00.3 01.1 01.7β-bisabolene 0t 00.4 00.4γ-cadinene 00.7 02.7 04.4(Z)-calamene 00.1 00.4 00.7(E)-β-farnesene 00.1 00.3 00.4(Z)-γ-bisabolene 00.1 00.9 00.4cubenol 0t 00.3 00.5τ-cadinol 00.2 01.1 02.0
Source: Rohloff, 1997 (unpublished data).
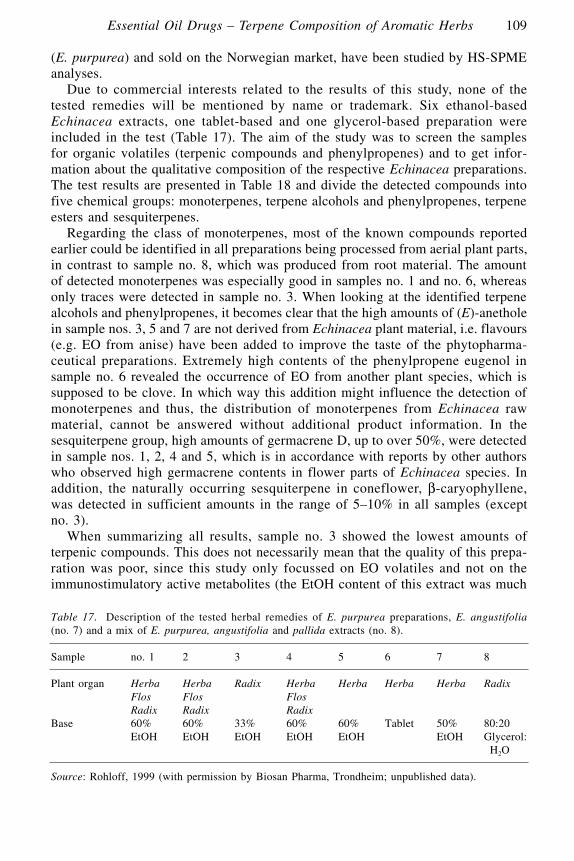
(E. purpurea) and sold on the Norwegian market, have been studied by HS-SPMEanalyses.
Due to commercial interests related to the results of this study, none of thetested remedies will be mentioned by name or trademark. Six ethanol-basedEchinacea extracts, one tablet-based and one glycerol-based preparation wereincluded in the test (Table 17). The aim of the study was to screen the samplesfor organic volatiles (terpenic compounds and phenylpropenes) and to get infor-mation about the qualitative composition of the respective Echinacea preparations.The test results are presented in Table 18 and divide the detected compounds intofive chemical groups: monoterpenes, terpene alcohols and phenylpropenes, terpeneesters and sesquiterpenes.
Regarding the class of monoterpenes, most of the known compounds reportedearlier could be identified in all preparations being processed from aerial plant parts,in contrast to sample no. 8, which was produced from root material. The amountof detected monoterpenes was especially good in samples no. 1 and no. 6, whereasonly traces were detected in sample no. 3. When looking at the identified terpenealcohols and phenylpropenes, it becomes clear that the high amounts of (E)-anetholein sample nos. 3, 5 and 7 are not derived from Echinacea plant material, i.e. flavours(e.g. EO from anise) have been added to improve the taste of the phytopharma-ceutical preparations. Extremely high contents of the phenylpropene eugenol insample no. 6 revealed the occurrence of EO from another plant species, which issupposed to be clove. In which way this addition might influence the detection ofmonoterpenes and thus, the distribution of monoterpenes from Echinacea rawmaterial, cannot be answered without additional product information. In thesesquiterpene group, high amounts of germacrene D, up to over 50%, were detectedin sample nos. 1, 2, 4 and 5, which is in accordance with reports by other authorswho observed high germacrene contents in flower parts of Echinacea species. Inaddition, the naturally occurring sesquiterpene in coneflower, β-caryophyllene,was detected in sufficient amounts in the range of 5–10% in all samples (exceptno. 3).
When summarizing all results, sample no. 3 showed the lowest amounts ofterpenic compounds. This does not necessarily mean that the quality of this prepa-ration was poor, since this study only focussed on EO volatiles and not on theimmunostimulatory active metabolites (the EtOH content of this extract was much
Essential Oil Drugs – Terpene Composition of Aromatic Herbs 109
Table 17. Description of the tested herbal remedies of E. purpurea preparations, E. angustifolia(no. 7) and a mix of E. purpurea, angustifolia and pallida extracts (no. 8).
Sample no. 1 2 3 4 5 6 7 8
Plant organ Herba Herba Radix Herba Herba Herba Herba RadixFlos Flos FlosRadix Radix Radix
Base 60% 60% 33% 60% 60% Tablet 50% 80:20EtOH EtOH EtOH EtOH EtOH EtOH Glycerol:
H2O
Source: Rohloff, 1999 (with permission by Biosan Pharma, Trondheim; unpublished data).

110 Jens Rohloff
Table 18. Screening of the terpene volatile composition of eight commercially available herbal remediesfrom Echinacea extracts detected by HS-SPME (t = trace compound).
Compound 1 2 3 4 5 6 7 8
MONOTERPENES
β-pinene 00.37 00t 01.06 00t 00.49 01.29sabinene 00t 00.50α-phellandrene 00.65 00t 00.54 00t 00t 00tβ-myrcene 03.61 02.26 0t 00t 00.50limonene 00.37 00t 0t 00t 02.30 08.58 00t 00t1.8-cineole 0t 00t 00.16 00t 00.66β-phellandrene 00t 00t 00t 00t 00tγ-terpinene 00t 00t 0t 00t 00t 01.45 00t 00t(E)-ocimene 00t 00t 00t 00tp-cymene 00.73 00t 0t 00.77 00.98 00.95 00t 00tterpinolene 0t 00.49 00t
Total area (%) 05.73 02.26 0– 02.37 03.78 12.26 01.29 00.66
TERPENE ALCOHOLS and PHENYLPROPENES
4-terpineol 00.23neomenthol 01.72estragole 0t 00.32 01.25α-terpineol 01.33(E)-anethole 9.00 00.82 04.73 34.90 00.19(E)-nerolidol 00t 00t 0t 00t 00teugenol 52.40thymol 00t 00t
Total area (%) 00– 00– 9.00 00.82 05.05 52.40 36.15 01.75
TERPENE ESTERS
linalyl acetate 03.39bornyl acetate 00t 00.16nerolidyl acetate 00t
Total area (%) 00– 00– 0– 0– 0– 0– – 03.55
SESQUITERPENES
α-copaene 01.06 01.40 2.02 01.96 00.54 02.77β-bourbonene 00t 00t 00t 00.36 00tβ-cubebene 01.19 01.28 00.85β-caryophyllene 06.27 04.52 09.67 10.96 04.25 05.67 11.89α-caryophyllene 00t 00.68 00tα-guaiene 01.68 02.48 02.36germacrene D 22.51 67.48 39.65 29.60 00.58 03.98 00tcaryophyllene oxide 00t 00t 00t 00.21 00t
Total area (%) 32.71 74.68 2.02 54.61 43.28 05.58 13.10 11.89
Source: Rohloff, 1999 (with permission by Biosan Pharma, Trondheim; unpublished data).
lower compared to the other ethanolic preparations). As already mentioned, highamounts of added EO flavours in sample no. 6 resulted in a distortion of the correctvolatile composition. On the other hand, this preparation, together with samplenos. 1, 2, 4 and 5, covered a broad range of naturally occurring terpene volatilesand might be one hint for describing the fine quality of these preparations with regardto careful extraction and processing procedures.
5. PROSPECTS OF AROMATIC HERBS ✧ A SCENT OF THE 21ST CENTURY
When choosing the resolutions of the ‘Second World Congress on Medicinal andAromatic Plants for Human Welfare WOCMAP-II’ (Giberti et al., 1999) as thestarting point for a discussion about the prospects of aromatic herbs, it becamequite clear that their production, processing and application has been attractingincreasing interest. The growing demand for medicinal and aromatic plants (MAPs)implies economic importance within the fields of agriculture, medicine, pharma-ceutical industry and biotechnology, and makes the sustainable use of nature andits plant resources imperative, as well as the extension of quality control measuresand statutory regulations for production and marketing. The common ground onwhich the international co-operation is based is highlighted by the WOCMAP-IIpostulations about concerted efforts for:
– Taxonomic research on the native flora and search for novel compounds– Establishment of pharmacological and toxicological information systems – Standardization and regulation of phytotherapeutic preparations– Application of Good Manufacturing Practice (GMP) in industrial processes– Recording and protection of ancestral knowledge related to traditional phy-
tomedicine– Elaboration of guidelines for domestication and cultivation methods of MAPs
These efforts seem to manifest themselves when reading the research topicsfrom more recent international conferences on MAPs (Bernáth et al., 2002;Figueiredo et al., 2002; Ming et al., 2002). In the near future, novel plant volatileswill be discovered and new fields of EO utilization will be introduced. The chemicalgroup of natural terpenoids especially seems to possess a promising potential forfuture applications. Since these compounds act as signalling messengers in mostorganisms and are involved in the interaction between biological systems that arequite diverse, scientists from several disciplines focus their work on bioactive ter-penoids, thus leading to intensified interdisciplinary research. Molecular biologyin particular should reveal additional biosynthetic pathways and the structure andfunction of corresponding enzymes, and extend biotechnological approaches and theindustrial-scale production of plant secondary metabolites.
Discoveries and implementations within aromatic plant production, researchand industrial processing go hand-in-hand with the development of newer instru-ments and analytical techniques. Adequate extraction, detection and structureelucidation are the key words within natural product chemistry and EO analysis.
Essential Oil Drugs – Terpene Composition of Aromatic Herbs 111
A great deal has changed since the publication of Sandra and Bicchi’s comprehensivebook, ‘Capillary Gas Chromatography in Essential Oil Analysis’ (1987), and modernextraction and chromatographic techniques for the study of EO volatiles have beenrecently reported and reviewed (Ammann et al., 1999; De Castro et al., 1999; Adams,2001; Gomez and Witte, 2001; Lang and Wai, 2001; Lockwood, 2001; Marriott etal., 2001; Hyötyläinen and Riekkola, 2002; Kubeczka, 2002; Sandra et al., 2002).Regarding the conclusions of Maarse (1991) and Boelens (1991), many of theirpredictions about future trends within analytical instrumentation and research havecome true during the past ten years. Smaller instruments, hyphenated techniquesand automation processes have been implemented. The breakthrough of computertechnology and database networking via the Internet especially has made theestablishment of computer-based expert systems for end-users feasible. Despite tech-nological innovations in the chromatographic sciences, sample preparation andextraction of plant volatiles is still the crucial step with regard to accuracy, preci-sion and analysis time as pointed out by Sandra and co-authors (2002).
Modern biotechnology with PCR and micro-array technique provide excellenttools to study the biosynthesis of secondary metabolites on the molecular level.Laboratory work and instrumentation on a microscale for the extraction, detectionand identification of plant volatiles will be further improved and established, andrecently introduced techniques such as micro-SPE, single-drop extraction and SPMEindicate the direction of miniaturization. Fast sample throughput, minimal samplesize, organic solvent consumption and high sensitivity are of essential importancefor such future developments. The application of dynamic sampling, on-site analysisand ‘lab-on-a-chip-technologies’ has the potential to support real-time decisions,interactive sampling and cost-effective solutions in industrial processes.
The extent to which SPME might be implemented in automated qualitycontrol and chemical and manufacturing processes depends on developments andmodifications of the (normally) manually operated SPME holder. Solid-phasemicroextraction seems to be an analytical tool for research applications rather thana generally applicable extraction technique. Its advantages over classical distilla-tion and headspace applications are impressive due to drastically reduced analysistime and will introduce new frontiers in plant volatile research. As a newly reported,excellent example, Grassi and co-workers (2002) have literally used solid-phase‘microextraction’ to extract the EO liquids from single peltate trichomes! SPMEneeds further development with regard to quantification. Fibres with affinity coatingsfor target analytes and chiral coatings for optically active analytes will be devel-oped, and the number of applications based on instrument hyphenation will increase.The user-friendliness of operating SPME will initiate the development of applica-tions and ‘handy’ equipment for the monitoring of volatiles for biological andenvironmental studies, extraction automation, on-site sampling and on-fibre storageof analytes. – ‘When talking about the direction in which future technology andresearch might grow, means always: Pointing at your Feet.’
112 Jens Rohloff
APPENDICES – MATERIALS AND METHODS
Chapter 4.1 – SPME vs. distillation: Peppermint, Chamomile, Basil and Dill
Chamomile (Matricaria recutita L.), sweet basil (Ocimum basilicum L.) and dill (Anethum grave-olens L.) were grown from seeds while peppermint plants (Mentha × piperita clone ‘Hardanger’)were grown by runner propagation. All species were pre-cultivated in the greenhouse at 25 °C at ThePlant Biocentre over an 8-week period. In the end of June, all species were transferred to the trialfield by planting them in 3 m long double-rows on 20 cm high, plastic-covered beds with 20 cm of spacebetween plants and 25 cm between double-rows. Leaves and flowers of blooming peppermint and flowersfrom chamomile were harvested in early September, while leaves and stems of sweet basil and dillwere harvested at the end of August 1997. All samples were dried at 35 °C for 48 h and stored atroom temperature prior to analysis in February 1998. The essential oil (EO) was obtained by sepa-rating leaves and/or flowers from the stems and crushing before distillation (Rohloff, 1999). GC sampleswere prepared by diluting 25 µl of essential oil in 1 ml EtOH and storing at 4 °C prior to analysis.The SPME procedure was carried out by using a PDMS-coated fibre (100 µm) as described by Rohloff(1999). All samples were analysed using a Varian Star 3400 CX gas chromatograph coupled with aSaturn 3 mass spectrometer with He as the carrier gas. EO GC-MS conditions – capillary columnDB-5, 30 m, 0.25 mm i.d., 0.25 µm film, 35–200 °C at 2.9 °C min–1, injector 250 °C (split 1 min),detector 200 °C (EI mode). SPME-GC-MS conditions – column as above, 35 °C for 2 min, 35–250 °C at 5 °C min–1, injector (split 2 min) and detector temperature as above.
Chapter 4.2 – Extraction time and concentration: Dill and Sachalinmint
Dill
For details on cultivation and sample preparation, see Chapter 4.1. SPME conditions – 1 g of dillherb (Anethum graveolens L. var. ‘Superdukat’) was sealed in a 10 ml screw-top vial with PTFE/siliconeseptum, equilibrium time 10 min at 35 °C, extraction 10 min, desorption 2 min. SPME-GC-MS con-ditions – capillary column DB-5, 30 m, 0.25 mm i.d., 0.25 µm film, 35 °C for 2 min, 35–250 °C at5 °C min–1, injector 220 °C (split 2 min), detector 200 °C (EI mode).
Sachalinmint
Sachalinmint plants (Mentha sachalinensis Briq. (Kudô) var. ‘Mentolcsepp’) were harvested at the PlantBiocentre, Trondheim, in September 1998 and dried at 35 °C for 48 h. Samples (3 replicates) taken froma pooled leaf sample were spiked with menthol: 2, 2.5, 5, 10 and 15 µl. SPME conditions – 1 g plantsample in 10 ml screw-top vial with phenolic cap and PTFE/silicone septum, equilibrium time 10min at 45 °C, extraction 30 s, desorption 3 min. SPME-GC-MS conditions – capillary column CPWax 52CB, 30 m × 0.32 i.d., 0.25 µm film, 35 °C for 2 min, 35–250 °C at 5 °C min–1, hold 2 min,injector 250 °C (split 2 min), detector 175 °C (EI mode).
Butyl Isothiocyanate (BITC)
BITC standard solutions (1, 5, 10, 25, 50, 100 and 200 ppm in H2O:EtOH 50:50) were prepared in10 ml screw-top vials with phenolic cap and PTFE/silicone. SPME conditions – equilibrium time 10min at 23 °C for 24 h, extraction 10 min, desorption 2 min. SPME-GC-MS conditions – capillary columnCP Wax 52CB, 30 m × 0.32 i.d., 0.25 µm film, 35 °C for 2 min, 35–250 °C at 5 °C min–1, hold2 min, injector 250 °C (split 2 min), detector 175 °C (EI mode).
Essential Oil Drugs – Terpene Composition of Aromatic Herbs 113

Chapter 4.3 – Identification of chemotypes and cultivars: Dill and Hops
Dill
Dill leaves (Anethum graveolens L.) of two cultivars – ‘Superdukat’ and ‘Aros’ – were harvested in1997 from non-flowering plants grown at Hordaland County, Norway, and oven-dried at 40 °C. SPMEanalysis with a PDMS fibre (100 µm) was carried out in the same way as described by Rohloff (1999).All samples were analysed using a Varian Star 3400 CX gas chromatograph coupled with a Saturn 3mass spectrometer with He as the carrier gas. SPME conditions – equilibrium time 30 min at 40 °C,extraction 10 min, desorption 2 min. SPME-GC-MS conditions – capillary column DB-5, 30 m,0.25 mm i.d., 0.25 (m film, 35 °C for 1 min, 35–90 °C at 2 °C min–1, 90–250 °C at 15 °C min–1,injector 250 °C (split 2 min), detector 200 °C (EI mode).
Hops
The plant material was collected from wild-growing Norwegian plants and cultivated at the ResearchStation Kise, The Norwegian Crop Research Institute (Planteforsk) in Hedmark County. Hops cones(Humulus lupulus L.) of 8 different clones were harvested at the mature stage in October 2000 andimmediately stored at –20 °C prior to analysis in March 2001. All samples were analysed using a VarianStar 3400 CX gas chromatograph coupled with a Saturn 3 mass spectrometer with He asthe carrier gas. SPME conditions – Each sample (20 g, frozen) was sealed in an Erlenmeyer flask(250 ml), equilibrium time 20 min at 50 °C, extraction time 10 min (100 µm PDMS fibre), desorp-tion 2 min. SPME-GC-MS conditions – capillary column CP Wax 52CB, 30 m × 0.32 i.d., 0.25 µmfilm, 35 °C for 2 min, 35–250 °C at 5 °C min–1, hold 2 min, injector 250 °C (split 2 min), detector175 °C (EI mode).
Chapter 4.4 – Ontogenetic differentiation: Peppermint, Sachalinmint and Arnica
Pepprmint
Both leaves and flowers of Mentha × piperita (clone ‘Hardanger’) were harvested from trial plots atThe Plant Biocentre, Trondheim. The sampling was carried out with regard to leaf position in basipetaldirection by dividing the samples into the following groups: flowers, leaves 1–3, leaves 4–5, leaves 6–7,leaves 8–9. Samples were dried at 35 °C for 48 h. Sample preparation, SPME (100 µm PDMS fibre)and GC-MS conditions are described in detail by Rohloff (1999).
Sachalinmint
Sachalinmint plants (Mentha sachalinensis Briq. (Kudô) var. ‘Mentolcsepp’) where harvested atthe Plant Biocentre, Trondheim, in September 1998 and dried at 35 °C for 48 h. The samples (3replicates) were divided into 4 groups with regard to leaf (and flower) position: A – 0–20 cm; B –20–40 cm; C – 40–60 cm; D – 60–80 cm. SPME conditions – 1 g plant sample in 10 ml screw-topvial with phenolic cap and PTFE/silicone septum, equilibrium time 10 min at 45 °C, extraction 30 s,desorption 3 min. Plant material used for exposure time testing (10 s, 20 s, 30 s, 1 min, 2 min, 5min) was taken from group D and equilibrated for 10 min at 45 °C. SPME-GC-MS conditions – cap-illary column CP Wax 52CB, 30 m × 0.32 i.d., 0.25 µm film, 35 °C for 2 min, 35–250 °C at 5 °Cmin–1, hold 2 min, injector 250 °C (split 2 min), detector 175 °C (EI mode).
114 Jens Rohloff

Arnica
The dried plant material of Arnica montana L. harvested in 1999, was obtained from a farmer atSpideberg, Østfold County, in Southeastern Norway. Flower, leaf and root samples were analysed byusing a 100 µm PDMS fibre. SPME conditions – 1 g plant sample in 10 ml screw-top vial withphenolic cap and PTFE/silicone septum, equilibrium time 15 min at 50 °C, extraction 1 min, desorp-tion 2 min. SPME-GC-MS conditions – capillary column CP Wax 52CB, 30 m × 0.32 i.d., 0.25 µmfilm, 35 °C for 2 min, 35–250 °C at 5 °C min–1, hold 2 min, injector 250 °C (split 2 min), detector175 °C (EI mode).
Chapter 4.5 – Quality control of processed herbs: Basil and Coneflower
Sweet Basil
The SPME procedure was carried out on commercially available dried herbs (Ocimum basilicum L.)by using a PDMS-coated fibre (100 µm) as described by Rohloff (1999). All samples were analysedusing a Varian Star 3400 CX gas chromatograph coupled with a Saturn 3 mass spectrometer with Heas the carrier gas. SPME-GC-MS conditions – column DB-5, 30 m, 0.25 mm i.d., 0.25 µm film, 35°C for 2 min, 35–250 °C at 5 °C min–1, injector 250 °C (split 2 min), detector 200 °C (EI mode).
Coneflower sp.
Commercially available phytomedicinal remedies of Echinacea purpurea L. (nos. 1–6), Echinacea angus-tifolia L. (no. 7) and a preparation containing a root extract of E. purpurea, E. angustifolia and E. pallida(no. 8) were analysed by HS-SPME with regard to the composition of terpene volatiles. All prepara-tions were EtOH-based (except for nos. 6 and 8) and analysed without further preparation. Sampleno. 6 consisted of tablets of which 1 tablet was dissolved in 5 ml 60% EtOH. Sample no. 8 consistedof a glycerol:H2O (80:20) base and was analysed as is (5 ml). SPME conditions – 5 ml of each samplewere sealed in a 10 ml screw-top vial with PTFE/silicone septum, equilibrium time 60 min at 50 °C,extraction 60 min, desorption 2 min. SPME-GC-MS conditions – capillary column CP Wax 52CB,30 m × 0.32 i.d., 0.25 µm film, 35 °C for 5 min, 35–90 °C at 3 °C min–1, 90–210 °C at 7 °C min–1,hold 15 min, injector 240 °C (split 2 min), detector 175 °C (EI mode).
REFERENCES
Adams, R. P. (2001). Identification of essential oil components by gas chromatography/quadruplemass spectrometry. Allured Publishing Corp., Illinois, 456 pp.
AFNOR (1996). Huiles Essentielles, 5th edition, Association Française de Normalisation, Recueil desNormes Françaises, Paris.
Alonzo, G., F. Saiano, N. Tusa and S. F. Del Bosco (2001). Analysis of volatile compounds releasedfrom embryogenic cultures and somatic embryos of sweet oranges by headspace SPME. PlantCell Tiss. Org. Cult. 66: 31–34.
Alpendurada, M. D. F. (2000). Solid-phase microextraction: A promising technique for sample prepa-ration in environmental analysis. J. Chromatogr. A 889: 3–14.
Ammann, A., D. C. Hinz, R. Shane Addleman, C. M. Wai and B. W. Wenclawiak (1999). Superheatedwater extraction, steam distillation and SFE of peppermint oil. Fresenius J. Anal. Chem. 364:650–653.
An, M., T. Haig and P. Hatfield (2001). On-site field sampling and analysis of fragrance from livinglavender (Lavandula angustifolia L.) flowers by solid-phase microextraction coupled to gas chro-matography and ion-trap mass spectrometry. J. Chromatogr. A 917: 245–250.
Essential Oil Drugs – Terpene Composition of Aromatic Herbs 115
Angelino, S. A. G. F (1991). Beer. In H. Maarse. (ed.) Volatile compounds in foods and beverages.Marcel Dekker Inc., New York, pp. 581–616.
Antonelli, A., C. Fabbri and E. Boselli (1998). Modifications of dried basil (Ocimum basilicum) leafoil by gamma and microwave irradiation. Food Chem. 63: 485–489.
Arnault, I., N. Mondy, F. Cadoux and J. Auger (2000). Possible interest of various sample transfertechniques for fast gas chromatography-mass spectrometric analysis of true onion volatiles. J.Chromatogr. A 896: 117–124.
Arnold, J. W. and S. D. Senter (1998). Use of digital aroma technology and SPME CC-MS to comparevolatile compounds produced by bacteria isolated from processed poultry. J. Sci. Food Agric. 78:343–348.
Arthur, C.L., L. M. Killam, K. D. Buchholz, J. Pawliszyn and J. R. Berg (1992a). Automation andoptimization of solid-phase microextraction. Anal. Chem. 64: 1960–1966.
Arthur, C. L., D.W. Potter, K.D. Buchholz, S. Motlagh, and J. Pawliszyn (1992b). Solid-phase microex-traction for the direct analysis of water: Theory and practice. LC·GC Europe 10: 4 pp.
Auerbach, R. H., K. Dost and G. Davidson (2000). Characterization of varietal differences inessential oil components of hops (Humulus lupulus) by SFC-FTIR spectroscopy. J. AOAC Int. 83:621–626.
Auger, J., S. Roussett, E. Thibout and B. Jaillais (1998). Solid-phase microextraction(gas chromatog-raphy(direct deposition infrared spectrometry as a convenient method for the determination of volatilecompounds from living organisms. J. Chromatogr. A 819: 45–50.
Augusto, F., A. L. P. Valente, E. D. Tada and S. R. Rivellino (2000). Screening of Brazilian fruitaroma using solid-phase microextraction(gas chromatography-mass spectrometry. J. Chromatogr.A 873: 117–127.
Azodanlou, R., C. Darbellay, J. L. Luisier, J. C. Villettaz and R. Amado (1999). A new concept forthe measurement of total volatile compound of food. Food Res. Technol. 208: 254–258.
Bailer, J., T. Aichinger, G. Hackl, K. De Hueber and M. Dachler (2001). Essential oil content andcomposition in commercially available dill cultivars in comparison to caraway. Industr. CropsProd. 14: 229–239.
Baltussen, E., C. A. Cramers and P. J. F. Sandra (2002). Sorptive sample preparation – a review.Anal. Bioanal. Chem. 373: 3–22.
Barkovich, R. and J. C. Liao (2001). Metabolic engineering of isoprenoids. Metabolic Engineering 3:27–39.
Bauer, R. and P. Remiger (1989). TLC and HPLC analysis of alkamides in Echinacea drugs. PlantaMed. 55: 367–371.
Bauer, R. and H. Wagner (1990). Echinacea – Handbuch für Ärzte, Apotheker und andereNaturwissenschaftler. Wissenschaftliche Verlagsgesellschaft mbH, Stuttgart, 182 pp.
Bauer, R., Khan, I. A. and H. Wagner (1988a). TLC and HPLC analysis of Echinacea pallida and E.angustifolia roots. Planta Med. 54: 426–430.
Bauer, R., P. Remiger and H. Wagner (1988b). Alkamides from the roots of Echinacea purpurea.Phytochem. 27: 2339–2342.
Beaulieu, J. C. and C. C. Grimm (2001). Identification of volatile compounds in cantaloupe at variousdevelopmental stages using solid phase microextraction. J. Agric. Food Chem. 49: 1345–1352.
Belardi, R. and J. Pawliszyn (1989). The application of chemically modified fused silica fibres in extrac-tion of organics from water matrix samples, and their rapid transfer to capillary column. WaterPoll. Res. J. Can. 24: 179–191.
Bellavia, V., M. Natangelo, R. Fanelli and D. Rotilio (2000). Analysis of benzothiazole in Italianwines using headspace solid-phase microextraction and gas chromatography-mass spectrometry. J.Agric. Food Chem. 48: 1239–1242.
Beltran, J., F. J. Lopez and F. Hernandez (2000). Solid-phase microextraction in pesticide residueanalysis. J. Chromatogr. A 885: 389–404.
Béné, A., A. Fornage, J. L. Luisier, P. Pichler and J. C. Villettaz (2001). A new method for the rapiddetermination of volatile substances: the SPME-direct method – Part I: Apparatus and workingconditions. Sensors and Actuators B 72: 184–187.
Bernáth, J., E. Zámboriné-Németh, L. Craker and O. Köck (2002). Proceedings of the InternationalConference of Medicinal and Aromatic Plants: Possibilities and Limitations of Medicinal and
116 Jens Rohloff

Aromatic Plant Production in the 21st Century. 8–11 July 2001, Budapest, Hungary, Act. Hort.576, 368 pp.
Besse, J., A. Fornage, J. L. Luisier and H. N’Zebo (2001). Monitoring of the drying process by directsolid-phase microextraction. Chimia 55: 741–743.
Bicchi, C., A. Binello and P. Rubiolo (1999). Supercritical carbon dioxide in combination with silicagel to fractionate essential oils. Phytochem. Anal. 10: 17–21.
Bicchi, C., C. Cordero, C. Iori, P. Rubiolo and P. Sandra (2000a). Headspace sorptive extraction (HSSE)in the headspace analysis of aromatic and medicinal plants. HRC-J. High Res. Chromatogr. 23:539–546.
Bicchi, C., S. Drigo and P. Rubiolo (2000b). Influence of fibre coating in headspace solid-phase microex-traction-gas chromatographic analysis of aromatic and medicinal plants. J. Chromatogr. A 892:469–485.
Boelens, M. H. (1991). Spices and condiments II. In H. Maarse (ed.), Volatile compounds in foodsand beverages. Marcel Dekker Inc., New York, pp. 449–482.
Borg-Karlson, A. K. and R. Mozuraitis (1996). Solid phase micro extraction technique used forcollecting semiochemicals: Identification of volatiles released by individual signalling Phyllonoryctersylvella moths. Eur. J. Biosci. Section C 51: 599–602.
Bottcher, H., I. Gunther, R. Franke and K. Warnstorff (2001). Physiological postharvest responses ofMatricaria (Matricaria recutita L.) flowers. Postharv. Biol. Technol. 22: 39–51.
Braggins, T. J., C. C. Grimm and F. R. Visser (1999). Analysis of food volatiles using SPME. In J.Pawliszyn (ed.), Applications of solid phase microextraction. Royal Society of Chemistry RSC,Cambridge, pp. 407–422.
Buchholz, K. D. and J. Pawliszyn (1993). Determination of phenols by solid-phase microextractionand gas chromatographic analysis. Environ. Sci. Technol. 27: 2844–2848.
Buszewski, B. and M. Ligor (2001). Qualitative and quantitative analyses of volatile organic compoundsin wines using SPME-GC. Chemia Analityczna 46: 215–224.
Buszewski, B. and M. Ligor (2002). Single-drop extraction versus solid-phase microextraction. LC·GCEurope 2: 92–97.
Butzke, C. E., T. J. Evans and S. E. Ebeler (1998). Detection of cork taint in wine using automatedsolid-phase microextraction in combination with GC/MS-SIM. In A. L. Waterhouse and S. E.Ebeler (eds.), Chemistry of wine flavor. ACS Symp. Ser. 714: 208–216.
Camarasu, C. C., M. MezeiSzuts and G. B. Varga (1998). Residual solvents determination inpharma-ceutical products by GC-HS and GC-MS-SPME. J. Pharmac. Biomed. Anal. 18: 623–638.
Cantrell, C. L., S. G. Franzblau and N. H. Fischer (2001). Antimycobacterial plant terpenoids. PlantaMed. 67: 685–694.
Cass, B. J., F. Schade, C. W. Robinson, J. E. Thompson and R. L. Legge (2000). Production of tomatoflavor volatiles from a crude enzyme preparation using a hollow-fiber reactor. Biotech. Bioeng.67: 372–377.
Chai, M. and J. Pawliszyn (1995). Analysis of environmental air samples by solid-phase micro-extraction and gas chromatography/ion trap mass spectrometry. Environ. Sci. Technol. 29: 693–701.
Chin, H. W., R. A. Bernhard and M. Rosenberg (1996). Solid phase microextraction for cheese volatilecompound analysis. J. Food Sci. 61: 1118–1122, 1128.
Chithra, V. and S. Leelamma (2000). Coriandrum sativum – effect on lipid metabolism in 1,2-dimethylhydrazine induced colon cancer. J. Ethnopharmacol. 71: 457–463.
Clark T. J. and J. E. Bunch (1997). Qualitative and quantitative analysis of flavor additives on tobaccoproducts using SPME-GC-mass spectroscopy. J. Agr Food Chem. 45: 844–849.
Clark, T. J. and J. E. Bunch (1998). Identification of tobacco varieties, using solid phase microextraction/capillary GC. Supelco Applic. Note 84.
Coleman, W. M, T. A. Perfetti and B. M. Lawrence (1998). Automatic injection solid-phase micro-extraction-chiral-gas chromatography-mass selective detection analyses of essential oils. J.Chromatogr.Sci. 36: 575–578.
Coleman, W. M. and B. M. Lawrence (2000). Examination of the enantiomeric distribution of certainmonoterpene hydrocarbons in selected essential oils by automated solid-phase microextraction-chiralgas chromatography-mass selective detection. J. Chromatogr. Sci. 38: 95–99.
Essential Oil Drugs – Terpene Composition of Aromatic Herbs 117
Coleman, W. M. and B. M. Lawrence (1997). A comparison of selected analytical approaches to theanalysis of an essential oil. Flav. Fragr. J. 12: 1–8.
Coleman, W. M. and S. N. Lawson (1998). Solid-phase microextraction gas chromatographic-mass selec-tive detection analysis of selected sources of menthol. J. Chromatogr. Sci. 36: 401–405.
Coleman, W. M., B. M. Lawrence and S. K. Cole (2002). Semiquantitative determination of off-notesin mint oils by solid-phase microextraction. J. Chromatogr. Sci. 40: 133–139.
Coran, S. A., V. Giannellini, S. Furlanetto, M. Bambagiotti-Alberti and S. Pinzauti (2001). Improvinggas chromatographic determination of residual solvents in pharmaceuticals by the combined useof headspace solid-phase microextraction and isotopic dilution. J. Chromatogr. A 915: 209–216.
Cornu, A., A. P. Carnat, B. Martin, J. B. Coulon, J. L. Lamaison and J. L. Berdague (2001). Solid-phase microextraction of volatile components from natural grassland plants. J. Agric. Food Chem.49: 203–209.
Council of Europe (2002). European Pharmacopeia. 4th ed., European Treaty Series no. 50, Strasbourg,2416 pp.
Cowan, M. M. (1999). Plant products as antimicrobial agents. Clin. Microbiol. Rev. 12: 564–582.Curren, M. S. S. and J.W. King (2001). Ethanol-modified subcritical water extraction combined with
solid-phase microextraction for determining atrazine in beef kidneys. J. Agric. Food Chem. 49:2175–2180.
Czerwinski, J., B. Zygmunt and J. Namiesnik (1996). Head-space solid phase microextraction forthe GC-MS analysis of terpenoids in herb-based formulations. Fresenius J. Anal. Chem. 356:80–83.
Das, M., G. R. Mallavarapu and S. Kumar (1998). Chamomile (Chamomilla recutita): Economic botany,biology, chemistry, domestication and cultivation. J. Med. Arom. Plant Sci. 20: 1074–1109.
De Castro, M. D. L., M. M. Jimenez-Carmona and V. Fernandez-Perez (1999). Towards more rationaltechniques for the isolation of valuable essential oils from plants. TRAC – Trend. Anal. Chem. 18:708–716.
De La Pena, M. G. A., R. A. Reglos and C. C. De Guzman (2002). Influence of different types of organicfertilizers on growth and essential oil yield of sweet basil (Ocimum basilicum L.). Philipp. Agric.Sci. 85: 15–18.
Deans, S. G. and K. P. Svoboda (1993). Biotechnology of aromatic and medicinal plants. In R. K. M.Hay and P. G. Waterman (eds.), Volatile oil crops: their biology, biochemistry and production.Longman Scientific & Technical, Harlow, pp. 113–136.
Demirci, F., N. Kirimer, B. Demirci, Y. Noma and K. H. C. Baser (2001). Screening of biotransfor-mation products of carvone enantiomers by headspace-SPME/GC-MS. J. Biosci. C 56: 58–64.
Demyttenaere, J. C. R., A. Adams, J. Vanoverschelde and N. De Kimpe (2001). Biotransformation of(S)-(+)-linalool by Aspergillus niger: An investigation of the culture conditions. J. Agric. Food Chem.49: 5895–5901.
Demyttenaere, J. C. R., M. D. Herrera and N. De Kimpe (2000). Biotransformation of geraniol, neroland citral by sporulated surface cultures of Aspergillus niger and Penicillium sp. Phytochem. 55:363–373.
Dewick, P. M. (2002). The biosynthesis of C-5–C-25 terpenoid compounds. Nat. Prod. Rep. 19: 181–222.Di Cesare, L. F., R. C. Nani, E. L. Fusari, D. Viscardi and R. Vitale (2001). The influence of blanching,
drying and storage on the volatile fraction of the basil leaves. Ind. Aliment. 40: 1007–1013.Diaz-Maroto, M. C., M. S., Perez-Coello and M. D. Cabezudo (2002a). Supercritical carbon dioxide
extraction of volatiles from spices – Comparison with simultaneous distillation-extraction. J.Chromatogr. A 947: 23–29.
Diaz-Maroto, M. C., M. S. Perez-Coello and M. D. Cabezudo (2002b). Headspace solid-phase microex-traction analysis of volatile components of spices. Chromatographia 55: 723–728.
Dragland, S. and T. H. Aslaksen (1997). Effect of fertilization on yield and quality of the essentialoil of peppermint (Mentha × piperita L.). Norwegian Crop Research Institute, Report no. 20, 17pp. [Norwegian].
Dragland, S. and B. Galambosi (1996). Produduksjon og første-foredling av medisinplanter.Forskningsparken i Ås AS, Ås, 213 pp. [Norwegian].
Ebeler, S. E., G. M. Sun, M. Datta, P. Stremple and A. K. Vickers (2001). Solid-phase microextrac-tion for the enantiomeric analysis of flavors in beverages. J. AOAC Intern. 84: 479–485.
118 Jens Rohloff

Ehlers, D., T. Nguyen, K. W. Quirin and D. Gerard (2001). Analysis of essential basil oils – CO2 extractsand steam-distilled oils. Dt. Lebensm. Rundsch. 97: 245–250.
Elmore, J. S., D. S. Mottram and E. Hierro (2001). Two-fibre solid-phase microextraction combinedwith gas chromatography-mass spectrometry for the analysis of volatile aroma compounds in cookedpork. J. Chromatogr. A 905: 233–240.
Eri, S., B. K. Khoo, J. Lech and T. G. Hartman (2000). Direct thermal desorption-gas chromatog-raphy and gas chromatography-mass spectrometry profiling of hop (Humulus lupulus L.) essentialoils in support of varietal characterization. J. Agric. Food Chem. 48: 1140–1149.
Fahlen, A., M. Welander and R. Wennersten (1997). Effects of light-temperature regimes on plant growthand essential oil yield of selected aromatic herbs. J. Sci. Food Agric. 73: 111–119.
Fallik, E., S. Alkali-Tuvia, B. Horev, A. Copel, V. Rodov, Y. Aharoni, D. Ulrich and H. Schulz(2001). Characterisation of ‘Galia’ melon aroma by GC and mass spectrometric sensor measure-ments after prolonged storage. Postharvest Biol. Tec. 22: 85–91.
Falqui-Cao, C., Z. Wang, L. Urruty, J.-J. Pommier and M. Montury (2001). Focused microwave assis-tance for extraction some pesticide residue from strawberries into water before their determinationby SPME/HPLC/DAD. J. Agric. Food Chem. 49: 5092–5097.
Fan, X. T. and R. A. Gates (2001). Degradation of monoterpenes in orange juice by gamma radia-tion. J. Agric. Food Chem. 49: 2422–2426.
Farag, R. S. and K. H. A. M. El-Khawas (1998). Influence of gamma-irradiation and microwaves onthe antioxidant property of some essential oils. Int. J. Food Sci. Nutr. 49: 109–115.
Farag, R. S., M. M. Rashed and A. A. A. A. Hgger (1996). Aflatoxin destruction by microwaveheating. Int. J. Food Sci. Nutr. 47: 197–208.
Fathima, A., K. Begum and D. Rajalakshmi (2001). Microwave drying of selected greens and theirsensory characteristics. Plant Foods Hum. Nutr. 56: 303–311.
Fernando, L. N. and I. U. Grun (2001). Headspace-SPME analysis of volatiles of the ridge gourd(Luffa acutangula) and bitter gourd (Momordica charantia) flowers. Flav. Frag. J. 16: 289–293.
Field, J. A., G. Nickerson, D.D. James and C. Heider (1996). Determination of essential oils in hopsby headspace solid-phase microextraction. J. Agric. Food Chem. 44: 1768–1772.
Figueiredo, A. C., J. G. Barroso and L. G. Pedro (eds.) (2002). International Symposium on EssentialOils – Book of Abstracts. 4–7 September 2002, Lisbon, Portugal, 222 pp.
Flamini, G., P. L. Cioni and I. Morelli (2002) Analysis of the essential oil of the aerial parts of Violaetrusca from Monte Labbro (South Tuscany, Italy) and in vivo analysis of flower volatiles usingSPME. Flav. Fragr. J. 17: 147–149.
Flechtmann, C. A. H., M. J. Dalusky and C. W. Berisford (1999). Bark and ambrosia beetle (Coleoptera:Scolytidae) responses to volatiles from aging loblolly pine billets. Environ. Entomol. 28: 638–648.
Franchomme, P., R. Jollois and D. Pénoël (1990). L’aromathérapie exactement: Encyclopédie del’utilisation thérapeutique des huiles essentielles – Fondements, démonstration, illustration etapplications d’une science médicale naturelle. Jollois, Limoges, 446 pp.
Frank, C., A. Dietrich, U. Kremer and A. Mosandl (1995). GC-IRMS in the authenticity control ofthe essential oil of Coriandrum sativum. J. Agric. Food Chem. 43: 1634–1637.
Franz, C. (1993). Genetics. In R. K. M. Hay and P. G. Waterman (eds.), Volatie oil crops: theirbiology, biochemistry and production. Longman Scientific & Technical, Harlow, pp. 63–96.
Fravel, D. R., W. J. Connick, C. C. Grimm and S. W. Lloyd (2002). Volatile compounds emitted bysclerotia of Sclerotinia minor, Sclerotinia sclerotiorum and Sclerotium rolfsii. J. Agric. FoodChem. 50: 3761–3764.
Freire, L. M. T. V., A. M. S. Freitas and A. M. Relva (2001). Optimization of solid phase microex-traction of aroma compounds in a Portuguese muscatel wine must. J. Microcol. Sep. 13: 236–242.
Freitas, A. M. C., C. Parreira and L. Vilas-Boas (2001). Comparison of two SPME fibers for differ-entiation of coffee by analysis of volatile compounds. Chromatographia 54: 647–652.
Freundorfer, J., J. Maier and L. Reiner (1991). Computer-assisted processes for the recognition ofvarieties of hops and hops products based on essential oils. 1. Methods and variety specific hopoil components. Monatsschr. Brauwiss. 44: 176–190.
Fuchs, S, S Zinn, T. Beck and A. Mosandl (1999b). Biosynthesis of menthofuran in Mentha × piperita:Stereoselective and mechanistic studies. J. Agric. Food Chem. 47: 4100–4105.
Essential Oil Drugs – Terpene Composition of Aromatic Herbs 119

Fuchs, S., T. Beck and A. Mosandl (2001a). Different stereoselectivity in the reduction of pulegoneby Mentha species. Planta Med. 67: 260–262.
Fuchs, S., T. Beck, M. Sandvoss and A. Mosandl (1999a) Biogenetic studies in Mentha × piperita. 2.Stereoselectivity in the bioconversion of pulegone into menthone and isomenthone. J.Agric. FoodChem. 47: 3058–3062.
Fuchs, S., A. Gross, T. Beck and A. Mosandl (2000). Monoterpene biosynthesis in Mentha × piperitaL.: bioconversion of piperitone and piperitenone. Flav. Fragr. J. 15: 84–90.
Fuchs, S., V. Montag and A. Mosandl (2001b). Menthone and isomenthone biosynthesis in Pelargoniumtomentosum Jacq. Enantiomer 6: 319–327.
Fuchs, S., S. Sewenig and A. Mosandl (2001c). Monoterpene biosynthesis in Agathosma crenulata(Buchu). Flav. Fragr. J. 16: 123–135.
Gallori, S., G. Flamini, A.R. Bilia, I. Morelli, A. Landini and F.F. Vincieri (2001). Chemical compo-sition of some traditional herbal drug preparations: Essential oil and aromatic water of costmary(Balsamita suaveolens Pers.). J. Agric. Food Chem. 49: 5907–5910.
Gandini, N. and R. Riguzzi (1997). Headspace solid-phase microextraction analysis of methyl isoth-iocyanate in wine. J. Agric. Food Chem. 45: 3092–3094.
Gang, D. R., J. H. Wang, N. Dudareva, K. H. Nam, J. E. Simon, E. Lewinsohn and E. Pichersky(2001). An investigation of the storage and biosynthesis of phenylpropenes in sweet basil. PlantPhys. 125: 539–555.
Garcia, D. D. C., M. Reichenbacher and K. Danzer (1998a). Classification of wines by means of mul-tivariate data analysis using the SPME/CGC-chromatograms of volatile aroma compounds. Vitis37: 181–188.
Garcia, D. D. C., M. Reichenbacher, K. Danzer, C. Hurlbeck, C. Bartzsch and K.H. Feller (1997).Investigations on wine bouquet components by solid-phase microextraction-capillary gas chro-matography (SPME-CGC) using different fibers. HRC-J. High Res. Chromatogr. 20: 665–668.
Garcia, D. D. C., M. Reichenbacher, K. Danzer, C. Hurlbeck, C. Bartzsch and K.H. Feller (1998b).Use of solid – phase microextraction-capillary-gas chromatography (SPME-GC) for the varietalcharacterization of wines by means of chemometrical methods. Fresenius J. Anal. Chem. 360:784–787.
Gautschi, M., Bajgrowicz, J.A. and Kraft, P. (2001). Fragrance chemistry – Milestones and perspec-tives. Chimia 55: 379–387.
Giberti, G., L. Craker, M. Lorenz, A. Mathé and A. Giulietti (1999). Proceedings of the Second WorldCongress on Medicinal and Aromatic Plants WOCMAP-2. 10–15 November 1997, Mendoza,Argentina, Act. Hort. 502, 408 pp.
Gil, A., E. De La Fuente, A. E. Lenardis, M. L. Pereira, S. A. Suarez, A. Bandoni, C. Van Baren,P. D. L. Lira and C. M. Ghersa (2002). Coriander essential oil composition from two genotypesgrown in different environmental conditions. J. Agric. Food Chem. 50: 2870–2877.
Gill, A. O., P. Delaquis, P. Russo and R. A. Holley (2002). Evaluation of antilisterial action of cilantrooil on vacuum packed ham. Int. J. Food Microbiol. 73: 83–92.
Gomez, N. E. and L. Witte (2001). A simple method to extract essential oils from tissue samples byusing microwave radiation. J. Chem. Ecol. 27: 2351–2359.
Grassi, P., J. Novak, H. Steinlesberger and C. Franz (2002). Changing of Terpene Composition in SinglePeltate Trichomes of Salvia officinalis Leaves by Direct Liquid, Non-equilibrium SPME Application.Poster presentation at ISEO 2002, Lisboa, Portugal.
Grayer, R. J., G. C. Kite, F. J. Goldstone. S. E. Bryan, A. Paton and E. Putievsky (1996). Infraspecifictaxonomy and essential oil chemotypes in sweet basil, Ocimum basilicum. Phytochem. 43: 1033–1039.
Green, C. P. and P. Osborne (1993). Rapid methods for obtaining essential oil from hops. J. Inst.Brew. 99: 335–339.
Guidotti, M. and M. Vitali (1998). Identification of volatile organic compounds in different honeysthrough SPME and GC/MS. Ind. Aliment. 37: 351–353.
Güntzel, U., F. Seidel und H. Kating (1967). Untersuchungen über die Inhaltsstoffe von Arnica-Arten.I. Der Gehalt an ätherischem Öl in den Blüten verschiedener Arnica-Arten. Planta Med. 15: 205–214.[German].
Halva, S. (1987). Yield and aroma of dill varieties (Anethum graveolens L.) in Finland. Act. Agric.Scand. 37: 329–334.
120 Jens Rohloff
Halva, S., R. Huopalahti, C. Franz and S. Makinen (1988). Herb yield and essential oil of dill (Anethumgraveolens L.) at different locations. J. Agric. Sci. Fin. 60: 93–100.
Harmon, A. D. (1997). Solid-phase microextraction for the analysis of flavors. In R. Marsili (ed.),Techniques for analyzing food aromas. Marcel Dekker Inc., New York, pp. 81–112.
Harrewijn, P., A. M. Van Oosten and P. G. M. Piron (2001). Natural Terpenoids as Messengers: AMultidisciplinary Study of Their Production, Biological Functions and Practical Applications. KluwerAcademic Publishers, Dordrecht, 440 pp.
Hay, R. K. M. (1993). Physiology. In R. K. M. Hay and P. G. Waterman (eds.), Volatile oil crops:their biology, biochemistry and production. Longman Scientific & Technical, Harlow, pp. 23–46.
Hay, R. K. M. and K. P. Svoboda (1993). Botany. In R. K. M. Hay and P. G. Waterman (eds.),Volatile oil crops: their biology, biochemistry and production. Longman Scientific & Technical,Harlow, pp. 5–22.
Hill, P. G. and R. M. Smith (2000). Determination of sulphur compounds in beer using headspacesolid-phase microextraction and gas chromatographic analysis with pulsed flame photometric detec-tion. J. Chromatogr. A 872: 203–213.
Hirasa, K. and M. Takemasa (1998). Spice Science and Technology. Marcel Dekker Inc., New York,219 pp.
Ho, W. H. and S. J. Hsieh (2001). Solid phase microextraction associated with microwave assistedextraction of organochlorine pesticides in medicinal plants. Anal. Chim. Act. 428: 111–120.
Holt, R. U. (2001). Mechanisms affecting analysis of volatile flavour components by solid-phasemicroextraction and gas chromatography. J. Chromatogr. A 937: 107–114.
Holt, R. U. (2002). Development of a method for analysing flavour components in strawberry usingsolid phase microextraction and gas chromatography. Act. Hort. 567: 743–746.
Hsu, H.-F. and J.-S. Yang (1996). Production of volatile compounds in suspension cell cultures ofCoriandrum sativum L. and Levisticum officinale Koch. In G. R. Takeoka, R. Teranishi, P. J. Williamsand A. Kobayashi (eds.), Biotechnology for improved foods and flavors. ACS Symp. Ser. 637: 97–108.
Hyötyläinen, T. and M.-L. Riekkola (2002). On-line combinations of pressurized hot-water extractionand microporous membrane liquid-liquid extraction with chromatography. LC·GC Europe. 15:298–306.
Ibanez, E., S. Lopez-Sebastian, E. Ramos, J. Tabera and G. Reglero (1998). Analysis of volatile fruitcomponents by headspace solid-phase microextraction. Food Chem. 63: 281–286.
Illes, V., H. G. Daood, S. Perneczki, L. Szokonya and M. Then (2000). Extraction of coriander seedoil by CO2 and propane at super- and subcritical conditions. J. Supercrit. Fluid 17: 177–186.
Irwin, R. E. and B. Dorsett (2002). Volatile production by buds and corollas of two sympatric, con-familial plants, Ipomopsis aggregata and Polemonium foliosissimum. J.Chem.Ecol. 28: 565–578.
Isman, M. B. (2000). Plant essential oils for pest and disease management. Crop Prot. 19: 603–608.Iversen, T.-H. (1994). Herb production and research in Norway. In Production of herbs, spices and med-
icinal plants in the Nordic Countries. Proceedings of NJF seminar no. 240, Mikkeli, Finland,pp. 12–15.
Iversen, T.-H. and J. Rohloff (1997). Årsrapport for NUP-Prosjekt ‘Sikre kvalitetsanalyser’. AnnualReport 1997 for ‘Norwegian Herb Production (NUP)’. The Plant Biocentre, Department of Botany,Norwegian University of Science and Technology (NTNU), 31 pp. [Norwegian].
Iversen, T.-H. and J. Rohloff (1998). Kvalitetssikring i urteproduksjon – En veiledning for god pro-duksjon av krydderurter og medisinplanter. Report for ‘Norwegian Herb Production (NUP)’. ThePlant Biocentre, Department of Botany, Norwegian University of Science and Technology (NTNU),56 pp. [Norwegian].
Iversen, T.-H. and A. H. Steen (1996). Prøvedyrking og kvalitetsanalyser av sitronmelisse, peppermynte,sakhalinmynte, bergmynte og timian. Annual Report 1995 for ‘Norwegian Herb Production (NUP)’.The Plant Biocentre, Department of Botany, Norwegian University of Science and Technology(NTNU), 38 pp. [Norwegian].
Iversen, T.-H. and A. H. Steen (1997). Årsrapport for delprosjektene ‘Prøvedyrking’ og ‘Sikre kvalitet-sanalyser’. Annual Report 1996 for ‘Norwegian Herb Production (NUP)‘. The Plant Biocentre,Department of Botany, Norwegian University of Science and Technology (NTNU), 58 pp.[Norwegian].
Iversen, T.-H., B. Ansok and A.H. Steen (1994a). Prøvedyrking og kvalitetsundersøkelse av peppermynte
Essential Oil Drugs – Terpene Composition of Aromatic Herbs 121
(Mentha × piperita), oregano (Origanum vulgare) og timian (Thymus vulgaris) i Midt-Norge. AnnualReport 1994 for ‘Norwegian Herb Production (NUP)’. The Plant Biocentre, Department of Botany,Norwegian University of Science and Technology (NTNU), 22 pp. [Norwegian].
Iversen, T.-H., B. Ansok and A. H. Steen (1994b). Prøvedyrking og kvalitetsundersøkelse av kamille(Matricaria chamomilla) og sitronmelisse (Melissa officinalis) i Midt-Norge. Annual Report 1994for ‘Norwegian Herb Production (NUP)’. The Plant Biocentre, Department of Botany, NorwegianUniversity of Science and Technology (NTNU), 17 pp. [Norwegian].
Jaillais, B., V. Bertrand and J. Auger (1999). Cryo-trapping/SPME/GC analysis of cheese aroma. Talanta48: 747–753.
Jarvenpaa, E.P., Z. Y., Zhang, R. Huopalahti and J. W. King (1998). Determination of fresh onion (Alliumcepa L.) volatiles by solid phase microextraction combined with gas chromatography mass spec-trometry. Z. Lebensm. Unters. Forsch. 207: 39–43.
Jelen, H. H., M. Obuchowska, R. Zawirska Wojtasiak and E. Wasowicz (2000). Headspace solid-phase microextraction use for the characterization of volatile compounds in vegetable oils of differentsensory quality. J. Agric. Food Chem. 48: 2360–2367.
Jia, M. Y., Q. H. Zhang and D. B. Min (1998). Optimization of solid-phase microextraction analysisfor headspace flavor compounds of orange juice. J. Agric. Food Chem. 46: 2744–2747.
Jones, G. R. and N. J. Oldham (1999). Pheromone analysis using capillary gas chromatographic tech-niques. J. Chromatogr. A 843: 199–236.
Kac, M. and M. Kovacevic (2000). Presentation and determination of hop (Humulus lupulus L.)cultivars by a min-max model on composition of hop essential oil. Monatsschr. Brauwiss. 53:180–184.
Kalra, A., N. K. Patra, H. P. Singh, H. B. Singh, N. Mengi, A. A. Naqvi and S. Kumar (1999). Evaluationof coriander (Coriandrum sativum) collection for essential oil. Indian J. Agric. Sci. 69: 657–659.
Kapoor, R., B. Giri and K. G. Mukerji (2002). Mycorrhization of coriander (Coriandrum sativum L.)to enhance the concentration and quality of essential oil. J. Sci. Food Agric. 82: 339–342.
Karaisz, K. G. and N. H. Snow (2001). The use of solid phase microextraction/gas chromatography-mass spectrometry for the determination of degradation products of volatile and semivolatilecompounds. J. Microcol. Sep. 13: 1–7.
Kataoka, H. (2002). Automated sample preparation using in-tube solid-phase microextraction and itsapplication – a review. Anal. Bioanal. Chem. 373: 31–45.
Kataoka, H., H. L. Lord and J. Pawliszyn (2000). Applications of solid-phase microextraction in foodanalysis. J. Chromatogr. A 880: 35–62.
Kenny, S. (2000). Headspace solid-phase microextraction for determination of hop essential oils. J.Amer. Soc Brew. Chem. 58: 180–183.
Keskitalo, M. K. (1999). Exploring biodiversity to enhance biodiversity in the genus Tanacetum throughprotoplast fusion. PhD Thesis, Department of Plant Production, Sect. Crop Husbandry, Universityof Helsinki, 113 pp.
Kohlert, C., G. Schindler, R.W. Marz, G. Abel, B. Brinkhaus, H. Derendorf, E. U. Grafe and M. Veit(2002). Systemic availability and pharmacokinetics of thymol in humans. J. Clinic. Pharmacol.42: 731–737.
Koprivnjak, O., L. Conte and N. Totis (2002). Influence of olive fruit storage in bags on oil qualityand composition of volatile compounds. Food Tech. Biotech. 40: 129–133.
Koseki, P. M., A. L. C. H. Villavicencio, M. S. Brito, L. C. Nahme, K. I. Sebastiao, P. R. Rela,L. B. Almeida-Muradian, J. Mancini and P. C. D. Freitas (2002). Effects of irradiation in medic-inal and eatable herbs. Radiat. Phys. Chem. 63: 681–684.
Kovacevic, M. and M. Kac (2001). Solid-phase microextraction of hop volatiles – Potential use for deter-mination and verification of hop varieties. J. Chromatogr. A 918: 159–167.
Kreuzwieser, J., J. P. Schnitzler and R. Steinbrecher (1999). Biosynthesis of organic compounds emittedby plants. Plant Biol. 1: 149–159.
Kribii, R., I. Soustre and F. Karst (1999). Isoprenoids biosynthesis. Act. Bot. Gallica 146: 5–24.Krüger, H. and B. Zeiger (1996). Evaluation of a Fennel Collection by Classical Extraction and Solid
Phase Microextraction Headspace Analysis. Proceedings of the 27th ISEO, Wien, pp. 160–163.Kubeczka, K.-H. (2002). Essential Oils Analysis by Capillary Gas Chromatography and Carbon-13
NMR Spectroscopy. 2nd ed., Wiley, Chichester, 480 pp.
122 Jens Rohloff

Lamikanra, O., O. A. Richard and A. Parker (2002). Ultraviolet induced stress response in fresh cutcantaloupe. Phytochem. 60: 27–32.
Lang, Q. Y. and C.M. Wai (2001). Supercritical fluid extraction in herbal and natural product studies– a practical review. Talanta 53: 771–782.
Lawless, J. (1996). Die illustrierte Enzyklopädie der Aromaöle – Das umfassende Standardwerk derheilenden Öle und Pflanzen. Scherz Verlag, Bern, 255 pp.
Lawrence, B. M. (2002). Commercial essential oils: Truths and consequences. In K. A. D. Swift (ed.),Advances in flavours and fragrances: From the sensation to the synthesis. Royal Society of ChemistryRSC, Cambridge, pp. 57–83.
Lecanu, L., V. Ducruet, C. Jouquand, J. J. Gratadoux and A. Feigenbaum (2002). Optimization ofheadspace solid-phase microextraction (SPME) for the odor analysis of surface-ripened cheese. J.Agric. Food Chem. 50: 3810–3817.
Leven, W. (1988). Qualitative und quantitative chromatographische (DC, GC, HPLC) und photometrischeAnalyse der Sesquiterpenlacton-Führung in Blüten von Arnica acaulis. Doctoral Dissertation,Mathematisch-Naturwissenschaftliche Fakultät; Universität Düsseldorf, 276 pp. [German].
Leven, W. and G. Willuhn (1987). Sesquiterpene lactones from Arnica chamissonis Less. VI.Identification and quantitative determination by high-performance liquid and gas chromatography.J. Chromatogr. 410: 329–342.
Lewinsohn, E., I. Ziv-Raz, N. Dudai, Y. Tadmor, E. Lastochkin, O. Larkov, D. Chaimovitsh,U. Ravid, E. Putievsky, E. Pichersky and Y. Shoham (2000). Biosynthesis of estragole and methyl-eugenol in sweet basil (Ocimum basilicum L.) – Developmental and chemotypic association ofallylphenol O-methyltransferase activities. Plant Sci. 160: 27–35.
Lichtenthaler, H. K. (1999). The 1-deoxy-D-xylulose-5-phosphate pathway of isoprenoid biosynthesisin plants. Ann. Rev. Plant Physiol. Plant Mol. Biol. 50: 47–65.
Ligor, M. and B. Buszewski (1999). Determination of menthol and menthone in food and pharmaceuticalproducts by solid-phase microextraction-gas chromatography. J. Chromatogr. A, 847: 161–169.
Liu, B. Z. (2000). Analysis of volatile constituents of mustard paste by gas chromatography/massspectrometry with solid-phase microextraction and simultaneous distillation and extraction. Chin.J. Anal. Chem. 28: 1489–1492.
Lloyd, S. W., J. M. Lea, P. V. Zimba and C.C. Grimm (1998). Rapid analysis of geosmin and2-methylisoborneol in water using solid phase microextraction procedures. Water Res. 32: 2140–2146.
Lockwood, G. B. (2001). Techniques for gas chromatography of volatile terpenoids from a range ofmatrices. J. Chromatogr. A 936: 23–31.
Lord, H. and J. Pawliszyn (2000). Microextraction of drugs. J. Chromatogr. A 902: 17–63.Louch, D., S. Motlagh and J. Pawliszyn (1992). Dynamics of organic compound extraction from water
using liquid-coated fused silica fibers. Anal. Chem. 64: 1187–1199.Loza-Tavera, H. (1999). Monoterpenes in essential oils – Biosynthesis and properties. Adv. Exp. Med.
Biol. 464: 49–62.Maarse, H. (ed.) (1991). Volatile Compounds in Foods and Beverages: Introduction. Marcel Dekker
Inc., New York, pp. 1–39.MacTavish, H. S., N. W. Davies, and R. C. Menary (2000). Emission of volatiles from brown boronia
flowers: Some comparative observations. Ann. Bot. London 86: 347–354.Maes, K., J. Vercammen, H. Pham-Tuan, P. Sandra and P. C. Debergh (2001). Critical aspects for
the reliable headspace analysis of plants cultivated in vitro. Phytochem. Anal. 12: 153–158.Mallouchos, A., M. Komaitis, A. Koutinas and M. Kanellaki (2002). Investigation of volatiles evolu-
tion during the alcoholic fermentation of grape must using free and immobilized cells with thehelp of solid phase microextraction (SPME) headspace sampling. J. Agric. Food Chem. 50:3840–3848.
Marotti, M., R. Piccaglia, E. Giovanelli, S. G. Deans and E. Eaglesham (1994). Effects of plantingtime and mineral fertilization on peppermint (Mentha × piperita) essential oil composition and itsbiological activity. Flav. Fragr. J. 9: 125–129.
Marriott, P. J., R. Shellie and C. Cornwell (2001). Gas chromatographic technologies for the analysisof essential oils. J. Chromatogr. A 936: 1–22.
Marsili, R. T. (1999a). Comparison of solid-phase microextraction and dynamic headspace methods
Essential Oil Drugs – Terpene Composition of Aromatic Herbs 123

for the gas chromatographic–mass spectrometric analysis of light-induced lipid oxidation productsin milk. J. Chromatogr. Sci. 37: 17–23.
Marsili, R. T. (1999b). SPME-MS-MVA as an electronic nose for the study of off-flavors in milk. J.Agric. Food Chem. 47: 648–654.
Martindale, W. and S. C. Sweetman (eds.) (2002). Martindale: The Complete Drug Reference. 33rdedition, Pharmaceutical Press, London, 2483 pp.
Massoud, H. Y. (1989). Quantiative Vererbung einiger Ertragsmerkmale und der Hauptkomponentendes ätherischen Öles von Kamille, Matricaria chamomilla L. (syn. Chamomilla recutita L.). PhDThesis, Technical University of Munich, Germany.
Matich, A. J. (1999). Analysis of food and plant volatiles. In J. Pawliszyn (ed.), Applications of solidphase microextractions. Royal Society of Chemistry RSC, Cambridge, pp. 349–363.
Matich, A. J., D. D. Rowan and N. H. Banks (1996). Solid phase microextraction for quantitativeheadspace sampling of apple volatiles. Anal. Chem. 68: 4114–4118.
Mazza, G. and T. Cottrell (1999).Volatile components of roots, stems, leaves, and flowers of Echinaceaspecies. J. Agric. Food Chem. 47: 3081–3085.
Millard, J. T., D. W. Comeau, S. Bellavia and J. E. Eckhert (1999). Maximization of the essentialoils in Echinacea purpurea and Valeriana officinalis. Abstr. Pap. Am. Chem. Soc. 217: 649.
Miller, K. G., C. F. Poole and T. M. P. Pawlowski (1996). Classification of the botanical originof cinnamon by solid-phase microextraction and gas chromatography. Chromatographia 42: 639–646.
Miller, M. E. and J. D. Stuart (1999). Comparison of gas-sampled and SPME-sampled static head-space for the determination of volatile flavor components. Anal. Chem. 71: 23–27.
Mills, G. A. and V. Walker (2000). Headspace solid-phase microextraction procedures for gas chro-matographic analysis of biological fluids and materials. J. Chromatogr. A 902: 267–287.
Ming, L. C., L. E. Craker and M. C. Scheffer (2002). Proceedings of the I. Latin-American Symposiumon the Production of Medicinal, Aromatic and Condiments Plants. 30 July to 4 August 2000, SãoPaulo, Brazil, Act. Hort. 569, 320 pp.
Misharina, T. A. (2001). Influence of the duration and conditions of storage on the composition ofthe essential oil from coriander seeds. Appl. Biochem. Microbiol. 37: 622–628.
Moeder, M., S. Schrader, M. Winkler and P. Popp (2000). Solid-phase microextraction(gas chro-matography-mass spectrometry of biologically active substances in water samples. J. Chromatogr.A 837: 95–106.
Moeller, M. R. and T. Kraemert (2002). Drugs of abuse monitoring in blood for control of drivingunder the influence of drugs. Ther. Drug Monit. 24: 210–221.
Muranyi, Z. and Z. Kovacs (2000). Statistical evaluation of aroma and metal content in Tokay wines.Microchem. J. 67: 91–96.
Müller, L., T. Górecki, and J. Pawliszyn (1999). Optimization of the SPME device design for field appli-cations. Fresenius J. Anal. Chem. 364: 610–616.
Nagata, T. and Y. Ebizuka (eds.) (2002). Medicinal and aromatic plants XII. In Biotechnology inagriculture and forestry Vol. 51. Springer Verlag, Heidelberg, 348 pp.
Namiesnik, J., B. Zygmunt and A. Jastrzebska (2000). Application of solid-phase microextraction fordetermination of organic vapours in gaseous matrices. J. Chromatogr. A 885: 405–418.
Nilsson, T., F. Pelusio, L. Montanarella, B. Larsen, S. Facchetti and J. Øgaard Madsen (1995). Anevaluation of solid-phase microextraction for analysis of volatile organic compounds in drinkingwater. HRC-J. High Res. Chromatogr. 18: 617–629.
Nishimura, H. and Y. Noma (1996). Microbial transformation of monoterpenes: Flavor and biologicalactivity. In G. R. Takeoka, R. Teranishi, P. J. Williams and A. Kobayashi (eds.), Biotechnologyfor improved foods and flavors. ACS Symp. Ser. 637: 173–187.
Ong, P. K. C. and T. E. Acree (1999). Similarities in the aroma chemistry of Gewürztraminer varietywines and lychee (Litchi chinesis Sonn.) fruit, J. Agric. Food Chem. 47: 665–670.
Page B. D. and G. Lacroix (2000). Analysis of volatile contaminants in vegetable oils by headspacesolid-phase microextraction with Carboxen-based fibres. J. Chromatogr. A 873: 79–94.
Page, B. D. (1999). Analysis of volatile contaminants in foods. In J. Pawliszyn (ed.), Applications ofsolid phase microextraction. Royal Society of Chemistry RSC, Cambridge, pp. 423–434.
Paniandy, J. C., J. Chane-Ming and J. C. Pieribattesti (2000). Chemical composition of the essential
124 Jens Rohloff

oil and headspace solid-phase microextraction of the guava fruit (Psidium guajava L.). J. Ess. OilRes. 12: 153–158.
Pawliszyn, J. (2001). Solid phase microextraction. Adv. Experim. Med. Biol. 488: 73–87.Pawliszyn, J. (ed.) (1999). Quantitative aspects of SPME. In Applications of solid phase microextrac-
tion. Royal Society of Chemistry RSC, Cambridge, pp. 3–21.Penton, Z. (1994). Flavor analysis of a fruit beverage with automated solid phase microextraction. Varian
Applic. Note 51.Penton, Z. (1995). Characterization of flavor components in wines with solid phase microextraction
(SPME), GC and GC/MS. Varian Applic. Note 6, 5 pp.Peterson, C., J. W. Zhu and J. R. Coats (2002). Identification of components of Osage orange fruit
(Maclura pomifera) and their repellency to German cockroaches. J. Essent. Oil Res. 14: 233–236.Pettersson, E. M. (2001). Volatiles from potential hosts of Rhopalicus tutela, a bark beetle parasitoid.
J.Chem.Ecol. 27: 2219–2231.Pham-Tuan, H., J. Vercammen and P. Sandra (2001). A versatile robotic arm for static headspace
sampling with SPME. LC·GC Europe 4: 8 pp.Piel, J., J. Donath, K. Bandemer and W. Boland (1998). Mevalonate-independent biosynthesis of
terpenoid volatiles in plants – induced and constitutive emission of volatiles. Angew. Chem. 37:2478–2481.
Pino, J. A. (1999a). Volatile compounds of spices: 11. Basil. Alimentaria 36: 91–94.Pino, J. A. (1999b). Volatile compounds of spices: 13. Dill. Alimentaria 36: 99–102.Pino, J. A. (1999c). Volatile compounds of spices: 1. Extraction methods and analysis. Alimentaria
36: 39–45.Pino, J. A., P. Borges and E. Roncal (1993). Compositional differences of coriander fruit oils from
various origins. Nahrung 37: 119–122.Pino, J. A., A. Rosado, I. Goire and E. Roncal (1995). Evaluation of flavor characteristic compounds
in dill herb essential oil by sensory analysis and gas-chromatography. J. Agric. Food Chem. 43:1307–1309.
Potter, T. L. (1996). Essential oil composition of cilantro. J. Agric. Food Chem. 44: 1824–1826.Pozo-Bayon, M. A., E. Pueyo, P. J. Martin-Alvarez and M. C. Polo (2001). Polydimethylsiloxane
solid-phase microextraction-gas chromatography method for the analysis of volatile compounds inwines – its application to the characterization of varietal wines. J. Chromatogr. A 922: 267–275.
Price, S. and N. Price (1999). Aromatherapy for Health Professionals. Churchill Livingstone, London,390 pp.
Quintanilla, P. (2002). Biological control in potato and tomato to enhance resistance to plant pathogens– especially against Phytophtora infestans in potato. Doctoral thesis at the Swedish University ofAgricultural Sciences, Uppsala, Sweden.
Quintanilla, P., J. Rohloff and T.-H. Iversen (2002). Influence of essential oils on Phytophtora infes-tans. Potato Res. 45: 13 pp.
Richards, H. M. J (1991). Spices and condiments I. In H. Maarse (ed.), Volatile compounds in foodsand beverages. Marcel Dekker Inc., New York, pp. 411–447.
Rinn, W. (1970). Isobuttersäure – Hauptbestandteil des ätherischen Öles der Rhizome und Wurzelnvon Arnica chamissonis. Planta Med. 18: 147–149 [German].
Roberts, D. D. and P. Pollien (1997). Analysis of aroma release during microwave heating. J. Agric.Food Chem. 44: 4388–4392.
Rocha, S., V. Ramalheira, A. Barros, I. Delgadillo and M. A. Coimbra (2001). Headspace solidphase microextraction (SPME) analysis of flavor compunds in wines. Effects of the matrix volatilecomposition in the relative response factors in a wine model. J. Agric. Food Chem. 49: 5142–5151.
Rodrigues, R. A. F., C. L. Queiroga, M. V. N. Rodrigues, M. A. Foglio, A. Sartoratto and I. Montanari(2002). Study of the variation of the composition of the essential oil of leaves and flowers ofAchyrocline alata (DC) along a period of the day. J. Essent. Oil Res. 14: 280–281.
Rohloff, J. (1999). Monoterpene composition of essential oil from peppermint (Mentha × piperita L.)with regard to leaf position using solid-phase microextraction and gas chromatography/mass spec-trometry analysis. J. Agric. Food Chem. 47: 3782–3786.
Rohloff, J. (2002a). Essential oil composition of sachalinmint from Norway detected by solid-phase
Essential Oil Drugs – Terpene Composition of Aromatic Herbs 125

microextraction and gas chromatography-mass spectrometry analysis. J. Agric. Food Chem. 50:1543–1547.
Rohloff, J. (2002b). Volatiles from rhizomes of Rhodiola rósea L. Phytochem. 59: 655–661.Rohloff, J., S. F. Hagen and T.-H. Iversen (2002a). The effect of plant biochemical regulators on
strawberry production in field trials under drip irrigation management at 5 locations in Norway.Act. Hort. 567: 463–466.
Rohloff, J., R. Nestby, J. A. Folkestad and T.-H. Iversen (2002b). Influence of rain cover cultivationon taste and aroma quality of strawberries (Fragaria ananassa Duch.). J. Sci. Food Agric [submitted].
Rohloff, J., G. Rakvåg and S. Dragland (2002c). Aroma Volatiles of Rhizomes and Roots of CultivatedRhodiola rosea L. from Norway. Poster presentation at ISEO 2002, Lisboa, Portugal.
Rohloff, J., E. B. Skagen, A. H. Steen and T.-H. Iversen (2000a) Production of yarrow (Achilleamillefolium L.) in Norway: Essential oil content and quality. J. Agric. Food Chem. 48: 6205–6209.
Rohloff, J., E. B. Skagen, A. H. Steen, T. Beisvag and T.-H. Iversen (2000b). Essential oil composi-tion of Norwegian peppermint (Mentha × piperita L.) and sachalinmint [Mentha sachalinensis (Briq.)Kudo]. Act. Agric. Scand. B 50: 161–168.
Rohmer, M., M. Seemann, S. Horbach, S. Bringer-Meyer and H. Sahm (1996). Glyceraldehyde3-phosphate and pyruvate as precursors of isoprenic units in an alternative non-mevalonate pathwayfor terpenoid biosynthesis. J. Am. Chem. Soc. 118: 2564–2566.
Rouseff, R. and K. Cadwallader (2001). Headspace techniques in foods, fragrances and flavors – anoverview. Adv. Experim. Med. Biol. 488: 1–8.
Rouseff, R., R. Bazemore, K. Goodner and M. Naim (2001). GC-olfactometry with solid phase microex-traction of aroma volatiles from heated and unheated orange juice. Adv. Exp. Med. Biol. 488: 101–112.
Ruiz, J., J. Ventanas and R. Cava (2001). New device for direct extraction of volatiles in solid samplesusing SPME. J. Agric. Food Chem. 49: 5115–5121.
Saglam, H., T. Gozler, B. Kivcak, B. Demirci and K. H. C. Baser (2001). Volatile compounds fromHaplophyllum myrtifolium. Chem. Nat. Comp. 37: 442–444.
Sala, C., M. Mestres, M. P. Marti, O. Busto and J. Guasch (2000). Headspace solid-phase microex-traction method for determining 3-alkyl-2-methoxypyrazines in musts by means ofpolydimethylsiloxane-divinylbenzene fibres. J. Chromatogr. A 880: 93–99.
Sandra, P. and C. Bicchi (eds.) (1987). Capillary Gas Chromatography in Essential Oil Analysis. Dr.Alfred Huethig Verlag, Heidelberg, Germany, 435 pp.
Sandra, P., F. David and J. Vercammen (2002). New developments in sorptive extraction for the analysisof flavours and fragrances. In K. A. D. Swift (ed.), Advances in flavours and fragrances: Fromthe sensation to the synthesis. Royal Society of Chemistry RSC, Cambridge, pp. 27–38.
Sangwan, N. S., A. H. A. Farooqi, F. Shabih, R. S. Sangwan (2001). Regulation of essential oil pro-duction in plants. Plant Growth Regulation 34: 3–21.
Schäfer, B., P. Hennig and W. Engewald (1995). Analysis of monoterpenes from conifer needlesusing solid phase microextraction. HRC-J. High Res.Chromatogr. 18: 587–592.
Schmidt, C. O. (1998). Biosynthese der Sesquiterpene (+)-Germacren, (–)-Germacren D und (–)-α-Gurjunen in Solidago canadensis – Enzymisolierungen und Aufklärung der Bildungsmechanismen.PhD Thesis, Fachbereich Chemie, Universität Hamburg, 178 pp.
Schneider, R., A. Razungles, C. Augier and R. Baumes (2001). Monoterpenic and norisoprenoidicglycoconjugates of Vitis vinifera L. cv. Melon B. as precursors of odorants in Muscadet wines. J.Chromatogr. A 936: 145–157.
Schulthess, B. H., E. Giger and T. W. Baumann (1991). Echinacea – anatomy, phytochemical patternand germination of the achene. Planta Med. 57: 384–388.
Sedlakova, J., E. Matisova and M. Slezackova (1998). Solid-phase microextraction and its utilizationin environmental analysis. Chemicke Listy 92: 633–642.
Servili, M. R. Selvaggini, A. Taticchi, A. L. Begliomini and G. Montedoro (2000). Relationships betweenthe volatile compounds evaluated by solid phase microextraction and the thermal treatment of tomatojuice: Optimization of the blanching parameters. Food Chem. 71: 407–415.
Shang, C. Q., C. H. Deng, X. Y. Zhang, Z. F. Chen and Y. M. Hu (2002). Headspace solid-phasemicroextraction and gas chromatography-mass spectrometry analysis of free volatile compoundsin mango. Chromatographia 55: 737–741.
126 Jens Rohloff

Sheen, L. Y., Y. H. T. Ou and S. J. Tsai (1991). Flavor characteristic compounds found in the essen-tial oil of Ocimum basilicum L. with sensory evaluation and statistical-analysis. J. Agr. FoodChem. 39: 939–943.
Sides, A., K. Robards and S. Helliwell (2000). Developments in extraction techniques and their appli-cation to analysis of volatiles in foods. TRAC-Trend. Anal. Chem. 19: 322–329.
Sides, S. L., K. B. Polowy, A. D. Thornquest and D. J. Burinsky (2001). Identification of a pharma-ceutical packaging off-odor using solid-phase microextraction gas chromatography/massspectrometry. J. Pharmaceut. Biomed. Anal. 25: 379–386.
Siegmund, B., K. Derler and W. Pfannhauser (2001). Changes in the aroma of a strawberry drinkduring storage. J. Agric Food Chem. 49: 3244–3252.
Silva, M. G. D., A. A. Craveiro, F. J. A. Matos, M. I. L. Machado and J. W. Alencar (1999). Chemicalvariation during daytime of constituents of the essential oil of Ocimum gratissimum leaves.Fitoterapia 70: 32–34.
Smallfield, B. M., J. W. Van Klink, N. B. Perry and K. G. Dodds (2001). Coriander spice oil: Effectsof fruit crushing and distillation time on yield and composition. J. Agric. Food Chem. 49: 118–123.
Snow, N. H. (2000). Solid-phase micro-extraction of drugs from biological matrices. J. Chromatogr.A 885: 445–455.
Stashenko, E. E., M. A. Puertas and J. R. Martinez (2002). SPME determination of volatile aldehydesfor evaluation of in-vitro antioxidant activity. Anal. Bioanal. Chem. 373: 70–74.
Stausberg, S. (1994). Untersuchungen zur Inhaltsstofführung der unterirdischen Organe von Arnicachamissonis ssp. foliosa. Doctoral Dissertation, Mathematisch-Naturwissenschaftliche Fakultät,Universität Düsseldorf, Germany, 217 pp. [German].
Steffen, A. and J. Pawliszyn (1996). Analysis of flavor volatiles using headspace solid-phase microex-traction. J. Agric. Food Chem. 44: 2187–2193.
Strunz, M., G. Puschmann, V. Stephani and D. Fritz (1992). Chemical variability of dill (Anethum grave-olens L.). Gartenbauwiss. 57: 190–192.
Sugawara Y, C Hara, K Tamura, T. Fujii, K. Nakamura, T. Masujima and T. Aoki (1998). Sedativeeffect on humans of inhalation of essential oil of linalool: Sensory evaluation and physiological mea-surements using optically active linalools. Anal. Chim. Acta 365: 293–299.
Supelco (1998). Solid phase microextraction: Solventless sample preparation for monitoring flavor com-pounds by capillary gas chromatography. Supelco Bulletin 869A, 8 pp.
Supelco (2001). SPME Applications Guide. Supelco Bulletin 925B, 3rd ed., 62 pp.Theodoridis, G., E. H. M. Koster and G. J. De Jong (2000). Solid-phase microextraction for the
analysis of biological samples. J. Chromatogr. B 745: 49–82.Tisserand, R. B. and T. Balacs (1995). Essential Oil Safety: A Guide for Health Care Professionals.
Churchill Livingstone, London, 279 pp.Ulrich, D., S. Eunert, E. Hoberg and A. Rapp (1995). Analyse des Erdbeeraromas mittels Festphasen-
Mikroextraktion. Dt. Lebensm. Runds. 91: 349–351.Ulrich, D., A. Krumbein and A. Rapp (1997). Analysis of aroma compounds in strawberry, sour
cherry and tomato by gas chromatography after solid-phase micro extraction. Dt. Lebensm. Rundsch.93: 311–316.
Ulrich, S. (2000). Solid-phase microextraction in biomedical analysis. J. Chromatogr. A 902: 167–194.Vas, G., K. Koteleky, M. Farkas, A. Dobo and K. Vekey (1998). Fast screening method for wine
headspace compounds using solid – phase microextraction (SPME) and capillary GC technique.Am. J. Enol. Viticult. 49: 100–104.
Vercammen, J, P. Sandra, T. Sandra and F. David (2000). Considerations on static and dynamic andadsorptive sampling to monitor volatiles emitted by living plants. HRC-J. High Res. Chromatogr.23: 547–553.
Vereen, D. A., J. P. McCall and D. J. Butcher (2000). Solid phase microextraction for the determina-tion of volatile organics in the foliage of Fraser fir (Abies fraseri). Microchem. J. 65: 269–276.
Verhoeven, H., T. Beuerle and W. Schwab (1997). Solid-phase microextraction: artefact formationand its avoidance. Chromatographia 46: 63–66.
Verzera, A., S. Campisi, M. Zappalà and I. Bonaccorsi (2000). SPME-GC/MS Analysis of Honey VolatileComponents for the Characterization of Different Floral Origin. Presentation at the 23rd ISCC, RivaDel Garda, Italy, 6 pp.
Essential Oil Drugs – Terpene Composition of Aromatic Herbs 127
Vianna, E. and S. E. Ebeler (2001). Monitoring ester formation in grape juice fermentations usingsolid phase microextraction coupled with gas chromatography-mass spectrometry. J. Agric FoodChem. 49: 589–595.
Voirin, B., N. Brun and C. Bayet (1990). Effects of day length on the monoterpene composition of leavesof Mentha × piperita. Phytochem. 29: 749–755.
Wagner, H. (1995). Immunostimulants of plant-origin. Croat. Chem. Act. 68: 615–626.Wan, X. M., R. J. Stevenson, X. D. Chen and L. D. Melton (1999). Application of headspace solid-
phase microextraction to volatile flavour profile development during storage and ripening of kiwifruit.Food Res. Int. 32: 175–183.
Wang, Y. W., M. Bonilla, H. M. McNair and M. Khaled (1997). Solid phase microextraction associ-ated with microwave assisted extraction of food products. HRC-J. High Res. Chromatogr. 20:213–216.
Waterman P. G. (1993). The chemistry of volatile oils. In R. K. M. Hay and P. G. Waterman (eds.),Volatile oil crops: Their biology, biochemistry and production. Longman Scientific & Technical,Harlow, pp. 47–61.
Watson, S. B., B. Brownlee, T. Satchwill and E. McCauley (1999). The use of solid phase microex-traction (SPME) to monitor for major organoleptic compounds produced by chrysophytes in surfacewater. Water Sci. Technol. 40: 251–256.
Wennrich, L., P. Popp, G. Koller and J. Breuste (2001). Determination of organochlorine pesticidesand chlorobenzenes in strawberries by using accelerated solvent extraction combined with sorptiveenrichment and gas chromatography/mass spectrometry. J. AOAC Int. 84: 1194–1201.
Wichtl, M. (ed.) (2002). Teedrogen und Phytopharmaka: Ein Handbuch für die Praxis auf wis-senschaftlicher Grundlage. 4th ed., Wissenschaftliche Verlagsgesellschaft WVG mbH, Stuttgart,706 pp. [German].
Willuhn, G. (1972). Untersuchungen über die Inhaltsstoffe von Arnica. VII. Die Zusammensetzungdes ätherischen Öles aus den unterirdisen Organen und Blütenkörbchen verschiedener Arnica-Arten. Planta Med. 22: 1–33 [German].
Willuhn, G. and W. Leven (1991). Zur qualitativen und quantitativen Analyse der Sesquiterpenlactonevon Arnikablüten. Pharm. Ztg. Wisss. 136: 32–39 [German].
Wirthensohn, M. G., M. Sedgley and G. P. Jones (2000). Epicuticular wax of juvenile Eucalyptus leavesand headspace analysis of leaf volatiles. J. Essent. Oil Res. 12: 401–411.
Wust, M. and A. Mosandl (1999). Important chiral monoterpenoid ethers in flavours and essentialoils – enantioselective analysis and biogenesis. Eur. Food Res. Technol. 209: 3–11.
Wust, M., T. Beck, A. Dietrich and A. Mosandl (1996). On the biogenesis of rose oxide in Pelargoniumgraveolens L’Heritier and Pelargonium radens H. E. Moore. Enantiomer 1: 167–176.
Yang, X. and T. Peppard (1994). Solid-phase microextraction for flavor analysis. J. Agric. FoodChem. 42: 1925–1930.
Yang, X. and T. Peppard (1995). SPME of flavor compounds – a comparison of two fiber coatingsand discussion of the rules of thumb for adsorption. LC·GC Europe 13: 882–886.
Yousif, A. N., C. H. Scaman, T. D. Durance and B. Girard (1999). Flavor volatiles and physical prop-erties of vacuum-microwave- and air-dried sweet basil (Ocimum basilicum L.). J. Agric. Food Chem.47: 4777–4781.
Zabaras, D. and S. G. Wyllie (2001). Quantitative analysis of terpenoids in the gas phase using head-space solid-phase microextraction (HS-SPME). Flav. Fragr. J. 16: 411–416.
Zekovic, Z., B. Pekic, Z. Lepojevic and L. Petrovic (1994). Chromatography in our investigations ofchamomile (Matricaria chamomilla L.). Chromatographia 39: 587–590.
Zhang, Z. and J. Pawliszyn (1993). Headspace solid-phase microextraction. Anal. Chem. 65: 1843–1852.Zini, C. A., F. Augusto, E. Christensen, B. P. Smith, E. B. Caramão and J. Pawliszyn (2001). Monitoring
biogenic volatile compounds emitted by Eucalyptus citriodora using SPME. Anal. Chem. 73:4729–4735.
Zini, C. A., H. Lord, E. Christensen, T. F. De Assis, E. B. Caramão and J. Pawliszyn (2002). Automationof solid-phase microextraction–gas chromatography-mass spectrometry extraction of eucalyptusvolatiles. J. Chromatogr. Sci. 40: 140–146.
128 Jens Rohloff

INTEGRAL HANDLING OF BANANA
LOURDES YAÑEZ, MIGUEL ARMENTA AND EFRAIN MERCADOUniversidad Autónoma Metropolitana, México, D.F.
ELHADI M. YAHIAFacultad de Química, Universidad Autónoma de Querétaro, 76010, Querétaro
PORFIRIO GUTTIERREZInstituto Tecnológico de Tepic, Nayarit, México
1. INTRODUCTION
Banana is one of the most important crops in the world. Over 10 million ha ofbananas are grown, with a total production of more than 68 million metric tons, fromwhich a little more than 10% is exported (Table 1). India is the principal worldbanana producer (16 million metric tons, 23% of world production), followed byEcuador (7.5 million tons, 11% of world production), Brazil (5.7 million tons,8.4% of world production), China (5.4 million tons., 7.9% of world production),Philippines (5.06 million tons., 7.4% of world production), Indonesia (3.6 milliontons, 5.2% of world production), Costa Rica (2.2 million tons, 3.3% of world pro-duction), and Mexico (2.0 million tons, a 2.9% of world production (FAO, 2001).
Bananas tolerate different weather ranges from the Temperate Rain Forest(12–18 °C, with 1000–1200 mm precipitation), up to the Tropical Dry Forest (morethan 24 °C; 400–800 mm precipitation). They are grown in Africa, India, Centraland South America under ideal temperature conditions (25–30 °C). Growth tem-perature should not be lower than 15 °C and the highest temperature should notexceed 35 °C (Robinson, 1996).
R. Dris and S. M. Jain (eds.), Production Practices and Quality Assessment of Food Crops,
© 2004 Kluwer Academic Publishers. Printed in the Netherlands.
129
Table 1. Total production (1000 MT) of bananas in the world and in someselected countries (FAO, 2001).
Total world production 68,651.3India 16,000.0Ecuador 07,561.2Brazil 05,744.2China 05,393.0Philippines 05,060.8Indonesia 03,600.0Costa Rica 02,270.0México 01,976.7Thailand 01,720.0Burundi 01,548.9Colombia 01,380.5Viet Nam 01,125.5Venezuela 01,050.0
Vol. 3, “Quality Handling and Evaluation”, pp. 129–168.

Banana (Musa spp. group AAB) is a perennial giant herbaceous plant, withroots, rhizome stem or bulb type, and some adventitious roots. Roots are 5 to8 mm in diameter and two or more meters high. Secondary roots are numerous,but they are weak and have low penetration strength (1.5 m deep). This is one ofthe reasons why banana plants cannot grow in stone or clay soils (Belalcazar,1991). They are propagated by one or more pseudostems, sometimes of large size,each at flowering stage. Leaves are oval shaped, their apical end is conical, theircolour is normally dark green at the upper part and light green in the lower part,they are arranged in a spiral fashion and they are base sheathed, long, big, and strong.They tear down transversally due to high winds. The terminal inflorescence emergesfrom the sheathed foliage, as a straight or bended spike, carrying flower clustersunder wide and reddish bracts (Israelí and Lahav, 1987; Belalcazar, 1991). Whena plant is totally developed, an acorn-shaped flower appears at the upper part, amongthe leaves. Flowers are arranged in clusters, 12 to 20 per nodule, in two row groupsnamed ‘hands’. They are unisexual; the upper clusters rachis acts as male flowers,the ones at the lower part act as female flowers and give rise to fruit formation.The calyx is tubular, and the corolla is represented by an opposite petal, whole ordentate; they generally have 6 stamens and one stamminoid, depending on the varietyand growing conditions. They grow from the pseudostem base towards their apicalend in a month, with a mean growing rate of 8 cm per day. The fruit is a bigcylindrical berry, containing many ovules, but no seeds (Salunkhe and Desai,1984). Its development is determined exclusively by pulp accumulation in the cavityformed by the inner pericarp walls. Banana fruits curve upwards (e.g. Gros Michel)in contrast to bunch growth. In most cultivars, fruits stick out in all directions,making their transport difficult (Salunkhe and Desai, 1984). Bananas are vegeta-tively propagated (Morton, 1987; Belalcazar, 1991). The total vegetative phase isaccomplished in 5 to 6 months, reproductive phase lasts 12 to 15 months and pro-ductive phase may last up to 10 months, 4 of which for the development of fruitclusters filling (Belalcazar, 1991; Montero, 1998).
Bananas can be processed into a variety of products, such as dried or fried bananachips, dried banana powder, flakes, juice, puree, and jam. In Africa bananas are con-verted into beer with high vitamin content.
Water is one of the main components of bananas (Table 2). The energetic contentper 100 gr of edible tissue is of 389 kJ and 92 kcal. Table 2 indicates its chemicalcomposition (Belalcazar, 1991; Terranova, 1995; Senser and Scherz, 1999).
2. BANANA PLANTATION MANAGEMENT
2.1. Propagation
Banana propagation is achieved by means of bulbs that come from fructiferousbranches. If it is the second time or more that propagation is made, it is importantto prune buds and preserve just one, which produces a vigorous bulb. By doingthis, soil is used in a homogeneous way and the selected bud makes good use ofthe bulb’s nutritive reserves. It is always desirable to establish a homogeneous
130 Lourdes Yañez et al.

plant distribution in all plantations. Each banana plant must have an amount ofgrowing surface such that its leaves are sun-illuminated. Planting is commonly madein a rectangle or square due to the advantages it represents. The vegetative tipmust be very superficial, hence the bulb must be sown no more than 60 cm deepin well-drained soil, or 40 cm deep in even soils. Bulbs should be homogeneousin size to avoid any competition from neighbouring bulbs (Champion, 1986; CCIA,1996).
Banana fruit development exhibits a sigmoid curve. This means that its growingpattern has three phases. A logarithmic phase in which its size (V) increases expo-nentially with time (t); its growth rate (dV/dt) is slow at the beginning; then thegrowth rate continuously increases. This phase is influenced by the constant activityof the apical meristem. Finally, the senescence phase is characterised by a decreasinggrowth rate as the plant reaches maturity and begins to senesce. In a newly estab-lished plantation, the vegetative cycle is closely related to soil properties, weather,and other factors. In recently sown fields, the vegetative cycle (from anthesis throughharvest) can be from 16 to 18 months at temperature averaging 22 °C, while itmay take 10 to 12 months in temperatures averaging 28 °C (Montero, 1998).
2.2. Irrigation
It is assumed that each plant at the time of harvest contains about 200 Kg ofvegetative material, from which approximately 90% is water. Therefore, an adequatecontinuous water supply is important. A great part of fruit size and weight dependon the water supply. Therefore, irrigation and drainage are important for waterequilibrium during crop development (Montero, 1998).
Irrigation techniques require knowledge of soil features. It is possible to reducewater usage and irrigation frequency. Care must be taken in attaining such period-icity in periods of irregular precipitation. Sprinkling is the most commonly used
Integral Handling of Banana 131
Table 2. Chemical composition of bananas.
Water 061–70% Vitamin B1 045c
Protein 001.1% Vitamin B2 055c
Lipids 000.2% Vitamin B6 370c
Carbohydrates 027–36% Biotine 006c
Sucrose 010.4a Folic acid 020c
Crude fiber 000.6% Vitamin C 012b
Minerals 001.0% Malic acid 360b
Calcium 005–8b Citric acid 012b
Phosphorous 030b Sodium 001b
Iron 000.50b Potassium 395b
Thiamine 000.07b Magnesium 530c
Riboflavin 000.03b Chloride 110b
Niacin 000.50b Copper 130c
Vitamin A 540 UI Zinc 220c
Carotenes 230c Manganese 530c
Vitamin E 270c Iodine 003c
a g/100g, b mg/100g, c µg/100g.

technique in several countries. It is suggested that overnight irrigation be used toavoid high evaporation losses. Underground irrigation has been adopted in placeswhere ‘Gros Michel’ plantation density is low; however, where densities are high,pseudostems represent obstacles that can cause irregular watering. Sprinkler systemestablishment is possible when plantations have adequate water supplies. Water flowrates determine the number of sprinklers that can work simultaneously. Soil hydro-logical characteristics will indicate irrigation time and frequency (Champion, 1986).
Superficial irrigation is convenient in permeable soils with a high capacity; inporous soils drainage losses can be very high. Regular water distribution can be adifficult task. This system is convenient when water resources are abundant andcheap as well as whenever there is good gravity water flow availability. Water freelyspreads all over the surface. Changes are followed and settled either in the soilitself or in cement trenches following the land topography. In The Canary Islands,narrow terracing is advantageous in places with pronounced slopes. Wells areestablished along 10–20 m long terraces bordering 2–3 wide soil margins. Slight,regular slopes are empirically determined in such a way that water arrives at thestrip at a regular pace. In Guinea, a circular bucket is sometimes used as an irri-gation system for each banana plant (Champion, 1986).
Plant root development and cluster holding requires suitable drainage. A problemresulting from poor drainage is plant rot and wilting. However, plant response towater excess can be confused with nutritional deficiencies expressed in leaf dis-coloration such as chlorosis or yellowing and colour loss (Montero, 1998). Whenit is possible to eliminate water at the surface, this operation is called superficialdrainage, and when it is made underground it is called sub-superficial drainage.
2.3. Fertilisation
Nitrogen is the most important element in banana plantations. This element alsoaffects flavour, and its deficiency is associated with off-flavours, i.e. when nitrogensupply is restricted (0.25 Kg nitrogen per plant) ‘earthy’ or ‘musty’ off-flavourdevelop in ‘Valery’ bananas, and when 5 Kg of nitrogen are provided per plant,flavour can be very good, even excellent (Palmer, 1980). It is preferable to designfertilisation plans based on foliar and soil analysis, along with other horticulturalpractices to insure excellent quality (Montero, 1998). Special attention must bepaid to microflora, organic matter content, and other soil physical and chemical char-acteristics, in order to find out its fertility status as well as land and plant productivitypotential, nutrient availability, their function, nutritional requirements, ways ofnutrient application, and humus and organic material supply to the used soil (CCIA,1996; Montero, 1998).
This operation consists of cutting all folded leaves, which are useless to theplant to avoid free cluster development (protective defoliation) and all those affectedby yellow or black sigatoka disease (sanitary defoliation) (Laville, 1977; Montero,1998). Defoliation must be performed weekly from the appearance of two to threehands in the stem to avoid leaf damage to the hands.
132 Lourdes Yañez et al.
2.4. Sanitary measures
Diseases, pests and weeds constitute natural risks the producer must face in anycultivated species. Their attacks not only cause a decrease in production but alsoaffect fruit quality (Compañía Frutera de Sevilla, 1995). Diseases are more impor-tant causes of losses in bananas than pests. The most important diseases that damagebananas include:
1. Banana disease or banana wilt, which is caused by soil-borne fungus and usuallyresults in the death of the entire plant. ‘Cavendish’ varieties are resistant to thisdisease.
2. Sigatoka disease or leaf spot is caused by an air-borne fungus that attacks theleaves and reduces the area available for photosynthesis.
3. Bacterial wilt or Moko disease is similar to Panama disease in external systems.Infected plants generally die, and if they survive the bunches will show prema-ture ripening and rotting of the isolated fingers.
4. Bunchy top is a viral disease that results in vegetative stunning and abnormalfruit bunch development, often splitting the pseudostem before they emerge.The fruit of infected plants are commonly small and unsalable.
2.5. Fumigation
In order to protect fruit against insect-transmitted fungal diseases, clusters arefumigated weekly after defoliation once two to three hands in the stem are apparent.Clusters should be wrapped in perforated polyethylene sacs after each fumigation.Thiabendazol (Mertect 340) is used as a fungicide applied at 200 ppm to 400 ppmdepending on the season. Sprayed fungicide should be evenly applied on all surfacesof a cluster (Champion, 1986). Also, when fruits start to develop, Aldicarb (CA-MM, Gran. 15 formulation, 15.0–20.0 g/Ha), Carbaril (CC-MM, PH 80 formulation,1.5 Kg/Ha) or Diazinón (FH-SE PH 25 formulation, 1.5–2.0 Kg/Ha) are appliedto avoid the attack of thrips (Frankliniella parvula or Thysanoptera: thripidae).Thrips thrust their stylets into the small, developing fruits where they place theireggs, and, as a consequence, low quality fruits are produced. Insects feed fromthe fruit peel, which then exhibits small dark spots. Severe attacks make the peelrough and cracked, as well as causing a dry pulp. These insects are present allyear round and so their population numbers fluctuate, but in some seasons gener-ations overlap. Such insect population increments are found every 30 days (Lagunesand Rodríguez, 1988).
One of the most economically important causes of fruit losses is the presenceof Micosphaerella fijiensis M, a fungus that attacks banana plant leaves, anddecreases yield from a 50 to a 100% in Nayarit, Mexico. Control methods arevery expensive, therefore the use of tolerant genotypes, such as FHIA-01 and FHIA-2, has been successfully evaluated. Production costs might be reduced and importantincreases in yield could be obtained.
De Costa and Subasinghe (1998) have studied the possibility of using bacterialisolates associated with the fruit skin of banana as potential biological control agents
Integral Handling of Banana 133

of postharvest fruit diseases. They reported that the bacterial antagonists inhibitedgrowth of Fusarium sppm, C. musae, Botryodiplodia sp., and Ceratocystys paradoxa,and the pathogens of crown rot disease, by 30–42% under in vitro conditions.
2.6. Pruning
This operation is very important for adequate selection of the type of buds to guar-antee production continuity. The 1–3 most vigorous buds are chosen for eachproductive unit, taking care to maintain good proportionality in light and distancebetween plants to improve luminosity effects on photosynthetic activity. Therefore,good illumination is needed to optimise cluster development as well as the othervegetative formed. Pruning is usually made by means of a sharp, disinfected knifethat allows removal of non-convenient buds (Montero, 1998).
2.7. Deflowering or ‘deacorning’
In some Latin American countries, male banana flowers are called ‘Acorns’. Oncethese flowers have accomplished their reproductive functions, they stay on theplant taking nutrient resources away from the rest of the plant, especially from femaleflowers, which hold banana fruits. In order to avoid this type of competition fornutrients, male flowers must be removed, preferably by hand. This task alsodecreases the incidence of ‘moko’ disease, caused by Pseudomona solanacearumbacteria, transmitted by insects, which could live on diseased male plants. This oper-ation causes an increase in cluster weight and minimises falling plants caused bycluster excess weight (Montero, 1998). This operation takes place between 18 to23 days after inflorescence, depending on seasonal conditions or when the false handexhibits its fingers in a horizontal fashion or when there are two internodes betweenthe false hand and the ‘acorn’. Then the shoot can be easily grasped, and the acornis broken without damaging the fruit (Champion, 1986; Anonymous, 1980).
2.8. Wrapping
Early on during the development of the fruit, bunches should be covered with per-forated polyethylene bags. The top of the bag should be secured to the stalk. Thesebags are important to prevent blemishes and scars in the fruit caused by leaves. Inaddition, a pesticide can be placed in the bag to reduce insect damage. The age ofthe fruit is usually recorded by using ribbons of different colours. Table 3 showsthe dimensions of polyethylene bags commonly used for wrapping banana clusters.
A stair should be placed next to the plant pseudostem at a suitable height, sothat wrapping operation can be properly made. The sac should be inflated in orderto be able to introduce the cluster into it. The sac’s upper part should also be inflatedat the tying site to assure that the sac under the tie is free. The sac should not betangled up around the stem, and it should be tied at 40 cm over the first stemhand insertion point. Coloured plastic ribbons are suggested to tie the sac to thestem since they may also be used to identify the cluster’s harvest period. It is not
134 Lourdes Yañez et al.

recommended to use the plant pseudostem fibres or any other plant material sincethese may decay, causing sac slippage over the fruit and thus un-protecting it. Itis also suggested that newspaper sheets be used along with the sac to cover the clusterin order to shade it at the points where sunlight is more intense, thus reducingsun-burned fruit losses.
2.9. Dehanding
This procedure involves removal of one or several hands during fruit protectionoperations. This decreases cluster weight, but it is compensated by more even sizeand quality of fruit during most of the production season. It can also decrease harvesttime per production unit, as well as a decrease in maturation days. Dehanding ismade as soon as the cluster is wrapped, by first removing the false hand andleaving the deformed finger to prevent decay advance which generally starts atthe end of the stem. The two apical hands (the lower ones) are removed by a slightspinning movement, making this a clean cut, and avoiding decay at the cut site. Ifthe cluster does not show the deformed finger at the false hand, the first incom-plete hand is removed and then the two next real female hands are dehanded.
2.10. Holding
Banana plants are sensitive to flattening due to cluster weight and wind damage.There are two holding systems that can be used to avoid damage after dehanding.One technique involves rubber bands and bamboo canes. Rubber band support isachieved with the aid of a ladder carefully placed on the plant pseudostem. Tworubber bands are stretched from the upper part between the pseudostem leaves andthe cluster to balance the cluster weight. The rubber bands are tied between theleaf petioles or anchored by means of a little piece of wood. They are stretcheduntil they reach two pseudostems opposite to the cluster. They are then tied approx-imately at 40 cm from the ground in each pseudostem. Another technique to supportclusters is by means of bamboo canes by placing two canes in a scissors-like fashion,leaning on the plant pseudostem opposite to the plant’s cluster. It is advisableto replace rubber bands and bamboo canes periodically to minimise possibleflattening (Anonymous, 1980).
Integral Handling of Banana 135
Table 3. Standard measurements for polyethylene bag covers, cm.
Thickness 000.05Perforations 001.25Distance between perforations 007.62Width (plane) 081.28Length (according to the cluster’s number of hands and size) 116.84–182.88

3. FRUIT RIPENING
In order to identify good strategies for banana postharvest handling and storage, itis necessary to have a clear understanding of the physiology and biochemistry offruit ripening. During the ripening process, a fruit goes through a series of markedchanges in colour, texture and flavour, which indicate that diverse changes in com-position are taking place (Abdullah and Pantastico, 1990).
Respiration is a fundamental metabolic process in harvested produce. Complexchemical compounds in the cell, such as sugars, organic acids and lipids, undergooxidative degradation to more simple molecules, such as carbon dioxide and water,with the consequent energy release and other molecules that may be used for cellularsynthetic reactions. Respiration can be divided into three phases:
(1) Hydrolysis of polysacharides into simple sugars.(2) Sugars oxidation into pyruvate through glycolysis.(3) Pyruvate and other organic acids undergo aerobic transformation into CO2, water
and energy through the tricarboxylic acids pathway and the oxidative phos-phorilation process.
Fruits are divided into two categories: climacteric and non-climacteric, accordingto their respiratory pattern after harvest. Banana is a climacteric fruit that can beharvested mature green and ripened later. Fruit respiration rate is about 10–30 mlCO2/kg. hr at 13 °C, and 20–70 ml CO2/kg.hr at 20 °C. Banana respiratory activitydecreases once fruit is harvested and it continues like that for a short preclimac-teric period. Extending this period is a commercial objective because fruits are easierto handle and they can be kept longer in storage. Approximately 12 days afterharvest, and often during storage, respiratory activity increased from 20–40 mgCO2/Kg/hr to about 120–125 mg CO2/Kg/hr as the fruit ripened and reached theclimacteric peak (Palmer, 1971). In most cultivars, this is when bananas attaintheir characteristic bright yellow colour. Then respiration decreases to approximately100–125 mg CO2/Kg/hr near senescence (postclimacteric period) in suitable storageconditions (18–20 °C, with high, over 80% humidity). Senescense is defined asthe time when biomolecules synthesis decreases and catabolic activity increases,characterised by brown spots appearance on the skin (Palmer, 1971; Salunkhe andDesai, 1984; Abdullah and Pantastico, 1990). Such a respiration pattern is typicalof climacteric fruits (Salunkhe and Desai, 1984; Burdon, 1997) and the rate increaseswith increasing temperature. The respiratory quotient (RQ) is the ratio of the numberof molecules of carbon dioxide given off to the number of molecules of oxygenabsorbed, and is used as a general indication of which particular substrate is beingused as the major source of respiratory energy. In whole bananas there is a distinctlowering of the RQ during the climacteric, followed by a return to about one inthe postclimacteric period. The main respiratory substrate during the climactericmight be fatty acids, and perhaps glucose at a posclimacteric stage. It is thoughtthat an alternate cyanide-resistant respiration indirectly participates in the climac-teric respiration increases (Theologis and Laties, 1978).
Another feature of climacteric fruits is that they ripen in response to ethylene.Ethylene is a simple gas that plays a very important role in fruit growth, develop-
136 Lourdes Yañez et al.

ment, and ripening at concentrations as low as 0.01ppm. Ethylene (C2H4) is a hydro-carbon constituted by two carbon atoms with a double bond. It is colourless,flammable, similar to ether, with a sweet aroma, and its explosion limits are from2.75–28.6% in air. Due to the double bond, ethylene absorbs UV light at 161, 166and 175 nm. Its diffusion coefficient in air is about 10,000 fold higher than inwater. Ethylene has a molecular weight of 28.05, freezes at –181 °C, boils at–103.7 °C, fuses at –169 °C, its relative density in air is 0.978, and its specificvolume is 861.5 ml/g at 21 °C (Abeles et al., 1992). Its double bond makes itsensitive to high energy radiation such as γ rays, which degrades it, resulting inacetylene, butane, ethane, hydrogen, and methane formation (Abeles et al., 1992).Theologis (1993) described ethylene as a plant hormone which co-ordinates fruitripening due to the series of metabolic changes which have been reported to coincidewith high levels of ethylene release when fruits ripen. Ethylene does not requireactive transport from its production site to its active site, so it is simply trans-ported by diffusion. Ethylene concentrations are regulated through its own synthesisand diffusion rates to the outside causing noticeable physiological effects at low con-centrations (Abeles et al., 1992). Inner ethylene distributions are not uniform. Withinplant organs, tissues produce ethylene at different rates, causing different diffu-sion resistance. Diffusion routes depend on tissue structure. It has been suggestedthat ethylene transport occurs through the xylem or the phloem. Ethylene diffu-sion gradients are determined by the surface/volume ratio, diffusion resistance andethylene production rates (Abeles et al., 1992). Ethylene production is almostundetectable in the preclimacteric respiration phase (Domínguez and Vendrell, 1993).Increases in ethylene occur slightly before or at the same time as the respiratoryclimacteric, as shown by a peak of about 0.05–4 µl/g FW/hr attained in about 24hr, one day before the respiratory climacteric peak (Domínguez and Vendrell, 1993;Robinson, 1996). Decreases of this hormone reach fairly constant levels, whichare nevertheless much higher than during the preclimacteric stage. Although ethyleneis produced by the fruit, ripening can also be stimulated by exogenous ethylene appli-cation, the so-called ethylene autocatalytic synthesis (Domínguez and Vendrell,1993). Thus, exogenous ethylene applied at a concentration as low as 0.1–1 µl/Lfor just one day is normally sufficient to hasten full ripening of this and other cli-macteric fruits (Abeles et al., 1992). Ethylene production in banana is about 0.1–2.0µl/kg.hr at 13 °C and 0.3–10 µl/kg.hr at 20 °C.
Under normal ripening conditions, the enzyme 1-aminocyclopropane-1-carboxylicacid oxidase (ACCO), also known as ethylene-forming enzyme (EFE) forms ethylenefrom its precursor, 1-aminocyclopropane-1-carboxylic acid (ACC). Recent findingsindicate that ethylene binds to an ethylene receptor molecule (ETR-1), which islocated in cellular membranes, resulting in a second messenger release. This secondmessenger migrates to the cell nucleus and causes an increase in transcriptionalactivity of genes influencing fruit ripening (Gutiérrez et al., 2001).
Both pulp and peel produce ethylene; however, banana ripening is co-ordinatedprimarily by pulp ethylene production essential for ethylene production in the peelas well as for de-greening of the peel. Once the peak in ethylene biosynthesis hasbeen reached in the pulp then ACCO activity increases in the peel and even exceedsthat in the pulp during the later stages of ripening (Clendennen et al., 1997). There
Integral Handling of Banana 137

are two different mechanisms in which membranes may affect ethylene biosyn-thesis regulation. One is the direct effect on enzymes associated to the membrane.The second one involves cellular membranes as translators for de novo enzymesynthesis that affect ethylene biosynthesis.
Banana fruit ripening is characterised by several biochemical and physiologicalchanges due to ‘organisation resistance’ breakdown as well as a marked increaseof membrane permeability, with accompanying cellular decompartmentation andmetabolic deregulation (Theologis and Laties, 1978; Palmer, 1971). This leads tofruit softening, changes in peel colour, a massive breakdown of starch and its con-version into sugars, as well as changes in acidity, among others (Kanellis et al.,1989).
Most fruits tend to soften during ripening. This is the main attribute determininga produce shelf life. Fruit softening may increase due to three reasons: turgor loss,starch degradation, or fruit cell wall breakdown. Turgor loss is a non-physiolog-ical process associated with postharvest water loss.
Banana cell walls are made up of pectin, cellulose and hemicellulosic substances(Kanellis et al., 1989). During ripening, protopectin (insoluble pectin), a largepolymer crossed-linked to other polymer chains with calcium bridges and boundto other sugars and derivatives forming a very large polymer, decreases from 0.5%to 0.2% fresh weight with a corresponding rise in soluble pectin. This is due to pectinmethyl esterase and polygalacturonase enzymes activity in three molecular forms(Palmer, 1971; Abdullah and Pantastico, 1990; Robinson, 1996). Pectin is gradu-ally broken down to lower molecular weight fractions, which are more soluble inwater (Abdullah and Pantastico, 1990; Seymour, 1993; Kotecha and Desai, 1996).Cellulose (2–3%) decreases only slightly during ripening due to cellulase enzymeactivity (Palmer, 1971; Kanellis et al., 1989). Hemicelluloses of the fresh greenbanana pulp appear to constitute the largest fraction of cell wall materials (8–10%).They decrease to about 1% in ripe fruits due to hemicellulase enzyme activity(Kanellis et al., 1989). They are thought to be labile reserve carbohydrates and poten-tial source of sugars, acids and other respiratory substances during ripening (Palmer,1971). Hence, fruit firmness decreases as a consequence of cell walls and weakeningcohesive forces, which bind cells together. In the initial ripening stages, fruittexture becomes more palatable, but in later senescence stages fruit structure dis-integrates and texture can soften extensively.
Changes in colour are often the main criterion used by consumers to determinematurity stages in fruits and to decide whether they must be eaten the same daythey are acquired or later. Colour stages in ripening ‘Cavendish’ bananas aredescribed in Table 4 (Salunkhe and Desai, 1984).
Green colour in banana (as it is in other horticultural crops) is due to the presenceof chlorophyll, a magnesium-organic complex. Degradation of chlorophyll by chloro-phyllase activity results in fruit colour changes (Palmer, 1971). Chlorophyllaseactivity in banana peel increases sharply at the onset of the climacteric to a peakwhich coincides with the climacteric peak, and then falls to near zero in the post-climacteric period (Palmer, 1971). The principal agents responsible for thisdegradation are pH changes (mainly due to a leakage of organic acids from thecells vacuoles), oxidative systems and chlorophyllases. Chlorophyll disappearance
138 Lourdes Yañez et al.

in banana fruit is associated with the appearance of carotenoids. Carotenoids areunsaturated hydrocarbons with generally 40 carbon atoms that may have one or moreoxygen atoms in the molecule. Carotenoids are stable compounds and remain intactin the tissue even when senescence has occurred. They may be synthesised duringdevelopment on the plant but remain masked by the presence of chlorophyll. Afterchlorophyll degradation, carotenoid pigments become visible. Banana carotenoidsare present as xanthophyll (about 5–7 µg/g FW) and carotene (about 1.5–3.5 µg/gFW) (Palmer, 1971).
Green banana peel contains about 3% starch, localised mostly in cells adjacentto the pulp. Only about 20.5% amylose has been reported in banana starch (Palmer,1971). The hydrolysis of starch and the accumulation of sugars in peel and pulp alterboth taste and texture of banana fruits. The sugar increase results in a sweeter,more palatable pulp, associated with optimum fruit quality. Only 1–2% of starchremains in the fully ripe banana fruit. Sugars, normally 1–2% in the pulp of greenfruits, increase to 15–20% in the ripe pulp. Soluble sugars in banana pulp are mainlysucrose (66%), glucose (20%), fructose (14%) and only traces of maltose, suggestingthat starch breakdown in this fruit is catalysed by phosphorylases, rather than byamylases due to its activity in both ripe and unripe bananas. Other starch degradingenzymes have been isolated, including α-amylase (EC 3.2.1.1), β-amylase (EC3.2.1.2) and α-1,6-glucosidase (EC 3.2.1.11) which increase in ripening bananas(Palmer, 1971; Seymour, 1993). The accumulation of sucrose has been reported tooccur earlier than glucose and fructose, and the ratio of glucose to fructose was closeto unity, indicating that the immediate precursor of these sugars is sucrose (Kanelliset al., 1989). Total carbohydrate decreases 2–5% during ripening, presumably assugars are utilised in respiration (Palmer, 1971). Medlicott et al. (1992) found thatthere is a relationship between surface colour development and starch conversioninto sugars in banana fruits.
They observed the maximal sugar concentrations in bananas are related to theircomplete colour development. Plantains differ from sweet bananas in having a higherstarch content in the pulp (30% at harvest and 5–10% when ripe), although sugarcontent of plantains is similar to that of sweet bananas (Palmer, 1971).
Integral Handling of Banana 139
Table 4. Characteristics of maturity stages of ‘Cavendish’ bananas.
Maturity Peel color Starch Sugar Remarksstage (%) (%)
1 Green 20 00.5 Hard, rigid, no ripeningSprung Green 19.5 01 Bends, slightly ripening, started2 Green, trace of yellow 18 02.5 –3 More green than yellow 16 04.5 –4 More yellow than green 13 07.5 –5 Yellow, green tip 07 13.5 –6 Full yellow 02.5 18 Peels readily, firm ripe7 Yellow, lightly flecked 01.5 19 Fully ripe, aromatic
with brown8 Yellow with increasing 01 19 Overripe, pulp very soft and
brown areas darkening, highly aromatic

Organic acids levels commonly decline during ripening as they are used as asubstrate for respiration or converted into sugars. However, bananas are an excep-tion because the highest acid levels are attained when the fruit is fully ripe (pHfrom about 5.4 ± 0.4 in pre-climacteric to about 4.5 ± 0.3 in post-climacteric pulp).Titratable acidity of plantains is 8 meq/100 g FW and it is about twice that ofsweet bananas, although acidity is not high at any stage of development comparedwith other produce (Palmer, 1971). In ‘Gros Michel’ banana pulp, malic, citricand oxalic acids were found to be major constituents; glutamic, aspartic, quinic,and glyceric acids were minor constituents (0.005–0.1 meq/100 g FW) (Palmer,1971). It was also found that total acidity of ‘Gros Michel’ banana pulp was 50%oxalic acid, 35% malic acid and 10% ‘citric peak’ acidity (citric acid plus certainphosphates). During ripening, both malic and ‘citric peak’ acidity increased three-to-four-fold and oxalic acid dropped to 60% of its original value. The net resultwas a doubling in organic acidity during the climacteric, with malic acid becomingthe major acid (65% of total acidity). Another important feature is that oxalic acidgenerally occurs in plants as water-insoluble and metabolically inert calcium oxalate.However, in bananas it is completely water-soluble and its decrease in ripe bananassuggests that ripening bananas are capable of metabolising it, although its productshave not been identified. α-Oxoglutaric and pyruvic acids levels during bananaripening differ among varieties during banana ripening (Palmer, 1971).
Little has been reported concerning ascorbic acid, but a slight decrease in thisacid in banana pulp was observed right after the climacteric, and concentrationsfell gradually to 10–12 mg/100g FW at full ripeness and then held constant untilthe fruit began to spoil (Palmer, 1971).
Ripe banana fruits contain at least 200 individual volatile components (Palmer,1971), including esters, alcohols, ketones, aldehydes and phenol esters (70%).Acetates and butyrates predominate within the latter fraction. ‘Banana like’ flavouris due to the presence of amyl esters, and that distinctive ‘fruity’ like flavour isdue mainly to butyl esters (Seymour, 1993). Volatile production increases duringbanana ripening until the onset of peel browning, where production reaches a plateauor decreases. Metabolism of fatty acids, which are converted to esters by bananatissues, is one of the routes of production of volatiles, as well as from some aminoacids such as leucine and valine.
One of the main problems with banana peel and pulp is the presence of phenoliccompounds such as 3,4-dihydroxyphenylethylamine and 3,4-dihydroxyphenylala-nine, which, when oxidized by the enzyme polyphenoloxidase (EC 1.10.3.1), areresponsible for the rapid browning of banana tissues. Banana cultivars which containhigh levels of ascorbic acid, had lower contents of polyphenoloxidase activity andtherefore exhibited low browning rates (Seymour, 1993). Studies have also shownthat these enzymes specifically oxidise o-diphenol compounds.
Peroxidases are also present in ripening banana fruits. They catalyse in thepresence of H2O2 the oxidation of substrates such as phenols, aromatic secondaryand tertiary amines, glucosides, ascorbic acid and some heterocyclic compoundssuch as indoles. An increase in cell wall-associated peroxidase activity has beenfound to occur with the initiation of the climacteric rise in respiration (Seymour,1993).
140 Lourdes Yañez et al.

Tannins have been found in banana fruit tissue, particularly in the peel. Theyare water-soluble phenolics with molecular weights of 500 to 3000. They precipi-tate alkaloids and proteins. According to Seymour (1993), tannins in banana fruitsseem to be confined mainly to the latex vessels of the pulp and peel. Tannins interactwith salivary proteins and glycoproteins, hence causing astringent fruit taste. Suchastringency gradually disappears due to tannins depolymerization as fruit ripens.
Fatty acids in banana do not change substantially during ripening. They compriseabout 1% dry weight of the pulp and 6.5% of the dry weight of the peel. The prin-cipal fatty acids are palmitic (16:0), oleic (18:1), linoleic (18:2) and linolenic(18:3) acid, with a reported tendency towards a loss of unsaturated fatty acids inboth pulp and peel during ripening (Seymour, 1993). Although changes have notbeen found to be considerable, some alterations have been noted, mainly in the phos-pholipid fraction with an increase in the proportion of linolenic acid and a decreasein the proportion of linoleic acid. Increases in the unsaturation of the phospho-lipid fraction may result in increased fluidity in cellular membranes during ripeningwhich may be the reason why sensitivity to chilling injury changes in banana asripening progresses, being less sensitive as ripening proceeds (Colinas, 1992;Seymour, 1993).
4. MATURITY AND HARVESTING INDICES
One of the important factors influencing the commercial value of bananas is its stageof maturity at harvest and freshness through the marketing period. Considerationof shipping distance and whether fruits are consumed at different stages of maturityis required.
Bananas are commonly harvested year round; however, there is a high and alow production season, depending on the region (Anonymous, 1980). The adequatematurity index for banana is the degree of fullness of the fingers, which is indi-cated by the disappearance of angularity in a cross section. Normally, if weatherconditions are adequate, harvest can be made at 80 to 104 days after anthesis(Champion, 1986; Anonymous, 1980). However, it is common to consider the timeat which the fruit attains the optimum width, and how far will be its marketingdestiny (Anonymous, 1980). Therefore, in order to determine optimum harvestdate, one has to take into account fruit development. The most appropriate harvesttime is when fruits do not increase in fresh weight (Montero, 1998). Fruit are har-vested at the ‘thin’ or ‘full’ stages, which can be broken down to ‘three quarters,light or thin’, ‘light full three-quarters’, ‘full three-quarters’, ‘full’ (Champion, 1986).These terms refer to a transverse fruit cut which faces, limited by theedges, at the beginning, plane or slightly concave, and then they turn to convex(Figure 1) (Champion, 1986)
In practice, this constitutes a problem in ‘giant’ bananas, with bunches locatedseveral meters from the ground because the harvester estimates fruit dimensionvisually. In order to make this operation easier, diverse methodologies are used.In Central America, ‘Gros Michel’ banana fruit diameter is measured by calibreand by means of devises including boards with calibrated holes that indicate the
Integral Handling of Banana 141
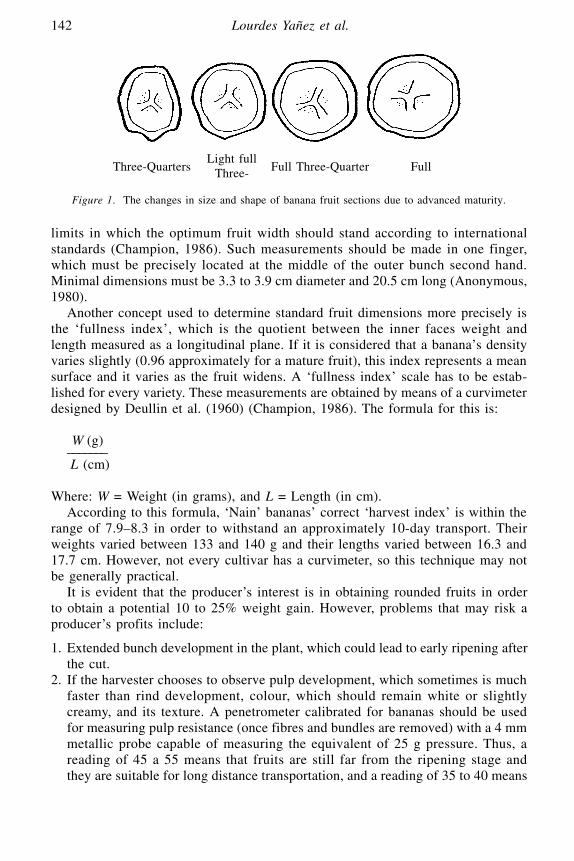
limits in which the optimum fruit width should stand according to internationalstandards (Champion, 1986). Such measurements should be made in one finger,which must be precisely located at the middle of the outer bunch second hand.Minimal dimensions must be 3.3 to 3.9 cm diameter and 20.5 cm long (Anonymous,1980).
Another concept used to determine standard fruit dimensions more precisely isthe ‘fullness index’, which is the quotient between the inner faces weight andlength measured as a longitudinal plane. If it is considered that a banana’s densityvaries slightly (0.96 approximately for a mature fruit), this index represents a meansurface and it varies as the fruit widens. A ‘fullness index’ scale has to be estab-lished for every variety. These measurements are obtained by means of a curvimeterdesigned by Deullin et al. (1960) (Champion, 1986). The formula for this is:
W (g)–––––––L (cm)
Where: W = Weight (in grams), and L = Length (in cm).According to this formula, ‘Nain’ bananas’ correct ‘harvest index’ is within the
range of 7.9–8.3 in order to withstand an approximately 10-day transport. Theirweights varied between 133 and 140 g and their lengths varied between 16.3 and17.7 cm. However, not every cultivar has a curvimeter, so this technique may notbe generally practical.
It is evident that the producer’s interest is in obtaining rounded fruits in orderto obtain a potential 10 to 25% weight gain. However, problems that may risk aproducer’s profits include:
1. Extended bunch development in the plant, which could lead to early ripening afterthe cut.
2. If the harvester chooses to observe pulp development, which sometimes is muchfaster than rind development, colour, which should remain white or slightlycreamy, and its texture. A penetrometer calibrated for bananas should be usedfor measuring pulp resistance (once fibres and bundles are removed) with a 4 mmmetallic probe capable of measuring the equivalent of 25 g pressure. Thus, areading of 45 a 55 means that fruits are still far from the ripening stage andthey are suitable for long distance transportation, and a reading of 35 to 40 means
142 Lourdes Yañez et al.
Figure 1. The changes in size and shape of banana fruit sections due to advanced maturity.
Three-Quarters Full Three-Quarter FullLight full
Three-

that the pulp has started softening and the bundles will have to be handled andtransported with extreme care. A reading of 30 means that the fruit has to belocally consumed, in view that it has started its ripening process.
3. If one lets banana fruit widen and get rounded, it is more likely to split apartand its pulp turns mealy and bitter (Champion, 1986). On the other hand, if itis harvested short before maturity stage, when its edges are really marked, thenripening takes place quickly, and there will not be enough time for its trans-portation in good conditions to distant markets.
5. HARVESTING
When banana cultivation is intensive, bunches ready to be harvested are usuallymarked with a coloured ribbon just a few days before this operation. Extreme caremust be taken during banana harvest and transportation to the packing station becauseany bruise causes skin darkening, in addition of initiating an infection point.
In dwarf bananas, bunches may be taken at the same moment when rachis iscut, far above the first hand (Champion, 1986). In the case of giant banana species,harvest usually requires two persons. One makes a cut with a big knife at approx-imately 1.5–2 m above ground level at the middle part of the bunches’ pseudostem.Another person is located at the back of the person cutting the stem, waiting forthe cut and catching the bunch. The person cutting the stem gently forces thebunch below the hand base to separate it from the plant (Laville, 1977). The bunchesmust be placed on a padded tray and cut through the bunch stalk (Laville, 1977).Heavy bunches may break or split apart if the operator is not careful; sometimesa rachis is tied to the pseudostem (under the bunch) to avoid these problems; thus,when a bunch falls, it stays parallel to the pseudostem. If dehanding is made inthe field, stem must be cut and bunch must be gently brought down, then dehandingmay start from the bottom hand (Laville, 1977).
Once bunches have been separated from the plant, care has to be taken to avoid
Integral Handling of Banana 143
Figure 2. Banana cluster cut at the base of the hand, supported by the fingers.

bruises to the fruit rind due to its contact with rough surfaces. Such bruises can causefungal diseases, although ‘Gros Michel’ bananas are more resistant. Banana pedun-cles are extremely sensitive to stress as compared to the outer apical areas. Therefore,bunches should be placed carefully over soft surfaces or mattresses (spring or rubbermattresses) and always placed in the shade (Champion, 1986). Also polyethylenesleeves may be placed between two adjacent hands. Other materials that can be usedinclude foam rubber, crumbled banana fibre pillows, straw between paper sheetspillows, etc.
In some places such as the Barlovento Islands, the bunch load in the field isstandardised. The bunch is wrapped in polyethylene sleeves and placed on a woodenpadded tray. Such trays substitute harvest containers and should preferentially beconcave, so that the bunch can be perfectly placed avoiding any movement or rolling.Bunches are gathered in a given shaded surface to avoid sun burning which mayaffect quality (Anonymous, 1980).
Bunches have to be cleaned and checked before leaving the plantation. Theseare cleaned by removing floral remains, which can cause sap leakage and stainingof the fruit. Aborted fruits that are frequently found in the last hand, as well asthe ones with wet and dry apical rots, are also removed. Bunches are then dippedin an alkaline solution or sometimes calcium sulphate (as a coagulant) for 15 minutes(Montero, 1998). Alum (aluminium sulphate solution) is used as an antioxidantand to prevent subsequent latex exudate. The solution should be mixed adequatelyimmediately before using (Montero, 1998). Sodium hypochloride (75 to 125 ppm)can also be used to prevent latex leakage as well as to kill fungal spores (Laville,1977). Emulgator NP7 can be used for thorough fruit cleaning (Montero, 1998).A diothene pad is used to protect the cut crown (Laville, 1977). Bananas can be
144 Lourdes Yañez et al.
Figure 3. Banana cluster cut at the base of the hand, taking it by the stem.

immersed in a second water tank for additional 10 or 15 minutes at the packingstation.
6. TRANSPORTATION FROM THE ORCHARD TOTHE PACKING STATION
Bananas are transported to the packinghouse as bunches. It is very important toreduce physical injury to the fruit during harvesting and transport. In small opera-tions, bunches should be transported in one single layer, and with adequate materialthat can serve as a cushion. In bigger operations, bunches are transported with theuse of different systems of cableways, commonly operated by tractors. The bunchesare attached to the cable by its base, and should be separated by spacer bars toprevent their contact.
Fruit transportation from the plantation to the packinghouse should be madethe same day of the harvest. Long stops, which expose fruits to the sun and heat,should be avoided. Mid-day transport should also be avoided or, if not possible, pro-tective material should be placed over the fruit (Anonymous, 1980).
Light bunches are transported by carriers who place them on their head or ontheir back, in the latter it could be two or more clusters at a time. This operationis commonly done in coffee regions with banana plantations (Anonymous, 1980;Montero, 1998). If bunches are going to be dehanded at the plantation this opera-tion is done with the aid of a curved knife. Two parallel cuts are made at thepseudostem and under the stem curvature so it will go down by its own weight ata determined height so the cutter will be able to dehand the cluster. Separatedhands are placed in metal trays 100 cm length × 45 cm in width, covered completelywith rubber and banana leaf pads to cushion and protect the fruit against damageduring transportation. Once trays are filled with fruits, they are placed on plat-forms in carts to avoid falling during transportation (Laville, 1977; Anonymous,1980).
Air cable is ideal for transportation but its installation is not easy. It is used inflat or gently, not pronounced sloped lands and installed at the plantation borders.If slopes are very gentle just a few clusters can be handled downhill. Nevertheless,this system simplifies fruit handling, minimises mishandling, and saves harvest time.Plant stems are protected by placing a piece of polyethylene film on the cluster’shigher parts to avoid latex leaking over onto the first cluster hands. The high costassociated with this system is a disadvantage which must be considered, howeverit is cost-effective in big plantations (more than 200 ha.), especially those intendedfor export (Montero, 1998). Cables are built of galvanised iron poles in an invertedU fashion with a 12-meter separation between poles. The steel cable is joined topoles by means of hangers and rods. In this way bunches are transported to the pack-inghouse by means of rodines, which run over the cable way. Bunches are separatedby spacer bars to prevent contact among banana bunches. Hauling can be manualor mechanical, a small tractor pulls trains of 75 or 150 bunches of 30 to 60 Kg alongthe cableway to the packing house. This method does not require a roadway orbridges to cross drainage ditches. Transportation speed should be limited to 8 Km/hr.
Integral Handling of Banana 145
Rigorous supervision must be made to monitor this operation because it will generatewastage and fruit damage if done poorly. Decisions about adopting cable systemsmust be based on the advantages and disadvantages of this system to the producer(Montero, 1998).
Another transportation system involves a hauling train, which consists of twoor three platforms or carts. These carts should be completely covered with smallcushions made of paper and nylon to avoid bruising. Dry banana leaves should beplaced on all of these layers to help minimise any damage during transportationfrom the orchard to the packinghouse. During this operation, a carrier assistant isnecessary, to move the bunch by taking the end from the carrier’s back and movingthe bunch onto the cart in order to avoid any breakage. Bunches should be placedwith the cut end towards the outer part of the cart and rubber or protective mate-rials should be placed between them to avoid bruising. It is important that roadsbe well maintained, cart cushioning should be adequate, transport speeds shouldnot be more than 10–15 Km/hr, and that cart cushioning surfaces should be keptclean (Anonymous, 1980; Montero, 1998).
Bunches are sometimes separated by means of coverings or provisionalpackages like banana leaves or foliar sheaths as practiced in Ecuador (Champion,1986), although this may cause sanitary problems. Piling up of punches must beavoided.
7. CONDITIONING FOR MARKETING
High fruit quality is essential for successful marketing because it helps increasemarket prices and to satisfy consumer demand. Quality starts from the field. Onceat the packinghouse, special fruit treatment is essential to preserve field quality,enhance fruit appearance, and make them more competitive at the market (Montero,1998). The packinghouse must be covered, and exposure to the sun heat must beblocked to prevent fruit damage and to enhance the workers’ comfort (Montero,1998).
The packinghouse floor must be dry to increase efficiency. All fruit shipmentsmust be processed as the following:
• Every bunch must have its respective ribbon, otherwise the packinghouse chiefor producer must be alerted to correct this mistake.
• Received amount of banana hands should be recorded, bunch weight, percentageof rejected or lost bunches must be made. It is important to know each lot con-dition and its yield according to weight and quality.
• Fruit defects must be recorded with the objective of improving bunch quality.When fruits arrive mishandled due to a poor harvest or transport, an alert mustbe sent immediately to the field ranger to correct the anomaly.
• Bunch classification should be done as follows:• Full bunch: Fingers that have lost their edges (rounded).• Mature bunch: Bunch with one or more mature fingers, without mechanical
damage.
146 Lourdes Yañez et al.

• Poor bunch: A bunch with retarded normal development, short fingers that presenta tip protuberance (more pronounced and distinct from that of a normal bunch).
• Sick bunch: A bunch with damage and decay higher than 50%, must be rejected,but if the damage is lower, good parts can still be used according to the qualityconcepts.
• Good or clean bunch: The bunch not exhibit damage or decay.
A packinghouse must fulfil certain conditions for correct operation:
• Avoid wastage accumulation (rejected fruits and trash) in the packinghouse.• Tanks and floors must be clean and washed as often as the cutting program
requires it. As a general rule, a complete packinghouse cleaning must be madeat least once a week.
• Water and functional tanks must be available for washing and all the other farmprocesses.
• Shipping and any kind of transportation must not be made without a clear knowl-edge of market specifications concerning amount, quality and fruit volume arebeing fulfilled at the packinghouse.
Upon arrival to the packinghouse, the fruit should be inspected for finger fullnessand length, bruises, blemishes, scars, insect attacks, and decay. Only fruits thatmeet the quality grades should be accepted and packed. Inferior quality fruit canbe sent for processing.
Bananas are then dehanded using a sharp curved knife, and immediately placedin a water tank. Water is needed to coagulate the exuded latex and thus reducethe staining. In addition, water serves to eliminate dust and dirt, and partially coolsthe fruit. Fruit is commonly placed in a second water tank for 10 to 15 minutesto further eliminate the latex. In addition, an antioxidant and/or a fungicide canbe added to the second water tank to reduce oxidation (darkening) of the cutsurfaces, and the development of decay organisms. Thiabendazole and imazalilare commonly used fungicides for banana. Sodium hypochlorite at a concentra-tion of 75 to 125 ppm is also commonly added to the water to reduce decayorganisms. Water should be changed regularly to avoid the increase of inoculum.The chlorine concentration in the water should also be monitored regularly usingindicator papers. Fungicides can also be added separately after washing either asspray or dip.
The main operations at the packinghouse include:
7.1. Selection
This process involves selecting fruit, especially with respect to plant sanitation,quality and appearance. At the packing place, there must be a person in charge ofreceiving fruits when they arrive from the orchard, commonly known as the fruitinspector. This person must supervise and record the bunch quality and harvestedvariety (Montero, 1998). Fruit defects are also taken in order to discard misshapefruits from the market, all according to specific regulations.
Integral Handling of Banana 147

7.2. Classification
This operation consists of fruit hand removal, cleaning and weighing. Fruit classi-fication is made according to size and market demands; thus, they may be exhibitedas fingers, clusters or complete hands, according to fruit weight, depending on thetype of market, national or international, and on the requested specifications(Montero, 1998).
7.3. Dehanding
Dehanding can be made with a very clean, sharp knife or a slicer. The dehandingperson must wear gloves on both hands. Cuts must be made even, very close tothe bunch’s rachis to support the hand with firmness and avoid loosening of fingers.Care must be taken to avoid damaging fruits with the knife or slicer. The dehandermust take the fruit by its crown with a minimum of three fingers to avoid mis-shandling, peduncle bruises, collar bending or the dehander must cut them withthe slicer (Montero, 1998).
7.4. Washing
After dehanding, fruits must be placed in a washing tank and caution must betaken to avoid throwing of hands over each others, tank edges rubbing, and pro-tection from mishandling scars. All of these defects become noticeable once fruitshave been dried. Water must be kept flowing to avoid latex or spot accumulation.Water is mixed with alum (100 g/10 L) to help remove latex and control micro-organisms, especially if this operation has not been made in the field. Latex isremoved because if it dries over fruit surface it can darken its appearance, and hencenegatively influences its marketing value (Montero, 1998).
7.5. Cluster preparation
This process is made by ‘selectors, cutters or sanitary workers’, using very cleanand sharp knives. Each hand must be checked, and fruit with defects such ascigarette tip, off-shaped, sunburn, striped, premature maturation, fungal problems,trips excess, malformations must be separated. The fruit is then cut in three tofive finger clusters or separated into individual fingers, depending on the type ofmarket, but in both cases a knife must be used. This operation should be doneadequately to avoid additional mechanical damage or accidents. In the case ofdirty fruits (with fumigation residues, latex, sooty mould and other substances), asponge and a washing solution should be used.
Whenever fruits are prepared by clusters, the crown must be arranged by meansof correct cuts. If fruits are to be offered by fingers, the peduncle must be slightlyroughed down to avoid a rough surface exposure, which is prone to fungal attack.When fruits are prepared by hands, defective fingers must be removed and the crownmust be arranged, thus making the hand healthier (Montero, 1998).
Fruit fingers must be removed with a slicer or a knife, but never with the
148 Lourdes Yañez et al.
operator’s hands. When fruits are requested as sorted, i.e., by clusters, by fingers,as well as by sizes, divisions must be placed in the tank. The sanitary operatormust take this into account during his cleaning of the fruits defects, includingstains that could affect peel and pulp, and from which scars and bruises are themost common and serious. Certain defects that affect the pulp and are consideredcritical are bruises, which are considered more severe than stains affecting thepeel.
After washing and preparation of clusters, it is necessary to take the fruits to atank containing alum, or alum-stone, and there they must remain for at least 15–30minutes. This treatment is for latex elimination. Good water circulation is neces-sary to avoid latex accumulation in the water. This condition is fundamental to agood fruit processing. Water pressure in the tank must be moderate and not exces-sive. Crowns (clusters or hands) should remain constantly submerged in water toobtain an effective latex elimination. Static water tanks must be changed wheneverthey reach high latex levels. Tanks must be 3/4 full of their capacity with fruit. Afterthis operation the fruit is taken to the weighing zone.
7.6. Weighing zone
The persons responsible for fruit weighing should also wear gloves and shouldeliminate fruits with defects. Fruit must be carefully handled and they must be setin a bucket where they are distributed by size to facilitate better drying and packing.Buckets should be directly set in a balance to record the required weight for eachpackage.
The main postharvest problem when working with banana hands or fingers iscrown decay, collar or tip decay, caused by a diverse number of fungi. This problemdemands a special fungicide treatment to avoid their rapid appearance, which lowerstheir commercial value, especially in high temperature zones or when bananashave not been refrigerated. Extra fungicide treatment may be necessary dependingon the type of market. This process is made after fruits are weighed and whenthey are still in the bucket. Mertect is commonly used to avoid insect problems(see fumigation). The amount of insecticide or fungicide depend on the number ofpackages or requests to be processed. They are added to the water with alum.Water changes are normally made during the day when high volumes of fruits ordirty fruits arrive at the packinghouse.
7.7. Quality evaluation
Large banana producers generate fruit according to their client’s request, which mustbe a guide to their production and handling. Fruit quality is evaluated at fourlevels:
1. In clusters, before processing.2. After packing and before their transportation.3. At shipping and at the marketing site.4. After the ripening process.
Integral Handling of Banana 149

These evaluations are used to help detect those factors that negativelyaffect quality and to discard defective fruit. They also allow supervisors to takecorrective decisions to improve amount and quality from the field to its lastdestination.
7.8. Fruit quality classification
The main defects in banana can be due to damage caused by fruit handling, insects,micro-organisms, adverse environmental conditions, chemical products used andfruit selection, as follows:
• Cluster mishandling once harvested. From the moment of harvest clusters mustreceive careful handling, otherwise mishandling directly affects the fruit by theappearance of defects such as handling scars (broken collar, bruises, latex stains,tip or flower damages).
• Damages caused by insects and other animals. • Losses by micro-organism. The most common are crown mould, crown rot and
finger-stalk rot, modulo, cigar-end rot, anthracnose, Johnston spot or pittingdisease, sigatoka disease, black heart, black tip, brown spot or diamond spot, doth-iorella rot, freckle phytophthora finger rot, pink mould rot, speckle or swampspot, squirter disease, watery soft rot, etc.
• Environmental and genetic conditions. The most important are yellow tip, mat-uration spot or cracked fingers.
• Chemical damage. These include non-tolerable or non-accepted chemical residues,especially when produce are subjected to exportation and chemical burns.
• Selection damage. Leaf scars, sun burn, short finger, finger weight, slicer cut,deformed hand, fingers malformations, crown bruises, end scar, bad maturityindex.
• Miscellaneous. There are several characteristics that buyers identify accordingto the different regions such as peel and pulp colour, peel thickness, size,peel adherence (i.e. peeling facility), pulp texture (grainy or soft when fried),flavour, sugar or starch content, adequate thickness (for ‘sancocho’ in Colombia),etc.
8. QUALITY INDICES AND STANDARDS
Quality indices for bananas include finger length and form, and freedom from defectssuch as insect injury, physical damage, scars, and decay.
Several factors can reduce the quality of banana fruit including skin abrasions,bruising, and decay. Abrasions result from skin scuffing against leaves or other fruitsor surfaces of the packages or of handling equipments. The exposure to low relativehumidity (<90%) increases water loss from scuffed areas, and promotes the devel-opment of brown to black colour.
Quality regulations depend on the buyer and market, help assure absence ofdefects, and its presentation fulfils certain specifications. Size or grade refers to
150 Lourdes Yañez et al.

finger length and its width. Presentation involves size and hand or finger arrange-ment.
Fruit defects include stain that affects peel and pulp, and scars and bruises,which are the most common and serious ones. Scars are classified as slight, moderateand severe. Certain defects that affect the pulp, such as bruises are considered critical.Peel defects are classified as major and minor. Persons involved in this processshould have knowledge of quality regulations demanded for the different destina-tion markets. The following are banana quality specifications:
• Appearance. Fresh fruit must be green, clean and uniform at the adequate harvestmaturity and size at the time of shipment.
• Condition. Fruit must be firm, dark green, without cracks or cracked tips.• Tolerances. Depending on the buyer and the market; little and dry scars caused
by insects might be acceptable on a maximum length of accumulated 4 cm area.Fresh scars caused by mechanical damages are not tolerated.
• Size. Measured at the central part diameter and convex fruit region lengthalong the outer curve from the growing end up to the peduncle base, where the‘eating part’ ends. Minimal finger length and diameter are 25 cm (tip to pulp)and 3.8 cm (48/32 in), respectively (NMX, 1995) depending on the buyer.Minimal finger in the cluster length is 22.5 cm (tip to pulp) depending on thebuyer.
• Calibre. Minimum and maximum for finger are 38 mm and 59 mm, respec-tively.
• Weight. The minimal weight per finger should be 250–350 g.
Mexican official standards classify banana fruit quality as extra, first class andsecond class. All of them must consist of complete fingers, firm, fresh appear-ance, healthy, excluding all those affected by insects, rots or altered in such a waythat they are not proper for human intake. Fruits should be clean, with no visibleextra material (i.e. soil, stains or organic matter residues). They should not haveany off-odours or off-flavours, maturity stage enough to bear handling and to beable to ripen in storage and to present such a development or condition which allowsthem to bear transport and handling, and to arrive in proper conditions. Extra qualitybananas must have the typical shape and yellow colour when ripe. They must beuniform with respect to colour and size and to fulfil the above-mentioned specifi-cations. They should not have defects, except for some superficial defects, whichdo not affect their general appearance, their preservation or container presenta-tion. All of these features must be visually assessed.
First class banana fruits may have minor defects as long as they do not affectthe general fruit appearance, quality, as above and they must not affect pulp quality.Such defects could be sun and heat damages. Minor defects on peel could be rubs,latex stains, scabs, and superficial stains not bigger than 1.5 cm2. These areas areverified using a millimetre scale. Those defects must not affect fruit pulp. Secondclass bananas cannot be classified in the above groups but they satisfy minimalsensory specifications. Nevertheless they should fulfil variety special features withregard to shape and development, i.e. rubs, scabs in a 1.51 cm2 and 2.0 cm2. Thesedefects should not affect the pulp. Bananas in this class are frequently sold locally.
Integral Handling of Banana 151
8.1. Tolerance specifications
According to Mexican standards, each produce container must have a maximumof 5% tolerance in fruit unit number or mass that does not fulfil all the specifica-tions required for extra class but does satisfy specifications of the first class. Firstclass bananas allow a 10% tolerance for those fruits that do not fulfil this classrequirement but they have the second-class banana specifications. Second classbananas allow 5% in units or mass to those fruits that do not fulfil this class spec-ifications but do not exhibit defects which alter their quality. There are also tolerancesto fruit size and they are similar to those mentioned above with respect to off-sized produce percentages.
Sampling must be done by the supplier and the buyer based on standards.Whenever numbers of units in the container are known, percentage calculations mustbe determined based on fruit count. If this number is unknown, calculations mustbe made on the basis of sampled net fruit mass relative to the net container massor by means of any other equivalent method.
Containers to be sold to the final consumer with contents that are not exter-nally visible must have the nature of produce and its variety specified by meansof a mark or label.
Containers for retail sales must carry at least the following printed or labelled,legible, indelible, and visible information: exporter identification, packing houseand/or producer’s name (address or trade identification), type of produce (its name,especially if the container contents are not very visible), variety’s name; countryof origin and its national denomination, regional, local, commercial identification,quality grade or class, size, number of units, and the container’s net weight (inkilograms).
Containers must satisfy quality, hygiene, ventilation and resistance propertiesto insure appropriate produce manipulation, transport and preservation. They mustbe free of any strange material or odour. Container content must be homogeneous,and the bananas must have the same origin, class, variety, size, and/or commer-cial type.
For extra class fruits, the contents of each container must fulfil quality standardspecifications and they must have homogeneous maturity stage and colour. A con-tainer’s visible part must be representative of the remaining content.
9. PACKAGING AND PACKAGES
Packages have very important roles in presentation, as well as for handling. Goodpackaging enhances consumer acceptability assuring better selling prices andextending the produce’s shelf life (Montero, 1998). Bananas must be packed insuch a way that convenient protection is guaranteed. Bananas are traditionallymarketed by clusters or fingers. Materials used within the container must be new,clean, and of a quality that avoids produce external or internal damage. The typeof package to be used must be defined in order to enhance good prices. The use
152 Lourdes Yañez et al.
of materials, especially paper or seals with commercial specifications, is allowedin the container as long as labelling or printing is made with non-toxic inks or glues.Packages must be made of special material which guarantees adequate producehandling and preservation.
In choosing the type of container to be used, it must be considered that if theclient wants to store the produce in a cold place, package dimensions need to bestandardised for cold storage. This may also be a consideration if stowages are tobe used in retail stores or supermarkets. Boxes should keep a relationship withthese dimensions. Normally bananas are packed with a net weight of 18–20 Kgwith 4 to 5% additional fruit required to compensate for any weight loss duringstorage and transport. Package overfilling should be avoided because container mate-rials may rub fruits thus producing mechanical damage, which will be noticed aspeel darkening and disease development. Fruits must never be forced inside thepackage.
9.1. Type of packages
Packages are fundamental for protecting fruit all the way to the final destination.The most appropriate are:
1. Boxes or plastic baskets 60 cm wide by 30 cm high that may be overlapped tofacilitate their transport. These boxes contain a cardboard within their base andsides as well as perforated plastic film to reduce any friction.
2. Two piece carton boxes, with a telescopic lid, and upper and lower vents. Theyalso have venting holes in their lateral walls and two holes located at each endto lift the boxes. Box dimensions vary according to the final market. The lid mustbe correctly set in such a way that it coincides with the venting holes.
3. Open boxes to exhibit fruits are also used in the banana market.
The most common package used for banana is a corrugated fibreboard cartonlined with polyethylene, with a capacity of 18 kg. Boxes are then palletised andeither stored in a cold room, or loaded into a pre-cooled transport container.
The use of polyethylene film inside the box is commonly used. Fruit must bepacked with peduncles attached to the narrow box walls. Fruits must be carefullyplaced to eliminate movement, and it should never be forced into the box or over-filling it to avoid the rubbing box’s walls that can cause scars, peel darkening andconsequent disease development.
Bananas may be packed by fingers or clusters. Packers are the last persons whotouch the fruit and therefore they should know very well the tolerances for quality.Special care should be taken to avoid piling up more than 5 boxes. Boxes mustbe carefully placed over woodpiles. Once boxes are piled up they must be tiedwith nets or metal bands to avoid any box movement. Packages, especially thoseintended for export market, should be designed in such a way that air circulationis allowed when boxes are piled up to prevent ethylene accumulation, as well asto maintain a uniform temperature.
Integral Handling of Banana 153

10. TRANSPORTATION
Horticultural produce is generally grown in places located far away from the con-suming or processing centres. In many cases, transportation is the most expensiveoperation in the commercialisation chain. Hence, means of horticultural producetransportation is determined by the distance, produce perishability and value, as wellas producer’s economical affordability and the production region’s degree of devel-opment. Bananas need special packing and transportation conditions in order todecrease risks of decay. During transportation, fruits are exposed to movement, vibra-tions, impacts, pressure, temperature variations and changes in relative humidity.Therefore, transportation conditions must minimise all factors influencing fruit dete-rioration. There are diverse ways of fruit transportation. Sailcloth covered andsometimes uncovered trucks or wagons are used locally or at a national level.Such transportation means have some disadvantages because they cause bruiseson fruits due to rubbing against the vehicle’s floor, with the sailcloth or with thesides of the vehicle. Vehicle cushioning may be a problem due to the highwayconditions. Humidity losses due to the air velocity and high temperatures to whichfruits are exposed may accelerate ripening. Another means of fruit transportationis in bulk, which means that fruits are transported as complete clusters or fingers.This type of transportation causes fruit damage due to vibration and compression.
In each packinghouse there should be a carrier person to carefully take packagesand to avoid fruit mishandling when placing them into the vehicle. Boxes shouldnever be thrown, dropped or hauled; they should be carried by the box holes madefor that purpose and they should not be tipped or turned upside down so that theyare not damaged. Well-aerated vehicles, with clean floors, equipped with wholeand waterproof sailcloth are acceptable as good transportation means.
Fruit transport trucks should follow these regulations:
• They should not carry fruit from more than three orchards.• There must not be more than five boxes of fruit in a stack.• Sailcloth should be in good condition. The back part must be covered to avoid
dust or rain contamination of the fruit.• In order to avoid fruit damage, moderate vehicle speed must be used during trans-
portation.• Regulations for merchandise shipping and delivery must be respected.• Transportation should preferably be made during night hours.
It is important to protect fruits placed on vehicle’s floors and walls. Leaves canbe used after each cluster is placed and more leaves are placed over clusters to avoiddirect fruit friction.
Transportation vehicles should provide adequate hygienic conditions, protec-tion and comfort with the objective of minimising quality losses.
Land transport, i.e. by highways, is the most commonly used. It allows the greatestproduce mobilisation over short and long distances, even from ‘door to door’.Also, it facilitates loading and unloading operations, but in rainy seasons theremay be some difficulties due to poor road conditions or due to the lack of vehiclesin peak harvest seasons. During transport it is convenient to humidify fruits to
154 Lourdes Yañez et al.

avoid losses due to fruit dehydration. Refrigerated vehicles able to cool down thefruit from 25 °C to 13–14 °C are needed for banana transportation and storage.
Railroad can be used for long distance transport, in view that their cost is low,although refrigerated cars are required for this purpose. In this type of transportbanana leaves are not used to avoid dissemination of sigatoka disease.
Water transport (rivers, oceans) is commonly used especially for export. Thereis an increase in the use of refrigerated ships with systems for air circulation. Aboardships, the fruit is commonly transported in containers, each of which may have anindependent refrigeration system. In places where there are no pre-cooling facilities,fruit may be directly packed in the refrigerated container to decrease fruit temper-ature. During palleting, packages should be piled up in columns, making sure thatair can circulate through the base and the next package’s lid. It is necessary touse corner protections and metal strips, bands, or to place plastic hoops around palletsin order to reinforce platforms and to stabilise packages. If piling on platforms cannotbe done, packages can be bulk loaded, i.e., placed package by package on thefloor, one over another by columns.
Air transportation has some disadvantages:
• High costs.• Flight interruptions due to bad weather conditions.• Long distances from airports to production or unloading centres.• Limited space availability in airlines.• Continuity is required in the use of this service.
Therefore, choosing the most suitable transportation means to move fruit mustinvolve the following considerations:
• Roads and highway conditions.• Transportation type availability.• Fruit characteristics.• Travel duration.• Packaging systems.• Transportation cost and availability.• The number of loading and unloading sites.• Delivery schedule.• Freight costs.• Produce sale price.
For loading and unloading it is suggested to:
• Avoid bruising during loading and unloading.• Avoid fruit exposure to rain and heat.• Minimise package movement during transportation.• Place the heavier and firmer packages in the lower part of the vehicle in order
to avoid mishandling.• Load during the coolest part of the day or during the night.• Keep the fruit under refrigeration and high relative humidity.• Park the vehicle at shaded sites.
Integral Handling of Banana 155

• Avoid transporting low quality product. Costs will be high.• Transporting fruits in sailcloth-covered vehicles will protect them against sun,
rain, dust, avoiding dehydration and bruises.• Use roads and highways that are in good conditions, even when this makes
travel longer.• Keep vehicles in very good hygienic and mechanical conditions.
Transportation costs will depend on:
• The volume of transported fruits.• Travel distance.• Highway conditions.• Availability of transport units.
Important transportation problems:
• Vehicles with high maintenance costs.• Vehicle conditions that will not guarantee produce delivery.• Difficult topography along with roads and highways in bad condition.• Production seasonality and spreadability that does not guarantee a continuous
stock.• There is no rational use of the parking lot at the different production sites.• Produce perishability makes mobilisation very risky.• Untimely pressure by intermediary vehicles owners upon the producers.
11. STORAGE
Fruit storage is a way to preserve quality after harvest for a specific time beforeits sale or consumption. Systematic storage is a part of a postharvest handlingchain and it constitutes a very important tool either for the local or export mar-keting (Hardenburg et al., 1986). Export bananas should remain mature (green) untilthey reach their last destiny, which may last from just few days to a few weeks,depending on the distance and transportation method.
During the period between harvest and consumption, temperature control is themost important factor for maintaining produce quality. When they are separated fromthe mother plant, fruits, vegetables and flowers are still living tissues that breathe.The lowest possible temperature increases shelf life by decreasing respiration rate,metabolic reactions related with respiration heat, ethylene production and action,water loss and wilting, softening, chlorophyll degradation, undesirable metabolicchanges, fungal attack and bacteria and yeast infections (Lizada et al., 1990).Decay rate can be decreased without altering the ripening process of the fruit(Burdon, 1997). Temperature is the most important factor which influences ripeningand decay processes, and therefore refrigeration is the most important techniqueto preserve perishable horticultural crops including bananas. Refrigerated roomsfor the storage of fresh fruits and vegetables should generally operate within verynarrow temperature ranges in space and time, with the objective of getting a verylong storage period, to avoid freezing injury and physiological disorders, as well
156 Lourdes Yañez et al.
as to minimise transpiration (Burdon, 1997). Temperature control is of great impor-tance, because a suitable low temperature storage extends the life of those fruitsthat need to be transported over a long distance. For many tropical and subtrop-ical commodities, optimum/minimal storage temperature is within 10 and 15 °C, andtherefore their storage life is usually short. It is important to know each variety’sstorage behaviour in order to establish optimal temperature range to minimisephysiological activity without causing chilling injury.
In general, the optimum storage temperature for most of the cultivated bananasis 13 to 14 °C, depending on the variety, maturity stage, and preconditioning treat-ments at the packinghouse, with a relative humidity between 90–95%. Maintainingadequate air circulation during storage and transport is critical to maintain adequateand uniform temperature and gas concentration. These conditions delay softeningand water loss, and insure a postharvest life of 1–4 weeks (Abdullah and Pantastico,1990). Lower temperatures cause chilling injury and higher temperatures accel-erate ripening and senescence. The optimum storage temperature for ripe ‘GrosMichel’ bananas is 13 °C, while 14 °C is the optimum storage temperature for‘Valery’ bananas (Hardenburg et al., 1986). ‘Valery’ bananas stored at 11 °C showedsome browning, grooves and pitting. Maturity advanced slowly and the colour ofthe peel was dull yellow even when the fruit was completely ripe. ‘Cavendish’bananas stored at 14–18 °C exhibited a more intense green colour than those storedat higher temperatures (Rahman et al., 1995). ‘Robusta’ bananas can only be storedat 15–20 °C for three weeks without affecting their quality (Krishnamurthy, 1989).
Relative humidity affects produce quality. Low humidity stimulates water lossand wilting. A high relative humidity is beneficial for wounds healing process,however, it may also promote fungal development.
12. CHILLING INJURY
Bananas are very sensitive to chilling injury (CI), when the fruit is exposed totemperatures below 13 °C. CI symptoms include surface discoloration, dull or muddycolour (instead of the bright yellow colour), subepidermal tissues reveal dark-brown streaks, failure to ripen, and flesh browning, in severe cases. CI symptomscan appear after exposure to low temperature for a few hours to a few days,depending on cultivar, conditions and handling practices before harvest, maturitystage, and temperature. For example, moderate CI will result from exposing mature-green bananas to one hour at 10 °C, 5 hours at 11.7 °C, 24 hours at 12.2 °C, or72 hours at 12.8 °C. Low temperature injured fruits become very sensitive to mechan-ical injury and to decay.
13. PATHOLOGICAL DISORDERS
Important pathological disorders that can affect banana fruit include crown rot,anthracnose, stem-end rot and cigar-end rot. Crown rot is caused by one or moreof the following fungi: Thielaviopsis paradoxa, Lasiodiplodia theobromae,
Integral Handling of Banana 157

Colletotrichum musae, Deightoniella torulosa, and Fusarium roseum. These attackthe cut surface of the hands, and the fungi grow from the rotting hand tissue intothe finger neck, and down into the fruit. Anthracnose is caused by Colletrichummusae, and becomes evident as the bananas ripen, especially in wounds and skinsplits. Stem-end rot is caused by Lasiodiplodia theobromae and/or Thielaviopsisparadoxa, which enter through the cut stem or hand. The invaded flesh becomessoft and water-soaked. Cigar-end rot is caused by Verticillium theobromae and/orTrachysphaera fructigena, where the rotted portion of the banana finger becomesdry and tends to adhere to the rest of the fruit, and appears as the ash of acigar.
14. MODIFIED AND CONTROLLED ATMOSPHERES
Atmosphere composition affects the postharvest life and quality of produce. Storageperiod may be extended if oxygen and carbon dioxide levels are modified. It iscommon to resort to this storage technique as a low temperature storage comple-ment. Some gases, emanated from the fruits themselves may accumulate in thestorage atmosphere, affecting fruit postharvest life and quality. The most impor-tant are carbon dioxide and ethylene.
Controlled (CA) and modified atmosphere (MA) involve the creation of dif-ferent atmosphere from the normal one. Carbon dioxide, oxygen, nitrogen, ethyleneand carbon monoxide may be manipulated in both cases. In the case of a CA,gases are precisely controlled, i.e., by means of special valves to dosify them andanalysers that measure the exact amounts of each of them. MA consists only inaltering the normal atmospheres without a precise gas control, i.e., by just lettingproduce breath, lowering oxygen levels by using it for respiration and increasingCO2 by letting its accumulation (Abdullah and Pantastico, 1990).
One of the most common ways to create a modified atmosphere is by the useof polymeric films as gas exchange barriers. There is a big list of films with thesecharacteristics, different with respect to their permeability to different gases andwater vapour, easiness to seal, mechanical resistance, product compatibility, etc.Suitable film is selected depending on the type of food and needed atmosphere(Yahia, 1992, 1997, 1998).
Modified (MA) and controlled (CA) atmospheres are very effective for delayingthe ripening and for prolonging the postharvest life of mature-green bananas. Thesetechniques are commonly used, especially during marine transport of bananas. Themost common technique used is called ‘Banavac’, which comprises in packing thefruit in a polyethylene liner of about 0.04 mm (1.5 mil) thickness, then the bag isevacuated, commonly using a house vacuum cleaners, and sealed. Only green fruitshould be used, and it is essential to avoid punctured bags. Ideal gas concentra-tions are 2–5% O2 and 2–5% CO2. MA and CA reduce respiration and ethyleneproduction rates.
Potential postharvest life of mature-green bananas are 2–4 weeks in air and 4–6weeks in MA/CA at 13–14 °C.
It is important to avoid the exposure of fruit to concentrations less than 1% O2
158 Lourdes Yañez et al.

and/or higher than 7% CO2, which may cause fermentation, undesirable textureand flavour.
M/CA extends the storage life of green bananas (Elyatem et al., 1984; Brown,1981; Kanellis et al., 1989; Liu, 1976a; Liu, 1976b; Liu, 1970; Mapson andRobinson, 1966; Quazi and Frebairn, 1970; Satyan et al., 1982a; Satyan et al., 1982b;Scott, 1975; Scott, 1971; Scott and Chaplin, 1978; Scott and Gandanegara, 1974;Scott et al., 1970; Scott and Robert, 1966; Smock, 1967; Woodruff, 1969b). Bananasrespond very well to M/CA when the fruit is at the pre-climacteric stage (Smock,1979). Optimum atmospheres differ for different cultivars but are about 2 to 5%O2 and 2 to 5% CO2, and optimum temperature for M/CA storage is 13 °C (Woodruff,1969b). Cooking bananas and plantains have similar CA requirements (Satyan et al.,1982b). Atmospheres containing 5% O2 and 5% CO2 were found to be suitablefor ‘Gros Michel’ bananas held for 20 days at 12 °C (Wardlaw, 1940). ‘Lacatan’ and‘Dwarf Cavendish’ bananas were kept for 3 weeks in atmospheres containing 6 to8% CO2 and 2% O2 at 15 °C (Smock, 1967). The recommended atmosphere for 2Malaysian cultivars of banana at 20 °C and 80% RH was 5 to 10% CO2 and acontinuous removal of ethylene (Broughton and Wu, 1979). Atmosphere of 1%O2 inhibited ripening in green bananas and was considered as the lower limit at15.5 °C (Parson et al., 1964). O2 concentration less than 1% cause fruit injurywhich include dull yellow to brown skin discoloration, failure to ripen, flaky grayflesh, and off-flavours (Parsons et al., 1964). However, 1% O2 was reported by otherresearchers (Mapson and Robinson, 1966; Chiang, 1970) to result in poor qualityand more stalk rot. Furthermore, research by Hesselman and Freebairn (1986) indi-cated that O2 levels less than 2.5% affect the taste of ‘Valery’ bananas. CO2
concentration higher than 5% are reported to result in undesirable flavour and textureafter fruit ripening (Woodruff, 1969b). CO2 level of 10% was considered to be theupper limit for ‘Gros Michel’ bananas (Gane, 1936).
Several experiments were conducted with storage of bananas in CA sealedrooms (Woodruff, 1969b). Rooms were flushed with N2 to reduce the O2 level andsupplemental CO2 was added. Water scrubber was used to control the CO2 con-centration. Purifiers containing brominated, activated carbon were used to absorbvolatiles (including ethylene). CA markedly reduced the crown rot. Woodruff (1969b)listed 4 advantages of CA storage of bananas including (1) fruit can be held forlong periods without significant ripening or turning. (2) lower rots and moulds.(3) maintains a fresher appearance fruit, and (4) more flexibility in coping withglutted markets. However, there has been no commercial CA storage for bananas.Bananas are available all year around, and therefore there was no need for long-termstorage. Gas tight CA chamber would have to be belt aboard marine ships, sincemost of the postharvest life of bananas is maintained on transit. In the past thiswas not technologically feasible, however, the recent advances in CA technologyand marine containers allow the application of CA aboard marine ships.
MA has been used commercially for the last 3 decades during marine ship-ments of banana (Woodruff, 1969a; b; Yahia, 1997; 1998). In this system, greenfruits are usually packed in polyethylene bags of about 0.04 mm (1.5 mil) thick-ness, which are then evacuated (usually using a vacuum cleaner) and sealed(Woodruff, 1969a). High temperature at the time of evacuation accelerate the estab-
Integral Handling of Banana 159
lishment of the desirable atmosphere (Woodruff, 1969b). The atmosphere in thesebags usually averages about 2.5% O2 (1 to 4.5%) and 5% CO2 (4 to 6%) after 3to 4 weeks. This system has been called ‘Banavac’ by United Fruit Company(Smock, 1979; Woodruff, 1969b). Bananas can be held satisfactory for 30 daysby this method without ripening, and can be maintained green for 60 days but rotsincrease and quality declines after 30 days (Woodruff, 1969b). Fermentationproblems have occurred in up to 1% of fruits shipped in this system (Woodruff,1969a). Only green fruits should be used, and care should be taken not to usepunctured bags. Punctured bags will not allow the development of an appropriateatmosphere. Ripe fruits would increase the accumulation of ethylene inside the bags,and would further stimulate fruit ripening. Ethylene concentration of 10 ppm accel-erated the ripening of ‘Valery’ bananas (Woodruff, 1969b). A concentration of 10ppm or more of ethylene can also stimulate the softening of green fruit (Chiang,1968), a condition known as ‘soft-green’ (Woodruff, 1969b) or ‘green ripeness’(Scott, 1975). High temperature and high CO2, and low O2 in the storage atmospherewere suggested to be the main factors causing this disorder, however, the exact mech-anism is not fully understood (Zhang et al., 1993). The use of ethylene absorbentagents such as potassium permanganate absorbed on aluminium silicate or vermi-culite inside the bags can prevent this disorder and prolong the postharvest life ofthe fruit (Liu, 1970; Scott, 1975; Scott et al., 1968). Ethylene removal with bromi-nated carbon was found to extend the storage life of ‘Lacatan’ and ‘Cavendish’bananas held in 2–3% O2 and 8% CO2 (Smock, 1979), and was found to be moreeffective than using molecular sieve 5A in a continuous air and C2H4 stream (Chiang,1968). The use of MA for bananas was found to prolong their storage life even atambient temperatures (Scott and Gandanegara, 1974).
The use of sealed polyethylene (0.1 mm thickness) containing 100 g vermi-culite impregnated with a saturated solution of KMnO4 allowed a storage life of‘Williams’ bananas for up to 6 wks at 20 to 28 °C and 16 wks at 13 °C (Satyanet al., 1982a, b). Storage of green mature ‘Cavendish’ bananas in low densitypolyethylene bags (0.05 mm thickness) for up to 30 days at 8, 11 and 14 °C devel-oped an in-package atmosphere of 3 to 11% O2 and 3 to 5% CO2 (Hewage et al.,1995). However, these authors reported that these storage conditions did not affectripening and sensory quality, nor did alleviate CI symptoms developed at 8 and11 °C. ‘Emas’ bananas stored in polyethylene bags (0.04 mm thickness) for 6 daysat 24 °C generated an atmosphere of up to 3.015% C2H4, up to 14.6% CO2, andas low as 2.9% O2 (Tan et al., 1986). Accumulation of 10% CO2 or more, espe-cially from day 3 to day 6, and an O2 concentration below 2% in the bags causedabnormal ripening when fruit was ripened later in air. Fruit had skin and pulpdarkening, and softening of the inner portion of the pulp, even though the outerportion remained hard. Water insoluble protopectins decreased, and water solublepectin and pectates increased in wrapped fruits. The authors suggested that aminimum of 10% CO2 for few days is required to cause injury in ‘Emas’ bananas.Storage life was doubled in the absence of an ethylene absorbent and tripled whenan absorbent (potassium permanganate on aluminium oxide) was used. Severalcultivars of cooking banana (Bluggoe, Pacific plantain, Blue Lubin, and PisangAwak) behaved similarly to the dessert cultivar ‘Cavendish’ when stored in poly-
160 Lourdes Yañez et al.

ethylene bags (0.1 mm) with or without an ethylene absorbent (potassium per-manganate on aluminium oxide) at 7, 13, 20, and 28 °C (Satyan at al., 1982b).The storage life increased by a factor of two in the absence of an ethylene absorbentand a factor of three in the presence of the ethylene absorbent. CO2 concentrationinside the packages increased up to 15%, and concentrations as high as 32% werereported at the end of storage. Packaging with or without ethylene absorbent hadno effect on the incidence of CI neither in the cooking banana cultivars nor in‘Cavendish’. The authors claimed that this method of sealing in polyethylene bags‘appears to be an alternative method to refrigeration’.
Jiang et al. (1999) studied the effect of 1-MCP (1-methylcyclopropane), combinedwith polyethylene bags on banana fruit ripening, and found that treatment with 1-MCP delayed peel colour change, as well as respiration and ethylene evolutionsuppression. Therefore, application of 1-MCP combined with the use of polyeth-ylene films could be a technological alternative to transport green banana fruitsfor long distances.
Liu (1976a) suggested pre-treatment of the fruit with ethylene at the produc-tion or packing site before storage or shipping, to avoid post shipping treatmentdue to high costs, and to provide even ripening. ‘Dwarf Cavendish’ pre-treatedwith ethylene and stored for 28 days in 1% O2 or in 0.1 atmospheric pressure at14 °C remained green and firm until the end of storage, and started to ripen almostimmediately after being placed in air at 21 °C without additional ethylene treatment.However, the period of ethylene pre-treatment is critical and should not exceed a‘threshold length of time (TLT)’. The TLT is defined by Liu (1976b) as the minimumtime required for a fixed concentration of ethylene treatment to induce bananaripening response. Only bananas which had been pre-treated with ethylene for aperiod equal to TLT were successfully stored in CA (Liu, 1976a). Neither CA norLP could prevent the ripening of bananas pre-treated with ethylene for a periodslightly longer than TLT. Fruits are not uniform in their TLT. Commercially maturebananas may have TLT between 4 and 20 hr, and a test for TLT requires 1 to 2days (Liu, 1976b). Therefore, from a practical point of view the author concludedthat it would be extremely difficult to select large lots of fruit with uniform TLT,and thus the potential hazard of fruit ripening during storage or shipping afterexcessive ethylene pre-treatment jeopardise the commercial applicability of thismethod.
Treatment with Pro-long (a mixture of sucrose esters of fatty acids and sodiumsalt of carboxymethylcellulose) extended the shelf-life of bananas (Banks, 1984a;Lowings and Cuts, 1982).
‘Gros Michel’ bananas held in a LP of 150 mm Hg at 15 °C were maintainedlonger in a better quality than those held in normal pressure (Burg and Burg,1966). Fruits held in LP of 760, 250, and 80 mm Hg at 14 °C were reported to bemaintained for 30, 60, and at least 120 days, respectively. The authors reportedthat fruits had an acceptable texture, taste, and aroma, and no injury.
The quality of green bananas was not affected when fruits were held for up to7 days in 100% N2 at 15.5 °C, but had dark-brown to black skin blemishes whenfruit was held for 10 days (Parsons et al., 1964). After 4 days in 100% N2 at15.5 °C, fruits ripened to a normal colour and flavour in 13 days at 20 °C. However,
Integral Handling of Banana 161

fruit failed to ripen in air, and developed decay, brown skin discoloration, andoff-flavour after storage in 100% N2 for 7 days. Fruits ripened normally in air at20 °C after being held in 99% N2 and 1% N2 at 15.5 °C for 10 days.
Low O2 (2.5%) suppressed the activity of acid phosphatase and the addition of500 µl of ethylene to the low O2 atmosphere did not reverse this suppression(Kanellis et al., 1989). However this atmosphere either alone or in combination with500 µl ethylene prevented the decline in the activity of pectin methyl esterase.Kanellis et al. (1989) suggested that there was differential effects of low O2 on meta-bolic processes since that the accumulation of sugars increased gradually for 4days in low O2, but no increase in acid phosphatase was observed throughout theduration of the low O2 treatment. Low O2 (3%) limited the operation of the Krebscycle in fruits of Musa paradisiaca L., but high CO2 showed no rate limiting stepsin this cycle (McGlasson and Wills, 1972).
Optimum atmosphere composition for bananas is 2 to 5% O2 and 2 to 5% CO2.These atmospheres delay fruit ripening without causing any deleterious effects.CA can maintain the fruit for a longer period in good quality. LP also can maintainthe fruit for a longer period in a very acceptable quality. However, due to availabilityof the fruit almost all year around and because of cost considerations, storage inCA and LP are not commercially used.
Research needs for this fruit include the cost and technological feasibility ofthe establishment and use of CA, especially on board of sea ships. Metabolic studiesto further investigate causes and methods to ameliorate CI symptoms are also needed.
The inadequate use of CA and MA may cause physiological disorders, and eventhe total produce loss of the product. Too low O2 levels and/or too high CO2 levels(depending on the type of produce) can stimulate off-flavours and off-odours dueto fermentative metabolites.
15. ARTIFICIAL RIPENING
Climacteric fruits, such as bananas, are commonly harvested before they acquiretheir ideal consumption stage for practical handling purposes. When they arrive attheir destiny they are ripened under controlled temperature and relative humidity,and under certain gases action such as ethylene. Low relative humidity activatesmaturation but increases darkening and wilting (Yanbin et al., 1996). An addi-tional advantage to controlled maturation is the process uniformity.
Bananas ripened on the plant often split, have poor texture, and tend to bemealy, and therefore they are harvested mature-green and ripened at arrival to themarket. Banana should be green and firm on arrival to destination.
Ideal conditions for ripening are as follows:
• Temperatures: 15–20 °C• Relative humidity: 90–95%• Ethylene concentration: 100–150 ppm• Duration of treatment: 24 to 72 hours depending on fruit maturity stage, and
desired speed of ripening.
162 Lourdes Yañez et al.

• Carbon dioxide concentration should be kept below 1% to avoid ripening inhi-bition.
• Ripening rooms should be well insulated and sufficiently airtight. Adequate aircirculation is needed to provide uniform temperature, and to eliminate the build-up of gases (ethylene and CO2).
The ripening process should be controlled depending on the initial stage ofmaturity of the fruit, the desired final maturity stage, the market demand, and theconsumer preference. These aspects can be easily controlled by manipulating thetemperature, ethylene concentration, and exposure duration.
Ethylene at a concentrations of 3 to 34% in air by volume (30,000 ppm or higher)is explosive. The maximum concentration needed for ripening is very low comparedto the explosive range, but care should be taken to secure its safe use.
In order to insure a good flavour as well as a bright yellow peel colour, greenfruits at physiological maturity stage, have to be artificially ripened by ethylenegas injection within sealed ripening chambers and at a controlled temperature.After ethylene application, chamber remains sealed for 24 hours, after which maturitychamber must be aired out, allowing for an atmosphere composition exchange. Underaverage conditions, ripening period may be as short as 4 days, if high tempera-tures are used, or it may be extended between 8 and 10 days at lower temperatures(Robinson, 1996). If ripening temperature is rather high ripened fruit will developsoft pulp, while peel colour will remain green-yellow. Inversely, if ripening tem-perature is lower than 13 °C it will cause peel damage, expressed as a greyish colour.Lack of ripening uniformity can also be caused by low temperatures and insufficientethylene levels in the chamber (Robinson, 1996).
Artificially applied ethylene accelerates banana maturation at concentrations aslow as 0.1 to 1 ppm in some cultivars (Abdullah and Pantastico, 1990). Ethyleneat 1, 100 and 1000 ppm for a 24 hour period accelerated the ripening of ‘Latundan’bananas in a way related with higher ethylene levels (Inaba and Nakamura, 1986).Ethylene application accelerated banana ripening during their storage at differenttemperatures by altering peel chlorophyll degradation (Kajuna et al., 1995). Bananatexture decreased as a result of ethylene application (Kajuna et al., 1997). Ethrelapplication as pre- or post-harvest spraying or immersion at 500 ppm proved tobe effective in accelerating banana ripening. Fruits ripen within 2–3 after treat-ment at ambient temperature. Fruit physiological response to ethrel treatment issimilar to that of fruits treated with ethylene, although a lower concentration isneeded for the latter. Acetylene, an ethylene analogous, simulates ethylene actionthus fruit ripening. However, minimal acetylene required to induce banana ripeningis 1 ml/L (Abdullah and Pantastico, 1990). Smith and Thompson (1987) studiedthe effect of acetylene concentrations at different exposure times and differenttemperatures at the beginning of fruit ripening process. They reported that fruitsexposed to acetylene at a concentration of 0.5–1.0 ml/L at 14–16 °C for 72 hoursripened with respect to total soluble solids and pulp firmness.
Integral Handling of Banana 163
16. RECOMMENDATIONS
1. Produce high quality fruit.2. Minimise bruising during harvesting, transport and packing.3. Cool the fruit rapidly to 14 °C.4. Avoid chilling injury by not exposing the fruit to temperatures below 13 °C.5. Provide adequate sanitation of handling facilities.6. Establish adequate control of the ripening process.7. Avoid using high concentrations of ethylene during the ripening process to
eliminate the danger of explosion.8. Fungicide treatments such as with Imazalil and Thiabendazol are effective for
decay control.9. Modified or controlled atmospheres are very effective for prolonging the life
of the fruit, especially during marine transport.
ACKNOWLEDGEMENTS
We thank Dr. William J. Etges and Ms. Margot Martin for their critical review ofthe manuscript, and Ms. Rocio Martinez-Jarque for the drawings.
REFERENCES
Abdullah, H., M. C. C. Lizada, S. C. Tan, B. Pantastico Er. and S. C. Tongdee (1990). Storage of banana.In H. Abdullah and B. Pantastico Er. (Eds.), Banana: Fruit development, postharvest physiology,handling and marketing in ASEAN. ASEAN Food Handling Bureau, pp. 44–64.
Abdullah, H. and B. E. Pantastico (1990). Banana Fruit Development, Postharvest Physiology, Handlingand Marketing in ASEAN. Indonesia pp. 33–103.
Abeles, F. B., P. W. Morgan and M. E. Saltveit (1992). Ethylene in Plant Biology, 2nd ed. AcademicPress, New York, pp. 26–83.
Al-Zaemy, A. B. S., I. B. Falana and A. K. Thompson (1989). Effects of permeable fruit coatings onthe storage life of plantain and bananas. Aspects of Applied Biology 20: 73–80.
Anonymous (1980). Manual de Prácticas Recomendadas para la Precosecha, Cosecha, Transporte,Selección y Clasificación, Envasado y Conservación de Banano en Estado Fresco. Manuales dePrácticas Recomendadas. Departamento de Normalización e Inspección de Calidad Frutícola.Subdirección Comercial. Comisión Nacional de Fruticultura SARH. PRM-FF-CNF-II. CONAFRUT,México, 56 pp.
Apelbaum, A., Y. Aharoni and N. Temkin-Gorodeiski (1977a). Effects of sub atmospheric pressureon the ripening processes of banana fruit. Trop. Agric. (Trinidad) 54: 39–46.
Badran, A. M. and L. Lima (1969). Controlled Atmosphere Storage of Green Bananas. U.S. Patent3,450,542.
Banks, N. H. (1983). Evaluation of methods for determining internal gases in banana fruit. Journal ofExperimental Botany 34: 871–879.
Banks, N. H. (1984a). Some effects of TAL Pro-long coating on ripening bananas. Journal ofExperimental Botany 35: 127–137.
Banks, N. H. (1984b). Studies on the banana fruit surface in relation to the effects of TAL prolongcoating on gaseous exchange. Scientia Horticulturae 24: 279–286.
Belalcazar, C. S. (1991). EL cultivo del plátano en el trópico. In Manual de Asistencia Técnica. No.50. JCA, CIID. Comité Departamental de Cafeteros del Quindío, INIBAP. Armenia, Cali, Colombia.pp. 21–102.
164 Lourdes Yañez et al.

Broughton, W. J. and K. F. Wu (1979). Storage conditions and ripening of two cultivars of banana.Scientia Horticulturae 10(1): 83–93.
Brown, D. J. (1981). The effects of low O2 atmospheres and ethylene and CO2 production, and1-aminocyclopropane-1-carboxylic acid concentration in banana fruits. MS Thesis, University ofMaryland, College Park.
Burg, S. P. and E. A. Burg (1966). Fruit storage at sub atmospheric pressures. Science 153: 314–315.
Burdon, J. N. (1997). Postharvest handling of tropical and subtropical fruit for export. In Mitra (ed.),Postharvest physiology and storage of tropical and subtropical fruits. S. CAB International, London,pp. 1–19.
Champion, J. (1986). El Plátano. Técnicas Agrícolas y producciones Tropicales. Instituto del Libro.2nd ed. Blume, España, pp. 169–179.
Chiang, M. N. (1970). The Effect of Temperature and the Concentration of O2 and CO2 upon theRespiration and Ripening of Bananas, Stored in a Controlled Atmosphere. Spec. Publ. Coll. Agric.Nat. Taiwan Univ., Taipei, Taiwan, 11: 1–13.
Chiang, M. N. (1968). Studies on the Removal of Ethylene from CA-storage of Bananas. Spec. Publ.Coll. Agric. Nat. Taiwan. Univ. No. 20, Taipei, Taiwan.
Clendennen, S. K., P. B. Kipp and G. D. May (1997). The role of ethylene in banana fruit ripening.In A. K. Kanellis, C. Chang, H. Kende and D. Grierson (eds.), Biology and biotechnology of theplant hormone ethylene. 3. High Technology – Vol. 34. NATO ASI Series. Kluwer AcademicPublishers. London. pp. 141–148.
Colinas L. M. T. (1992). Desórdenes fisiológicos de productos hortícolas. In E. M. Yahia and C. I.Higuera (eds.), Fisiología y tecnología postcosecha de productos hortícolas. Centro de Investigaciónen Alimentación y Desarrollo, Limus,. Grupo Noriega Editores, México, pp. 65–71.
Compañía Frutera de Sevilla (1995). Instructivo de Protección de Fruta. Santa Marta, Colombia,47 pp.
Corporación Colombiana de Investigaciones Agropecuarias (CCIA) (1996). Tecnología del Eje Cafeteropara la Siembra y Explotación Rentable del Cultivo del Plátano. Tercer Informe Técnico. ComitéDepartamental de Cafeteros, Armenia, Colombia, 130 pp.
Domínguez, M. and M. Vendrell (1993). Ethylene biosynthesis in banana fruit: Evolution of EFE activityand ACC levels in peel and pulp during ripening. Journal of Horticultural Science 68(1): 63–70.
Elyatem, S. M., N. H. Banks and A. C. Cameron (1994). Oxygen concentration effects on ethyleneproduction by ripening banana tissue. Postharvest Biology & Technology 4: 343–351.
Esguerra, E. B., K. Kawada and H. Kitagawa (1993). Responses of Senorita and Cavendish bananasto postharvest control treatments. ASEAN Food Journal 8(2): 6–9.
FAO (2001). FAOSTAT Database. FAO, Rome, Italy.Fuchs, Y. and N. Temkin-Forodeiski (1971). The course of ripening of banana fruits in sealed poly-
ethylene bags. Journal of the American Society for Horticultural Science 96: 401–402.Gane, R. (1936). A study of the respiration of bananas. New Phytol. 35: 383.Gutiérrez, M. P., L. M. Gómez and G. R. López (2001). Identification of an ETR-1 homologue from
mango fruit expressing during fruit ripening and wounding. Journal of Plant Physiology 158:101–108.
Hardenburg, E. R., E. A. Watada and Y. C. Wang (1986). The Commercial Storage of Fruits, Vegetables,and Florist and Nursery Stocks. United States Department of Agriculture Handbook, U.S.A.,No. 66.
Hesselman, G. W. and H. T. Freebairn (1986). Rate of ripening of initiated bananas as influenced byoxygen and ethylene. Journal of the American Society for Horticultural Sciences 94: 635–637.
Hewage, S. K., H. Wainwright, S. W. Wijerathnam and T. Swinburne (1995). The modified atmos-phere storage of bananas as affected by different temperatures. In A. Ait-Oubahou and M. El-Otmani(eds.), Postharvest physiology and technologies for horticultural commodities: Recent advances.Institut Agronomique & Vétérinaire Hassan II, Agadir, Morocco, pp. 172–176.
Ibrahim, K., A. B. Abu-Goukh and K. S. Yusuf (1994). Use of ethylene, acetylene and ethrel onbanana fruit ripening. Journal of Agricultural Sciences 2(1): 73–92.
Inaba, A. and R. Nakamura (1986). Effect if exogenous ethylene concentration and fruit temperatureon the minimum treatment time necessary to induce ripening in banana fruit. Journal of the JapaneseSociety for Horticultural Sciences 55(3): 348–354.
Integral Handling of Banana 165

Israeli, Y. and E. Lahav (1987). Banana. In P. S. Monselise (ed.), Handbook of fruit set and develop-ment. CRC Press Inc., Florida, U.S.A. pp. 45–73.
Jiang, Y., D. C. Jayce and J. Macnish (1999). Extension of the shelf life of banana fruit by 1-methyl-cyclopropene in combination with polyethylene bags. Postharvest Biology & Technology 16:187–193.
Kajuna, S. T. A. R., W. K. Bilanski and G. S. Mittal (1995). Color control in bananas and plantainsin storage. Harvest and postharvest technologies for fresh fruit and vegetables. Proceedings of theInternational Conference. Guanajuato. ASAE, México, pp. 601–608.
Kajuna, S. T. A. R., W. K. Bilanski and G. S. Mittal (1997). Textural changes of banana and plantainpulp during ripening. Journal of the Science of the Food and Agriculture 75(2): 244–250.
Kanellis, A. K. and T. Solomos (1985). The effect of low oxygen on the activities of pectin-methylesterase and acid phosphatase during the course of ripening of bananas. In S. M. Blankenship(ed.), Proc. 4th Nat. CA Res. Conf., Hort. Rpt. No. 126, Dept. Hort. Sci., North Carolina StateUniv., Raleigh, NC, pp. 20–26.
Kanellis, A. K., T. Solomos and A. K. Matoo (1989). Changes in sugars, enzymic acitivities and acidphsophatase Isoenzyme profiles of bananas ripened in air or stored in 2.5% O2 with and withoutethylene. Plant Physiology 90: 251–258.
Krishnamurthy, S. and C. G. Kushalappa (1985). Studies on the shelf life and quality of Robusta bananasas affected by post-harvest treatments. Journal of Horticultural Science 60: 549–556.
Kotecha, P. M. and B. B. Desai (1995). Banana. In Handbook of fruit science and technology. Production,composition, storage and processing. Marcel Dekker, Inc. pp. 67–90.
Krishnamurthy, S. (1989). Storage life and quality of Robusta banana in relation to their stage of maturityand storage temperature. Journal of Food Science and Technology 26(2): 87–89.
Lagunes, T. A. and Rodríguez M. J. C. (1988). Plátano. In: Combate Químico de Plagas Agrícolasen México, Centro de Entomología y Acarología, Colegio de Postgraduados, Institución de Enseñanzaen Ciencias Agrícolas, México, pp 234.
Laville, B. (1977). Produce Top Quality Bananas. Windward Islands Banana Growers Association,Ed., Topical Products Institute, London, 12 pp.
Liu, F. W. (1978). Ripening banana with ethephon in three polymeric film packages. HortScience 13(6):688–690.
Liu, F. W. (1976a). Storing ethylene-pretreated bananas in controlled atmosphere and hypobaric air.Journal of the American Society for Horticultural Science 101: 198–201.
Liu, F. W. (1976b). Correlation between banana storage life and minimum time required for ethyleneresponse. Journal of the American Society for Horticultural Sciences 101: 63–65.
Liu, F. W. (1970). Storage of bananas in polyethylene bags with an ethylene absorbent. HortScience5: 25–27.
Lizada, C. C., A. B. Agillon, L. A. Artes and E. V. Labios, E. V. (1986). Physiological characteriza-tion of some banana cultivars subjected to modified atmosphere storage. HortScience 21: 811(Abstract).
Lizada, M. C., E. B. Pantastico, A. R. Shukor and D. S. Sabari (1990). Ripening of banana. In: Bananafruit development, postharvest physiology. Handling & Marketing in ASEAN, pp. 65–83.
Lowings, P. H. and D. F. Cuts (1982). The preservation of fresh fruits and vegetables. IFST proceed-ings 15: 52–54.
Mapson, L. W. and J. E. Robinson (1966). Relation between O2 tension, biosynthesis of ethylene,respiration and ripening changes in banana fruit. Journal of Food Technology 1: 215–225.
McGlasson, W. B. and R. B. H. Wills (1972). Effects of oxygen and carbon dioxide on respiration,storage life, and organic acids of green bananas. Australian J. Bio. Sci. 25: 35–42.
Medlicott, A. P., A. J. Semple, J. Thompson, H. R. Blackbourne and A. K. Thompson (1992).Measurement of color changes in ripening bananas and mangoes by instrumental, chemical and visualassessments. Tropical Agriculture (Trinidad) 69(2): 161–166.
Montero, E. H. (1998). Manejo Post-Cosecha y Comercialización del Plátano (Musa spp. GrupoAAB). Serie de Paquetes de Capacitación sobre Manejo Post-Cosecha de Frutas y HortalizasNo. 15. Programa Post-Cosecha, Convenio SENA-Reino Unido, NRI. DFID., México, 500 pp.
Morton, J. (1987). Banana. In Fruits of warm climates. Miami, Florida, U.S.A., pp. 29–46.Nair, H. and H. F. Tung (1992). Low oxygen effect and storage of Mas bananas (Musa, AA group).
166 Lourdes Yañez et al.

In W. M. W. Othman, R. Mohamad, S. H. Ahmad and K. K. Chong (eds.), Recent advances inhorticultural science in the tropics. International Society for Horticultural Science, Wageningen,Netherlands, pp. 209–215.
Olorunda, A. O. (1976). Effect of ethylene absorbent on the storage life of plantain packed in poly-ethylene bags. Nigerian J. Sci. 10(1/2): 19–26.
Olorunda, A. O., M. Meheriuk and N. E. Looney (1978). Some postharvest factors associated withthe occurrence of chilling injury in banana. Journal of the Science of Food and Agriculture 29(3):213–218.
Palmer, J. K. (1971). The banana. In A. C. Hulme (ed.), The biochemistry of fruits and their products.Chapter 2, Vol. 2. Academic Press, A.R.C. Food Research Institute, Norwich, England. pp. 65–105.
Parsons, C. S., J. E. Gates and D. H. Spalding (1964). Quality of some fruits and vegetables afterholding in nitrogen atmospheres. Journal of the American Society for Horticultural Science 84:549–566.
Quazi, M. G. and H. T. Freebairn (1970). The influence of ethylene, oxygen and carbon dioxide onthe ripening of bananas. Bot. Gaz. 131: 5–14.
Rahman, N. A., W. Yuqing and K. Thompson (1995). Temperature and modified atmosphere pack-aging effects on the ripening of banana. Harvest and Postharvest technologies for fresh fruit andvegetables. In: Proceedings of the international conference, ed. ASAE. Guanajuato, México,pp. 313–321.
Robinson, J. (1996). Bananas and Plantains. CAB-International, U.S.A.Salunkhe, D. K. and B. B. Desai (1984). Banana and plantain. In Postharvest biotechnology of fruits.
Chapter 4. ed. CRC Press, Inc. Boca Raton, Florida, U.S.A., pp. 43–57.Satyan, S. H., K. J. Scott and D. Graham (1982a). Storage of banana bunches in sealed polyethylene
tubes. Journal of Horticultural Science 67: 283–287.Satyan, S. H., K. J. Scott and D. J. Best (1982b). Effects of storage temperature and modified atmos-
pheres on cooking bananas grown in New South Wales. Tropical Agriculture 69: 263–267.Scott, K. J. (1975). The use of polyethylene bags to extend the life of bananas after harvest. Food
Technol. Aust. 27: 481–482.Scott, K. J. (1971). Polyethylene bags and ethylene absorbent for transporting bananas. Agric. Gaz. NSW
82: 267–269.Scott, K. J., J. R. Blake, G. Strachan, B. L. Tugwell and W. B. McGlasson (1971). Transport of
bananas at ambient temperature using polyethylene bags. Tropical Agriculture (Trinidad) 48:245–254.
Scott, K. J. and G. R. Chaplin (1978). Reduction of chilling injury in avocados stored in sealed poly-ethylene bags. Tropical Agriculture (Trinidad) 55(1): 87–90.
Scott, K. J. and S. Gandanegara (1974). Effect of temperature on the storage life of bananas held inpolyethylene bags with ethylene absorbent. Tropical Agriculture (Trinidad) 51: 23–26.
Scott, K. J., W. B. McGlasson and E. A. Roberts (1970). Potassium permanganate as an ethyleneabsorbent in polyethylene bags to delay ripening of bananas during storage. Aust. J. Exp. Agric.Anim. Husb. 10: 237–240.
Scott, K. J., B. McGlasson and E. A. Roberts (1968). Ethylene absorbent increase storage life of bananaspacked in polyethylene absorbent. Agric. Gaz. N.S.W. 79: 52–xxx.
Scott, K. J. and E. A. Roberts (1966). Polyethyelene bags to delay ripening of bananas during trans-port and storage. Aust. J. Exp. Agric. & Anim. Husb. 6: 197–199.
Senser, F. and H. Scherz (1999). Plátano, banane. In Tablas de compopsición de alimentos. Edicióndel Deutsche Forschungsanstalt für Lebersmittelschemie, Garching bei München, ed. Acribia. S.A.España, pp. 367.
Seymour, G. B. (1993). Banana. In G. B. Seymour, J. E. Taylor and G. A. Tucker (eds.), Biochemistryof fruit ripening, Chapter 3. Chapman & Hall, London, England, pp. 83–106.
Shorter, A. J., K. J. Scott and D. Graham (1987). Controlled atmosphere storage of bananas in bunchesat ambient temperatures. CSIRO Food Res. Q. 47: 61–63.
Smock, R. (1979). Controlled atmosphere storage of fruits. Horticultural Reviews 1: 301–336.Smock, R. M. (1967). Methods of storing bananas. Philippine Agriculturist 51: 501–517.Smith, N. S. J. and K. A. Thompson (1987). The effects of temperature, concentration and exposure
Integral Handling of Banana 167

time to acetylene on initiation of banana ripening. Journal of the Science of Food and Agriculture40(1): 43–50.
Tan, S. C. and A. M. Ali (1990). The effect of CO2 on phenolic compounds during the storage of‘Mas’ banana in polybag. Acta Horticulturae 269: 389 (Abstract).
Tan, S. C., P. E. Lam and H. Abdullah (1986). Changes of the pectic substances in the ripening ofbananas (Musa sapientum, cv. Emas) after storage in polyethylene. ASEAN Food Journal 2: 76–77.
Terranova (1995). Economía, administración y mercadeo agropecuarios. In V. I. Tomo (ed.), LaEnciclopedia Agropecuaria de Terranova Editores, Ltda. Terranova Editores Ltda. Bogotá, Colombia,304 pp.
Theologis, A. (1993). One rotten apple spoils the whole bushel. The role of ethylene in fruit ripening.Cell 70: 181–184.
Theologis, A. and G. Laties (1978). Respiratory contribution of the alternate path during variousstages of ripening in avocado and banana fruits. Plant Physiol. 62: 249–255.
Turner, D. W. (1997). Bananas and plantains. In Postharvest physiology and storage of tropical andsubtropical fruits. CAB. International, London, pp. 47–83.
Valdez, E. R. T. and D. B. Mendoza Jr. (1988). Influence of temperature and gas composition on thedevelopment of senescent spotting in banana (Musa sapientum L. cv. Bungulan). PhilippineAgriculturist 71: 5–12.
Wade, N. L. (1974). Effects of oxygen concentration and ethephon upon the respiration and ripeningof banana fruits. Journal of Experimental Botany 25: 955–964.
Wardlaw, C. W. (1940). Preliminary observations on the refrigerated gas storage of ‘Gros Michel’bananas. Tropical Agriculture (Trinidad) 17: 103–105.
Wills, R. B. H., S. Pitakserikul and K. J. Scott (1982). Effects of prestorage in low oxygen or highcarbon dioxide concentrations on delaying the ripening of bananas. Australian Journal of AgriculturalResearch 33: 1029–1036.
Woodruff, R. E. (1969a). Overseas transport of bananas. In: Controlled atmospheres for the storageand transport of horticultural crops. Proc. Natl. CA Res. Conf., Mich. State Univ., Hort. Rept. 9:54.
Woodruff, R. E. (1969b). Modified atmosphere storage of bananas. In: Controlled atmospheres forthe storage and transport of horticultural crops. Proc. Natl. CA Res. Conf., Mich. State Univ.,Hort. Rept. 9: 80–94.
Yahia, E. M. (1992). Nodified and controlled atmosphere technologies. Proc. I Latin American posthar-vest technology. México, pp. 117–135.
Yahia, E. M. (1993). Modified/controlled atmosphere storage in Mexico. In CA’93. Proceedings ofthe Sixth International CA Res. Conf., Ithaca, NY, June 14–16, 1993, pp. 570–579.
Yahia, E. M. (1997). Modified/controlled atmospheres for banana and plantain. In Adel A. Kader, CA’97Proceedings, Volume 3: Fruits other than apples and pears. University of California, Davis,U.S.A., pp. 104–109.
Yahia, E. M. (1998). Modified and controlled atmospheres for tropical fruits. Horticultural Reviews22: 123–183.
Yanbin, X., Y. Kubo and R. Nakamura (1996). Effects of humidity on the ripening characteristics ofbanana fruits. Journal of the Japanese Society of Food Science and Technology 43(5): 541–545.
Zhang, D., B. Y. Huang and K. J. Scott (1993). Some physiological and biochemical changes of‘green ripe’ bananas at relative high storage temperatures. Acta Horticulturae 343: 81–85.
168 Lourdes Yañez et al.

ECONOMICS AND ORGANISATION OF HORTICULTURALPOSTHARVEST PRODUCTION
Z. KISS L., J. BALINT, M. HOLLO AND M. JUHASZSzent Istvan University, Faculty of Horticultural Sciences, Department of Farm Management andMarketing, Budapest, Hungary
1. STORAGE OF FRUITS AND VEGETABLES
One possible way of raising income is to interpose storage, thus extending themarketing time. Another possible way of extending the marketing period is todraw new varieties into production, thus making the season of consumption longer.
The feasibility of prolonging the season means storage in order to stimulateproduction and lengthen the marketing time. Cold storage was first applied inHungary, as in other countries, to apples, and on smaller scale to pear storage.
Over the last few years, apple storage has become less and less profitable, andthe storehouses have often been used to store industrial commodities or simply rentedout for such purposes.
This has been due to the fact that the industrial commodities do not need energy-costly cooling. This kind of use of storehouses, although profitable, has contributedto deterioration in their condition.
Eighty percent of Hungarian storehouses have normal cooling, only 20% ofthem operate with regulated air condition. The whole capacity is about 200 thousandtons, which is enough to cool 40% of the apple production. This may be linked to
R. Dris and S. M. Jain (eds.), Production Practices and Quality Assessment of Food Crops,
© 2004 Kluwer Academic Publishers. Printed in the Netherlands.
169
Photo: Z. Kiss, 2002
Picture 1. Producer storehouse of ZALAGRAR Ltd. with 200 tons capacity in part of CA storage.
Vol. 3, “Quality Handling and Evaluation”, pp. 169–198.

past economic policies, in which the role of a storehouse was thrust into the back-ground. In the present situation there is hope for a favourable change.
Around the years 2005–2010, if a boom takes place in agriculture, a positiveimprovement can be envisaged as far as the renewal of refrigeration equipment,or even new buildings are concerned (Z. Kiss, 1998).
In the year 2000 130 thousand tons were stored, out of which 90 thousand in con-trolled and normal storehouses, while 35 thousand tons in storerooms (Fruit Info2001).
In the year 2000 the processing industry processed 630 thousand tons of applesrepresenting 80% of the whole apple production.
2. POSSIBILITIES OF DECREASING POSTHARVEST COST
2.1. Postharvest quality
The result of storage depends on harvest date, storage temperature, and CO2 con-centration. It also depends on varieties, different storage conditions, maturity of fruitspecies, on pre-harvest quality, the length of storage time, the bruising during harvestand on the grading equipment as well.
2.2. Cost-saving grading equipment
Good quality of apples before storage and the optimum storage circumstances haveresulted in high water tension in the apples. When the fruit growers started to sortthem in February/March the apples were so full of water that any collision couldcause bruising.
Emptying of boxes at sorting was carried out in two systems: dry bin tipper, orwet system. The wet system causes the lowest number of collisions, but this systemis also more expensive than the dry one (Picture 2). In the dry bin dumping systemthere are several aspects that can prevent fruit bruising. A hydraulic tipping systemmoves the box more smoothly, so there are fewer collisions. When we start unloadingthe apples they will meet a brush and a two-speed belt. The brush is to keep themclose to each other. As long as the apples are tight to each other they cannotcollide. From the two-speed belt the apples pass over to a quality-rolling table. Atthe change from belt to table an especially soft material is used. Then the appleswill enter the sorting machine and start on the simulator. On the simulator we candetermine the colour with a colour scan system. Then the apples will roll smoothlyin cups. When passing to the cups brushes are used, which are opened beforetouching the apples. In the cups the weight is measured. After colour and weightis known we program the computer to determine the outlet.
2.3. Decreasing bruising during packing
On the outlet a brush or a flap can guide the apples. Both systems are to overcomebruising. The apples will pass on the side of the brush and then are transferred
170 Z. Kiss L. et al.

onto the belt. Passing to the side of the brush is important as then bruising isminimised. This breaks the fall of the apples in their movement to the belt(Wehmann, 1994).
Following the procedure described one of the most crucial moments is packing.If packing is done by hand bruising is minimised (Picture 3). If you have smallbin filler then a guided tongue is necessary to overcome collisions. It has to be under-stood that without taking care of our fruits from postharvest to delivery we willnot be able to provide our customers with high quality products. This system(machine) can be applied for apple, tomato, apricot, peach, pear, paprika, etc.
3. CHANGE OF QUALITY IN DIFFERENT STORAGE CONDITIONS
During storage flesh firmness and titatrable acidity decrease, and skin colour changesas well. Thus the selling price and the profit decrease owing to quality loss(Herregods, 1994).
3.1. Influence of varieties
The firmness of Jonagold apples decreased by 20% on the average in 5 months.The best results were obtained by ultra low oxygen storage, but it is the mostexpensive storage method. The results were similar in acidity and skin colourchanges. If has been found that the lower the oxygen concentration, the slower
Economics and Organisation of Horticultural Postharvest Production 171
Photo: Z. Kiss, 2002
Picture 2. Sorting machine of apple with wet system.

the decrease of flesh firmness and of titratable acidity, while skin colour turns yellow.Quality decrease during storage influences the producer price as well. The followingtable is to show the change in producer prices in HUF.
It seemed that a 9-month long storage time is not beneficial, but a long termCA storage produces more profit.
3.2. Influence of flavour and appearance of quality
From the Table 3 it can be seen, that the best result is given by the variety Gala.We have to know that consumer considers not only these categories but also theprice, the quality, and the purchasing intention depends on the originating regiontoo.
172 Z. Kiss L. et al.
Photo: Z. Kiss, 2002
Picture 3. Packing by hand.
Table 1. Change of firmness of Jonagold apples stored in air or in controlled atmosphere (afterHerregods, 1994).
Storage atmosphere Monthly storage
O2 % CO2 % 5 6 7 8 9
21.00 0.03 100.0 100.0 95.7 80.9 78.717.00 4.00 100.0 088.9 83.2 79.6 79.601.00 1.00 100.0 087.5 83.9 77.7 76.500.70 0.70 100.0 093.4 84.3 84.3 81.6
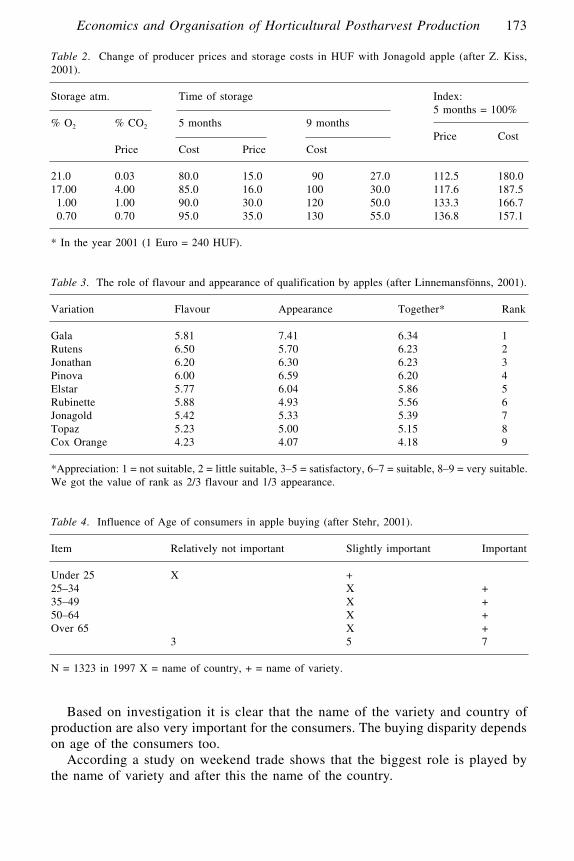
Based on investigation it is clear that the name of the variety and country ofproduction are also very important for the consumers. The buying disparity dependson age of the consumers too.
According a study on weekend trade shows that the biggest role is played bythe name of variety and after this the name of the country.
Economics and Organisation of Horticultural Postharvest Production 173
Table 2. Change of producer prices and storage costs in HUF with Jonagold apple (after Z. Kiss,2001).
Storage atm. Time of storage Index:5 months = 100%
% O2 % CO2 5 months 9 monthsPrice Cost
Price Cost Price Cost
21.0 0.03 80.0 15.0 090 27.0 112.5 180.017.00 4.00 85.0 16.0 100 30.0 117.6 187.501.00 1.00 90.0 30.0 120 50.0 133.3 166.700.70 0.70 95.0 35.0 130 55.0 136.8 157.1
* In the year 2001 (1 Euro = 240 HUF).
Table 3. The role of flavour and appearance of qualification by apples (after Linnemansfönns, 2001).
Variation Flavour Appearance Together* Rank
Gala 5.81 7.41 6.34 1Rutens 6.50 5.70 6.23 2Jonathan 6.20 6.30 6.23 3Pinova 6.00 6.59 6.20 4Elstar 5.77 6.04 5.86 5Rubinette 5.88 4.93 5.56 6Jonagold 5.42 5.33 5.39 7Topaz 5.23 5.00 5.15 8Cox Orange 4.23 4.07 4.18 9
*Appreciation: 1 = not suitable, 2 = little suitable, 3–5 = satisfactory, 6–7 = suitable, 8–9 = very suitable.We got the value of rank as 2/3 flavour and 1/3 appearance.
Table 4. Influence of Age of consumers in apple buying (after Stehr, 2001).
Item Relatively not important Slightly important Important
Under 25 X +25–34 X +35–49 X +50–64 X +Over 65 X +
3 5 7
N = 1323 in 1997 X = name of country, + = name of variety.

4. WEIGHT LOSS OF HORTICULTURAL PRODUCTS DURING LONG TERM STORAGE
Weight loss of horticultural products is basically generated by moisture loss dueto the evaporation of water from the product. It greatly depends on the vapourpressure difference (VPD) between the air in the product and the surrounding air.The smaller this VPD is the less the water loss.
This water (weight) loss depends on
– the temperature of the product– the difference in temperature between the product and the air– the relative air humidity.
Weight loss comprises CO2 loss as a result of respiration process, and waterloss by evaporation of water from the product. Water loss results in a decrease ofquality too, and water loss depends on the product variety. For instance GoldenDelicious skin has not got wax on its surface that is why water loss is higher thanby variety Idared (Scheer, 1994).
4.1. The extent of water loss
Water loss is determined by the skin feature of the product, by relative air humidity,by the temperature of the product and the air, air velocity, and the time whenvapour pressure difference is present. The rate of water evaporation can be deter-mined by the following equation:
Wprod = Mprod × mspec × dP × t (kg)
in which
Wprod = amount of water vapour from the product in kgMprod = mass of the product in kg mspec = specific water loss in kg (kg Pas)dP = vapour pressure deficitt = time in seconds
According to the equation the water loss is proportionate to the time for whichvapour pressure deficit is present. The specific water loss of the product m specis the water loss per mass, time and vapour pressure deficit. It depends, among others,on the variety, properties of the skin, mass of the individual product, vapour pressuredeficit and air velocity around the product.
Air velocity in the storage room also has a great influence on the water loss ofthe product (see Table 5)
To manage water loss by means of controlling the cooling system is only possibleby fluctuating temperatures of the product and that of the air. Water loss manage-ment during long storage only applies to products that are very susceptible towater loss, for example roots, apples, carrots, etc.
174 Z. Kiss L. et al.

5. MANAGING ULO STORAGE FOR BETTER FRUIT QUALITY
Advantages of ULO (Ultra Low Oxygen Content) storage:
– better preservation of the ground colour,– harder product, – longer display life, – less browning of the core and scald.
The problem of ULO storage is represented by a higher investment cost and amore expensive technology compared to normal method of storage. Taking invest-ment cost of normal storage for 100%, the cost of controlled atmosphere wouldbe 300% and that of ULO storage 350%. But in case of having enough moneyULO storage can give us a positive result (Wehmann, 1994).
5.1. Conditions of ULO storage
The first condition for a successful ULO storage is the high quality of storedgoods.
The second condition is to have strongly constructed isolated walls with aminimum thickness and optimum isolation. The air contains 21% of O2 and thecold storage unit 1.3% of it, so a small opening in the wall would make successfulstorage impossible. To have optimum cooling capacity for example for an 80 tonnescell storing 20 t/day, with a beginning temperature of 20 °C and temperature of1 °C the following cooling capacity is needed:
The other task is to ensure a low-oxygen operated scrubber. In order to reducethe flow of oxygen to the cold storage unit a low oxygen system is used.
The scrub capacity is given in Table 7.
6. PACKING AND PACKING COST
Packing in selling fruits and vegetable is also an important factor. The packingmaterial can be: – paper, plastic, wooden and plastic (f. e. boxes).
Economics and Organisation of Horticultural Postharvest Production 175
Table 5. Specific water loss in kg* (after Scheer, 1994).
Product Air velocity
0 m/sec 0.05–0.15 m/sec
Apple 00.68 00.73Mushroom 24 57Carrot 01.0 09.6Headed Cabbage 07.3 12Lettuce 13 17
* Informing data.
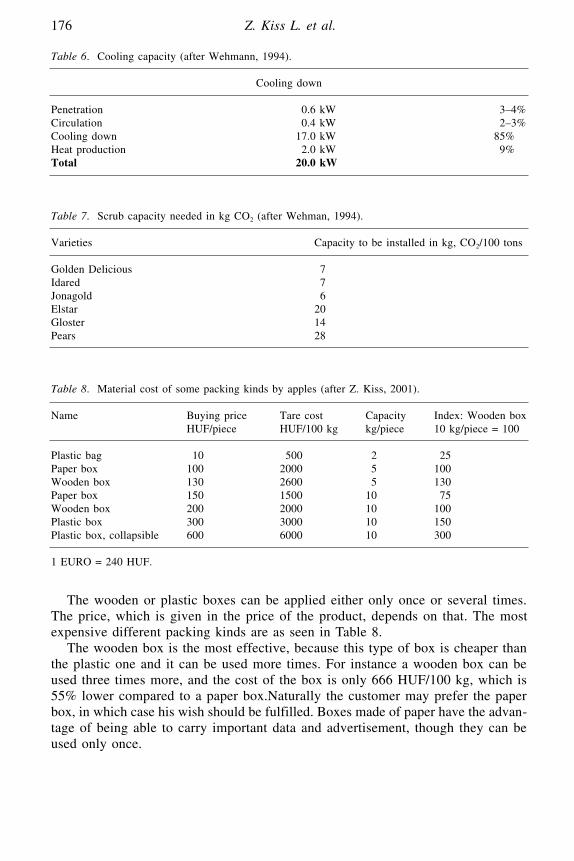
The wooden or plastic boxes can be applied either only once or several times.The price, which is given in the price of the product, depends on that. The mostexpensive different packing kinds are as seen in Table 8.
The wooden box is the most effective, because this type of box is cheaper thanthe plastic one and it can be used more times. For instance a wooden box can beused three times more, and the cost of the box is only 666 HUF/100 kg, which is55% lower compared to a paper box.Naturally the customer may prefer the paperbox, in which case his wish should be fulfilled. Boxes made of paper have the advan-tage of being able to carry important data and advertisement, though they can beused only once.
176 Z. Kiss L. et al.
Table 6. Cooling capacity (after Wehmann, 1994).
Cooling down
Penetration 00.6 kW 03–4%Circulation 00.4 kW 02–3%Cooling down 17.0 kW 85%Heat production 02.0 kW 09%Total 20.0 kW
Table 7. Scrub capacity needed in kg CO2 (after Wehman, 1994).
Varieties Capacity to be installed in kg, CO2/100 tons
Golden Delicious 07Idared 07Jonagold 06Elstar 20Gloster 14Pears 28
Table 8. Material cost of some packing kinds by apples (after Z. Kiss, 2001).
Name Buying price Tare cost Capacity Index: Wooden boxHUF/piece HUF/100 kg kg/piece 10 kg/piece = 100
Plastic bag 010 0500 02 025Paper box 100 2000 05 100Wooden box 130 2600 05 130Paper box 150 1500 10 075Wooden box 200 2000 10 100Plastic box 300 3000 10 150Plastic box, collapsible 600 6000 10 300
1 EURO = 240 HUF.

7. PRICE DEVELOPMENT AND FOOD CONSUMPTION
For the first time in more than a decade the annual consumer index was regis-tered as a single digit number (9.8%) in 2000. The disinflation process, however,faltered and the price index was only reduced by 0.2% compared to the previousyear.
The increase in world market energy prices and the devaluation of the EUROagainst the US Dollar also influenced the inflation process through producer prices.Industrial producer prices exceeded consumer prices in 2000 by 2 percentages.
The increase of food prices was an important element in the faltering of disin-flation in 2000. While growth in food prices did not reach 3% in 1999 the increasein this group reached 9% in 2000. This was generated by steps taken to compen-sate for the widening gap between agricultural and industrial products in the longrun to reduce the price differences between them (Balint et al., 2001).
7.1. Labour market
Labour force expansion of the previous two years faltered in 2000 and the numberof people entering employment increased by 35 thousand. Of the 3874.8 persons55.3% are men, a quarter of them young and a further quarter between 30 and 40years of age, while 42% of them are middle-aged. Almost 38% of employees arewhite-collar workers. The proportion of unskilled workers is 8%, while manuallabourers constitute 13% of the total number of employed people. Of all occupiedpeople 70% are employees, constituting a force of 717 thousand. According to theCentral Statistical Agency (2000), the number of unemployed was 260.2 thousandpeople, which is 9.4% less than the previous year. An increase in the number ofemployed people is expected this year.
The average nominal wage of those in full time employment was 87,650 HUFin the year 2000. The average monthly income of people employed in the competitivesector was 88,430 HUF, as opposed to 86,210 HUF of people working in the publicsector.(which is about 300 EUR). The wages in the agricultural sector were 30%lower. The average net income of full time employed people increased by 11.4%,which was a 1.5 percent growth at real value in the year 2000.
8. SALE AS AN IMPORTANT PROCESS
The influence of varieties on price is shown in Table 9. By apples is can be clearly seen that variety has a very big influence on price
change. The difference is particularly big between Braeburn and Jonagored, not tomention Gloster.
As for Jonagored the explanation is that it is an autumn variety, and its qualityin spring is lower than that of Braebum’s. Consumption habits are to be observedin connection with the different varieties. For example Jonagored is preferred byyounger people, while Braebum is the favourite of the older generation accordingto a study published in Germany (Schade, 2000).
Economics and Organisation of Horticultural Postharvest Production 177
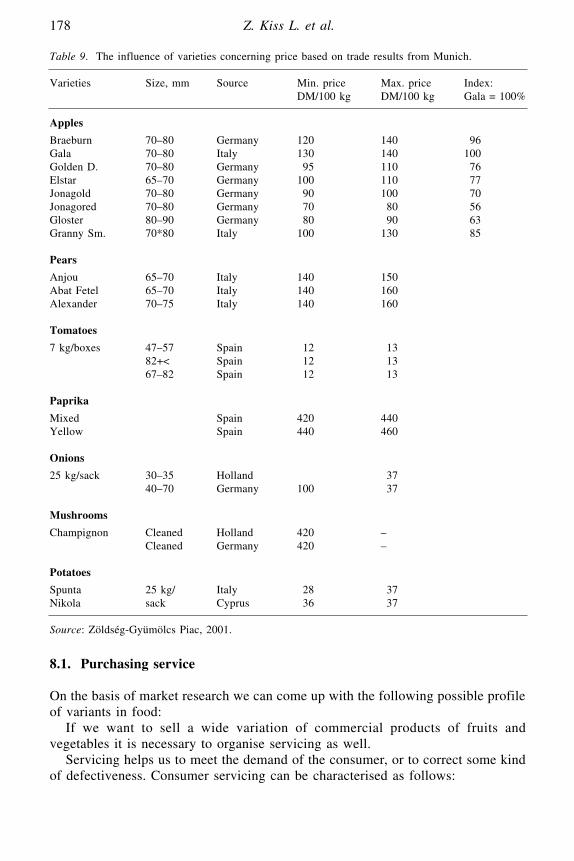
8.1. Purchasing service
On the basis of market research we can come up with the following possible profileof variants in food:
If we want to sell a wide variation of commercial products of fruits andvegetables it is necessary to organise servicing as well.
Servicing helps us to meet the demand of the consumer, or to correct some kindof defectiveness. Consumer servicing can be characterised as follows:
178 Z. Kiss L. et al.
Table 9. The influence of varieties concerning price based on trade results from Munich.
Varieties Size, mm Source Min. price Max. price Index:DM/100 kg DM/100 kg Gala = 100%
Apples
Braeburn 70–80 Germany 120 140 096Gala 70–80 Italy 130 140 100Golden D. 70–80 Germany 095 110 076Elstar 65–70 Germany 100 110 077Jonagold 70–80 Germany 090 100 070Jonagored 70–80 Germany 070 080 056Gloster 80–90 Germany 080 090 063Granny Sm. 70*80 Italy 100 130 085
Pears
Anjou 65–70 Italy 140 150Abat Fetel 65–70 Italy 140 160Alexander 70–75 Italy 140 160
Tomatoes
7 kg/boxes 47–57 Spain 012 01382+< Spain 012 01367–82 Spain 012 013
Paprika
Mixed Spain 420 440Yellow Spain 440 460
Onions
25 kg/sack 30–35 Holland 03740–70 Germany 100 037
Mushrooms
Champignon Cleaned Holland 420 –Cleaned Germany 420 –
Potatoes
Spunta 25 kg/ Italy 028 037Nikola sack Cyprus 036 037
Source: Zöldség-Gyümölcs Piac, 2001.
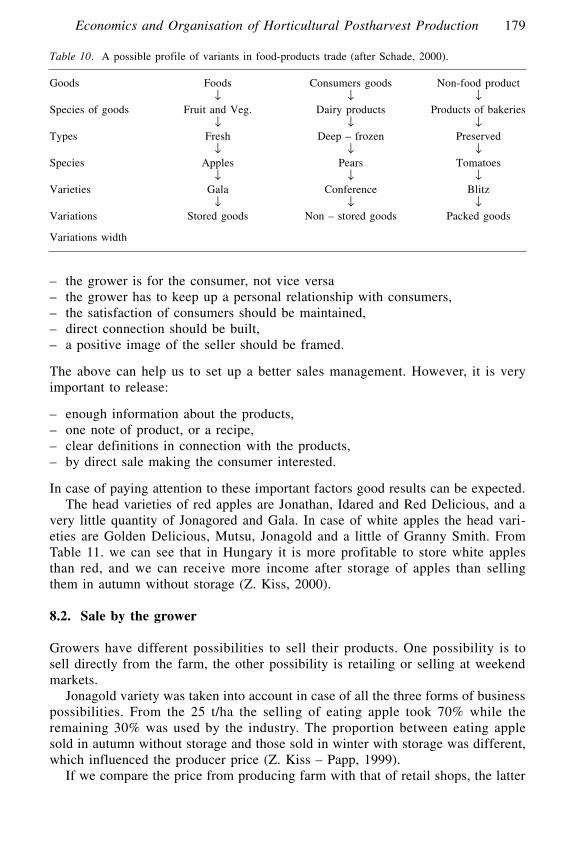
– the grower is for the consumer, not vice versa– the grower has to keep up a personal relationship with consumers,– the satisfaction of consumers should be maintained,– direct connection should be built,– a positive image of the seller should be framed.
The above can help us to set up a better sales management. However, it is veryimportant to release:
– enough information about the products, – one note of product, or a recipe,– clear definitions in connection with the products,– by direct sale making the consumer interested.
In case of paying attention to these important factors good results can be expected.The head varieties of red apples are Jonathan, Idared and Red Delicious, and a
very little quantity of Jonagored and Gala. In case of white apples the head vari-eties are Golden Delicious, Mutsu, Jonagold and a little of Granny Smith. FromTable 11. we can see that in Hungary it is more profitable to store white applesthan red, and we can receive more income after storage of apples than sellingthem in autumn without storage (Z. Kiss, 2000).
8.2. Sale by the grower
Growers have different possibilities to sell their products. One possibility is tosell directly from the farm, the other possibility is retailing or selling at weekendmarkets.
Jonagold variety was taken into account in case of all the three forms of businesspossibilities. From the 25 t/ha the selling of eating apple took 70% while theremaining 30% was used by the industry. The proportion between eating applesold in autumn without storage and those sold in winter with storage was different,which influenced the producer price (Z. Kiss – Papp, 1999).
If we compare the price from producing farm with that of retail shops, the latter
Economics and Organisation of Horticultural Postharvest Production 179
Table 10. A possible profile of variants in food-products trade (after Schade, 2000).
Goods Foods Consumers goods Non-food product↓ ↓ ↓
Species of goods Fruit and Veg. Dairy products Products of bakeries↓ ↓ ↓
Types Fresh Deep – frozen Preserved↓ ↓ ↓
Species Apples Pears Tomatoes↓ ↓ ↓
Varieties Gala Conference Blitz↓ ↓ ↓
Variations Stored goods Non – stored goods Packed goods
Variations width

180 Z. Kiss L. et al.
Table 11. Change of prices on wholesale market in years of 2000, in HUF/kg.
Month Price of Price of Index: red apples white apples Red apples = 100%
January 070–85 075–100 112.9February 085–105 100–120 115.8March 102–110 110–130 113.2April 106–130 130–160 122.9May 135–160 160–190 119.3June 160–170
Average of the first 6 months 110–127 115–140 107.6
September 070–75 110–90 137.9October 070–75 090–95 127.6November 070–75 095 131December 080–75 090–95 119.4
Average of last 4 months 073–75 094–96 128.4
Average 095–105 106–119 109.8
Source: Fruit and Vegetable Bulletin.1 EURO = 240 HUF.
Photo: Z. Kiss, 2002
Picture 4. Prepared apple for sale by grower.

is 39% higher, and at weekend markets it is 109% higher. The share of goods soldin winter in the first case was 35%, at retail selling it was 50%, and at the weekendmarket it was also 50%.
Selling directly from the producing farm has a great advantage. The grower cansave the transport cost, but he risks the chance of selling less in this way.
Selling to retailers provides a lower price, however any additional costs can besaved (Z. Kiss, 2001).
8.3. Sale on wholesale market, wholesale trade and store
The goods can be characterized by having high, homogenous and excellent quality.The producers have taken into account the higher transport cost, the rental cost
at the wholesale market and also the lower selling price.We have to calculate with selling our fruits and vegetables in stores as our
goods are one or more months late. The stores are in monopolistic position andbecause of this they give us the lowest price. Besides this they often claim discountfor the reclaim, and shelf money too. In addition they pay the bill with a monthdelay.
Despite of this, commercial organizations (stores) can buy large quantities, andthis means security for the producers.
8.4. Ways of selling
Summarising the different selling possibilities the following should be stated (Varga,1994):
Economics and Organisation of Horticultural Postharvest Production 181
Table 12. Change of selling cost (HUF/kg) (after Z. Kiss, 2001).
Name From producing Through retail At weekend farm shop market
Storing and packing cost 05.77 11.70 08.07Cost of loading 01.50 01.94 02.08Selling cost 08.50 0– 10.240% wage tax 03.40 04.68 05.26Electricity 00.60 00.80 01.02Amortisation 02.18 03.10 03.05Transport cost 0– 04.80 04.60
Reclaim
Selling cost 22.25 27.02 34.68Production cost 24.70 24.70 24.70Altogether 46.95 51.72 59.38Producer price 53.40 60.70 76.45Br income * 06.45 08.98 17.07Income rate 13.73 17.36 28.75
* Before taxation.1 EURO = 240 HUF.

Direct sale from producers to consumers
– at the place of growing,– at consumer market places,– at permanent selling places– by large – scale consumer
Direct sale to the retail trade
– department stores,– supermarkets– consumer co – operatives,– shops.
Wholesale purchase
– at the place of growing, upon contract,– by contractual consumer transport,– at market grounds,– at the place of growing, without contract.
182 Z. Kiss L. et al.
Photo: Z. Kiss, 2002
Picture 5. Retail trade of fruit and vegetable in Budapest.

Purchases to the processing industry
– from the producer upon contract,– from the producer without contract,– from the wholesale trade.
Seemingly there are more possibilities for the producer to sell his vegetables andfruits, however, a market research should be done before choosing an alternativeway, and a very competent calculation should also be carried out. This examina-tion has to be repeated yearly depending on the production results.
8.5. Change of storage cost and income concerning apples
Owing to the decreasing living standard after the change of the political regime appleconsumption got 50% lower in Hungary. Apple consumption is about 15 kg/head.It would be desirable to increase it to 20–25 kg/head. To be able to reach thislevel we have to produce quality home apple also by the end of spring. However,this home apple has to be cheap enough. Apple storage cost depends on the typeof storage and on the length of storage time.
As the data show the best results were reached by the ULO storage of GoldenDelicious, but storage cost amortisation is the highest here (54%). Apart from thisthe investment cost of ULO storehouses is so high that the producer could hardlyproduce as much profit as to compensate for it.
Storage in chamber because of high percent of quality decrease and rotting gaveus a negative result, thus this storage form cannot be taken for effective.
Economics and Organisation of Horticultural Postharvest Production 183
Table 13. Cost of apple storage in HUF/100 kg (after Z. Kiss, 2000).
Name ULO Contr.atm. Cold storage In chamber6 Months 6 Months 6 Months 3 Months
Amortisation 01300 01000 0400 0100Sorting and packing 00300 00300 0300 0150Wage tax 00120 00120 0120 0060Transport – loading 00300 00300 0300 0100Quality decrease 00080 00100 0150 0230Weight loss, rotting, other 00300 00250 0200 0100
Storage cost 02400 02070 1470 0740Product cost 02470 02470 2470 2470
Altogether 04870 04540 3940 3210
Selling price 11000 10000 9000 6000Autumn price 04000 04000 4000 4000
Income* 02130 01460 1060 1210
* Before taxation.The data concern Golden Delicious variety. 1 EURO = 240 HUF.
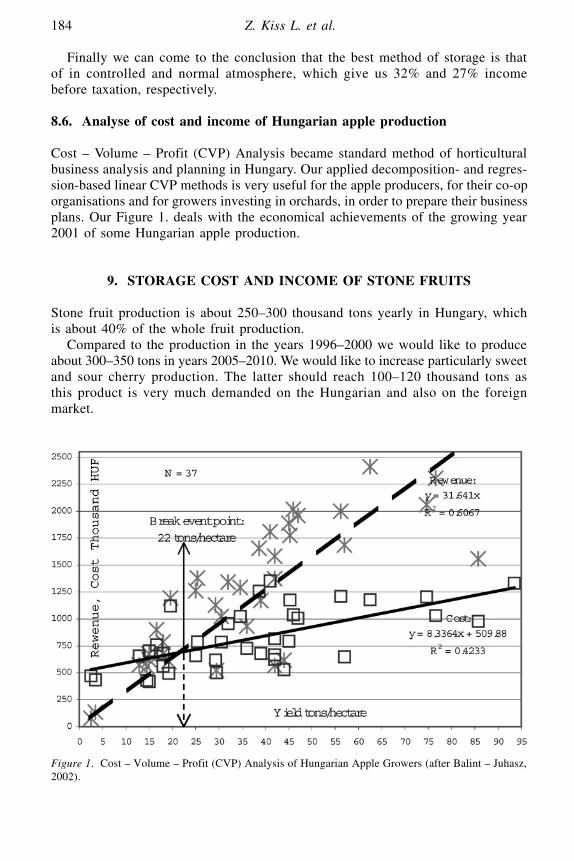
Finally we can come to the conclusion that the best method of storage is thatof in controlled and normal atmosphere, which give us 32% and 27% incomebefore taxation, respectively.
8.6. Analyse of cost and income of Hungarian apple production
Cost – Volume – Profit (CVP) Analysis became standard method of horticulturalbusiness analysis and planning in Hungary. Our applied decomposition- and regres-sion-based linear CVP methods is very useful for the apple producers, for their co-oporganisations and for growers investing in orchards, in order to prepare their businessplans. Our Figure 1. deals with the economical achievements of the growing year2001 of some Hungarian apple production.
9. STORAGE COST AND INCOME OF STONE FRUITS
Stone fruit production is about 250–300 thousand tons yearly in Hungary, whichis about 40% of the whole fruit production.
Compared to the production in the years 1996–2000 we would like to produceabout 300–350 tons in years 2005–2010. We would like to increase particularly sweetand sour cherry production. The latter should reach 100–120 thousand tons asthis product is very much demanded on the Hungarian and also on the foreignmarket.
184 Z. Kiss L. et al.
Figure 1. Cost – Volume – Profit (CVP) Analysis of Hungarian Apple Growers (after Balint – Juhasz,2002).

9.1. Storing stone fruits
One possibility to raise income is to interpose storage, thus extending the mar-keting time. Another possible way of extending the marketing period is to drawnew varieties into production, making the season of consumption longer with con-trolled atmosphere storage. The situation for other kinds of stone fruit is similar,with early to very late ripening varieties available. Equally the feasibility of pro-longing the season means storage, in order to stimulate production and lengthenthe marketing time.
Cold storage was first applied in Hungary, as in other countries, to apple, andon a smaller scale to pear storage. Ninety percent of Hungarian storehouses haveair cooling and only about 20% operate with controlled atmosphere (Z. Kiss etal., 1998).
Principally, stone fruits can be stored in storage conditions. Since such productscannot be kept fresh for a prolonged period, this fact does not have much impor-tance. This is why stone fruits can only be stored for a short period.
9.2. Storing sweet cherries and sour cherries
Storing sweet cherries and sour cherries for only one or two weeks can signifi-cantly decrease their quality, so both fruits are usually marketed in the mainproduction season. In previous years the chief purchaser was the processing industry.
Sweet cherries, in comparison with sour cherries, can be stored better. Sourcherries last only a couple of days in store, but cherries may – depending on thevariety – be kept for one or two weeks at a temperature of 0 °C or 1 °C (Z. Kiss,1997).
The varieties concerned were Bigarro burlat, and Pandy. The results show thatstorage of cherries has only a little importance. We can apply it if there is no demandon the market, and for a short term.
Nevertheless, both species are first rate for fresh consumption and the storageof cherries could contribute to lengthening the marketing period. In my opinion,storage could play an important role in case of other varieties like Hedelfinger Giant,prolonging the consumption time by one or two weeks. The big question is whetherthe cost of storage can be regained through the price.
Economics and Organisation of Horticultural Postharvest Production 185
Table 14. Change of stone fruit production In 1000 Tons.
Item 1991–1995 1996–1999 2000 Index: 1991–1995 = 100%
Sweet cherries 024.4 021.4 018.3 075.0Sour cherries 067.4 055.3 049.0 072.7Peaches 055.2 064.1 064.1 116.1Apricots 031.4 036.5 021.4 068.2Plums 125.4 100.9 091.3 072.8Total 303.8 278.2 244.1 080.3
Source: Hungarian Statistical Books.

9.3. Storage of apricots
The structure of apricot varieties has been extended by plant improvement and bythe new varieties with early and late ripening times.
Apricot consumption is a relatively low proportion of the total stone fruit con-sumption, namely 15% on the Budapest free market. As a result, its storage is notof great importance and it would not be reasonable to encourage this activity.
Notwithstanding this, some varieties, especially those belonging to the Hungarian‘rose’ variety group can be stored in air or in controlled atmospheres with goodresults for 4 or 6 weeks at 0 °C or 1 °C, in good air circulation conditions andhumidity. Similar results reached Pala, M at all in Turkey (1994).
9.4. Storage of peaches
Peaches are one of our most important stone fruits, with regard to both fresh con-sumption and storage. On the Budapest market their proportion approaches 45%.From the beginning of June until November, peaches are continuously present onthe market. Mostly they are consumed as fresh fruits, but some varieties, like theBabygold series, are well adapted to being conserved. They have another advantage:since they have firm flesh they can be stored easily. If stored, peaches demand ahigh moisture content in the air. Because of these circumstances, peach storagemay be profitable. Firm flesh varieties, if stored, can lengthen the marketing periodby two or four weeks depending on varieties and storage conditions.
Better results have been reached by Eris, A at all (1994) by controlled atmos-phere storage than stored in air on J.H. Hale variety. It can be seen that the incomefrom sales of stored peaches was nearly 20% higher than that of non-stored peaches.However, this is only an apparent figure, because losses during storage must be takeninto account.
These are the following:
– abating, manifested as weight loss estimated as 22%.– rotting, depending on variety, ripening grade and storage period, on average
3%.
186 Z. Kiss L. et al.
Table 15. Storage cost and income of sweet and sour cherry in HUF/100 kg (after Z. Kiss, 2000).
Item Sweet cherry Sour cherry2 weeks storage 1 weeks storage
Storage cost 00500 00400Production cost 08388 06050Total 08888 06450Producer price 10740 13650Income * 01852 07200Rate of income % 00020.8 00111.6
* Before taxation.1 EURO = 240 HUF.

– quality regrouping, manifested by the fact that a proportion of stored first classfruit will be second class after storage. This proportion can be estimated as10%.
9.5. Storage of plums
Plums have a share of 22% on the Budapest market. Their repining and sale beginsin July with early varieties and can have a long season until December. Providedthat storage techniques are suitable, it can be economic to store plums untilChristmas.
Nevertheless, according to my calculations based on our research only one monthsstorage can be endured with good efficiency by Bluefre or Stanley varieties. As theirskin is covered by wax, plums can be stored better than peaches. Ripe, good qualityplums can be stored at a temperature of 0–1 °C at 90–95% humidity for one month.Controlled atmosphere storage gave better results, but this requires higher invest-ment cost.
Our research results concerning storage in air show that the weight loss after4 weeks is too high, therefore this storage condition cannot be applied without adeficit.
The price of first-class stored plums was 50% higher than that of non-stored ones.During storage there are losses, which reduce the price by an average of 22%.The corrected price allows for losses due to regrouping because some first classplums will become second class. As a result, stored plums can be sold at a profitthree times that of non-stored plums. This favours the storage of plums.
10. STORAGE COST AND INCOME OF ONIONS
Onions are highly importable vegetables present not only in the consumption ofHungarian people but all over the world That is why we investigated not only theproduction but also postharvest costs.
Economics and Organisation of Horticultural Postharvest Production 187
Table 16. Economics results of storage of apricots and peaches in HUF/100 kg (after Z. Kiss,2000).
Item Apricots Peaches2 weeks storage 3 weeks storage
Storage cost, weight loss, rotting 0700 0900Quality decrease 0200 0300Production cost 4200 4500Total 5100 5600Producer price 5800 6350Income* 0700 0850Rate of income % 0013.7 0015.5
* Before taxation.1 EURO = 240 HUF.

The variety studies were the Makói, which is a variety well-known in Europe.However, its production time is two years, and therefore its production cost ishigher.
In the first case the storage loss without cooling by ventilation was 5%, theinfected bulbs lost 4% of weight and the sprouted bulbs were also 4% lighter. Resultsby cooling storage after 5 months were the following: weight loss 4%, infected bulbs5%, and the sprouted ones 3% (Fustos, 1994). Naturally, the results would bedifferent depending on other storage conditions or other varieties.
11. STORAGE COST AND INCOME OF HEADED CABBAGES
Leafy vegetable as lettuce, kohlrabi, spinach etc. can be stored only for a shorttime by air storage. We receive better results, if we store it in controlled atmosphere.In this case we can store them longer that is for one or two weeks. The biggestproblem is water loss, which in case of air storage may reach 7–8% in two weeks
188 Z. Kiss L. et al.
Table 17. Change of some quality parameters of peach Elberta and plum Bluefre (after Z. Kiss,1998).
Item Storage period in weeks
0 2 4 6
Elberta
Water soluble solids % 08.85 08.02 09.07 11.35Total sugar/q (100 ml) 09.45 08.22 08.57 08.33Firmness (lb.) 10.27 08.25 06.54 04.30Weight loss % 00 01.48 05.45 09.72
Bluefre
Water soluble solids % 12.20 11.40 11.25 10.06Total sugar/q (100 ml) 10.70 10.06 09.45 09.80Firmness (lb.) 07.32 07.05 06.70 05.20Weight loss % 00 01.35 04.22 06.75
Table 18. Storage results of plums (after Z. Kiss, 2000).
Item 4 weeks storage Non-stored
Storage cost 0700 0–Weight loss, rotting, Quality decrease 0200 0–Production cost 4200 4000Total 5100 0–Producer price 6800 4550Income * 1700 0550Rate of income % 0033.3 0013.8
* Before taxation.1 EURO = 240 HUF.

storage/but by CA depending on the proportion of CO2: O2 it was 0.5–1.5%, but aCA storage is too expensive for a product like cabbage.
Though the income at controlled atmosphere storage was bigger, the expensesof such a storehouse were too high for storing cabbages.
12. STORAGE OF CARROTS AND PARSLEY ROOTS
Storage of these two species of vegetables can be in storehouse or underground. Decreasing of production caused an increase in producer-market price. In the
future, we can expect the growth of production, thus naturally also an increase ofthe producer price.
12.1. Storing of carrots and parsley roots
The storage of these vegetable species is a very important task, because house-wives have to buy them throughout the year and we, as producers, have to be
Economics and Organisation of Horticultural Postharvest Production 189
Table 19. Results of onion storage in HUF/100 kg.
Item Stored 3 months Stored 5 monthswithout cooling with air cooling
Cost of drying (on field) 00315 000–Cost of drying (by drying equipment) 000– 00810Cost of storage 00470 01230Production cost 16860 20860Total 17645 22900Producer price 20000 27000Income* 02355 04100Rate of income % 00013.3 00017.9
* Before taxation.1 EURO = 240 HUF.
Table 20. Result of storing cabbages in HUF/100 kg.
Item Stored in air cooling Stored in contr. atm.
Two months
Cost of storage 0420 0950Water loss, etc. 0160 0070Product cost 1500 1500Total 2080 2520Producer price 2600 3020Income * 0520 0940Rate of income % 0008.3 0003.9
* Before taxation.1 EURO = 240 HUF.
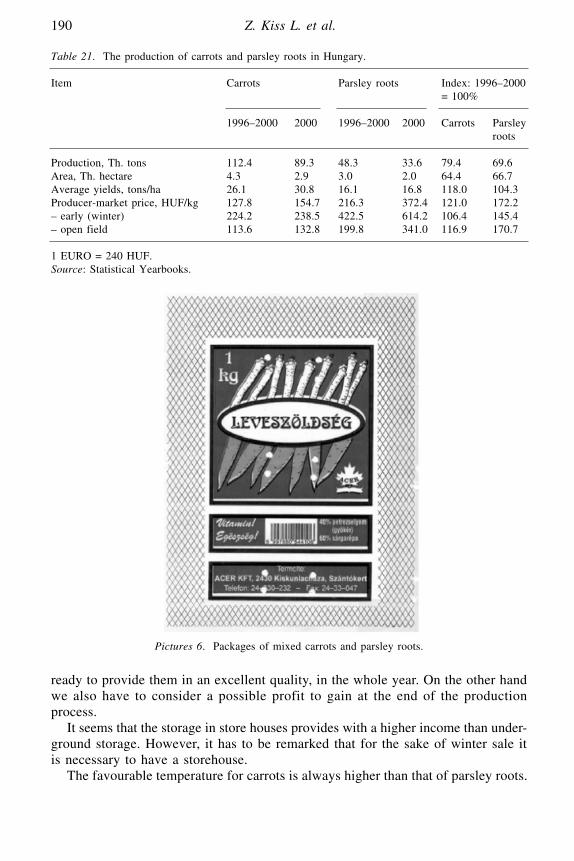
ready to provide them in an excellent quality, in the whole year. On the other handwe also have to consider a possible profit to gain at the end of the productionprocess.
It seems that the storage in store houses provides with a higher income than under-ground storage. However, it has to be remarked that for the sake of winter sale itis necessary to have a storehouse.
The favourable temperature for carrots is always higher than that of parsley roots.
190 Z. Kiss L. et al.
Table 21. The production of carrots and parsley roots in Hungary.
Item Carrots Parsley roots Index: 1996–2000 = 100%
1996–2000 2000 1996–2000 2000 Carrots Parsley roots
Production, Th. tons 112.4 89.3 48.3 33.6 79.4 69.6Area, Th. hectare 4.3 2.9 3.0 2.0 64.4 66.7Average yields, tons/ha 26.1 30.8 16.1 16.8 118.0 104.3Producer-market price, HUF/kg 127.8 154.7 216.3 372.4 121.0 172.2– early (winter) 224.2 238.5 422.5 614.2 106.4 145.4– open field 113.6 132.8 199.8 341.0 116.9 170.7
1 EURO = 240 HUF.Source: Statistical Yearbooks.
Pictures 6. Packages of mixed carrots and parsley roots.

The latter can tolerate temperature below zero, but carrots are threatened by beingfrozen at that temperature. In case if in the store room carrots and parsley rootsare together the applied temperature have to be higher (+2 °C–+4 °C) and the airhumidity is about 90%.
Economics and Organisation of Horticultural Postharvest Production 191
Picture 7. One-kilo packing of carrots.
Table 22. The storage cost and income of carrots and parsley roots in HUF/100 kg (after Z. Kiss, 2001).
Item Carrots Parsley roots
Underground In store – Underground In store –storage house storage house
3 months 3 months
Storage cost 02000 05500 02500 03000Production cost 19500 19500 32000 32000Total 21500 23000 34500 35000Producer price 23000 25000 40000 45000Income* 01500 02000 05500 10000Rate of income % 00007.7 00012.8 00017.2 00031.3
* Before taxation.1 EURO = 240 HUF.
13. POSTHARVEST PROCESS OF HUNGARIAN RED PAPRIKA
As far as the nineteenth century the cultivation of red paprika was noted in Hungary.Hungarian paprika owes its worldwide reputation to its colour and aromatic qual-ities; it is one of the fundamental favours in Hungarian cooking.
In the last few years Hungary has become the third in the world’s crop produc-tion and second in the export, following Spain’s export production. The mainexport markets are the European Union (especially Germany and Austria) andthere are also export markets in the USA and Canada.
In the last 10 years the crop area was decreasing because of the transformationof Hungarian agriculture and adulteration of powdered red paprika. In 1990 theharvested area was about 8300 hectare, in 2000 it was approximately 5400 hectare.
Regions of Kalocsa and Szeged are Hungary’s traditional paprika growing centres,because they have the highest number of hours of sunshine (minimum 1500 hours),which is the most important factor in growing quality red paprika. It is also essen-tial that from April to September the average mean temperature reaches at least17.5 °C.
The crop production of processing Hungarian red paprika benefits from a suc-cessful combination of small farmers and the efficiency of large-scale processingmethods.
The results of the Hungarian breeding are 22 cultivars in crop production. Theaim of cultivation, the demands on consumers and processing, and the conditions
192 Z. Kiss L. et al.
Table 23. Hungarian exports of powdered red paprika (Statistical Yearbook of External trade, HungarianCentral Statistical Office, Budapest, 1999, 2001.
Countries 1997 1998 1999 2000
Q V Q V Q V Q VTotal: 4356 13.4 4835 14.4 5712 12.1 4557 10
Of which:Germany 2000 6 2084 6 2033 4 1622 3.4Austria 0679 1.9 0719 2 1042 2.2 0926 2Nederland 0516 1.6 0625 1.9 0845 1.8 0457 1.1Slovakia 0452 1.3 0339 0.7 0268 0.6USA 0126 0.4
Q: Quantity(tons), V: Value (million USD).
Table 24. Characteristics of production.
Denomination 1996 1997 1998 1999 2000
Harvested area, hectare 04581 05655 06770 04627 05385Total harvested production, tons 52105 45323 64619 33105 39969Average yields, kilogram/hectare 10710 07490 08910 06280 06800
Source: Statistical Yearbook of Agriculture, Hungarian Central Statistical Office, Budapest, 1998, 2001.

of cultivation have to be considered when selecting cultivars. Taking all claimsinto account it is impossible to choose on only cultivar; so 2–3 cultivars are growingin a particular area.
In Hungary the 80% of red paprika is direct seeded, but it can be better if 60%of it is cultivated this way. Planting plants improves quality, but it increases costswith 25–30%. Safety of growing and a higher sale price are the advantages ofplantation. Disadvantages are the higher demand on implements of production andthat of human resource.
Harvesting is the most labour-consuming part of the whole crop process.Hungarian red paprika is harvested in mature red colour. Harvesting is started inthe planted cultivations at the beginning of September and it is followed in the directseeded cultivations 2–3 weeks later. Paprika is a typically hand-harvested plant,the fields are harvested two or three times depending on the varieties. The capacityof hand harvesting is 25–30 kilogram per hour depending on the yield and thecultivars. Mechanical harvesting is also possible, the capacity of harvesting equip-ments is equal with the capacity of hand gathering by 50–100 people. A harvestingmachine cannot distinguish between desirable and undesirable pods, so more diseasedand unripened fruit will be harvested, thus it is necessary to dehydrate pods imme-diately.
The most important quality criteria is not fully developed in the harvest-maturepods. After-ripening is necessary in the postharvest process of paprika. During after-ripening the colour content strongly increases. The matured pods contain 2–3 g/kgcoloring matter and at the end of the after-ripening period it can reach the maximumof 7–8 g/kg. Only desirable, uninjured pods can be after-riped. The duration of after-ripening is at least 10 days, but in an optimum case it is 40 days. Traditionally, insmall farms the after-ripening methods are seasoning in ropes or in trail nets.After-ripening technologies are seasoning in crate, in bulks or in sacks, drying isalso possible in controlled boarded floor in big farms. During the after-ripeningprocess it is very important to protect pods from microbiological infection and insurefavourable storage conditions. Following the after-ripening process it is necessaryto make a selection. Colour uniformity and stability are significant in determiningquality; other important quality criteria are low microbial count, low extraneousmatter and minimal insect parts. The next step in the postharvest process is thewashing. Pods have to be washed by clean drinking-water in any cases. Small
Economics and Organisation of Horticultural Postharvest Production 193
Table 25. Values of production.
Denomination 1996 1997 1998 1999 2000
Average producer-procurement prices (raw weight), USD per tons 302 306 233 232 269Value of gross production, million USD
at current prices 015.2 013.4 014.2 007.2 010.6at constant prices 008.6 005.9 014.2 006.5 007.4
Source: Statistical Yearbook of Agriculture, Hungarian Central Statistical Office, Budapest, 1998, 2001.
farms use water tanks for washing, big farms and processors use pneumatic washingequipments. The process following washingis removing the surface water. Podsget to the slicker, where ringwise pieces or 12–15 mm long slices are made.Dehydration of sliced pods is more efficient than that of whole pods. Dehydrationis the most important processing step to preserve quality. During dehydration themoisture of paprika fruits decreases to 6–8%. The paprika fruits are transported tothe dehydrator on trays or conveyor belts, depending on the process is used. Smallfarms use dehydration in ropes or in trail nets; in this case the fruits are not sliced.Big farms and processors use tunnel dryer or continuous belt system. The contin-uous belt system is widespread, in this way the dehydration temperature in the initialstage of drying is 80–85 °C and it takes 5–6 hours to dry to 6–8% of moisture.At the end of dehydration, the semi-finished product can be stored in cool, dryand dark storage. Before storing it is useful to crack the product. Grand paprika losescolor faster than whole pods during the storage. For this reason, paprika is oftenstored as flakes before final grinding. Flakes require less storage space than wholepods and maintain colour better than ground powder. The final process is grinding,the final product is the ground powder, the granulation is less than 0.5 mm. Finallyit is necessary sift and condition the product.
Farmers and processors must manipulate cultivation, harvest timing, after-ripening, dehydration methods and temperature, moisture content, granulation andstorage environment for maximum quality of powdered red paprika. The prehar-vest quality of the fruit affects postharvest quality and shelf life.
14. POSSIBILITY OF INCREASING STORAGE EFFICIENCY
To increase efficiency we have some possibilities:
– to store only good quality products– to work according to an exact storage plan,
194 Z. Kiss L. et al.
Table 26. Producers’ balance-sheet, ton.
Denomination 1996 1997 1998 1999 2000
Total harvested production 52105 54323 64619 33105 39969Purchasing and other sources 09009 08722 10052 01937 03416Total sources 61114 54045 74671 35042 43385Total sales 49203 40287 60750 30410 37053Of which: procurement, to processors 34225 30075 30075 21357 31319peasants’ market 01237 01365 01520 01575 02094direct exports 00– 00– 00– 00– 00008Processing and consumption within farm 09467 09976 11434 02477 04535Consumption from own production 02275 03728 02169 01964 01632Storage loss 00169 00054 00315 00192 00135Changes in stocks 00– 000– 00003 000–1 00030Total use 61114 54045 74671 35042 43385
Source: Statistical Yearbook of Agriculture, Hungarian Central Statistical Office, Budapest, 1998, 2001.

– to apply skilled labour to sorting and packing,– to utilise storehouse capacity to the maximum,,– the manager of the storehouse should be a highly qualified specialist,– to have a good contact with commercial organisations,– to have always the most up-to-date information on the market and the scien-
tific results.
15. ORGANISATION OF STORAGE OF FRUITS AND VEGETABLES
The task of the storage manager is three-fold:
– Transport to the storehouse ad into the house.– Determining storage time and shelf-live of goods.– Storing, grading, packing and selling.
Before starting storage we have to make up a storage plan, which has to includethe following:
– the length of storage time and quality,– the number of electric cars of loading,– the necessary labour force,– the boxes and packaging material needed– the required transport equipment,
In the end the storage process will provide us with the income expected Here is aplan of transport and storage to meet the requirements (Z. Kiss et al).
15.1. Plan of process for apple transport and storage
In the first case the time needed was 168 min/2.75 h. In the second case was also168 min., in this example the transport length was 30 km for which it is better touse a lorry than a car. If we calculate with 3 hours for a cycle in both cases, theeffective transported quantity in the first case is 1.3 t/h, and in the second case itis 2.0 t/h, namely it is more effective to use a lorry than a car over a 20 kmdistance.
We calculate with 10 h useful time in both examples. In the first case – takinginto account the optimum – we can transport 13.3 t to the storehouse, while in thesecond case it can be 20 t. If our storage room has 100 t capacity, the storage processruns 7.5 and 5.0 days. If we want to load the same storeroom quicker, we have toapply two lorries or cars instead of one.
16. REDUCE POSTHARVEST RISK
The need for effective food safety programs doesn’t end at harvest. Foodbornpathogens can be found in the packinghouse, storage facilities, shipping containers,
Economics and Organisation of Horticultural Postharvest Production 195

and vehicles. Both packers and shippers must take precautions to guard againstmicrobial contamination.
There are several points grower should include when developing a food safetyplan for packing, storing and transporting produce. They are adapted from FoodSafety Begins On The Farm, A Grower’s Guide, which is published in USA bythe national Good Agricultural Practices Program based at Cornell University(Naegely, 2001).
In the packinghouse:
196 Z. Kiss L. et al.
Figure 2. Plan of transport and storage.

– Prevent contaminated water and livestock waste from entering the packinghousevia runoff or drift.
– Wash, rinse and sanitize packing areas and floors at the end of each day.– Exclude all birds and animals. Use screening where necessary.– Do not allow packinghouse workers to ear or smoke in the packing area. Require
workers to wash their hands after eating or taking a break.– Do not wear field clothes, especially shoes, into the packinghouse.– Use chlorinated water or other labelled disinfectants to wash produce. Use proper
amount of chlorine bleach for each commodity.– Change wash water when it gets dirty or after several hours of operation.– Monitor chlorine levels and maintain pH at 6.0 to7.0 so that chlorine will remain
active.– Wash and sanitize the packing and food contact surfaces each day.– Store materials in a clean area.
Storage and transportation:
– Cool fruits and vegetables quickly to minimize the growth of pathogens andmaintain quality.
– Make ice from drinkable water.– Do not load refrigeration rooms beyond their cooling capacity.– Use clean vehicles and refrigerated trucks.– Do not ship fresh produce in trucks that have carried live animals unless they
have been sanitized.– Implement the trace-back system that identifies field of origin and packing date
for each package.
These are the most important things, which the producers and managers should haveto keep on eyes.
REFERENCES
Balint, J., M. Juhasz, A. Balint and Zs. Fazekas (2001). A Globalis Jovo Tersegi Arnyekai azAgrargazdasagban. VISION-2000 III, Godollo, pp. 157–165.
Eris, A. et al. (1994). A Research on Controlled Atmosphere (CA) Storage of Peach cv. Hale Haven.Int. Symp. on Postharvest Treatm. of Hort. Crops., Kecskemet, pp. 767–776.
Fustos Zs. et al. (1994). Effects of Postharvest Handling and Cultivars on Keeping Quality of Onionsin Storage. Int. Symp. on Postharvest Treatm. of Hort. Crops., Kecskemet, pp. 212–219.
Goffings, G. and M. Herregods (1994). The Influence of the Storage Conditions on Some Quality ofJonagold Apples. Int. Symp. on Postharvest Treatm. of Hort. Crops. Kecskemet. Vol. I. pp. 37–42.
Linnemansfönns, L. (2001): Rubens-Erfahrungen am GBZ Köln-Auweiler. Obstbau 12, pp. 635–646.Markus, F. and J. Kapitany (2001). A Fuszerpaprika Termesztese (4.) Feldolgozas-technologia.
Gyakorlati AGROFÓRUM, Szekszard, 2001/09 pp. 29–35.Naegely, S. (2001). Reduce Postharvest Risks. Fruit Grower, August, pp. 4–5Noack, B. (2001). Kostendeckend Apfelanbauen – welche Preise müssen erzielt werden. Obstbau,
pp. 6–7.Nyeki, Zs. (2002). Almatarolas Helyzete. Fruitinfo-Alma, 2sz. 3.Pala, M. et al. (1994). The Effects of Modified Atmosphere Packing on Quality and Storage Life of
Apricot. Int. Symp. on Postharvest Treatm. of Hort. Crops., Kecskemet, pp. 808–816.
Economics and Organisation of Horticultural Postharvest Production 197

Schade, G., D. Liedtke, Z. Kiss L. (1998). Die Rolle der Regionalmarket in der Entwicklung derRegionen. Int. Scient. Symposium 16–18. Sept., Budapest, pp. 152–156.
Schade, G. et al. (2000). Entscheidungsfeld Produktpolitik. In P. Wagner (ed.), Marketing in derAgrar- und Ernahrungwirtschaft. Verlag Eugen Ulmer Stuttgart.
Scheer, A. (1994). Reducing the Water Loss of Horticultural and Arable Products during Long TermStorage. Int. Symp. on Postharvest Treatm. of Hort. Crops. Kecskemet, pp. 511–522.
Stehr, R. (2001). Erfahrungen zu ausgewahlten schorfresistenten Apfelsorten. Obstbau 12, pp. 608–616.Varga, Gy. (1994). Current Problems of Market Oriented Production in the Growing Vegetables and
Fruits. Int. Symp. on Postharvest Treatm. of Hort. Crops., Kecskemet, Vol. II. pp. 327–332.Wehmann, B (1994). Grading of Apples. Int. Symp. on Postharvest Treatm. of Hort. Crops., Kecskemet,
pp. 340–545Wehmann, B. (1994). ULO – Technology for Storage of Apples. Int. Symp. on Postharvest Treatm. of
Hort. Crops., Kecskemet, pp. 531–539.Z. Kiss L., J. Balint and M. Juhasz (1998). A Gyumolcstermesztes Szervezese es Okonomiaja
(Organisation and Economics of Fruit Production) in Mezogazdasagi Vallalkozasok Szervezese esOkonomiaja. Mezogazdasagi Szaktudas Kiado, Budapest.
Z. Kiss L. and J. Papp (1999). A Magyar Gyumolcstermesztes Fejlesztese es Szerepe a MunkanelkulisegKezeleseben. Kertgazdasag 3–4 sz., pp. 62–66.
Z. Kiss L. (1994). Connection in the Production and Storage of Stone Fruits. Int. Symp. on PostharvestTreatm. of Hort. Crops., Kecskemet, pp. 225–230.
Z. Kiss L. (1997). Production and Storage of Stone Fruits in Hungary. Int. ISHS Symp. on Effect ofPreharvest and Postharvest Factors on Storage of Fruits. Warsaw, pp. 215–218.
Z. Kiss L. (1998). The Present and the Future of Hungarian Fruit Production. Sadownictwo w KrajachSrodkowo-Wschodviej Int. Konf., Lublin, pp. 143–147.
Z. Kiss L. (2000). A Gyumolcstermesztes Fejlesztesenek Kozeptavu Strategiai Terve (Middle-distanceDeveloping Plan of Fruit Production in Hungary). 7th Int. Agricultural Scientific Days, Gyongyos,pp. 281–285.
Z. Kiss L. (2000). Az Integracio Lehetosegei es Akadalyai a Kerteszeti Aagazatban. VISION-2000III. Kooperacio, koordinacio es integracio az agraragazatban, Godollo, pp. 44–49.
Z. Kiss L. et al. (1999). A Kerteszeti Agazatok Szerepe es Lehetosegei a Halmozottan Hatranyos HelyzetuRegiok Fejleszteseben. Magyar Tudomanyos Akademia, Budapest, pp. 97–125.
ZMP (2001). Arinformaciok (A muncheni nagybani piac arai – marcius 17). Zoldseg es GyumolcspiacV. evf. 3.12. p. 20.
198 Z. Kiss L. et al.

HANDLING MACHINERY AND DAMAGE INFLICTED TOTHE PRODUCT
F. JAVIER GARCIA-RAMOS, CONSTANTINO VALERO AND MARGARITA RUIZ-ALTISENTPhysical Properties Laboratory, Polytechnic University of Madrid Av. Complutense s/n Edif.Motores, 28040 Madrid, Spain. E-mail: [email protected]
1. INTRODUCTION
Fruit postharvest processing is a highly mechanized task in most fruits (citrus, apple,pear, peach, apricot, cherry, etc.). Although a large manual labour is required in someprocesses such as packing and sorting, the mechanization of the postharvest processesis advancing continuously.
Once harvested, fruit is processed at centralized facilities called packinghousesor warehouses. Fruit undergoes across different processes whose final objectives are:(1) fruit sorting according to several quality standards (nowadays norms are focusedon external quality) and (2) fruit packing according to the consumer requirements.It is necessary to offer to the market different sizes, packing trays, labels, etc, fora same fruit variety. Fruit packing lines are used for this purpose.
Fruit packing lines are the main equipment in warehouses. Together with thefruit packing line, a warehouse has different areas where the postharvest activitiesare carried out: fruit reception area, refrigerating cameras, loading docks, qualitylaboratories, offices, and installations for employees (dressing rooms, bathrooms,dining room, etc.)
2. OBJECTIVES OF THE FRUIT PACKING LINES
The objective of fruit packing lines is the production of fruit according to consumer’srequirements. These requirements are focused on several aspects: external quality(size, colour, shape and defects), internal quality (acids content, sugar content, textureand juiciness), and external appearance (packing, label, and waxes).
Nowadays, quality standards are exclusively focused on external quality: size,cleanness, defects, external appearance, label and identification. Each fruit varietyis classified in different categories (extra, I, II, III), according to its external quality.For this purpose the warehouses use specific equipments able of measuring sizeand colour of each fruit.
Consumer requirements are advancing faster than quality standards, increasingthe quality demands until internal quality parameters such as sugar content orfirmness. This fact is producing a great effort in the development of new technologiesand equipments able to measure internal quality parameters on line. Actually,there are sensors and equipment for static and mainly destructive measurementsin laboratory, and some new equipment to measure internal quality on line. The
R. Dris and S. M. Jain (eds.), Production Practices and Quality Assessment of Food Crops,
© 2004 Kluwer Academic Publishers. Printed in the Netherlands.
199
Vol. 3, “Quality Handling and Evaluation”, pp. 199–231.
problem is that these equipments are expensive, not fast enough, and their devel-opment stage is just experimental, in most cases.
As fruit packing lines must meet consumer requirements, it is composed of agroup of machines that apply different treatments to fruit: washing, chemical treat-ments, sorting, packing, labelling, etc.
3. FRUIT PACKING LINES CHARACTERISTICS
Fruit packing lines are a chain of machines with specific functions (dumper, washer,drier, sizer, packing machines, etc.) connected by means of transporting belts, rollerstransporters, elevators, etc. Fruits are introduced in this chain and travel coveringsteps in the postharvest process. Finally, fruits are packed for sale to the consumermarkets.
The capacity of theses lines is variable according to the characteristics of eachwarehouse, varying from 10 to 40 tons per hour.
These equipments base their work in the use of low power electric motors (usually< 5 kW), pneumatic systems, chain drives and control electronic systems.
Fruit packing line equipments vary according to the fruit to be processed andto the warehouse mechanization. For instance, an orange packing line needs somespecific machines different than those needed in a peach packing line. In the sameway, some advanced warehouses have most of the processes mechanized in oppo-sition to those where the manual labor is predominant.
In general, every packing line is composed of four main components: dumper,sorting tables, sizer and packing system. Additionally, and depending on fruit species,the line can be equipped with different machinery: depalletizers, presizers, washers,driers, waxers, chemical applicators, labelers, etc.
Figure 1 shows an example of the main processes experimented by the fruit inthe packing lines. The different elements of the fruit packing lines are placed in aspecific order, as it can be seen in the Figure 1. The complexity of fruit packinglines increases with the number of packs prepared, requiring different packingmachines and fruit treatments.
4. MAIN ELEMENTS OF FRUIT PACKING LINES
4.1. Dumper
The dumper introduces the fruit coming from the orchard to the packing line. Fruitis placed in bins (800 × 1200 mm; or 1000 × 1200 mm, wooden or plastic) orfield boxes (600 × 400 mm, usually plastic) at the orchard, and transported to thewarehouse.
Dumping systems can be classified according to two criteria: dumping systemand fruit pack. As dumping techniques are not specific of the fruit pack (bin or box),then, dumpers will be classified according to the dumping technique or way of intro-
200 F. Javier García Ramos et al.

Handling Machinery and Damage Inflicted to the Product 201
Fig
ure
1.
Gen
eral
sch
eme
of a
cit
rus
pack
ing
line
. 1.
Bin
uns
take
r; 2
. B
in d
umpe
r; 3
. B
in s
take
r; 4
. D
isch
arge
bel
t; 5
. R
olle
r el
evat
or;
6. F
ield
box
tw
ist
chai
n du
mpe
r; 7
. S
oaki
ng t
ank;
8.
Was
her;
9.
Mix
ing
cabi
net;
10.
Fun
gici
de a
ppli
cato
r; 1
1. P
re-d
rier
; 12
. W
ax a
ppli
cato
r; 1
3. W
ax d
rier
, 14
. F
ungi
cide
appl
icat
or;
15.
Dis
trib
utin
g be
lts;
16.
Sor
ting
tab
les;
17.
Sec
ond
clas
s fr
uit
conv
eyor
; 18
. P
acki
ng t
able
. 19
. R
olle
r tr
ansp
orte
r; 2
0.T
rans
port
ing
belt
; 21
.L
abel
ling
mac
hine
s; 2
2. R
olle
r si
zer;
23.
Tra
nspo
rtin
g be
lts;
24.
Pac
k ta
bles
; 25
. B
ox f
ille
rs;
26.
Net
mac
hine
s; 2
7. B
ag c
onve
yor
for
fill
ing
mas
ter
con
-ta
iner
s; 2
8. O
verh
ead
conv
eyor
for
em
pty
boxe
s; 2
9. F
ille
d bo
x co
nvey
or;
30.
Pal
let
wra
pper
; 31
. B
in d
renc
herr
; 32
. A
utom
atic
bul
k fi
llin
g m
achi
nes;
33.
Ele
ctri
c co
ntro
l pa
nel.

ducing the product in the line. There are two types of dumpers: water dumpersand dry dumpers.
4.1.1. Water dumpers
Water dumpers are used to manage fruit susceptible to mechanical damage suchas pears and apples. These dumpers handle the product carefully, decreasing theimpact damages during the dumping process. The dumper introduces the fruit(usually bins) in water tanks, which feed the packing line. There are two types ofwater dumpers:
(a) Direct dumping. The system dumps the fruit directly from the bin to the watertank. The bin or box is tipped and fruit fall onto the water. This system hasthe inconvenience that, during the dumping, fruit-to-fruit impacts are produced.
(b) Immersion. The system submerges the bin in the water tank by means of ahydraulic lift. Then, fruits float (Figure 2) and the bin is retired from the tankby a chain system or by the immersion system. These water dumpers are moreused, with working capacities between 20 and 25 bin/hour.
In the case of fruits with larger density than the water, e.g. pears, the water densityis increased adding some salt, e.g. sodium sulphate. Dumper tanks must have anexhaustive control of the fungical spores level. For this goal chlorine is used inconcentrations between 50 and 200 ppm. Tanks design must let the water circu-late while dumping and filling in a short period of time. Tanks can be equippedwith nets to eliminate leafs and branches, and floating systems to keep constantthe water level.
202 F. Javier García Ramos et al.
Figure 2. Immersion bin water dumper.
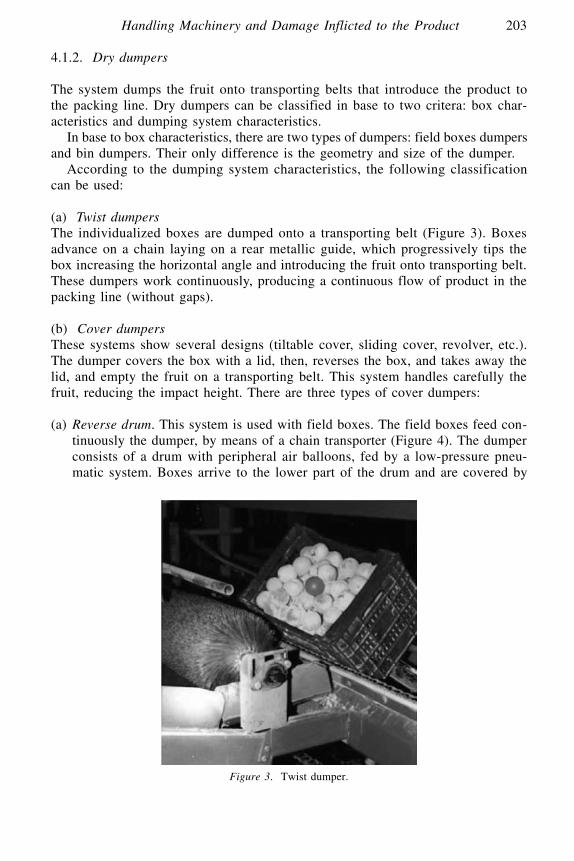
4.1.2. Dry dumpers
The system dumps the fruit onto transporting belts that introduce the product tothe packing line. Dry dumpers can be classified in base to two critera: box char-acteristics and dumping system characteristics.
In base to box characteristics, there are two types of dumpers: field boxes dumpersand bin dumpers. Their only difference is the geometry and size of the dumper.
According to the dumping system characteristics, the following classificationcan be used:
(a) Twist dumpers The individualized boxes are dumped onto a transporting belt (Figure 3). Boxesadvance on a chain laying on a rear metallic guide, which progressively tips thebox increasing the horizontal angle and introducing the fruit onto transporting belt.These dumpers work continuously, producing a continuous flow of product in thepacking line (without gaps).
(b) Cover dumpers These systems show several designs (tiltable cover, sliding cover, revolver, etc.).The dumper covers the box with a lid, then, reverses the box, and takes away thelid, and empty the fruit on a transporting belt. This system handles carefully thefruit, reducing the impact height. There are three types of cover dumpers:
(a) Reverse drum. This system is used with field boxes. The field boxes feed con-tinuously the dumper, by means of a chain transporter (Figure 4). The dumperconsists of a drum with peripheral air balloons, fed by a low-pressure pneu-matic system. Boxes arrive to the lower part of the drum and are covered by
Handling Machinery and Damage Inflicted to the Product 203
Figure 3. Twist dumper.

the balloons. Once the drum reverses the boxes, the balloons are retired and fruitfall onto a transporting belt.
(b) Tiltable cover. These dumpers are used with field boxes and bins, dumpingthe fruit discontinuously (Figure 5). Boxes are covered with a lid and rotateda specific angle. Once the boxes have been rotated, the lid is retired by meansof a pneumatic cylinder and fruit emptied onto a transporting belt.
(c) Sliding cover. These dumpers are used with field boxes and bins, dumping thefruit discontinuously (Figure 6). Boxes are covered with a lid and rotatedbetween 90° and 180°. Once rotated, the boxes advance over the lid, placingthe product onto a transporting belt. Boxes are rotated by pneumatic grips.The working capacities vary between 60 and 70 bins/hour, or between 500 and1500 boxes/hour. Working with field boxes, these can be emptied by couples,achieving capacities around 30 T/h.
204 F. Javier García Ramos et al.
Figure 4. Reverse drum.
Figure 5. Tiltable cover.

4.2. Sorting system
The elimination of defective fruits in the packing line is an important step to obtaina high quality product. This process usually is developed manually requiring alarge labour.
Sorting systems consist of tables with PVC or aluminium rollers, which rotatethe fruit providing a whole view of its surface (Figure 7). Working velocity islow, between 3 and 10 m/min, to make easier the elimination of defective fruits.Workers placed on the sides of the table eliminate the defective fruit manually.This fruit can be evacuated with different systems: mechanical systems based ontransporting belts or portable containers.
The number of sorting tables in a fruit packing line is variable. The tables areusually placed in specific positions in the line, being common to find three sortingtables with the following characteristics:
• sorting table 1. It is located after the dumper. In this table, highly defectivefruit is eliminated (rots, fungus, etc.).
• sorting table 2. It is located before the sizer. In this table, the fruit with smalldefects, not valid for common commercial categories, are eliminated. Fruit isdirected to other areas of the packing line and is used for industry or lessdemanding markets.
• sorting table 3. It is located before the packing system. The last inspection iscarried out in this table, to eliminate the defective fruit which has not beenremoved previously. This sorting table is more important in mechanical packingsystems where fruit can not be examined during the packing.
During the sorting process, the human factor is basic. Working conditions mustbe suitable to guarantee a good work. It must be taken into account that is in thispoint where the defective fruit is eliminated, and this process must be developedperfectly to avoid economic losses. The following aspects must be considered:
Handling Machinery and Damage Inflicted to the Product 205
Figure 6. Sliding cover.

• Workers must see the whole surface of the fruit. Sorting tables must incorpo-rate systems to rotate the fruit.
• Worker comfort is essential. Workers location must be comfortable, makingpossible the access to systems to evacuate defective fruit (belts, containers, etc.)
• The rules to conclude that a fruit is defective must be clear and precise. • Illumination and background colour must be appropriate to make possible a quick
detection of the defective fruit.
4.3. Sizer
The sizer classifies each fruit according to several parameters: weight, size, andcolour. It is one of the most important machines of the packing line. The sizermust work correctly to obtain a product perfectly calibrated, without calibrationerrors, which produce economical losses.
206 F. Javier García Ramos et al.
Figure 7. Sorting table.
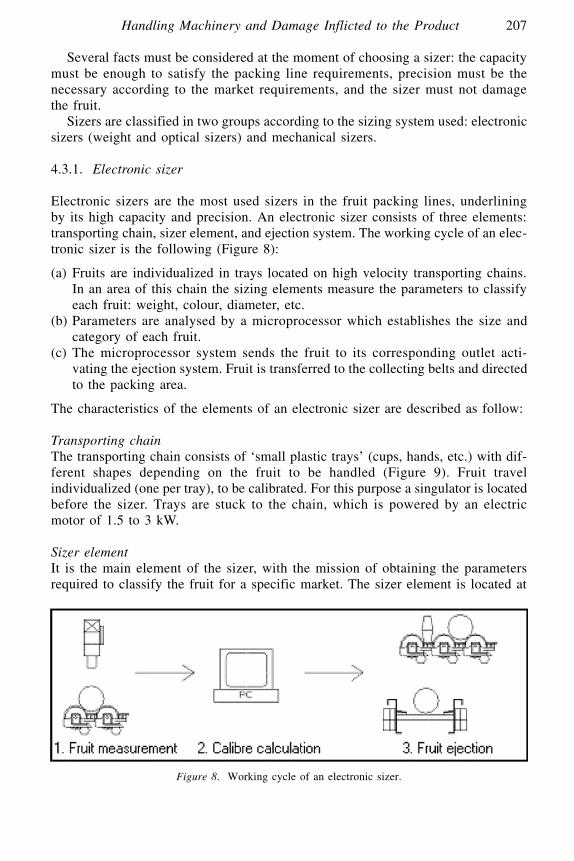
Several facts must be considered at the moment of choosing a sizer: the capacitymust be enough to satisfy the packing line requirements, precision must be thenecessary according to the market requirements, and the sizer must not damagethe fruit.
Sizers are classified in two groups according to the sizing system used: electronicsizers (weight and optical sizers) and mechanical sizers.
4.3.1. Electronic sizer
Electronic sizers are the most used sizers in the fruit packing lines, underliningby its high capacity and precision. An electronic sizer consists of three elements:transporting chain, sizer element, and ejection system. The working cycle of an elec-tronic sizer is the following (Figure 8):
(a) Fruits are individualized in trays located on high velocity transporting chains.In an area of this chain the sizing elements measure the parameters to classifyeach fruit: weight, colour, diameter, etc.
(b) Parameters are analysed by a microprocessor which establishes the size andcategory of each fruit.
(c) The microprocessor system sends the fruit to its corresponding outlet acti-vating the ejection system. Fruit is transferred to the collecting belts and directedto the packing area.
The characteristics of the elements of an electronic sizer are described as follow:
Transporting chainThe transporting chain consists of ‘small plastic trays’ (cups, hands, etc.) with dif-ferent shapes depending on the fruit to be handled (Figure 9). Fruit travelindividualized (one per tray), to be calibrated. For this purpose a singulator is locatedbefore the sizer. Trays are stuck to the chain, which is powered by an electricmotor of 1.5 to 3 kW.
Sizer element It is the main element of the sizer, with the mission of obtaining the parametersrequired to classify the fruit for a specific market. The sizer element is located at
Handling Machinery and Damage Inflicted to the Product 207
Figure 8. Working cycle of an electronic sizer.

the beginning of the transporting chain, and its position varies according to the tech-nique used. There are two kinds of sizer elements: weight sizer and optical sizer.
(a) Electronic weight sizerThe sizer classifies the fruit measuring its weight by means of an electronic scale.The scale is located under the chain (Figure 10), and weights each fruit sendingthe signal to a computer, which activates the ejection system placing the fruit inits corresponding outlet.
There are two types of weight sizers:
• Dependent on transporting chain. The tray itself is weighted when goes acrossthe scale (Figure 10). For this purpose the tray must lean on the weigher inde-pendently from the chain
• Independent on transporting chain. The weighting system is independent andconsists of a small chain, with a specific number of trays (20 ó 30), which isinserted in the transporting chain. The weighting chain leans on an electronic
208 F. Javier García Ramos et al.
Figure 9. Sizer transporting chain.
Figure 10. Electronic weight sizer.

scale obtaining the weight of each fruit. Trays of the transporting chain aredesigned in such a way that the weighting chain can be inserted betweenthem.
The tare of the scale is calculated automatically, avoiding the error derived fromthe dirt accumulation and from variations due to temperature changes. Workingcapacity of these sizers is around 10 fruits/second/line with a precision of ± 1g.
(b) Electronic optical sizerThe sizer element consists of one or several video cameras (Figure 11) locatedover the transporting chain (Figure 12). The cameras determine external parame-ters of the fruit: colour, diameter, and length. Cameras are located in illuminationboxes which make possibile the obtention of high quality images. Transporting chainsmust be designed on such way that fruit must rotate during the image acquisitionto obtain a whole view of its surface.
The video cameras used are CCD (Coupled Charge Device), and can be of threetypes: colour, b/w, and near infrared. Depending on the image processing tech-nique, there are different options to mount the cameras: one per line, two per line,one per two lines, etc. Infrared cameras are used to classify fruit whose colour issimilar to that of the trays, and to discriminate better the contour of the fruits.
Working capacity of the optical sizers is around 10 fruits/second/line, with adiameter precision of ± 1mm.
Ejection system Once each fruit has been calibrated, the microprocessor obtains the calibrationparameter (weight, colour, diameter, length, etc.) and sends the fruit to its corre-
Handling Machinery and Damage Inflicted to the Product 209
Figure 11. CCD optical camera.
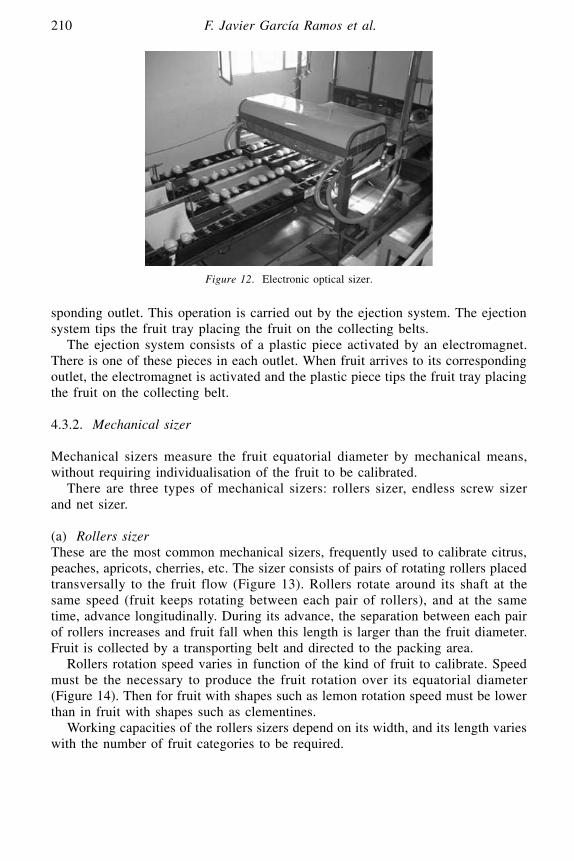
sponding outlet. This operation is carried out by the ejection system. The ejectionsystem tips the fruit tray placing the fruit on the collecting belts.
The ejection system consists of a plastic piece activated by an electromagnet.There is one of these pieces in each outlet. When fruit arrives to its correspondingoutlet, the electromagnet is activated and the plastic piece tips the fruit tray placingthe fruit on the collecting belt.
4.3.2. Mechanical sizer
Mechanical sizers measure the fruit equatorial diameter by mechanical means,without requiring individualisation of the fruit to be calibrated.
There are three types of mechanical sizers: rollers sizer, endless screw sizerand net sizer.
(a) Rollers sizer These are the most common mechanical sizers, frequently used to calibrate citrus,peaches, apricots, cherries, etc. The sizer consists of pairs of rotating rollers placedtransversally to the fruit flow (Figure 13). Rollers rotate around its shaft at thesame speed (fruit keeps rotating between each pair of rollers), and at the sametime, advance longitudinally. During its advance, the separation between each pairof rollers increases and fruit fall when this length is larger than the fruit diameter.Fruit is collected by a transporting belt and directed to the packing area.
Rollers rotation speed varies in function of the kind of fruit to calibrate. Speedmust be the necessary to produce the fruit rotation over its equatorial diameter(Figure 14). Then for fruit with shapes such as lemon rotation speed must be lowerthan in fruit with shapes such as clementines.
Working capacities of the rollers sizers depend on its width, and its length varieswith the number of fruit categories to be required.
210 F. Javier García Ramos et al.
Figure 12. Electronic optical sizer.
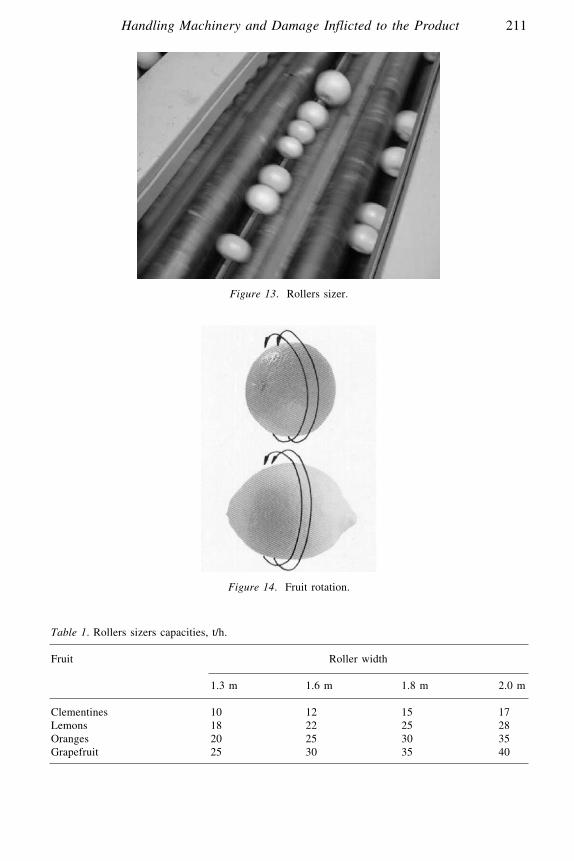
Handling Machinery and Damage Inflicted to the Product 211
Figure 13. Rollers sizer.
Figure 14. Fruit rotation.
Table 1. Rollers sizers capacities, t/h.
Fruit Roller width
1.3 m 1.6 m 1.8 m 2.0 m
Clementines 10 12 15 17Lemons 18 22 25 28Oranges 20 25 30 35Grapefruit 25 30 35 40

(b) Endless screw sizer The sizer consists of a pair of endless screws placed longitudinally to the fruitflow (Figure 15). The screws are covered by plastic material to avoid the fruitdamage. Fruit moves between each pair of screws and the width between thescrews increases with the fruit advance, then small fruit fall at the beginning ofthe screws and large fruit at the end. Each pair of screws must be fed with a sin-gulator to place the fruit on a line.
Working capacity depends on the number of lines of the sizer (pairs of endlessscrews), being around 1 t/h per line.
(a) Net sizerThe sizer consists of several nets of different diameters and a specific width(Figure 16). The number of nets coincides with the number of fruit calibres. Eachnet is disposed forming a cylinder and is placed transversally to the fruit flow. If
212 F. Javier García Ramos et al.
Figure 15. Endless screw sizer.
Figure 16. Net sizer.

the fruit diameter is lower than the net diameter the fruit fall and is collected by atransporting belt. If not, fruit passes to the following net.
Working capacity depends on the width of the sizer.Net sizers are not commonly used to calibrate fruit commercially, although are
really useful as presizers to put out of the line fruit of not commercial diameters.For this purpose, a net sizer of a specific diameter is located after the dumper insome packing lines.
4.4. Packing systems
Packing systems prepare the fruit for the market in different boxes, nets, bags,etc. According to the process automatization, there are two types of packing systems:manual and mechanical packing.
(A) Manual packing
Fruit is packed manually in different packages. For this goal, packing tables areused.
Packing tables (Figure 17) consists of collecting transporting belts and lateraltrays (located in parallel to the belts) where fruits are placed. Workers take manuallythe fruit and place it in the packages. Packages can arrive to the sorting table by
Handling Machinery and Damage Inflicted to the Product 213
Table 2. Net sizers capacities, t/h.
Net width
0.7 m 0.9 m 1.2 m 1.5 m
Capacity (t/h) 2 3.5 5 6.5
Figure 17. Packing table.

means of transporting chains. Once filled, the packages are placed in chains andtransported to the loading area.
Manual packing has the advantage that fruit is handled carefully, and can beinspected in a final sorting to remove the remaining defective fruit.
(B) Mechanical packing
There are a big number of different packing machines because of the differentpreferences of the consumers in relation to the fruit packages. Analysing the packingsystem, three groups of packing machines can be found: weighers, packing systemsby number of fruits, volume-packing systems.
(a) WeighersThe quantity of fruit to place in each package is determined by weight. Fruit isweighed by means of electronic scales. The weight is controlled by a microprocessor.Once the established weight is achieved, the fruit is placed in the package anddirected to a collecting belt.
Weigher characteristics vary with the type of package, being the most common:box fillers, and net and bag fillers.
– box filler (Figure 18): Packing volume varies between 5 and 20 kg with a weightprecision between 0.5 and 1%. The machine is powered by electric motors from1 to 3 kW, and works by means of pneumatic systems with working pressuresbetween 4 and 8 bar. The machine may be equipped with small lifts to place
214 F. Javier García Ramos et al.
Figure 18. Box filler.

the fruit gently on the box, decreasing the fall height. Box fillers are used topack citrus, tomatoes, plums, apples, pears and apricots.
– net and bag filler (Figure 19): Packing volume varies between 0.5 and 5 kgwith weight precision similar to that of the box filler. Working capacity variesbetween 20 and 40 nets per minute. The machine is powered by electric motorsfrom 1 to 4 kW, and works by means of pneumatic systems similar to those ofthe box filler.
(b) Packing systems by number of fruitsThe system is based in the use of pneumatic systems with a net of suction nozzles(one per fruit). The nozzles transfer the fruit to the box, which has inside an alveolartray with the same geometry than the net of nozzles (Figure 20). Fruit handling isgentle and working capacities between 200 and 600 boxes/hour can be achieved.
Handling Machinery and Damage Inflicted to the Product 215
Figure 20. Pneumatic filler by number of fruits.
Figure 19. Net filler.

Energy required varies between 1 and 4 kW, and air consumption between 10 and15 l/min.
(c) Volume packing systemsVolume packing systems are based in the filling in bulk of boxes and bins. Thesystem consists of a transporting belt that places the fruit in a box or bin. Opticalsensors control the box filling. When the box is filled the optical sensor stops thetransporting belt advance. For the case of bin fillers, where the fall height is large,the system can make use of vertical transporters with mobile fingers. In this way,the height between the transporter and the bottom of the bin is kept always constantavoiding impacts and damage to the product (Figure 21).
5. ADDITIONAL ELEMENTS
5.1. Depalletlzer and palletizer
The depalletizers destack either plastic or wooden boxes, which can then be fittedinto the fruit packing line. The operation is fully automatic. Maximum productionvaries between 700 and 1500 boxes/hour, with installed power around 3 kW.Palletizers use the same technique to stack all kinds of boxes, carton, plastic ortimber boxes in universal dimensions (maximum 1200 mm × 1200 mm).
216 F. Javier García Ramos et al.
Figure 21. Bulk bin filler.

5.2. Presizer
Presizer can be located at the beginning of the packing line, after the dumper, andis used to eliminate fruits of not commercial diameters. For this purpose, net or rollersizers can be used.
A different option is the use of independent presizer packing lines. These lineshandle all the fruit classifying it by calibres and preparing lots, which pass to therefrigerating cameras. The presizer line consists of a dumper, a sorting table, asizer (electronic or mechanic) and a bulk packing system. The fruit, once preclas-sified in the presizer line, is introduced in the fruit packing line in function of themarket orders. With this working system, the performance of the packing lineincreases.
5.3. Washing system
Some fruits must be washed during its handling on the packing lines to eliminatedirtiness, dust, residues, etc. For this goal washers are used (Figure 22). The washerconsists of a series of nylon brushers where fruit is gently scrubbed to removeresidues and dirtiness. After scrubbing fruit is washed with fresh water and thentravels over sponge rolls which eliminate the water to help the drying of the fruit.Detergents and fungicides can be mixed with the water using precision pumps.Working capacity can achieve 20 t/h. Washers are powered by electric motors of1–2 kW.
5.4. Drier
Once washed, the fruit is dried using driers or drying tunnels. Driers are locatedafter the washing and waxing systems. Thermal driers produce the drying where
Handling Machinery and Damage Inflicted to the Product 217
Figure 22. Washing system.

the heated air is recirculated while a portion of the humid air is exhausted througha chimney. For this goal turbines around 2 kW are used. Working capacity canachieve 30 t/h.
There are two kinds of driers: air drier and cold drier.
(a) Air drierThe drying is produced by the application of a flow of air, usually hot, over
the product. These are the standard systems in whatever fruit packing line. Air driers can be open (brush drier, Figure 23) or closed (drying tunnel, Figure
24). Drying tunnels are closed systems with turbines to distribute the hot airachieving temperatures around 60 °C. The hot air is generated in oil burners, althoughelectric resistances can be used. Brush driers are based in the same technique withthe difference that the system is open.
218 F. Javier García Ramos et al.
Figure 24. Drying tunnel.
Figure 23. Brush drier.

(b) Cold drierCold driers have appeared recently in the market. The system works with electricenergy, and its technique is similar to that of the refrigerating cameras. Fruit tem-perature does not increase during the drying process. The energy consumption islower than that of the air driers.
5.5. Waxer
Some fruits like citrus and apples are commonly waxed during its handling on thepacking lines. Waxer (Figure 25) is located after the washing system and drier, asfruit must be clean and dry to obtain a successful treatment. After waxing fruitmust be dried again.
Waxer consists of a series of transverse horsehair brushes with an applicatorhead over them. A coating of wax is sprayed on the fruit when is passing on thebrushes. Waxes can be mixed with fungicides. A pumping unit that has a filter toavoid clogging in the piping system, a manometer, and a pressure chamber to regulatepressure of the wax being applied.
Waxes are used to reduce the water loses, replace the natural waxes removedin the washing process, cover superficial wounds, and improve the fruit appear-ance. Waxes must be eatable and can’t reduce the fruit water losing more than athird part to keep a normal breathing activity.
5.6. Fungicide applicator and sanitary control system
Fungicide treatments can be applied by means of nozzle applicators or water tankswhere fungicide is dissolved.
Handling Machinery and Damage Inflicted to the Product 219
Figure 25. Waxer.
(a) Nozzle applicatorThe fungicide is applied in equipments similar to that used to apply waxes, usingnozzles.
(b) Water tankThe equipment consists of a water tank where the fungicide is dissolved. Thewater is heated using electric resistances to increase the treatment efficiency. Thissystem produces a better fruit covering with a smaller volume of fungicide. Fruitis evacuated from the tank by a roller transporter ramp. The tank design must besuch that the water could be changed quickly when the fungical spore level in thewater is high.
A different kind of sanitary control is the packing line separation in two areas:clean and dirty areas. This method is based in the use of walls to separate thereception and dumping area from the rest of the packing line, reducing the propa-gation of spores in the warehouse atmosphere.
A new system to control the propagation of spores is the closed system to removedecayed fruit. The system consists of hermetic conducts (connected to the sortingtables) where decayed fruit are placed and evacuated from the warehouse.
5.7. Labeler
Fruit boxes must have labels with the fruit characteristics: manufacturer informa-tion, variety, country, category, calibre, etc. These labels are obtained by means oflabelling systems more or less automatized.
Besides box labels, many producers are using individual polyethylene labelsplaced on each fruit to enhance the fruit quality (appearance) and the commercialbrand. These machines, totally automatized (Figure 26) are located in the packingarea of the line.
220 F. Javier García Ramos et al.
Figure 26. Drum labeler.

The labeler places the label over the fruit either just placed on the box or whenis travelling on the packing line. Rubber bellows extended by adjustable air pressureapply the labels. Each one is pressed down gently. The pneumatic system can consistsof a rotating drum (Figure 26) or of vertical arms (Figure 27). Working capacitycan achieve 400 labels/minute/head.
5.8. Accumulator
Accumulators are located before the packing system to get an optimum performanceof the packaging machines. The accumulator (sometimes called ‘lung’ after itsway of working) is a container with capacity around 400–500 kg, and installed powerbetween 0.5 and 1.5 kW. The accumulator consists of three conveyor belts, one ateach side (larger vertical lateral sides of the box) and one at the bottom (hori-zontal, figure 28), fully synchronized and controlled by an optical sensor. The opticalsensor measures the fruit level and sends the signal to the controller in order to movethe belts depending on the amount of fruit admitted by the packaging system.
6. HOW TO DECIDE THE SIZE OF A PACKING LINE
Fruit packing lines are composed by a group of machines disposed in a specific orderand connected by means of transporting belts, elevators, roller transporters, etc.Equipment working capacities are not always the same, then, equipments with thelowest capacities must be considered to calculate the dimension and maximumperformance of the packing line.
Sizers are one of the equipments to be considered because its velocity is limited.Depending on the calibre, sizers can achieve velocities around 10 fruits/second/line,with lengths between trays of 9 cm (velocities around 1 m/s).
The packing line is divided in two areas with different working width: before
Handling Machinery and Damage Inflicted to the Product 221
Figure 27. Arm labeler.

and after sizer. In the first area, machines have a large width. After sizer, the lineis divided in small lines, one per calibre, with lower widths.
Several aspects must be considered before sizing a fruit packing line:
• Maximum width of the equipments is restricted by the maximum trucks width,being commonly 2.5 m.
• For a width of 2.5 m, the maximum number of lines in the sizer varies between8 and 10.
• Economically, it is better to design only one packing line that two or more,because electronic and production costs are lower. However, sometimes it isnecessary to design two lines to achieve objectives of liability and equipmentutilization.
Packing line dimensionThe first step is to calculate the sizer capacity. For this goal, the following para-meters are required:
V = sizer velocity in fruits/second (2–12). R = occupation percentage of the sizer (70–90%).P = average weight of the fruit (apple, 160 g; peach, 130g; kiwi, 90 g; etc.)N = number of lines of the sizer (2–10).
The working capacity is calculated with the following equation:
R PQ(kg/h) = V × 3600 × –––– × –––– × N
100 1000
Knowing the fruit production, the number of lines of the sizer is calculated. Theother equipments must be designed to guarantee a correct feeding of the sizer. The
222 F. Javier García Ramos et al.
Figure 28. Accumulator.

capacity of the other machines can be calculated establishing widths and veloci-ties. The percentage of occupation, the average weight and the average diametermust be considered to establish the volume of fruits per surface unit.
Power requirementMost of the machines used in a fruit packing line base its performance in the useof roller transporters and conveyor belts powered by electric motors with installedpower of 1–5 kW. Motors are equipped with frequency converters to obtain a greatrange of velocities, making the machines more versatile. Motor power is calcu-lated according to the transporting chain dimensions and the quantity of fruit tobe transported. As an example, the power (N) necessary to drive a transportingbelt would be calculated using the following equation:
N = N1 + N2 + N3;
N1 = Power to move the belt (without product). This power depends on the weightof the mobile elements, friction coefficient in the support rollers, inclinationangle and speed.
N2 = Power to move the product. It depends on the same factors than N1, consid-ering exclusively the weight of the charge to be transported.
N3 = Power to elevate the charge. It is used for the case of belts in slope, dependingon the weight of the product, the height to achieve and the transport speed.
Calculation of each power is obtained using the following equations:
C·fr·Gm·vN1 = ––––––––––
1000
N1 = power to move the belt without product (kW)C = security coefficient (1–6)fr = friction coefficient of the supporting rollers (0,018–0,030)Gm = belt weight (Gc) and rotating elements weight (Gr, rollers) (N)Gm = Gc· cos α + Gr
v = working speed (m/s)
C·fr·Gf·cos α ·vN2 = –––––––––––––––––
1000
N2 = power to move the product (kW)C = security coefficient (1–6)fr = friction coefficient of the supporting rollersGf = fruit weight (N) for the whole belt lengthv = working speed (m/s)
Gf·v ·HN3 = ––––––––
l ·1000
Handling Machinery and Damage Inflicted to the Product 223

N3 = power to elevate the charge (kW)Gf = fruit weight (N) for the whole belt lengthv = working speed (m/s)l = belt length (m)H = transport height (m)
The total power necessary to drive the belt is: N = N1 + N2 + N3;Na
The motor power (Nm) is obtained with the following equation: Nm = –––η
Nm = motor power (kW)Na = drive power (kW)η = motor efficiency
Transported belts are powered commonly by 0.37 kW (1/2 CV) motors, apart frombelts of small dimensions (less than 2 m length and 30 cm width), which are poweredby 0.18 kW (1/4 CV) motors. Sizers are equipped with motors of 1.5 to 3 kW(2–4 CV). Electric motors of low power have a low cost; because of this they arecommonly over dimensioned.
7. DESIGN OF FRUIT PACKING LINES TO REDUCE MECHANICAL DAMAGE
7.1. Previous considerations
During the handling process in the packing lines, fruit receive impacts, frictionsand compressions producing mechanical damages. The consequence is the appear-ance of bruises and wounds which reduce the quality and the commercial value ofthe fruit, and produce decays.
The main sources of fruit damage in the packing lines are:
• Impacts against machines surfaces.• Frictions against machines surfaces.• Compressions against machines surfaces, boxes bottoms, etc.• Fruit-to-fruit impacts.
There are two main factors affecting the mechanical damage: packing line aggres-siveness, and fruit susceptibility to mechanical damage.
Packing line aggressiveness depends on several factors: correct design and imple-mentation of the packing line, correct election of the machines, and accurate workingconditions.
Fruit damage susceptibility depends on: fruit variety, firmness, humidity, tem-perature, growing conditions, etc.
From the point of view of the mechanical damage, transfer points betweenmachines (for instance, the transfer point between a conveyor belt and a sortingtable) are the most critical points where impacts and frictions are produced.
224 F. Javier García Ramos et al.

7.2. Critical points detection. ‘Electronic fruits’
A first step to avoid the mechanical damage in a fruit packing line is to removethe critical points where fruit is damaged. ‘Electronic fruits’ are used for this purpose.An electronic fruit is an impact recording device used to detect the zones of thepacking line where mechanical charges are produced, and to quantify the intensityof these charges. The sensor is introduced in the packing line and travels with thefresh fruit recording mechanical charges. These sensors have a dimension, weightand appearance similar to those of a real fruit. The use of this technology makespossibile: the correct design of a packing line, the correct choice of padding mate-rials, and the optimal establishment of working conditions in the line (speeds, heights,product flow, etc.).
According to the technology used, there are three types of electronic fruits:
• Piezoelectric effect• Hydrostatic pressure differences• Deceleration
Piezoelectric effectThe sensor consists of a toroidal plastic structure where a piezoelectric cable is rolledup. When the sensor receives a mechanical charge, the piezoelectric cable is pres-sured giving an electric signal which is proportional to the mechanical charge.This signal is saved in a memory until a larger charge is registered. A screenlocated in the sensor surface shows the maximum charge registered during theprocess and the time in seconds passed between the sensor connection and theimpact occurrence. This kind of sensor is capable of detecting static and dynamiccharges.
Hydrostatic pressure differences This device measures the hydrostatic pressure variation produced in a sphere filledof silicon oil, while the sphere receives mechanical charges. For each impact, thesensor records the maximum force, the time, the duration, and the force/time integral.The sensor is capable of detecting static and dynamic charges, but some errors appearwhen temperature changes are produced during the data acquisition. Temperaturechanges modify the rubber carcase and the silicon oil characteristics.
DecelerationThe sensor detects dynamic charges (not static) by means of a piezoelectric triaxialaccelerometer. For each impact the sensor records two parameters: maximum accel-eration and impact duration. Combining both parameters, acceleration and time,the velocity change produced during the impact is obtained. This sensor is widelyaccepted by enterprises and research teams, and is commonly used in the fruitpacking lines evaluation.
Handling Machinery and Damage Inflicted to the Product 225

7.3. Transfer points design
A correct transfer points design is necessary to guarantee the absence of mechan-ical damage to the fruit during its handling in the packing line. For this goal, theintensity of the charges received by the fruit must be lower than the bruise threshold.
The design implies the use of electronic fruits to quantify the charge intensitiesand the zones where they are produced, and the application of corrective measuresto avoid the critical points.
The following aspects must be considered to reduce the mechanical damage inthe transfer points.
7.3.1. Transference to a conveyor belt
The transfer point must be designed to avoid the impact of the fruit against struc-tural elements supporting the conveyor belt: rollers, metallic sheets, shafts, etc.The use of rollers as structural elements is recommendable because its positioncan be modified easily. The use of longitudinal structures such as continuous metallicsheets or longitudinal beams must be avoided.
Figure 29 shows correct and incorrect designs of transferences to a conveyor belt.
7.3.2. Simple transfer points
A simple transfer point is the one with a low fall height (<20 cm) and with lon-gitudinal design. In this kind of points mechanical damage can be avoided usingdifferent decelerator elements: brushes, curtains, and blankets.
(a) Powered brushesPowered brushes consist of a horizontal shaft where bristles of different materialsare inserted. The brush is powered by an electrical motor on such way that thebrush peripheral speed must be similar to that of the element that brings the fruit.Bruise height over the receiving element must be regulated to guarantee the correctperformance with fruit of small diameter. Figure 30 shows this kind of deceler-ator element.
(b) Blankets and curtainsBlankets and curtains are passive decelerators (Figure 31), which reduce the fruitspeed when it passes across the transfer point. Blankets consist of flexible plasticsheets. Curtains consist of plastic bristles or sheets. The height of the curtainand blanket over the ramp or element that receives the fruit must be regulatedcorrectly.
7.3.3. Transfer points in ramp
Transfer points in ramp must be designed to avoid an increase in the fruit velocitywithout producing product retentions. Several decelerator elements can be used withthis purpose.
226 F. Javier García Ramos et al.

Handling Machinery and Damage Inflicted to the Product 227
Figure 29. Transference to a conveyor belt.
Figure 30. Powered brush.
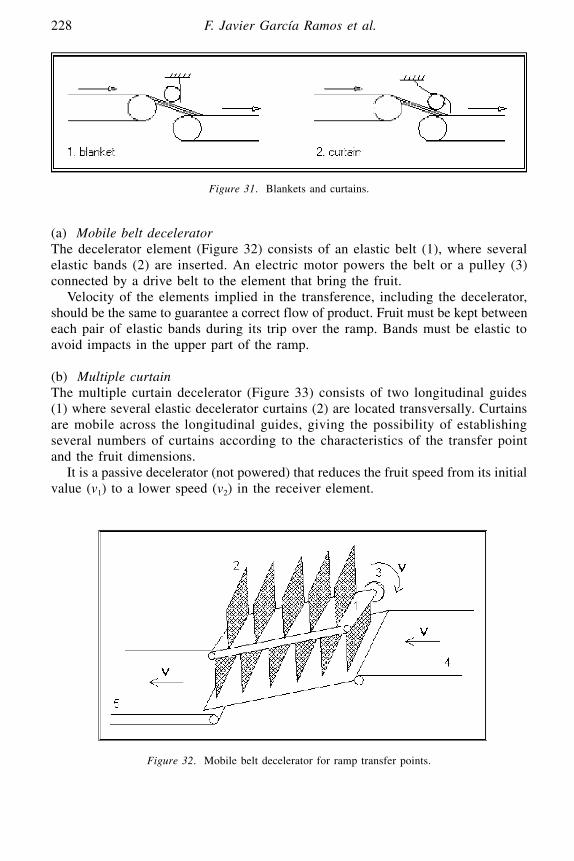
(a) Mobile belt deceleratorThe decelerator element (Figure 32) consists of an elastic belt (1), where severalelastic bands (2) are inserted. An electric motor powers the belt or a pulley (3)connected by a drive belt to the element that bring the fruit.
Velocity of the elements implied in the transference, including the decelerator,should be the same to guarantee a correct flow of product. Fruit must be kept betweeneach pair of elastic bands during its trip over the ramp. Bands must be elastic toavoid impacts in the upper part of the ramp.
(b) Multiple curtainThe multiple curtain decelerator (Figure 33) consists of two longitudinal guides(1) where several elastic decelerator curtains (2) are located transversally. Curtainsare mobile across the longitudinal guides, giving the possibility of establishingseveral numbers of curtains according to the characteristics of the transfer pointand the fruit dimensions.
It is a passive decelerator (not powered) that reduces the fruit speed from its initialvalue (v1) to a lower speed (v2) in the receiver element.
228 F. Javier García Ramos et al.
Figure 31. Blankets and curtains.
Figure 32. Mobile belt decelerator for ramp transfer points.

7.3.4. Transfer points in angle
In a transfer point in angle, there are two main types of mechanical damage tothe fruit: impacts against machines surfaces, and fruit-to-fruit impacts.
Although packing line manufactures have recently designed curved conveyorbelts, they are expensive and difficult to adapt to old packing lines. As an alterna-tive, several decelerator elements can be used to reduce this problem.
(a) Powered horizontal brushCharacteristics of this element are similar to those described for the case of singletransfer points. The brush must be located forming an angle with the receivingelement to permit a continuous flow of the product (Figure 34). Brush peripheralvelocity must be similar or superior to that of the elements implied in the transferpoint.
(b) Powered vertical brushThe decelerator consists of two vertical shafts with an elastic band with polyeth-ylene bristles (Figure 34). One of the shafts is powered by an electric motorproducing a rotation of the band to facilitate the flow of the fruit. Location angleand peripheral speed must be regulated to obtain a correct flow of fruit.
The vertical brush reduces the number of fruit-to-fruit impacts, and its applica-tion is really useful in belt conveyor of small width, as those used in the zones ofthe packing line located after the sizer.
7.3.5. Padding materials
A common way of reducing the impacts received by the fruit in the packing lineis the use of padding materials to cover the surfaces of the machines. Paddingmaterial surface must not be rough, and must be cleaned usually to avoid frictiondamages.
A good padding material must satisfy three requirements: 1. It must absorb the
Handling Machinery and Damage Inflicted to the Product 229
Figure 33. Multiple curtain decelerator.

impact energy without damaging the fruit; 2. It must not apply a high rebound energyto the fruit; 3. It must be durable and compatible with the working conditions ofthe packing line (no toxic, no humidity absorption, etc.).
7.4. Working conditions in a fruit packing line
The fact of having a correctly designed packing line with accurate machinery isessential to obtain a high quality product. But this fact must be connected with acorrect use of the line, for which, several aspects must be considered: flow of productin the line, packing line cleaning, fruit properties, etc.
7.4.1. Flow of product in the line
Packing line must work at full capacity to obtain a continuous flow of product. Flowdiscontinuities produce fruit damage and reduce the machinery performance. Toavoid this problem it is necessary the use of dumpers able of introducing the productin the line continuously. Furthermore, the speed of the different machines must beregulated correctly.
7.4.2. Friction damages and surfaces cleaning
Friction damage, together with impact and compression damage, is one of the causesof the fruit mechanical damages in the packing lines. Friction is the combinedeffect of:
• contact deformation (impact) • relative movement between the fruit and the mobile element
For instance:
• transference to a conveyor belt: the fruit impacts against the belt and is deformed.At the same time the belt rubs the fruit,
230 F. Javier García Ramos et al.
Figure 34. Decelerator for transfer points in angle. H:B horizontal brush; VB: vertical brush.

• lateral of a conveyor belt: the fruit advances on the belt with its same speed.At the same time is rubbing against the belt lateral. This effect is increasedwhen the machines surface is rough due to the dirt.
The friction problem can be reduced avoiding relative speeds between elementsand cleaning regularly the machines surfaces.
7.4.3. Packing line maintenance
It is necessary to carry out a periodic maintenance of the packing line, which mustbe focused in the following objectives:
• machinery cleaning• control of the correct performance of the nozzles in the washer, waxer and
fungicide applicator• padding materials inspection• decelerators systems regulation• sizer accuracy inspection
7.4.4. Fruit properties
Fruit must be in accurate conditions for its handling in the packing line. Fruitproperties vary in function of physical and environmental factors. Each fruit varietyrequires optimum conditions of firmness, temperature, humidity, etc. to makepossible a handling without negative effects for the product final quality.
Handling Machinery and Damage Inflicted to the Product 231

MECHANICAL DAMAGE DURING FRUIT POST-HARVESTHANDLING: TECHNICAL AND PHYSIOLOGICAL IMPLICATIONS
DOMINGO MARTINEZ-ROMERO, MARIA SERRANO, ANGEL CARBONELL,SALVADOR CASTILLO, *FERNANDO RIQUELME AND DANIEL VALEROMiguel Hernandez University, Ctra. Beniel, Km 3.2, 03312 Orihuela, Alicante, Spain. CEBAS-CSIC,Campus de Espinardo, 30100 Murcia, Spain
1. INTRODUCTION
Mechanical damage is considered as a type of stress that occurs during the post-harvest manipulation of fruits. This stress is accompanied by physiological andmorphological changes that affect the fruit commodity. Apart from the mechan-ical stress, there are other types of stress due to biological and environmental factors,which also cause quality reduction (Shewfelt, 1998).
The occurrence of fruit stress during post-harvest handling and storage has beenwidely investigated in different plant species and, in general, is mainly attributedto:
(a) Abnormally high values of temperature and relative humidity. (b) Microbial infections.(c) Composition of storage atmosphere.(d) Mechanical damage.
Mechanical damage of fruits and vegetables, as consequence of inappropriateharvest, manipulation, and transport techniques, is one of the most common andsevere defects; it has great economical repercussions, mainly due to negative changesin organoleptic attributes (skin and flesh browning and off-flavours) and internalbreakdown reactions (Castillo, 1992).
Fresh fruits need to be manipulated at different stages from the orchard to theindustry, before reaching consumers. At each of these stages, injuries can be induced,and these injuries could be: a) externally visible and easily detectable or b) non-externally visible because internal bruising is masked by external colour; however,both types of injuries result in a quality reduction (Vergano et al., 1991a).Internationally, mechanical damage is the major cause of post-harvest losses (FAO,1989).
The amount of mechanical damage that is admissible for fruits and vegetablesin commerce is legislated by individual countries and international organizations;an example of this legislation is provided by the European Community (CEE law2251/92 published in DO No. 219 of August, 1992). The minimum EuropeanCommunity quality requirements are established according to parameters such asappearance, visual condition (occurrence of defects), size, grading and colour, andapply to most volume crops grown in or imported into the European Communitymember states.
R. Dris and S. M. Jain (eds.), Production Practices and Quality Assessment of Food Crops,
© 2004 Kluwer Academic Publishers. Printed in the Netherlands.
233
Vol. 3, “Quality Handling and Evaluation”, pp. 233–252.
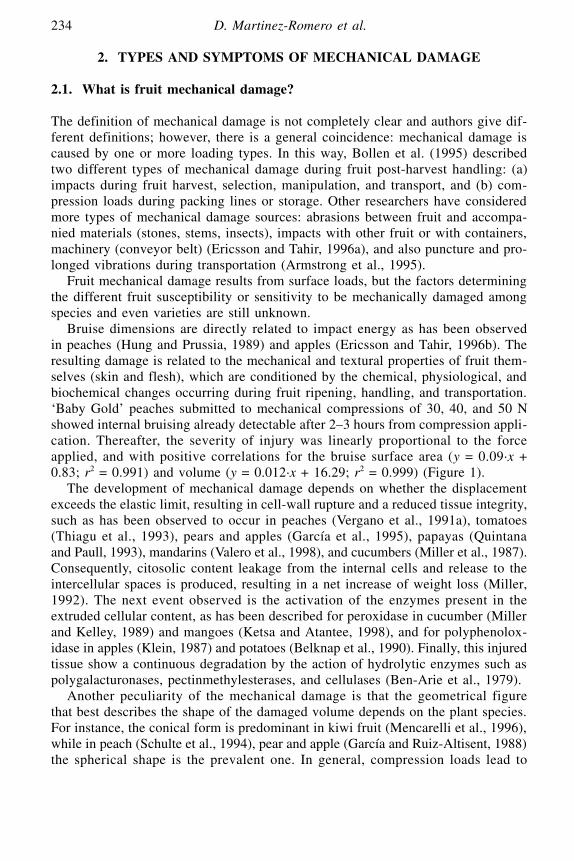
2. TYPES AND SYMPTOMS OF MECHANICAL DAMAGE
2.1. What is fruit mechanical damage?
The definition of mechanical damage is not completely clear and authors give dif-ferent definitions; however, there is a general coincidence: mechanical damage iscaused by one or more loading types. In this way, Bollen et al. (1995) describedtwo different types of mechanical damage during fruit post-harvest handling: (a)impacts during fruit harvest, selection, manipulation, and transport, and (b) com-pression loads during packing lines or storage. Other researchers have consideredmore types of mechanical damage sources: abrasions between fruit and accompa-nied materials (stones, stems, insects), impacts with other fruit or with containers,machinery (conveyor belt) (Ericsson and Tahir, 1996a), and also puncture and pro-longed vibrations during transportation (Armstrong et al., 1995).
Fruit mechanical damage results from surface loads, but the factors determiningthe different fruit susceptibility or sensitivity to be mechanically damaged amongspecies and even varieties are still unknown.
Bruise dimensions are directly related to impact energy as has been observedin peaches (Hung and Prussia, 1989) and apples (Ericsson and Tahir, 1996b). Theresulting damage is related to the mechanical and textural properties of fruit them-selves (skin and flesh), which are conditioned by the chemical, physiological, andbiochemical changes occurring during fruit ripening, handling, and transportation.‘Baby Gold’ peaches submitted to mechanical compressions of 30, 40, and 50 Nshowed internal bruising already detectable after 2–3 hours from compression appli-cation. Thereafter, the severity of injury was linearly proportional to the forceapplied, and with positive correlations for the bruise surface area (y = 0.09·x +0.83; r2 = 0.991) and volume (y = 0.012·x + 16.29; r2 = 0.999) (Figure 1).
The development of mechanical damage depends on whether the displacementexceeds the elastic limit, resulting in cell-wall rupture and a reduced tissue integrity,such as has been observed to occur in peaches (Vergano et al., 1991a), tomatoes(Thiagu et al., 1993), pears and apples (García et al., 1995), papayas (Quintanaand Paull, 1993), mandarins (Valero et al., 1998), and cucumbers (Miller et al., 1987).Consequently, citosolic content leakage from the internal cells and release to theintercellular spaces is produced, resulting in a net increase of weight loss (Miller,1992). The next event observed is the activation of the enzymes present in theextruded cellular content, as has been described for peroxidase in cucumber (Millerand Kelley, 1989) and mangoes (Ketsa and Atantee, 1998), and for polyphenolox-idase in apples (Klein, 1987) and potatoes (Belknap et al., 1990). Finally, this injuredtissue show a continuous degradation by the action of hydrolytic enzymes such aspolygalacturonases, pectinmethylesterases, and cellulases (Ben-Arie et al., 1979).
Another peculiarity of the mechanical damage is that the geometrical figurethat best describes the shape of the damaged volume depends on the plant species.For instance, the conical form is predominant in kiwi fruit (Mencarelli et al., 1996),while in peach (Schulte et al., 1994), pear and apple (García and Ruiz-Altisent, 1988)the spherical shape is the prevalent one. In general, compression loads lead to
234 D. Martinez-Romero et al.

parabolic forms, while impact forces describe irregular shapes (Chen et al., 1987).In citrus fruits, mechanical damage produces cell rupture in both the epidermisand pulp, and disruption of segments and essential oils vessels with no internalbrowning being detectable (Castillo, 1992).
Another kind of mechanical damage is the coming out of skin discolorations,which consists of dark brown and orange spots, and has been attributed to micro-bial infections, vibrations, or abrasions during handling. Mechanical damage islocalised specifically at the exocarp (cuticle, epidermis and hypodermis) with thetissue under the exocarp remaining unblemished and turgid. This effect could beintensified when fruit is manipulated with dirty skins because dirt particles will inten-sify the fruits damage.
Lemon damaged with compression forces of 50 N showed an acceleration ofthe colour changes (expressed as the index a/b from the Hunter Lab system)compared with non-damaged lemons during storage at 12 °C (Figure 2) (Martínez-Romero et al., 1999); however, in blueberry the mechanical damage had nosignificant effects on the colour development (Lurie et al., 1997).
Mechanically damaged tissues are the key factor determining the pathogeninvasion resulting in decays, which is a severe effect during the post-harvest shelflife of fruits (Bruton, 1994). The skin of a mature root or tuber is normally aneffective barrier against most potentially invading bacteria and fungi causing rottingof tissue. Any rupture of this barrier caused by damage or injury to the skin willprovide an inlet for infection and will also stimulate physiological deteriorationand dehydration (FAO, 1989).
Mechanical Damage During Fruit Post-Harvest Handling 235
Figure 1. Surface (blank) and volume (grid) of bruising damage in Baby-Gold peaches at 24 hoursafter compression of 25 N.

2.2. Factors affecting bruising occurrence
There are several factors determining the predisposition of a fruit to be bruised:
(a) Fruit species.(b) Orchard cultural practises.(c) Harvest, transportation and handling modes.(d) Optimal use and maintenance of machinery during the post-harvest manipula-
tion.
2.2.1. Fruit species
The susceptibility to be bruised depends on the plant species studied due mainlyto their different physical properties (García and Ruiz-Altisent, 1988; Brusewitz andBartsch, 1989). Thus, there are some studies dealing with the different responseof several fruit varieties or cultivars to mechanical damage (Maness et al., 1995)intentionally caused mechanical damage in five peach cultivars and found signifi-cant differences among the diameters and depths of the injuries. Similar results havebeen reported for Asian pear (Chen et al., 1987) and apple (Ericsson and Tahir,1996b). These authors concluded that this different behaviour among cultivars ismainly due to the different structural properties of the damaged tissues: cell wallstrength, stiffness of intercellular adhesion and sap pressure within cells. Besides,the presence of air gaps in the intercellular spaces increases the tissue elasticity,
236 D. Martinez-Romero et al.
Figure 2. Colour index (a/b) of lemons (cv. Verna) non-damaged (�) and damage (�), during storageat 12 °C.
which plays a key role in absorbing the impact energy and minimises both theinternal and external damages (Pérez, 1999).
The maturation stage at harvest also affects the fruit response to the mechan-ical stress. In general, mature and soft fruits are more susceptible to mechanicaldamage. Thus, ‘Aroma’ and ‘Ingrid Marie’ apples harvested early are more resis-tant than those harvested 10 days after; and mechanical damage increased between10–40% (Ericsson and Tahir, 1996b). The same conclusion was postulated whentomatoes (Thiagu et al., 1993), and pears (García and Ruiz-Altisent, 1988), wereharvested in different seasons and ripening stages. However, ‘Cox’s Orange Pippin’did not show significant differences under the same experimental conditions(Ericsson and Tahir, 1996b).
Another factor influencing bruise susceptibility is the number of days elapsedbetween harvest and the generation of the mechanical damage; thus, the greaterthe number of days elapsed, the lower the fruit susceptibility, postulating thatyoung tissues are more sensitive to bruise due to their higher turgidity.
Other factors that can affect the intensity of mechanical damage are: internal tem-perature of fruit, fruit size, tissue firmness, and even the fruit size exposed to thebruising force (Hung and Prussia, 1989).
2.2.2. Orchard cultural practises
Agronomical factors previous to fruit harvest can affect bruise susceptibility as well.Irrigation of fruit trees before harvesting and high relative humidity can increasethe susceptibility to mechanical damage (García et al., 1995). The total soil humidityis another key factor, thus tubers harvested when the soil is relatively dry are moreseverely injured than tubers harvested following rain or irrigation (Knowles, 1989).
The orchard cultural practise affecting the most the sensitivity of fruit to damageis fertilisation, the effects of potassium being the best known. Potassium influ-ences cell size and the physical properties of the cell wall of tubers (turgidity);besides, it has the ability to form coloured oxidation products after cell damage. Thenitrogen fertilisation effect on internal bruising is less clear; it is believed thathigh levels of nitrogen result in slightly lower specific gravity of fruits, which wouldtend to reduce bruising (Knowles, 1989).
2.2.3. Harvest, transportation and handling modes
The typical fresh-market fruits and vegetables handling system has been employedto study quality changes. This systems approach allows for the assessment of theeffect of each individual handling step on the final product quality and providesthe basis for establishing general coordination and quality control among all the indi-vidual operations (Shewfelt et al., 1987).
There are some studies dealing with the evaluation of mechanical damage duringharvest, handling, and transport of strawberry (Camarena and Reyes, 1995), peach(Shewfelt et al., 1987), lemon (Miller, 1987), and apple (Brown et al., 1993). Forthese fruits, the main operations are summarised in Figure 3.
The handling may occur both immediately after harvest and several months
Mechanical Damage During Fruit Post-Harvest Handling 237
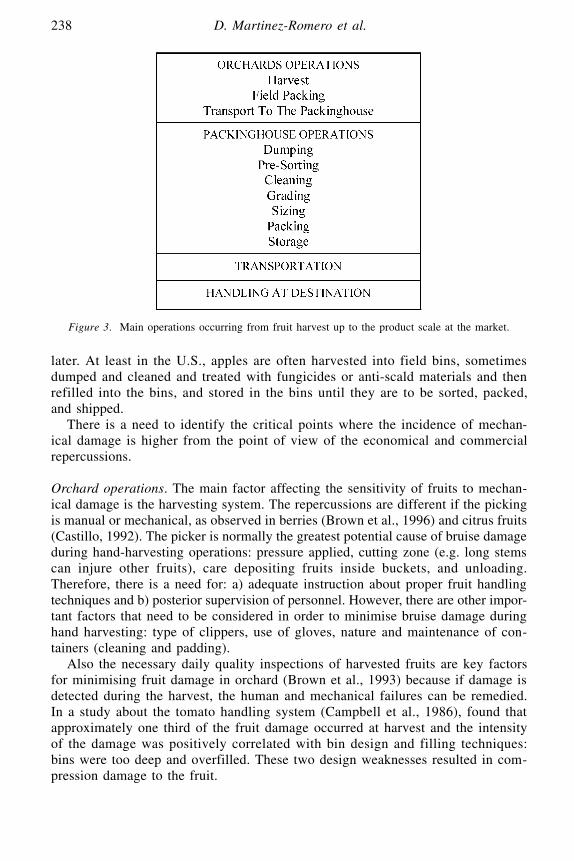
later. At least in the U.S., apples are often harvested into field bins, sometimesdumped and cleaned and treated with fungicides or anti-scald materials and thenrefilled into the bins, and stored in the bins until they are to be sorted, packed,and shipped.
There is a need to identify the critical points where the incidence of mechan-ical damage is higher from the point of view of the economical and commercialrepercussions.
Orchard operations. The main factor affecting the sensitivity of fruits to mechan-ical damage is the harvesting system. The repercussions are different if the pickingis manual or mechanical, as observed in berries (Brown et al., 1996) and citrus fruits(Castillo, 1992). The picker is normally the greatest potential cause of bruise damageduring hand-harvesting operations: pressure applied, cutting zone (e.g. long stemscan injure other fruits), care depositing fruits inside buckets, and unloading.Therefore, there is a need for: a) adequate instruction about proper fruit handlingtechniques and b) posterior supervision of personnel. However, there are other impor-tant factors that need to be considered in order to minimise bruise damage duringhand harvesting: type of clippers, use of gloves, nature and maintenance of con-tainers (cleaning and padding).
Also the necessary daily quality inspections of harvested fruits are key factorsfor minimising fruit damage in orchard (Brown et al., 1993) because if damage isdetected during the harvest, the human and mechanical failures can be remedied.In a study about the tomato handling system (Campbell et al., 1986), found thatapproximately one third of the fruit damage occurred at harvest and the intensityof the damage was positively correlated with bin design and filling techniques:bins were too deep and overfilled. These two design weaknesses resulted in com-pression damage to the fruit.
238 D. Martinez-Romero et al.
Figure 3. Main operations occurring from fruit harvest up to the product scale at the market.
Mechanical harvest is a major source of damage to the some types of fruits ortubers (Knowles, 1989). Mechanical harvest of firm and ripe peaches (Glenn etal., 1995) caused from 5.4% to 38.3% bruising in cultivars ‘Autumnglo’, ‘Harvester’,and ‘Redhaven’. The highest levels of damage were caused by puncture. Mechanisedharvest produces short and rough stalks that can puncture fruit as it passes throughthe trees.
Mechanical damage incurred during harvest depends also directly on the envi-ronmental conditions; for instance in citrus fruits, when the relative humidity isextremely high (after rain or sprinkling or fog), just the action of the picker pressingthe fruit is enough to induce a specific type of injury, oleocellosis (Castillo, 1992).Oleocellosis is characterised by spots affecting the external appearance of the fruitsdue to the rupture of the skin oil vessels, the leakage of oil drops, and finally leadingto browning by oxidation reactions. The susceptibility of fruits to suffer from oleo-cellosis has been related to the ripening stage at harvest, skin colouration and plantvariety.
Packinghouse operations. Mechanical damage at packinghouse can be reduced byimproving several operations, including among others (Brown et al., 1993):
– Bulk bin handling must be done smoothly and the floors must be smooth– Number of transfers between packing line components: most packing line have
7 or more transfers that can have vertical drops exceeding 3.9 cm and ramp anglesthat average 19 degrees
– Unsynchronisation between components and operation speed of the packingline. The packing line must be as straight as possible and avoid changes ofdirection
One of the most important factors for avoiding the bruising of fruits is thecushioning of hard and rough surfaces. Packing lines have several transfers thatprovide enough drop height so that impact bruise can result. However, if the hardsurfaces on the equipment are adequately cushioned and the roll velocity of eachitem is controlled to a low but adequate speed, impact bruising can be avoided(Armstrong et al., 1995). The basic factors to consider when choosing a cush-ioning material are: (1) bruising must be avoided for all drop heights and roll speedsthat exist on the particular packing line; (2) at least 60% of the impact energymust be absorbed so rebounds are minimised; (3) cushion durability must be good(a long service life is required); (4) cushion cleanup and sanitation must be easyand compatible with water, fungicides, and waxes and; (5) the physical propertiesof the cushion (thickness, stiffness, etc.) must be appropriate for all types of fruitsbeen handled.
(Petracek et al., 1998) studied the effect of nozzle pressure during the washingand wax application on the morphology and physiology of citrus and they found thatmost of the natural epicuticular wax platelets from the fruits surface were removed;besides, there were increased internal CO2 and ethylene concentrations and decreasedO2 concentrations.
Other factors affecting bruise induction are the storage conditions, e.g. pre-refrig-eration temperature (Thompson et al., 1998). Storage at low temperature, but not
Mechanical Damage During Fruit Post-Harvest Handling 239

low enough to induce chilling injury, can ameliorate bruising sensitivity, also pre-storage at high temperature and the use of modified atmosphere storage are effectivein the inhibition of this kind of stress (Miller et al., 1987). It has been proved thatrelative humidity conditions during fruit storage are also important: low relativehumidity leads to higher weight loss and makes fruit less susceptible comparedwith those stored at extremely high relative humidity (García et al., 1995).
The most studied energies absorbed by fruits and inducing mechanical damageduring the processing lines have been impact, compression and abrasion. These typesof load have been simulated through different assays, such as fruit impact causedby falls from different heights (Quintana and Paull, 1993; García et al., 1995),impacts carried out by pendulum (Hung and Prussia, 1989), compressions with spher-ical probes (Valero et al., 1998), and vibration tables with pre-fixed frequencies(Vergano et al., 1991b). Also, different surfaces for the transfer lines have been usedto study fruit behaviour after the induction of injuries by impacts and/or abrasions(Schulte et al., 1994; Mencarelli et al., 1996). Bruise threshold response lines havebeen developed for apples, peaches and pears (Schulte et al., 1991), citrus (Millerand Burns, 1991), apple (Pang et al., 1994), potato (Hyde et al., 1992) and are relatedto impact surface data collected by the Instrumented Sphere (IS). This informa-tion is useful in developing equipment design guidelines and bruise-free handlingenvironments.
Transportation. Many of the losses occurred during transportation are due to inap-propriate packaging and box arrangement inside the lorries. Some types ofmechanical damage in packaging containers are impact damage through dropping,compression damage due to high stacking, vibration, snagging, tearing and hookdamage (Kitinoja and Kader, 1995). The packaging improvements are directedtowards minimising vibration bruising through the use of plastic or paper sheetsto separate layers of fruit in corrugated or wooden boxes. The values of the kineticcoefficient of friction for peaches in contact with peaches were significantly reducedwith the use of paper and plastic materials between peaches (Vergano et al., 1992).Bruising occurs during transport mainly due to three types of mechanical abuse:impact, vibration and compression (Vergano et al., 1992); all of these forces are aconsequence of the irregular road surfaces and can be avoided by the use of vehiclesequipped with air-cushion rather than steel-spring suspension (Brown et al., 1993).Finally, other factors inducing injuries are (FAO, 1989): (a) Fast driving and poorcondition of the vehicle; (b) poor stowage (which allows packages in transit to sway);and (c) packages stacked too high (the movement produced within a particularbox increases in relation to its height in the stack).
3. EFFECT OF MECHANICAL DAMAGE ON FRUIT PHYSIOLOGY
Mechanical damage causes physiological changes at hormone, genetic, andbiochemical levels besides the physical effects above described. Some of themodifications that occur naturally during fruit ripening are accelerated after themechanical damage has been induced, specialy at the senescence stage. On the other
240 D. Martinez-Romero et al.
hand, different signals can be used as indicators or markers of the mechanicalstress (Martínez-Romero et al., 1999), as have been described in other well-knownstresses such as chilling injury (Serrano et al., 1998).
Hormonal changes after fruits have been mechanically damaged have been doc-umented in some studies (Martínez-Romero et al., 1999; Valero et al.,1998), however,whether these changes are a mechanism to control the stress or the consequenceof this stress is still unknown. This is, whether the hormonal activation or deacti-vation acts as a protective mechanism against the mechanical stress or it is simplya signal produced by the fruit to induce the physiological changes is unclear.
3.1. Ethylene
Ethylene has been the most studied plant hormone during fruit ripening and post-harvest storage. Ethylene plays a key role in the fruit response against mechanicalstress, with stress increasing ethylene levels in climacteric fruits (Maness et al.,1992), and even in non-climacteric fruits (El-Otmani et al., 1995). The responseof this hormone immediately follows the mechanical damage (between 2–3 h) andlasts 2–10 h. This ethylene is the so-called as ‘wound ethylene’, and it as it hasbeen observed for example in ‘Babygold’ peaches (Martínez-Romero, 2000a)damaged with compressions forces of 30, 40, and 50 N, in which the ethyleneemission was proportional to the impact intensity 3–5 h after the mechanical damagewas induced (Figure 4a). Also ‘Mauricio’ apricots damaged with compression forcesof 25 N showed higher ethylene production along storage than non-damage controlsand an advancement of the climateric peak of ethylene production was foundcompared with non-damaged apricots (Figure 4b).
Similar effects have been observed in fig fruits (Ficus carica L.) placed inplastic containers and vibrated for 10 min at accelerations of 1, 2, 3, 4, 5, and6 ×g, showing a significant correlation between ethylene production and degreeof vibration (Mao et al., 1995). This higher ethylene emission rate is attributed tothe increase of 1-aminocyclopropane-1-carboxylic acid (ACC) synthesis by acti-vation of the enzyme ACC synthase and its posterior conversion to ethylene (Milleret al., 1987). The higher global ethylene production after mechanical damage canbe due to the following factors: Ethylene diffusing through the intercellular spacesof the affected zones leading to an increase of the internal ethylene production bythe translocation of ACC (Watada et al., 1990), and even its accumulation in thenon-damaged tissues (Mencarelli et al., 1996).
However, it seems that this mechanism is not a general pattern in fruits becausedamaged mangoes did not show significant increases in ethylene production,probably due to the presence of phenolic compounds released from the cell wall thatcan compete with the ethylene biosynthesis (Ketsa and Koolpluksee, 1993). In thesame way, high impact and abrasion forces in papaya fruits did not increase theethylene production during ripening (Quintana and Paull, 1993); however, the expla-nation in this case was different and was that the impact force was spread throughoutthe whole fruit and thus the cell burst strength was not exceeded as occurred inothers fruits.
Mechanical Damage During Fruit Post-Harvest Handling 241

3.2. Polyamines
Polyamines (PAs) have been considered as antisenescent agents with changes in theirlevels being reported as a protective mechanism. However, in different plant speciesdifferent PA are involved (Orr and Brady, 1993), and there seem to be species-specific relationships. In general, an accumulation of PAs [putrescine (Put),spermidine (Spd), and spermine (Spm)] has been found in response to several plantand fruit stresses, such as acid (Southwick and Yeager, 1995), saline (Southwick andYeager, 1995), osmotic (Uthaibutra and Gemma, 1991), mineral deficiency (Kuraokaet al., 1977), and CO2 (Nanos and Mitchell, 1991). These are the most studiedstresses in fruits and their relationships with the PAs concentrations are well estab-lished; however, little is known about the endogenous PAs levels in response toexternal mechanical bruising of fruits.
Diamino oxidase (DAO) and peroxidase (POD) were strongly enhanced bymechanical injury, resulting in increased levels of the catabolic products of thePAs oxidation in both fruits and flowers (Scalet et al., 1991). In wounded greenbanana, Put accumulation may have been induced by the action of the woundethylene (Lurie and Ben-Yehoshua, 1986). In addition, Put, Spd, and Spm have beenshown to inhibit the ACC synthase activity and also the wound-inducible ACCsynthase transcript, with the inhibition being greater for Spm than for Put or Spd(Li et al., 1992). From these reports, it can be inferred that PAs could play an impor-tant role during mechanical wounding stress, but to date there is a lack of informationabout changes in endogenous PA levels in mechanically damaged tissues.
242 D. Martinez-Romero et al.
Figure 4. Ethylene production at 20 °C of peaches (cv. Baby-Gold) (a) damaged with compressionof 0 N (�), 30 N (�), 40 N (�) and 50 (�) after 24 hours. Ethylene production of apricots (cv. Mauricio)(b) non-damaged (�) and damaged (�) during storage at 12 °C.

In this review, some examples of PAs role during storage of mechanicallydamaged fruits will be provided. Valero et al. (1998) worked with two mandarinvarieties, ‘Clementine’ and ‘Fortune’, chosen because they differ in their peel char-acteristics: thickness, sponginess, and adherence to juice segments, with ‘Fortune’being more susceptible to bruising than ‘Clementine’. After external applicationof 10, 20, and 30 N forces, it was observed that application of high external forceswas positively related with increases in fruit deformation; this deformation beinggreater in ‘Clementine’ than in ‘Fortune’ mandarins. However, observation of thedamaged sections using magnifying lens (10×) revealed that only ‘Fortune’ mandarinshowed mechanical damage consisting of breakdown and disruption of the albedotissue. This effect could be attributed to the fact that the ‘Clementine’ peel has greaterthickness and sponginess, while ‘Fortune’ peel is thinner and tightly adhered tothe segments. In the sensitive variety (‘Fortune’), a short time-course for quanti-fying the levels of endogenous PAs during storage was performed. The resultsrevealed that Put levels were affected by both the intensity of the force appliedand the storage temperature. Put. decreased during storage of non-damaged fruits,likely as a consequence of the ripening process. Increased Put levels in damaged‘Fortune’ mandarins were already detectable 3 h after the mechanical damage wasperformed, especially for 20 and 30 N, with the magnitude of the increase beingforce-dependent. From these results, it could be inferred that the Put increases mightbe a consequence of the mechanical stress rather than a defensive mechanism ofthe fruits against the stress effects, as has been suggested to occur in chill-injuredpeppers (Abbott et al., 1984).
The Spd levels increased significantly in peaches (Martínez-Romero et al., 2000b)mechanically damaged with a compression force of 50 N and stored at 2 °C. ThisSpd increase could be the result of an active transformation of Put to Spd, becausePut concentration was lower in the damaged areas than in non-damaged fruits(Figure 5a). In the same way, in plums mechanical damaged with 50 N of com-pression force and stored at 2, 10 and 20 °C an increase in free Spd was found (Pérez,1999) (Figure 5b). In both fruits, levels of free Spm were below the detectionlimit throughout the storage time. On the other hand, mechanically damaged lemons(Martínez-Romero et al., 1999) showed a significant increase in levels of bothSpd and Spm. These results show direct effects of the mechanical stress on themetabolism of PAs; consequently, an increase in PAs concentration could act as aphysiological marker of mechanical stress, one of the less known type of stressesin fruits and vegetables.
Exogenous application of Put could protect the fruits against mechanical damageby maintaining higher levels of PAs; this phenomenon has been described in lemons(Martínez-Romero et al., 1999), peaches (Martínez-Romero et al., 2000b), apricots(Martínez-Romero, 2000a), and plums (Pérez, 1999). In these four studies, non-treated and damaged fruits showed significant increases in Spd and/or Spm levels,which could be considered as a physiological response. In fact, treatments withSpm of zucchini squash prior to cold storage resulted in a significant increase inSpd levels and reduced CI symptoms by protecting the membrane lipids from per-oxidation during storage (Bible and Singha, 1993).
Mechanical Damage During Fruit Post-Harvest Handling 243

3.3. Abscisic acid
Abscisic acid (ABA) plays an important role in colour development in fruits. Severalauthors have shown that increased ABA levels in mandarins (Lafuente et al., 1997),oranges (Harris and Dugger, 1986), and peppers (Serrano et al., 1995), were respon-sible for the transition of chloroplast to chromoplast during the colour developmentstage. ABA levels have been analysed in damaged fruits, both climacteric andnon-climacteric ones, such as lemons (Figure 6a) and apricots (Figure 6b). Resultsshowed an increase during storage, with significantly higher ABA concentrationsbeing found in mechanically damaged fruits, likely as a response mechanism tomechanical stress. It is also known that several stresses, including CI (Serrano et al.,1997), increased the ABA levels as well. Despite this effect, the ABA changesobserved could also be senescence-related when considering the fast colour changeobserved.
3.4. Respiration rate and weight loss
Respiration rate is known to be a sensitive physiological indicator of mechanicalstress or wounding in both vegetative tissues and fruits. Fig fruit submitted to dif-ferent frequency vibrations showed a carbon dioxide production increasing linearlywith vibration speed (Mao et al., 1995). Moreover, respiration rate increased sig-nificantly with higher number of impacts in blueberries, sweet cherries, and tartcherry fruits (Burton and Schulte-Paso, 1987), and this higher carbon dioxide(CO2) production was also positively correlated with the percentage of product decay.Similarly, ‘Hamlin’ and ‘Valencia’ oranges showed higher respiration rates aftermechanical damage induction (Miller and Burns, 1991). As well as in damaged
244 D. Martinez-Romero et al.
Figure 5. Free spermidine content in peaches (cv. Baby-Gold) (a) and plums (cv. Black Start) (b)non-damaged (�) and damaged (�) during storage at 2 °C.

apricot in which respiration rate increased after damage and was higher than inundamaged fruit during storage (Figure 7a). On the other hand, there are a few fruitsand vegetables in which mechanical damage did not increase the respiration rateduring storage: peach (Martínez-Romero et al., 2000b), papaya (Quintana andPaull, 1993), and mangosteen (Ketsa and Koolpluksee, 1993).
Another indirect indicator of damage is the weight loss in fruits. The effect ofmechanical damage on weight loss in fruits has been studied in several fruits,including lemons (Martínez-Romero et al., 1999), oranges (Miller and Burns, 1991),and blueberries (Sanford et al., 1991). The weight loss was dependent on temper-ature, relative humidity and type of force inducing the mechanical damage. Apricots(Martínez-Romero, 2000a) submitted to compression forces of 25 N lost a higherpercentage of weight than non-damaged fruits, perhaps due to changes in theirbiophysical properties: modification of cellular arrangements and tissue permeability,occurrence of small fissures connecting the fruit internal and external atmospheres(which would accelerate gas transfer, particularly water vapour), and increasedrespiration rate (Woods, 1990) (Figure 7b). Mechanical impacts in carrots decreasedthe water potential upon storage and this decrease depended on the tissue respira-tion activity (Herppich et al., 1999). Therefore, tissue water potential may help toidentify the influence of mechanical impact on freshness of carrots during harvestand post-harvest stages.
3.5. Other related physiological effects
Another physiological parameter that could be affected by mechanical damage is thetotal soluble solids concentration (SSC). SSC was found to increase in kiwifruits(Mencarelli et al., 1996) while it was unaffected in blueberry after impact damageduring fruit picking in two seasons (Sanford et al., 1991). Mechanically damaged
Mechanical Damage During Fruit Post-Harvest Handling 245
Figure 6. Abscisic acid levels in lemons (cv. Verna) (a) and apricots (cv. Mauricio) (b) non-damaged(�) and damaged (�) during storage.

cucumbers experienced a reduction in mannose and galactose contents, whileramnose, arabinose, xylose and glucose did not change significantly (Miller,1989). Increases in uronic acids, methanol, oligosaccharides, and polysaccharidesassociated to the cell wall were due to amplified activities of cellulase, pectin-methylesterase, xylanase, and polygalacturonases. This effect is more evident at hightemperatures (Miller et al., 1987) and the increase in SSC could be explained simplyby lower moisture contents existing at high temperatures.
Titratable acid values were observed to increase in response to impact damagein blueberry (Sanford et al., 1991); this increase may occur due to the release ofadditional acids associated with softening and breakdown of cell wall structures.On the other hand, after mechanical damage of tomato, ascorbic acid content wassignificantly reduced by its oxidation to dehydroascorbic acid (Krochta et al., 1975).
Another experimental observation made in mechanically damaged fruits (postu-lated as an indicator of the mechanical damage) is the increase in the poly-phenoloxidase (PPO) and peroxidase (POD) activities, which are responsible forthe significant decrease in the content of total phenolic compounds observed inmango (Ketsa and Koolpluksee, 1993). In non-damaged fruits, the phenolic com-pounds are localised mainly in vacuoles while POD is localized mainly in the cellwalls and PPO in the chloroplast (Martínez and Whithaker, 1995). If fruits aremechanical damaged, the cell wall structures are deteriorated and the phenoliccompounds may leak and get in direct contact with highly active POD and/or PPO.These enzymes oxidise the phenolic compounds to brown melaninic compounds thatwill brown the damaged tissue (Friedman, 1996).
The main substrates for the PPO enzyme within potato tubers are L-tyrosine,chlorogenic acid and, to a lesser degree, caffeic acid (Dale et al., 1998). The finalresult of this enzymatic reaction may be the synthesis of lignin, which may formcomplexes with other compounds such as carbohydrates, proteins and pectins,resulting in strong lignin complexes (Ketsa and Atantee, 1998).
246 D. Martinez-Romero et al.
Figure 7. CO2 production (a) and weight loss (b) in apricots (cv. Mauricio) non-damaged (�) anddamaged (�) during storage at 12 °C.

4. ANALYTICAL DETERMINATIONS
In this section, the methods regularly used in our laboratory are going to bedescribed, as an example of the methods used in this type of research.
Colour is generally determined using the Hunter Lab System in a Minoltacolorimeter CR200 model (Minolta Camera Co., Osaka, Japan). The ratio betweenthe parameters ‘a’ and ‘b’, expressed as ‘a/b’.
Diameters and depths of the mechanically damaged zone produced by the com-pression or impact force can be measured as easily as with a ruler or caliper toquantify the main dimensions and by applying the proper formulas for the geometricfigures better describing the bruising volume (mm3) and surface (mm2). Alternatively,digital imaging may provide more precise measurement.
The ethylene and CO2 production rates were measured by placing fruits in her-metically sealed 0.5 L glass jars for 1 h. For ethylene, 1mL of the holder atmospherewas withdrawn with a gas syringe through a rubber stopper on the top of the glassjar lid, and the ethylene was quantified using a gas chromatograph (GC, Hewlett-Packard 5890a, Hewlett-Packard GmbH, Waldbronn, Ger.), equipped with a flameionisation detector and a 3 m stainless steel column with a 3-mm i.d. and con-taining activated alumina of 80/100 mesh. The column temperature was 70 °C,and both injector and detector temperatures were 110 °C. Results were expressedin nanolitres of ethylene released per gram of tissue per hour (nL·g–1·h–1). For theCO2 production rate, another sample of 0.5 mL of the same atmosphere was with-drawn and quantified using a GC (Shimadzu GC 14A) with a catarometric detectorand a 3 m stainless steel column with a 3-mm i.d containing Chromosorb 102.The column temperature was 55 °C, and the injector and detector temperatureswere 110 °C. Results were expressed in milligrams of CO2 released per kilogramof tissue per hour (mg·kg–1·h–1).
ABA was extracted from 0.5 g fresh tissue fruit with 10 mL of 80% acetonesolution containing butylated hydroxytoluene at 100 mg·L–1 and citric acid at 0.5g·L–1. For damaged fruits, samples were taken exclusively from the damaged zone.The extracts were centrifuged for 5 min at 3000 ×g, and the supernatant was dilutedwith a 50 mM Tris buffer, pH = 7.8, containing 1 mM MgCl2 and 150 mM NaCland then quantified by an enzyme-linked immunosorbent assay (ELISA) (Weiler,1980), using an IgG monoclonal antibody (Idexx, Inc., San Bruno, CA, USA).Synthesis of ABA-bovine serum albumin conjugate was carried out as describedby Weiler (1980). ABA content was estimated from the standard curve preparedfor each particular plate using an spectrophotometer StarFax 2100 (AwarenessTechnology Inc.). The absorbance was fixed at 405 nm. Two extractions weremade for each sample and each extract was quantified in duplicate. For each extract,three dilutions were prepared and at least two of them fell within the standard curve.All manipulations were carried out in dim light. The ABA levels were consistentwith the appropriate dilution. No interference from impurities was detected whenABA standards were added to diluted extracts of fruits.
Polyamine Analysis. Two extractions of PAs were made from each fruit studied.One gram fresh tissue was extracted with 10 mL of 5% cold perchloric acid. 1,6Hexanediamine (100 nmol·g–1) was added as internal standard. For damaged fruits,
Mechanical Damage During Fruit Post-Harvest Handling 247

samples were taken exclusively from the damage zone. The homogenate was thencentrifuged for 30 min at 20000 ×g. Free polyamines left in the supernatant werebenzoylated as described by Serrano et al. (1995). Derivatives were analysed byHPLC (HPLC, Hewlett-Packard 1100). The solvent MeOH:H2O (64:36) was runisocratically with a flow rate of 0.8 mL min–1. The benzoyl-polyamines were elutedthrough a reversed-phase column (LiChroCart 250–4,5 µm) and detected byabsorbance at 254 nm. A relative calibration procedure was used to quantify the PAsin the samples, using 1,6 hexanediamine as internal standard and standard curves(from 1.25 to 40 µM) for Put, Spd, and Spm.
5. CONCLUDING REMARKS
In order to reduce the quality loss occurring during fruit handling, it would benecessary to detect the critical points where the impact, compression, and vibra-tion energies originating the mechanical damage are produced. To minimise or reducethe causes of these energies the following suggestions are proposed:
(a) Minimise the heights differences among the different elements of the manipu-lation lines.
(b) Protect/cushion those impacting critical points having rough surfaces. Also thosesmooth surfaces where an energy transfer occurs, like drops and turns.
(c) Use brushes or curtains in the lines to control fruit speed.(d) Synchronise all line components to achieve a constant fruit flow.(e) Avoid as much as possible all impacts.
Regarding physiological considerations, up to date visible bruise and woundethylene production are the most accepted markers of mechanical damage withsignificant increases in ethylene levels occurring in damaged fruits. However, recentstudies on PAs metabolism have revealed that the free forms of putrescine, sper-midine, and/or spermine could be considered to characterise this type of stress aswell. Changes in fluorescence and in NIR absorbance are also potencial markers.
ACKNOWLEDGEMENTS
We thank Dr. Abbott J.A. (Beltsville Agricultural Research Center, USDA, ARS,Beltsville, MD) for the critical reading of the manuscript. This work has been fundedby Comisión Interministerial de Ciencia y Tecnología (CICYT). Project ALI99-1058-C02-02.
REFERENCES
Abbott, J. A., A. E. Watada and D. R. Massie (1984). Sensory and instrument measurement of appletexture. Journal of the American Society for Horticultural Science 109: 221–228.
Armstrong, P. R., G. K. Brown and E. J. Timm (1995). Cushioning choices can avoid produce bruising
248 D. Martinez-Romero et al.
during handling, In L. Kushwada, R. Serwatowski and R. Brook (eds.), Harvest and postharvesttechnologies for fresh fruits and vegetables. ASAE, Guanajuato, Mexico, pp. 183–190.
Belknap, W. R., T. M. Pickey and D. R. Rockhold (1990). Blackspot bruise dependent changes in enzymeactivity and gene expression in ‘Lemhi Russet’ potato. American Potato Journal 67: 253–256.
Ben-Arie, R., N. Kislev and L. Frenklel (1979). Ultrastructural changes in the cell walls of ripeningapple and pear fruit. Plant Physiology 64: 197–202.
Bible, B. B. and S. Singha (1993). Canopy position influences CIELAB coordinates of peach color.HortScience 28: 992–993.
Bollen, A. F., I. M. Woodhead and B. T. Dela Rue (1995). Compression forces and damage in thepostharvest handling system. In L. Kushwada, R. Serwatowski and R. Brook (eds.), Harvest andpostharvest technologies for fresh fruits and vegetables. ASAE, Guanajuato, Mexico, pp. 168–175.
Brown, G. K., N. L. Schulte, E. J. Timm, P. R. Armstrong and D. E. Marshall (1993). Apple bruisedamage can be reduced. The Mountanier Grower 520: 4–13.
Brown, G. K., N. L. Schulte, E. J. Timm, R. M. Beaudry, D. L. Peterson and J. F. Hancock et al.(1996). Estimates of mechanization effects on fresh blueberry quality. Applied Engineering inAgriculture 12: 21–26.
Brusewitz, G. H. and J. A. Bartsch (1989). Impact parameters related to post-harvest bruising ofapples. Transactions of the ASAE 32: 953–957.
Bruton, B. D. (1994). Mechanical injury and latent infections leading to postharvest decay. HortScience29: 747–748.
Burton, C. L. and N. L. Schulte-Paso (1987). Carbon dioxide as an indicator of fruit impact damage.HortScience 22: 281–282.
Camarena, E. A. and C. Reyes (1995). Daño mecánico en el procesamiento de fresa previo a la con-gelación. In L. Kushwada, R. Serwatowski and R. Brook (eds.), Harvest and postharvest technologiesfor fresh fruits and vegetables. ASAE, Guanajuato, Mexico, pp. 465–470.
Campbell, D. T., S. E. Prussia and R. L. Shewfelt (1986). Evaluating postharvest injury to freshmarket tomatoes. Journal of Food Distribution Research September: 16–25.
Castillo, S. (1992). Estudio de la distribución, visibilidad y propiedades físicas de los frutos cítricosen árbol y su influencia en el diseño de sistemas robotizados de recolección. Ph.D. Dissertation,Universidad Politécnica de Valencia.
Chen, P., M. Ruiz-Altisent, F. Lu and A. A. Kader (1987). Study of impact and compression damageon asian pears. Transactions of the ASAE 30: 1193–1197.
Dale, M. F. B., D. W. Griffiths and H. Bain (1998). Effect of bruising on the total glycoalkaloidchlorogenic acid content of potato (Solanum tuberosum) tubers of five cultivars. Journal of Scienceof Food and Agriculture 77: 499–505.
Das, S., A. Bose and B. Ghosh (1995). Effect of salt stress on polyamine metabolism in Brassicacampestris. Phytochemistry 39: 283–285.
El-Otmani, M., C. J. Lovatt, C. W. Coggins and M. Agustí (1995). Plant growth regulators in citri-culture: Factors regulating endogenous levels in citrus tissues. Critical Review in Plant Sciences14: 367–412.
Ericsson, N. A. and I. I. Tahir (1996a). Studies on apple bruising. I. Estimation of incidence and sus-ceptibility differences in the bruising of three apple cultivars. Acta Agriculturae Scandinavica SectionB – Soil and Plant Science 46: 209–213.
Ericsson, N. A. and I. I. Tahir (1996b). Studies on apple bruising. II. The effects of fruit characteris-tics, harvest date and precooling on bruise susceptibility of three apple cultivars. Acta AgriculturaeScandinavica Section B – Soil and Plant Science 46: 214–217.
FAO (1989). Prevention of Post-harvest Food Losses Fruits, Vegetables and Root Crops a TrainingManual. Smith K., Rome.
Feng, J. and A. V. Barker (1993). Polyamine concentration and ethylene evolution in tomato plantsunder nutritional stress. HortScience 28: 109–110.
Friedman, M. (1996). Food browning and its prevention: An overview. Journal of Agricultural and FoodChemistry 44: 631–653.
Galston. A. W. (1983). Polyamines as modulators of plant development. Bioscience 33: 382–388.García, C. and M. Ruiz-Altisent (1988). Impact parameters related to bruising in selected fruits. ASAE
Paper No. 886027.
Mechanical Damage During Fruit Post-Harvest Handling 249

García, J. L., M. Ruíz-Altisent and P. Barreiro (1995). Factors influencing mechanical properties andbruise susceptibility of apples and pears. Journal of Agricultural Engineering Research 61: 11–18.
Glenn, D. M., D. L. Peterson and W. M. Miller (1995). Mechanical harvesting of peaches limitedpotencial. HortScience 30: 985–987.
Harris, M. J. and W. M. Dugger (1986). Levels of free and conjugated abscisic acid in developingfloral organs of the Navel orange (Citrus sinensis [L.] Osbeck cv Washington). Plant Physiology82: 1164–1166.
Herppich, W. B., H. Mempel and M. Geyer (1999). Effects of postharvest mechanical and climatic stresson carrot tissue water relations. Postharvest Biology and Technology 16: 43–49.
Hung, Y. C. and S. E. Prussia (1989). Effect of maturity and storage time on the bruise susceptibilityof peaches (Cv. Red Globe). Transactions of the ASAE 32: 1377–1382.
Hyde, G. M., G. K. Brown, R. J. Timm and Zhang (1992). Instrumented sphere evaluation of potatopacking line impacts. Transactions of the ASAE 35: 65–69.
Ketsa, S. and S. Atantee (1998). Phenolics, lignin, peroxidase activity and increased firmness of damagedpericarp of mangosteen fruit after impact. Postharvest Biology and Technology 14: 117–124.
Ketsa, S. and M. Koolpluksee (1993). Some physical and biochemical characteristics of damage pericarpof mangosteen fruit after impact. Postharvest Biology and Technology 2: 209–215.
Kitinoja, L. and A. A. Kader (1995). Small-scale Postharvest Handling Practices – A Manual forHorticultural Crops. University of California, Davis.
Klein, J. D. (1987). Relationship of harvest date, storage conditions, and fruit characteristics to bruisesusceptibility of apple. Journal of the America Society for Horticultural Science 112: 113–118.
Knowles, L. O. (1989). Bruise prevention. Retrieved September 19, 2000, from Alberta Agriculture,Food and Rural Development: http://www.agric.gov.ab.ca/agdex/potato/bruise.html.
Krochta, J. M., S. J. Tillin and L. C. Whitehand (1975). Ascorbic acid content of tomatoes damagedby mechanical harvesting. Food Technology 29: 28–30.
Lafuente, M. T., M. A. Martinez-Tellez and L. Zacarias (1997). Abscisic acid in the response of ‘Fortune’mandarins to chilling. Effect of maturity and high-temperature conditioning. Journal of Science ofFood and Agriculture 73: 494–502.
Li, N., B. L. Parsons, D. Liu and A. K. Mattoo (1992). Accumulation of wound-inducible ACC synthasetranscript in tomato fruit is inhibited by salicylic acid and polyamines. Plant Molecular and Biology18: 477–478.
Maness, N. O., G. H. Brusewitz, D. Chrz and G. G. Taylor (1995). Performance of an instrument designedfor, and evaluation of methods to assess, peach fruit impact bruise susceptibility. Journal of FoodQuality 18: 335–353.
Maness, N. O., G. H. Brusewitz and T. G. McCollum (1992). Impact bruise resistance comparison amongpeach cultivars. HortScience 27: 1008–1011.
Mao, L., T. Ying, Y. Xi and Y. Zhen (1995). Respiration rate, ethylene production, and cellularleakage of fig fruit following vibrational stress. HortScience 30: 145–145.
Mathooko, F. M., Y. Kubo, A. Inaba and R. Nakamura (1995). Induction of ethylene biosynthesisand polyamine accumulation in cucumber fruit in response to carbon dioxide stress. PostharvesBiology and Technology 5: 51–65.
Martínez-Romero, D. (2000). Estudio de tratamientos para la mejora posrecolección de frutos. Ph.D.Dissertation, Universidad de Murcia.
Martínez-Romero, D., D. Valero, M. Serrano, F. Burló, A. Carbonell, L. Burgos et al. (2000). Exogenouspolyamines and gibberellic acid effects on peach (Prunus persica L.) storability improvement. Journalof Food Science 65: 288–294.
Martínez-Romero, D., D. Valero, M. Serrano and F. Riquelme (1999). Effects of postharvest putrescineand calcium treatments on reducing mechanical damage and polyamines and ABA levels duringlemon storage. Journal of Science of Food and Agriculture 79: 1589–1595.
Martínez, M. V. and J. R. Whithaker (1995). The biochemistry and control of enzymatic browning.Trends in Food Science and Techonology 6: 195–200.
Mencarelli, F., R. Massantini and R. Botondi (1996). Influence of impact surface and temperature onthe ripening response of kiwifruit. Postharvest Biology and Technology 8: 165–177.
Miller, A. R. (1992). Physiology, biochemistry and detection of bruising (mechanical stress) in fruitsand vegetables. Postharvest News and Inforrmation 3: 53–58.
250 D. Martinez-Romero et al.
Miller, A. R. (1989). Mechanical stress-induced changes in sugar composition of cell walls fromcucumber fruit tissues. Phytochemistry 28: 389–392.
Miller, A. R., J. P. Dalmasso and D. W. Kretchman (1987). Mechanical stress, storage time, and tem-perature influence cell wall-degrading enzymes, firmness, and ethylene production in cucumbers.Journal of the American Society for Horticultural Science 112: 666–671.
Miller, A. R. and T. J. Kelley (1989). Mechanical stress stimulates peroxidase activity in cucumber fruit.HortScience 24: 650–652.
Miller, W. M. (1987). Physical properties data for postharvest handling of Florida citrus. Transactionsof the ASAE 3: 123–128.
Miller, W. M. and J. K. Burns (1991). Interrelationship of impact regimes with citrus fruit quality. ASAEPaper No. 916592.
Nanos, G. D. and F. G. Mitchell (1991). High-temperature conditioning to delay internal breakdowndevelopment in peaches and nectarines. HortScience 26: 882–885.
Pang, D. W., C. J. Studman and N. H. Banks (1994). Apple bruising thresholds for an instrumentedsphere. Transactions of the ASAE 37: 893–897.
Petracek, P. D., D. F. Kelsey and C. Davis (1998). Response of citrus fruit to hig-pressure washing.Journal of the American Society for Horticultural Science 123: 661–667.
Pérez, A. (1999). Maduración y postrecolección de la ciruela: Cambios fisiológicos y bioquímicos, yrespuesta a tratamientos hormonales y químicos. Master Thesis, Universidad Miguel Hernández.
Quintana, M. E. G. and R. E. Paull (1993). Mechanical injury during postharvest handling of ‘Solo’papaya fruit. Journal of the American Society for Horticultural Science 118: 618–622.
Sanford, K. A., P. D. Lidster, K. B. McRae, E. D. Jackson, R. Lawrence, R. Stark and R. K. Pragne(1991). Lowsbush blueberry quality in response to mechanical damage and storage temperature.Journal of the American Society for Horticultural Science 116: 47–51.
Scalet, M., R. Federico and R. Angelini (1991). Time course of diamine oxidase and peroxidase activ-ities, and polyamine changes after mechanical injury of chick-pea seedlings. Journal of PlantPhysiology 137: 571–575.
Schulte, N. L., E. J. Timm and G. K. Brown (1994). ‘Redhaven’ peach impact damage thresholds.HortScience 29: 1052–1055.
Schulte, N. L., E. J. Timm, J. D. Ladd and G. K. Brown (1991). Peach and pear impact damagethresholds: A progress report. ASAE Paper No. 916620.
Schulte-Pason, N. L., E. J. Timm and G. K. Brown (1990). Apple, peach and pear impact damage thresh-olds. Am. Soc. Ag. Eng. Paper No. 90-6002.
Serrano, M., M. C. Martínez-Madrid, F. Romojaro and F. Riquelme (1998). CO2 treatment of zucchinisquash reduces chilling-induced physiological changes. Journal of Agricultural and Food Chemistry46: 2465–2468.
Serrano, M., M. C. Martínez-Madrid, M. T. Petrel, F. Riquelme and F. Romojaro (1997). Modifiedatmosphere packaging minimizes increases in putrescine and abscisic acid levels caused by chillinginjury in pepper fruit. Journal of Agricultural and Food Chemistry 45: 1668–1672.
Serrano, M., M. C. Martínez-Madrid, F. Riquelme and F. Romojaro (1995). Endogenous levels ofpolyamines and abscisic acid in pepper fruits during growth and ripening. Physiology Plantarum95: 73–76.
Shewfelt, R. L. (1998). Stress physiology: A cellular approach to quality. In R. L. Shewfelt and S. E.Prussia (eds.), Postharvest Handling. Academic Press Inc., San Diego, CA, pp. 257–276.
Shewfelt, R. L., S. C. Meyers, S. E. Prussia and J. L. Jordan (1987). Quality of fresh-market peacheswithin the postharvest handling system. Journal of Food Science 52: 361–364.
Thiagu, R., N. Chand and K. V. R. Ramana (1993). Evolution of mechanical characteristics of tomatoesof two varieties during ripening. Journal of the Science of Food and Agriculture 62: 175–183.
Thompson, J. F., F. G. Mitchell, T. R. Rumsey, R. F. Kasmire and C. H. Crisosto (1998). CommercialCooling of Fruits, Vegetables, and Flowers. University of California. Division of Agriculture andNatural Resources, Oakland, California.
Valero, D., D. Martínez-Romero, M. Serrano and F. Riquelme (1998). Polyamine response to externalmechanical bruising in two mandarin cultivars. HortScience 33: 1220–1223.
Vergano, P. J., R. F. Testin, A. C. Choudrari and W. C. Newall (1992). Peach vibration bruising:effect of paper and plastic films between peaches. Journal of Food Quality 15: 183–197.
Mechanical Damage During Fruit Post-Harvest Handling 251

Vergano, P. J., R. F. Testin and W. C. Newall (1991a). Distinguishing among bruises in peachescaused by impact, vibration, and compression. Journal of Food Quality 14: 285–289.
Vergano, P. J., R. F. Testin and W. C. Newall (1991b). Peach bruising: Susceptibility to impact,vibration, and compression abuse. Transactions of the ASAE 34: 2110–2116.
Wang, C. Y. (1993). Relation of chilling stress to polyamines in zucchini squash. Acta Horticulturae343: 288–289.
Watada, A. E., K. Abe and N. Yamuchi (1990). Physiological activities of partially processed fruitsand vegetables. Food Technology 44: 116–122.
Weiler, E. W. (1980). Radioimmunoassay for the differential and direct analysis of free and conju-gated abscisic acid in plant extracts. Planta 148: 262–272.
Woods, J. L. (1990). Moisture loss from fruits and vegetables. Postharvest News and Information 1:195–199.
Young, N. D. and A. W. Galston (1983). Putrescine in acid stress. Plant Physiology 71: 767.Yoza, K., Y. Takeda, K. Sekiya, Y. Nogata and H. Ohta (1996). Putrescine accumulation in wounded
green banana fruit. Phytochemistry 42: 331–334.
252 D. Martinez-Romero et al.
HARVEST AND POSTHARVEST CONDITIONS FORAPPLES AND PEARS
CELIA E. BENITEZ AND NORMA A. PENSELInstituto de Tecnología de Alimentos, INTA, CC.77 – B1708WAB-Morón, Bs.As., Argentina
1. INTRODUCTION
The current demand of apples and pears requires freshness and absence assuranceof chemical, pathogens, and contaminant substance. These exigencies motivatedifferent studies in various parts of the world. And the principal objective of thesestudies was to optimise harvest and postharvest techniques, reducing as much aspossible the phytosanitary substances use in the different production stages.
Internationally, numerous researchers had studied the particular characteristicsand behaviour of different varieties during harvest and storage. They had fixedmaturity index levels for harvested fruit destined to immediate consumption ordestined to short, medium or long storage (Gorini, 1984; Iglesias, 1989, 1990a, b;Iglesias and Almacelles, 1992; Jobling et al., 1993; Le Lézec et al., 1988; Lombard,1987; Masseron and Trillot, 1988; Sansavini, 1997, 1998, 2001). However, the influ-ence of environmental factors and orchard cultural tasks on final fruit qualitydetermines the necessity of regional studies for each variety.
Eighty five percent of Argentine apples and pears production is cultivated in NorthPatagonian valleys. The region climate is continental, temperate and arid with anaverage annual temperature of 15 °C. The chilling hours required for apple andpear production are satisfied and there are around 174 frost-free days. The rainfallis about 200 mm per year, which implies that irrigation is necessary in orchards.Soils are alluvial with a sandy to sandy-silt texture, a very low organic matter content(less than 1%) and a pH between 7–8 (Benitez et al., 1993). These are exceptionalconditions for growing pears in general, but they are unfavourable for some applevarieties. For these reason adaptation studies are indispensable.
The harvest and postharvest pear and apple varieties evaluation program con-ducted in North Patagonian valleys is a dynamic program orientated to study fruitbehaviour along the different productive stages. This program is conducted parallelto the varieties aptitude study during the season. It is clearly established that fruitsfrom younger trees have an inferior quality and shorter shelf life than fruits fromstabilised trees. However, the maturity evaluation and fruit quality during thisperiod allows adopting technical decisions over the more convenient trainingsystem for the variety. As trees became older the information collected is utilisedto select orchard practices oriented to improve fruit quality (Benitez, 1997, 1998,2001).
Taking this into account, the optimum harvest time is determined as a functionof final destination and more distinguishing maturity criteria are established.Different storage conditions are experimented and factors that favour the presenceof harvest and postharvest diseases and disorders in each variety are investigated.
R. Dris and S. M. Jain (eds.), Production Practices and Quality Assessment of Food Crops,
© 2004 Kluwer Academic Publishers. Printed in the Netherlands.
253
Vol. 3, “Quality Handling and Evaluation”, pp. 253–293.

Generally, fruit behaviour before harvest and during storage varies from one yearto the other as environmental conditions in each season does. These factors havea direct influence on maturation process rate and shelf life period extension.
In this chapter the more significant results obtained in these types of studiesare presented, and the methodology utilised to obtain them is described. A briefdescription of general characteristics and regional particularities of the fruits is intro-duced and their susceptibility to the principal diseases and disorders is shown.
2. PROCEDURES
For performance studies of apples and pears varieties grown in North Patagonianvalleys, different sampling methodologies were used depending on the variety(regional traditional or regional non-traditional variety).
The experimental design prepared for traditional varieties included soil type,training systems and rootstocks. For non-traditional varieties, all growers who intro-duced them to the region participated as well as all the clones grown for the variety.Using this approach it was possible to have trees with different ages localised indifferent areas of the region. Samplings were initiated with the first fruit producedby trees and continued for at least five to six seasons for non-adapted varieties orthose that presented a dubious behaviour. The traditional variety methodology, selec-tion of orchards with differential characteristics, was used for best clones of therest of non-traditional varieties.
Determination of optimum harvest date for a particular destination is morecomplex for pears than for apples. The maturation characteristics vary among dif-ferent varieties and even inside the varieties of the same specie. Besides, requirementto initiate harvest and parameters to be used are not coincident among researcherswho work in different producing regions because of the important influence oflocal factors (Gorini, 1984; Iglesias, 1989, 1990a, 1990b; Iglesias and Almacelles,1992; Jobling et al., 1993; Le Lézec et al., 1988; Lombard, 1987; Masseron andTrillot, 1988; Sansavini, 1997, 1998, 2001). For this reason, in local experiencehistory of the orchard selected for sampling, soil characteristics, tree characteris-tics (age, load, training system, and rootstocks), opportunity and volume of irrigation,quantity and time of nutrient application, and other different form traditional orchardlabours were registered.
During each season samples were taken 20 to 30 days previous to harvest, witha 4 to 7 days of frequency, depending on variety maturation rate. Taking into accountyear and availability of fruit, sampling varied in number (3 to 8) and size (10 to20 healthy, well-developed fruit). Trees were selected to take samples representa-tive of the orchard. For trees with good productivity, fruit was collected over 10plants at 1.70 m of height. And the same amount of fruit was picket from both spalieror from the entire circumference in the spindle training trees. In young orchards itwas necessary to use a grater number of trees and total healthy and normal fruitsfor the successive harvests.
Once the sample was prepared, different fruit size measurements were per-formed and the conventional maturity indexes were determined.
254 C. E. Benitez and N. A. Pensel
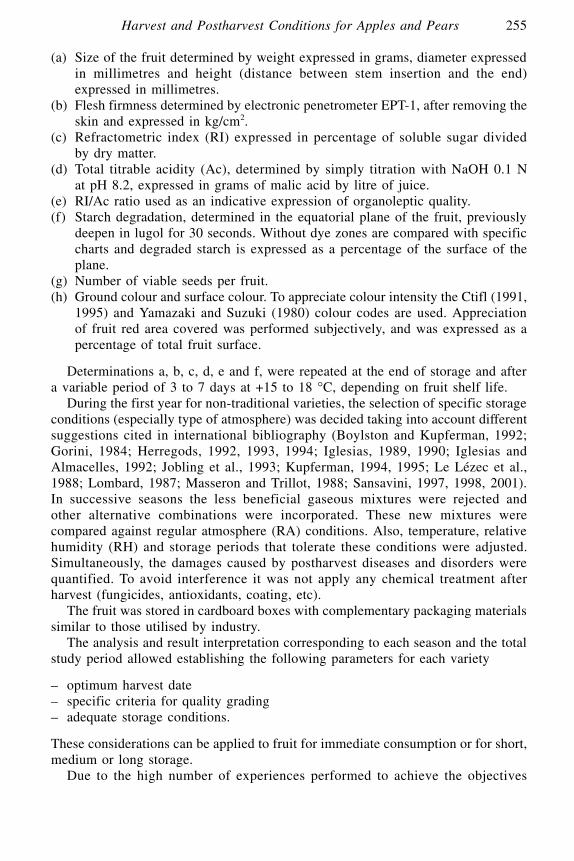
(a) Size of the fruit determined by weight expressed in grams, diameter expressedin millimetres and height (distance between stem insertion and the end)expressed in millimetres.
(b) Flesh firmness determined by electronic penetrometer EPT-1, after removing theskin and expressed in kg/cm2.
(c) Refractometric index (RI) expressed in percentage of soluble sugar dividedby dry matter.
(d) Total titrable acidity (Ac), determined by simply titration with NaOH 0.1 Nat pH 8.2, expressed in grams of malic acid by litre of juice.
(e) RI/Ac ratio used as an indicative expression of organoleptic quality. (f) Starch degradation, determined in the equatorial plane of the fruit, previously
deepen in lugol for 30 seconds. Without dye zones are compared with specificcharts and degraded starch is expressed as a percentage of the surface of theplane.
(g) Number of viable seeds per fruit. (h) Ground colour and surface colour. To appreciate colour intensity the Ctifl (1991,
1995) and Yamazaki and Suzuki (1980) colour codes are used. Appreciationof fruit red area covered was performed subjectively, and was expressed as apercentage of total fruit surface.
Determinations a, b, c, d, e and f, were repeated at the end of storage and aftera variable period of 3 to 7 days at +15 to 18 °C, depending on fruit shelf life.
During the first year for non-traditional varieties, the selection of specific storageconditions (especially type of atmosphere) was decided taking into account differentsuggestions cited in international bibliography (Boylston and Kupferman, 1992;Gorini, 1984; Herregods, 1992, 1993, 1994; Iglesias, 1989, 1990; Iglesias andAlmacelles, 1992; Jobling et al., 1993; Kupferman, 1994, 1995; Le Lézec et al.,1988; Lombard, 1987; Masseron and Trillot, 1988; Sansavini, 1997, 1998, 2001).In successive seasons the less beneficial gaseous mixtures were rejected andother alternative combinations were incorporated. These new mixtures werecompared against regular atmosphere (RA) conditions. Also, temperature, relativehumidity (RH) and storage periods that tolerate these conditions were adjusted.Simultaneously, the damages caused by postharvest diseases and disorders werequantified. To avoid interference it was not apply any chemical treatment afterharvest (fungicides, antioxidants, coating, etc).
The fruit was stored in cardboard boxes with complementary packaging materialssimilar to those utilised by industry.
The analysis and result interpretation corresponding to each season and the totalstudy period allowed establishing the following parameters for each variety
– optimum harvest date– specific criteria for quality grading– adequate storage conditions.
These considerations can be applied to fruit for immediate consumption or for short,medium or long storage.
Due to the high number of experiences performed to achieve the objectives
Harvest and Postharvest Conditions for Apples and Pears 255

cited above, in this chapter are presented the general conclusions obtained duringall the experiences that include 2001 harvest. The period involved were differentdepending on species and varieties. Different apple and pear varieties are classi-fied by maturation period as early, middle and late season fruits. Inside each groupthe maturity chronological order was considered. Tables 1 to 6 summarised therequired conditions to initiate harvest or to storage fruit and the susceptibility topostharvest disease and disorders of the different apples and pears grown inArgentine North Patagonian valleys.
3. APPLES
3.1. Early apples
This group comprises three bicolour varieties that mature in January, in chrono-logical order: Sansa, Elstar and Gala group (Table 1). They were introduced tothe Northern Patagonian Valleys in the inverse order as they mature, and their successhas been different. Gala apples and specially two of their improved clones, Royaland Mondial Gala, are well adapted to the region. Their harvesting represents 4%of the total Argentine apple production and is steadily growing. Sansa, one Gala’sdescendant, is also well adapted. But, although planting of this variety continues,their production is not still very important. Oppositely, Elstar, that requires coldand humid climate, did not find the adequate microclimate in this region, charac-terised by warm and dry summers. Thus, soon after its introduction growers lostinterest for this variety. These three varieties initiated the harvest season, but theydiffer in their shelf life expectancy. The shelf life is short for Sansa, and moreprolonged for Elstar and Gala. Taking into account this characteristic, the biggestefforts were dedicated to evaluate Gala optimum harvest conditions and to analyseits behaviour under different storage conditions, such as regular atmosphere (RA)and controlled atmosphere (CA).
3.1.1. Sansa
It was developed in 1986, as a result of activities carried out in the Joint EnhancementProgram subscribed by New Zealand and Japan. The fruit is spherical and small,weighing 160 to 180 g, with well-defined lobules. The skin is smooth and clean,with a soft-green ground colour and more than 50% of its surface covered by redcolour. The flesh is white-yellowish, crispy, juicy and firm, with an adequate balancebetween refractometric index (RI) and acidity. These characteristics bring about avery good sensory quality, that for some consumers it is even better than the qualityof Gala variety (Yoshida and Katsurayama, 1993).
Requirements for harvest and storage. In the Patagonia Sansa variety matures aroundthe middle of January, seven or ten days before Gala harvesting. It is picked whenreaches the following indexes, firmness: 6 to 7 kg/cm2, RI: 11–12%, malic acidity
256 C. E. Benitez and N. A. Pensel
3.5–4 g/l, and degraded starch: 25–40%. Despite this variety tolerates two or threemonths of RA storage without showing apparent sensitivity to the common storagedisorders, Sansa should be considered only as an early apple and commercialisedbefore Gala.
Diseases and disorders. Every time there is a delay in harvest date, there is anincrease on mealiness or internal breakdown risk.
3.1.2. Elstar
This variety was obtained in Holland in 1955 as result of crossing Golden Delicious× Ingrid Marie. The original type is known in USA as Lustre Elstar. In the Patagonia,depending on their origin, they were named as Elstar o Lustre Elstar. The fruithas an attractive aspect, its shape somewhat spherical and flatten, with an averageweight of 150 to 160 g, a diameter of 70 to 75 mm, and a medium-size stem. Theskin has a green-yellowish colour partially covered by a soft-bright red colour,that in some occasions presents russeting in the calyx and stem cavities. The fleshis white-yellowish, consistent and crispy, with an adequate balance between RIand acidity that results in an excellent organoleptic quality. After one month of refrig-
Harvest and Postharvest Conditions for Apples and Pears 257
Table 1. Maturity conditions to begin harvesting, storage conditions and disorders susceptibility forearly apples. Northern Patagonia valleys, Argentina.
Sansa Elstar Gala
DAFB 102 127 120Firmness (kg/cm2) 6–7 6.5–7.5 7.8–8.5RI (%) 11–12 ≥12 11–12Malic acidity (g/l) 3.5–40 08–10 3.5–50Starch degrad. (%) 25–40 20–30 40–50
RA storage
Temperature °C –0.5/0 –0.5/–0.75 0Period (months) 1–2 2–3 3–4
CA storage
Temperature °C – – 0+0.5/+0.75% O2 – – 01.5 2 3% CO2 – – 1 1.2 1 Period (months) – – 4–6
Postharvest diseases Internal breakdown Sunburn, bitter pit, Cracking, bruises, water and disorders russeting, light core, bitter pit, mealiness,
water core, and Jonathan spot, CO2
superficial scald injury, internal browning,core rot, decays
DAFB: days after full bloom; RI: refractometric index; RA: regular atmosphere; CA: controlledatmosphere.

erated storage, its flavour greatly improves and its main attribute, crispiness,increases. Despite this variety is very productive, it does not adapt to hot climatesbecause its coloration and consistency is affected (Baeza and Konig, 1989; Iglesias,1991; Sansavini, 1997; Stainer, 1992; Stebbins, 1989; Stebbins et al., 1989; Trillotet al., 1993).
Requirements for harvest and storage. This variety matures in the last week ofJanuary, simultaneously with Gala variety. It is harvested when reaches the followingindexes, firmness: 6–7 kg/cm2, RI: 12–15%, and malic acidity: 8–10 g/l. The harvestaptitude period for Elstar should not exceed 8 to 10 days. The attractive organolepticcharacteristics and international market demand should have been incentives forthe development of this variety. However, the ecological conditions of the region,with warm and dry summers, were unfavourable for the expansion of Elstar. Thissituation and the simultaneity of maturation with Gala variety abbreviated the periodelapsed between the incorporation and decline of Elstar in the region. This explainsthe actual presence of this variety only in very small areas.
Other countries that cultivate this variety consider that has a more uniform qualitythan Jonagold apple and recommend one month of refrigerated storage to improveflavour. However, it is important to bear in mind that a prolonged storage, beyond60 days in RA or five to six month in CA, will result in detriment of firmnessand consequently in reduction of its characteristic crispiness (Chapon andWestercamp, 1996; Herregods, 1993; Sansavini and Buscaroli, 1997; Stainer, 1992;Stebbins, 1989, 1991; Trillot et al., 1993). During its brief production period inPatagonia valleys, Elstar was commercialised as an early variety and consequentlyits conventional storage never exceeded thirty days.
Diseases and disorders. It is important to mention the sensibility of this variety torusseting and sunburn, and its resistance to certain disorders such as bitter pit,water core, and superficial scald (Trillot et al., 1993).
3.1.3. Gala
This variety was originated in New Zealand in 1939, as result of crossing Kidd’sOrange Red × Golden Delicious. The fruit presents a truncated-cone shape, weights150–180 g, has a diameter of 65–75 mm, a long stem and a close calyx. The skinhas a light green ground colour at early stages that became almost white at harvesttime and then turns to yellow colour. The yellow colour intensity increases asmaturation progresses. Initially the red overcolour develops in the forms of orange-red strings. Then the red colour intensity increases while covers the fruit surface.The covered areas are variables and will depend on the genetics characteristicsand orchard environmental conditions. Also, the epidermis is sprinkle with roundand small lenticels. The flesh is yellowish, juicy and crispy. It has a fine textureand a neutral organoleptic quality (Mattheis, 1995; Plotto et al., 1992; Sansavini andBuscaroli, 1997; Stainer, 1992; Stebbins, 1991; Stebbins et al., 1989; Trillot et al.,1993).
258 C. E. Benitez and N. A. Pensel

Requirements for harvest and storage. Due to the characteristic fructification overlateral and terminal branches, not all the fruits of the tree will mature at the sametime. This particularity makes necessary two or three picks during harvestingperiod (Stebbins, 1989).
In Patagonia region, Gala and its clones mature in the last week of January.The harvest aptitude period for commercial harvesting fluctuates from 10 to 15days depending on the environmental conditions during the season. The harvestof all Gala’s clones begins with 7.8–8.5 kg/cm2, RI of 11–12%, 3.5–5 g/l of malicacidity, 40–50% of starch degradation and grade 3 of ground colour as it is shownin the ‘Code Couleur Gala chart’ Ctifl (1995). This chart presents a graduationfrom 1 to 5, where grade 3 is coincident with the turn from soft green to specificcreamy white (Planton and Ferré, 1992). Since generally the weather conditionsof the region did not favour a good overcolour, the standard Gala type was letaside and two improved clones were preferred. The clones Royal Gala® Tenroyand Mondial Gala® Mitchgala were developed in New Zealand in 1981 and 1985receptively (Trillot et al., 1993; Trillot et al., 1995). Nowadays they are the mostcultivated clones of the region.
On the other hand, a correlation between RI and starch degradation with red over-colour development have not been found. But, it was possible to find a relationshipbetween the different ground colour stages and the optimum harvest time, takinginto account the intended destination of the fruit and consequently the initial qualitynecessary for immediate consumption or short, medium or prolonged storage(Westercamp, 1994).
In Patagonia valleys, when Gala is harvested with a firmness of 7.5–8.5 kg/cm2
and 3.5–4.5 g/l of malic acidity, this variety tolerates up to three or four monthsunder RA storage. If the harvest is performed under these conditions, the fruits shouldnot loss more than 25–30% of their firmness and 30–50% of their acidity duringstorage. To avoid disorders, fruits from different picks should not be mixed andshould not be allowed unnecessary handling (Benitez, 2001).
In this region, several studies have been conducted using different gaseousmixes with and without CO2. Despite the susceptibility of Gala apple to CO2, CO2
presence, even in low levels, is very important due to its fungistatic effect. Thesuccessful gaseous combinations were, 1.5% O2/0.5–1% CO2; 2% O2/1.2% CO2; 3%O2/1% CO2 and some intermediate relations. Some authors suggest using levels ofCO2 up to 2.5%, provided that the O2 levels are kept higher than 1.5%. It is alsoimportant to keep flesh temperature between +0.5 °C to +0.75 °C to avoid lowtemperature damages under CA conditions. Because the fruits are very sensitiveto shrivelling, the relative humidity (RH) should be kept between 92 to 94%. HigherRH levels increase carbon dioxide injury and cracking susceptibility (Benitez, 2001;Boylston and Kupferman, 1992; Mattheis et al., 1998).
Westercamp and Saint-Hilary (1993) findings and five seasons of local experi-ences results showed that Gala’s apples under CA storage with low levels of O2
(LO or ULO) required 7 to 10 days of RA storage for optimal flavour qualityrecovering (Benitez, 1998, 2001). Consequently, late harvesting fruit should notbe stored for prolonged periods, because during the time needed for flavour recov-ering the fruit will mature and dehydrate quickly.
Harvest and Postharvest Conditions for Apples and Pears 259

Disease and disorders. Gala apples are almost immune to superficial scald, verysusceptible to bruising during harvest handling specially at high temperatures.They have low sensitivity to bitter pit and russeting. In late harvesting, aroma isprioritised against crispiness, firmness and acidity. This practice increases suscep-tibility to mealiness, shrivelling, internal breakdown and stem cavity cracking. Thesedisorders are also incremented in rainy seasons.
3.2. Middle season apples
This group includes Delicious and Golden Delicious apples that represent 75% ofArgentina apple production, where Golden Delicious has a low share (1.1%).Jonagold behaviour is also described, although both the region environmental con-ditions and the results of harvest and post-harvest studies carried out by our groupcontributed to its decline (Table 2). From 1980, more than twenty Delicious cloneshad been studied to find fruits with early overcolour development and differentmaturity periods. This last objective is important to be able to sequence the harvestand to avoid excessive fruit concentration from middle February to the end of March.But the clones’ great majority did not adapt to the region for different reasons.Nowadays, Starkrimson, Red Chief, Hi Early, two selections of Top Red, RedKing Oregon and Cooper 8 are the strains being cultivated. Golden Delicious isfound in Northern Patagonia region and grown principally for export markets. Theexceptional environmental conditions produce clean fruits deprived of russeting.However, the importance of Golden Delicious in the region was decreasing whileNorth Hemisphere producers offer increases. The harvesting periods for GoldenDelicious and Delicious clones begin at mid February and continue until the begin-ning and the end of March respectively.
3.2.1. Delicious group
Delicious was discovered in 1879 in USA (Beach et al., 1905). In 1915 (also inthe USA), a smooth red mutation, named Richared Delicious, appeared. In 1926 astriped red mutation, called Starking Delicious come into view. This last one wasthe most successful and is cultivated all over the world. The fruit has a truncated-cone shape with five well-defined protuberances. However, they might present anirregular form due to pollination deficiencies. The fruit have an average weight of160–240 g and a diameter from 70–85 mm to 85–90 mm. The skin is consistentand has a green ground colour with bright red coloured stripes in great part of thesurface. Usually the fruits that are more exposed to the sun present a more het-erogeneous and intense overcolour. The flesh is white-yellowish, juicy, aromatic,with a finely granulated texture and good flavour. But, the fruit is susceptible tomealiness and to lose firmness under certain circumstances (Beach et al., 1905;Le Lézec, 1983; Rosati et al., 1977; Sansavini, 1997; Sansavini and Buscaroli, 1997;Trillot et al., 1993).
Since the beginning of regional horticulture and even now, this is the most impor-tant variety cultivated in Argentina. In Patagonia and other cultivated regions, thisvariety is known as Red Delicious.
260 C. E. Benitez and N. A. Pensel
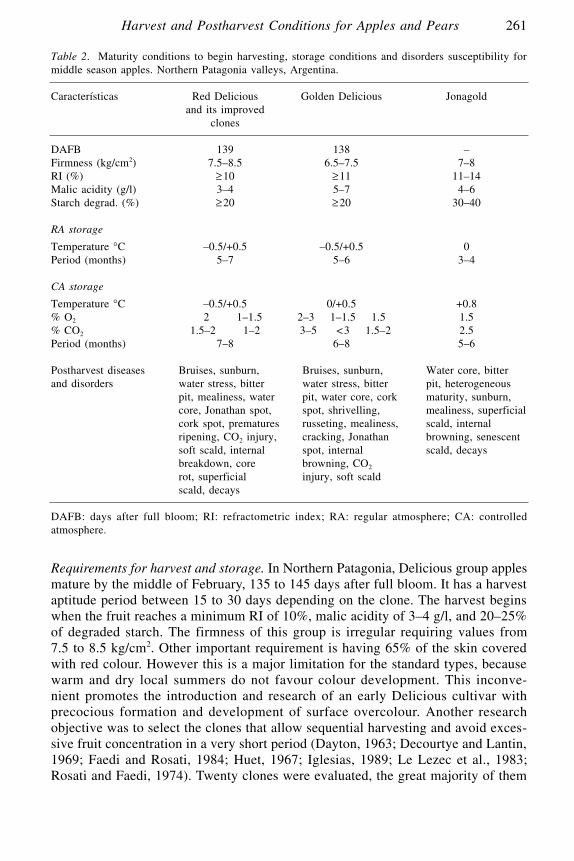
Requirements for harvest and storage. In Northern Patagonia, Delicious group applesmature by the middle of February, 135 to 145 days after full bloom. It has a harvestaptitude period between 15 to 30 days depending on the clone. The harvest beginswhen the fruit reaches a minimum RI of 10%, malic acidity of 3–4 g/l, and 20–25%of degraded starch. The firmness of this group is irregular requiring values from7.5 to 8.5 kg/cm2. Other important requirement is having 65% of the skin coveredwith red colour. However this is a major limitation for the standard types, becausewarm and dry local summers do not favour colour development. This inconve-nient promotes the introduction and research of an early Delicious cultivar withprecocious formation and development of surface overcolour. Another researchobjective was to select the clones that allow sequential harvesting and avoid exces-sive fruit concentration in a very short period (Dayton, 1963; Decourtye and Lantin,1969; Faedi and Rosati, 1984; Huet, 1967; Iglesias, 1989; Le Lezec et al., 1983;Rosati and Faedi, 1974). Twenty clones were evaluated, the great majority of them
Harvest and Postharvest Conditions for Apples and Pears 261
Table 2. Maturity conditions to begin harvesting, storage conditions and disorders susceptibility formiddle season apples. Northern Patagonia valleys, Argentina.
Características Red Delicious Golden Delicious Jonagoldand its improved
clones
DAFB 139 138 –Firmness (kg/cm2) 7.5–8.5 6.5–7.5 7–8RI (%) ≥10 ≥11 11–14Malic acidity (g/l) 3–4 5–7 4–6Starch degrad. (%) ≥20 ≥20 30–40
RA storage
Temperature °C –0.5/+0.5 –0.5/+0.5 0Period (months) 5–7 5–6 3–4
CA storage
Temperature °C –0.5/+0.5 0/+0.5 +0.8% O2 2 1–1.5 2–3 1–1.5 1.5 1.5% CO2 1.5–2 1–2 3–5 <3 1.5–2 2.5Period (months) 7–8 6–8 5–6
Postharvest diseases Bruises, sunburn, Bruises, sunburn, Water core, bitter and disorders water stress, bitter water stress, bitter pit, heterogeneous
pit, mealiness, water pit, water core, cork maturity, sunburn, core, Jonathan spot, spot, shrivelling, mealiness, superficial cork spot, prematures russeting, mealiness, scald, internal ripening, CO2 injury, cracking, Jonathan browning, senescent soft scald, internal spot, internal scald, decaysbreakdown, core browning, CO2
rot, superficial injury, soft scaldscald, decays
DAFB: days after full bloom; RI: refractometric index; RA: regular atmosphere; CA: controlledatmosphere.

did not adapt for different reasons, and new orchards are being planted only withRed Chief clone (Benitez, 2001; Castro, 1992).
Starkrimson. This apple, resulting from Starking Delicious mutation, was developedin the USA (Huet, 1967; Rosati and Faedi, 1975; Rosati et al., 1977). This is thelatest Delicious type to mature. In the Patagonia region, Starkrimson begins to maturein late February. The skin is waxy and smooth. The overcolour is dark-red, almostviolet, uniform, bright and without stripes. The overcolour develops very early inseason. If the harvest is anticipated, the flavour is poor and flesh has a character-istic coarse texture.
Red Chief. It is a sprout mutation of Starkrimson originated in USA. In many places,this mutation is used as a reference for Delicious group. At early stages, the skinpresents bright, intense and modestly striped reds colour, later the red colour coversthe entire surface. The flesh is fine, consistent, juicy, gently acidic and with goodflavour quality. This apple matures by middle of February, with the first group ofDelicious. Performing a good fruit selection, it can be commercialised early. Thefruit that will be selected for medium or prolonged storage periods should beharvested from seven to ten days later.
Hi Early. This fruit develops early during the season. It has an epidermis mostlycover by red-carmine colour with stripes. The harvest is by the middle of Februaryand represents a very good early fruit.
Top Red Delicious. It is a Starking mutation developed in Wenatchee, WA, USA.The skin presents an early coloration and is almost totally cover with an attractivered, striped colour on an intense pink ground. The flesh is firm, with good flavourquality (Rosati et al., 1977). In Argentina, it had been grown two Top Red types,one denominated Angius, locally best know as Red Delicious Chañar 28 and theother named Red Delicious Chañar 34. Both apples mature during the last weekof February.
Oregon Spur o Red King Oregon. This Red King mutation was developed inOregon, USA. The overcolour development is premature, but less premature thanfor Red Chief. First the skin is covered by a bright red stripes that finally coverthe entire surface. Maturation occurs in the third week of February. In warmsummer years, unfavourable for good colour development, Oregon apples presenta bronzed coloration over a striped surface. This defect that occurs in other regionswith similar weather conditions finally discouraged the interest for planting newOregon orchards.
Cooper 8. This apple, better known in the region as Italred, is very attractive becauseof its shape and the striped red coloration of the skin. Despite Cooper 8 can presenta bronzed coloration, it is less frequent and intense than in Red King Oregon.
Depending on the maturity of Delicious fruit, this kind of apples stands for fourto seven months of storage using refrigeration temperatures between –0.5 °C and
262 C. E. Benitez and N. A. Pensel
0.5 °C and 92 to 94% RH. Delicious tolerates CA (2% O2 and 1.5 to 2% CO2)and ULO (1 to 1.5% O2 and 1 to 2% CO2). However, fruits that had been sub-jected to stress, as a result of unfavourable weather or cultivation conditions, mightpresent internal and/or external CO2 injury when levels of CO2 are lower than O2
levels.
Diseases and disorders. Since all Delicious clones are moderately sensitive tobitter pit, calcium spays are an essential requisite. All clones are also susceptibleto sunburn; presenting bronzed coloration in the zones of the skin that are moreexposed to the sun. In extremely hot seasons it can be observed fruits with prematuresenescence in end area. Late harvesting, high temperature and alternated high –low temperatures are factors that increase vulnerability for the manifestation of watercore, mealiness and internal breakdown. Delicious semi-open calyx facilitates theentrance of Alternaria spp. and other fungi that cause core rot. This weakness ispresent in all types and harvesting areas, but its frequency and intensity variesfrom year to year.
During the storage period, Delicious is moderately susceptible to superficial scaldand requires an anti-scalding treatment for 4 months or longer storage periods.This is critical when other favourable factors appear, some example are early har-vesting, excessive nitrogen fertilisation, hot summers. On the other hand fungicidetreatments can prevent decay caused by wound parasites, like Penicillium expansumLK and Botrytis sp.
3.2.2. Golden Delicious
The origin of this variety is the USA, where it was discovered by the end of the 19thcentury. Since this variety is used in the majority of the countries and is the chrono-logical reference for blossom and harvest date of the other varieties, it is recognisedas one of the most extended varieties. The fruit has an oblong truncated cone toregular shape, an average weight of 190 to 210 g, a diameter of 75 to 85 mm, anda long stem. The fruit skin has a green yellowish or green golden colour, some-times can present a pink side, specially fruits coming from young trees. Theepidermis has notable lenticels. It has and smooth appearance, however it has amicroscopic reticulate that increase the fruit exchange surface. The flesh is yellowish,fine, consistent, juicy, crispy, aromatic and with an equilibrated sweet-sour taste(Beach et al., 1905; Geoffrion, 1992; Huguet et al., 1990; Iglesias, 1990; Le Lézecet al., 1983; Trillot et al., 1993; Sansavini and Buscaroli, 1997; Stebbins et al.,1989).
In most of the producing zones of the world it is frequent the presence of acci-dental russeting (Le Lézec and Lespinasse, 1991; Trillot et al., 1993), howeverthis is unusual in the Northern Patagonia Valleys where Golden Delicious foundfavourable environmental conditions for its development. Although there are severalimproved clones, there is not interest for their introduction to the region. A dif-ferent reason could explain this lack of interest: russeting is not a problem, noneof the clones has better organoleptic quality and Golden Delicious growth isdeclining. Anyway, nowadays there are some commercial cultivated areas with
Harvest and Postharvest Conditions for Apples and Pears 263

Golden B and it is being evaluated the adaptation and post-harvest behaviour ofOzark Gold, a simile to Golden (Faedi and Rosati, 1984).
Requirements for harvest and storage. Golden Delicious matures by the middle ofFebruary, and has a harvest aptitude period between 15 to 20 days. Picking beginswhen flesh firmness reaches 6.5–7.5 kg/cm2, RI is higher than 11%, malic aciditylevels are between 5 and 7 g/l and starch degradation is higher than 20%. Theepidermis colour change from soft green to yellowish green is a good maturity indexonly for fruits from healthy and well-equilibrated orchards (Lespinasse, 1971). Someresearchers relate the optimum harvest date with the colour change of seeds fromamber to dark brown (Bidabé et al., 1972; Siegrist, 1986). After several seasons,the local research results were erratic. The seed darkening variation was greaterdue to cultivation conditions, especially type of soil, than for maturity stage ofthe fruit (Benitez, 2001).
Golden Delicious very well tolerates storage. If soluble solid concentration ishigher than 12%, this variety can stand near-freezing temperatures (around –0.5 °C).For lower soluble solid concentrations, Golden apples require 0 °C to 0.5 °C.Under CA conditions, regardless of sugar concentration, the fruit must be storedat temperatures slightly above zero. During storage, the RH plays an importantrole because fruits have a high tendency to shrivelling because of their structuralcharacteristics (Geoffrion, 1992). Thus, it is convenient to keep RH values from94 to 96%. Excessively high humidity levels increase the susceptibility to crackingand splitting in very ripen fruits. Locally, our group had been essaying differentgaseous mixes, 2 to 3% O2 – 3 to 5% CO2; 1 to 1.5% O2 with CO2 values lowerthan 3%, and 1.5% O2 – 1.5 to 2% CO2. These gaseous mixtures were good notonly for standard Golden Delicious but also for Clone B that behaves similar tothe original variety (Benitez, 2001). Still there are not local experiences on appro-priated storage conditions for Ozark Gold.
Diseases and disorders. Golden apples are very susceptible to bitter pit. This makesindispensable spray calcium at preharvest and a postharvest reinforce. This varietyhas a low susceptibility to superficial scald and is practically immune beyond themiddle part of its aptitude period. The high tendency to any kind of russeting inGolden Delicious apples motivates big concern for most growers all over theworld, but this is only accidental in Patagonia region. However, this variety isvery sensitive to bruises, friction discoloration and highly susceptible to shrivel-ling. Their elevated ethylene emission makes necessary to take precautions andcontrol its level during storage and avoid prolonged contact with apples that has alower respiratory rate.
3.2.3. Jonagold
Jonagold apple was obtained in 1953 from the USA by crossing Golden Delicious× Jonathan apples. It requires temperate to fresh climate with high RH and high tem-perature amplitude. The fruit has a big to very big size, 80 to 90 mm diameterand weights 200 to 230 g. The epidermis is green yellowish partially cover with
264 C. E. Benitez and N. A. Pensel

luminous bright red colour that will be light or dark depending on the clone. Theflesh is crispy, juicy, perfumed, with adequate balance between RI and organicacids that assures a good organoleptic quality. The fruit to be commercialised requiresat least 30% of surface covers by red colour, having higher price the fruit highlycovered (De Coster, 1990a, b, c; Sansavini, 1997; Stainer, 1992; Trillot et al.,1993).
Requirements for harvest and storage. The maturity season and its relation to othervarieties differ according to the cultivation zone. While in France this variety maturessimultaneously with Golden Delicious, in Spain Jonagold matures first (Iglesias,1990). In Chile, harvesting begins by the end of February or in the first days ofMarch (Contreras, 1990). In Northern Patagonia harvesting conditions are adequateby the third week of February, seven or ten days after Golden (Benitez, 2001).
The proper harvest time is very difficult to determine objectively. On one side,the red colour is a highly appreciated characteristic. Since 30% covered surfacedapples and highly coloured clones are very well paid, growers are tempted to harvestimmature, low organoleptic quality apples (De Coster, 1990b; Herregods andGoffings, 1993). On the other side, in places ecologically unfavourable for Jonagoldcultivation, Northern Patagonia for example, the harvest must wait until colourdevelops. The fruit has excellent flavour but their unattractive aspect discouragesthe cultivation of this variety (Benitez, 2001). For these reasons growers, espe-cially from Belgium, have intended to define certain harvesting guidelines basedon ground colour, firmness, RI and starch degradation. When the fruit is young,the abundance of chlorophyll in the skin gives the characteristic green colour ofthe fruit. As the fruit matures the green colour is attenuated by carotenoid presence.The specific colour charts goes from 1 (green) to 8 (yellow). Based on this chart,the advised ground colour for harvesting would be between 4 and 5. For the restof the indexes, it is proposed 7 to 8 kg/cm2 of firmness, 11 to 14% of RI and 4 to6–7 g/l of malic acidity (De Coster, 1990a, b, c).
During five seasons, our group experimented with Jonagold periodically har-vesting and evaluating physicochemical-organoleptic advantages and disadvantages.Finally, the lack of adaptation discouraged the cultivation of this variety once andfor all. The evaluation of the storage aptitude under local cultivation conditionswas interesting. Three to four months of RA at 0 °C and 92–94% RH is welltolerated for this variety. Using CA with 1.5% O2 and 2.5% CO2 Jonagold applescan be kept in good condition for seven months at 0.8 °C.
Diseases and disorders. Jonagold apples are sensitive to sunburn, superficial scald,internal browning, mealiness, senescent scald and water core.
3.3. Late apples
This group represents a little more than 20% of total apple production, but it con-stitutes the most numerous groups (Table 3). Following the harvesting order, thegroup is composed by one green apple variety: Granny Smith, one yellow: YellowNewton.
Harvest and Postharvest Conditions for Apples and Pears 265

Pippin and four bicolour: Rome Beauty, Braeburn, Fuji and Pink Lady. Harvestingbegins in the first days of March and continues until late April. Granny Smithproduction stand stable, while Yellow Pippin and Rome Beauty are steadily dropping.Braeburn, Fuji and Pink Lady were introduced more recently, Braeburn and Fujiat the beginning of the nineties and Pink Lady, that seems to adapt well to the region,at the end of last decade.
266 C. E. Benitez and N. A. Pensel
Table 3. Maturity conditions to begin harvesting, storage conditions and disorders susceptibility forlater apples. Northern Patagonia valleys, Argentina.
Características Granny Rome Yellow Braeburn Fuji Pink Smith Beauty Newton Lady
Pippin
DAFB 165 164 170 168 170 186Firmness (kg/cm2) 6.5–7.5 7.5–9 7–7.5 7–8 6.5–70. 7.5–8.5RI (%) ≥10 10.5–12 ≥10 ≥12 12–14 13–15Malic acidity (g/l) 0.8–8.5 0.4–5 – 6–7 4–5 0.7–7.5Starch degrad. (%) ≥20 0.20–30 ≥20 30–40 35–40 30–50
RA storage
Temperature °C –0.5/+0.5 0/+0.5 –0.5/+0.5 0/+0.75 0/+0.5 0Period (months) 7–9 0.6–7 5–6 4–5 5–6 4–5
CA storage
Temperature °C 0/+0.5 – – +0.5/+1 +0.5/+1 0% O2 2 0.8–1.2 – – 1.2–30. 1.2–2.5 1.2–2.5% CO2 1.5 1 – – 0.5–1.2 0.8–1.3 0.8–1.3Period (months) 10–12 – – 5–7 6–8 6–8
Postharvest Bruises, Bitter pit, Bruises, Bruises, Bitter pit, Hot diseases and sunburn, Jonathan sunburn, bitter pit, heterogen. tempera-disorders water stress, spot, bitter pit, heterogen. maturity, ture
bitter pit, superficial internal maturity, sunburn, injury, water core, scald, browning, sunburn, lenticel cracking, CO2 injury, soft Jonathan lenticel blocht pit, internal soft scald, scald, spot blocht water core, breakdowninternal internal pit, water cracking, browning, browning core, core russeting, core flush, flush, CO2 CO2 injury,superficial injury, mealiness, scald, internal superficial decays breakdown, scald,
mealiness, core rotsup. scald, decays
DAFB: days after full bloom; RI: refractometric index; RA: regular atmosphere; CA: controlledatmosphere.

3.3.1. Granny Smith
This variety is originally from Australia, where appeared by the middle of the19th century (Ballard, 1981). Granny Smith has the third place among the mostextended variety in the word, after Delicious and Golden Delicious. In Argentinahas the second place after Delicious. The fruit has truncated cone shape, is regularand homogeneous. It has medium to big size, weighs 190 to 210 g, has a diameterof 75 to 80 mm and medium-size stem. The epidermis is unctuous, with intensegreen colour and well notable white lenticels. Sometimes present reddish col-oration on the face exposed to the sun. The flesh is white greenish, firm, crispy,juicy, definitely acid and slightly aromatic (Ballard, 1981; Beach et al., 1905;Stebbins et al., 1989; Trillot et al., 1993).
Requirements for harvest and storage. Granny Smith reaches the maturity pointby the fist days of March, 160 to 170 days after full bloom. Harvesting is initi-ated when the fruit reach the minimum maturity values. These are firmness of6.5 to 7.5 kg/cm2, RI higher than 10–11%, malic acidity of 8 to 8.5 g/l, 20–30%of starch degradation and 1.5 to 2 level of ground colour in the chart, where 1correspond to intense green and 4 to yellowish.
This variety tolerates five to six months under RA storage, after this periodgradually losses its organoleptic quality and increase unctuously of the skin (Mitchamet al., 1999; Viard and Chapon, 1976). For prolonged periods (more than six months)it is convenient to apply AC. Locally we have had good results utilising com-posite mixes such as, 2% O2 and 1.5 to 2% CO2; 0.8 to 1.2% O2 and 1% CO2 orsimilar. In all the experience the temperature range used was from 0 °C to 0.5 °C.Negative temperatures increase the risk of CO2 injury, specially working underU.L.O. conditions. CA with low oxygen levels acts favourably against these kindof disorders and contributes to maintain the green ground colour and organolepticquality of fruit. Besides, this helps to reduce the natural unctuous production thatoccurs during storage.
Diseases and disorders. Early harvest fruits are highly susceptible to superficial scaldand bitter pit. This disorder increase for fruits that come from young trees withlow loads and acute nutritional unbalance. Late fruits are sensitive to sunburn andwater core. These disorders increase with warm summers and fruit coming fromscarce foliage trees. During refrigerated storage Granny Smith apples are suscep-tible to core flush and other low temperature disorders (Benitez, 2001; Mitchamet al., 1999).
3.3.2. Rome Beauty
This variety originated in 1848 spontaneously appeared in an Ohio, USA orchard.Depending on the clone and cultivation practices the fruit might have bigger orsmaller size. The fruit shape is spherical, mostly regular, with some flattening inthe ends, a close calyx and long a straight or lightly oblique stem. The skin is smooth,
Harvest and Postharvest Conditions for Apples and Pears 267

more or less thin, with yellow greenish colour and small white doted lenticels.The sun exposed face present wide red carmine stripes that sometimes are poorlycoloured. The flesh is white yellowish to greenish, crispy, juicy, slightly aromatic,with firm slightly fine texture. It has good flavour at ripening and very good culinarycharacteristics (Beach et al., 1905).
Requirements for harvest and storage. During last twenty years, this variety isconstantly declining in Northern Patagonian valleys. Rome Beauty mature by middleof March when fruits have become 164 days old, flesh firmness reaches 7.5 to9 kg/cm2, RI gets to 10.5 to 12% (depending on the year), malic acidity level turns4 to 5 g/l and starch degradation reach 20 to 30%.
This variety tolerates six to seven months under RA at 0 °C to 0.5 °C and 92to 94% RH. Especial atmosphere had not been experienced locally, however inter-national literature shows good results utilising conventional CA (Meheriuk, 1989).
Diseases and disorders. Rome Beauty is modestly susceptible to bitter pit andslightly sensitive to superficial scald, especially in more coloured clones.
3.3.3. Yellow Newton Pippin
This variety was originated in New York, USA in 1773. In the Patagonia it wascultivated until the seventies but today has practically disappeared. The fruit has arather uniform medium to big size, but an irregular form. It is spherical with awide base that narrows towards the calyx, has an oblong tendency and short stem.The epidermis is thin, smooth or lightly russeted, especially at the stem cavity. Ithas white lenticels that became more numerous by the calyx area. The skin colouris bright yellow and sometimes has a pink tone on the sun opposite face. The fleshtexture is modestly granulated, firm, crispy, semi-sour, perfumed, white yellowishand with an attractive flavour (Beach et al., 1905).
Requirements for harvest and storage. This variety tolerates well five to six monthsof storage in RA conditions at 0 °C and 92–94% RH.
3.3.4. Braeburn
The origin of this variety is New Zealand. It was obtained by free pollination ofLady Hamilton. This is an apple appropriated for climates with long vegetativeperiods. The fruit is firm, with medium to big size, a weight of 200 to 250 g,70–80 mm of diameter and semi-open calyx. Its shape is a truncated cone, slightlyflatten, irregular, especially fruits from young trees. The epidermis has a darkgreen ground colour with red carmine strips that covers 25 to 75% of surface. Theflesh is yellowish, firm, crispy, sugary and without characteristic aroma. It has 12to 15% of RI and 5 to 6 g/l of malic acidity depending on the regions, 0.87 of specificweight. To assure a good coloration is required a direct access to sunlight. It isalso convenient to harvest with malic acidity levels higher than 4.5–5.0 g/l, lowervalues tend to affect negatively its particular sweet acidulated flavour (Iglesias
268 C. E. Benitez and N. A. Pensel
et al., 1997; Reyes, 1994; Stainer, 1992; Stebbins, 1991; Stebbins et al., 1989; Trillotet al., 1993; Tronel et al., 1995).
Requirements for harvest and storage. Ground colour turning from green to intenselight green is a good index to decide harvesting date; oppositely, overcolour devel-opment is not a good index (Westercamp, 1994). Postponing harvest allows improvered colour intensity and proportion of surface covered, but this practice reduceshelf life and produce extremely big fruits in trees with low load (Plotto, 1992;Reyes, 1994). In the Patagonia Braeburn matures by the middle of March. Thecommercial harvest aptitude period varies depending on the years; it can be from12 to 15 days. Harvesting is initiated when ground colour turns from dark greento light green, soluble solid increase to values higher than 12% and malic aciditydrops to almost 6 g/l, while starch degradation goes to 30–40%. Maturity is veryheterogeneous (Benitez, 2001; Chapon and Westercamp, 1996; Iglesias et al., 1997;Reyes, 1994; Stainer, 1992; Stebbins, 1991; Stebbins et al., 1989; Trillot et al., 1993;Tronel et al., 1995). First there are only a few apples ready for picking, a fewdays later the vast majority of apples matures and later the rest of them. Pickingof first matured fruits must proceed without waiting the principal picking, becausethey have poor quality and accelerate maturation of greener apples (Benitez, 2001).
This variety can be stored for four to five months using temperatures from +0to +0.7 °C and 92 to 94% RH. Although Braeburn physically tolerates prolongedstorage, it systematically losses quality when acidity drops below 4 g/l. In thiscondition, harvest must proceed when ground colour turns from intense green tolight green and there is a 35–40% of starch degradation. For short periods (two tothree months) it is possible to favour the excellent flavour of this variety and harvestat higher degree of maturity (Benitez, 2001; Chapon and Westercamp, 1996; Reyes,1994).
In local controlled atmosphere essays, there have been good results utilisingtemperatures between +0.5 and +1.0 °C and 92–94% RH with different gaseousmixtures. Considering Braeburn susceptibility to CO2, it is convenient maintain itlevels close to 1%. The level of O2 utilised in the local experience was 1.2 to3.0% and from 0.5 to 1.2% for CO2, this mixture maintains a good acidity leveland favours juiciness (Benitez, 2001).
Diseases and disorders. High percentages of rejected fruit are characteristic ofBraeburn apples, especially in the first productions. Then, if an adequate leave/fruitproportion is maintained, some susceptibility factor, youth and excessive vigour,could be attenuated in the second or third season. The fruits are sensitive to sunburn,scab, lenticel blotch pit, wing deformity and water core. A sufficient number ofcalcium sprays at preharvest and a reinforce at harvest time are essential becausethis variety is very susceptible to bitter pit. Late harvesting increases risk of decays,mealiness, internal breakdown and water core. During storage they are sensitiveto superficial scald and very susceptible to CO2 injury that is manifested as browncore or dark cavities inside the flesh (Benitez, 2001; Chapon and Westercamp, 1996;Reyes, 1994; Stebbins et al., 1989; Trillot et al., 1993; Tronel et al., 1995).
Harvest and Postharvest Conditions for Apples and Pears 269

3.3.5. Fuji
Fuji is a variety obtained in 1939 by the National Fruit Research Station of Morioka,Japan. It is the result of crossing Ralls Janet × Delicious. The fruit is spherical,with medium to big size, 200 to 250 g of weight, most of diameter between 75and 85 mm, irregular form for the first productions and firm-short stem. The skinground is light green partially covered by a bright red colour of late appearance,with very notable lenticels and frequently by russeting of some kind. The fleshfirmness is not a good maturity index because sometime almost imperceptiblefirmness changes are accompanied by important modifications of fruit conditions(Iglesias et al., 1997; Kikuchi et al., 1998; Masseron et al., 1995; Sansavini andBuscaroli, 1997; Stebbins et al., 1989; Trillot et al., 1993).
Requirements for harvest and storage. Like other varieties, Fuji fructifies in terminaland lateral branches. Consequently, by the same date there will be fruits with dif-ferent development and maturity stages. This results in two or three picking roundsto complete the harvest (Rodriguez R. and Rodriguez M., 1997). It is difficult todetermine the optimum moment for each picking because the harvest modalitiesand adequate indexes depend on production areas and market destination. WhileJapan considers water core as a quality index, occidental markets consider it as adefect (Blanchet and Ramat, 1995a, b; Fan et al., 1995; Iglesias et al., 1997;Masseron et al., 1995; Sansavini and Buscaroli, 1997; Stebbins, 1989, 1991).
Fuji matures by middle of March. The best index to start harvesting is starchdegradation (35%), together with a minimum level of RI (13–14%) and malic acidity(3.5–4 g/l). Also, there is a turn of ground colour to green yellowish and intensi-fication of overcolour that depends on the clone but did not depend of maturitystage.
These apples are characterised by their low ethylene emission and tolerance tostorage in certain conditions (Blanchet and Ramat, 1995b; Chapon, 1996). Theycan be stored from five to six months under RA utilising positive temperatures(+0 °C to +0.5 °C) and 92–94% RH. During longer storage times using these con-ditions, fruits will maintain their firmness and concentrate their sugars. But, theywill present important acidity dropping and their organoleptic quality will beginto decline. For prolonged storage, is preferable to use CA that has good results usingcertain gaseous mixtures. Essays accomplished in Patagonia revealed a good responseto different levels of O2, from 1.2 to 2.5%, but always keeping CO2 levels between0.8 and 1.3%, positive temperatures (+0.5 °C to +1 °C) and 92–94% of RH. Fujitolerates ULO storage, but its use is not justified for less than a 3–4 months periodbecause this variety can be maintained in excellent conditions under LO (Benitez,2001).
Diseases and disorders. Fuji is susceptible to russeting of any type. The affectedfruits have shorter shelf life, shrivel tendency, develop bad taste, frequently presentstem cavity cracking and become corky, however they keep a good firmness andan elevated RI. Early or very late harvesting favours the development of diseasesand disorders before and after picking. Sunburn damages are characteristic of this
270 C. E. Benitez and N. A. Pensel
variety, to avoid them there are different strategies. Some strategies are sacking orbagging, sun protection nets and half turn of the fruit. Half fruit turn is for humidareas where stem resists is the application of this technique (Masseron et al., 1995;Kikuchi et al., 1998). However, if there is not an adequate training system, thefruits in the shadow part will stay with a green coloration even postponing the harvest(Blanchet and Ramat, 1995; Westercamp, 1994).
Similarly to Braeburn, Fuji apples are susceptible to superficial scald (espe-cially in early harvesting) and lenticel blotch pit. Water core might appear beyondmiddle part of harvest aptitude period (Watkins et al., 1993). In CA storage con-ditions, Fuji becomes susceptible to internal browning by high levels of CO2 orinadequate gaseous mixtures.
Fuji tends to alternating bearing and heterogeneity of clones coloration. Bothof these limitations added to the previous disorders makes very difficult to achievecommercial fruit levels higher than 60%. For this reason, in some medium to littlefavourable regions of North Patagonia the enthusiasm of planting orchard withFuji trees diminished (Trillot et al., 1993).
3.3.6. Pink Lady® Cripp’s Pink COV
Pink Lady is the commercial name of the Cripp’s Pink COV variety, producedcrossing Lady Williams × Golden Delicious in 1979 in Australia (Mathieu et al.,1998). The fruit has cylindrical-conical shape, medium to big size. It is uniforminside the same tree, weights 185 to 220 g, measures 80 to 85 mm of diameter,and has a close calyx and little visible stem. The epidermis is thin with someirregularities in the bigger fruits of the first productions; the lenticels are poorlydefined and the fruit may have light russeting at the stem cavity. The skin groundcolour is light green and overcolour is pink at first and then turn to a luminousred. The overcolour appears late, covers 25 to 75% of surface, and can coat com-pletely one face at harvest time. The flesh has creamy white colour and mediumtexture. It is crispy, firm, juicy and slightly perfumed. An adequate balance betweensugars and acids give to this fruit exceptional organoleptic characteristic (Sansavini,1997; Mathieu et al., 1998).
Requirements for harvest and storage. Establishing the optimum harvest date isan essential factor to assure the shelf life quality of this variety. Thus, there havebeen attempts to define the harvest opportunity using flesh firmness, RI content,malic acidity, starch degradation and turning of ground colour (Mathieu et al.,1998).
In the Patagonia this variety reaches the commercial maturity by the last daysof March or first half of April, comprising a three to four weeks period. Harvestingis accomplished when fruits have 7.5 to 8.5 kg/cm2 of firmness, at least 13%of RI (might reach 14–15%), 7 to 7.5 g/l of malic acidity and 30 to 50% ofstarch degraded. These conditions allow fruit consumption right away from theharvesting.
It is well preserved for four to five months under RA conditions, a temperatureof 0 °C and 92–94% of RH. After that time the skin became waxy. Although it
Harvest and Postharvest Conditions for Apples and Pears 271

has low tendency to mealiness, their organoleptic characteristics decline. For periodof six to eight months it is convenient to use CA with, 1.5 to 2% O2 and 0.8 to1% CO2 (Benitez, 2001).
Diseases and disorders. Pink lady has the same sensitivity to mechanical injuriesthan Golden Delicious (Mathieu et al., 1998). It is little susceptible to superficialscald and bitter pit that might appear in young fruit. If picking is postponed, therisk of flesh browning and other senescence symptoms (loss of firmness and juice)increases. This variety is little sensitive to sunburn, but it is sensible to very hotweather, especially late fruits. Rainy seasons increase the susceptibility of stem cavitycracking.
4. PEARS
4.1. Early pears
All the earliest varieties Beurré Giffard, Clapp’s Favourite and Red Clapp’s havecommon characteristics. The fruits are picked young and they have short harvestaptitude period because of its high respiration rate, and brief shelf life (Hedrick,1921; Morettini et al., 1967; Baldini and Scaramuzzi, 1982). In North Patagonianvalleys these pears start the annual harvest season, giving early fruits to the market.However the production of these varieties barely reach 1.2% of total production.Bartlett variety, better known at Argentina as Williams, shared this group and con-tributes with 45% of national pear production. Bartlett red selections, especially RedBartlett, Red Sensation and Williams Rosée, account for nearly 7.2% of total pro-duction (Table 4).
4.1.1. Beurré Giffard
In 1824, this pear was found in France as a wild variety and it was introduced inAmerica by 1850. The fruits have conical pyriform shape, small size, 125 g ofweight, 60 mm of diameter and 83 mm of height. Pears stem is medium to largewith a vertical insertion, without stem cavity and an open to semi-open calyx. Itssmooth skin has light green colour with a pink tint in the more exposed to sunface and noticeable lenticels. Fruit flesh has creamy white colour, consistent slightlygritty texture. It is very sweet and pleasing with low acidity and good organolepticquality (Baldini and Scaramuzzi, 1982; Hedrick, 1921; Morettini et al., 1967;Tacchini, 1967).
Requirements for harvest and storage. Harvesting starts, 104–105 days after fullbloom during last days of December or first week of January. As result of itsscarce production and short shelf life period, Giffard pears are immediately com-mercialised.
272 C. E. Benitez and N. A. Pensel
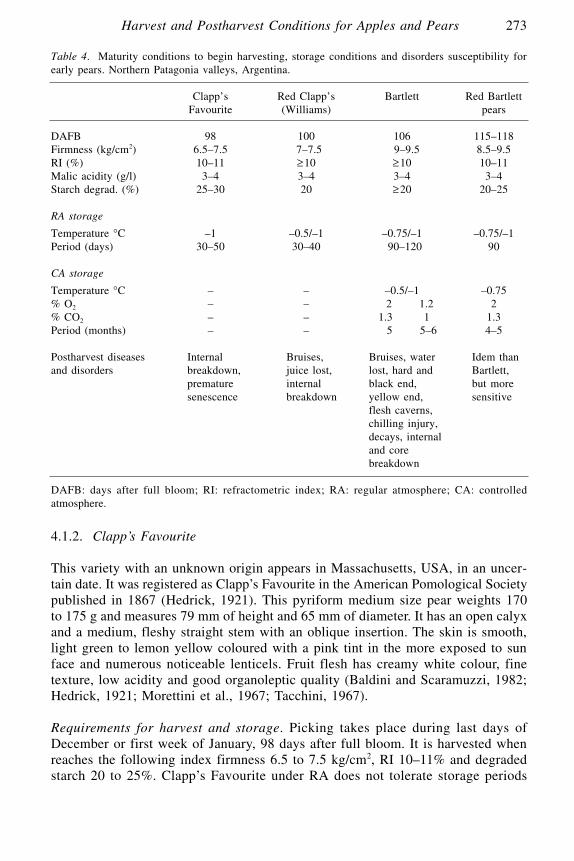
4.1.2. Clapp’s Favourite
This variety with an unknown origin appears in Massachusetts, USA, in an uncer-tain date. It was registered as Clapp’s Favourite in the American Pomological Societypublished in 1867 (Hedrick, 1921). This pyriform medium size pear weights 170to 175 g and measures 79 mm of height and 65 mm of diameter. It has an open calyxand a medium, fleshy straight stem with an oblique insertion. The skin is smooth,light green to lemon yellow coloured with a pink tint in the more exposed to sunface and numerous noticeable lenticels. Fruit flesh has creamy white colour, finetexture, low acidity and good organoleptic quality (Baldini and Scaramuzzi, 1982;Hedrick, 1921; Morettini et al., 1967; Tacchini, 1967).
Requirements for harvest and storage. Picking takes place during last days ofDecember or first week of January, 98 days after full bloom. It is harvested whenreaches the following index firmness 6.5 to 7.5 kg/cm2, RI 10–11% and degradedstarch 20 to 25%. Clapp’s Favourite under RA does not tolerate storage periods
Harvest and Postharvest Conditions for Apples and Pears 273
Table 4. Maturity conditions to begin harvesting, storage conditions and disorders susceptibility forearly pears. Northern Patagonia valleys, Argentina.
Clapp’s Red Clapp’s Bartlett Red Bartlett Favourite (Williams) pears
DAFB 98 100 106 115–118Firmness (kg/cm2) 6.5–7.5 07–7.5 0 9–9.5 8.5–9.5RI (%) 10–11 ≥10 ≥10 10–11Malic acidity (g/l) 3–4 3–4 3–4 3–4Starch degrad. (%) 25–30 20 ≥20 20–25
RA storage
Temperature °C –1 –0.5/–1 –0.75/–1 –0.75/–1Period (days) 30–50 30–40 090–120 90
CA storage
Temperature °C – – –0.5/–1 –0.75% O2 – – 2 1.2 2% CO2 – – 1.3 1 1.3Period (months) – – 5 5–6 4–5
Postharvest diseases Internal Bruises, Bruises, water Idem than and disorders breakdown, juice lost, lost, hard and Bartlett,
premature internal black end, but more senescence breakdown yellow end, sensitive
flesh caverns, chilling injury, decays, internal and core breakdown
DAFB: days after full bloom; RI: refractometric index; RA: regular atmosphere; CA: controlledatmosphere.

longer than 30 to 50 days. As happens in other countries that produce this variety,the scarce signification in regional market determines its immediate commerciali-sation as an early fruit, before Bartlett entrance to the market.
Diseases and disorders. Clapp’s Favourite is very susceptible to premature internaldecay, affecting its shelf life and confirming its low aptitude for storage (Baldiniand Scaramuzzi, 1982; Morettini et al., 1967).
4.1.3. Red Clapp’s
Better known as Starkrimson in many other parts of the world, it is a Clapp’sFavourite sprout mutation. This variety was obtained in Michigan-USA, in 1939.It is a mutation of the most superficial skin cellular layers that acquire a wine likeintense bright uniform red colour. This characteristic gives to this pears a highlyattractive aspect. The fruits are similar to the original variety with big to mediumsize, especially when the tree load is poor. The calyx is open or semi-open andthe stem is somewhat long, bulky, fleshy, straight, vertically inserted and withoutstem cavity. The skin is smooth and thick. The colour of early development isdark red, uniformly distributed with numerous small notable lenticels. Red Clapp’sflesh is creamy white, with a fine consistent texture, moderately granulated closeto the carpel loculus. It is perfumed, sweet, and pleasant, with low acidity andgood organoleptic quality (Iglesias and Almacelles, 1992; Lombard, 1987; Morettiniet al., 1967; Sugar, 1991; Sugar and Lombard, 1989; Warner, 1999).
Requirements for harvest and storage. This pear matures at 100 days old, two orthree days after Clapp’s Favourite, when achieve similar maturity indexes. Todevelop its exceptional organoleptic characteristics needs 20 to 40 days of refrig-erated storage under RA conditions.
Diseases and disorders. Red Clapp’s is susceptible to bruising during handling,internal breakdown and organoleptic quality decline when storage is extended.
4.1.4. Bartlett
Bartlett pear, also known as Williams Bon Chrétien or plainly Williams, was orig-inated in Aldermaston, Berkshire, UK, by 1799. This is the Occident most commonlygrowing pear and preferred by the processing industry. The fruit is pyriform, arounded bell on the bottom half of the fruit, then a definite shoulder with a smallerneck. It has a medium to big size, 230 to 235 g of weight, 105 mm of height and65 mm of diameter. The stem is midi, partially woody, obliquely inserted with adeep stem cavity and a semi-open calyx. Bartlett’s skin is smooth and delicate,with abundant noticeable lenticels over a light green colour that turns to an attrac-tive yellow when the fruit is ripen. Some times the epidermis presents a pink tintin the more exposed to sun face. The flesh has creamy white colour and finetexture. It is typically aromatic, very juicy, sweet slightly acid, modestly granu-lated close to the carpel loculus where some stone cells appears and has very good
274 C. E. Benitez and N. A. Pensel

organoleptic quality (Baldini and Scaramuzzi, 1982; Hedrick, 1921; Iglesias andAlmacelles, 1992; Morettini et al., 1967; Stebbins, 1990; Tacchini, 1967; Warner,1999). This variety, under ‘Williams’ name accounts for 45% of national pear pro-duction.
Requirements for harvest and storage. This variety matures by January 10, when thepear has an average of 106 days old. Other indexes that fruit should reach are aminimum diameter of 64 to 65 mm, 9–9,5 kg/cm2 of firmness, RI level superiorto 10%, 3–4 g/l of malic acidity and 20 to 25% of starch degradation (Benitez, 2001).The fruit position on the tree influences the maturation and quality of Bartlett orchardproduction. The high top and more exposed to sun fruits matures before than fruitfrom other positions. However they have grater percentages of rejected fruit thanlower exposed parts of the tree. The plants also have areas with less productionand smaller size fruits. These characteristics should be taken into account to orientthe harvest by the destiny of the fruit, if it will be market as early fruit or storagefruit (Benitez et al., 1997). This pear tolerates storage, but requires previous pre-cooling. In other world production areas Bartlett fruit requires application ofcomplementary maturation technique, in Patagonian region there is no need ofsuch application (Gorini, 1984; Mitcham et al., 1999). Depending on the maturityindex by the harvest time, the fruit under RA conditions (–1 °C and 92 to 94%RH) maintains their exceptional quality for three to four months. Longer storageperiods or inadequate storage conditions results in Bartlett pears that has a matureappearance but they are really not. The fruits present an attractive yellow colourbut the juice and their exceptional organoleptic quality disappear. This disorder islocally known as ‘chilling injury’ (Benitez, 1998, 2001).
Good results were obtained using CA conditions. The parameters used weretemperatures from –0.5 °C to –1 °C and the following gaseous mixtures 2% O2/1.3% CO2 and 1.2% O2/1% CO2, where CO2 was used as a decay depressor. Severalyear of study under different conditions showed that the selected gaseous mixturesincrease elasticity and skin resistance, decreasing susceptibility to bruising. Thispermits to extend the storage period to five month and improve significantly theaspect and aptitude for consumption of the fruit. Besides CA use contributes to exaltthe intrinsic organoleptic characteristics of this variety, provoking organic acidformation and juice secretion and considerably retarding senescence and internalbreakdown development.
Diseases and disorders. Bartlett variety is susceptible to bruising, especially duringwarm summers when skin became thinner, increasing the risk (Benitez and Calvo,2002; Mellenthin et al., 1982; Mitcham et al., 1999). The water stress increasesthe risk of stone cell formation, juice lost, and in very serious cases parenchymacavities formation. Different causes of incompatibility or unfavourable grown con-ditions increase the risk of hard end and black end development. This variety isalso susceptible to yellow end disorder. This physiological disorder, characterisedby premature calyx maturity, develops when harvest time is presided by cool weatheror permanent temperature changes (Benitez and Calvo, 2002). In other world pearproducing areas this disorder is known as pink end (Porrit et al., 1982) because of
Harvest and Postharvest Conditions for Apples and Pears 275
the parenchyma tissues coloration of the calyx areas. But this characteristic colourdid appear on Bartlett pear of Patagonian region.
During storage, this variety is susceptible to decay caused by wound parasites,especially Penicillium expansum LK. Other physiological disorder such as shrivel(due to lack of humidity in cooling chambers), senescence scald and internal break-down (due to late harvesting, over-ripening or prolonged storage), freezing (dueto use of temperatures bellow –1 °C) and ‘chilling injury’ previously described.Under AC conditions, oxygen levels influence on CO2 tolerance of Bartlett fruit.This variety is considered practically immune to superficial scald in a thirty-dayperiod. In local studies, it was observed scald fruits in only one of thirty seasonsafter 100 to 120 days of storage under RA conditions.
4.1.5. Red Bartlett Pears
4.1.5.1. Red Bartlett Better known as Max Red Bartlett in many other parts of the words, it was dis-covered as a Bartlett sprout mutation, by 1938 in Washington, USA. The fruit ispyriform, similar to the original variety but with smaller size. The stem is shorterthan Bartlett standard stem, partially woody and pretty curved. The skin is smooth,partially covered with violet-red turning to carmine colour by the harvest time andmore intense on the more exposed to sun face. The colour is quite uniform amongall fruit of the tree, although sometimes there is a reversion tendency. The flesh iscreamy white, aromatic, very juicy slightly acidic, with fine and compact textureand slightly granulated near to carpel loculus areas where might appear a fewstone cells. This pear also presents all organoleptic characteristics of green Bartlett(Baldini and Scaramuzzi, 1982; Iglesias and Almacelles, 1992; Lombard, 1987;Morettini et al., 1967; Stebbins, 1990; Sugar, 1991; Sugar and Lombard, 1989).
Requirements for harvest and storage. Red Bartlett matures seven to ten daysafter Bartlett when fruits present an average age of 115 days. Other requirementsare 60 to 64 mm of diameter, 8.5–9.5 kg/cm2 of firmness, RI higher than 10%,3–4 g/l of malic acidity and 20 to 25% of starch degradation. Frequently duringwarm summers when harvesting approaches it is possible to observe a reductionon colour intensity and surface area covered by red colour. This variety toleratesthe same RA and CA conditions that are used for Bartlett, but for shorter period(Benitez, 1998).
Diseases and disorders. Red Bartlett is sensitive to the same diseases and disor-ders than Bartlett variety. However, the risk is greater for Red Bartlett, becausetheir tissues are more delicate and their shelf life is shorter.
4.1.5.2. Red SensationThis pear is also known as Sensation and is a mutation from Red Bartlett, obtainedin Australia in 1940. Despite this clone blooms by the same time, it matures laterthan Max Red Bartlett does. The characteristics of the fruits are also similar withthe exception of colour. Red Sensation presents a more intense colour on a greater
276 C. E. Benitez and N. A. Pensel
surface area and is subjected to a possible reversion (Iglesias and Almacelles,1992; Lombard, 1987; Sugar, 1991; Sugar and Lombard, 1989). This pear maturesat an age of 120 days, 3 to 5 days later than Red Bartlett. If they are mixed,it results difficult to differentiate between them. The conditions required for a suc-cessful storage and susceptibility for disease and disorders are similar to Red Bartlett.Despite Neri et al. (1998) cited Italian cases of superficial scald and soft scald; inPatagonia region there have not been observed these alterations in Sensation pears.
4.1.5.3. Williams RoséeDerived from an individual sprout mutation on a Bartlett tree, this pear was obtainedin Washington, USA in 1938. Fruit shape, size and organoleptic characteristicsare similar to its predecessor attributes (Morettini et al., 1967). Williams Roséebehaviour was compared with Red Bartlett and Red Sensation along five seasons.Williams Rosée presents similar colour, reversion risks and conditions for harvestingand storage, however the optimum harvest time is located between the two citedclones (Benitez, 2001).
4.2. Middle season pears (Table 5)
This group includes great part of varieties grown in Patagonian valleys, integrating44% of national pear production. A distinct place is occupied by Packham’s Triumphthat contributes with 34%. Very far from this percentage Beurré D’Anjou accountfor 8,5% of national pear production. All varieties of the group are green pearswith the exception of Red Anjou. These pears mature from last week of Januaryup to last week of February. Harvesting aptitude indexes, storage requirements,and susceptibility to diseases and disorders varies among varieties. Generally thesepears tolerate longer storage periods.
4.2.1. Beurré D’Anjou
This variety is usually known as Anjou in USA. This pear is considered to haveoriginated by the middle of XIX century. Some authors locate the origin of thisfruit in Belgium and others in the vicinity of Angers, centre part of France. Thefruit is pyriform, short and globular with a wide base. This pear has a medium tobig size, 270 to 285 g of weight, 85 mm of height and 80 mm of diameter. Thestem is short, thick and slightly fleshy, and the calyx is open. The skin is thin anddelicate, with a light green colour and numerous notable lenticels. There is no changeto yellow colour as they ripen. The flesh is creamy white, aromatic, juicy, sweetslightly acidic, with buttery and slightly grtty texture and variable organolepticquality (Baldini and Scaramuzzi, 1982; Hedrick, 1921; Morettini et al., 1967;Stebbins, 1990; Tacchini, 1967).
Requirements for harvest and storage. In Patagonia valleys, this variety occupiesthe third place in local pear production. The pear matures around January 25, whenthe fruit have an average age of 129 days, 7–7,5 kg/cm2 of firmness, 10–11% ofRI, 3,5–4 g/l of malic acidity and 20 to 25% of degraded starch.
Harvest and Postharvest Conditions for Apples and Pears 277

Anjou has a very good storage tolerance not only under RA conditions but alsounder CA environment. Under RA using –1 °C to –0.5 °C and 92 to 94%, this varietycan maintain its good conditions for five to seven months, depending on the maturitystage by the time of harvest. Under CA at –0.5 °C tolerates ULO.
Diseases and disorders. Anjou pears are sensitive to mechanical injuries, sunburnand sunscald. Also they are susceptible to physiological disorders related with lowlevels of calcium such as black end, alfalfa greening, especially Anjou pit or corkspot. These disorders are aggravated by water stress and nutritional unbalanceof other element with respect to calcium, particularly in N excess conditions(Kupferman, 1994, 1995).
During storage under any kind of atmosphere, this pear is susceptible to super-
278 C. E. Benitez and N. A. Pensel
Table 5. Maturity conditions to begin harvesting, storage conditions and disorders susceptibility formiddle season pears. Northern Patagonia valleys, Argentina.
Características B. Anjou – P. Abate Beurré D. du Confé- Général R. Anjou Triumph Fetel Bosc Comice rence Leclerc
DAFB 127 138 138 138 139 138 138129
Firmness (kg/cm2) 00.7–7.5 007–8 005.5–5.8 5.5–6 005–5.5 06–7 05–5.5RI (%) 010–11 0010–11 >11 >12 >12 >11 12–13Malic acidity (g/l) 3.5–4 3.5–4 2.5–3 002–3 2–3 02–3 2.5–30Starch degrad. (%) 020–25 0 20–30 0030–40 0025–35 20–30 20–30 20–40
RA storage
Temperature °C –0.5/–1 0/–1 –0.5 –0.75 –0.5/+0.5 –0.5/+0.5 –0.5/+0.5Period (months) 05–7 006–7 003–4 004–5 4 06–8 3–4
CA storage
Temperature °C –0.5 –0.5 –0.5/0 –0.5/0 – – 0% O2 2 1.5 002–3 2 2 – – 2–3% CO2 1.5 1 001–2 1.3 0001–1.3 – – 2–3Period (months) 7–8 008–9 005–6 006–7 – – 3–4
Postharvest Cork spot, Superfic. Bruises, Bruises, Bruises, Superfic. Superfic. diseases and hard and scald, heterogen mechanic core scald, scald, disorders black end, stem maturity, injuries, break- core decays
black speck, shrivel., stem stem down, break-bruises, decays shrivel., shrivel., decays down, sunburn, soft scald, core and decayswater stress, internal internal CO2 injur, break- break-senescent down, CO2 down,scald, injury, senescent superfic. senescent scald, scald, scald, decaysdecays decays
DAFB: days after full bloom; RI: refractometric index; RA: regular atmosphere; CA: controlledatmosphere.

ficial scald, senescent scald, bitter pit and any kind of disorders related with calciumdeficit. This variety is also sensitive to decay and very especially to decay origi-nated by Botrytis sp. The fungus penetrates trough stem distal end. The entranceis favoured by the stem characteristics that are short, thick and fleshy. Afterpenetration Botrytis sp quickly invades the fruit flesh and some times develops whatis usually called ‘Botrytis nests’. These ‘Botrytis nests’ are formed between closefruits inside the package. The nutritional balance and the harvest season affect theimportance level of any of these problems; thus preventive treatments are neces-sary. Low oxygen levels increase Anjou susceptibility to CO2. This sensitivity variesfrom one season to the other and the damage produced is represented by the presenceof a dry and firm tissue extended from the core surrounding area to the flesh (Benitezand Calvo, 2002).
When storage had been performed under different gaseous mixtures, usuallysmall black spots appear on the skin surface. These spots are known as blackspecks. Lee et al. (1990), studied the characteristics of this disorder and observedquantitative differences on malic acid levels. The levels of malic acid, dry matterpercentage and soluble proteins are higher in damaged than in healthy tissues.The authors attributed the development of this disorder to the possible stressoccurred before harvesting, that affect the fruit resistance to tolerate low oxygenatmospheres.
4.2.2. Red Anjou
There are two known clones originated at Oregon, USA. The first, Red AnjouGebhard Medford appeared in 1950. The second was found in Pakdale and it wasnamed Columbia Red Anjou. The fruits are smaller but maintain the original varietyshape. The skin is red with bronzed reflections and a light streaky covering between75 to 100% of surface areas. The flesh characteristics, harvest requirements andstorage conditions are coincident with those for green Anjou (Iglesias andAlmacelles, 1992; Lombard, 1987; Sugar, 1991; Sugar and Lombard, 1989; Stebbins,1990).
Requirement for harvest and storage. This variety was introduced to the regiontwo years ago. And it still do not occupy important land surfaces. Generally, treeshave low production, the fruit has late coloration and frequents problems to acquiregood size, and during warm season the skin red colour is more opaque than usual.Red Anjou matures 2 to 5 days after Beurré D’ Anjou. Conditions for harvestingand storage are similar to the required for green Anjou.
Diseases and disorders. Red Anjou is susceptible to disorders related to calciumlevels, bruising, shrivel and fungus attacks through wound or stem distal end.
4.2.3. Packham’s Triumph
It was originated in Australia by 1896–1897. This fruit is pyriform, having a shortand wide base. It has a midi to big size, an average weight of 270 to 280 g, a
Harvest and Postharvest Conditions for Apples and Pears 279

height of 95 mm, a diameter of 75–80 mm and a surface covered by numerousprotuberances. The stem is long, curved and woody, with medium thickness, verticalinsertion and a stem cavity barely defined. The skin is light green that changes toyellow close to ripen stage, with numerous, dark and noticeable lenticels. Theflesh is creamy white, consistent, fine, aromatic, juicy, sweet slightly acidic and withvery good organoleptic quality (Baldini and Scaramuzzi, 1982; Hedrick, 1921;Morettini et al., 1967).
Requirement for harvest and storage. Although far away from Bartlett, Packham’sTriumph occupies the second place in local pear production importance. InPatagonian region Packham’s matures by the first week of February, 138 daysafter full bloom. Harvesting is initiated when the fruit reaches 7 to 8 kg/cm2 offirmness, 10–11% of IR, 3.5–4 g/l of malic acidity and 20 to 30% of starch degra-dation. This pear is quite resistant to handling.
This variety has good tolerance to storage (Retamales et al., 1997). Using atemperature of 0 to –1 °C and 92 to 94% of RH, fruits harvested in the right momentcan be stored in good condition during six to seven months. This behaviour makesunnecessary the use of CA to store them (Benitez, 2001). However, experiencescarried on in other parts of the word pointed out as adequate the following gaseousmixtures, 2 to 3% O2/1 to 2% CO2; 2 to 3% O2/4 to 5% CO2, and recommends tomaintain CO2 levels below 5% (Chapon and Westercamp, 1996; Masseron andTrillot, 1991).
Diseases and disorders. Packham’s pears are susceptible to superficial scald andstem shrivels. They also are sensitive to the entrance of Botrytis sp., through stemdistal end. But the longitude and structural characteristics of stem do not favour aquick passing of the fungi to the flesh like in Anjou case.
4.2.4. Abate Fetel
Its original name was Abbé Fetel and was found in Ródano Valley, Southern Franceby 1866. The fruit is elongated with gourd appearance, predominating the verticalaxis and a long and irregular neck. The fruit is big with 270 g of weight, 135 mmof height and 65 mm of diameter. The stem is short, thick, straight or slightly curvedwith an absent or barely defined stem cavity and the calyx is open. The skin isthin and smooth with little russeting in close to the calyx and stem areas. Epidermiscolour is light green to yellow with numerous more or less visible lenticels and some-times with faded pink colour on the more exposed to sun face. The flesh is white,consistent, fine, juice and with neutral flavour (Baldini and Scaramuzzi, 1982;Hedrick, 1921; Iglesias and Almacelles, 1992; Morettini et al., 1967).
Requirement for harvest and storage. In Patagonia Valleys, growing of this varietybegun a few years ago. The purpose of its cultivation was to satisfy contrary seasonmarket demand. This pear matures during the first week of February, 135 to 138days after full bloom. Harvesting begins with levels of 11% for RI, 2.5–3 g/l of
280 C. E. Benitez and N. A. Pensel

malic acidity and 30 to 40% of degraded starch. It is important to wait until fleshfirmness drops below 5.5 to 58 kg/cm2; higher values might alter maturation.
This variety tolerates from three to four months of storage under RA using0 °C to –0.5 °C and 92 to 94% RH. Under CA, there had been obtained better resultsworking with 2% O2 and 1.3% CO2 for a five to six months storage (Benitez,1997, 1998, 2001).
Diseases and disorders. Because of Abate characteristic shape, it is usually damagedduring normal pyriform fruits operations. This pear is sensitive to stem shrivels,decay and senescent scald. Under local storage conditions, the fruit does not presentneither superficial scald nor bitter pit symptoms. In local investigations it wasobserved a heterogeneous maturation of fruit during storage and while large areasof the surface turn to yellow, some parts remain green. The green zones later becamedark, being the previous step for internal breakdown. These symptoms were presentunder CA with low oxygen levels, and their frequency differ from one year to anotherand are coincident with those reported by Dur·n Torrellardona (1982) for soft scald.Considering the importance that little by little this variety acquires, it is necessaryto study the particularities of this disorder.
4.2.5. Beurré Bosc
This pear, also called Kaiser Alexander, Imperatore Alessandro or simply Bosc,was found in France by the end of 18th century. The fruit has a medium to bigsize, 250 to 255 g of weight, 108 mm of height and 75 mm of diameter. Bosc hasa gourd-shape; a long apex and a pyriform slightly flatten base with well-definedlobules that sharpen through the stem zone. The stem is thin, long, flexible, slightlycurved, more or less vertically inserted and without a stem cavity. The calyx isgenerally open and the skin is rough, with most of surface covered by russeting. Theskin colour is dark green that turns to an attractive golden yellow when ripens.The flesh is white yellowish, slightly fine, moderately granulated through the core,sweet, rather consistent and with excellent flavor (Baldini and Scaramuzzi, 1982;Burkart, 1989; Hedrick, 1921; Morettini et al., 1967; Schwarz, 1991; Stebbins, 1990;Sugar, 1991a).
Requirement for harvest and storage. Rather extended in Europe and USA,Beurré Bosc was cultivated in the Patagonia in the early 70s. Its importance wasdiminishing until the beginning of the 90s when there was intents to reintroducethe variety. However for different reasons there are only a few hectares planted.Bosc matures by February 10 to 12, 136 to 138 days after full bloom. Harvestingbegins when the fruit present the following index, 5.5 a 6 kg/cm2 of firmness,12 or higher percentages of RI, 2–3 g/l of malic acidity and 25 to 35% of starchdegradation.
Storage is well tolerated by this variety. When the fruit is harvest at prime time,they can be storage for four to five months under RA using 0 to –1 °C and 92 to94% RH. Under CA conditions, local test obtained good results using the fol-
Harvest and Postharvest Conditions for Apples and Pears 281

lowing gaseous mixtures, 2% O2/1% CO2; and 2% O2/1.3 to 1.5% CO2 for six toseven months (Benitez, 1997, 2001).
Diseases and disorders. If precautions for manipulating long neck fruits are taken,this pear is resistant to handling. If precautions are not taken, the level of brokennecks and bruising might be important. When the RH of the cooling chamber isinsufficient, Beurré Bosc fruit is very susceptible to stem shrivels. Decay, core break-down and senescence scald are probable when late harvest or prolonged refrigeratedstorage occurred.
4.2.6. Doyenné du Comice
This French variety was obtained in 1849 and is pretty much expended throughoutEurope and USA. Despite Doyenné du Comice is the proper name, this pear isusually known as Decana del Comizio or simply Comice. The fruits are pyriform,big with a wide base, 270 to 280 g of weight, 105 mm of height and 85–90 mmof diameter. The stem is medium to short, thick, fleshy and straight, and the calyxis semi-open. Comice handling sensitive skin is thin and smooth with light greencolour, slightly pink on the more expose to sun face and with numerous small earthylenticels. It might appear some russet spots surrounding the calyx. He flesh is creamywhite, fine consistent, sweet slightly acidic, aromatic, modestly granulated sur-rounding the core, and with very good organoleptic quality (Baldini and Scaramuzzi,1982; Gorini, 1984; Hedrick, 1921; Iglesias and Almacelles, 1992; Masseron andTrillot, 1991; Morettini et al., 1967; Stebbins, 1990).
Requirement for harvest and storage. In Patagonian valleys, Comice growing isnot very extended and the existing orchards are still very young. This pear maturesat the beginning of February, 138 to 139 days after full bloom. Thus the fruit presents5 to 5.5 kg/cm2 of firmness, IR values higher than 12%, 2–3 g/l of malic acidityand 20 to 30% of degraded starch. These harvest conditions are quite similar to thoseestablished for Western European countries.
In those countries and USA, it is generally recommended –0.5 °C to +0.5 °Cand 92 to 94% RH as the necessary conditions for four month of storage underRA. To storage the fruit for five to six months under CA, the advised gaseousmixtures are 2 to 3% O2/3 to 4% CO2 or the same O2 level with a CO2 level from0.8 to 5%. Oxygen levels lower than 2% and CO2 levels equal or higher than 5%are considered as risky values (Chapon and Westercamp, 1996; Gorini, 1984;Herregods, 1992, 1994; Mitcham et al., 1999; Richardson and Sugar, 1993; Schwarz,1990a).
Diseases and disorders. To maintain the Comice optimum quality is required imme-diate refrigeration. This variety has high sensitivity to handling and intermediatesusceptibility to superficial scald. When late harvest or prolonged refrigerated storageoccurred, Comice is also susceptible to decay, core breakdown and senescence scald(Herregods, 1992, 1994).
282 C. E. Benitez and N. A. Pensel
4.2.7. Conférence
This English variety appeared by 1885 and is rather extended in Europe. The fruithas medium to big size, 225 to 230 g of weight, 105 mm of height and 70–75mm of diameter. Conférence has stretched pyriform shape with log neck and a globe-shaped base. It might present deformities when pollination had been insufficient.The stem has a medium size and the calyx is open. The skin has light green colourand is thick, a little thinner in warm climates, consistent, slightly rough, with somerusseting in surrounding calyx areas that can be extended as irregular spots to therest of surface fruit. The flesh is white yellowish, modestly fine, rather consistent,very sweet and aromatic (Baldini and Scaramuzzi, 1982; Gorini, 1984; Richardsonand Sugar, 1993; Mitcham et al., 1999; Herregods, 1992; Chapon and Westercamp,1996).
Requirement for harvest and storage. Conférence begun to be cultivated in PatagoniaValley a few years ago and in small surfaces. These pears mature at the beginningof February, 138 days after full bloom. Harvesting stars when the fruit attain 7 kg/cm2
of firmness, RI values higher than 11%, 2–3 g/l of malic acidity and 20 to 30%of degraded starch.
There are not results from local experience yet, however international literatureremark the satisfactory adaptation of this variety. Despite the fact that particular con-ditions varies from one country to another, it is generally recommended –0.5 °Cto +0.5 °C and 92 to 94% RH for early harvested and immediately refrigerated fruitsto be stored for a long period (180 a 200 days) under RA. For pears stored underCA, the advised gaseous mixtures for a six to seven months period are 2 to 3%O2/3 to 5% CO2 and 2% O2/1.5 to 2% CO2. However, in some regions it is con-sidered that the season conditions influence CO2 susceptibility when its concentrationexceeds 2% working under LO or ULO. In those cases the characteristics symptomsare internal browning and cavities on fruit flesh (Chapon and Westercamp, 1996;Gorini, 1984; Herregods, 1992, 1994; Masseron and Trillot, 1991; Recasens et al.,1997; Schwarz, 1990b).
Diseases and disorders. This pear is quite resistant to handling, but susceptible tosuperficial scald, decay, core breakdown and senescence scald when late harvestor prolonged refrigerated storage occurred.
4.2.8. Général Leclerc
Général Leclerc is a descendant of Comice and was obtained in France by 1950.At the beginning this variety attract a lot of attention because of its rapid entranceto production, high productivity and remarkable organoleptic quality. However,lately this pear planting stops due to a series of inconveniences such as, tendencyto alternating bearing, premature falling of fruits, high sensitivity to fire blight,susceptibility to decay, production heterogeneity and important damages causedby birds (Bellini, 1991; Sansavini, 1990). The fruit has big to very big size and is
Harvest and Postharvest Conditions for Apples and Pears 283

very heterogeneous, pyriform, globe shaped, with a rather irregular and flattens baseand a longitudinal very delimited crease. The stem is short, thick and fleshy. Theskin is rather resistant to handling, with a green yellowish colour that turns to bronzewhen ripens. It is cover by russeting with spattering aspect. The flesh is whiteyellowish, very juicy and aromatic and with fine and consistent texture and excel-lent organoleptic quality (Sansavini, 1990).
Requirement for harvest and storage. In Patagonia, Général Leclerc productiondid not pass the experimental stage. However, the high productivity of this variety,even in its young stage, allowed determining the requirement for harvest and storageduring that time. This pear matures around February 10 and harvesting is accom-plished when the fruits have a firmness of 5 to 5.5 kg/cm2, a RI higher to 12–13%,a malic acidity of 2.5–3 g/l and a 20 to 40% of degraded starch. There were obtainedgood result using storage conditions recommended by the international literature.Under RA using –0.5 °C to +0.5 °C and 92 to 94% RH it was possible to storefruit in good condition for three to four months and also under CA applying 2 to3% O2 and 2 to 3% CO2 (Benitez, 2001; Chapon and Westercamp, 1996; Masseronand Trillot, 1991).
Diseases and disorders. Général Léclerc is susceptible to decay during storage, espe-cially by Botrytis sp. and its entrance modality through the stem.
4.3. Late varieties
In the past, late varieties had certain presence in Patagonia pear production. However,in the present days late varieties, also known as March varieties, account for merely1% of total national pear production. Nowadays only Winter Bartlett y WinterNelis cultivars are grown, but their decline continues, especially for Winter Nelis(Table 6). Two decades ago Passe Crassane was cultivated in the region, howeverit has practically disappeared.
4.3.1. Winter Bartlett
This variety is very productive, auto-incompatible despite the low percentage ofparthenocarpics fruit. The fruit has medium to big size is pyriform with a verydistinct waist and an oblong base. The stem is long and rather thick. The calyx issemi-open, the surface is modestly rough with protuberances and the skin is con-sistent, thick and opaque. The skin has light green colour that turn to yellow whenripens and very notable and prominent lenticels. The flesh is creamy white, veryjuicy and sweet slightly acidic and with good flavour (Hedrick, 1921; Tacchini,1967).
Requirement for harvest and storage. In Patagonia region this variety matures bythe last week of March, 163 days after full bloom. The maturity conditions are similarto Bartlett requirements, but Winter Bartlett maintain its firmness for more timeand tolerates without problems five to six months of storage under RA.
284 C. E. Benitez and N. A. Pensel

Diseases and disorders. This pear is susceptible to Botritys sp. attacks throughthe stem. However due to its long stem rarely the fungus reaches the fruit beforeripening.
4.3.2. Winter Nelis
This pear is very productive and auto-incompatible. The fruit has a medium tosmall size and is conical pyriform slightly stretched. The calyx is open and theskin has light green colour that turns to yellow when ripens with notable lenticels.The flesh is creamy white, very juicy, sweet slightly acidic and with stone cellsurrounding the core (Hedrick, 1921; Tacchini, 1967). In Patagonian valleys, WinterNelis matures by the last days of the first week of March, 166 days after fullbloom.
4.4. Asian pears or nashi
There is a botanical difference between Nashi (Pyrus serotina = Pyrus pyrifolia) andEuropean pears (Pyrus communis) (Table 6). The shape is different, Nashi fruitsare not pyriform but globe-shaped or spheroidal, and the size is medium to big orvery big. The calyx does not have the characteristic sepals of any European varietyand the fruits are able to satisfactory complete its maturation on the tree. Thereare two types of fruits, bronzed skin fruits that correspond to the original type andthe yellow or greenish skin fruits that have characters incorporated by hybridisa-tion with other species. The flesh of Asian pears is consistent, very juicy and sugary,with a weak acidity and with low aroma. The Occidental consumers accustom tothe European pears find Nashi pear as a distinctive fruit with specific criteria todetermine its optimum harvest time and storage aptitude (Lombard, 1987; Masseronet al., 1988; Sansavini et al., 1997).
Different varieties of Asian pears were introduced in our region, but nowadaysthe planting is reduced to three varieties, Shinseiki (New Century), Nijisseiki (XXCentury) and Hosui (Abundance). All these varieties have fruits with global flattenshape, medium to big size. Shinseiki and Nijisseiki skin is green yellowish, smoothand susceptible to bruising. Hosui skin has bronzed colour that became golden whenripens, with very notable lenticels.
Requirement for harvest and storage. The three varieties matures in February, Hosuiand Shinseiki between February 5 to 7 and Nijisseiki by the middle of February.They are harvested when the fruit reaches 3.5 to 4.5 kg/cm2 of firmness, up to15% of RI, 2 to 3 g/l of malic acidity and more than 75% of degraded starch (Benitez,1997).
The RI and evolution of skin coloration are good indexes to determine maturityof the fruits. Both indexes and the relation between them vary depending on theposition of the fruit in the tree (Lombard, 1987; Masseron et al., 1988). To evaluatethe progressive skin colour changes different colour charts are used. One chart forclear skin varieties that turn from green to green-yellowish colour and other chart
Harvest and Postharvest Conditions for Apples and Pears 285
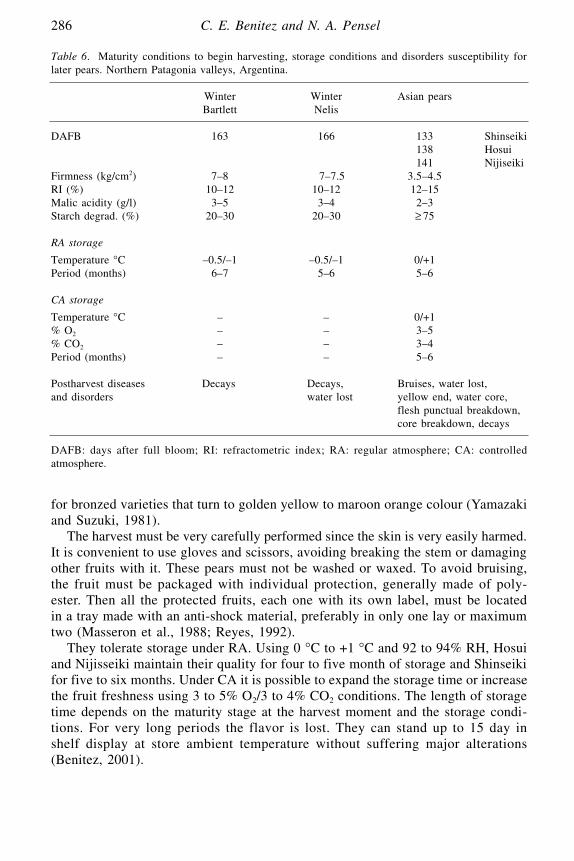
for bronzed varieties that turn to golden yellow to maroon orange colour (Yamazakiand Suzuki, 1981).
The harvest must be very carefully performed since the skin is very easily harmed.It is convenient to use gloves and scissors, avoiding breaking the stem or damagingother fruits with it. These pears must not be washed or waxed. To avoid bruising,the fruit must be packaged with individual protection, generally made of poly-ester. Then all the protected fruits, each one with its own label, must be locatedin a tray made with an anti-shock material, preferably in only one lay or maximumtwo (Masseron et al., 1988; Reyes, 1992).
They tolerate storage under RA. Using 0 °C to +1 °C and 92 to 94% RH, Hosuiand Nijisseiki maintain their quality for four to five month of storage and Shinseikifor five to six months. Under CA it is possible to expand the storage time or increasethe fruit freshness using 3 to 5% O2/3 to 4% CO2 conditions. The length of storagetime depends on the maturity stage at the harvest moment and the storage condi-tions. For very long periods the flavor is lost. They can stand up to 15 day inshelf display at store ambient temperature without suffering major alterations(Benitez, 2001).
286 C. E. Benitez and N. A. Pensel
Table 6. Maturity conditions to begin harvesting, storage conditions and disorders susceptibility forlater pears. Northern Patagonia valleys, Argentina.
Winter Winter Asian pearsBartlett Nelis
DAFB 163 166 133 Shinseiki138 Hosui141 Nijiseiki
Firmness (kg/cm2) 7–8 007–7.5 3.5–4.5RI (%) 10–12 10–12 12–15Malic acidity (g/l) 3–5 3–4 2–3Starch degrad. (%) 20–30 20–30 ≥ 75
RA storage
Temperature °C –0.5/–1 –0.5/–1 0/+1Period (months) 6–7 5–6 5–6
CA storage
Temperature °C – – 0/+1% O2 – – 3–5% CO2 – – 3–4Period (months) – – 5–6
Postharvest diseases Decays Decays, Bruises, water lost, and disorders water lost yellow end, water core,
flesh punctual breakdown, core breakdown, decays
DAFB: days after full bloom; RI: refractometric index; RA: regular atmosphere; CA: controlledatmosphere.

Diseases and disorders. Nashi fruits are very sensitive to external aggressions dueto climatic accidents, chemical products, cultural labours, bird attack, etc. Under dif-ferent conditions, calcium salts and captan might provoke skin spots and fruitdeformation. They are susceptible to hard end, especially when soil pH is low andthe fruit is calcium deficient. Also these pears are sensitive to water core that is aserious defect present in late harvested fruit and associated to water or nutrientdeficit. Some times it can be detected some dark dots in the flesh, close to thevascular region that deteriorate the fruit flavor and its origin remains unknown.
During storage, the Asian pears are sensitive to superficial scald, punctual fleshand core breakdown and decays. They also are susceptible to Botrytis sp. attackthough the stem.
5. CONCLUDING REMARKS
The harvest and postharvest behavioural studies for different apples and pearsvarieties allow taking decision about different aspects related to continuous qualityenhancement.
During recent years preference habits of apples and pears consumers have changedin respect not only to the variety preference but also to the valorisation of fruitcharacteristics. Important advances in fruit genetic have accompanied this interest.This development has allowed offering internationally new varieties and clones toa market that is constantly demanding quality and product innovation. An appro-priated environment and application of modern growing preharvest and postharvesttechnologies contribute to the variety potential full expression. In a globalise-tradingenvironment, Patagonia region, traditionally an exporting region, cannot turn awayfrom international commerce tendencies. This makes imperative to diversify theregion pears and apples offer. And precisely that had been the objective of theprogram which results are summarised in this chapter. However in a region withvery favourable environment for pear growing, some apple varieties like Elstarand Jonagold could not adapt and had been excluded. In Fuji case, new clones arestill investigated to satisfy the overcolour characteristics required. For pears, Bartlett(or Williams) continues being the most important variety, like in other parts ofthe world. However, some varieties such as Abate Fetel, some red Bartlett typeapples, Red Anjou with less important amount and a limited Nashi group had beengrown in the last few years. While Forelle, Comice and Conference are still inthe study and adaptation period.
In the international context, the varieties offer increase. Moreover, intense studiesare been conducted to develop new rootstocks for both species, and some of thesedevelopments have been probed in Patagonia region with more or less success.And new training systems adaptable to different cultivation areas have also beendeveloped.
A correct harvest date selection and particular storage condition for each specieand cultivar assure longer fruit shelf life, preserving its intrinsic attributes. On theother hand, a wrong decision will shorten the shelf life, reduce its quality andincrease the susceptibility to storage disorders and diseases. To facilitate variety
Harvest and Postharvest Conditions for Apples and Pears 287
characterisation and comparison of result obtained in different regions and coun-tries, it would be interesting to establish universal and variety selective parameters.
From another point of view, day by day increase fresh fruit demand, privilegingtheir aspect and organoleptic quality. To achieve today consumer satisfaction hadbeen necessary to change concepts and guidelines about the ideal harvest time.Increasing permanence of fruits on the tree or in other words harvesting moreripen fruits is possible to improve aroma, taste and texture compare with earlierharvest. These consumer preference changes forced to reorient the conservationsystems and its objectives (Benitez, 1998). Not always conventional physicochem-ical determinations can express numerically the magnitude of the differencesaffecting sensory senses, especially product aroma, taste, juiciness and crispiness.Studies oriented to determine objectively the subjective appreciation are expectedto suggest more universal quality indexes (Trillot et al., 1993).
In respect to techniques utilised for maturity evaluation, there is a definitetendency toward non-destructive maturity indexes that allows accomplishing severalmeasurements over the same fruit without damaging it. Research is oriented to searchfor fast methods to externally evaluate internal quality. In this sense, acoustic,optic, photographic and magnetic resonance techniques demonstrated an effectiveevaluation of internal characteristics and maturity of fruits in only one measurement.The possibility to incorporate the same technique to sorting and sizing packinglines would allow separation of diseased from healthy fruits and mature from greenfruits, assuring homogeneous lots (Chen, 1994; Moras et al., 1998; Peirs et al., 1999;Ruiz and Valero, 1998; Sinnaeve et al., 1999; Tollner et al., 1993). Despite thefirst sorting and sizing packing lines with these characteristics had appeared, researchmust continue through the improvement of the techniques and the reduction of thehigh cost of its implementation.
Present demand of pears and apples for fresh consumption with absence guar-antied of toxic residues and contaminant substance determined the implementationof good agricultural practices (GMP). This new soft technology favour expressionof all specific characteristics of varieties. The improvement of these techniques ispermanently developing and the programs that emphasise product differentiation(integrated production, organic production, etc.) had been implemented in all worldproductive zone.
During many years, refrigerated storage was oriented to keep initial fruit qualityfor a more or less prolonged period. Nowadays, it is emphasise the importance ofrefrigeration as an alternative technique to the use of chemical substance to controlthe principal storage disease and disorders. With this triple objective in mind, newtechniques for storage under controlled atmosphere (CA) have being incorporated.These are the treatments performed at the beginning of storage like pre-treatmentswith CO2 and Initial Low Oxygen Stress (I.L.O.S.) technique. Also during storage,application of CO2 shocks or modulated systems (different gaseous mixturesthroughout storage period) had satisfactory results under certain conditions. Controlof ethylene level in chamber is used as a cooling adjuvant and to reduce posthar-vest diseases and disorders risk (Chapon and Westercamp, 1996).
During next years, genetic engineering is expected to offer new varieties that con-jugate most of the following characteristics: exceptional organoleptic quality,
288 C. E. Benitez and N. A. Pensel

prolonged storage aptitude and low storage disease and disorders susceptibility(Herregods, 1997).
To assure a quality product new development in refrigeration technology areexpected. However, to guarantee its success many efforts must be done to avoid coldchain interruptions in critical points. This chain, very effective in the first links,has its weakest point from the moment that the fruit arrives to retail store until itsconsumption. Then, this commercialisation step is the most needed of training ingood handling practices implementation.
Meanwhile, research continues orientated to understand the mechanisms thatinduce varieties susceptibility to different disease and disorders during storage incertain pears and apples. And in this way propose strategies to implement preven-tive control with soft technologies adjusted to a sustainable productive system.
ACKNOWLEDGEMENTS
We wish to acknowledge the expert and kind manuscript revision of Dr. Paul M.Chen (Professor Postharvest Physiology, Oregon State University, Mid-ColumbiaAgricultural Research and Extension Center, Hood River, OR 97031, U.S.A.); andthe comments and suggestion of Dr. Carlos A. Margaría (INTA researcher cur-rently working at USDA, Citrus & Subtropical Products Lab, Winter Haven, FL33881, U.S.A.).
REFERENCES
Baldini, E. and F. Scaramuzzi (1982). Il Pero. Reda Editorial, Italia, 280 pp.Baeza, C. and A. Konig (1989). Nuevas variedades de manzanas para Chile. Revista Frutícola 10: 17–22.Ballard, J. (1981). Granny Smith: An Important Apple for the Pacific Northwest. Wash. St. University,
Coop. Ext. Coll. Agric. Ext. Bull. 0814, 12 pp.Beach, S., N. Booth and O. Taylor (1905). The Apples of New York. N.Y. Agric. Exp. Sta. Vol. I.
J. B. Lyon Company, Albany, 409 pp.Bellini, E. (1991). Maturazione e raccolta dei frutti del pero. Informatore Agrario 18: 59–68.Benitez, C. E. (1997). Harvesting and Storing Non Traditional Pear Cultivars. 7th Intern. Symp. Pear
Growing, Talca, Chile, pp. 535–542.Benitez, C. E. (1998). Almacenamiento refrigerado de frutas frescas. Reorientación del manejo del
frío y sus coadyuvantes. Alimentación Latinoamericana 222: 36–46.Benitez, C. E. 2001. Cosecha y Postcosecha de Peras y Manzanas en Los Valles Irrigados de la
Patagonia. E. E. A. Alto Valle, INTA, RN, Argentina, 126 pp.Benitez, C. E., F. Duprat and E. Insúa (1996). Almacenamiento de peras y manzanas en atmósfera
controlada. Alimentación Latinoamericana 210: 27–33.Benitez, C. E., F. Duprat, M. Grotte, and E. Insúa (1993). Evaluation of Apple Quality Versus the
Fruits Position on the Tree. Intern. Symp. Cultivar Improv. Hort. Crops. and Peach Congress, Beijing,China, 16 pp.
Benitez, C. E., F. Duprat, M. Grotte and E. Insúa (1997). Fruit Placement on the Tree and Its Influenceon Maturity and Quality of Pears. 7th Intern. Symp. Pear Growing, Talca, Chile, pp. 527–533.
Benitez, C. E. and G. Calvo (2002). Fisiopatías y Pérdidas de Calidad en Manzanas y Peras. EdicionesINTA, Bs. As., Argentina (In press).
Blanchet, P. and T. Ramat (1995a). Comportement de la pomme Fuji. I. Coloration et russeting.Arboriculture Fruitiere 483: 21–26.
Harvest and Postharvest Conditions for Apples and Pears 289

Blanchet, P. and T. Ramat (1995b) Comportement de la pomme Fuji. II. Floration, développement etmaturité. Arboriculture Fruitiere 484: 17–20.
Blay Coll, J. (1988). Recolección y conservación de algunas variedades de pera. Fruticultura Profesional18: 79–87.
Boylston, T. and E. Kupferman (1992). Quality of Gala Apples as Influenced by Storage. Proc. Wash.Tree Fruit Postharvest Confer., pp. 15–17.
Burkhart, D. (1989). Russeted pears pose challenge for growers. Good Fruit Grower May: 1 and 9.Carrera, M. (1988). Variedades de peral. Fruticultura Profesional 18: 9–16.Castro, H. R. (1992). Cultivares de Manzano. Curso Internacional de Manzanas, INTA, EEA. Alto Valle,
RN, VI, pp. 1–13.Chapon, J-F. (1988). Comportement au froid de quelques variétés de pommes sous basse teneur
d’oxigène. Infos-Ctifl 41: 13–18.Chapon, J-F. (1991). L’entreposafe frigorifique des poires. Infos-Ctifl 76: 37–41.Chapon, J-F. (1993). L’entreposafe frigorifique des poires. Arboriculture Fruitiere 462: 30–34.Chapon, J-F. (1996). La qualité de la pomme et l’entreposage frigorifique. Pomme haute définition.
Fruits et Légumes, hors série, pp, 124–128.Chapon, J-F. and P. Westercamp (1996). Entreposage Frigorifique des Pommes et des Poires. Tomo
2: Conduite de la Conservation. Ctifl, Francia, 205 pp.Crowe, A. (1988). Apple Cultivars. Advisory Committee Tree Fruits, Atlantic Agr. Serv. Coordin. Com.
Pub-ACC-1205, 16 pp.Dayton, D. (1963). Variation in the Pattern of Red Color Distribution in the Skin of Delicious and
Starkimg Bud Sport Varieties. Wenatchee Exp. Sta., pp. 44–49.De Coster, J. (1990a). Nouvelles variétés des pommes. Fruit Belge 431: 207–210.De Coster, J. (1990b). Jonagold: une remarquable variété de pommes. Fruit Belge 432: 259–260.De Coster, J. (1990c). Jonagold et ses mutants. Fruit Belge 432: 279–284.Decourtye, L. and B. Lantin (1969). Contribution a la connaissance des mutants spurs de pommier:
hérédité du caractère. Ann. Amel. Plantes 19(3): 227–238.Durán Torrellardona, S. (1982). La Frigoconservación de los Frutos. Aedos, Barcelona, España,
363 pp.Eccher, P. and G. Spada (1993). Effect of picking date on quality and sensory characteristics of pears
after storage and ripening. Acta Horticulturae 326: 291–298.Elfving, D., A. Dale, K. Fisher, N. Miles and G. Tehrani (1990). Fruit Cultivars. A Guide for Commercial
Growers. Min. Agriculture and Food, Ontario, Canadá, 82 pp.Faedi, W. and P. Rosati (1984). First Evaluation of Apple Mutants Induced by Gamma Ray Treatments.
Eucarpia Fruit Confer., pp. 51–61.Fan, X., J. P. Mattheis, M. E. Patterson and J. K. Fellman (1995). Changes in amylose and total starch
content in Fuji apples during maturation. HortSci. 30(1): 104–105.Geoffrion, R. (1992). La déshydratation de la pomme Golden Delicious pendant sa conservation. Phytoma
442: 25–29.Goffings, G. (1997). Dégats de CO2 sur poires Conférence. Fruit belge 469: 172–173.Gorini, F. (1984). Conservation frigorifique des poires: Derniers progrès pour les variétés. Acta
Horticulturae 161: 39–46. Avignon, Francia.Hedrick, U. (1921). The Pears of New York. N.Y. Agric. Exp. Sta. Vol 2, Parte II. 636 pp.Herregods, M. (1992). Conservation et qualité des poires. Fruit Belge 445: 175–184.Herregods, M. (1993). Amélioration et conservation de la qualité des pommes après récolte. Fruit
Belge 445: 152–153. Herregods, M. (1994). La conservation des poires. Fruit Belge 451: 137–140.Herregods, M., G. Goffings (1993). Variability in maturity, quality and storage ability of Jonagold apples
on a tree. Acta Horticulturae 326: 59–64.Huet, J. (1967). Contribution à une meilleure connaissance des types spurs de pommiers. Pomol.
Française 9(4): 85–96.Huguet, C., P. Borioli and J. Manguin (1990). Relations Entre la Qualité Gustative de la Pomme Golden
et la Composition du Fruit, les Techniques de Fertilisation, Dans Les Vergers Conduits en ProductionIntégrée. 9ème, Colloque Rech. Fruit, Avignon, Francia, pp. 155–163.
290 C. E. Benitez and N. A. Pensel
Iglesias, I. (1989). Diversificación varietal. I – Las variedades rojas del grupo Red Delicious. FruticulturaProfesional 23: 3–17.
Iglesias, I. (1990). Diversificación varietal. II – Las variedades del grupo Golden Delicious y símiles.Fruticultura Profesional 29: 3–21.
Iglesias, I. (1991). Variedades de manzano: Situación actual y perspectivas. Fruticultura Profesional38: 4–22.
Iglesias, I. and J. Almacelles (1992). Ensayo sobre el comportamiento de 21 variedades de peral enla zona tardía de Lleida. Fruticultura profesional 49: 5–21.
Iglesias, I., R. Dalmau, J. Bonany and J. Carbo (1997). Comportamiento de diferentes cultivaresde los grupos Fuji y Braeburn en Lleida y Girona (Cataluña-España). Fruticultura Profesional 89:6–20.
Kikuchi, T, O. Arakawa and R. Norton (1998). Tecniche di miglioramento del colore delle mele Fujiin Giappone. Frutticoltura 3: 18–21. Translated by S. Sansavini of the Fruit Varieties Journal 51(2):71–75, 1997.
Kupferman, E. (1994). Anjou pear quality: I. Fruit quality. II. Postharvest practices. III. Disordersand diseases. Tree Fruit Postharvest Journal. Wash. St. University 5(1): 3–16.
Kupferman, E. (1995). Postharvest handling of Anjou pears. Tree Fruit Postharvest Journal. Wash.St. University 6(2): 3–8.
Kupferman, E. (1998). Postharvest practices for pears. Tree Fruit Postharvest Journal. Wash. St.University 9(1): 22–24.
Lee, S., P. Chen, N. Chen, D. Varga and E. Mielke (1990). Differences of biochemical componentsbetween the skin tissues of normal and black-speckled d’Anjou pears after prolonged low-oxygenstorage. J. Amer. Soc. Hort. Sci. 115(5): 784–788.
Le Lezec, M. and J. Babin (1976). La qualité de Granny Smith en relation avec les époques de cueil-lette. Pomologie Française 18 (5): 96–102.
Le Lezec, M., J. Babin and J. Michelesi (1983). Les Delicious Rouge. Ctifl, Francia, 67 pp.Le Lezec, M., J. Babin, J. Michelesi and J-M. Lespinasse (1983). Golden Delicious et ses Mutants. Ctifl,
Francia, 40 pp.Lespinasse, J-M. (1971). Quelques observations sur la colloration de l’épiderme de la varieté de pommier
Golden Delicious. INRA, Bull. Inform. 214: 26–29.Lidster, P., G. Blanpied and R. Prange (1990). Controlled-atmosphere Disorders of Commercial Fruits
and Vegetables. Agric. Canada Public. 1847/E. 58 pp.Lombard, P. (1987). Cultivo de Peras Rojas y Asiáticas. Universidad de Chile, Publ. Miscel. Agr.
No. 17, 54 pp.Marcelle, R. (1992). La composition minérale des poires et l’apparition de désordres physiologiques
durant la conservation. Fruit belge 439: 171–174.Masseron, A. and M. Trillot et al. (1991). Le Poirier. Ctifl, Francia, 217 pp.Masseron, A., M. Trillot, V. Mathieu and C. Tronel et al. (1995). Fuji. Ed. Ctifl, Francia, 58 pp.Mathieu, V., C. Tronel, J. Mazollier, A. Masseron and M. Trillot et al. (1998). Pink Lady®. Ctifl, Francia,
76 pp.Meheriuk, M. (1989). CA recommendations for apples. Intern. Contr. Atm. Res. Confer. 5o. Proc.(1):
257–284.Meheriuk, M. and W. McPhee (1986). Postharvest Handling of Pome Fruits, Soft Fruits, and Grapes.
Public, 1768E, Communic. Branch, Agric, Canada, 50 pp.Mellenthin,W., P. Chen and D. Borgic (1982). In-line application of porous wax coating materials to
reduce friction discoloration of ‘Bartlett’ and ‘d’Anjou’ pears. HortSci. 17(2): 215–217.Mitcham, E., C. Crisosto and A. Kader (1999). Apples Gala. Fuji. Golden Delicious. Granny Smith. Red
Delicious. Pears Anjou, Bosc and Comice. Pears Bartlett. Dept., Pomology, Un. California. Internet:Produce Facts.
Moras, Ph., J. Mazollier, M. Moreau, P. Westercam and C. Coureau (1998). La Pomme. Consommationet itinéraire qualité. Ediciones Ctifl, Francia, 109 pp.
Morettini, A., E. Baldini, F. Scaramuzzi and L. Mittempergher (1967). Monografia Delle PrincipaliCultivar di Pero. Cos. Nazion, Ricerche, Centro Miglioramento Piante da Frutto, Firenze, Italia,412 pp.
Harvest and Postharvest Conditions for Apples and Pears 291
Planton, G. and G. Ferré (1992). Pomme Gala. Un code couleur pour raisonner la qualité. Infos-Ctifl82: 39–42.
Plotto, A. (1992). Maturity indices for Gala, Fuji, and Braeburn, as Rrelated to Taste Tests. Proc. Wash.Tree Fruit Postharvest Confer., pp. 8–14.
Plotto, A., A. Azarenko, M. McDaniel, P. Crockett and J. Mattheis (1992). Eating quality of ‘Gala’and ‘Fuji’ apples from multiple harvests and storage durations. HortSci. 32(5): 903–908.
Porrit, S., M. Meheriuk and P. Lidster (1982). Postharvest Disorders of Apples and Pears. Public, 1737/E,Agric. Canadá, 66 pp.
Pratella, G. (1992). La maturazione complementare e la qualità delle pere. Frutticoltura 4: 71–74.Raese, T. (1989). Physiological disorders and maladies of pear fruit. Hort. Rev. 11: 357–411.Recasens, I. (1997). Atmósferas controladas-ULO en postcosecha de frutas. Fruticultura Profesional
90: 41–45.Recasens, I., D. Ganau, J. Graell, C. Larrigaudiere and L. Lopez (1997). Physiological and quality
responses of Conference pears to reduced levels of O2 under controlled atmosphere storage condi-tions. International CA Research Confer. Un. California. Proceedings 2: 258–263.
Retamales, J., R. Campos and D. Castro (1997). Ethylene Control and Ripening in Packham’s Triumph and Beurré Bosc Pears. 7th International Symposium on Pear Growing, Talca, Chile, pp.559–566.
Reyes, M. (1994). Manejo de cosecha y postcosecha de manzanas Braeburn. Rev. Frutícola 15(3):95–101.
Rizzolo, A., P. Eccher and F. Gorini (1989). Correlations between time of picking, ethylene produc-tion and other ripening indices at harvesting in Abate and Packham’s T. pears. Acta Horticulturae256: 205–212.
Rodriguez, R. and M. Rodriguez (1997). Efecto de la posición y del tipo de estructuras fructíferassobre la calidad del fruto de manzanos cv. Fuji en Río Negro y Neuquén, Argentina. FruticulturaProfesional 90: 10–12.
Rosati, P. and W. Faed (1975). Indagini sul melo. Osservazioni su 25 cloni spur di Red Delicious.Frutticoltura 2: 15–38.
Rosati, P., F. Gorini, W. Faedi and A. Sozzi (1977). Attitudine alla conservazione frigorifera di 25cloni di Delicious rosse. Frutticoltura 9: 29–36.
Sansavini, S. (1990). Stato e prospettive della coltura del pero in Italia. Frutticoltura 8/9: 41–72.Sansavini, S. (1998). Nuove mele per l’Europa. Frutticoltura 11: 11–38.Sansavini, S. (2001). La producción de peras en el mundo: Tendencias y perspectiva. II Curso
Internacional de pera. INTA, Alto Valle. General Roca RN, Argentina 1(1): 3–23.Sansavini, S. and C. Buscaroli (1997). Le cultivar di melo. Frutticoltura 4: 29–38.Schwarz, A. (1990a). Essai d’entreposage frigorifique de poires en atmosphère contrôlée. II – Doyenné
du Comice. Revue Suisse Vitic. Arboric. Hortic. 22(4): 265–267.Schwarz, A. (1990b). Essai d’entreposage frigorifique de poires en atmosphère contrôlée. III –
Conférence. Revue Suisse Vitic. Arboric. Hortic. 22(5): 307–310.Schwarz, A. (1991). Essai d’entreposage frigorifique de poires en atmosphère contrôlée. V – Beurré
Bosc. Revue Suisse Vitic. Arboric. Hortic. 23(3): 157–160.Siegrist, J. (1986). Dates de récolte des pommes de garde. Exemple de la Golden Delicious. Rév.
Suisse Vitic. Arboric. Hortic. 18(1): 39–44.Stainer, R. (1992). Nuevas variedades de manzano. Curso Internacional de Manzanas. INTA, Alto
Valle de Río Negro. III: 1–15.Stebbins, B. (1989). Maturity of new apple varieties. Good Fruit Grower in Oregon 40(15): 2 pp.Stebbins, B. (1990). La coltura del pero negli Stati Uniti: Miglioramento genetico, tecnica colturale e
difesa. Frutticoltura 819: 67–72.Stebbins, B. (1991). New apple varieties. Good Fruit Grower 40(1): 8–10.Stebbins, B., A. Duncan, C. Compton and D. Duncan (1989). Apple Variety Trial; 1988 Progress Report.
Oregon St. University Ext. Serv. 40 pp.Sugar, D. (1991a). Peras Bosc: Cultivo y Manejo Postcosecha. Curso Internacional de Peras. INTA,
Alto Valle, 6 pp.Sugar, D. (1991b). Características y Producción de Peras Rojas en Los Estados Unidos. Curso
Internacional de Peras, INTA, Alto Valle, 17 pp.
292 C. E. Benitez and N. A. Pensel
Sugar, D. and P. Lombard (d.u.) Characteristics and Production of Red Pears in the Pacific Northwest.Oregon St. University, 8 pp.
Tacchini, E. (1967). Descripción de Los Cultivares del Peral de la E. E. A. Mendoza. ColecciónAgropecuaria No. 15, INTA, Bs. As. 641 pp.
Trillot, M., A. Masseron and C. Tronel (1993). Pomme, Les Variétes. Ctifl, Francia, 199 pp.Trillot, M., A. Masseron, C. Tronel and V. Mathieu (1995). Gala. Ctifl, Francia, 63 pp.Tronel, C., M. Trillot, A. Masseron and V. Mathieu (1995). Braeburn. Ctifl, Francia, 52 pp.Viard, M. and J. Chapon (1976). Conservation des fruits de la variété de pommes Granny Smith produits
sous climat méditérranéen. Pomologie Française 18(5): 87–95.Warner, G. (1999). Pear varieties abound worldwide, a famous few. Good Fruit Grower Magazine
Online.Watkins, C., P. Brookfield and F. Harker (1993). Development of maturity indeces for the Fuji apple
cultivar in relation to water core incidence. Acta Horticulturae 326: 267–275.Westercamp, P. (1994). Pomme. Qualité et conservation des bicolores. Fruits et Légumes 121: 20–22.Westercamp, P. and J. Saint-Hilary (1993). Pomme. Qualité et conservation de la varieté Braeburn. Infos,
Ctifl 94: 33–36.Williams, M., H. Couey, H. Moffitt and D. Coyier (1978). Pear production. U.S.D.A. Agric. Handbook
526: 53 pp.Yamazaki, T. and K. Suzuki (1980). Color charts useful guide to evaluate the fruit maturation. Fruit
Trees Res. St. Serie A (7).Yoshida, Y. and Y. Katsurayama (1993). Melhoramento genético da macieira no Brasil: Perspectiva e
contribuiçao das cultivares japonesas. Agrop. Catarinense 6(4): 12–15.
Harvest and Postharvest Conditions for Apples and Pears 293

RAPID QUALITY EVALUATION TECHNIQUES OF HORTICULTURAL CROPS
HIDEKAZU ITONational Institute of Vegetable and Tea Science (NIVTS), Kusawa, Ano, Age, Mie 514-2392 Japan
1. INTRODUCTION
Non-destructive techniques can be used for quality evaluation and sorting of fruitsand vegetables as well as for measurement of critical selection traits in plant breedingprograms.
Many researchers have been working to find the techniques for evaluating externaland internal quality factors of fruits and vegetables non-destructively by measuringphysical, acoustic, electrical, optical, X-ray, fluorescent and nuclear magneticresonant properties (Dull et al., 1996; Hakim et al., 1999; Watada, 1989, 1995).
2. NEAR INFRARED SPECTROSCOPY
Techniques based on near infrared (NIR) measurements that is one of the opticalproperties have been evaluated for non-destructive assessment of soluble solids(Brix), dry matter, water content, acidity, firmness and so on and for rapid assess-ment of fiber, crude protein, crude fat, ash content and so on in horticultural products.The techniques are coming popular for measuring Brix of intact fruits becausethey can evaluate Brix rapidly, inexpensively and accurately.
2.1. Elementary knowledge on near infrared spectroscopy
Light emitted from the light source (Tungsten-Halogen lamp) enters a sample (forexample; fruit) and interacts with the sample. Some of the light exits the sampleto be collected by a detector. As angle between incident beam and the detectorwas wider, the optical density was higher (Dull et al., 1989b). The detectors madefrom Si and PbS have been used mainly for the visible and the beginning of near-infrared range (400 to 1098 nm) and for 1100 to 2500 nm, respectively. Thisoptical measurement is suitable for viable intact samples because it requires lowenergy, thereby minimizing tissue damage. A researcher claimed that the depth oflight penetration in apple was in the range 2–4 mm for light at all wavelengths inthe range 500–1900 nm using reflectance mode. But using a more direct and lessinvasive technique 1% light penetration in apple was 35 mm at 713 nm, reducingto less than 1 mm in the region 1400–1600 nm, where the strong water absorbancedominates. This results confirm the presence of a distinct ‘diagnostic window’ inthe 700–900 nm region (Fraser et al., 2001).
There are mainly three modes to measure NIR spectrum, namely, reflectance,transmission and interactance mode. Reflectance mode is mainly used to measure
R. Dris and S. M. Jain (eds.), Production Practices and Quality Assessment of Food Crops,
© 2004 Kluwer Academic Publishers. Printed in the Netherlands.
295
Vol. 3, “Quality Handling and Evaluation”, pp. 295–305.

spectra in the wavelength range 1100 to 2500 nm for low moisture samples.Transmission and interactance mode are mainly used to measure spectra in the wave-length range 400 to 1100 nm for intact fruit and vegetable that have high moisture.The three modes were compared for their ability to non-destructively estimate solublesolid content (SSC), density and internal flesh colour of the yellow-fleshed kiwifruit.Interactance mode provided the most accurate estimates of SSC, density and fleshcolour (Schaare and Fraser, 2000).
The acquisition of NIR spectra for a calibration sample set allows to establishcalibration models relating spectral data to quality indice. Before the models areestablished, the acquired raw spectra are subjected to a preprocessing step. This stepis very helpful in reducing the adverse effect of the physical sample structure onthe quantitative evaluation. There are four preprocessing methods mainly, deriva-tion, de-trending (Barnes et al., 1989), SNV (Standard Normal Variate) (Barnes etal., 1989) and MSC (Multiplicative Scatter Correction) (Isaksoon et al., 1988)(Extended Multiplicative Signal Correction) (Martens and Stark, 1991). Derivationis most popular in these four methods. The 2nd derivative can eliminate bias andslope from spectra. Two major methods of calculating derivative spectra are theSavitzky-Golay method and the Norris Segment-Gap method (Hopkins, 2001).
A laboratory-determined index value range of the calibration sample set shouldbe wide to obtain a good calibration. In addition, if laboratories are well knownas authoritative institutions for food analysis and have many years of experience,their analytical potential may differ considerably (Buning-Pfaue et al., 1998).
Two calibration methods are used mainly, their methods are Multiple linear regres-sion (MLR) and Partial least squares regression (PLS) (Centner et al., 1996; Geladiet al., 1986) in multivariate analysis. Bi-linear modelling tool, PLS, is equally applic-able for smooth and for non-smooth data (Martens and Martens, 2001).
The accuracy of the obtained calibration equations is decided by multiple cor-relation coefficient (R), standard error of calibration sample set (SEC), mean error(Bias), bias corrected standard error of prediction sample set (SEP), root mean square(RMS) and so on.
SEC is calculated as
SEC = square root (∑(Y – Y)2/(n – m – 1))
where Y = the laboratory-determined value for a sampleY = NIR-calculated valuen = the number of the samplesm = the number of independent variables
Such calibration models can be checked by using a prediction sample set.SEP is calculated as
SEP = square root (∑(d – b)2/(n – 1))
where d (difference) = (Y – Y)b (bias) = 1/n ∑ d
296 Hidekazu Ito
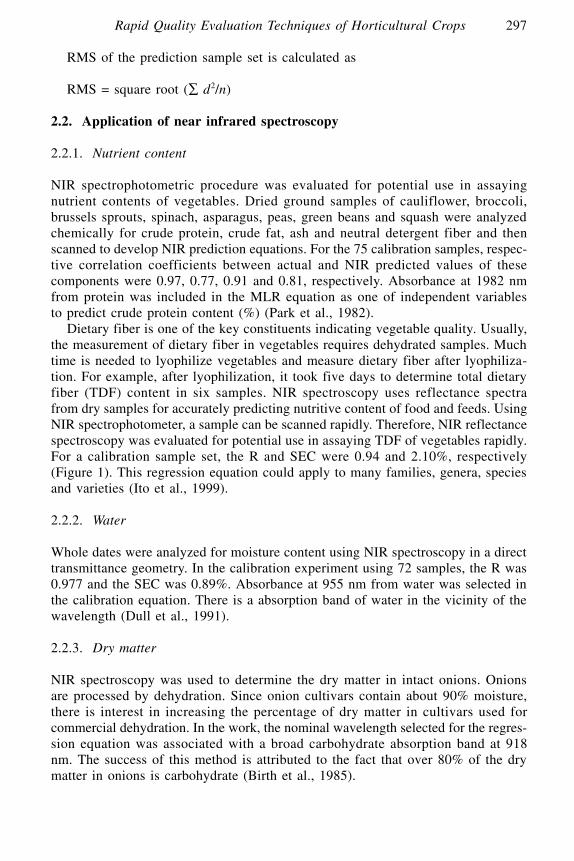
RMS of the prediction sample set is calculated as
RMS = square root (∑ d2/n)
2.2. Application of near infrared spectroscopy
2.2.1. Nutrient content
NIR spectrophotometric procedure was evaluated for potential use in assayingnutrient contents of vegetables. Dried ground samples of cauliflower, broccoli,brussels sprouts, spinach, asparagus, peas, green beans and squash were analyzedchemically for crude protein, crude fat, ash and neutral detergent fiber and thenscanned to develop NIR prediction equations. For the 75 calibration samples, respec-tive correlation coefficients between actual and NIR predicted values of thesecomponents were 0.97, 0.77, 0.91 and 0.81, respectively. Absorbance at 1982 nmfrom protein was included in the MLR equation as one of independent variablesto predict crude protein content (%) (Park et al., 1982).
Dietary fiber is one of the key constituents indicating vegetable quality. Usually,the measurement of dietary fiber in vegetables requires dehydrated samples. Muchtime is needed to lyophilize vegetables and measure dietary fiber after lyophiliza-tion. For example, after lyophilization, it took five days to determine total dietaryfiber (TDF) content in six samples. NIR spectroscopy uses reflectance spectrafrom dry samples for accurately predicting nutritive content of food and feeds. UsingNIR spectrophotometer, a sample can be scanned rapidly. Therefore, NIR reflectancespectroscopy was evaluated for potential use in assaying TDF of vegetables rapidly.For a calibration sample set, the R and SEC were 0.94 and 2.10%, respectively(Figure 1). This regression equation could apply to many families, genera, speciesand varieties (Ito et al., 1999).
2.2.2. Water
Whole dates were analyzed for moisture content using NIR spectroscopy in a directtransmittance geometry. In the calibration experiment using 72 samples, the R was0.977 and the SEC was 0.89%. Absorbance at 955 nm from water was selected inthe calibration equation. There is a absorption band of water in the vicinity of thewavelength (Dull et al., 1991).
2.2.3. Dry matter
NIR spectroscopy was used to determine the dry matter in intact onions. Onionsare processed by dehydration. Since onion cultivars contain about 90% moisture,there is interest in increasing the percentage of dry matter in cultivars used forcommercial dehydration. In the work, the nominal wavelength selected for the regres-sion equation was associated with a broad carbohydrate absorption band at 918nm. The success of this method is attributed to the fact that over 80% of the drymatter in onions is carbohydrate (Birth et al., 1985).
Rapid Quality Evaluation Techniques of Horticultural Crops 297
In the production and processing of potatoes, quality and yield of processedproducts are directly correlated with specific gravity and % dry matter. With thickslices and intact potatoes the R, SEC were –0.952, 1.28 and –0.918, 1.04, respec-tively (Dull et al., 1989a). Since soluble solids are mostly carbohydrate, thistechnology was examined to measure soluble solids in fruit and vegetable afterthat.
2.2.4. Brix
A refractometer is used to measure Brix of juice extracted from each fruit or bulb.There is spatial variation in Brix of fruits of apple, cantaloupe, grapefruit, honeydewmelon, mango, orange, pineapple and tomato and of bulbs of onion (Peiris et al.,1999).
MLR is one of the simple methods of predicting a dependent variable (Brix) fromindependent variables more than two. Interpretation of NIR models may be diffi-cult when dealing with models that involve many wavelength like PLS. But PLScan lead to good results (Carlini et al., 1998, 2000; Guthrie and Walsh, 1997,1999; McGlone and Kawano, 1998; Moons et al., 2000; Peiris et al., 1998a; Peirset al., 2000; Slaughter et al., 1996). Next, I refer to simple models. The combina-tion of absorbances in the vicinity of 908 and 880nm for Brix prediction has beenselected in melons (Dull et al., 1989c; Ito and Fukino-Ito, 2002; Ito et al., 2000),watermelons (Ito et al., in press), onions (Birth et al., 1985), strawberries (Ito, 2002),peaches (Kawano et al., 1992; Peiris et al., 1998b), nectarins (Slaughter, 1995),satsuma mandarins (Miyamoto and Kitano, 1995) and pineapples (Guthrie andWedding, 1998).
298 Hidekazu Ito
Figure 1. Plots of laboratory-determined TDF v. NIR calculated TDF for dehydrated vegetables (Itoet al., 1999).

The absolute value of a bias sometimes becomes high (Peiris et al., 1998).The high bias can correct with some samples from the same lot. In this case, Brixof their samples must be determined manually. Therefore, for the bias correction(correction of the intercept in a calibration equation), the laboratory value maybe determined rapidly. Moreover, for preventing high biases, sample temperatureshould be kept constant or the calibration equation with temperature compensa-tion should be developed (Kawano et al., 1995). Incidentally, the wavelength rangeof 740–755 nm region or 840–850 nm region could compensate for the differentoptical pathlength of satsuma mandarin fruit. And one of the wavelength around794 nm or 835 nm could compensate for the influence of the fruit temperature(Miyamoto and Kitano, 1995). Thus, a good calibration equation can avoid cor-recting the coefficients.
2.2.5. A hand held and portable instrument
For more than 50 years, NIR spectroscopy has evolved primarily into process andlaboratory instruments. Laboratory instruments are bench type instruments suitablefor service in laboratory environments where temperature and relative humidityare controlled. As such, they are neither portable nor made rugged for harsh envi-ronments. Hand-held instruments incorporate narrow-band interference filters anda single detector to determine the absorbance data of samples. Such instrumentsare compact and lower in cost than laboratory instruments that are full-spectrumrecorders. A hand-held NIR meter (called the Gmeter), based on gap-second deriv-ative (GSD) theory, was designed, constructed and performance-tested. Formeasuring protein in soy-protein/sugar mixtures, performance of the Gmeter wascompared with the performance of a Foss NIRSystems model 6500 spectropho-tometer used widely all over the world. Gmeter performed almost as well as themodel 6500 for measuring protein in the mixtures. Measurements from the samethree filters selected for determining protein in the mixtures could be used fordetermining nitrogen in the dry-grass tissue (Morimoto et al., 2001).
As mentioned above, non-destructive determination of Brix in harvested fruitusing NIR spectroscopy has been reported by many researchers. There is a cultivarthat is difficult to judge harvest time from external appearance. If we can deter-mine Brix in a growing fruit, immature fruits will not be harvested. A portableNIR spectrophotometer for field use has been just developed by Kubota Corporation.The spectral data of growing melons in a plastic greenhouse were measured bythe portable spectrophotometer. Absorbances at 906 and 874 nm that were key wave-lengths for non-destructive Brix determination were included in the MLR equationas independent variables. Therefore, it was concluded that Brix in growing fruitscould be determined non-destructively in the field (Figure 2) (Ito et al., 2001).
2.2.6. Non-contact mode
When Brix in intact fruit was measured non-destructively by NIR spectroscopy withfibre optic probe, each fruit was placed on the end of the fibre optic probe (lightreceptor) so that the desired fruit location was centred on, and in direct contact with,
Rapid Quality Evaluation Techniques of Horticultural Crops 299

the fibre optic probe (contact mode) (Kawano et al., 1992) (Slaughter, 1995). Theflesh in the blossom end of melon fruit is thinner than that in other parts. Thissuggests that Brix of the flesh in the blossom end may be predicted by NIR witha fibre optic probe. But, in the case of measuring spectra of the blossom end, itssurface and the end of the fibre optic probe can not be contacted all of fruits becauseof the hollow at the blossom end and the distance between the surface of the blossomend and the end of the fibre optic probe influences the absorbance. Even if thesensitive surface of the detector does not touch the surface of the melon, its spectrumcan be measured (non-contact mode) and the SEC was 0.82% (Dull et al., 1992).Therefore, the objective of this study was to determine if non-contact mode couldimprove the standard error (SEC and SEP) of the Brix of the flesh in the blossomend of melon fruit as well as the contact mode. When the results for the contactmode and the non-contact mode was compared, the latter mode improved the formerstandard error (Figure 3) (Ito et al., 2000).
The previous paper has described improvement of standard errors of the predictedsoluble solids (Brix) in a melon cultivar by non-contact mode using NIR spec-troscopy. Then we examined the immature and mature fruits to provide a broad rangeof Brix. The objective of next study was to determine the potential of NIR spec-troscopy for non-destructive estimation of Brix in melon breeding programs.Harvesting stage of fruits from a progeny was judged with mainly external appear-ance (yellowing of rind and/or formation of abscission layer and so on). NIRspectroscopy could estimate Brix in the melons from the progeny well (Ito andFukino-Ito, in press).
300 Hidekazu Ito
Figure 2. Laboratory-determined Brix v. NIR calculated Brix for growing melons (Ito et al., 2001).

Rapid Quality Evaluation Techniques of Horticultural Crops 301
Figure 3. Laboratory-determined Brix v. NIR-calculated Brix for melons (n = 23). � means non-contactmode, � means contact mode, respectively (Ito et al., 2000).

In addition, non-contact mode could estimate Brix in growing melons (Ito etal., 2001), watermelons (Figure 4) (Ito et al., in press), tomatoes, apples, mandarinoranges, peach, grapes, persimmons, pears and strawberries (Morimoto et al., inpress).
Non-contact mode will be able to improve SEC and SEP of other qualityindice.
2.2.7. Grading cost
The current availability of commercial instruments has stimulated interest in theuse and potential of NIR for high moisture crops and is accelerating the rate at whichimpediments to development are addressed. At prevailing grading rates, a gradingcost of <$0.02 a product unit appears to be realistic (Kays et al., 2000).
3. ACOUSTICS
Acoustic techniques are attractive as methods for the non-destructive measure-ment of fruit quality. Many studies have been done using acoustic techniques onvarious kinds of produce. Most of the researchers applied frequency analysis tech-niques to analyze sound signals, and observed that resonant frequencies decreasedwith ripening. However, the resonant frequencies were affected by the size and shapeof the sample. In addition, the mechanism of producing multiple resonant frequencieswas not clarified by experimental evidence.
There are two advantages to using the transmission velocity instead of the resonant
302 Hidekazu Ito
Figure 4. Laboratory-determined Brix v. NIR calculated-Brix for watermelons (Ito et al., in press).
frequency to evaluate ripeness. First, the transmission velocity method compen-sates for variations in the size of the samples. Second, it is easy to detect a maximumpeak in the impact waveform for calculation of the transmission velocity. On theother hand, many resonant frequencies were observed using the resonant method,and it is difficult to determine which one is the optimal firmness index. Based onthis transmission velocity, a portable firmness tester for measuring melons was devel-oped. It measures the transmission velocity of an impulse waveform induced byan impact of a plunger on a melon. The pistol-shaped tester has a light-touchimpact mechanism and two microphone sensors. Acoustic signals are transmittedto a computer through a PC card-type A/D converter. The transmission velocitycalculated from the cross correlation of the two acoustic signals showed a highlevel of correlation (R = 0.94) with apparent elasticity measured in destructivetests. In addition, based on the transmission velocity, the firmness tester can beused for consumers to evaluate proper eating time of melon fruit (Sugiyama etal., 1998). In the next study, the firmness tester was modified to measure the firmnessof pears and its performance examined. Pears are relatively firmer than melons. Thismeans the firmness tester must be able to measure high transmission velocity. Asone of the modification, to achieve this, the sampling frequency for data acquisi-tion was increased from 70 kHz to 125 kHz. Pulling the trigger of the firmness testerstarts the measurements and the results (transmission velocity and so on) appearson a personal computer screen in less than a second. The transmission velocityshowed a high level of correlation (R = 0.94) with apparent elasticity measured indestructive tests (Sugiyama, 2001).
REFERENCES
Barnes, R. J., M. S. Dhanoa and S. J. Lister (1989). Standard normal variate transformation and de-trending of near-infrared diffuse reflectance spectra. Applied Spectrosc. 43(5): 772–777.
Birth, G. S., G. G. Dull, W. T. Renfore and S. J. Kays (1985). Nondestructive spectrophotometricdetermination of dry matter in onions. J. Amer. Soc. Hort. Sci. 110(2): 297–303.
Buning-Pfaue, H., R. Hartmann, J. Harder, S. Kehraus and C. Urban (1998). NIR-spectrometric analysisof food. Methodical development and achievable performance values. Fresenius J. Anal. Chem.360: 832–835.
Carlini, P., R. Massantini and F. Mencarelli (2000). Vis-NIR measurement of soluble solids in cherryand apricot by PLS regression and wavelength selection. J. Agric. Food Chem. 48: 5236–5242.
Carlini, P., R. Massantini, F. Mencarelli and R. Botondi (1998). Determination of soluble solidscontent in apricot varieties by visible/near-infrared spectroscopy. Agr. Med. 128: 138–141.
Centner, V., D. L. Massart, O. E. de Noord, S. de Jong, M. B. Vandeginste and C. Sterna (1996).Elimination of uninformative variables for maltivariate calibration. Anal. Chem. 68: 3851–3858.
Dull, G. G., G. S. Birth and R. G. Leffler (1989a). Use of near infrared analysis for the nondestruc-tive measurement of dry matter in potatoes. Amer. Potato J. 66: 215–225.
Dull, G. G., G. S. Birth and R. G. Leffler (1989b). Exiting energy distribution in honeydew melonirradiated with a near infrared beam. J. Food Quality 12: 377–381.
Dull, G. G., G. S. Birth, D. A. Smittle and R. G. Leffler (1989c). Near infrared analysis of solublesolids in intact cantaloupe. J. of Food Sci. 54(2): 393–395.
Dull, G. G., M. Iwamoto and S. Kawano (1996). Nondestructive Quality Evaluation of HorticulturalCrops (Proceedings of the intl. symposium on nondestructive quality evaluation of hort. crops fundedby the 24th intl. hort. congr. held 26 August, 1994 in Kyoto, Japan), Saiwai Shobou PublishingCo. Ltd., Tokyo, Japan.
Rapid Quality Evaluation Techniques of Horticultural Crops 303

Dull, G. G., R. G. Leffler, G. S. Birth and D. A. Smittle (1992). Instrument for nondestructive mea-surement of soluble solids in honeydew melons. Transactions of the ASAE 35(2): 735–737.
Dull, G. G., R. G. Leffler, G. S. Birth, A. Zaltzman and Z. Schmilovitch (1991). The near infrared deter-mination of moisture in whole dates. Hortsci. 26: 1303–1305.
Fraser, D. G., R. Kunnemeyer, V. A. McGlone and R. B. Jordan (2001). Near infra-red (NIR) lightpenetration into an apple. Postharvest Biol. Technol. 22: 191–194.
Geladi, P. and B. R. Kowalski (1986). Partial least-squares regression: A tutorial. Anal. Chem. Acta 185:1–17.
Guthrie, J. and K. Walsh (1997). Non-invasive assessment of pineapple and mango fruit quality usingnear infra-red spectroscopy. Aust. J. of Exp. Agric. 37: 253–263.
Guthrie, J. and K. Walsh (1999). Influence of environmental and instrumental variables on the non-invasive prediction of Brix in pineapple using near infrared spectroscopy. Aust. J. of Exp. Agric.39: 73–80.
Guthrie, J. and B. Wedding (1998). Robustness of NIR calibrations for soluble solids in intact melonand pineapple. J. Near Infrared Spectrosc. 6: 259–265.
Hakim, A., A. C. Purvis, I. Voipio, E. Pehu and M. Khatoon (1999). Use of different nondestructivetechniques to evaluate vegetable quality. Acta Hort. 483: 235–244.
Hopkins, D. W. (2001). Derivatives in spectroscopy. Near Infrared Analysis 2: 1–13.Isaksoon, T. and T. Naes (1988). The effect of multiplicative scatter correction (MSC) and linearity
improvement in NIR spectroscopy. Applied Spectrosc. 42: 1273–1284.Ito, H. (2002). Potential of near infrared spectroscopy for nondestructive estimation of Brix in straw-
berries. Acta Hort. 567: 751–754.Ito, H. and N. Fukino-Ito (2002). Near infrared determination of soluble solids in intact melons from
a progeny by non-contact mode using fibre optic probe. Proceedings of the 10th Intl. Conf. onnear Infrared Spectrosc (in press).
Ito, H., K. Ippoushi, K. Azuma and H. Higashio (1999). Potential of near-infrared reflectance spec-troscopy for estimating total dietary fiber content of dehydrated vegetables. Acta Hort. 483: 265–274.
Ito, H., K. Ippoushi, K. Azuma and H. Higashio (2000). Nondestructive estimation of soluble solidsin intact melons by non-contact mode with a fiber optic probe. Near Infrared Spectrosc: Proceedingsof the 9th Intl. Conf.: 859–862.
Ito, H., S. Morimoto and R. Yamauchi (2001). Potential of near infrared spectroscopy for non-destruc-tive estimation of soluble solids in growing melons. Acta Hort. 566: 483–486.
Ito, H., S. Morimoto, R. Yamauchi, K. Ippoushi, K. Azuma and H. Higashio. Potential of near infraredspectroscopy for non-destructive estimation of soluble solids in watermelons. Acta Hort. (in press).
Kawano, S., H. Abe and M. Iwamoto (1995). Development of a calibration equation with tempera-ture compensation for determining the Brix value in intact peaches. J. Near Infrared Spectrosc. 3:211–218.
Kawano, S., H. Watanabe and M. Iwamoto (1992). Determination of sugar content in intact peachesby near infrared spectroscopy with fiber optics in interactance mode. J. Japan Soc. Hort. Sci.61(2): 445–451.
Kays, S. J., G. G. Dull and R. G. Leffler (2000). Challenges and opportunities in the use of nearinfrared for the analysis of intact, high moisture plant products. Near Infrared Spectrosc: Proceedingsof 9th Intl. Conf.: 841–847.
Martens, H. and M. Martens (2001). Multivariate Analysis of Quality. J. Wiley & Sons Ltd, ChichesterUK, pp. 111–115.
Martens, H. and E. Stark (1991). Extended multiplicative signal correction and spectral interference sub-traction: New preprocessing methods for near infrared spectroscopy. J. Pharmaceutical & BiomedicalAnalysis 9: 625–635.
McGlone, V. A. and S. Kawano (1998). Firmness, dry-matter and soluble solids assessment of posthar-vest kiwifruit by NIR spectroscopy. Postharvest Biol. and Technol. 13: 131–141.
Miyamoto, K. and Y. Kitano (1995). Non-destructive determination of sugar content in satsuma mandarinfruit by near infrared transmittance spectroscopy. J. Near Infrared Spectrosc 3: 227–237.
Moons, E., G. Sinnaeve and P. Dardenne (2000). Nondestructive visible and NIR spectroscopy mea-surement for the determination of apple internal quality. Acta Hort. 517: 441–448.
Morimoto, S., H. Ishibashi, T. Takada, Y. Suzuki, M. Kashu and R. Yamauchi. Non-destructive near
304 Hidekazu Ito
infrared spectrophotometers: Development of portable fruit quality meters. Proceedings of the 10thIntl. Conf. on Near Infrared Spectrosc (in press).
Morimoto, S., W. F. Mcclure and D. L. Stanfield (2001). Hand-held NIR spectroscopy: part 1: an instru-ment based upon gap-second derivative theory. Applied spectrosc 55: 182–189.
Park, Y. W., M. J. Anderson and A. W. Mahoney (1982). Potential of near infrared reflectance(NIR)spectroscopy for estimating nutrient content of dehydrated vegetables. J. Food Sci. 47: 1558–1561.
Peiris, K. H. S., G. G. Dull, R. G. Leffler and S. J. Kays (1998a). Near-infrared(NIR) spectrometrictechnique for nondestructive determination of soluble solids content in processing tomatoes. J. Amer.Soc. Hort. Sci. 123(6): 1089–1093.
Peiris, K. H. S., G. G. Dull, R. G. Leffler and S. J. Kays (1998b). Near-infrared spectrometric methodfor nondestructive determination of soluble solids content of peaches. J. Amer. Soc. Hort. Sci. 123(5):898–905.
Peiris, K. H. S., G. G. Dull, R. G. Leffler and S. J. Kays (1999). Spatial variability of soluble solidsor dry-matter content within individual fruits, bulbs, or tubers: Implications for the developmentand use of NIR spectrometric techniques. Hortsci. 34(1): 114–118.
Peirs, A., J. Lammertyn, B. Nicolai and J. De Baerdemaeker (2000). Non-destructive quality mea-surements of apples by means of NIR-spectroscopy. Acta Hort. 517: 435–440.
Schaare, P. N. and D. G. Fraser (2000). Comparison of reflectance, interactance and transmission modesof visible-near infrared spectroscopy for measuring internal properties of kiwifruit (Actinidia chi-nensis). Postharvest Biol. and Technol. 20: 175–184.
Slaughter, D. C. 1995. Nondestructive determination of internal quality in peaches and nectarines.Transactions of the ASAE 38(2): 617–623.
Slaughter, D. C., D. Barrett and M. Boersig (1996). Nondestructive determination of soluble solids intomatoes using near infrared spectroscopy. J. of Food Sci. 61(4): 695–697.
Sugiyama, J. (2001). Application of non-destructive portable firmness tester to pears. Food Sci. Technol.Res. 7: 161–163.
Sugiyama, J., T. Katsurai, J. Hong, H. Koyama and K. Mikuriya (1998). Melon ripeness monitoringby a portable firmness tester. Transactions of the ASAE 41(1): 121–127.
Watada, A. E. (1989). Nondestructive methods of evaluating quality of fresh fruits and vegetables.Acta Hort. 258: 321–329.
Watada, A. E. (1995). Methods for determining quality of fruits and vegetables. Acta Hort. 379: 559–567.
Rapid Quality Evaluation Techniques of Horticultural Crops 305

TABLE GRAPE POSTHARVEST MANAGEMENT ANDSAFETY ISSUES
ALFONSO A. GARDEA, TANIA CARVALLO, BETHZABET SASTRÉ,MIGUEL A. MART INEZ-TÉLLEZ, GLORIA M. YÉPIZ-PLASCENCIA,MARTHA DIAZ-CINCO AND J. ANTONIO OROZCOCentro de Investigación en Alimentación y Desarrollo A.C., P.O. Box 781, Cuauhtémoc, Chihuahua,México C.P. 31570
1. INTRODUCTION
Table grape production is an important component of regional economy in north-west Mexico. Seedless grapes grown in the Sonoran desert are of excellent quality.Production systems have been directed to the U.S. market just three hours away,as a consequence postharvest management requirements have been consideredminimal. However, this is changing, because of the necessity to explore othermarkets, as well as cold-store part of the crop to extend its marketing season.
As far as the Mexican market, availability of Chilean grapes in winter fillsan empty niche, since no local grapes are grown during winter; therefore theyhave a positive effect on consumers by widening the marketing season. Although,potentially they may compete with the earliest Sonoran grapes. Under any cir-cumstance this situation also implies a challenge to improve grape quality for internalconsumption.
In this context more detailed postharvest management practices are required, aswell as the generation of this type of technologies to keep the competitive levelrequired at the beginning of this millenium.
This chapter try to familiarize readers with some aspects of harvest and posthar-vest practices of ‘Flame Seedless’ grapes as grown in northwest Mexico. Also itshows data on quality during postharvest management, and the efforts being devotedto improve food safety issues. It is important to mention that germplasm stronglyinfluences field and postharvest behavior, consequently this information should beconsidered within those limitations.
2. EFFECT OF MANAGEMENT ON CLUSTER DEVELOPMENT
Use of growth regulators and specially designed cultural practices has been exten-sively use in seedless grape production (Mullins et al., 1992). These practicesstrongly influence berry characteristics such as size, color and ripening; they alsotrigger a more intense rachis development.
Table 1 shows the comparison between clusters produced under two conditions,one representing a commercial, export-oriented vineyard, and the other whereclusters grew mostly without any particular care, other than vine pruning andwatering. It is noticeable that technology used for export table grapes resulted in
R. Dris and S. M. Jain (eds.), Production Practices and Quality Assessment of Food Crops,
© 2004 Kluwer Academic Publishers. Printed in the Netherlands.
307
Vol. 3, “Quality Handling and Evaluation”, pp. 307–320.

berries twice as heavy and larger than those from non-managed vines, those clustershad more developed rachis as well. As far as ripening, although no difference insugars were found among berries, well managed vines produced an extra consid-erable amount of sugars.
An important character affecting rachis susceptibility to dehydration is its degreeof lignification (Nelson, 1985), because of difficulties inherent to lignin determi-nation, former works (Zieslin y Ben-Zaken, 1991; Abeles and Biles, 1991; Lagrimiet al., 1993; Bate et al., 1994; Bidlack et al., 1995; Campbell and Sederoff, 1996)have defined that the activity of enzymes associated to lignin synthesis is a key factorto understand this condition. Phenylalanine ammonia lyase (PAL) is the main enzymedirecting compounds into the phenylpropanoid metabolism (Davin and Lewis, 1992),the pool system from which lignin is derived (Azcón-Bieto and Talón, 1993; Dixonand Harrison, 1990). Peroxidases (POD) are key enzymes for lignin synthesis(Stafford, 1974; Bruce and West, 1989; Lagrimi, 1991; McDougall, 1992; Campbelland Sederoff, 1996). They are a group of isozymes, directly responsible for ligninformation (McLellan and Robinson, 1983; Moulding et al., 1987; Khan andRobinson, 1993). Values from both enzymes extracted from rachis show that man-agement not only influence rachis development, but also affect the enzymesresponsible for lignification, hence improving its ability to withstand dehydration,one of the most important factors affecting postharvest quality of table grapes.Recently it has been shown that CPPU, a substituted phenylurea enhance rachisperformance during postharvest management (Carvajal et al., 2001).
3. POSTHARVEST PHYSIOLOGY AND PATHOLOGY
3.1. Respiration
This is the physiological event more closely resembling the metabolic activity offruits. Respiration rate strongly determines postharvest life by triggering senes-cence processes. Grapes are non-climateric fruits, therefore they do not increasesubstantially their carbon dioxide (CO2) evolution rate once harvested. In fact,their respiration rates are just slightly higher than those of dry fruits, dates andnuts. In contrast, other species respire at considerably faster rates as in avocados,bananas, and strawberries (Kader, 1985). This was confirmed with tests showing
308 A. A. Gardea et al.
Table 1. Quality attributes of clusters, berries and rachis, as affected by cultural practices oriented toproduce high quality table grapes.
C M1 TSS2 Berry Berry Rachis Rachis PAL activity POD activity°Brix fw3 (g) dia4 (cm) fw (g) dw5 (g) (nm cinn ac/hr/gfw) (min/g fw)
With 20.9 715.2 1.9 19.0 4.2 0.1009 236.4Without 20.1 351.7 1.5 11.3 2.2 0.0875 135.4
1 CM = Cluster management, including use of growth regulators, cluster thinning, trunk girdling andethephon sprays. 2 TSS = Total soluble solids. 3 fw = fresh weight. 4 dia = diameter. 5 dw = dry weight.
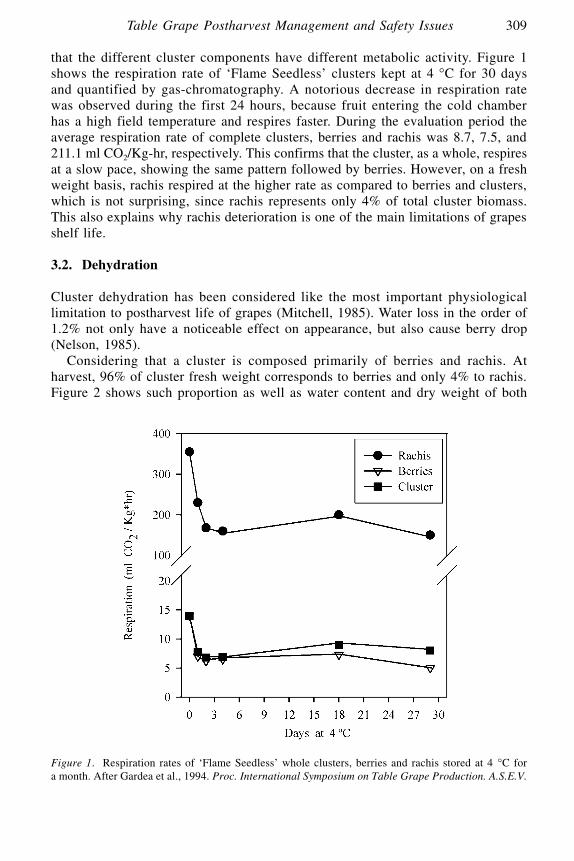
that the different cluster components have different metabolic activity. Figure 1shows the respiration rate of ‘Flame Seedless’ clusters kept at 4 °C for 30 daysand quantified by gas-chromatography. A notorious decrease in respiration ratewas observed during the first 24 hours, because fruit entering the cold chamberhas a high field temperature and respires faster. During the evaluation period theaverage respiration rate of complete clusters, berries and rachis was 8.7, 7.5, and211.1 ml CO2/Kg-hr, respectively. This confirms that the cluster, as a whole, respiresat a slow pace, showing the same pattern followed by berries. However, on a freshweight basis, rachis respired at the higher rate as compared to berries and clusters,which is not surprising, since rachis represents only 4% of total cluster biomass.This also explains why rachis deterioration is one of the main limitations of grapesshelf life.
3.2. Dehydration
Cluster dehydration has been considered like the most important physiologicallimitation to postharvest life of grapes (Mitchell, 1985). Water loss in the order of1.2% not only have a noticeable effect on appearance, but also cause berry drop(Nelson, 1985).
Considering that a cluster is composed primarily of berries and rachis. Atharvest, 96% of cluster fresh weight corresponds to berries and only 4% to rachis.Figure 2 shows such proportion as well as water content and dry weight of both
Table Grape Postharvest Management and Safety Issues 309
Figure 1. Respiration rates of ‘Flame Seedless’ whole clusters, berries and rachis stored at 4 °C fora month. After Gardea et al., 1994. Proc. International Symposium on Table Grape Production. A.S.E.V.

components. In this assay clusters with an average weight of 450 g were used. Watercontent, on a fresh weight basis, was 88% in berries and only 72% in rachis.
Their high succulence suggests that berries may be the main cause of waterloss. However, they have a relatively thick epidermis, covered with cuticular waxesacting as an important barrier against dehydration (Báez-Sañudo et al., 1992;Rosenquist and Morrison, 1988), while rachis lacks such protection, consequentlybeing more prone to dehydration (Elboudwarej et al., 1990). This condition is aggra-vated in early cultivars, which are typically harvested right when the soluble solidscontent reaches the minimum threshold required for marketing, assuming that colordevelopment is not a problem. The reason for such aggravating condition is thatrachis are not lignified and are still too succulent. Lignification is important sinceis the natural condition preventing rachis dehydration and consequently preservingcluster integrity. In the early 20s, before the adventing of refrigerated transport,this knowledge was a factor allowing Spanish growers to export table grapes toAmerica (Stubenrauch and Mann, 1913).
3.3. Pathology
Gray Mold caused by Botrytis cinerea (Pers) is the postharvest disease inflictingthe highest damages in grapes. In spite of this, the effects of this devastatingfungus are seldom seen in Sonoran vineyards, even though they are characterizedby dense canopies, which create microclimate conditions favoring its development
310 A. A. Gardea et al.
Figure 2. Cluster weight partitioning into fresh and dry weights as well as water content of rachisand berries.

(Pearson and Goheen, 1988; Smart and Robinson, 1991; Winkler et al., 1974). Likelyweather conditions are hot and dry enough to inhibit infection. On the other hand,management programs regularly include sprays against Botrytis during bloom. Sincethe crop is marketed immediately, it is also possible that there is not enough timefor the infection to be expressed. Although, specific searches have detected coloniesof several fungi, like Aspergillus sp., Alternaria sp., Penicillium sp. and Aspergillussp. Surprisingly, Botrytis was not found. Figure 3 shows the structures of thesefungi.
3.4. Weight loss as related to dehydration
Cluster weight loss during shelf life is mainly caused by dehydration and sub-strate oxidation to maintain respiration. Berry drop, which obviously affect clusterweight, is partly an effect of these two causes. Also, extreme environmental con-ditions act as catalysts of such processes.
Following several examples will be discussed. Figure 4 shows changes indehydration rates of ‘Flame Seedless’ clusters kept at 25 °C and 30% R.H. in a shelf-life simulation assay for 7 days. In spite of high variability among clusters, significantdifferences were found during the study. This variability was caused by differentphysiological conditions of the samples. Although berries may have the same amountof sugars, rachis may be ontogenetically different. This in turn affect both succu-lence and degree of lignification, and by consequence their susceptibility todehydration. During the first 24 hours dehydration rates were at their peak, and after
Table Grape Postharvest Management and Safety Issues 311
Figure 3. Structures of the most prevalent fungi attacking table grapes in the Sonoran Desert of Mexico.(a) Aspergillus sp., (b) Penicillium sp., (c) Alternaria sp., and (d) Rhizopus sp.

60 hr dehydration symptoms were already visible, affecting sample marketability.At 120 hr, dehydration rates were certainly minimum; however, the rachis were com-pletely deteriorated.
Weight loss for the same set of samples is presented in Figure 5. Initial averagecluster weight was 645 g, and the 10.8 g loss recorded after 24 hr represents adecrease in weight of 1.8%, which according to other reports is enough to affectcluster marketability (Elboudwarej et al., 1990; Hardenburg et al., 1990). As thetime continued, the loss increased as expected. That is the reason because an appro-priate postharvest handling is important, since it determines deterioration rate.
Temperature is undoubtedly the single most important factor catalyzing weightlosses. It regulates not just respiration, but also dehydration by affecting directly
312 A. A. Gardea et al.
Figure 4. Changes in dehydration rates of ‘Flame Seedless’ clusters in a 7-day shelf-life study. Ratesare expressed as microliters of evapotranspired water per gram of fresh weight. Means followed bythe same letter are not significantly different (p ≤ 0.05) according to FPLSD.
Figure 5. Cluster weight loss during shelf life. Means followed by the same letter are not signifi-cantly different (p ≤ 0.05) according to FPLSD.

evapotranspiration rates and – by consequence – water loss. Indirectly, tempera-ture plays a role by affecting air relative humidity, at lower temperatures R.H.rises, decreasing the gradient between R.H. in the fruits and their surroundingenvironment. Another factor is wind speed, since water extraction from tissues isdirectly proportional to it. Figure 6 shows accumulative weight loss in clusters storedunder two conditions (a) 5 ± 1 °C and 95% R.H. and (b) 25 ± 5 °C and 50% R.H.A lower temperature combined with a higher relative humidity had a synergisticeffect in preventing weight loss, which had a five-fold increase in the hotter anddrier storage.
4. WEIGHT LOSS IN REGIONAL MANAGEMENT SYSTEMS
4.1. Description of packing and precooling systems
In general Sonoran grapes are field-packed, either in the avenue or along the row.After harvest, boxes are left in the shadow waiting for cluster selection, trimmingand packing. Once done, packed boxes are inspected, weighed and, if approved,stacked on the avenue, waiting transport to the cooling facility. This waiting periodranges from half-hour up to 2 hr. Transportation is done by tractor-pulled trailerswith or without roofs. When unloading, boxes are palletized and either strappedor wrapped in nylon nets. Forklifts carry the pallets to the precooling tunnels,where temperature, humidity and cooling time vary. Cold storage is rarely done,
Table Grape Postharvest Management and Safety Issues 313
Figure 6. Storage temperature effect on accumulative weight loss for ‘Flame Seedless’ clusters after180 hours. Means followed by the same letter are significantly different (p ≤ 0.05) according toFPLSD.

since grapes are immediately transported in refrigerated containers to marketingcenters Traveling time is approximately 3 to 4 hr to the U.S.A. border and 3 to 4days to most important markets in Mexico.
In the following study, boxes weight changes were monitored beginning rightafter packing up to after cooling. The objective was to identify critical steps andquantify weight losses. The assay was performed in commercial vineyards and inany moment special care was taken to simulate the real operation. As far as weatherconditions during harvest, midday temperatures are typically in the mid 40s °Cwith relative humidity in the range of 10 to 15%.
Since grapes are packed in several packing materials, the most commonly usedwere selected, Table 2 lists and describes them. Usually box type is selecteddepending on buyer’s request. It is notorious that EPS (expanded polystyrene) boxesare used exclusively for the Mexico City market, since buyers prefer them basedon the assumption of their largest capacity, and their protection against clusterdehydration.
4.2. Box weight gain
Several physical features characterize the different packing materials. These mate-rials influence SO2 circulation rates (Harvey et al., 1988), produce final quality(Perkins-Veazie et al., 1992), and differ in their weight gain behavior during pre-cooling.
The last characteristic does not go unnoticed for field personnel, who are awareof box weight changes along the day. Particularly in the morning when the boxeshave been exposed to the higher humidity at night. If the real change in weight ofpacked boxes is to be determined, a correction factor for each box-type should beestimated. Table 3 summarizes such results. Empty boxes were individually labeledand weighed in a precision balance (±1 g) at midday. The boxes were stacked ina precooling tunnel for 6 hours and they were weighed again. Heaviest boxeswere TKV, followed by cardboard (10 Kg), cardboard (5 Kg), and EPS as thelightest. After cooling the largest weight gain was found in cardboard (10 Kg)with 47 g, since it is a very hygroscopic material. No significant differences werefound between TKV and cardboard (5 Kg) boxes, both with a mean gain of 34 g.Being such an impermeable material, EPS absorbed only 1 g of water. Theseweight gains represent an important factor to calculate precisely the effective weightloss by clusters.
314 A. A. Gardea et al.
Table 2. Description of the different types of packing boxes.
Type Dimensions (cm) Materials
TKV 44 × 35 × 17 Pressed-wood ends, cardboard sides. Includes curtains, pads and liners.
Cardboard (5 Kg) 40 × 35 × 22 Thin cardboard, bright finishing, vents.Cardboard (10 Kg) 40 × 30 × 41 Fiberboard, vents.EPS 50 × 40 × 17 EPS tops and bottoms, lateral vents.

4.3. Weight loss in packed clusters
Sometimes depending on buyer preference clusters are packed in bags. The bagsare plastic with vented sides or chimney-type. Let us consider that a bag is anextra barrier against moisture loss. A simulation was performed at 4 °C to estimatethe effect of bags in weight loss of individual clusters (see Figure 7).
It was found that, at any moment, bagged clusters lose less weight. Baggingalso imply a longer cooling time, since bags delay cold air flux.
Table 4 shows cluster weight loss along the postharvest handling right up tocooling. Box types were the same as described before and clusters were either baggedor not. Weight after packing was recorded as soon as possible with a precisionbalance (±1 g). Total packing time for all 59 boxes was almost 2 hours. Packed boxeswere kept in the shadow to avoid overheating. Weight of packed boxes was com-mercially representative with the exception of 5 Kg boxes, which were overfilled.However, the important data are the weight losses and they can be extrapolated tothe appropriate box weight.
Once all boxes were weighed, the waiting period for transportation to the cooling
Table Grape Postharvest Management and Safety Issues 315
Table 3. Changes in weight of four different packing boxes for table grapes.
Type Sample size Precooling weight changes (g)1
Before After Gain
TKV 10 1922 ± 5 1956 ± 5 34 bCardboard (5 Kg) 10 0571 ± 4 0605 ± 5 34 bCardboard (10 Kg) 10 0877 ± 1 0924 ± 3 47 cEPS 10 0350 ± 2 0352 ± 3 01 a
1 Mean ± standard deviation. Within the same column, means followed by the same letter are notsignificantly different by FPLSD, p ≤ 0.05.
Figure 7. Weight loss for bagged and no-bagged clusters during storage at 4 °C.

facility was simulated and the weight change recorded again, representing theloss while the boxes are in the avenue. During such period temperature was42 °C (108 °F) and relative humidity was 15%, which represent typical weatherduring harvest. Upon arrival to the cooling facility, boxes were palletized. Theywere stacked according to the type of box with the sturdiest at the bottom, butwithin each type the replications were randomized. Cooling time was 6 hours, whichis representative of the commercial operation, although deviations depend onharvested volume, transport availability, etc. After cooling boxes were weighedand cluster weight loss was determined once the appropriate correction factorswere applied.
This evaluation yielded important information. Major losses did not occur inthe field, but during cooling. The extremes are represented by clusters packed incardboard boxes (both presentations), which lose only 17 g. While, unbagged clustersin TKV boxes loose 45 g. During cooling weight loss increased, totaling twice orthrice over those found in the field. In general, bag use resulted in smaller losses,although this difference was not statistically significant. Effective weight loss rep-resents both field and cooling losses and is corrected by the weight gained by thebox.
In all cases effective loss weights, at least during this phase of postharvesthandling, was consistently smaller than the extra 2 to 2.5 pounds (908 to 1,135g), which are regularly added to the labeled weight to compensate for the lossesbefore inspection by buyers, avoiding the corresponding sanctions. The weightloss percentage shown in the last column represents the relative cluster total weightloss and can be used as a calibration factor for each type of packing.
316 A. A. Gardea et al.
Table 4. Determination of weight loss of grape clusters packed in different boxes during packing,transportation to the cooling facility and precooling.
Box type n1 Weight loss
Packed In the During Total Relative weight (g) field (g) cooling (g) effective (g) loss (%)
TKV (bag) 10 11,955 31.8 cd 114.3 d 180.3 d 1.80TKV (CB) 10 11,665 45.0 e 114.4 d 193.6 d 1.99CB 102 (bag) 07 10,238 17.0 a 090.7 c 154.6 c 1.65CB 102 07 10,532 37.4 d 070.9 b 155.1 c 1.61CB 53 (bag) 10 05,759 17.7 a 048.0 a 100.2 a 1.93CB 53 10 07,285 23.3 b 063.3 b 121.0 b 1.80EPS 05 09,414 30.4 c 088.0 c 120.0 b 1.32
1 n = sample size.2 Cardboard box is a 10 Kg presentation.3 Cardboard box is a 5 Kg presentation.Means followed by the same letter within the column are not significantly different at p = 0.05 (FPLSD).

5. FOOD SAFETY PRACTICES
Contamination from different sources (physical, chemical or biological) mustbe taken in consideration when establishing strategies to obtain a safe food(Figure 8).
Marketing of horticultural commodities requires of implementing good agricul-tural and manufacturing practices during field practices (GAP) and along thepostharvest management (GMP). These actions are taken to insure a safe productfor human consumption. This section describes those steps undertaken by grapegrowers in northwest Mexico in order to improve the quality of their produce.Certified vineyards established a Food Safety Program (FSP) based on their GAPand GMP. Some of the actions include:
(1) The water used for chemical sprays and human consumption is monitored toensure its microbiological quality as free from total and fecal coliforms.
(2) As far as physical infrastructure, minimum requirements must be met as faras toilet availability in the field and cooling house. It is mandatory to includehand washing and sanitizing facilities along with each toilet. Also, cooling equip-ment must be periodically maintained to avoid possible contamination sources.
Table Grape Postharvest Management and Safety Issues 317
Figure 8. Most common sources of physical, chemical and biological contamination for table grapes.

(3) Each FSP coordinator must receive specialized training on HACCP, GAP andGMP.
(4) A work team is established with permanent personnel who develop the list ofbiological, physical and chemical hazards at which table grapes are exposedalong their development and all the way to transportation to its final market.
(5) Handbooks for standard and operation procedures are made. They include allsteps required to reduce contamination hazards and should cover the following:Personnel hygiene and health, as well as training; cleaning, sanitizing and main-tenance of all surfaces regardless their contact with produce; drinking wateravailability; use of field materials; cleaning, maintenance and sanitizing of toiletfacilities; vertebrate, insect and mite pests control; produce storage, trans-portation and traceability; verification of sanitizing procedures of all surfacesin contact with produce.
(6) Particular situations affecting each vineyard are considered as well. Examplescould include a pork or chicken farm close to the vineyard, under this condi-tion specific actions should be taken into account.
Developing strategies to implement a FSP requires of participation of all fieldand packing personnel. This condition is of paramount importance. Personnel istrained to detect and avoid contamination hazards in table grapes.
6. CONCLUSIONS
Postharvest physiology of grape clusters calls for a special handling system.Although their respiration rate is very slow, the susceptibility of clusters to dehy-dration asks for a quick and careful handling. Berries represent most of the clusterbiomass; however, rachis represent the weakest link in the chain, because of theirhigh susceptibility to dehydration. Dehydration and weight loss rates are stronglydetermined by temperature and humidity. Consequently an effort should be madeto avoid cluster exposure to high temperatures, which also diminishes the amountof field heat to be eliminated by cooling.
Packing boxes are made with several materials differing in their hygroscopiccharacteristics, this is important to calculate their correction factors, which allowthe correct estimation of the weight to be added to compensate for the loss, andwithin the limits of this study, there is a whole potential to do so.
Establishing a food safety program is a must for a successful export, since min-imizes the probability of hazards for consumers.
ACKNOWLEDGEMENTS
This work was possible through the financial support from C.I.A.D., Conacyt-Méxicoand Fundación Produce Sonora.
318 A. A. Gardea et al.

REFERENCES
Abeles, F. B. and C. L. Biles (1991). Characterization of peroxidases in lygnifying peach fruit endocarp.Plant Physiol. 95: 269–273.
Azcón-Bieto, J. and M. Talón (1993). Fisiología y Bioquímica Vegetal. McGraw-Hill, Spain, pp.252–259.
Báez-Sañudo, R., F. R. Tadeo, F. Primo-Millo and L. Zacarías (1992). Physiological and ultrastruc-tural changes during the ripening and senescence of ‘Clementine’ mandarin. Acta Horticulturae. 383:18–24.
Bate, N. J., J. Orr, W. Ni, A. Meromi, T. Nadler-Hassar, P. W. Doerner, R. A. Dixon, C. J. Lamband Y. Elkind (1994). Quantitative relationship between phenylalanine ammonia-lyase levels andphenylpropanoid accumulation in transgenic tobacco identifies a rate-determining step in naturalproduct synthesis. Proc. Natl. Acad. Sci. U.S.A. 91: 7608–7612.
Bidlack, J. E., D. R. Buxton, R. M. Shibles and I. C. Anderson (1995). Phenylalanine ammonia-lyaseas a precursory enzyme of legume stem lignification. Can. J. Plant Sci. 75: 135–140.
Bruce, R. J. and C. S. West (1989). Elicitation of lignin biosynthesis and isoperoxidase activity by pecticfragments in suspension cultures of castor bean. Plant Physiol.: 889–897.
Campbell, M. M. and R. R. Sederoff (1996).Variation in lignin content and composition mechanismsof control and implications for the genetic improvement of plants. Plant Physiol. 110: 3–13.
Carvajal-Millán, E., T. Carvallo, J. A. Orozco, M. A. Martínez-Téllez, I. Tapia, V. M. Guerrero,A. Rascón-Chu and A. A. Gardea (2001). Polyphenol oxidase activity, color changes and dehydrationin table grape rachis during development and storage. J. Agric. Food Chem. 49(2): 946–951.
Davin, L. B. and N. G. Lewis (1992). Phenylpropanoid metabolism: Biosynthesis of monolignols, lignansand neolignans, lignins and suberins. In H. A. Stafford and I. R. R. Jenm (eds.), Phenolic Metabolismin Plants. Chapter 11th, Press New York, pp. 325–373.
Dixon, R. A. and M. J. Harrison (1990). Activation, structure and organization of genes involved inmicrobial defense in plants. Advances in Genetics. Academic press Inc. 28: 165–216.
Elboudwarej, A. F., A. Shirazi, A. Cameron and R. C. Herner (1990). Measurements of transpirationof different parts of grape clusters. Technical Abstracts 41st Annual Meeting Am. Soc. Enol. Vitic.Los Angeles, CA, June 28–30, 1990, p. 12.
Gardea, A. A., M. A. Martínez-Téllez, A. Sánchez, M Báez, J. H. Siller, G. González, R. Báez,C. H. Crisosto and R. S. Criddle (1994). Post-harvest weight loss of Flame Seedless clusters. InJ. A. Rantz (ed.), Proceedings of the International Symposium on Table Grape Production. Am.Soc. Enol. Vitic. Anaheim, Cal. June 28–29, 1994, pp. 203–206.
Hardenburg, R. E., A. E. Watada and C. Y. Wang (1990). The commercial storage of fruits, vegeta-bles, and florist and nursery stocks. U.S.D.A. Agriculture Handbook. Number 66, Revised edition.
Harvey, J. M., C. M. Harris, T. A Hanke and P. L. Hartsell (1988). Sulfur dioxide fumigation of tablegrapes: Relative sorption of SO2 residues, decay, and bleaching. Am. J. Enol. Vitic. 39(2): 132–136.
Kader, A. L. (1985). Postharvest biology and technology: An overview. In A. L. Kader, R. F. Kasmire,F. G. Mitchell, M. S. Reid, N. F. Sommer and J. F. Thompson (eds.), Postharvest Technology ofHorticultural Crops. Cooperative Extension University of California, Special Publication 3311,pp. 3–7.
Khan, A. A and D. S. Robinson (1993). Purification of an anionic peroxidase isozyme from mango(Mangifera indica L. Var. Chausa). Food Chemistry 46: 61–64.
Lagrimini, M. L. (1991). Wound-induced deposition of polyphenols in transgenic plants over expressingperoxidase. Plant Physiol. 96: 577–583.
Lagrimini, M. L., J. Vaughn, W. A. Erb and S. A. Miller (1993). Peroxidase overproduction in tomato:Wound-induced polyphenol deposition and disease resistance. HortScience 28(3): 218–221.
McDougall, G. J. (1992). Changes in cell wall-associated peroxidases during the lignification of flaxfibres. Phytochemistry 31(10): 3385–3389.
McLellan, K. M. and D. S. Robinson (1983). Cabbage and brussels sprout peroxidase isozymes sepa-rated by isoelectric focusing. Phytochemistry 22: 645–647.
Mitchell, F. G. (1985). Postharvest handling systems: Table grapes. In A. L. Kader, R. F. Kasmire,F. G. Mitchell, M. S. Reid, N. F. Sommer, J. F. Thompson (eds.), Postharvest Technology of
Table Grape Postharvest Management and Safety Issues 319

Horticultural Crops. Cooperative Extension University of California, Special Publication 3311,pp. 149–151.
Moulding, P. H., H. F. Grant, K. M. McLellan and D. S. Robinson (1987). Heat stability of solubleand ionically bound peroxidase extracted from apples. Int. J. Food Sci Technol. 22: 391–397.
Mullins, M. G., A. Bouquet and L. E. Williams (1992). Biology of the Grape Vine. Cambridge UniversityPress, Great Britain, pp. 134–140.
Nelson, K. E. (1985). Harvesting and Handling California Table Grapes for Market. Agri. Exp. Station,University of California, Bulletin 1913, pp. 3–9.
Pearson, R. G. and A. C. Goheen (1988). Compendium of Grape Diseases. APS Press, Saint Paul,MN, p. 13.
Perkins-Veazie, J. K. Collins, J. Lloyd and K. R. Striegler (1992). Influence of package on post-harvest quality of Oklahoma and Arkansas table grapes. Am J. Enol. Vitic. 41(1): 79–82.
Polle, A., T. Otter and F. Seifert (1994). Apoplastic peroxidases and lignification in needles of Norwayspruce (Picea abies L.). Plant Physiol. 106: 53–60.
Rosenquist, J. K. and J. C. Morrison (1988). Causes of variability in wax and cuticle development ongrape berries. Proceedings 39th Annual Meeting Am. Soc. Enol. and Vitic. Abstract. Reno, Nevada.
Smart, R. and M. Robinson (1991). Sunlight into wine. A handbook for winegrape canopy manage-ment. Australian Industrial Publishers Pty Ltd., p. 14.
Stafford, A. H. and R. R. I. Jenum (1992). Phenolic Metabolism in Plants. Press, NY, pp. 325–373.Stubenrauch, A.V. and C. W. Mann (1913). Factors governing the successful storage of California
table grapes. U.S.D.A. Bulletin No. 35.Winkler, A. J., J.A. Cook, W. M. Kliewer and L. A. Lider (1974). General Viticulture. Second edition.
UC Press, pp 572–573.Zieslin, N. and R. Ben-Zaken (1991). Peroxidases, phenylalanine ammonia-lyase and lignification in
peduncles of rose flowers. Plant Physiol. Biochem. 29(2): 147–151.
320 A. A. Gardea et al.
FRUIT POSTHARVEST TECHNOLOGY: INSTRUMENTALMEASUREMENT OF RIPENESS AND QUALITY
PILAR BARREIRO, MARGARITA RUIZ-ALTISENT, CONSTANTINO VALERO AND
JAVIER GARC IA-RAMOSPhysical Properties Laboratory, LPF. Dept. de Ingeniería Rural – ETSIAUniversidad Politécnica de Madrid, Spain. email:[email protected]
1. INTRODUCTION
The Physical Properties Laboratory (LPF) directed by Prof. Margarita Ruiz-Altisenthas been working on fruit quality assessment for more than 20 years now. Whatwe present here is a compendium of this knowledge. We have refused the idea ofmaking an exhaustive list of all scientific contributions on this topic during thisperiod. Instead the reader will find discussions about theoretical and practicaltopics concerning instrumental measurement of quality in fruits. From someapproaches to the definition of quality, to the role of the different agents involvedin the quality assessment process. A review of most used and recent techniques tomeasure each quality parameter is presented, as well as the proper rules to performthe measurements (sampling, good laboratory practices) and the way to evaluate andquantify the error level of an instrument (metrology). Finally on-line measuring,sensor fusion and the automation process are discussed. Also a reference is madeto a European Concerted action: Artificial Sensing Techniques for the Evaluationof Quality (ASTEQ, FAIR CT97-3516), now running, where near 15 research centres(10 countries) are involved.
In order to offer additional information to the reader, there is a small numberof relevant and/or recently published books in the reference list. Additionally anextensive list of web pages of interest is available at the end of the chapter. Someof them concern the most important research centres working on the subject. Therest of internet sites refer to commercial equipment available either for at-line(laboratory) or on-line (at the packing house) measurements of fruit quality, aswell as some companies specialised in sensory analysis.
1.1. Legal quality, consumer quality and company specifications
At least three different concepts are found when referring to ‘quality’ of a foodproduct:
(1) the relative to the qualified origin and/or procedures of field production; (2) the one referring to quality systems according to the ISO 9000 and further
standards, and (3) the accordance between consumer’s expectation and its satisfaction when eating
the product, which is the main issue in this chapter.
R. Dris and S. M. Jain (eds.), Production Practices and Quality Assessment of Food Crops,
© 2004 Kluwer Academic Publishers. Printed in the Netherlands.
321
Vol. 3, “Quality Handling and Evaluation”, pp. 321–340.
The quality properties that are standardised in the regulatory body, legal quality(UN, ECE standards for fresh fruit and vegetables E.91.II.E.42), are those that everyproduct in the market has to comply with in order to enhance the globalisation ofthe market of fresh produce. The properties which could be standardised have tobe such that, either there exist some magnitudes to be measured, like: size, shape,presence and size of external damages, or else they are not included in the standards.Some properties may be (and are) included, based on subjective evaluation: colour,and its distribution, typical varietal features, occurrence of off-shapes. It is obviousthat regulations can not include properties which can not be measured with definedprotocols.
It is well known that all this situation has drawn the market to a point where manyfruits and vegetables do not satisfy the consumer.; this is consumer quality. Inmany cases beautiful fruits, for example peaches, or pears, are completely inedible;others are tasteless, as mealy apples. One example is the practice of ‘degreening’oranges. The present standards establish minimum colour for the mandarins; atthe beginning of the season, colour of these fruits is still mostly green; so, thereexists the technique of degreening, which consists of a treatment in a closed chamberwhere ethylene is applied at specific temperatures and times. The peel develops abeautiful orange colour, apt for the market, but the sugars in the inside flesh maybe non-existent.
Growers and distributors are now concerned about developing the so calledcompany specifications, which go far beyond the legal quality, summarising therelevant intrinsic properties that the consumer will accept: firmness, sugar andacid contents, aromas (juice content is already established as a more or less standardmeasurement) also Vitamins. This implies the definition of the magnitudes whichcharacterise these properties: firmness in N or kg/cm2, sweetness as soluble solidscontent in °Brix, total acid content (in ml/kg; or pH); content of ascorbic acid orcarotene in mg/kg; and the selection of instruments and protocols in order to carryout the measurements at the production site, and possibly at the auctions. However,this involves sampling strategies, equipment installation, data acquisition and man-agement systems, decision aids, all of them needing a feasible and cheap solution.At this stage the question is: do they have the required tools and expertise?, or isit just a negotiation mechanism? We hope the reader will have an overview of thestate of the art by the end of this chapter.
2. WHO NEEDS TO MEASURE QUALITY
All actors in the production-distribution chain: producers, packing houses, ware-housemen, wholesaler and retailers, are potential users of instruments and equipmentfor measuring fruit and vegetable quality properties. The pressure now exerted bythose potential users is giving impulse to technological development, with the aimto solve the frequent problems arising in the negotiations between those actors. Alsosome agro-insurance agents and technology transfer institutions are potential usersof this equipment
322 P. Barreiro et al.
What these users ask for may be summarised by: objectivity, sensibility,precision, reproducibility, portability, fast and easy operation, possibly non-destruc-tiveness, extended use with world-wide accepted threshold values, and low cost. Thepriority given to these requirements depends on the different applications: controllaboratories need a lower portability, whereas a higher robustness; ‘fast’ operationmay be a priority for manual operation (laboratories at-line); on-line, automatic appli-cations demand a high-speed 10 fruits per second operation. Finally, low cost isalso relative: it may be established in 400 for the growers and 4000 for on-site laboratories; (up to 40,000 for research laboratories) per instrument unit.
3. QUALITY PARAMETERS OF FRUITS
In the aim of defining quality parameters and developing instrumental systems formeasuring fruit quality, we need to distinguish four different concepts:
• first a ‘property’, or quality property: it is rather an idea, well known by mostconsumers and experts, which lacks a precise physical meaning (for example:firmness or consistency);
• second a ‘magnitude’, which is the value of a parameter with a defined physicalsignificance and units; for example: puncture force (N) or force/deformation(N/mm); modulus of elasticity (N/m2);
• third, we need the definition of a ‘test’ and an instrument with a testing protocol:(for example: probe rupture by compression or by extension; Magness-Tayloror Effegi penetrometer; non-destructive impact or acoustic response meter); and
• fourth, we need the definition of a ‘scale’: the distance between consecutive divi-sions. Scales may be linear or non-linear; non-linear scales are usually the oneswhich relate best to sensorial perceptions.
Table 1 summarises most relevant quality attributes for several fruits as statedthrough consumers (818) and professionals (77 producers and 26 warehousemen)survey in a European Project (FAIR CT 95 0302, ‘Mealiness in fruits’) and otherparallel sources of information. Nearly in all cases the most relevant quality attributeis an internal property such as firmness or taste; this is related to the fact thatother important quality attributes are already met: size, shape, cleanness and soon.
To be able to quantify a property it is necessary to use some magnitudes whichare closely related to it. Being this relationship not evident in many cases, a sensorypanel is needed at the first stage. In other cases, a clear or common-sense relationshipexists between a property and a magnitude (firmness measured by resistance topenetration, N/m2). Beside, there is the need for the development of new instrumentsto measure properties which already have an instrumental reference. This is whynew techniques are investigated, looking for improvements: instruments that arefaster, non-destructive, more portable, more reliable, more precise and accurate,etc.
One very much discussed question, which is sometimes used to point out the
Fruit Postharvest Technology 323

impossibility of meeting the consumers expectations, is that the consumers ofdifferent areas (markets, states) have different appreciation of fruit and vegetablequality. This, on one hand, is not completely true, as we will analyse in an exampleon quality of apples. On the other hand, if there is such different groups of con-sumers, the market should be able to inform them properly and reliably on the(intrinsic) properties of each product on the shelf, so that they can make theirchoice and be satisfied.
Recently, in the scope of the mentioned European joint R&D project (FAIR CT95 0302) dealing with apple quality, one of the Institutions made a very detailedstudy on consumers (apple) preferences from different nationalities: UK, Danish,Flemish, French, Spanish and Belgian. On a first sensory panel test, 41 attributeswere assessed, for example: hardness, crispness, juiciness, watery, green sweet, floral,bitter, etc, etc: these are named ‘descriptors’ by the sensorial experts. Then, arepertory grid with 125 consumers was carried out with three different apple vari-eties in every country. The terms were translated into the different languages, afterprevious consumer studies. The conclusion of this study was that
• the overall perception of the descriptors for the quality of apples is similar,what suggests ‘a cross-cultural consensus with respect to consumer perception’(of mealiness in apples), and hence these selected sensory attributes, in thiswell known fruit,
• on the other hand, it was shown that, being this specific ‘intrinsic’ property(‘mealiness’) similarly perceived, different consumers might have different appre-ciation of it: most of them do not like it, some of them do.
This is good news, as there appears the possibility of developing instrumentation(as was in fact done for mealiness) to measure the properties, whose results canbe used to define more precisely any fresh product for the choice of the consumer.Thus the market begins to accept that the features which the consumer relates toits perception of quality when eating fresh products are indeed ‘quality (intrinsic)properties’ of the product itself. This opens the possibility for analysing theseproperties and advancing to its instrumentation.
324 P. Barreiro et al.
Table 1. Most relevant quality attributes (or defects) for several fruit species as stated throughconsumers (818) and professionals (77 producers and 26 warehousemen) survey in a European Project(FAIR CT 95 0302, ‘Mealiness in fruits’).
Species Most relevant Second Thirdquality attribute
Apple Firmness/texture Bruises Taste (sugar and acidity)Pear Firmness Taste (sugar and acidity) BruisesPeach Firmness Taste (sugar and acidity) BruisesApricot Firmness Sugar ColourTomato Colour Firmness Taste (sugar and acidity)Melon Sugar Colour –Citrus Rots-molds Blemishes/Bruises Taste (sugar and acidity)
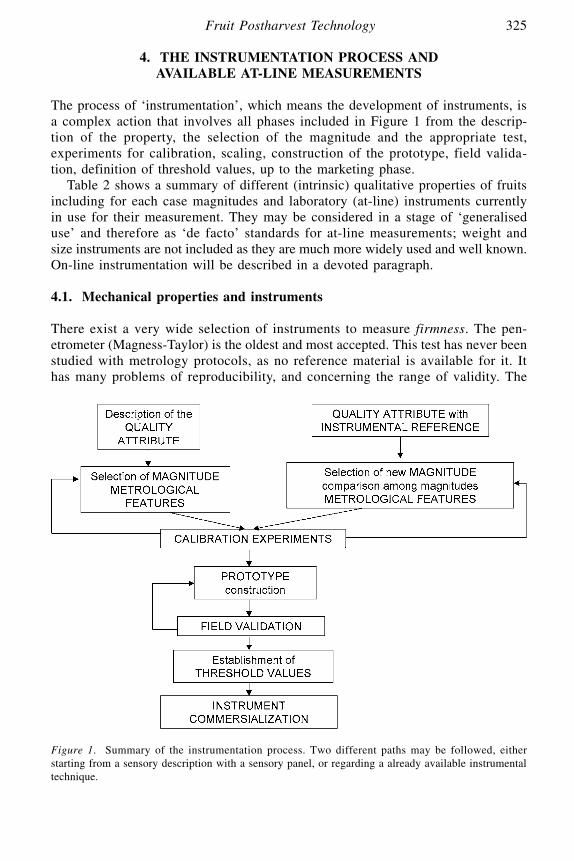
4. THE INSTRUMENTATION PROCESS AND AVAILABLE AT-LINE MEASUREMENTS
The process of ‘instrumentation’, which means the development of instruments, isa complex action that involves all phases included in Figure 1 from the descrip-tion of the property, the selection of the magnitude and the appropriate test,experiments for calibration, scaling, construction of the prototype, field valida-tion, definition of threshold values, up to the marketing phase.
Table 2 shows a summary of different (intrinsic) qualitative properties of fruitsincluding for each case magnitudes and laboratory (at-line) instruments currentlyin use for their measurement. They may be considered in a stage of ‘generaliseduse’ and therefore as ‘de facto’ standards for at-line measurements; weight andsize instruments are not included as they are much more widely used and well known.On-line instrumentation will be described in a devoted paragraph.
4.1. Mechanical properties and instruments
There exist a very wide selection of instruments to measure firmness. The pen-etrometer (Magness-Taylor) is the oldest and most accepted. This test has never beenstudied with metrology protocols, as no reference material is available for it. Ithas many problems of reproducibility, and concerning the range of validity. The
Fruit Postharvest Technology 325
Figure 1. Summary of the instrumentation process. Two different paths may be followed, eitherstarting from a sensory description with a sensory panel, or regarding a already available instrumentaltechnique.
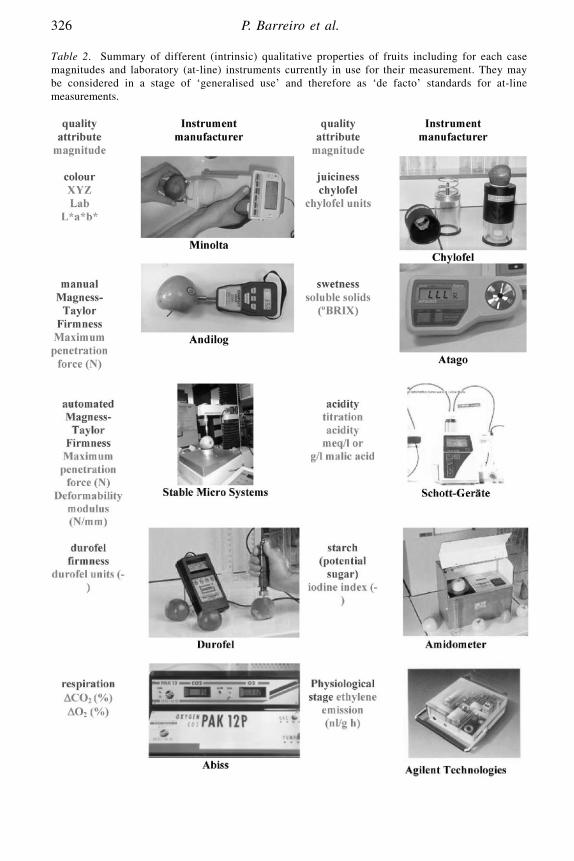
326 P. Barreiro et al.
Table 2. Summary of different (intrinsic) qualitative properties of fruits including for each casemagnitudes and laboratory (at-line) instruments currently in use for their measurement. They maybe considered in a stage of ‘generalised use’ and therefore as ‘de facto’ standards for at-linemeasurements.

rest of firmness-measuring instruments are considered non-destructive. We have:acoustic resonance (AIR-KU Leuven), impactometry (LPF-UPM), Durofel (Copa-Technology), and ultrasound (TECHNION and the Volcani Centre). Each of themyield different magnitudes, which are loosely correlated to destructive penetrom-eter values, as they measure rather deformability, more closely related to hand-heldsensory appreciation. Destructive penetrometry resembles more to ‘biting’ firmness.Correlation between the Magness-Taylor penetrometer and other non-destructivefirmness instruments improves when using penetrometer force/deformation ratiorather than force. However, this parameter can only be registered through automated‘universal’ or ‘texture’ tests and not with manual instruments.
Turgidity is directly related to water status, being turgor or pressure potentialthe magnitude used for its measurement. The complexity of this magnitude needsspecialised laboratories. In the case of pome fruits, though, we have shown thatdeformation at puncture with a 0.5 mm-diameter rod is very indicative of theturgor stage of the (external tissue of the) fruit, being ‘freshness’ but also suscep-tibility to bruising well correlated to this property of apples.
Juiciness, described as the amount of juice that is easily liberated on biting thefruit, is not necessarily related to total water content. It is mostly related with theway the tissue breaks at biting. So, mealy texture is ‘dry’ because the cells do notbreak, but rather separate; turgid and densely packed cells break and release thejuice, as happens in the so-called ‘crisp’ textures. The instrument called Chylofelconsists of the introduction of a probe of fixed volume (2 cm3) and recovery ofthe released juice. With a calculated density of the juice of 1 g/cm3, the percentageof juice in it can be determined. This test, lacking a correct metrological evalua-tion as no reference materials exist for it, is not very precise, and can only beused for characterising fruit batches, and not to obtain individual fruit data; an advan-tage is that it can be used as a reliable technique for extracting a juice sample tobe used afterwards for the evaluation of chemical composition.
4.1.1. Optical properties and instruments: colour and spectrophotometers
The existing equipment to objectively evaluate colour are colorimeters and spec-trometers in the visible (VIS) range. Both instruments give co-ordinates XYZ, Laband L*a*b*. The first (XYZ) were defined in the 1930s by the CIE: CommissionInternational de l’…clairage, and they reproduce the human vision for a standard-ised viewer. Human visual perception is much sharper in the greens than in thereds, and so are the XYZ co-ordinates. The colour spaces Hunter Lab and CIEL*a*b* give a more objective representation of colour differences between theproducts (something very important in post-harvest ripening!). CIE L*a*b* are asmall modification of the Hunter Lab established in 1974 to improve the unifor-mity of distribution for the different chromatic surfaces.
Visible spectrometers, in spite of colorimeters, are able to register point reflectancevalues for (very) small areas of the spectrum (between 5 and 20 nanometers widewindows) and therefore can evaluate specific pigments, as chlorophylle. Variationsin this and in other pigments are better correlated to, for example, post-harvestripening processes than the colour coordinates.
Fruit Postharvest Technology 327
4.1.2. Chemical properties and instruments: taste and aroma
These are the ‘intrinsic’ properties the consumer expects to find in a fresh, high-quality fruit or vegetable. And these are probably the most difficult (or time-consuming) to measure at present. We count with different instrumental methodsto measure the attributes that affect the taste: basically sweetness, acid content. First,soluble solids (SS) – more or less closely related to ‘sweetness’, depending onthe fruit considered – are measured by refractometry. Refractometers are verycommon in most laboratories; they count on reference standards and are very preciseand reliable. A disadvantage is that they have low specificity, as a similar valueof soluble solids (°Brix) is not always referring to the same chemical composi-tion. Refractometry is destructive, as it needs a few drops of juice on the instrument.This also happens with acids determination, as the acidity measurement also needssome juice to be titrated in a solution; automatic titrators help (more or less) inthe assessment of high numbers of samples in the laboratory. The uncertainty ofthese procedures lies in the recovery of the juice, which may introduce much vari-ability in the results. The content of sugars and acids both add to the taste of afruit or vegetable. We have to bear in mind that both are ‘dissolved’ in the sap; ifno sap is released, no taste can be sensed: textural characteristics are closely cor-related with chemical flavouring factors, as has been well demonstrated by theexperts in sensorial analysis.
NIR reflectance has been successfully used for the estimation of chemical sub-stances or groups, in solid products under static measurements. The main andwell-known application for many years has been the estimation of moisture in grain;more recently NIR reflectance instruments are used to determine protein in animalfeed, or different components in flour, for example. The application of NIRreflectance to intact fruits is newer. In the European project (CAMAR CT91 0206)finished 6-years ago, researchers applied the NIR spectrum directly onto the fruits(apples and peaches) using optical fibre bundles on its surface. Sugar (measuredas soluble solids) was able to be assessed with an accuracy of +1.2 °Brix, in afew seconds.
The next and most active (and controversial) instrument development concernsthe aromas. Aromatic compounds in fruits and vegetables is an un-explored universe.As an example, in apples, more than 350 aromatic compounds have been charac-terised, which add to the aromatic composition, either sensed by the consumers,in the different varieties, ripeness stages, etc. or analysed chemically (by GC, gas-chromatography). Many of those compounds appear in parts per billion (ppb) onthe headspace of the fruits. Moreover, some of them are mixed at much higherconcentrations (up to 1 million times higher); and above all this: human percep-tion is independent of actual concentration of the gas. It is today impossible forany research group to prove that aroma in fruits can be reliably sensed by the so-called ‘electronic noses’. These are composed by an array of sensors which givean unspecific response to the different aromatic compounds. Nowadays researchobjectives are in the line of identifying ‘indicator’ signals, or specific compoundsthat can be traced reliably by the sensor(s) and relate them to a selected propertyone might be interested in: a comprehensive ‘quality’, or the presence of some detri-
328 P. Barreiro et al.

mental gases like, for example, alcohol in anaerobic storage problems, or hope-fully, some diseases. Micro-chromatographs are used in some laboratories for fast(20 s/sample) ethylene determination, the hormone which indicates the physiolog-ical stage of the fruits, and related to the time for optimal consumption. Also oxygenconsumption and CO2 production can be reliably measured and monitored in closechambers, as it is done very generally in fruit storage facilities.
5. HOW TO EVALUATE THE PERFORMANCE OF THE INSTRUMENTATION. METROLOGY
As it is well known, Metrology is the science devoted to the evaluation and the quan-tification of the level of error of an instrument. Various aspects are relevant in theresponse of an instrument:
• sensitivity: the ability of an instrument to react to a stimulus. It is defined asthe slope response/stimulus. For digital instruments there is a step-like responsefor increasing stimulus. In these cases the knowledge on the resolution (heightof the step) is fundamental as it refers to the range of response where no dif-ferences can be stated. In Figure 2(a) different resolutions are represented asdots of varying diameter. Points inside a resolution dot cannot be differentiatedwith an instrument, so the larger the dot, the poorer the resolution is,
• specificity: it indicates the selectivity against stimuli which might come from
Fruit Postharvest Technology 329
Figure 2. Representation of several metrological features. The centre of the target represents a knowtrue value to be assessed with the instrument.

the sample, different from the one to be measured. For example, if we want tomeasure firmness, it is important that the instrument is not affected by otherfactors as the turgor or dehydration of the sample),
• precision: the repeatability, stated as standard deviation or coefficient of varia-tion of a measurement taken on a reference sample under identical conditions.In Figure 2(b)&(c) each dot refers to an individual measurement, wheneverthese dots are very near to each other there is a high precision,
• accuracy: the degree of approximation of a measurement to a true value of thecorrespondent magnitude (centre of the target in Figure 2(d)). It implies theexistence of a reference of known true value (certified reference material), and
• reproducibility: the degree of approximation of a pool of measurements of acertain magnitude measured with different methods, different instruments, dif-ferent operators or conditions (temperature, relative humidity . . .)
These metrological parameters refer to the instrument, they do not include thesampling variability, which in the case of fresh produce is usually very high,between – as well as within individual specimens (i.e. soluble solids content ofpeaches).
In most of the quality parameters reviewed here, no standard reference mate-rials exist, to establish the accuracy of the presented instruments. An exception:chemical measurements (soluble solids, acidity, aromas), where it is easy to preparesubstances to be used as reference. Colour references can be used as standards forthe VIS optical instrumentation. Destructive texture parameters do not count withthis possibility; in this case, the use of very homogeneous fruit samples can beadopted to establish metrological parameters. An evaluation of the accuracy andreproducibility is given just by the many years of common use. Non-destructivecontact firmness measurements can be referenced to known hardness and elas-ticity rubber balls for example; in this case they are used just as precision standards,but not as accuracy standards, as they have not yet been defined as such.
6. DAILY APPLICATION OF AT-LINE INSTRUMENTAL TECHNIQUES. SAMPLING
Whenever an at-line instrument is used, there is the need for sampling the product.Moreover, there is the need for demonstrating that the sample characteristics areextensible to those of the full batch or load under inspection. ISO 874 regulatessampling for fresh fruits and vegetables. Several definitions are given by suchinternational standard:
• entry: quantity of produce sent or received at once within a contract or trans-port document. It may gather one or more batches,
• batch: quantity of produce with homogeneous characteristics (identical variety,similar ripeness stage, identical package . . .)
• elementary sample: small quantity taken from a location within a batch,• global sample: result of gathering all the elementary samples from a batch,• reduced sample: quantity derived if necessary from the global sample, and
330 P. Barreiro et al.
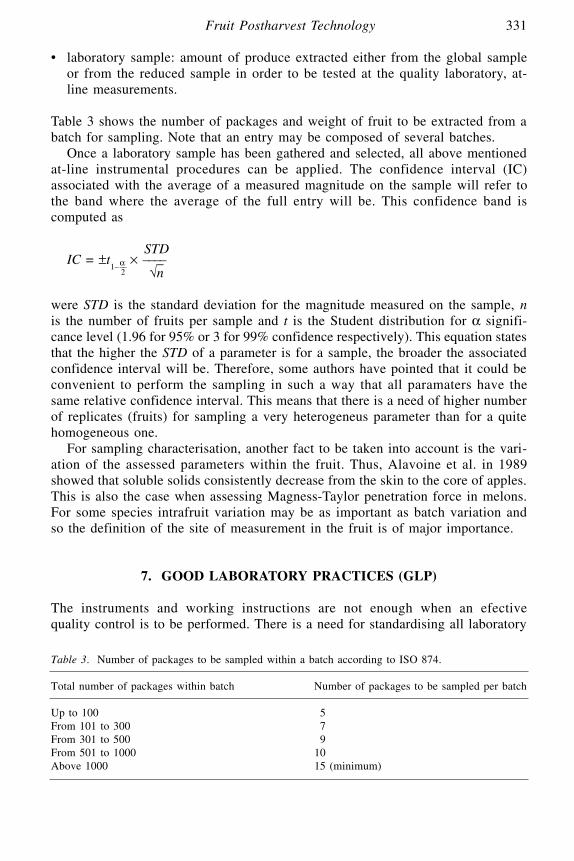
• laboratory sample: amount of produce extracted either from the global sampleor from the reduced sample in order to be tested at the quality laboratory, at-line measurements.
Table 3 shows the number of packages and weight of fruit to be extracted from abatch for sampling. Note that an entry may be composed of several batches.
Once a laboratory sample has been gathered and selected, all above mentionedat-line instrumental procedures can be applied. The confidence interval (IC)associated with the average of a measured magnitude on the sample will refer tothe band where the average of the full entry will be. This confidence band iscomputed as
STDIC = ±t
1–α––2
× ––––√
–n
were STD is the standard deviation for the magnitude measured on the sample, nis the number of fruits per sample and t is the Student distribution for α signifi-cance level (1.96 for 95% or 3 for 99% confidence respectively). This equation statesthat the higher the STD of a parameter is for a sample, the broader the associatedconfidence interval will be. Therefore, some authors have pointed that it could beconvenient to perform the sampling in such a way that all paramaters have thesame relative confidence interval. This means that there is a need of higher numberof replicates (fruits) for sampling a very heterogeneus parameter than for a quitehomogeneous one.
For sampling characterisation, another fact to be taken into account is the vari-ation of the assessed parameters within the fruit. Thus, Alavoine et al. in 1989showed that soluble solids consistently decrease from the skin to the core of apples.This is also the case when assessing Magness-Taylor penetration force in melons.For some species intrafruit variation may be as important as batch variation andso the definition of the site of measurement in the fruit is of major importance.
7. GOOD LABORATORY PRACTICES (GLP)
The instruments and working instructions are not enough when an efectivequality control is to be performed. There is a need for standardising all laboratory
Fruit Postharvest Technology 331
Table 3. Number of packages to be sampled within a batch according to ISO 874.
Total number of packages within batch Number of packages to be sampled per batch
Up to 100 05From 101 to 300 07From 301 to 500 09From 501 to 1000 10Above 1000 15 (minimum)
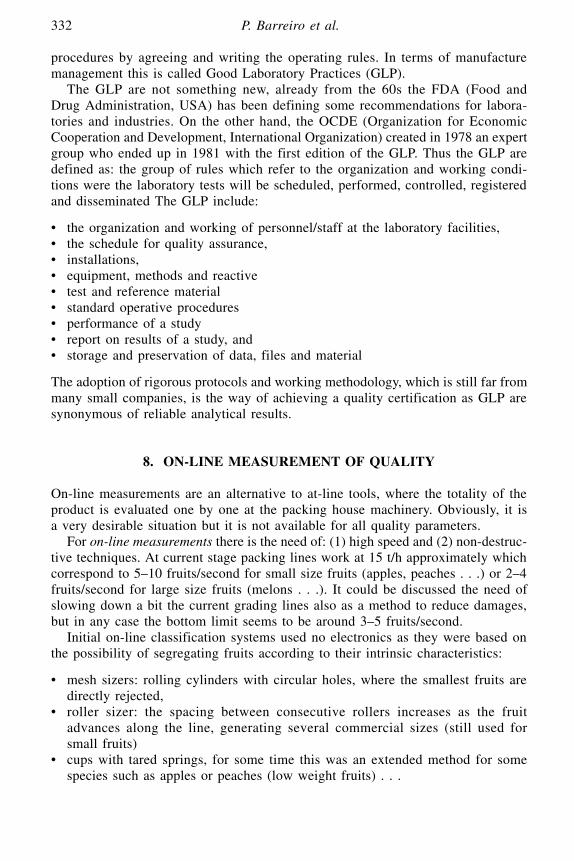
procedures by agreeing and writing the operating rules. In terms of manufacturemanagement this is called Good Laboratory Practices (GLP).
The GLP are not something new, already from the 60s the FDA (Food andDrug Administration, USA) has been defining some recommendations for labora-tories and industries. On the other hand, the OCDE (Organization for EconomicCooperation and Development, International Organization) created in 1978 an expertgroup who ended up in 1981 with the first edition of the GLP. Thus the GLP aredefined as: the group of rules which refer to the organization and working condi-tions were the laboratory tests will be scheduled, performed, controlled, registeredand disseminated The GLP include:
• the organization and working of personnel/staff at the laboratory facilities,• the schedule for quality assurance,• installations,• equipment, methods and reactive• test and reference material• standard operative procedures• performance of a study• report on results of a study, and• storage and preservation of data, files and material
The adoption of rigorous protocols and working methodology, which is still far frommany small companies, is the way of achieving a quality certification as GLP aresynonymous of reliable analytical results.
8. ON-LINE MEASUREMENT OF QUALITY
On-line measurements are an alternative to at-line tools, where the totality of theproduct is evaluated one by one at the packing house machinery. Obviously, it isa very desirable situation but it is not available for all quality parameters.
For on-line measurements there is the need of: (1) high speed and (2) non-destruc-tive techniques. At current stage packing lines work at 15 t/h approximately whichcorrespond to 5–10 fruits/second for small size fruits (apples, peaches . . .) or 2–4fruits/second for large size fruits (melons . . .). It could be discussed the need ofslowing down a bit the current grading lines also as a method to reduce damages,but in any case the bottom limit seems to be around 3–5 fruits/second.
Initial on-line classification systems used no electronics as they were based onthe possibility of segregating fruits according to their intrinsic characteristics:
• mesh sizers: rolling cylinders with circular holes, where the smallest fruits aredirectly rejected,
• roller sizer: the spacing between consecutive rollers increases as the fruitadvances along the line, generating several commercial sizes (still used forsmall fruits)
• cups with tared springs, for some time this was an extended method for somespecies such as apples or peaches (low weight fruits) . . .
332 P. Barreiro et al.

Nowadays, with electronics getting more and more accessible, the general schemefound for sensing on-line is composed by: sensor, processor/controller, and actuator(Figure 3).
General considerations for an electronic measurement system can be summarisedas:
• presentation of the product to the sensor: the ideal situation is a non-contactmeasurement; for this reason vision systems are ideal,
• sensing device: there is a need for the fruit to be individualised, while the sensorresponse has to be very quick (<100 ms),
• processor/controller: the main issue is to establish the distance between the sensorand the actuator as a matter of the time delay generated by this element whichincreases rapidly for complex calculations such as image analysis. Encoders areneeded in order to trace the movement of the fruit between the sensor and theactuator. Sensor and actuator are commonly mounted on the same chain to facil-itate trazability, and
• actuator: fruits have to be individualised just like for the sensing device. Electricor pneumatic actuators may be used. Hydraulic actuators are disregarded dueto their low speed and to the risk of contaminating the product.
Fruit Postharvest Technology 333
Figure 3. Example of an on-line measuring system for melons (Sumitomo Metal Mining). Sensorand actuator are mounted on the same chain to facilitate fruit trazability through step-wise motors.
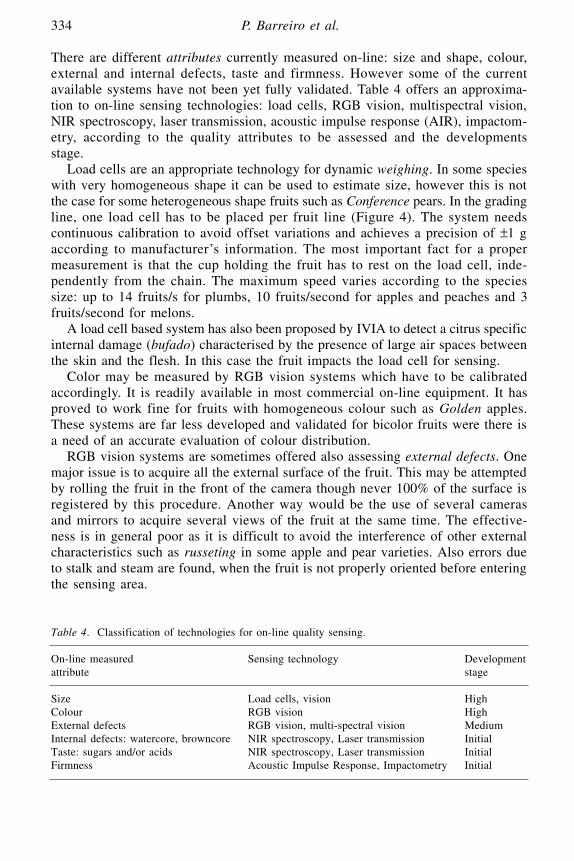
There are different attributes currently measured on-line: size and shape, colour,external and internal defects, taste and firmness. However some of the currentavailable systems have not been yet fully validated. Table 4 offers an approxima-tion to on-line sensing technologies: load cells, RGB vision, multispectral vision,NIR spectroscopy, laser transmission, acoustic impulse response (AIR), impactom-etry, according to the quality attributes to be assessed and the developmentsstage.
Load cells are an appropriate technology for dynamic weighing. In some specieswith very homogeneous shape it can be used to estimate size, however this is notthe case for some heterogeneous shape fruits such as Conference pears. In the gradingline, one load cell has to be placed per fruit line (Figure 4). The system needscontinuous calibration to avoid offset variations and achieves a precision of ±1 gaccording to manufacturer’s information. The most important fact for a propermeasurement is that the cup holding the fruit has to rest on the load cell, inde-pendently from the chain. The maximum speed varies according to the speciessize: up to 14 fruits/s for plumbs, 10 fruits/second for apples and peaches and 3fruits/second for melons.
A load cell based system has also been proposed by IVIA to detect a citrus specificinternal damage (bufado) characterised by the presence of large air spaces betweenthe skin and the flesh. In this case the fruit impacts the load cell for sensing.
Color may be measured by RGB vision systems which have to be calibratedaccordingly. It is readily available in most commercial on-line equipment. It hasproved to work fine for fruits with homogeneous colour such as Golden apples.These systems are far less developed and validated for bicolor fruits were there isa need of an accurate evaluation of colour distribution.
RGB vision systems are sometimes offered also assessing external defects. Onemajor issue is to acquire all the external surface of the fruit. This may be attemptedby rolling the fruit in the front of the camera though never 100% of the surface isregistered by this procedure. Another way would be the use of several camerasand mirrors to acquire several views of the fruit at the same time. The effective-ness is in general poor as it is difficult to avoid the interference of other externalcharacteristics such as russeting in some apple and pear varieties. Also errors dueto stalk and steam are found, when the fruit is not properly oriented before enteringthe sensing area.
334 P. Barreiro et al.
Table 4. Classification of technologies for on-line quality sensing.
On-line measured Sensing technology Development attribute stage
Size Load cells, vision HighColour RGB vision HighExternal defects RGB vision, multi-spectral vision MediumInternal defects: watercore, browncore NIR spectroscopy, Laser transmission InitialTaste: sugars and/or acids NIR spectroscopy, Laser transmission InitialFirmness Acoustic Impulse Response, Impactometry Initial

The combination of image and spectroscopy, which produces spectral imaging,is a great development in fruit classification equipment. For example, bruises canbe much better ‘seen’ by a camera when using spectral images at specified wave-lengths than when using complete light. Moreover, these spectral images can becombined together to better enhance specific surface damages.
Also artificial vision is widely used today in on-line equipment for sizing. UsuallyCCD (Couple Charge Devices) cameras are installed on every fruit line, with whichsize and shape are determined for grading fruit according to standards. The presentneed imposed by the manufacturers for an output of 6–10 fruits per second seemsquite incompatible with the precision in size grading (1–2 mm in diameter in oranges)imposed by standards.
Today NIR spectroscopy (see Paragraph 4) has been improved and is offeredon-line by several manufactures since the last two years, aiming that it is able tomeasure taste and internal disorders (Figure 4). There are many problems thathave to be solved in such on-line systems. The first one deals with the use of aCCD sensor array which reaches only the very proximal infrared (up to 1100 nm)since other type such as InGaAs (Indium, Gallium and Arsine) or PbS (lead sulphur)
Fruit Postharvest Technology 335
Figure 4. On-line measuring systems: Load cell, impactometry and NIR spectroscopy.
detectors are far too expensive, but could provide much better information. A secondproblem deals with the stability of the calibrations which have to be performedvery frequently. Another drawback to be pointed out is the difficulty for fruit pre-sentation to the sensor. There are two different approximations on-line NIRspectroscopy: reflectance and transmittance, each of them having their own specificdifficulties. Current on-line NIR systems (specially the one using transmittance) offerthe detection of internal defects such as watercore and browncore though littledata are available on it.
AIR and impactometry for assessing fruit by fruit firmness are available as at-line non-destructive technologies as stated in Paragraph 4. They are in principlequick enough to be mounted on-line at 5–7 fruits/s. In fact there are prototypeswith the system already running, at a pre-commercial stage. Extensive tests are beingcarried out to establish their applicability to different fruits and real needs.
Actually, there is also a new commercial Japanese system using the transmis-sion of NIR laser inside the fruit to estimate sugars and to assess internal defectssuch as watercore. The main advantages stated by the manufacturer is the higherintensity and stability of the laser sources, compared to halogen light, which enablea better signal to noise ratio in the detector as well as an accurate control of thewavelength in use. The manufacturer of this first laser system indicates that thereis a low sensitivity of the system to an uncontrolled positioning of the fruit, whichcould be promising.
New optical technologies are also at development stage to be mounted on linesuch as X-ray and NMR for internal quality sensing, or new optical device for 3Dsize evaluation. The main objective is the assessment of the whole fruit-body. A newtechnique called TDRS (time-domain diffuse reflectance spectroscopy), evaluatedin the European Project FAIR CT 96 1060), is being tested with some success stillat-line but with on-line prospective. It uses VIS and NIR lasers at various wave-lengths applied through a single optical fibre, and detection is accomplished byphoton-counting equipment. It differs from the laser systems already mentioned inthat it assesses both absorbency and scattering of light in a differential way, inprinciple allowing textural and chemical evaluation independently.
9. SENSOR FUSION AND AUTOMATION OF INFORMATION SYSTEMS
From the brief summary presented here on quality measuring instrumentation, itis evident that many different sensors and instruments exist, which can be used toevaluate different quality aspects of fruits and vegetables. Every product will haveits own pertinent quality factors, with the corresponding magnitudes and tests, theresults of which will be combined in appropriate protocols. Two aspects remain ata development stage: one is the clear need for automating quality laboratories andmerging of data, while the second is the interest in combining the information forvarious different on-line sensors for decision purposes, called ‘sensor fusion’.
The automation of laboratories to determine quality parameters includes gath-ering many different sensing instruments with information systems (Figure 5), andhas following constraints:
336 P. Barreiro et al.

Fruit Postharvest Technology 337
Figure 5. Example of automation of a quality laboratory and its integration within the manufactureinformation system (Valero and Ruiz-Altisent, 2000)

• sufficient replicates have to be carried out for every sampling unit and batch, • different number of replicates are needed for different parameters to be measured,• the instruments are very different between them, in their use, in the presenta-
tion of the samples, in the data obtained: scalar, signals, multidimensionality,• data have to be gathered in common databases, which have to be complete, acces-
sible, with efficient information search, self-exploratory, user-friendly, etc, • decisions must be taken fast, and• many samples have to be processed per day.
All this obliges to organise the system for data which follow very sparse patterns.The design has to be developed according to the commodities and to the needs ofthe individual users.
Sensor fusion is a brand new topic derived from the increasing number of sensorsavailable on-line. Steinmetz (1997) has made a first categorisation of sensor fusionprocedures:
• independent fusion: in this case sensors are used autonomously which meansthat the number of final categories is the product of the number of classes madeper sensing tool i.e. a colour system with 3 classes combined with a 5 levelsizer leads to 15 commercial categories,
• competitive fusion: fusion is focused on reducing the level of error of the sensors.It is used for sensors giving the same type of information such as weight measuredwith a load cell and size assessed with a vision system. Beside, to avoid erraticdata one should establish ranges of validity of the results so that the systemcan automatically reject them and use the redundant sensor response instead,and
• complementary fusion: the objective is to integrate the information from severalsensors either at a low level (data merging) or by high level fusion (combiningeach sensor decision). For this purpose, it has been proposed that a hierarchicalintegration of the information could be made for the different instruments’ data,and provide the system to mimic the criteria of assignation of priorities madeby the consumers.
As a conclusion, exciting and challenging research and development, and inno-vation topics are opened in the aim of technifying fruit industry. We should beable to evaluate and compare them, giving some clues of the actual state of theart to the potential users.
REFERENCES
Alavoine, F., M. Crochon, C. Fady, J. Fallot, P. Moras and J. C. Pech (1990). La qualité gustativedes fruits. Methodes pratiques d’analyse. Ed. CEMAGREF. ISBN 285 362 119 7.
Arthey, D. and P. R. Ashurst (2000). Fruit Processing. Nutrition, Products and Quality Management.Ed. Aspen Publications. ISBN 0834217333.
Bellon-Maurel, V. (ed.) (1998). SENSORAL 98. International Workshop on Sensing Quality ofAgricultural Products. Vol. 1 and 2. Ed. CEMAGREF. ISBN 2 85362 499 4.
338 P. Barreiro et al.

Bertrand, D. (ed.) (2000). La Spectroscopie Infrarouge et ses Applications Analytiques. Ed. TEC &DOC. ISBN 2 7430 0375 8.
CAMAR CT91 0206. Quality of Fruits: Engineering Research for Improving the Quality Preservationduring Pre and Postharvest Operations. Coordinator: Prof. Margarita Ruiz-Altisent, 1992–1994,www.cordis.lu.
FAIR CT95 0302. Mealiness of Fruits. Consumer Perception and Means for Detection. Coordinator:Prof. Bart Nicolai, 1996–1998, www.cordis.lu.
FAIR CT96 1060. Diffuse Reflectance Spectroscopy for the Evaluation of Fruit and Vegetables InternalQuality (DIFFRUIT). Coordinator: Ing. Claudio Zarotti, www.cordis.lu.
FAIR CT97-3516. ASTEQ: Artificial Sensing Techniques for the Evaluation of Quality. Coordinator:Prof. Douglas Rutledge, 1998–2001, www.cordis.lu.
Feinberg, M. (1999). L’assurance Qualité dans les Laboratoires Agroalimentaires et Pharmaceutiques.Technique & Documentation, Paris.
Guizard, C., V. Bellon and F. Sevila (1992). Vision Artificielle dans les Industries Agro-Alimentaires.Ed. CEMAGREF. ISBN 2-85362-305-X.
Hildrum, K. I., T. Isaksson, T. Naes and A. Tandberg (1992). Near Infra-red Spectrosciopy. Bridgingthe Gap between Data Analysis and NIR Applications. Ed. Ellis Horwood. ISBN 0-13-617416-7.
International Organization for Standardization (ISO) (1995). Guide for the Expression of Uncertaintyin Measurement. Ed. ISO. ISBN 92-67-10188-9.
Shewfelt, R. L. and B. Bruckner (2000). Fruit and Vegetable Quality: An Integrated View. Ed. TechnomicPub. Co. ISBN 1566767857.
Steinmetz, V. (1997). Fusion Multisensorielle Appliquée en Temps Réel aux Décisions Qualitativessur les Produits Agro-alimentaires. Thèse. CEMAGREF-ENGREF.
Valero, C. and y M. Ruiz-Altisent (2000). Design Guidelines for a Quality Assessment System inFruits Centers and Hypermarkets. CIGR Electronic Journal vol. 2, http://agen.tamu.edu/cigr/volume2.html.
Wood, R., A. Nilsson and H. Wallin (1998). Quality in the Food Analysis Laboratory. Ed. The RoyalSociety of Chemistry. ISBN 085404566.
Web Pages of interest concerning fruit quality assessment:
RESEARCH GROUPSiru16.iru.etsia.upm.es Physical Properties Laboratory (LPF). Polytechnic University of Madrid (Spain)www.montpellier.cemagref.fr/giqual/CEMAGREF: Centre Nationale du Machinisme Agricole, des
Genies Rural, des Eaux et des Forets (France). GIQUAL ‘Génie Instrumental pour la QualitéAgroalimentaire
www.agr.kuleuven.ac.be KU: Katholike Universiteit Leuven (Belgium). Faculty of Agricultural andApplied Biological Science. Department of Agro-Engineering and Economics
cwisdb.cc.kuleuven.ac.be/research/T/team261315.htm Flanders Centre/Laboratory of PostharvestTechnology. Katholike Universiteit Leuven (Belgium)
www.sri.bbsrc.ac.uk SRI: Silsoe Research Institute (United Kingdom)www.technion.ac.il TECHNION: Israel Institute of Technologie (Israel)www.agri.gov.il Volcani Centre (Israel)postharvest.ucdavis.edu UC: University of California, Davis (USA)www.ivia.es IVIA: Instituto Valenciano de Investigaciones Agrarias (Spain)www.inapg.inra.fr/ens_rech/siab/asteq/ASTEQ concerted action: Artificial Techniques for the Evaluation
of Quality
FRUIT AND VEGETABLE ORGANIZATIONS AND TECHNOLOGY TRANSFER INSTITUTIONSwww.ctifl.fr Centre Technique Interprofessionnel des fruits et légumes (France)www.agris.be/nl/presenta/vbt.html Verbond Van Belgische Tuinbouwveilingen (Belgium)
www.opfh.com Organización de productores de_Frutas y Hortalizas (Spain)europolagro.univ-reims.fr Euroagropol (France)
Fruit Postharvest Technology 339

MECHANICAL PROPERTIES www.machpro.fr (andilog pressure and force gauges)www.stablemicrosystems.com (texture profile measurements)www.instron.com/universal_testing/index.htm (Universal Testing Machines)www.lloyd-instrument.co.uk (Universal Testing Machines)www.copa-technologie.com (durofel, chylofel, amidometer . . .)www.aweta.nl (acoustic impulse response)
COLORIMETRYwww.colorpro.com/info/vendors/meters.html (various equipments for colour assessment)www.minolta.com/japan/rio/e/spectrophoto.html (VIS spectrophotometers and colorimeters Minolta)www.hunterlab.com (colorimeters)
SPECTROSCOPYonly fruit oriented NIR instruments are includedwww.zeiss.dewww.perten.comwww.bran-luebbe.de
CHEMICAL PROPERTIES AND VOLATILE DETECTIONwww.atago.net (soluble solids)www.schott.com (automated tritration)www.chem.agilent.com (chromatography)www.bennex.no/instr1.html (abiss for O2 y CO2)www.pbi-dansensor.com (O2 and CO2 portable analysers)www.intlsensor.com (electrochemical sensors: O2, CO2, C2H4 . . .)www.theminispec.com (NMR)www.cyranosciences.com (electronic nose-polymer sensors)www.alpha-mos.com (electronic nose – metal oxide sensors)www.estcal.com (electronic nose – surface acoustic wave quart mycrobalance sensors)
METROLOGY AND GOOD LABORATORY PRACTICEwww.iso.ch International Organization for Standardizationwww.oecd.org/ehs/ehsmono/#GLP Organization for Economic Cooperation and Development: Good
Laboratory Practices
SENSOMETRYall refer to external services for quality analysis of food:www.mktres.demon.co.uk/sensory (Sensory Dimensions, United Kingdom)www.campden.co.uk/research/panels/panelcmp.htm (Sensory and Consumer panel, United Kingdom)www.camo.com/Services/Global/trained.htm (CAMO, USA)www.ift.org/ClasGuid/cg-sensoryevaluation.htm (ABIC International Consultants, USA)
ON-LINE QUALITY DETECTIONwww.aweta.nl (firmness, sugar, acidity, internal and external defects, Netherlands)www.caustier.com(size and colour, France)www.fomesa.com (size and colour, Spain)www.greefa.nl (size, colour and external defects, Netherlands)www.xpress.es/maxfrut.es (size and colour, Spain)www.maf-roda.com (size, colour and external defects, France)www.sammo.com (size and colour, Italy)www.compacsort.com (size, colour and sugar, New Zeland)www.smm.co.jp (sugar and internal defects, Japan)www.sacmi.com (firmness, sugar, acidity, and internal defects, Italy)www.unitec-group.com (size and colour, Italy)
340 P. Barreiro et al.

DEVELOPMENTAL CHANGES DURING STRAWBERRYFRUIT RIPENING AND PHYSICO-CHEMICAL CHANGESDURING POSTHARVEST STORAGE
WILFRIED SCHWAB AND THOMAS RAABLehrstuhl für Lebensmittelchemie, Universität Würzburg, Am Hubland, 97074 Würzburg, Germany
1. INTRODUCTION
Ripening is defined by a set of physico-chemical changes characteristic of each fruit.These usually involve transitions in colour arising from the degradation of existingpigments and the synthesis of new and often intensely coloured pigments, texturechanges resulting in tissue softening, and the production of highly distinctive flavoursand aromas which affect the palatability of the fruit. Changes involving senes-cence occur throughout development and are most obvious in the later stages asthe fleshy tissues disintegrate, leaving the seeds to survive. Ripening is thus partof a continuous developmental process in which several physiological phases mayoverlap (Moing et al., 2001).
The cultivated strawberry, Fragaria × ananassa, is a regular part of the dietsof millions of people. Known for its delicate flavour and rich in vitamin content,strawberry are cultivated in all arable regions of the globe from the Arctic to theTropics. Since strawberries are such a widely grown commodity, much researchhas been conducted on producing and maintaining these standards of fruit quality.Considerable effort has been expended on maximizing fruit growth in the fieldand increasing postharvest fruit quality. An excellent review has been publishedby Manning, 1993. In recent years, recombinant DNA technology has entered thearena of research on genes and enzymes involved in fruit ripening. Gene cloningand heterologous gene expression have proven to be powerful tools to elucidatethe physico-chemical changes during fruit development and decisive progress hasbeen achieved.
2. MACROSCOPIC CHANGES
The berry is a simple fruit, formed by enlargement of the overy of the pistil, thatremains fleshy and succulent when mature and contains immersed seeds. In thiscontext, strawberry (genus Fragaria) is a false fruit, having the true fruits or acheneson the outside of a fleshy receptable and attached to it through vascular connections.
Strawberry fruit growth as a function of time fits a single sigmoid curve or isbiphasic depending on cultivar. Fruit of strawberry grow rapidly, with full size beingattained approximately 30 days after anthesis, depending upon conditions. Thetime taken for fruit to become fully ripe is closely related to temperature and canvary between 20 and 60 days. This probably reflects an overall effect of tempera-ture on metabolic rate as determined by enzyme activity (Manning, 1993).
R. Dris and S. M. Jain (eds.), Production Practices and Quality Assessment of Food Crops,
© 2004 Kluwer Academic Publishers. Printed in the Netherlands.
341
Vol. 3, “Quality Handling and Evaluation”, pp. 341–369.
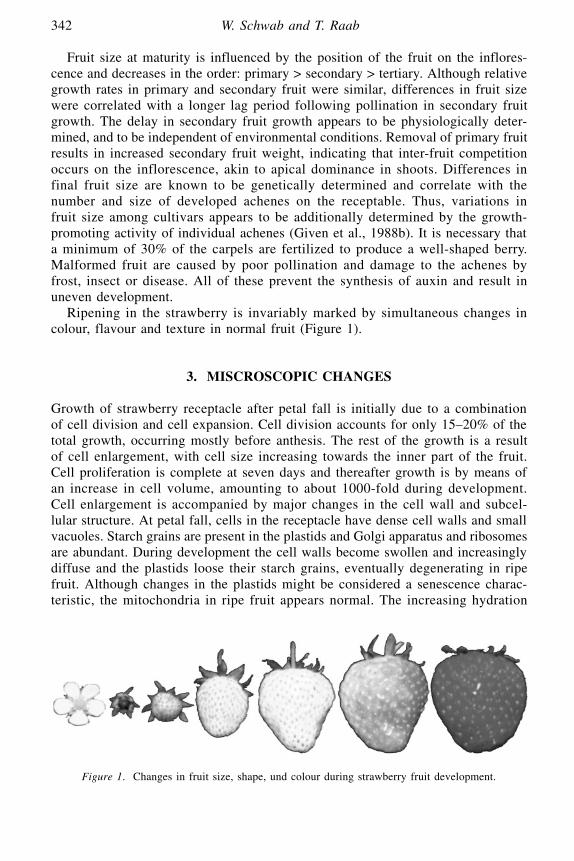
Fruit size at maturity is influenced by the position of the fruit on the inflores-cence and decreases in the order: primary > secondary > tertiary. Although relativegrowth rates in primary and secondary fruit were similar, differences in fruit sizewere correlated with a longer lag period following pollination in secondary fruitgrowth. The delay in secondary fruit growth appears to be physiologically deter-mined, and to be independent of environmental conditions. Removal of primary fruitresults in increased secondary fruit weight, indicating that inter-fruit competitionoccurs on the inflorescence, akin to apical dominance in shoots. Differences infinal fruit size are known to be genetically determined and correlate with thenumber and size of developed achenes on the receptable. Thus, variations infruit size among cultivars appears to be additionally determined by the growth-promoting activity of individual achenes (Given et al., 1988b). It is necessary thata minimum of 30% of the carpels are fertilized to produce a well-shaped berry.Malformed fruit are caused by poor pollination and damage to the achenes byfrost, insect or disease. All of these prevent the synthesis of auxin and result inuneven development.
Ripening in the strawberry is invariably marked by simultaneous changes incolour, flavour and texture in normal fruit (Figure 1).
3. MISCROSCOPIC CHANGES
Growth of strawberry receptacle after petal fall is initially due to a combinationof cell division and cell expansion. Cell division accounts for only 15–20% of thetotal growth, occurring mostly before anthesis. The rest of the growth is a resultof cell enlargement, with cell size increasing towards the inner part of the fruit.Cell proliferation is complete at seven days and thereafter growth is by means ofan increase in cell volume, amounting to about 1000-fold during development.Cell enlargement is accompanied by major changes in the cell wall and subcel-lular structure. At petal fall, cells in the receptacle have dense cell walls and smallvacuoles. Starch grains are present in the plastids and Golgi apparatus and ribosomesare abundant. During development the cell walls become swollen and increasinglydiffuse and the plastids loose their starch grains, eventually degenerating in ripefruit. Although changes in the plastids might be considered a senescence charac-teristic, the mitochondria in ripe fruit appears normal. The increasing hydration
342 W. Schwab and T. Raab
Figure 1. Changes in fruit size, shape, und colour during strawberry fruit development.

and disorganization of the cell wall and the greater solubility of the middle lamellaand wall matrix during ripening accompanies fruit softening.
A strawberry is composed of five distinct tissue zones (Suutarinen et al., 1998).Epidermal cells form the outer layer (Figure 2). The second layer is composed ofhypodermal cells and the third layer of cortical cells. Vascular bundles beginningfrom the achenes and connecting to the pith play a role in the texture of straw-berry. Microscopic studies showed that the vascular strands and achenes ofstrawberries formed the majority of the structures which maintained their struc-tural integrity during jam-making process.
The different chemical components in different parts of strawberry cell walls,cortical cells, vascular tissue and in achenes were stained using different stainingsystems and the location of pectins, lignin, proteins and cellulose was studied(Suutarinen et al., 1998). In cortical cells cellulose, proteins and pectin was observed.Cellulose could be detected in the intercellular spaces. The proteins were depositedon the outer layer of the cell wall. The middle lamella cementing the cells togetherwas rich in pectin. Lignin was not stainable. Vascular tissue contained long fibrescomposed of cellulose, protein, pectin and lignin. The main component of achenesseemed to be lignin which was surrounded by proteins. Also some pectin couldbe observed but cellulose was absent.
In mature fruit, cells are compromised predominantly of the vacuole, with thecytoplasm being reduced to a thin layer compressed between the tonoplast andcell wall. The vacuole accumulates organic acids, sugars and phenolic compoundsincluding anthocyanin pigments.
4. CHEMICAL AND BIOCHEMICAL CHANGES
Numerous chemical and biochemical changes occur during strawberry fruit ripening.Over 50 polypeptides have been identified that show prominent changes atdifferent stages of fruit development. Several specific enzymes associated with
Developmental Changes and Physico-Chemical Changes 343
Figure 2. Schematic presentation of a strawberry showing location of epidermal and cortical cells,achenes, hypodermis and vascular tissue (adapted from Suutarinen et al., 1998).

carbohydrate metabolism, cell walls and anthocyanin synthesis have been shownto increase in the strawberry during ripening.
4.1. Carbohydrate metabolism
Ripe strawberry are composed of approximately 90% water and 10% total solublesolids, and contain numerous important dietary components. Important in flavour,carbohydrates are one of the main soluble components in strawberry fruit and provideenergy for metabolic changes. Sucrose, glucose and fructose account for more than99% of the total carbohydrates in ripe fruit, with sorbitol, xylitol and xylose occur-ring in trace amounts. Glucose and fructose are present in equivalent concentrationsin ripe strawberry fruit (2.3 and 2.2 g per 100 g fresh weight, respectively). Thecontent of individual sugars in ripe fruit and the total sugar content varies withthe season, but the glucose:fructose ratio and the content of individual sugars as apercentage of the total sugar varies to only a small extent with geographical location,variety and season. Sucrose is present at a very low level in fruit for the first 10days post-anthesis, but thereafter increases rapidly to reach a maximum at the turningstage before declining sharply in over-ripe fruit. For the first 10 days, glucosedeclined and fructose remained constant on a fresh weight basis, then both increased.On a per fruit basis total sugar increases throughout strawberry fruit development(Manning, 1993).
The primary organic acid is citric acid, which comprises 88% of the total acids.Total acidity expressed on a fresh weight basis increases modestly to a maximumin mature green fruit before declining more rapidly in the later stages of ripening.However, on a per fruit basis acid content increases considerably during develop-ment and ripening. The loss of total acidity in overripe fruit was mainly due to areduction in the content of malic acid. Ascorbic acid content was highly corre-lated with soluble solids content, sucrose/total sugar content ratio and glucose/fructose ratio (Sone et al., 1999).
Strawberry fruit are the most competitive sink in the plant, accumulating 20–40%of the total plant dry weight. The only tissues to show an actual reduction in biomassduring fruiting are the roots. Sucrose uptake by strawberry fruits is greatest amongyoung fruit compared with older fruit.
4.2. Cell wall
Plant cell walls are made up of cellulose fibrils embedded in a matrix largely ofpectic substances, hemicelluloses, proteins, lignins, low molecular weight solutesand water. In strawberry cell walls, the main hemicellulose is xyloglucan and thecomposition of strawberry cell walls varies in the different tissues (Legentil et al.,1995). The principal carbohydrate polymer found in the middle lamella is thepectic substance. The complexity of the cell wall suggests that also its metabo-lism must be complex and, in fact, a broad set of different enzyme types can beinvolved in the degradation of the many different parietal polymers (Fry, 1995).
Cell structure, and particularly the nature of cell wall polymers, is believed todetermine the physical properties of plant tissues. While covalent linkages are impor-
344 W. Schwab and T. Raab

tant in cell wall structure, ionic stabilization between carboxyl groups in pectinmolecules by Ca2+ are also important and this depends upon the degree of esteri-fication of the pectin. The rapidity and extent with which soft fruits lose theirfirmness during ripening is a major factor determining fruit quality and posthar-vest shelf life. In strawberry, the complex relationship between carbohydratecomposition, cell structure and the physical property of the whole tissue is furthercomplicated by increases in cell volume which continue throughout ripening.Furthermore, the net synthesis of polyuronides in ripening fruit could mask anychanges occurring in cell wall polymers laid down earlier in cell development.
Fruit ripening is frequently accompanied by solubilisation of the pectic poly-saccharides of the primary cell wall and a loss of neutral sugars from the sidechain of the polymers (Redgwell et al., 1997). A high proportion of freely-solublepolyuronides exits in the receptacle at petal fall and in ripe fruit. The pectic sub-stances are relatively loosely bound at all stages of development judging by theease with which they can be solubilized by EDTA. The proportion of totalpolyuronide which was soluble increased from 30% in green fruit to 65% in ripefruit. The difference between the amount of uronic acid of unripe and ripe fruitwas taken as an indication of the degree of pectin solubilisation and strawberryshowed a high degree of pectin solubilisation (Redgwell et al., 1997). There was,however, little alteration in the average molecular size of these soluble polymersduring development (Redgwell et al., 1997). The increased hydration of the cell wallduring ripening is consistent with increased polyuronide solubility.
Ripening in the strawberry is also accompanied by increases in the proportionsof the neutral sugars associated with the soluble polyuronides as galacturonic acidconcentration decreases during development. The increases in these sugars, whichcan be linked to the polygalacturonan backbone via the rhamnosyl moiety, indicatethat alterations may occur during ripening in the way in which carbohydrates arecross-linked in the cell wall. The cell wall material from unripe strawberry containsgalactose and arabinose (ratio 1:1) as the predominant non-cellulosic neutral sugars.Due to loss of total neutral wall residues (mainly arabinose and galactose) duringripening xylose becomes the predominant cell wall neutral sugar in ripe straw-berry (Redgwell et al., 1997). An increase in xylose, mannose and glucose residuesin soluble cell wall fractions during ripening of strawberry was found, thus, hemi-cellulosic polysaccharides may be either degraded or released from inter-polymerbonds. Little alteration in the sugar composition of the hemicellulose fraction fromstrawberry was found, but a significant reduction occurred in its average molec-ular size with ripeness (Nogata et al., 1996).
With ripening, the ratio of noncellulosic material (i.a. pectins and hemicelluloses)to rigid cellulose decreased from 2.3 for unripe to 1.9 for ripe. The crystallinityof the cellulose molecules remained unaltered throughout ripening. Thus, basiccellulose crystallite of strawberry cell walls appeared exceptionally small comparedwith other systems studied thus far (Koh et al., 1997)
Swelling properties of the cell walls of strawberry were unusual in that wall barrierthickness in ripe fruit declined to 0.4 times that in unripe fruit. Walls in firm fruitappeared moderately to highly swollen with densely staining material adjacent tothe cell and lightly staining material between cells. During ripening this intercel-
Developmental Changes and Physico-Chemical Changes 345
lular material was lost, leaving a thin densely stained wall bounding the cells. Inindividual sections the cells had little or no visible contact and were often sepa-rated by a considerable intercellular space. There was a correlation between swellingand the degree of pectin solubilisation, suggesting that wall swelling occurred asa result of changes to the viscoelastic properties of the cell wall during pectin sol-ubilisation. Swelling is probably associated with movement of water into voidsleft in the cellulose-hemicellulose network by the solubilised pectin (Redgwell etal., 1997).
The firmness of strawberry fruit declines throughout development, partly as aresult of swelling of the cell wall as the hydration status increases. The degrada-tive changes associated with ripening involve multiple structural changes withinthe cell wall that affect pectins and the cellulose-xyloglucan framework resultingin increased polyuronide and hemicellulose solubilization. Efforts to reveal themolecular basis of changes in firmness, which are a major contributing factor to fruitquality, have focused on cell wall-associated enzymes, which are believed to mediateand/or contribute to cell wall breakdown. The most studied of these activities,endopolygalacturonase, is absent or below the limit of detection in ripening straw-berry fruit. Of the possible candidate genes involved in strawberry cell wallmetabolism, cellulase, pectate lyase and expansin are the only genes isolated fromstrawberry fruit which show increased expression during ripening (Medina-Escobaret al., 1997; Llop-Tous et al., 1999; Trainotti et al., 1999; Harrison et al., 2001).In addition, and similarly to other fruits, pectin methyl esterase has been impli-cated in strawberry fruit softening (Perkins-Veazie, 1995).
There is an increasing interest in the metabolic benefit of fiber such as pectinfor human health. Evidence suggests that dietary pectin may reduce the levels ofserum total cholesterol and decrease low density lipoprotein cholesterol (Versariet al., 1999b). Strawberry is a soft fruit containing high levels of pectin.
4.3. Pigments and phenolics
Fruits, many of which are highly coloured, may have evolved pigments to assistin seed dispersal by attracting predators. Pigments are natural indicators of fruitripeness and some pigments are benefical for human health as antioxidants (Natellaet al., 1999; Robards et al., 1999) and anticarcinogens (Kaul et al., 1998; Rice-Evanset al., 1996; Carlton et al., 2001). Extracts of strawberries have antioxidative andanticarcinogenic effects in vitro, which are partly proposed to be due to phenoliccompounds in the berries. Strawberry had the highest oxygen radical absorbancecapacity when 12 fruits and 5 fruit juices were studied (Wang et al., 1996).
The perceived colour of fruits can be influenced by co-pigmentation, for exampleanthocyanins may form complexes with flavones, causing bathochromic colour shiftsfrom red to blue. During strawberry ripening there is destruction of chlorophyll, con-sistent with the disappearance of the chloroplasts and a decrease in the content ofcarotenoids.
Red colour develops in strawberry through the production of anthocyanins,primarily pelargonidin-3-glucoside, comprising almost 90% of the anthocyanins(Figure 3). Cyanidin 3-glucoside is the second most common anthocyanin followed
346 W. Schwab and T. Raab
by pelargonidin 3-rutinoside. Analysis of 39 strawberry genotypes showed a rangeof up to 13 anthocyanin peaks, depending on genotype (Bakker et al., 1994; Briddleand García-Viguera, 1997; Versari et al., 1999a). In contrast, peonidin 3-gluco-side, the methylated form of cyanidin 3-glucoside represents the main anthocyaninin strawberry cell suspension cultures (Nakamura et al., 1998; Zhang et al., 1998).Anthocyanin production by strawberry cells are greatly induced by high intensityof light (Kurata et al., 2000). The activity of 3-deoxy-D-arabino-heptulosonate 7-phosphate (DAHP) synthase, phenylalanine ammonia-lyase (PAL), and chalconesynthase (CHS) was monitored at various light intensities using a strawberry cellsuspension culture. PAL and CHS were found to increase significantly withincreasing light intensities (Mori et al., 2000). Besides, a strawberry callus, whichproduced high amounts of anthocyanin in the dark, was isolated from a cell linenot producing anthocyanin (Nakamura et al., 1999). Anthocyanin synthesis in straw-berry cell suspension cultures was influenced significantly by the initial mediumpH value. Measurement of the ratio of pigmented cells suggested that the varia-tion in pH changed the accumulation of anthocyanin inside the pigmented cellsonly (Zhang and Furusaki, 1997).
Kaempferol and Quercetin are the main flavonols in strawberries and their con-centration varies between 0.2 and 0.9 mg/100 g fresh weight (Figure 3) (Häkkinenand Törrönen, 2000). In addition, the metabolites quercetin-3-glucuronide andquercetin-3-glucoside have been identified in ripe strawberry fruit (Henning, 1981;Versari et al., 1999a).
Phenolics comprise a diverse group of substances including the secondary plantmetabolites polyphenols (tannins), proanthocyanidins (condensed tannins) and esterof hydroxybenzoic acid and hydoxycinnamic acids (Figure 3). Phenolics are normalconstituents of fruits affecting their taste, palatability and nutritional value. They areresponsible for astringency owing to their interaction with the proteins andmucopolysaccharides in saliva. Typical of many edible fruits, strawberry lose astrin-gency during ripening, although this is not necessarily correlated with a decreasein soluble polyphenol content. Ellagic acid is the main phenolic compound instrawberry and its amount varies from 39.6 to 52.2 mg/100 g fresh weight (Häkkinenet al., 1998; Häkkinen et al., 2000; Häkkinen and Törrönen, 2000; Amakura etal., 2000; Clifford and Scalbert, 2000). It is known to inhibit certain carcinogen-induced cancers and may have other chemopreventive properties (Narayanan etal., 1999; Loarca-Pina, 1998; Clifford and Scalbert, 2000; Xue et al., 2001). Inaddition, accumulation of 1-O-trans-cinnamoyl-β-D-glucopyranose was detectedin developing strawberry fruit (Latza et al., 1996).
The pigments and phenolics found in strawberry are derived from phenyl-propanoid secondary metabolites. Fruit anthocyanin synthesis is belived toshare a common pathway from the primary metabolic precursor phenylalanine.Phenylalanine ammonia-lyase (PAL) (EC 4.3.1.5), the first enzyme in the pathway,has a pivotal role in directing synthesis towards secondary metabolites. The temporalrelationship between PAL activity and anthocyanin accumulation in strawberrywas confirmed (Given et al., 1988a). It was shown that the activity of the terminalenzyme in the synthesis of pelargonidin-3-glucoside, the principal anthocyanin instrawberry, uridine diphosphate glucose:flavonoid 3-O-transferase (UDPGFT) (EC
Developmental Changes and Physico-Chemical Changes 347

2.4.1.91) paralleled this increase in anthocyanin. The role of PAL activity in antho-cyanin synthesis in the strawberry was examined further using the competitiveinhibitor L- -aminoxy-β-phenylpropionic acid (L-AOPP). Interestingly, L-AOPPlowered anthocyanin content without affecting fruit softening. The increase in PALactivity in strawberry is the result of de novo synthesis (Given et al., 1988b). Incontrast to several other species, the enzyme from strawberry is a single isoen-zyme having a tetrameric sub-unit structure. The metabolic regulation of PAL activityis complex. The enzyme is known to be induced and is also probably inactivatedby trans cinnamic acid, the product of its reaction.
348 W. Schwab and T. Raab
Figure 3. Anthocyanins, flavonols and phenolics identified in strawberry fruits.
α
Strawberry cell cultures producing anthocyanin have been developed and theeffects of sugar, nitrogen, auxin and cytokinin on anthocyanin accumulation havebeen studied using the cultured cells (Mori et al., 1994). Conditioned medium (CM),prepared from strawberry cell cultures promoted anthocyanin accumulation insuspended cells of strawberry. Phenylalanine ammonia-lyase (PAL, EC 4.3.1.5)and chalcone synthase (CHS, EC 2.3.1.74) activities were found to increasesignificantly in the CM-cultured cells but there was no significant difference inthe 3-deoxy-D-arabino-heptulosonate 7-phosphate (DAHP) synthase (EC 4.1.2.15)isozymes activities of cells grown in CM or synthetic media (Mori et al., 2001).It is proposed that conditioned medium contains factor(s) that promote cell growth(Mori and Sakura, 1999). Sulfated peptides have been purified and identified as pro-liferation-stimulating factors for single mesophyll cells (Matsubayashi and Sakagami,1996). Anthocyanin synthesis in strawberry cells was also enhanced in the condi-tioned medium prepared from grape and callus which do not produce anthocyanin(Mori and Sakurai, 1998). Vice versa, a conditioned medium prepared from sus-pended cultures of strawberry stimulated anthocyanin accumulation insuspension-cultured cells of rose (Rosa hybrida sp), which did not normally produceanthocyanin (Sakurai et al., 1997).
Anthocyanin accumulation in strawberry cells cultured on a solid medium wasmonitored using an image-processing system. Changes in the time courses of theanthocyanin content of individual cells differed from each other, although the averageanthocyanin content increased gradually with time in a batch culture. Two cellsjust after cell division were almost identical to each other both in size and antho-cyanin content (Miyanaga et al., 2000b).
4.4. Volatiles
The flavour quality of food is a combination of the sensory impressions of tastedetected by the tongue and aroma sensed by the nose. Information on the flavourchemistry of natural and processed fruit products is increasingly important for thefood industry in determining optimal harvesting dates and storage conditions, opti-mising postharvest quality, and in ensuring that the flavours and aromas required forconsumers acceptability are produced and maintained. The aroma of strawberry isan important component of its flavour. The relative abundance of individual volatilesfrom a fruit is a ‘finger print’ of a particular cultivar and species. The mixture ofvolatiles from strawberry is complex, with over three hundred compounds havingbeen identified (Honkanen an Hirvi, 1990). The diversity of strawberry aroma sub-stances may simply reflect a lack of absolute specificity of enzymes such asreductases, esterases, oxidases, etc. involved in their formation.
The composition of strawberry aroma is influenced by cultivar, maturity, andstorage (Forney et al., 2000). Since volatiles differ in their organoleptic propertiesonly relatively few of these are likely to contribute to flavour. Recently, the ‘aromavalue’ concept, i.e. the ratio of concentration to odor threshold has been appliedto strawberry flavour (Schieberle und Hofmann, 1997). The studies showed thatespecially the ‘fruity’ smelling esters ethyl butanoate, ethyl hexanoate and methyl2-methylbutanoate as well as (Z)-3-hexenal (freshly cut grass), 2-methylbutanoic
Developmental Changes and Physico-Chemical Changes 349

acid (sweaty), -decalactone (peach-like) and the ‘caramel-like’ smelling odorants2,5-dimethyl-4-hydroxy-3(2H)-furanone (Furaneol®, DMHF) and 2,5-dimethyl-4-methoxy-3(2H)-furanone (DMMF) are likely to contribute significantly to strawberryflavour (Figure 4) (Larson and Poll, 1992). Of these DMHF is most important dueto its high concentration (up to 100 mg/kg strawberry fruit fresh weight) and lowodor threshold (10 ppb) (Schieberle and Hofmann, 1997; Schwab and Roscher,1997).
The biosynthesis of DMHF is discussed controversially. On the basis of meta-bolic studies, 6-deoxy-D-fructose (Zabetakis et al., 1999, Zabetakis and Gramshaw,1998; Zabetakis and Holden, 1996), D-fructose-6-phoshate (Pérez et al., 1999)and D-fructose-1,6-diphosphate (Wein et al., 2001; Roscher et al., 1998; Schwab,1998) have been postulated as precursors of DMHF in strawberry. Metabolismstudies of DMHF in detached ripening strawberry fruit showed that the 4-hydroxy-furanone is methylated to DMMF or glucosylated during ripening (Roscher et al.,1996, 1997). Although strawberry tissue cultures derived from cultivated species didnot produce the furanones, DMHF and DMMF was found in cultures contami-nated with Methylobacterium extorquens (Zabetakis, 1997).
4.5. Hormones
Clear evidence for the role of the achenes (or seeds) in ripening has been obtained(Given et al., 1988b). The unique structure of the strawberry with the achenes onthe exterior of the fruit has made it a generally useful system to study the role ofthe seeds in development since the achenes can be removed relatively easily withlittle damage to the remaining parts of the fruit.
350 W. Schwab and T. Raab
Figure 4. Key aroma compounds in strawberry fruit.
γ

4.5.1. Auxin
The growth of the strawberry receptacle is regulated by the achenes which are asource of indole-3-acetic acid (IAA). The achenes are synthesizers and exportersof auxin to the fruit (Given et al., 1988b). Although the role of the achenes infruit growth is undisputed, receptacle growth is not well correlated with endogenousauxin levels and the inter-relationships between the different forms of IAA areincompletely understood. The partial removal of achenes at early stages of devel-opemt results in distorted berry formation, with the receptacles expanding only inproximity to undisturbed achenes. In normal fruit, auxin produced in the achenesinhibits ripening in green fruit and as the fruit develops the level of auxin in theachenes declines, modulating ripening. This implies that the concentration of freeIAA in the receptacle falls to a critical level to permit ripening to proceed.
A similar result was obtained while investigating the effect of auxin concentra-tion on cell growth, anthocyanin production, and anthocyanin composition in cellsuspensions of strawberry. Lower auxin concentrations in the medium limited thecell growth and enhanced both anthocyanin production and anthocyanin methyla-tion (Nakamura et al., 1998).
Soluble and bound forms of invertase may also be differentially regulated byauxin during early fruit development. Auxin not only induces but also repressesthe expression of certain genes in the strawberry during development (Nam et al.,1999; Hamano et al., 1998; Manning, 1998; Medina-Escobar et al., 1997; Wilkinsonet al., 1995).
A gene encoding an auxin-binding protein (ABP1) was isolated from straw-berry by screening a genomic library. It resembles ABP1 genes from other sourcesboth in structure (four introns) and in the high level of homology of the deducedamino acid sequence of the mature protein encoded in exons 2–5. Exon 1, encodedmainly the non-conserved signal peptide. ABP1 transcript levels were low duringfruit development, but transcripts were detected at all stages of receptacle swelling(auxin-dependent) and ripening (inhibited by auxin), consistent with a role for ABP1in auxin perception (Lazarus and MacDonald, 1996).
The suggestion that auxin concentration may be the main hormonal factor influ-encing ripening in the strawberry is supported by the lack of any apparentinvolvement of ethylene in this process, as evidenced by the poor correlation withendogenous ethylene production. IAA stimulated ethylene production without changeof ACC oxidase activity at 1 day after treatment in strawberry fruit at pink stage(Tian et al., 1997).
4.5.2. Ethylene
Research on the role of ethylene in fruit ripening and the regulation of ethylenebiosynthesis has concentrated on climacteric fruit. It has been reported that straw-berry is a nonclimacteric fruit, and ethylene is not thought to play a role in thegrowth, coloration or softening of strawberry fruit. Endogenous ethylene produc-tion in strawberry fruit is very low, and autocatalytic ethylene production has notbeen observed at any stages of maturity. Ethylene production, ACC (1-aminocy-
Developmental Changes and Physico-Chemical Changes 351

clopropane 1-carboxylic acid) content, and ACC oxidase activity were determinedin strawberry fruit harvested at different stages of development and in fruit harvestedgreen and developed in vitro solutions containing sucrose. In fruit harvested atprogressive stages of development from green through full ripe, ethylene produc-tion and ACC oxidase activity decreased whereas ACC content increased betweenthe white and pink stages. Fruit detached at the green stage and developed to fullripe by immersion of the cut pedicel in sucrose solutions exhibited an increase inACC content, decreased ethylene production, and no change in ACC oxidase activity.ACC synthase could not be detected in fruit harvested at different developmentalstages or in fruit detached and developed in vitro (Perkins-Veazie et al., 1995).However, ethylene may play a role in strawberry development as ethylene hasbeen shown to enhance strawberry fruit softening and reduce its storage life (Willsand Kim, 1995). Also, respiration increased when white-stage strawberry fruit areexposed to ethylene for one week. ACC at 1 mM stimulated endogenous ethyleneproduction in both green and white strawberries, but advanced colour develop-ment by only 2 days in green berries (Tian et al., 1997). Ethylene biosynthesis innonclimacteric strawberry fruit at various stages of maturity may be regulated byethylene receptor(s) with inhibition of ethylene production. Respiration may notbe regulated by an ethylene receptor in strawberry fruit at most stages of maturity(Tian et al., 1997). However, exogenous ethylene stimulated respiration by regu-lating new respiratory enzymes synthesis in strawberry fruit. Ethylene induced anionic leakage increase, and this was positively correlated to fruit water loss andperoxidase activity (Tian et al., 2000). Employing non-invasive photoacoustic spec-trometry, emissions of nitric oxide (NO) and ethylene in post-harvest strawberrieswere monitored. A clear-cut stoichiometric relationship was found between thetwo gases. The maturation process is clearly accompanied by a marked decreaseof NO concomitant with an increase of ethylene (Leshem and Pinchasov, 2000).Although ethylene does not initiate a climacteric response, it may still be involvedin levels of gene expression promoting some characteristics associated with ripening.
4.5.3. Abscisic acid
Abscisic acid (ABA) accumulates in the achenes during ripening without increasingsubstantially in the receptacle. In vitro, the presence of abscisic acid induced sig-nificant changes in phenylalanine ammonia-lyase and tyrosine ammonia-lyaseactivity (Revilla and Gonzalez, 1997).
4.5.4. Gibberellins
There is considerable evidence that gibberellins (GAs) play a major role in theprocesses of fruit-set and development (García-Martínez and Hedden, 1997). Inshort-day (SD) cultivars, flower initiation is thought to be repressed by a trans-missible flower inhibitor produced in the leaves under long-day (LD) conditions,whereas the inhibitory system is lost or impaired in day-neutral (DN) cultivars.The gibberellins have been suggested as possible candidates for the inhibitor, havingbeen shown to inhibit flower initiation when applied to cultivars from different
352 W. Schwab and T. Raab

response groups (Taylor et al., 2000a, b). Seven endogenous GAs were identifiedin leaf tissue of DN cultivars and four GAs were found in leaf exudates from SDstrawberry. Although no quantitative GA analyses were performed, the resultssuggest that levels of GA3 and GA8 may fluctuate according to leaf developmentand/or environmental conditions, particularly photoperiod (Taylor et al., 2000a,b). Moreover, the gibberellin GA3 was reported to act synergistically with 1-naph-thaleneacetamide (1-NAAm) in intact fruit cultured in vitro in promoting growthand ripening. The cytokinin N6-benzyladenine (BA) suppressed growth and ripeningin conjunction with 1-NAAm (Manning, 1993). A total of 17 previously charac-terised GAs were identified in extracts of carboxylic acids from immature fruitsof strawberry. Identification of the 13-hydroxylated GAs in berries confirms that theearly 13-hydroxylation GA biosynthetic pathway exists in fruit tissue of straw-berry, as well as in vegetative tissue (Blake et al., 2000). Exogenous treatment ofgibberellic acid (GA3) improved weight, size and colour of strawberry fruits, andaffected phenylalanine ammonia-lyase and tyrosine ammonia-lyase activities(Montero et al., 1998).
4.5.5. Methyl jasmonate
(3R,7S)-(+)-methyl epi-jasmonate and (3R,7R)-(–)-methyl jasmonate were isolatedfrom extracts of strawberry fruit. The sum of both isomers had a maximum con-centration in immature fruits and then steadily decreased (Gansser et al., 1997). Asignificant increase in respiratory activity and ethylene production was determinedin white and pink strawberries treated with methyl jasmonate, while differentresponses were elicited from ripe and overripe fruits. A significant effect of methyljasmonate treatment on strawberry color evolution was also observed by a stimu-lation of anthocyanin biosynthesis and an accelerated degradation of chlorophylla, chlorophyll b and, to a lesser extent, β-carotene and lutein (Pérez et al., 1997).Limitation of nitrogen concentration in the medium and the addition of methyljasmonate effectively enhanced the total anthocyanin production in batch suspen-sion culture of strawberry (Miyanaga et al., 2000a).
4.5.6. Cytokinins
Most cytokinin activity was detected in achenes. Cytokinin activity in fruits wasthe highest 10–15 days after anthesis and decreased gradually as fruits developed.Cytokininis are actively produced in immature achenes. The response of differentstrawberry strains to benzylaminopurine in vitro was studied. The response wasstrain-specific, suggesting that sensitivity of strawberry plants to benzylaminopurineis genotype-dependent (Irkaeva et al., 1997).
4.5.7. Polyamines
In strawberry, polyamines (putrescine, spermidine and spermine), conjugatedspermidine and bound amines (putrescine, spermidine, phenylethylamine, 3-hydroxy-4-methoxyphenylethylamine) accumulated in the shoot tips during floral induction
Developmental Changes and Physico-Chemical Changes 353

and before floral emergence. Polyamine composition differed according to tissueand stages of development. The results suggested that ornithine decarboxylase (ODC)and polyamines are involved in regulating floral initiation in strawberry (Tarenghiand Martin-Tanguy, 1995; Tarenghi et al., 1995).
4.6. Enzymes
Although strawberries represent an economically important fruit in Europe andAmerica enzymatic studies on fruit ripening physiology have until now been limited.Reasons are the high content of polyphenolics and pectins in unripe and ripe straw-berry fruits hampering enzyme isolation, the short harvest period and storage shelflife as well as the low protein content. Nevertheless some enzymes such as inver-tase (Poovaiah and Veluthambi, 1985), phenylalanine ammonia lyase (Given etal., 1988a), polygalacturonase (Nogata et al., 1993), alcohol acyltransferase (Pérezet al., 1993, 1996), alcohol dehydrogenase (Mitchell and Jelenkovic, 1995), UDP-glucose:flavonoid O-glucosyltransferase (Cheng et al., 1994), peroxidase (Civello,Martínez et al., 1995; López-Serrano and Barceló, 1997; Arnaldos et al., 2001,;López-Serrano and Ros Barceló, 2001), polyphenol oxidase (Espín et al., 1997;De los Angeles Serradell et al., 2000; López-Serrano and Ros Barceló, 2001), lipoxy-genase (Pérez et al., 1999), ascorbate peroxidase (Kim and Chung, 1998),hydroperoxide-lyase (Pérez et al., 1999), β-glucosidase (Orruño et al., 2001), andaldolase (Schwab et al., 2001) have been partially purified from strawberry fruitsand characterised. Besides, the properties and time-course activity of adenine phos-phoribosyltransferase and adenosine kinase isolated from apical buds werecharacterized (Robert and Pétel, 2000) and the effect of ammonium or nitrate onnitrate reductase and glutamine synthase was determined in strawberry leaf androot (Claussen and Lenz, 1999). Acid phosphatase activity was observed in straw-berry cell culture (Keßler et al., 1997). Recently, two aldolase isoenzymes have beenisolated from ripe strawberry fruits and patially purified. During strawberry fruitdevelopment the overall total aldolase activity decreased until the pink ripening stageand then increased due to a rise of cytosol aldolase yielding up to 75% in redstrawberries. It was suggested that induction of the cytosolic aldolase both at thelevels of transcription and translation might be part of a ripening related stressresponse in the receptacle tissue (Schwab et al., 2001).
Due to the drawbacks encountered during enzyme isolation several groups havegenerated cDNA libraries from wild and cultivated strawberries to investigateregulation of ripening, improve shelf life or flavor formation (Aharoni et al., 2000;Nam et al., 1999; Manning, 1998; Medina-Escobar et al., 1998; Moyano et al., 1998;Medina-Escobar et al., 1997).
5. RIPENING RELATED GENES
In recent years an increasing amount of reports of strawberry gene characterisa-tion has been accumulated. It was shown that strawberry fruit ripening isaccompanied by changes in gene expression representing both up- and down-
354 W. Schwab and T. Raab

regulation. E.g. anthocyanin biosynthesis appears to be up-regulated in ripeningstrawberry fruit by de novo synthesis of enzymes and inhibited by application ofauxin (Given et al., 1988b). Fruit color changed from pale-green to white about 3weeks after anthesis. At this stage, anthocyanins rapidly accumulated until the fullripe. The transcript level of phenylalanine ammonia lyase (PAL) and chalconesynthase (CHS) genes did not change markedly throughout the fruit development.The transcript level of chalcone isomerase (CHI) and dihydroflavonol 4-reductase(DFR) gene was high in the young fruit, decreased to an almost undetectable levelat the white-mature stage, and then increased again until the fully ripe stage par-alleling mostly the accumulation of anthocyanin. The latter correlation suggeststhe involvement of CHI and DFR in the regulation of anthocyanin biosynthesisduring fruit ripening (Li et al., 2001). The 18S rRNA and alcohol dehydrogenaseof strawberry have been cloned and sequenced (Wolyn and Jelenkovic, 1990).
Several studies have indicated that alterations in gene expression occur duringdevelopment and ripening of strawberry receptacles (Nam et al., 1999; Hamano etal., 1998; Manning, 1998; Medina-Escobar et al., 1997; Wilkinson et al., 1995).
5.1. Alcohol acetyl-CoA transferase gene
Esters are one of the most important classes of volatile compounds in fruit flavour.In strawberry alone, more than a hundred different esters have been detected(Honkanen and Hirvi, 1990). Esterification is the result of transacylation fromacyl-CoA to an alcohol (Figure 5).
The enzyme catalysing the reaction is termed an alcohol acyltransferase (AAT),a key enzyme in aroma biochemistry. In plants, AAT activity has been investi-gated in both flowers and fruit. Purification of the acetyl-CoA:benzylalcoholacetyltransferase (BEAT) protein from flowers of Clarkia breweri and isolation ofthe gene encoding it have been reported (Dudareva et al., 1998). In strawberryAAT protein has been investigated in crude fruit extracts (Pérez et al., 1993, 1996;Olías et al., 1995). It was concluded that the alcohol moieties of the esters producedby crude strawberry fruit extracts reflected the alcohols predominantly synthesizedin the fruit and that the acid moieties reflected the acyl-CoA specificity of theAAT enzyme (Ueda et al., 1992). Comparison of strawberry and banana proteinspossessing AAT activity showed clear differences between the alcohol and acyl-CoAspecificity of the two enzymes. The strawberry AAT enzyme had high activitywith hexanol and with acetyl- or butyl-CoAs. The banana enzyme, on the other hand,had high activity with butanol and acetyl-CoA but showed less activity with butyl-CoA. A clear correlation could be observed between the substrate preference ofthe enzymes and the volatile esters present in both fruits (Olías et al., 1995).
Developmental Changes and Physico-Chemical Changes 355
Figure 5. General Scheme for the ester formation catalysed by strawberry alcohol acyltransferase(SAAT) (adopted from Aharoni et al., 2000).

Recently, microarrays were used to examine gene expression quantitatively duringstrawberry fruit ripening (Aharoni et al., 2000). One cDNA clone (SAAT) showingexpression profiles similar to those of colour genes involved in anthocyanin biosyn-thesis, showed sequence similarity to genes encoding enzymes with acyltransferaseactivity. Detailed RNA gel blot analysis showed that SAAT is exclusively expressedin the receptacle (fruit without achenes). Biochemical evidence for involvementof the SAAT gene in formation of fruity esters was provided by characterising therecombinant protein expressed in Escherichia coli. The SAAT enzyme showedmaximum activity with aliphatic medium-chain alcohols, whose corresponding estersare major components of strawberry volatiles. The enzyme was capable of uti-lizing short- and medium-chain, branched, and aromatic acyl-CoA molecules ascosubstrates. It was suggested that the formation of volatile esters in strawberry fruitis subject to the availability of acyl-CoA molecules and alcohol substrates and isdictated by the temporal expression pattern of the SAAT gene(s) and the substratespecificity of the SAAT enzyme(s) (Aharoni et al., 2000).
5.2. Pectate lyase gene
A strawberry fruit cDNA showing sequence similarity to higher-plant pectate lyasegenes has been isolated by differential screening of a strawberry fruit cDNA sub-stractive library. The transcript is predominantly expressed in ripe fruits and was notdetected at high levels in any other plant tissues. The removal of the achenes fromunripe green fruits induced the expression of this putative pectate lyase gene. Incommon with other ripening related genes in strawberry, this induction was partiallyinhibited by treatment of de-achened fruit with auxin. It is proposed that the ripefruit expression of this strawberry gene with similarity to pectate lyases could berelated to cell wall pectin degradation contributing to strawberry fruit softening(Medina-Escobar et al., 1997).
5.3. Endo-1,4-�-glucanase
Total extractable polyuronides remain constant as a proportion of cell wall materialduring ripening and do not show detectable depolymerisation. In contrast to thesefindings, however, the hemicellulosic fraction of cell walls prepared from ripeningfruit demonstrates a progressive shift from high- to low-molecular weight polymers(Huber, 1984). Whereas there is no discernible change in the neutral sugar com-position of hemicelluloses isolated from the small-sized green to red-ripe stages,the average net molecular weight is quite dramatic, suggestive of an active, devel-opmentally regulated endohydrolase. The observed hemicellulose activity correlateswell with a soluble carboxymethylcellulase activity measured in extracts preparedfrom ripening strawberry fruit.
A cDNA (Cel1) encoding an endo-1,4-β-glucanase (EGase) was isolated fromripe strawberry fruit. The deduced protein contained a presumptive signal sequence,a common feature of cell wall-localised EGases, and one potential N-glycosyla-tion site. In fruit, cel1 mRNA was first detected at the white stage of development,
356 W. Schwab and T. Raab

and at the onset of ripening, coincident with anthocyanin accumulation. Cel 1 mRNAabundance increased dramatically and remained high throughout ripening and sub-sequent fruit deterioration. Strawberry Cel1 is a ripening-specific and auxin-repressedEGase, which is regulated during ripening by a decline in auxin levels originatingfrom the achenes (Harpster et al., 1998). To assess the role of the Cel1 enzyme infruit softening a cDNA of the gene cel1, was used to down-regulate cel1 gene expres-sion in transgenic strawberry plants. In several primary transformants, cel1 mRNAwas strongly suppressed in ripe fruit. However, the EGase activity and the firmnessof these fruits were indistinguishable from those of control fruit (Woolley et al.,2001).
Recently, two groups have independently isolated two full-length cDNA clones(faEG1 and faEG3 identical to Cel1 and Cel2, respectively) by screening a cDNAlibrary representing transcripts from red strawberry fruits (Trainotti et al., 1999;Llop-Tous, 1999). The genes are predominantely expressed during ripening althoughsome expression of faEG3 has also been observed in large green fruits. The expres-sion of faEG1 and faEG3 is down-regulated by treatment with auxin. Differencesin temporal expression of the two EGase genes in fruits are not accompanied bydifferences in spatial expression. The pattern of expression and the sequence char-acteristics of the two polypeptides suggest that the two strawberry EGases operatein a synergistic and coordinate manner. It was proposed that the faEG3-encodedEGase might especially hydrolyse the xyloglucans coating the cellulose microfib-rils, thus rendering the cell wall more susceptible to the subsequent hydrolyticactivity of the faEG1-encoded EGase (Trainotti et al., 1999; Trainotti, 2000). Theexpression of Cel2 (identical to faEg3) in green fruit, well before significant soft-ening begins, suggests that the product of this gene may also be involved in processesother than fruit softening, e.g. cell wall expansion (Llop-Tous et al., 1999).
5.4. �-Galactosidase
Strawberry fruits undergo a marked softening during their ripening, and the processis accompanied by a release of free sugars with galactose among them. Galactoseresidues can be found both in hemicelluloses and, more abundantly, in pectins.This sugar is mostly located at the level of the side chain that depart from themain polymeric molecules, so its role in cell wall stability has long been difficultto perceive. Loss of either galactans or galactose has been reported during ripeningof strawberries, therefore galactosidase activity might play a role in the softeningof these fruits. Three full-length cDNAs (Faßgal1 – 3) encoding different β-galac-tosidases were isolated from a library representing red fruit transcripts. All of themcould be detected both in fruits and in vegetative tissues. Only Faßgal1 showedan increasing expression during the ripening stages up to a maximum in the redfruits, while the other two were mostly found in green fruits and became barelydetectable during ripening. Faßgal1, Faßgal2 and Faßgal3 were expressed in theyeast Pichia pastoris, and each of them encode a functional β-galactosidase. Theexpression of Faßgal1 and Faßgal2 appears to be down-regulated by auxin, as alreadyobserved for other ripening-related genes (Trainotti et al., 2001).
Developmental Changes and Physico-Chemical Changes 357

5.5. Endopolygalacturonase
A fruit-specific and developmentally regulated polygalacturonase gene from straw-berry has been cloned and characterised. Comparison analysis of the correspondingdeduced protein have shown that this strawberry gene is similar to Clade A endopoly-galacturonase genes. The spatio-temporal and hormonal gene expression patternsuggests a close relationship between the expression of this gene and the onset ofthe strawberry fruit ripening process and agrees with that of the production ofoligosaccharins (Redondo-Nevado et al., 2001).
5.6. Expansin
Expansins are proteins which have been demonstrated to induce cell wall exten-sion in vitro. In order for a plant cell to grow it must be continually able to modifyand expand its cell wall, which is composed of cellulose microfibrils tetheredtogether with hemicelluloses and embedded in a matrix of pectins and structuralproteins. Changes in the primary cell wall are not only required for cell expan-sion but also for developmental events, such as fruit ripening. Analysis of sevenexpansin cDNAs (FaExp1 to FaExp7) during strawberry fruit development and inleaves, roots and stolons revealed a unique pattern of expression for each cDNA.FaExp5 was the only clone to show fruit specific expression which was up-regu-lated at the onset of ripening (Harrison et al., 2001). FaExp2 expression was largelyunaffected by auxin (Civello et al., 1999).
5.7. Ascorbate peroxidase
Fruit ripening is known to be a complex process, characterised by the differentia-tion of chloroplast to chromoplast, which involves compositional, structural, andmetabolic changes including the breakdown of chlorophyll. A plant cell receivesoxidative stresses from byproducts such as superoxide radical, hydrogen peroxide,and lipid peroxides produced during fruit ripening. A series of antioxidant enzymes,including superoxide dismutase and ascorbate peroxidase (APX), are related toresponses to these oxidative stresses. Of these enzymes, the expression of APX isrelated to fruit ripening. A cytosolic ascorbate peroxidase from strawberry fruitwas isolated and its N-terminal sequence was determined (Kim and Chung, 1998).Using degenerated oligonucleotide primers two polymerase chain reaction productswere synthesized. Screening of a strawberry fruit cDNA library resulted in a cDNAencoding a cytosolic APX isoform. The APX mRNA is strongly expressed in fruitand weakly in leaf, root, and petiole, but not in seed. During ripening, the expres-sion of the mRNA increased to the maximum level at the turning stage (Kim andChung, 1998).
5.8. Miscellaneous
Differential screening of a cDNA library from ripe wild-strawberry receptaclesallowed the isolation of a cDNA for an mRNA which accumulated to high levels
358 W. Schwab and T. Raab

in ripe strawberry receptacles. Sequence analysis showed homology with cys-tathionine Ξ-synthase (CGS), an enzyme involved in methionine biosynthesis. Amuch stronger expression was observed in receptacles from strawberries comparedto other organs. Accumulation of CGS transcripts and CGS protein was highlycorrelated with the progress of ripening. The treatment of receptacles with auxin sig-nificantly reduced CGS gene expression (Marty et al., 2000).
Although the process of ripening has been studied extensively, we still lackvaluable information on how the numerous metabolic pathways are regulated andco-ordinated. Recently, FaMYB1, a ripening regulated strawberry gene memberof the MYB family of transcription factors was characterised. Expression of lateflavonoid biosynthesis genes and their enzyme activities were adversely affectedby FaMYB1 overexpression in tobacco plants. The results suggest that FaMYB1may play a key role in regulating the biosynthesis of anthocyanins and flavonolsin strawberry (Aharoni et al., 2001).
Several other strawberry ripening genes have also been reported such as e.g.acyl carrier protein, terpene synthase, O-methyltransferase and glycosyltransferase(Nam et al., 1999; Hamano et al., 1998; Manning 1998; Medina-Escobar et al., 1997;Wilkinson et al., 1995). However, the main role of these genes during strawberrydevelopment is still unkown.
For the strawberry we are at an exciting stage in elucidating the molecularevents which bring about ripening in this fruit, and how they might be regulatedat the hormonal level. Identification of ripening-related genes and their proteinproducts will in due course yield information on the basic mechanisms under-laying the changes in texture, flavour and colour occurring during strawberry fruitripening. It is expected that this information will lead to a rational approach to manip-ulating these ripening parameters in soft fruit in general for the benefit of consumersand producers alike.
6. STORAGE
Controlled atmospheres (CA), and in particular high CO2 concentrations in thestorage atmosphere, are widely used to extent storage and shelf life in a numberof perishable berry fruits. In general, these storage practices maintain a number ofimportant quality characteristics, such as berry firmness, soluble solids, acidity,and freshness, and reduce fungal decay. However, Vitamin C content (ascorbicacid plus dehydroascorbic acid) was reduced by high CO2 concentrations instrawberries (Agar et al., 1997). Ascorbic acid was more diminished at high CO2
than dehydroascorbic acid. This suggests a stimulating effect of high CO2 concen-trations on the oxidation of ascorbic acid and/or an inhibition of mono- ordehydroascorbic acid reduction to ascorbic acid.
It was also observed that storage in elevated CO2 atmospheres induced a paleingor ‘bleaching’ of the internal flesh color of strawberry (Holcroft and Kader, 1999b).Further investigation of this phenomenon indicated that two enzymes in the biosyn-thetic pathway were adversely affected by elevated CO2 atmospheres. While thisexplains that further synthesis of the anthocyanin pigment is inhibited to a certain
Developmental Changes and Physico-Chemical Changes 359

extent, it does not fully explain the ‘bleaching’ phenomena. Since pH has a profoundeffect on anthocyanin stability and color expression, particularly in an aqueoussolution, it was assumed that changes in pH induced by CA treatments could causesignificant losses in color. Indeed, the ‘bleaching’ effect during storage in elevatedCO2 atmospheres correlated with an increase in pH and a reduction in malic andcitric acid (Holcroft and Kader, 1999b).
Anthocyanin concentrations increased in both external and internal tissues storedin air, but the increase was lower in fruit stored in air enriched with CO2. Activitiesof phenylalanine ammonia-lyase (PAL) and UDP glucose: flavonoid glucosyl-transferase (GT) decreased during storage, with decreases being greater in bothexternal and internal tissues of strawberry fruit stored in air enriched with CO2
than in those kept in air. Phenolic compounds increased during storage but werenot affected by the storage atmosphere (Holcroft and Kader, 1999a).
CO2-treated strawberry fruit are firmer than air-stored fruit and have lower sus-ceptibility to decay, resulting in extension of postharvest life. Moreover, firmnessof strawberries increase, rather than simply be maintained, when fruits are exposedto high levels of CO2 during cold storage. Firmness-enhancement is due to anincrease in the strength of cell-to-cell bonding. It was assumed that the mecha-nism of CO2 enhancement of firmness is associated with changes in the pH of theapoplast (Harker et al., 2000).
The effects of elevated O2 alone or in combination with elevated CO2 atmospheresfor postharvest decay control on strawberry fruit were assessed. In vitro and invivo growth of Botrytis cinerea and the effects on fruit quality were determined. Thecommercially-used CO2 level of 15 kPa in air and its combination with 40 kPa O2
were most effective in suppressing mycelial growth. In all treatments, the growthrate increased immediately upon removal from the atmosphere, indicating thatthere was no residual inhibitory effect (Wszelaki and Mitchum, 2000).
Strawberries were held in air, and air plus 20% CO2, with and without the inclu-sion of a potassium permanganate absorbent. The addition of CO2 and potassiumpermanganate both decreased the concentration of ethylene in the atmosphere duringstorage and decreased the rate of deterioration of berries. The results suggestedthat an important beneficial action of high CO2 on strawberries is to supress ethyleneproduction (Kim and Wills, 1998).
Effects of CO2 treatments on concentrations of fermentation products, organicacids, and activities of pyruvate decarboxylase (PDC) and alcohol dehydrogenase(ADH) were measured in fruit of selected strawberry cultivar. Cultivar were clas-sified as intolerant to high CO2, showing accumulation of acetaldehyde, ethanol, andethyl acetate and as tolerant to high CO2 showing no accumulation of fermenta-tion products. Activities of PDC and ADH were higher in CO2-treated than inair-treated fruit of tolerant cultivars but not in the intolerant cultivars (Fernandez-Trujillo et al., 1999; Watkins et al., 1999).
Atmospheres combining high O2 and high CO2 were the most effective in pre-venting fungal growth and enhancing strawberry firmness. Other quality parameterssuch as color, titrable acidity, sugars and organic acids distribution, off-flavor devel-opment, and aroma were only mildly affected by superatmospheric O2 levels.Evidence of an altered ester biosynthesis was also found in fruits stored under
360 W. Schwab and T. Raab
these high-O2 atmospheres. Data obtained suggest that stress induced by high CO2
and stress induced by high O2 have an additive effect on strawberry flavor alter-ation (Pérez and Sanz, 2001).
Ozone treatment was ineffective in preventing fungal decay in strawberries.Significant differences in sugars and ascorbic acid content were found in ozone-treated strawberries. The vitamin C content of ozonated strawberries was 3 timesthat of control fruits. A detrimental effect of ozone treatment on strawberry aromawas observed, with a reduced emission of volatile esters in ozonated fruits (Pérezet al., 1999).
Strawberry fruit were fumigated with nitric oxide immediately after harvest.The treatment extended the postharvest life of strawberries, the most pronouncedeffect being obtained with nitric oxide in the concentration range 5–10 µl l–1.Fumigation with 1-methylcyclopropene at 15 nl l–1 also extended the postharvestlife but at higher concentrations there was an accelerated loss of quality (Ku etal., 1999).
Fully red strawberries were treated for 1–5 h at temperatures ranging from 39to 50 °C. The lower fungal development and the slower ripening rate shown by heat-treated fruits suggest that this physical method could be useful to extend thepostharvest shelf life of strawberry (Civello et al., 1997).
The aromatic volatile compounds of high pressure treated strawberry couliswere compared with aromatic volatile compounds of raw strawberry and heat-treatedstrawberry coulis. No significant changes of all the aromatic volatile compoundswere observed between untreated and high pressure-treated (500 MPa) strawberrycoulis. On the other hand, changes appeared in the composition of aromatic com-pounds after an ultra high hydrostatic pressure treatment at 800 MPa and after asterilisation (Lambert et al., 1999). Similar results have been obtained when straw-berry fruits were submitted to high pressure ranging from 200 to 800 MPa (Zabetakiset al., 2000).
The firmness of strawberry varieties was determined by penetrometric methodusing a motorized materials testing device. Maximum force was the best para-meter for the assessment of firmness (Hiertaranta and Linna, 1999).
Nondestructive real-time detection of volatile organic compounds is a subjectof considerable interest in various areas of science and technology. The nonde-structive methods can be applied to food quality control, environmental monitoring,and real-time detection of organic volatiles emitted from fruits during aging.Photoluminescence with visible emission spectrum was observed and visualised atthe surface of strawberry fruits. This photoluminescence is associated with vaporsof natural organic volatiles emitted from the fruit surface. Fruit aging was foundto be accompanied by modification of the photoluminescence spectrum shape anda noticeable increase in the photoluminescence intensity (Kharlamov and Burrows,2001). A novel method, based on proton transfer reaction-mass spectrometry (PTR-MS) was also used to monitor the postharvest aging of strawberries by real timedetection of volatile organic compounds (VOCs) in the headspace of the fruits(Boschetti et al., 1999). Methanol is a major volatile associated with aging andreaches concentrations of 40 ppm. The overall pattern of the emission of acetic acid,methyl acetate and ethyl acetate matches quite nicley that of methanol. This confirms
Developmental Changes and Physico-Chemical Changes 361

the correlation of these substances with the onset of catabolic processes occurringinside the fruit.
Unlike climacteric fruit such as tomatoes, the field of genetically modifiedstrawberries has not yet developed into a huge market. However, this topic willno doubt prove to be an exciting and important field of research in the near future.Like other fruits, genetically modified strawberries can be developed to increasethe production of bigger and tastier crops and to increase their availability throughoff-seasons.
ACKNOWLEDGEMENT
We thank Ken Manning for providing valuable suggestions and revision of thetext.
REFERENCES
Agar, I. T., J. Streif and F. Bangerth (1997). Effect of high CO2 and controlled atmosphere (CA) onthe ascorbic and dehydroascorbic acid content of some berry fruits. Postharvest Biology andTechnology 11: 47–55.
Aharoni, A., L. C. P. Keizer, H. J. Bouwmeester, Z. K. Sun, M. Alvarez-Huerta, H. A. Verhoeven,J. Blaas, A. van Houwelingen, R. C. H. De Vos, H. van der Voet, R. C. Jansen, M. Guis, J. Mol,R. W. Davis, M. Schena and A. J. van Tunen (2000). Identification of the SAAT gene involvedin strawberry flavor biogenesis by use of DNA micoarrays. Plant Cell 12: 647–661.
Aharoni, A., R. C. H. De Vos, M. Wein, Z. Sun, R. Greco, A. Kroon, J. N. M. Mol and A. P.O‘Connell (2001). The strawberry FaMYB1 transcription factor suppresses anthocyanin and flavonolaccumulation in transgenic tobacco. Plant Journal 28: 319–332.
Amakura, Y., M. Okada, S. Tsuji and Y. Tonogai (2000). Determination of ellagic acid in fresh andprocessed fruits by HPLC. Journal of the Food Hygienic Society of Japan 41: 206–211.
Arnaldos, T. L., M. A. Ferrer, R. Muñoz and A. Calderón (2001). Purification and stability of a basicperoxidase from strawberry callus culture. Plant Physiology and Biochemistry 39: 479–486.
Bakker, J., P. Bridle and S. J. Bellworthy (1994). Strawberry juice colour: A study of the quantitativeand qualitative pigment composition of juices from 39 genotypes. Journal of the Science of Foodand Agriculture 64: 31–37.
Blake, P. S., D. R. Taylor, C. M. Crisp, L. N. Mander and D. J. Owen (2000). Identification ofendogenous gibberellins in strawberry, including the novel gibberellins GA123, GA124 and GA125.Phytochemistry 55: 887–890.
Boschetti, A., F. Biasioli, M. van Opbergen, C. Warneke, A. Jordan, R. Holzinger, P. Prazeller,T. Karl, A. Hansel, W. Lindinger and S. Iannotta (1999). PTR-MS real time monitoring of theemission of volatile organic compounds during postharvest aging of berry fruit. Postharvest Biologyand Technology 17: 143–151.
Bridle, P. and C. García-Viguera (1997). Analysis of anthocyanins in strawberries and elderberries. Acomparison of capillary zone electrophoresis and HPLC. Food Chemistry 59(2): 299–304.
Carlton, P. S., L. A. Kresty, J. C. Siglin, M. A. Morse, J. Lu, C. Morgan and G. D. Stoner (2001).Inhibition of N-nitrosomethylbenzylamine-induced tumorigenesis in the rat esophagus by dietaryfreeze-dried strawberries. Carcinogenesis 22: 441–446.
Cheng, G. W., D. A. Malencik and P. J. Breen (1994). UDP-glucose: Flavonoid O-glucosyltransferasefrom strawberry fruit. Phytochemistry 35: 1435–1439.
Civello, P. M., G. A. Martínez, A. R. Chaves and M. C. Anón (1995). Peroxidase from strawberryfruit (Fragaria ananassa Duch.): Partial purification and determination of some properties. Journalof Agricultural and Food Chemistry 43: 2596–2601.
362 W. Schwab and T. Raab

Civello, P. M., G. A. Martínez, A. R. Chaves and M. C. Anón (1997). Heat treatments delay ripeningand postharvest decay of strawberry fruit. Journal of Agricultural and Food Chemistry 45:4589–4594.
Civello, P. M., A. L. T. Powell, A. Sabehat and A. B. Bennett (1999). An expansin gene expressedin ripening strawberry fruit. Plant Physiology 121: 1273–1279.
Claussen, W. and F. Lenz (1999). Effect of ammonium or nitrate nutrition on net photosynthesis, growth,and activity of the enzymes nitrate reductase and glutamine synthetase in blueberry, raspberry andstrawberry. Plant and Soil 208: 95–102.
Clifford, M. N. and A. Scalbert (2000). Ellagitannins – Nature, occurrence and dietary burden. Journalof the Scien.
De los Angeles Serradell, M., P. A. Rozenfeld, G. A. Martinez, P. M. Civello, A. R. Chaves andM. C. Anon (2000). Polyphenoloxidase activity from strawberry fruit (Fragaria × ananassa, Duch.,cv Selva): Characterization and partial purification. Journal of the Science of Food and Agriculture80: 1421–1427.
Dudareva, N., J. C. Dauria, K. Nam, R. A. Raguso, E. Pichersky and K. H. Nam (1998). Acetyl-CoA:Benzylalcohol acetyltransferase – an enzyme involved in floral scent production in Clarkia breweri.Plant Journal 14: 297–304.
Espín, J. C., M. Ochoa, J. Tudela and F. García-Cánovas (1997). Monophenolase activity of straw-berry polyphenol oxidase. Phytochemistry 45: 667–670.
Fernandez-Trujillo, J. P., J. F. Nock and C. B. Watkins (1999). Fermentative metabolism and organicacid concentration in fruit of selected strawberry cultivars with different tolerances to carbon dioxide.Journal of the American Society for Horticultural Science 124: 696–701.
Forney, C. F., W. Kalt and M. A. Jordan (2000). The composition of strawberry aroma is influencedby cultivar, maturity, and storage. HortScience 35: 1022–1026.
Fry, S. C. (1995). Polysaccharide-modifying enzymes in the plant cell wall. Annual Review on PlantPhysiology and Plant Molecular Biology 46: 497–520.
Gansser, D., S. Latza and R. G. Berger (1997). Methyl jasmonates in developing strawberry fruit(Fragaria × ananassa Duch. cv. Kent). Journal of Agricultural and Food Chemistry 45: 2477–2480.
García-Martínez, J. L. and P. Hedden (1997). Gibberellins and fruit development. In F. A. Tomás-Barberán and R. J. Robins (eds.), Phytochemistry of fruit and vegetables (Proceedings of thePhytochemical Society of Europe, 41). Clarendon Press, Oxford, pp. 263–285.
Given, N. K., M. A. Venis and D. Grierson (1988a). Phenylalanine ammonia-lyase activity and antho-cyanin synthesis in ripening strawberry fruit. Journal of Plant Physiology 133: 25–30.
Given, N. K., M. A. Venis and D. Grierson (1988b). Hormonal regulation of ripening in the straw-berry, a non-climacteric fruit. Planta 174: 402–406.
Häkkinen, S., M. Heinonen, S. Kärenlampi, H. Mykkänen, J. Ruuskanen and R. Törrönen (1999).Screening of selected flavonoids and phenolics in 19 berries. Food Research International 32:345–353.
Häkkinen, S. H., S. O. Kärenlampi, I. M. Heinonen, H. M. Mykkänen and A. R. Törrönen (1998). HPLCmethod for screening of flavonoids and phenolic acids in berries. Journal of the Science of Foodand Agriculture 77: 543–551.
Häkkinen, S. H. and A. R. Törrönen (2000). Content of flavonols and selected phenolic acids in straw-berries and Vaccinium species: Influence of cultivar, cultivation site and technique. Food ResearchInternational 33: 517–524.
Hamano, M., H. Miura and Y. Tabei (1998). Analysis of differentially expressed mRNAs during theearly developmental stage of strawberry (Fragaria × ananassa Duch.) fruit by differential displaytechnique. Journal of the Japanese Society for Horticultural Science 67: 559–561.
Harker, F. R., H. J. Elgar, C. B. Watkins, P. J. Jackson and I. C. Hallett (2000). Physical and mechan-ical changes in strawberry fruit after high carbon dioxide tratments. Postharvest Biology andTechnology 19: 139–146.
Harpster, M. H., D. A. Brummell and P. Dunsmuir (1998). Expression analysis of a ripening-specific,auxin-repressed end-1,4-β-glucanase gene in strawberry. Plant Physiology 118: 1307–1316.
Harrison, E. P., S. J. McQueen-Mason and K. Manning (2001). Expression of six expansin genes inrelation to extension activity in developing strawberry fruit. Journal of Experimental Botany 52:1437–1446.
Developmental Changes and Physico-Chemical Changes 363
Henning, W. (1981). Flavonol glycosides of strawberries (Fragaria × ananassa Duch.), raspberries(Rubus idaeus L.) and blackberries (Rubus fruticosus L.). Zeitschrift für Lebensmittel Untersuchungund – Forschung 173: 180–187.
Hietaranta T. and M. M. Linna (1999). Penetrometric mesurement of strawberry fruit firmness: Devicetesting. HortTechnology 9: 103–105.
Holcroft, D. and A. A. Kader (1999a). Carbon dioxide-induced changes in color and anthocyanin syn-thesis of stored strawberry fruit. HortScience 34: 1244–1248.
Holcroft, D. and A. A. Kader (1999b). Controlled atmosphere-induced changes in pH and organicacid metabolism may affect color of stored strawberry fruit. Postharvest Biology and Technology17: 19–32.
Honkanen, E. and T. Hirvi (1990). The flavour of berries. In I. D. Morton and A. J. MacLeod (eds.),Developments in food sciences 3C, Food flavours, Part C, The flavour of fruits. Elsevier, Amsterdam,pp. 125–193.
Huber, D. J. (1984). Strawberry fruit softening: The potential roles of polyuronides and hemicellu-loses. Journal of Food Science 49: 1310–1315.
Irkaeva, N. M. and T. V. Matveeva (1997). Response of strawberry (Fragaria vesca L.) strains tocytokinin in vitro. Russian Journal of Genetics 33: 404–409.
Kaul, A. and K. L. Khanduja (1998). Polyphenols inhibit promotional phase of tumorigenesis: Relevanceof superoxide radicals. Nutrition and Cancer 32: 81–85.
Keßler, M., O. Bye and S. Furusaki (1997). Loss of viability correlates with altered acid phosphataseactivity in suspended strawberry cell fractions after excessive agitation. Biotechnology Letters 19:545–548.
Kharlamov, A. A. and H. Burrows (2001). Visualization of fruit odor by photoluminescence. AppliedBiochemistry and Microbiology 37: 206–214.
Kim, I. J. and W. I. Chung (1998). Molecular characterization of a cytosolic ascorbate peroxidase instrawberry fruit. Plant Science 133: 69–77.
Kim, G. H. and R. B. H. Wills (1998). Interaction of enhanced carbon dioxide and reduced ethyleneon the storage life of strawberries. Journal of Horticultural Science & Biotechnology 73: 181–184.
Koh, T. H., L. D. Melton and R. H. Newman (1997). Solid-state 13C NMR characterization of cell wallsof ripening strawberries. Canadian Journal of Botany 75: 1957–1964.
Ku, V. V. V., R. B. H. Wills and S. Ben-Yehoshua (1999). 1-methylcyclopropene can differentiallyaffect the postharvest life of strawberries exposed to ethylene. HortScience 34: 119–120.
Kurata, H., A. Mochizuki, N. Okuda, M. Seki and S. Furusaki (2000). Intermittent light irradiationwith second- or hour-scale periods controls anthocyanin production by strawberry cells. Enzymeand Microbial Technology 26: 621–629.
Lambert, Y., G. Demazeau, A. Largeteau and J. M. Bouvier (1999). Changes in aromatic volatilecomposition of strawberry after high pressure treatment. Food Chemistry 67: 7–16.
Larsen, M. and L. Poll (1992). Odour thresholds of some important aroma compounds in strawber-ries. Zeitschrift für Lebensmittel-Untersuchung und – Forschung 195: 120–123.
Latza, S., D. Gansser and R. G. Berger (1996). Idenitification and accumulation of 1-O-trans-cinnamoyl-β-D-glucopyranose in developing strawberry fruit (Fragaria × ananassa Duch. cv. Kent). Journalof Agricultural and Food Chemistry 44: 1367–1370.
Lazarus, C. M. and H. MacDonald (1996). Characterization of a strawberry gene for auxin-bindingprotein, and its expression in insect cells. Plant Molecular Biology 31: 267–277.
Legentil, A., I. Guichard, B. Piffaut and J. P. Haluk (1995). Characterization of strawberry pectinextracted by chemical means. Lebensmittel-Wissenschaft und – Technologie 28: 569–576.
Leshem, Y. Y. and Y. Pinchasov (2000). Non-invasive photoacoustic spectroscopic determination ofrelative endogenous nitric oxide and ethylene content stoichiometry during the ripening of straw-berries Fragaria anannasa (Duch.) and avocados Persea americana (Mill.). Journal of ExperimentalBotany 349(51): 1471–1473.
Li, Y., R. Sakiyama, H. Maruyama and S. Kawabata (2001). Regulation of anthocyanin biosynthesisduring fruit development in ‘Nyoho’ strawberry. Journal of the Japanese Society for HorticulturalScience 70: 28–32.
Llop-Tous, I., E. Dominguez-Puigjaner, X. Palomer and M. Vendrell (1999). Characterization of two
364 W. Schwab and T. Raab

divergent endo-β-1,4-glucanase cDNA clones highly expressed in the nonclimacteric strawberry fruit.Plant Physiology 119: 1415–1421.
Loarca-Piña, G., P. A. Kuzmicky, E. G. de Mejía and N. Y. Kado (1998). Inhibitory effects of ellagicacid on the direct-acting mutagenicity of aflatoxin B1 in the Salmonella microsuspension assay.Mutation Research 398: 183–187.
López-Serrano, M. and A. R. Barceló (1997). Kinetic properties of (+)-catechin oxidation by a basicperoxidase isoenzyme from strawberries. Journal of Food Science 62: 676–679.
López-Serrano, M. and A. Ros Barceló (2001). Histochemical localization and developmental expres-sion of peroxidase and polyphenol oxidase in strawberries. Journal of the American Society forHorticultural Science 126: 27–32.
Manning, K. (1993). Soft fruit. In G. B. Seymour, J. E. Taylor and G. A. Tucker (eds.), Biochemistryof fruit ripening. Chapman & Hall, London, pp. 347–377.
Manning, K. (1998). Isolation of a set of ripening-related genes from strawberry: their identification andpossible relationship to fruit quality traits. Planta 205: 622–631.
Marty, I., C. Douat, L. Tichit, K. Jungsup, T. Leustek and G. Albagnac (2000). The cystathionine-Ξ-synthase gene involved in methionine biosynthesis is highly expressed and auxin-repressed duringwild strawberry (Fragaria vesca L.) fruit ripening. Theoretical and Applied Genetics 100: 1129–1136.
Matsubayashi, T. and Y. Sakagami (1996). Phytosulfokine, sulfated peptides that induce the prolifer-ation of single mesophyll cells of Asparagus officinalis L. Proceedings of the National Academyof Science USA 93: 7623–7627.
Medina-Escobar, N., J. Cardenas, E. Moyano, J. L. Caballero and J. Munoz-Blanco (1997). Cloning,molecular characterization and expression pattern of a strawberry ripening-specific cDNA withsequence homology to pectate lyase from higher plants. Plant Molecular Biology 34: 867–877.
Medina-Escobar, N., J. Cardenas, J. Munoz-Blanco and J. L. Caballero (1998). Cloning and molec-ular characterization of a strawberry fruit ripening-related cDNA corresponding a mRNA for alow-molecular-weight heat-shock protein. Plant Molecular Biology 36: 33–42.
Medina-Escobar, N., J. Cardenas, V. Valpuesta, J. Munoz-Blanco and J. L. Caballero (1997). Cloningand characterization of cDNAs from genes differently expressed during the strawberry fruit ripeningprocess by a MAST-PCR-SBDS method. Analytical Biochemistry 248: 288–296.
Mitchel, W. C. and G. Jelenkovic (1995). Characterizing NAD- and NADP-dependent alcohol dehy-drogenase enzymes of strawberries. Journal of the American Society for Horticultural Science120: 798–801.
Miyanaga, K., M. Seki and S. Furusaki (2000a). Quantitative determination of cultured strawberry-cell heterogeneity by image analysis: Effects of medium modification on anthocyanin accumulation.Biochemical Engineering Journal 5: 201–207.
Miyanaga, K., M. Seki and S. Furusaki (2000b). Analysis of pigmentation in individual cultured plantcells using an image processing system. Biotechnology Letters 22: 977–981.
Moing, A., C. Renaud, M. Gaudillere, P. Raymond, P. Roudeillac and B. Denoyes-Rothan (2001).Biochemical changes during fruit development of four strawberry cultivars. Journal of the AmericanSociety for Horticultural Science 126: 394–403.
Montero, T., E. Molla, M. A. Martin-Cabrejas and F. J. Lopez-Andreu (1998). Effects of gibberellicacid (GA3) on strawberry PAL (phenylalanine ammonia-lyase) and TAL (tyrosine ammonia-lyase)enzyme activites. Journal of the Science of Food and Agriculture 77: 230–234.
Mori, T. and M. Sakurai (1998). Conditioned medium from heterogeneous plants (rose and grape) oncell growth and anthocyanin synthesis of Fragaria ananassa. Biotechnology Letters 20(1): 73–75.
Mori, T. and M. Sakura (1999). Preparation of conditioned medium to stimulate anthocyanin produc-tion using suspension cultures of Fragaria ananassa cells. World Journal of Microbiology &Biotechnology 15: 635–637.
Mori, T., M. Sakurai and M. Sakuta (2000). Changes in PAL, CHS, DAHP synthase (DS-Co and DS-Mn) activity during anthocyanin synthesis in suspension culture of Fragaria ananassa. Plant Cell,Tissue and Organ Culture 62: 135–139.
Mori, T., M. Sakurai and M. Sakuta (2001). Effects of conditioned medium on activities of PAL,CHS, DAHP synthase (DS-Co and DS-Mn) and anthocyanin production in suspension cultures ofFragaria ananassa. Plant Science 160: 355–360.
Mori, T., M. Sakurai, M. Seki and S. Furusaki (1994). Effects of conditioning factors on anthocyanin
Developmental Changes and Physico-Chemical Changes 365

production in strawberry suspension cultures. Journal of the Science of Food and Agriculture 66:381–388.
Moyano, E., I. Portero-Robles, N. Medino-Escobar, V. Valpuesta, J. Munoz-Blanco and J. L. Caballero(1998). A fruit-specific putative dihydroflavonol 4-reductase gene is differentially expressed in straw-berry during the ripening process. Plant Physiology 117: 711–716.
Nakamura, M., M. Seki and S. Furusaki (1998). Enhanced anthocyanin methylation by growth limita-tion in strawberry suspension culture. Enzyme and Microbial Technology 22: 404–408.
Nakamura, M., Y. Takeuchi, K. Miyanaga, M. Seki and S. Furusaki (1999). High anthocyanin accu-mulation in the dark by strawberry (Fragaria ananassa) callus. Biotechnology Letters 21: 695–699.
Nam, Y. W., L. Tichit, M. Leperlier, B. Cuerq, I. Marty and J. M. Lelièvre (1999). Isolation andcharacterization of mRNAs differentially expressed during ripening of wild strawberry (Fragariavesca L.) fruis. Plant Molecular Biology 39: 629–636.
Narayanan, B. A., O. Geoffroy, M. C. Willingham, G. G. Re and D. W. Nixon (1999). p53/p21(WAF1/CIP1) expression and its possible role in G1 arrest and apoptosis in ellagic acid treated cancercells. Cancer Letters 136: 215–221.
Natella, F., M. Nardini, M. Di Felice and C. Scaccini (1999). Benzoic and cinnamic acid derivativesas antioxidants: Structure-activity relation. Journal of Agricultural and Food Chemistry 47:1453–1459.
Nogata, Y., H. Ohta and A. G. J. Voragen (1993). Polygalacturonase in strawberry fruits. Phytochemistry34: 617–620.
Nogata, Y., K. Yoza, K. Kusumoto and H. Kenichi (1996). Changes in molecular weight and carbo-hydrate composition of cell wall polyuronide and hemicellulose during ripening in strawberry fruit.Progress in Biotechnology 14: 591–596.
Olías, J., C. Sanz, J. J. Ríos and A. G. Pérez (1995). Substrate specificity of alcohol acyltransferasefrom strawberry and banana fruits. In R. L. Rouseff and M. M. Leahy (eds.), Fruit flavors: Biogenesis,characterization and authentication. American Chemical Society, Washington DC, pp. 134–141.
Orruño, E., R. O. Apenten and I. Zabetakis (2001). The role of β-glucosidase in the biosynthesis of2,5-dimethyl-4-hydroxy-3(2H)-furanone in strawberry (Fragaria × ananassa cv. Elsanta). Flavourand Fragrance Journal 16: 81–84.
Pérez, A. G., R. Olías, J. M. Olías and C. Sanz (1999). Biosynthesis of 4-hydroxy-2,5-dimethyl-3(2H)-furanone and derivatives in in vitro grown strawberries. Journal of Agricultural and FoodChemistry 47: 655–658.
Pérez, A. G. and C. Sanz (2001). Effect of high-oxygen and high-carbon-dioxide atmosphereson strawberry flavor and other quality traits. Journal of Agricultural and Food Chemistry 49:2370–2375.
Pérez, A. G., C. Sanz and J. M. Olías (1993). Partial purification and some properties of alcohol acyl-transferase from strawberry fruit. Journal of Agricultural and Food Chemistry 41: 1462–1466.
Pérez, A. G., C. Sanz, R. Olías and J.M. Olías (1997). Effect of methyl jasmonate on in vitro straw-berry ripening. Journal of Agricultural and Food Chemistry 45: 3733–3737.
Pérez, A. G., C. Sanz, R. Olías and J. M. Olías (1999). Lipoxygenase and hydroperoxide lyase activityin ripening strawberry fruits. Journal of Agricultural and Food Chemistry 47: 249–253.
Pérez, A. G., C. Sanz, R. Olías, J. J. Ríos, R. Olías and J. M. Olías (1999). Effect of ozone treatmenton postharvest strawberry quality. Journal of Agricultural and Food Chemistry 47: 1652–1656.
Pérez, A. G., C. Sanz, R. Olías, J. J. Ríos and J. M. Olías (1996). Evolution of strawberry alcoholacyltransferase activity during fruit development and storage. Journal of Agricultural and FoodChemistry 44: 3286–3290.
Perkins-Veazie, P. M. (1995). Growth and ripening of strawberry fruits. Horticultural Review 17:267–297.
Perkins-Veazie, P. M., D. J. Huber and J. K. Brecht (1995). Characterization of ethylene productionin developing strawberry fruit. Plant Growth Regulation 17: 33–39.
Poovaiah, B.W. and K. Veluthambi (1985). Auxin regulated invertase activity in strawberry fruits. Journalof the American Society of Horticultural Science 110: 258–261.
Redgwell, R. J., M. Fischer, E. Kendal and E. A. MacRae (1997). Galactose loss and fruit ripening:
366 W. Schwab and T. Raab

High-molecular-weight arabinogalactans in the pectic polysaccharides of fruit cell walls. Planta 203:174–181.
Redgwell, R. J., E. MacRae, I. Hallett, M. Fischer, J. Perry and R. Harker (1997). In vivo and in vitroswelling of cell walls during fruit ripening. Planta 203: 162–173.
Redondo-Nevadao, J., E. Moyano, N. Medina-Escobar, J. L. Caballero and J. Munoz-Blanco (2001).A fruit-specific and developmentally regulated endopolygalacturonase gene from strawberry(Fragaria × ananassa cv. Chandler). Journal of Experimental Botany 52: 1941–1945.
Revilla, I. and S. J. M. L. Gonzalez (1997). Effect of exogenous indoleacetic and abscisic acids onphenylalanine ammonia-lyase and tyrosine ammonia-lyase in strawberries (Fragaria × ananassa).Agrochimica 41: 20–26.
Rice-Evans, C. A., N. J. Miller and G. Paganga (1996). Structure-antioxidant activity relationships offlavonoids and phenolic acids. Free Radical Biology & Medicine 20: 933–956.
Robards, K., P. D. Prenzler, G. Tucker, P. Swatsitang and W. Glover (1999). Phenolic compoundsand their role in oxidative processes in fruits. Food Chemistry 66: 401–436.
Robert, F. and G. Pétel (2000). Seasonal changes in adenine phosphoribosyltransferase and adenosinekinase activities as markers of the dormancy and the growth of Fragaria × ananassa. PlantPhysiology and Biochemistry 38: 395–402.
Roscher, R., G. Bringmann, P. Schreier and W. Schwab (1998). Radiotracer studies on the formationof 2,5-dimethyl-4-hydroxy-3(2H)-furanone in detached ripening strawberry fruits. Journal ofAgricultural and Food Chemistry 46: 1488–1493.
Roscher, R., M. Herderich, J. P. Steffen, P. Schreier and W. Schwab (1996). 2,5-Dimethyl-4-hydroxy-3(2H)-furanone 6′O-malonyl-β-D-glucopyranoside in strawberry fruits (Fragaria × ananassa, cv.Senga sengana). Phytochemistry 43: 155–160.
Roscher, R., P. Schreier and W. Schwab (1997) Metabolism of 2,5-dimethyl-4-hydroxy-3(2H)-furanonein detached ripening strawberry fruits. Journal of Agricultural and Food Chemistry 45: 3202–3205.
Sakurai, M., Y. Ozeki and T. Mori (1997). Induction of anthocyanin accumulation in rose suspen-sion-cultured cells by conditioned medium of strawberry suspension cultures. Plant Cell, Tissueand Organ Culture 50: 211–214.
Schieberle, P. and T. Hofmann (1997). Evaluation of the character impact odorants in fresh straw-berry juice by quantitative measurements and sensory studies on model mixtures. Journal ofAgricultural and Food Chemistry 45: 227–232
Schwab W. (1998). Application of stable isotope ratio analysis explaining the bioformation of 2,5-dimethyl-4-hydroxy-3(2H)-furanone in plants by a biological Maillard reaction. Journal ofAgricultural and Food Chemistry 46: 2266–2269.
Schwab, W., A. Aharoni, T. Raab, A. G. Pérez and C. Sanz (2001). Cytosolic aldolase is a ripeningrelated enzyme in strawberry fruits (Fragaria × ananassa). Phytochemistry 56: 407–415.
Schwab, W. and R. Roscher (1997). 4-Hydroxy-3(2H)-furanones: Natural and Maillard products. RecentResearch Developments in Phytochemistry 1: 643–673.
Sone, K., T. Mochizuki and Y. Noguchi (1999). Variations in ascorbic acid content among straw-berry cultivars and their harvest times. Journal of the Japanese Society for Horticultural Science68: 1007–1014.
Suutarinen, J., L. Änäkaäinen and K. Autio (1998). Comparison of light microscopy and spatiallyresolved fourier transform infrared (FT-IR) microscopy in the examination of cell wall compo-nents of strawberries. Lebensmittel-Wissenschaft und – Technologie 31: 595–601.
Tarenghi, E., M. Carré and J. Martin-Tanguy (1995). Effects of inhibitors of polyamine biosynthesisand of polyamines on strawberry microcutting growth and development. Plant Cell, Tissue and OrganCulture 42: 47–55.
Tarenghi, E. and J. Martin-Tanguy (1995). Polyamines, floral induction and floral development of straw-berry (Fragaria ananassa Duch.). Plant Growth Regulation 17: 157–165.
Taylor, D. R., P. S. Blake and C. M. Crisp (2000a). Identification of gibberellins in leaf tissuesof day-neutral strawberry (Fragaria × ananassa Duch.) cultivars. Plant Growth Regulation 30:5–7.
Taylor, D. R., P. S. Blake and C. M. Crisp (2000b). Identification of gibberellins in leaf exudates ofstrawberry (Fragaria × ananassa Duch.). Plant Growth Regulation 30: 221–223.
Developmental Changes and Physico-Chemical Changes 367

Tian, M. S., Y. Gong and A. D. Bauchot (1997). Ethylene biosynthesis and respiration in strawberryfruit treated with diazocyclopentadiene and IAA. Plant Growth Regulation 23: 195–200.
Tian, M. S., S. Prakash, H. J. Elgar, H. Young, D. M. Burmeister and G. S. Ross (2000). Responsesof strawberry fruit to 1-methylcyclopropene (1-MCP) and ethylene. Plant Growth Regulation 32:83–90.
Trainotti, L. (2000). Molecular aspects of the strawberry fruit softening. Developmental Plant Geneticsand Breeding 6: 133–139.
Trainotti, L., L. Ferrarese, F. Dalla vecchia, N. Rascio and G. Casadoro (1999). Two different endo-β-1,4-glucanases contribute to the softening of the strawberry fruits. Journal of Plant Physiology154: 355–362.
Trainotti, L., R. Spinello, A. Piovan, S. Spolaore and G. Casadoro (2001). β-Galactosidases with a lectin-like domain are expressed in strawberry. Journal of Experimental Botany 52: 1635–1645.
Trainotti, L., S. Spolaore, A. Pavanello, B. Baldan and G. Casadoro (1999). A novel E-type endo-β-1,4-glucanase with a putative cellulose-binding domain is highly expressed in ripening strawberryfruits. Plant Molecular Biology 40: 323–332.
Ueda, Y., A. Tsuda, J. H. Bai, N. Fujishita and K. Chachin (1992). Characteristic pattern of aromaester formation from banana, melon, and strawberry with reference to the substrate specificity ofester synthase and alcohol contents in pulp. Journal of the Japanese Society of Food Science andTechnology 39: 183–187.
Versari, A., S. Biesenbruch, D. Barbanti, P. J. Farnell and S. Galassi (1999a). Effects of pectolyticenzymes on selected phenolic compounds in strawberry and raspberry juices. Food ResearchInternational 30(10): 811–817.
Versari, A., S. Biesenbruch, D. Barbanti, P. J. Farnell and S. Galassi (1999b). HPAEC-PAD analysisof oligogalacturonic acids in strawberry juice. Food Chemistry 66: 257–261.
Wang, H., G. Cao and R. L. Prior (1996). Total antioxidant capacity of fruits. Journal of Agriculturaland Food Chemistry 44: 701–705.
Watkins, C. B., J. E. Manzano-Mendez, J. F. Nock, J. Zhang and K. E. Maloney (1999). Cultivarvariation in response of strawberry fruit to high carbon dioxide treatments. Journal of the Scienceof Food and Agriculture 79: 886–890.
Wein, M., E. Lewinsohn and W. Schwab (2001). Metabolic fate of isotopes during the biologicaltransformation of carbohydrates to 2,5-dimethyl-4-hydroxy-3(2H)-furanone in strawberry fruits.Journal of Agricultural and Food Chemistry 49: 2427–2432.
Wilkinson, J. Q., M. B. Lanahan, T. W. Conner and H. J. Klee (1995). Identification of mRNAs withenhanced expression in ripening strawberry fruit using polymerase chain reaction differential display.Plant Molecular Biology 27: 1097–1108.
Wills, R. B. H. and G. H. Kim (1995). Effect of ethylene on postharvest life of strawberries. PostharvestBiology and Technology 6: 249–255.
Wills, R. B. H., V. V. V. Ku and Y. Y. Leshem (2000). Fumigation with nitric oxide to extend thepostharvest life of strawberry. Postharvest Biology and Technology 18: 75–79.
Wolyn, D. J. and G. Jelenkovic (1990). Nucleotide sequence of an alcohol dehydrogenase gene inoctoploid strawberry (Fragaria × ananassa Duch.). Plant Molecular Biology 14: 855–857.
Woolley, L. C., D. J. James and K. Manning (2001). Purification and properties of an endo-β-1,4-glucanase from strawberry and down-regulation of the corresponding gene, cel1. Planta DOI10.1007/s004250100577.
Wszelaki, A. L. and E. J. Mitcham (2000). Effects of superatmospheric oxygen on strawberry fruitquality and decay. Postharvest Biology and Technology 20: 125–133.
Xue, H., R. M. Aziz, N. Sun, J. M. Cassady, L. M. Kamendulis, Y. Xu, G. D. Stoner and J. E. Klaunig(2001). Inhibition of cellular transformation by berry extracts. Carcinogenesis 22: 351–356.
Zabetakis, I. (1997). Enhancement of flavour biosynthesis from strawberry (Fragaria × ananassa) calluscultures by Methylobacterium species. Plant Cell, Tissue and Organ Culture 50: 179–183.
Zabetakis, I. and W. Gramshaw (1998). 1,2-Propanediol in strawberries and its role as a flavour pre-cursor. Food Chemistry 61:351–354.
Zabetakis, I. and M.A. Holden (1996). The effect of 6-deoxy-D-fructose on flavour bioformation fromstrawberry (Fragaria × ananassa, cv. Elsanta) callus culture. Plant Cell Tissue and Organ Culture45: 25–29.
368 W. Schwab and T. Raab

Zabetakis, I., P. Moutevelis-Minakakis and J. W. Gramshaw (1999). The role of 2-hydroxypropanalin the biosynthesis of 2,5-dimethyl-4-hydroxy-2H-furan-3-one in strawberry (Fragaria × ananassa,cv. Elsanta) callus cultures. Food Chemistry 64: 311–314.
Zabetakis, I., A. Koulentianos, E. Orruño and I. Boyes (2000). The effect of high hydrostatic pressureon strawberry flavour compounds. Food Chemistry 71: 51–55.
Zhang, W. and S. Furusaki (1997). Regulation of anthocyanin synthesis in suspension cultures ofstrawberry cell by pH. Biotechnology Letters 19: 1057–1061.
Zhang, W., M. Seki, S. Furusaki and A. P. J. Middelberg (1998). Anthocyanin synthesis, growth andnutrient uptake in suspension cultures of strawberry cells. Journal of Fermentation andBioengineering 86: 72–78.
Developmental Changes and Physico-Chemical Changes 369

PROCESSING OF HORTICULTURAL CROPS IN THETROPICS
R. MADAKADZE AND M. MASARIRAMBIDepartment of Crop Science, Engineering, University of Zimbabwe, P.O. Box MP167, Mount Pleasant, Harare, Zimbabwe
E. NYAKUDYADepartment of Soil Science and Agricultural Engineering, Engineering, University of Zimbabwe, P.O. Box MP167, Mount Pleasant, Harare, Zimbabwe
1. INTRODUCTION
Horticultural crops such as fruits and vegetables are very important in humannutrition because when consumed in adequate amounts, they are an important sourceof vitamins, mineral nutrients and fibre. Processing of fruits and vegetables is veryimportant in the tropics where most of the developing countries like Zimbabweare located. The magnitude of postharvest losses of fresh fruits and vegetables isestimated to be 5 to 25% in developed countries and 20 to 50% in developingcountries depending upon commodity (Kader, 1992). For Zimbabwe’s rural poor,smallholder horticultural production provides extra income when the produce ismarketed locally or transported, packed, processed and marketed in distant places,including highly populated local urban areas and internationally. Employmentcreation, reduction of postharvest losses and enhancing of household food securityare also some of the reasons why small holder farmers process their crops. Mostfruits and vegetables are highly perishable commodities and if they are not processedthey quickly deteriorate due to spoilage and microbial attack.
In Zimbabwe, postharvest losses of fruits and vegetables were studied byMasanganise (1994), who estimated the losses to range between 35% and 45% forthe small-scale producers. The extent of postharvest losses depends on severalfactors, such as (i) perishability of the commodity, (ii) environmental factors, (iii)interval between harvest and consumption and (iv) postharvest handling, storage andprocessing practices.
The most widely practised method of fruit and vegetable processing in the small-holder areas is direct sun drying or boiling followed by sun drying especially forvegetables. The problem with this method is that drying conditions may not be cleanand considerable quantities of nutrients are lost (Tembo, 1996). Fruits and vegeta-bles can also be processed into high value products like juice, wine, puree, jamand jelly.
Processing of fruits and vegetables grown by smallholder farmers has great poten-tial in the tropics. A considerable amount of information already exists on smallscale processing of horticultural crops (Richter et al., 1996), however, this wouldhave to be complemented by medium to large scale processing plants located at
R. Dris and S. M. Jain (eds.), Production Practices and Quality Assessment of Food Crops,
© 2004 Kluwer Academic Publishers. Printed in the Netherlands.
371
Vol. 3, “Quality Handling and Evaluation”, pp. 371–399.

strategic places such as growth points and rural service centres which have facili-ties such as electricity, water, accessible transport and telecommunications.
2. PROCESSING METHODS FOR COMMONLY PRODUCED FRUITS AND VEGETABLES
The main objective of fruit and vegetable processing is to supply wholesome, safe,nutritious and acceptable food to consumers at affordable prices throughout theyear (Dauthy, 1995). Successful fruit and vegetable processing enterprises requirea lot of skill and provision of a consistently high quality product. Processors musttherefore employ quality control measures to ensure uniformity and consistencyin their products.
Special problems that should be noted for processing fruit and vegetables includethe following:
• most of the raw materials are highly perishable and will spoil quickly after harvestunless they are processed quickly;
• many fruits and vegetables are highly seasonal, which means that the businesscan only operate for part of the year, unless crops are either part-processed forintermediate storage, or a succession of crops is processed throughout the year;
• yields of fruit and vegetables are subject to considerable variation according tothe weather, especially rainfall patterns;
• some processed foods also have a seasonal demand, which further complicatesplanning and cashflow of a business;
• even after processing, some fruit and vegetable products have a limited shelflife and distribution and sales methods must be organized so that customersreceive products in the required amounts before they spoil; and
• processing must be done to high standards of hygiene and production controlto avoid contamination by food poisoning micro-organisms (Fellows, 1997).
A well planned fruit and vegetable processing plant must be designed to operatefor as many months of the year as possible. The facilities, buildings and materialhandling and the equipment itself must be interlinked and co-ordinated to allowas many products as possible to be handled at the same time, while the equipmentmust be versatile enough to be able to handle many products without major alter-ations (Dauthy, 1995).
The products whose possible processing methods have been described below havecurrent national total production of greater than 10 000 t per annum, according tothe figures obtained from the Agricultural Technical and Extension Services (Agritex)1998. These products have not been ranked in terms of importance or productionvalues. The possible processing methods for the top ten vegetables and fruitsproduced by smallholders are shown in Table 1.
The processing methods, quality standards and equipment needs are describedin the following sections.
372 R. Madakadze et al.

Processing of Horticultural Crops in the Tropics 373
Table 1. Processing methods for vegetables and fruits.
Vegetables Processing methods Fruits Processing methods
Tomatoes Juice Mangoes JuicePastes and purees Jam and jellyCanned or bottled CannedSauces Dried
ChutneyPuree
Onions Pickled Bananas JuiceSauces WineSoups ChipsDried Dried
Irish potatoes Frozen Oranges JuiceChips Squashes and cordialsDried Marmalades and jamsFried
Sweet potatoes Dried Avocados DriedChips WineCanned Puree
ButterPaprika Dried Peaches Canned
Sauces JuiceSoups Squashes and cordialsPastes and purees Jam and jelly
PickleButterPuree
Green maize/baby corn Dried Pineapples JuicePickled WineSoups Canned
Am and jellyPuree
Butternut Soups Guavas JuiceDried Wine
JamsPuree
Cabbage Dried Grapes JuiceFrozen Squashes and cordialsPickled Wine
Dried as raisinsButterPuree
Covo Dried Masawu JuiceFrozen Wine
DriedRape Dried Sugarcane Sugar
Frozen Syrups
Source: Fellows (1997).
2.1. Juices
Juices can be made using pulped fruit from a single fruit or a mixture of fruits. Thereare juices that are drunk immediately after opening and those that are dilutedbefore use. Juices that are diluted may need a preservative such as sodium benzoatefor them to have a long shelf life after opening (Fellows, 1997). Unopened bottlesof both types (diluted ones and those consumed immediately) should have a shelflife of three to nine months, depending on the storage conditions. Pure juiceswith nothing added are preferable, except in products such as melon in which thelevel of acidity needs to be increased by addition of citric acid to give a pH below~3.5–4.0 (Nelson and Tressler, 1980). In such juices preservation is achieved throughpasteurisation and the natural acidity of the juice. The process of juice prepara-tion is shown in Appendix 1.
2.1.1. Pulping
Soft fruits such as berries, passion fruit and papaya can be pulped by hand. Harderand more fibrous fruits such as pineapple and mangoes require mechanised pulping.Juices can also be extracted using a fruit press, fruit mill or by steaming the fruit.Citrus fruit juices are extracted by reaming the fruit.
2.1.2. Pasteurisation
The time and temperature required for pasteurisation depend on the type of productand bottle size, but it is typically 10–20 minutes at 80–90 °C. Juices can either bepasteurised and then hot filled into thoroughly pre-cleaned and pre-sterilised (inboiling water for 10 minutes) bottles or cold filled and then pasteurised in sealedbottles. A volumetric piston filler can be used in filling up the bottles. A water coolercan be constructed to speed up the rate of cooling of filled containers. The hot bottlesand the cool water should pass in a counter-current way through a trough to minimiseheat shock to the containers.
2.1.3. Extraction rates/yield
The yield of tomato juice from fresh tomatoes ranges from 29.4 to 91.5%, dependingon the type of equipment used (Leonard, 1980). The processing action of a juiceextractor gives an average of 78.55%, whereas the beating action of a paddlepulper and finisher give an average juice yield of 82.4%.
2.2. Squashes, cordials and syrups
2.2.1. Squashes and cordials
Squashes and cordials are diluted to taste with water and are, therefore, used alittle at a time. The container must be re-closable and products may contain a preser-
374 R. Madakadze et al.

vative, usually sodium benzoate, to prevent spoilage after opening. Squashes aremade from at least 30% fruit juice mixed with sugar syrup, while cordials are crystalclear squashes. Although food dyes are used by some processors, these are notnecessary for most products. The process of making squashes and cordials is shownin Appendix 2.
2.2.2. Syrups
Syrups are filtered juices that are concentrated by boiling until the sugar contentreaches 50–70%. The heat and high solids content preserves the syrup and it isused in place of sugar or honey. Syrups can be made from a wide range of fruits,but the most common type is made from grapes.
2.3. Wines, vinegars and spirits
2.3.1. Wines
Wine is produced by fermentation in which sugars in the fruit juice or pulp,plus added sugar, are converted into alcohol and carbon dioxide by varieties ofyeast (Sacharomyces cerevisae) or ‘wine yeasts’. Wines are preserved by theraised levels of alcohol and their natural acidity (Fellows, 1997). Almost any fruitcan be used to make wine but the most popular include pineapple, papaya, grape,passion fruit, banana, melon and strawberry. The alcohol content of wine is6–12% and in fortified wines such as sherry or ginger wine, alcohol content isusually 15–20%. It is important to ensure that fermentation vessels are adequatelycleaned to prevent contamination by other micro-organisms that spoil wine andthat adequate sedimentation or filtration is achieved to produce a crystal clearproduct.
Sugar may be added to fruit juice to raise the level to about 20° Brix. Afterinoculation with about 3% yeast, it is held in a fermentation vessel, made fromfood grade plastic or glass for about 10 days. The vessel should be kept closed toprevent bacteria and mould from infecting the batch. After 10 days of fermenting,wine is filtered by passing it through a muslin or nylon straining cloth into narrownecked fermentation vessels, plugged with cotton wool or fitted with an air lock.Fermentation continues for another three weeks to twelve months, depending onthe temperature and the yeast being used. The end of fermentation is seen when thereare no bubbles rising to the surface. The product is then siphoned into clean con-tainers and allowed to clear and mature before it is siphoned into bottles and sealedwith sterilised cork stoppers or roll-on pilfer proof screw caps. Fruit wines suchas pineapple, which are difficult to clear because of natural gums in the fruit, canbe heated and the gums precipitated before the juice is fermented. The process ofmaking wine is shown in Appendix 3.
Processing of Horticultural Crops in the Tropics 375
2.3.2. Vinegar
Vinegar is produced by a second fermentation, after the wine, in which acetic acidproducing bacteria (Acetobacter species) convert the alcohol in wine into acetic acid.It is important for the bacteria to be in contact with air for the second fermenta-tion. Vinegar contains 6–10% acetic acid, which preserves the product for manymonths, or even years, provided that it is sealed in an air tight container to preventthe acetic acid from evaporating. Usually, vinegar fermenters pump air into the wine.The process of making vinegar is shown in Appendix 4.
2.3.3. Spirits
Alcohol is distilled to concentrate the alcohol in spirit drinks. Distillation is carriedout in a still which is a clean drum, fitted with a safety valve and a pipe to carryaway the vapour. Wine or other alcohol is placed inside the drum and heated. Thealcohol vapour is passed through cooled air or cool water and the distillate con-denses and is collected. Distillation normally requires a government licence. Modernstills are made entirely of copper or stainless steel and larger ones are fitted withthermostatically controlled heaters.
2.4. Bottled and canned products
Bottling and canning are similar processes in that food is filled into a containerand heated to destroy enzymes and micro-organisms. Fruits can be packed intojars while hot, sugar syrup and vegetables can be packed in hot brine. The filledjars are sealed and pasteurised so that an internal vacuum forms when they arecool. Sealed containers preserve the food by preventing re-contamination andexcluding air and, sometimes, light. Preservation depends on an adequate heattreatment and an air-tight seal.
There are three grades of syrup used for fruit packing in cans:
• a light syrup containing 200 g sugar per litre;• a medium syrup containing 400–600 g sugar per litre; and• a heavy syrup containing 800 g sugar per litre.
The salt concentration in brine is usually 15 g per litre.Fruits require relatively mild heating conditions for pasteurisation, for example
90–100 °C for 20 minutes, to destroy yeasts and moulds. Less acidic vegetablesrequire more severe heat sterilisation to destroy food poisoning bacteria, 121 °Cfor 15–40 minutes, depending on the size of the container. The acidity of vegeta-bles has to be adjusted using citric acid or vinegar, in order to avoid the risk ofpoisoning from inadequately processed foods.
For canning, the time and temperature are critical and must be carefully con-trolled. If the cans are underprocessed, there is a risk of serious food poisoning oreven death from Clostridium botulinum (Botulism) (Fellows, 1997). If cans areover processed the vegetables lose much of their texture, colour, vitamins and flavour
376 R. Madakadze et al.

and are, therefore, not saleable. Establishment of the correct heating conditionsdepends on the type of food, the size and shape of the can and the initial level ofcontamination of the vegetables. This requires skills of a qualified food technolo-gist and/or microbiologist. When food is heated in sealed cans during the canningprocess, the temperature of sterilisation is above 100 °C and the pressure outsidethe can must equal that inside to prevent the can from exploding. This is achievedby using high pressure steam and a strong vessel named a ‘retort’. Compressedair is also necessary to maintain the pressure while cans are cooked.
For cans, different types of products require a specific internal lacquer to preventthe metal from corroding when it is in contact with the fruits or vegetables. A‘seamer’ is also needed to seal the lid onto the can. Regular checks and maintenanceare necessary to ensure that the seam is properly formed. A seam micrometer isnecessary for this. Failures in seams are one of the main causes of spoiled orpoisonous canned foods. The processes involved in bottling/canning products areshown in Appendix 5.
2.4.1. Extraction rates/yield
For canned apricot halves the yield ranges from 70% to 90% (Lu et al., 1986).Peeling and trimming losses for canned sweet potatoes range from 10% to 35.5%(Woodroof, 1975), while that for asparagus can be as much as 20% to 30%.
2.5. Dried fruits and vegetables
The technologies used in the enterprises can be broadly classified as small-scale(manual) and medium scale (motorised) technologies. Processing in informal enter-prises may be characterised as a manual activity where as in most formal enterprisesboth manual and motorised technologies are utilised. Most of the equipment whichsmall scale processors use in processing consists of basic kitchen equipment andutensils. Examples include chopping boards, knives and cooking pots. Energy sourcesfor various technologies include direct solar energy (traditional sun drying anduse of solar drying frames), gas, wood and electricity.
Air and sun dried products are the most common types of dried fruit andvegetables. Some products may be blanched or sulphurised to protect their naturalcolour and help preserve them. Crystallised fruits, for example, peels for marmaladeand cake production and osmotically dried fruits, are fruit pieces that are soakedin hot water, followed by concentrated sugar syrups to extract some of the waterbefore air drying. The preparation procedures needed for dried fruits and vegeta-bles are summarised in Table 2.
Some vegetables and a few fruits such as limes may also be salted before drying.The high salt concentration preserves the food by both drawing out water by osmosisand by the anti-microbial properties of salt. High salt concentrations also preventthe action of some enzymes, which would cause a loss in the quality of the driedfood during storage.
Over-ripe fruits are easily damaged and may be difficult to dry, while under-
Processing of Horticultural Crops in the Tropics 377
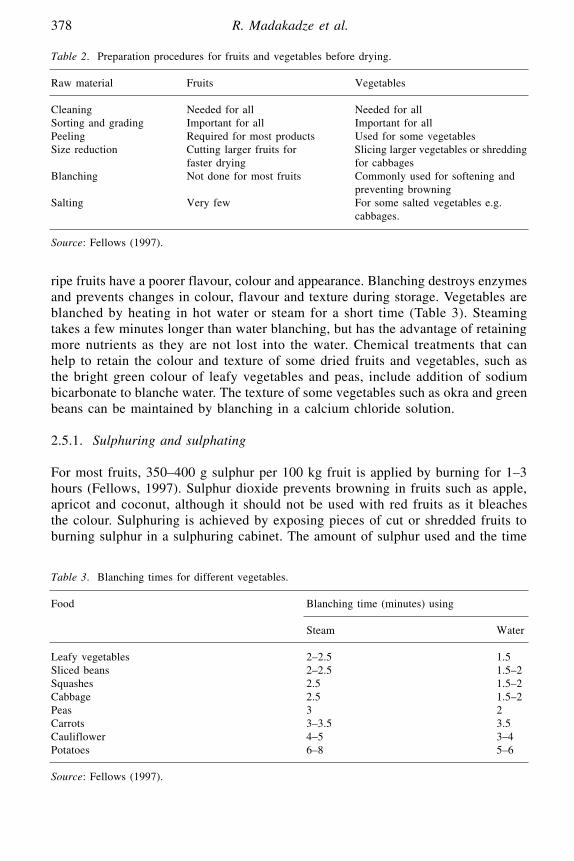
ripe fruits have a poorer flavour, colour and appearance. Blanching destroys enzymesand prevents changes in colour, flavour and texture during storage. Vegetables areblanched by heating in hot water or steam for a short time (Table 3). Steamingtakes a few minutes longer than water blanching, but has the advantage of retainingmore nutrients as they are not lost into the water. Chemical treatments that canhelp to retain the colour and texture of some dried fruits and vegetables, such asthe bright green colour of leafy vegetables and peas, include addition of sodiumbicarbonate to blanche water. The texture of some vegetables such as okra and greenbeans can be maintained by blanching in a calcium chloride solution.
2.5.1. Sulphuring and sulphating
For most fruits, 350–400 g sulphur per 100 kg fruit is applied by burning for 1–3hours (Fellows, 1997). Sulphur dioxide prevents browning in fruits such as apple,apricot and coconut, although it should not be used with red fruits as it bleachesthe colour. Sulphuring is achieved by exposing pieces of cut or shredded fruits toburning sulphur in a sulphuring cabinet. The amount of sulphur used and the time
378 R. Madakadze et al.
Table 3. Blanching times for different vegetables.
Food Blanching time (minutes) using
Steam Water
Leafy vegetables 2–2.5 1.5Sliced beans 2–2.5 1.5–2Squashes 2.5 1.5–2Cabbage 2.5 1.5–2Peas 3 2Carrots 3–3.5 3.5Cauliflower 4–5 3–4Potatoes 6–8 5–6
Source: Fellows (1997).
Table 2. Preparation procedures for fruits and vegetables before drying.
Raw material Fruits Vegetables
Cleaning Needed for all Needed for allSorting and grading Important for all Important for allPeeling Required for most products Used for some vegetablesSize reduction Cutting larger fruits for Slicing larger vegetables or shredding
faster drying for cabbagesBlanching Not done for most fruits Commonly used for softening and
preventing browningSalting Very few For some salted vegetables e.g.
cabbages.
Source: Fellows (1997).
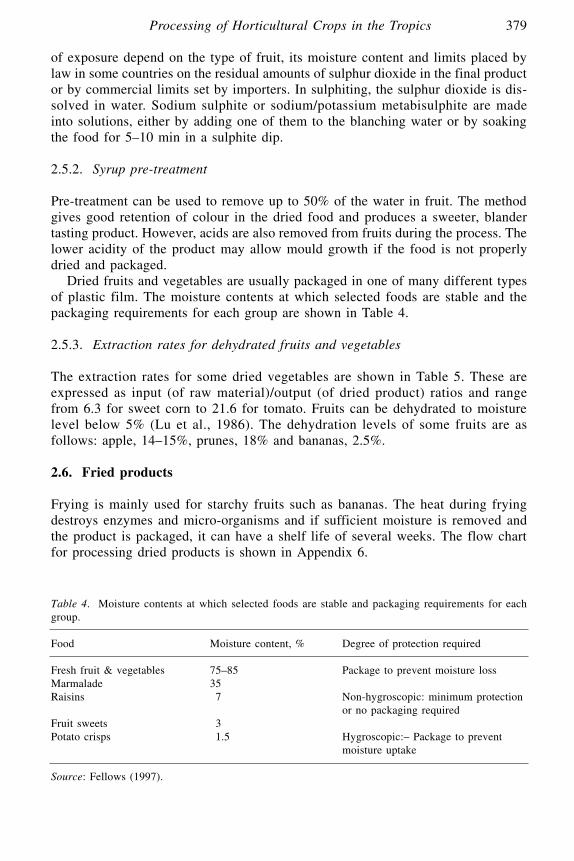
of exposure depend on the type of fruit, its moisture content and limits placed bylaw in some countries on the residual amounts of sulphur dioxide in the final productor by commercial limits set by importers. In sulphiting, the sulphur dioxide is dis-solved in water. Sodium sulphite or sodium/potassium metabisulphite are madeinto solutions, either by adding one of them to the blanching water or by soakingthe food for 5–10 min in a sulphite dip.
2.5.2. Syrup pre-treatment
Pre-treatment can be used to remove up to 50% of the water in fruit. The methodgives good retention of colour in the dried food and produces a sweeter, blandertasting product. However, acids are also removed from fruits during the process. Thelower acidity of the product may allow mould growth if the food is not properlydried and packaged.
Dried fruits and vegetables are usually packaged in one of many different typesof plastic film. The moisture contents at which selected foods are stable and thepackaging requirements for each group are shown in Table 4.
2.5.3. Extraction rates for dehydrated fruits and vegetables
The extraction rates for some dried vegetables are shown in Table 5. These areexpressed as input (of raw material)/output (of dried product) ratios and rangefrom 6.3 for sweet corn to 21.6 for tomato. Fruits can be dehydrated to moisturelevel below 5% (Lu et al., 1986). The dehydration levels of some fruits are asfollows: apple, 14–15%, prunes, 18% and bananas, 2.5%.
2.6. Fried products
Frying is mainly used for starchy fruits such as bananas. The heat during fryingdestroys enzymes and micro-organisms and if sufficient moisture is removed andthe product is packaged, it can have a shelf life of several weeks. The flow chartfor processing dried products is shown in Appendix 6.
Processing of Horticultural Crops in the Tropics 379
Table 4. Moisture contents at which selected foods are stable and packaging requirements for eachgroup.
Food Moisture content, % Degree of protection required
Fresh fruit & vegetables 75–85 Package to prevent moisture lossMarmalade 35Raisins 07 Non-hygroscopic: minimum protection
or no packaging requiredFruit sweets 03Potato crisps 01.5 Hygroscopic:– Package to prevent
moisture uptake
Source: Fellows (1997).

2.7. Preserves
2.7.1. Jams, jellies and marmalades
2.7.1.1. JamJam is a solid gel made from fruit pulp or juice from a single fruit pulp or from acombination of fruits. In mixed fruit jams, the first named fruit should be at least50% of the total fruit content. Sugar content is normally 68–72% and this will preventmould growth after opening the jar.
2.7.1.2. JelliesJellies are crystal clear jams that are produced using filtered juice instead of fruitpulp.
2.7.1.3. MarmaladesMarmalades are produced mainly from clear citrus juices (lime, orange, grapefruitand lemon) and have fine shreds of peel suspended in the gel. Fruit content shouldnot be less than 20% citrus fruit. The sugar content should be similar to that injam. The common faults encountered in making preserves are shown in Table 1.14,while the processes involved in making jams and jellies are shown in Table 1.13.
The correct combination of acid, sugar and pectin is needed to achieve the requiredgel structure and rapid boiling is necessary to remove water quickly, to concen-trate the mixture before it darkens and loses its ability to form a gel.
2.7.2. Pastes and purees
The most common types of pastes and purees are tomatoes and garlic, which arewidely used in cooking. They are made by carefully evaporating water to concen-trate the pulp, with constant stirring to prevent darkening or localised burning.
380 R. Madakadze et al.
Table 5. Input-output ratios for dehydrated vegetables.
Vegetable Input/output ratio
Beans 12.3Broccoli 13.1Cabbage 13.1Cauliflower 15.7Celery 17.3Courgette 15.7Egg plant 15.7Leek 10.7Onion 07.3Pepper 17.5Sweet corn 06.3Tomato 21.6
Source: EPZA Database.
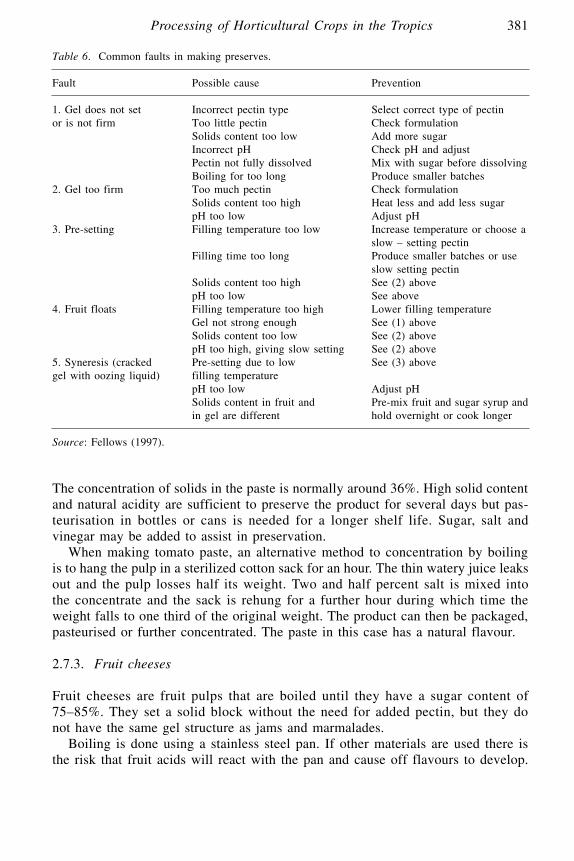
The concentration of solids in the paste is normally around 36%. High solid contentand natural acidity are sufficient to preserve the product for several days but pas-teurisation in bottles or cans is needed for a longer shelf life. Sugar, salt andvinegar may be added to assist in preservation.
When making tomato paste, an alternative method to concentration by boilingis to hang the pulp in a sterilized cotton sack for an hour. The thin watery juice leaksout and the pulp losses half its weight. Two and half percent salt is mixed intothe concentrate and the sack is rehung for a further hour during which time theweight falls to one third of the original weight. The product can then be packaged,pasteurised or further concentrated. The paste in this case has a natural flavour.
2.7.3. Fruit cheeses
Fruit cheeses are fruit pulps that are boiled until they have a sugar content of75–85%. They set a solid block without the need for added pectin, but they donot have the same gel structure as jams and marmalades.
Boiling is done using a stainless steel pan. If other materials are used there isthe risk that fruit acids will react with the pan and cause off flavours to develop.
Processing of Horticultural Crops in the Tropics 381
Table 6. Common faults in making preserves.
Fault Possible cause Prevention
1. Gel does not set Incorrect pectin type Select correct type of pectinor is not firm Too little pectin Check formulation
Solids content too low Add more sugarIncorrect pH Check pH and adjust Pectin not fully dissolved Mix with sugar before dissolvingBoiling for too long Produce smaller batches
2. Gel too firm Too much pectin Check formulationSolids content too high Heat less and add less sugarpH too low Adjust pH
3. Pre-setting Filling temperature too low Increase temperature or choose a slow – setting pectin
Filling time too long Produce smaller batches or use slow setting pectin
Solids content too high See (2) abovepH too low See above
4. Fruit floats Filling temperature too high Lower filling temperatureGel not strong enough See (1) aboveSolids content too low See (2) abovepH too high, giving slow setting See (2) above
5. Syneresis (cracked Pre-setting due to low See (3) abovegel with oozing liquid) filling temperature
pH too low Adjust pHSolids content in fruit and Pre-mix fruit and sugar syrup andin gel are different hold overnight or cook longer
Source: Fellows (1997).

At higher production rates, a steam jacketed pan is preferable because it givesmore even and faster heating.
Preserves should be hot filled into new or re-used glass jars which are then sealed.The temperature of filling should be around 85 °C. If it is too high, steam con-denses on the inside of the lid and water falls onto the surface of the preserve,diluting the sugar at the surface and causing mould growth. If temperature is toolow, the preserve thickens and is difficult to fill into containers. Filling can bedone using semi-automatic piston fillers. All jars should be filled to about 90%full, to assist in the formation of a partial vacuum in the space above the productas it cools.
2.8. Chutneys and pickles
2.8.1. Chutneys
Chutneys are thick, jam-like mixtures made from a variety of fruits and vegeta-bles, sugar, spices and, sometimes, vinegar. High sugar content has a preservativeeffect and vinegar addition may not always be necessary, depending on the naturalacidity and maturity of the fruits that are used.
Natural acids from the fruit, vinegar or those produced by fermentation, togetherwith the high sugar content, are used to preserve the chutney after a jar has beenopened. A preservative index can be used to calculate the amounts of ingredientsto be added. The preservative index is a measure of the preserving power of com-binations of acid and sugar, measured as total solids. This is used to assess whethera pickle is safe from food spoilage and food poisoning microorganisms. It can becalculated as follows:
(Total acidity × 100)/(100 – total solids). The value must not be less than 3.6%.
The process for making mango chutney is shown in Appendix 9.
2.8.2. Pickles
Pickles are used for vegetables such as cucumbers, cabbage and onions. The productsare fermented by lactic acid bacteria which can grow in low concentrations of salt.The bacteria ferment sugars in the food to form lactic acid, which then preventsthe growth of food poisoning bacteria and moulds or other spoilage microorganisms.The amount of added salt controls the type and rate of fermentation, for example,if 2.5–5% salt is used, different types of bacteria produce lactic acid but if up to16% salt is added, a salt stock pickle is produced which is preserved by salt andnot by fermentation. Some examples of the different types of fruit or vegetablepickles is shown in Table 7.
An additional measure to prevent pickle spoilage is to either pasteurise it oronly heat the sugar/salt/vinegar mixture, add it to the vegetables and fill the jarswhile the product is still hot. The hot product forms a part vacuum in the jar whenit cools and further aids preservation.
382 R. Madakadze et al.

The process of making pickles and equipment needs are shown in Table 8.
2.9. Sauces
Sauces are thick viscous liquids, made from pulped fruit and/or vegetables, withthe addition of salt, sugar, spices and vinegar. They are pasteurised to give therequired shelf life, but the basic principle of preservation is the use of vinegar, whichinhibits the growth of spoilage and food poisoning micro-organisms. The processis done using steam heated stainless steel double jacketed pans. The process formaking tomato sauce is shown in Appendix 10. A typical formulation per kg oftomatoes is 10-g sugar. Herbs and spices, such as 1 g each of cinnamon, ground
Processing of Horticultural Crops in the Tropics 383
Table 7. Examples of different types of fruit or vegetable pickles.
Product Salt Sugar Vinegar Process
Fermented sweet pickle 05%, then 3% 1–2%, then 3% 0, then 5% Fermented for 1–2 weeksthen repack in vinegar + salt + sugar (optional pasteurisation)
Fermented sour pickle 05%, then 3% Nil 0, then 5% Ferment for 1–2 weeks then repack in vinegar +salt (optional pasteurisation)
Unfermented pickle 03% 1% 5% Pack straight away and pasteurise
Salt – stock pickle 15% 0 0 Store until required then wash out salt and repack as unfermented pickle
Source: Fellows (1997).
Table 8. Examples of different types of fruit or vegetable pickles.
Product Salt Sugar Vinegar Process
Fermented sweet pickle 05%, then 3% 1–2%, then 3% 0, then 5% Fermented for 1–2 weeksthen repack in vinegar + salt + sugar (optional pasteurisation)
Fermented sour pickle 05%, then 3% nil 0, then 5% Ferment for 1–2 weeks then repack in vinegar + salt (optional pasteurisation)
Unfermented pickle 03% 1% 5% Pack straight away and pasteurise
Salt-stock pickle 15% 0 0 Store until required then wash out salt and repack as unfermented pickle
Source: Fellows (1997).

cloves, all spice, and cayenne pepper are placed into a tied muslin bag and this issubmerged in the pulp.
2.10. Pectin
Pectin is a component of nearly all fruits and vegetables and can be extracted andused in food processing to form the characteristic gel in jams and marmalade. Therichest sources of pectin are the peels of citrus fruits such as lime, lemon, orangeand passion fruit or the pulp of apple. The process for extracting pectin is shownin Appendix 11.
2.11. Freezing
Freezing can preserve many foods in a form as acceptable to the consumer as thefresh product. Freezing inhibits the agents responsible for spoilage at ordinarytemperatures from growing, without causing major alterations in appearance, odourand flavour of a particular commodity (Lu et al., 1975). It cannot, however, com-pletely preserve the quality as some deterioration will inevitably take place evenin freezer storage.
The products to be frozen raw or pre-cooked must be at least as good inquality as high grade products normally distributed fresh. The processes involvedin freezing preservation are usually mechanised and organised in such a waythat they succeed each other rapidly, with each process taking the shortestpossible time. Mechanical injuries, improper temperature during preparation,exposure to light and contamination with copper and iron should be avoided, as thesefactors can cause changes in colour, texture and flavour (Lu et al., 1986).
For vegetables or fruits that require blanching, rapid cooling is requiredimmediately after, in order to avoid overcooking and to prevent the growth of micro-organisms. In individually quick frozen foods such as peas, lima beans, sweet cornand diced carrots, freezing preceeds packaging.
Properly blanched, frozen and packaged commodities such as cauliflower, greenbeans, peas and spinach can be kept at –29 °C for five years without measurablechange in colour, flavour, chemical constituents and physical attributes.
The processes involved in freezing are shown in Appendix 13.
3. STORAGE LIFE
The storage life of canned, frozen, dehydrated and preserved fruits depends uponstorage temperature and type of product (Woodroof, 1986), Table 9. For frozen fruitsand juice fluctuation in temperature is undesirable and longer storage life is achievedat temperature of –10 to –20 °F. Dehydrated products are stable if protected fromwater, air, sunlight and contaminants.
384 R. Madakadze et al.

4. UTILITY REQUIREMENTS
For any of the described processing methods to run smoothly, there must be adequateutilities such as water and electricity. If there is no reticulated and treated water,then filtration and treatment may be necessary to remove impurities. Water for boilersfor blanching should be softened to prevent formation of scale. The water usedfor washing the plant and floors requires no treatment for hardiness, but it mustbe microbiologically and chemically clean. Water for cooling cans must be chlori-nated, while canning syrups must be free of chlorine.
Proper lighting is very important, especially for sorting of prepared fruits, inspec-tion and the operation of automatic can filling machines and sealers. Proper lightmeans adequate light of good quality, directed where it is needed, with good dif-fusion. The switches, control panels and outlets must be properly selected andinstalled so that they are safe for the workers in the plant.
The Cannery Illuminating Committee of the USA (Lu et al., 1986) recommendthe following intensities of illumination:
• 10 fc for receiving and dispatching;• 20 fc for preliminary sorting, washing raw materials, cutting and pitting, canning,
syruping, seaming and labeling;• 30 fc for the machine shop;• 200 fc for colour evaluation of food; and• 30–50 fc for the laboratory.
Processing of Horticultural Crops in the Tropics 385
Table 9. Storage life of canned, frozen, dehydrated and preserved fruits.
Type of product Critical storage Storage time Notestemperature
Canned fruits and juice –25–27 °C 1 year Order of breakdown in quality:flavour, colour, texture, nutritive loss
Frozen fruits and juice –17.8 °C +1 year Fluctuations in temperature undesirable. Longer storage if temperature is –10 to –20 °F.
Dried fruit and fruit powders –00 °C, RH 55% 1 year Dehydrated products stable only if protected from water, air, sunlight and contaminants.
Purees (avocado, guava) –17.8 °C 5 months to 1 year
Preserves (jams, jellies) any 2–4 years°C 7 years
Source: Woodroof (1986).

386 R. Madakadze et al.
AP
PE
ND
IX
App
endi
x 1.
P
roce
ss c
hart
for
fru
it j
uice
pro
duct
ion.
Sta
ge i
n pr
oces
s Q
uali
ty a
ssur
ance
Equ
ipm
ent
requ
ired
Not
eses
sent
ial
(opt
iona
l)
Har
vest
fru
itC
heck
for
ful
l m
atur
ity
Fru
its
shou
ld b
e m
atur
e of
ove
rrip
e, w
itho
ut
mou
ld g
row
th.
The
y sh
ould
be
pick
ed c
aref
ully
to
red
uce
brui
sing
.(W
ash)
Was
h ta
nkU
se c
lean
wat
er t
o re
mov
e di
rt.
Sor
t/gr
ade
Ess
enti
al t
o pr
oduc
e S
ort
by h
and
for
sim
ilar
col
our
or m
atur
ity
and
unif
orm
qua
lity
rem
ove
mou
ldy
frui
ts.
(Cut
/sli
ce/c
ore)
Pul
pK
nive
sD
epen
ds o
n w
heth
er p
ulpi
ng i
s do
ne m
echa
nica
lly
or b
y ha
nd.
Fil
ter
pulp
Che
ck f
or u
nifo
rm p
ulp
Coa
rse
clot
h fi
lter
Sie
ving
/fil
teri
ng is
nee
ded
if p
ulpi
ng is
don
e by
han
d.H
eat
Sta
inle
ss s
teel
boi
ling
P
aste
uriz
e at
88
°C f
or 1
0–15
min
utes
. T
o de
stro
y pa
n, h
eat
sour
ceen
zym
es a
nd m
icro
-org
anis
ms.
Fil
l &
Sea
l B
ottl
es/c
aps
Che
ck f
ill-
wei
ght
and
Bot
tled
and
cap
s st
eril
ized
by
boil
ing
for
at l
east
co
rrec
tly
seal
ed p
ack
10 m
inut
es.
Hea
tH
eat
sour
ce,
boil
ing
Alt
erna
tive
ly,
fill
jui
ce a
nd p
aste
uriz
e in
sea
led
wat
er-b
ath
bott
les
for
20 m
inut
es.
Coo
l, L
abel
& s
tore
Che
ck t
hat
labe
l an
d st
orag
eO
n ra
cks,
in
boxe
s w
ith
cool
dry
atm
osph
ere.
cond
itio
ns a
re c
orre
ct

Processing of Horticultural Crops in the Tropics 387
App
endi
x 2.
P
roce
ss c
hart
for
squ
ashe
s an
d co
rdia
ls.
Sta
ge i
n pr
oces
s es
sent
ial
Qua
lity
ass
uran
ceE
quip
men
t re
quir
edN
otes
Fru
it p
ulp
Fil
ter
pulp
Ens
ure
clot
h is
reg
ular
ly
Cou
rse
mus
lin
clot
h.
Fil
ter
thro
ugh
coar
se m
usli
n cl
oth
to o
btai
n ju
ice
clea
ned
and
ster
iliz
ed
Fin
e fi
lter
clo
th o
r an
d th
roug
h fi
ne c
loth
or
spec
ial
juic
e fi
lter
to
by b
oili
ngst
rain
erob
tain
cry
stal
cle
ar j
uice
for
cor
dial
s.H
eat
Che
ck t
empe
ratu
re a
nd
Sta
inle
ss s
teel
boi
ling
P
aste
uriz
atio
n de
stro
ys e
nzym
es a
nd m
icro
-org
anis
ms
tim
e of
hea
ting
pan,
hea
t so
urce
whi
ch p
rese
rves
the
pro
duct
.M
ix s
ugar
syr
upC
heck
syr
up c
once
ntra
tion
R
efra
ctom
eter
(op
tion
al).
Hea
t at
50%
sol
utio
n of
fil
tere
d su
gar
syru
p to
and
prop
orti
ons
of
Hea
t so
urce
s, b
oili
ng
90 °
C.
Mix
in
the
corr
ect
prop
orti
on w
ith
the
juic
e.sy
rup
and
juic
ew
ater
bat
h.F
ill
& S
eal
Bot
tles
Che
ck f
ill-
wei
ght
and
Fil
ter,
bot
tle
capp
erH
eat
mix
ture
qui
ckly
to
abov
e 70
°C
and
hot
fil
l in
to
corr
ectl
y se
aled
pac
kpr
este
rili
zed
bott
les.
Hea
ting
can
be
done
eit
her
befo
re
bott
ling
or
afte
r fi
llin
g w
ith
the
capp
ed b
ottl
es.
Hea
tS
tain
less
ste
el p
anM
ost
bott
led
squa
shes
or
cord
ials
sho
uld
be
heat
ed t
o 90
°C
for
15–
20 m
inut
es.
Coo
l, L
abel
and
sto
reC
heck
tha
t la
bel
and
stor
age
On
rack
s, i
n bo
xes
wit
h a
cool
dry
atm
osph
ere.
cond
itio
ns a
re c
orre
ct

388 R. Madakadze et al.
App
endi
x 3.
P
roce
ss c
hart
for
fru
it w
ine.
Sta
ges
in p
roce
ss e
ssen
tial
Q
uali
ty a
ssur
ance
Equ
ipm
ent
requ
ired
Not
es(o
ptio
nal)
Fru
it p
ulp
(fil
ter)
Coa
rse
mus
lin
clot
h.
Fil
ter
thro
ugh
coar
se m
usli
n cl
oth
to o
btai
n ju
ice.
Hea
tB
oili
ng p
an,
heat
sou
rce
Pas
teur
isat
ion
for
15 m
inut
es a
t 90
–100
°C
.M
ix s
ugar
and
yea
stC
heck
tha
t ye
ast
star
ter
Sca
les,
pan
Coo
l to
roo
m t
empe
ratu
re b
efor
e ad
ding
yea
st.
cult
ure
is a
live
Add
sug
ar (
20%
) an
d ye
ast
(3%
of
wei
ght
of
pulp
/sug
ar)
to j
uice
.F
erm
ent
Che
ck r
ate
of f
erm
enta
tion
, F
erm
enta
tion
ves
sel,
Use
eit
her
a st
arte
r cu
ltur
e of
yea
st o
r li
quor
ch
eck
for
mou
ld g
row
th
alco
hol
hydr
omet
erfr
om p
revi
ous
batc
h.an
d in
sect
con
tam
inat
ion
Fil
ter
and
pulp
Che
ck t
hat
win
e is
cle
arP
reve
nt a
ir f
rom
ent
erin
g th
e fe
rmen
tati
on v
esse
l by
th
e us
e of
an
air
lock
. T
he t
empe
ratu
re s
houl
d be
be
twee
n 20
–28
°C.
Fer
men
tati
on m
ay l
ast
for
5–21
day
s de
pend
ing
on t
he t
empe
ratu
re.
Thi
s li
quor
is
used
to
mak
e vi
nega
r an
d sp
irit
s.C
heck
alc
ohol
con
tent
Hyd
rom
eter
Cle
arC
heck
fil
l-w
eigh
t an
d C
lear
ing
agen
ts a
re n
eede
d fo
r so
me
frui
t w
ines
corr
ectl
y se
aled
pac
k.(e
.g.
gela
tine
, ta
nnin
, is
ingl
ass)
. D
ecan
t cl
eare
d w
ine
to r
elat
ed s
edim
ents
.S
tand
aris
eA
djus
t th
e al
coho
l co
nten
t to
tha
t de
clar
ed o
n th
e la
bel
by b
lend
ing
wit
h pr
evio
us b
atch
es o
r ad
ding
cle
an w
ater
.F
ill
& S
eal
Bot
tles
/cap
s C
heck
tha
t la
bel
and
stor
age
Fil
ler,
bot
tles
cap
per
Col
d fi
ll i
nto
pre-
ster
iliz
ed b
ottl
es a
nd f
it
or c
orks
cond
itio
ns a
re c
orre
ctst
eril
ized
cor
ks.
Sto
reS
tore
on
rack
s, i
n bo
xes
wit
h a
cool
dry
atm
osph
ere
away
fro
m s
unli
ght.

Processing of Horticultural Crops in the Tropics 389
App
endi
x 4.
P
roce
ss c
hart
for
vin
egar
.
Sta
ge i
n pr
oces
sQ
uali
ty a
ssur
ance
Equ
ipm
ent
requ
ired
Not
eses
sent
ial
opti
onal
Fer
men
ted
juic
e
Fil
ter
Coa
rse
mus
lin
clot
hF
ilte
r th
roug
h co
arse
mus
lin
clot
h to
obt
ain
juic
e.M
ix Ace
tic
acid
Bac
teri
aF
erm
ent
Che
ck r
ate
of f
erm
enta
tion
, F
erm
enta
tion
ves
sels
or
Spe
cial
des
ign
is n
eede
d to
ens
ure
air
circ
ulat
ion
chec
k fo
r m
ould
gro
wth
‘g
ener
ator
’. F
ilte
r cl
oth
in t
he f
erm
ente
r.an
d in
sect
con
tam
inat
ion
Fil
ter
Che
ck t
hat
prod
uct
is c
lear
Cle
arC
heck
ace
tic
acid
con
tent
Tit
rati
on e
quip
men
tS
tand
ardi
seA
djus
t th
e ac
etic
aci
d co
nten
t to
tha
t de
clar
ed o
n th
e la
bel.
Fil
l an
d S
eal
Che
ck f
ill-
wei
ght
and
Bot
tles
cap
sC
old
fill
int
o pr
este
rili
sed
bott
les.
corr
ectl
y se
aled
pac
kH
eat
Tim
e an
d te
mpe
ratu
re
Wat
er b
ath
Opt
iona
l pa
steu
riza
tion
for
5–1
0 m
inut
es a
t 60
°C
.of
hea
ting
Lab
el &
Sto
reC
heck
tha
t la
bel
& s
tora
ge
Sto
re o
n ra
cks,
in
boxe
s w
ith
a co
ol d
ry
cond
itio
ns a
re c
orre
ct.
atm
osph
ere.

390 R. Madakadze et al.
App
endi
x 5.
P
roce
ss c
hart
for
bot
tled
fru
its.
Sta
ge i
n pr
oces
s Q
uali
ty a
ssur
ance
Equ
ipm
ent
requ
ired
Not
eses
sent
ial
(opt
iona
l)
Har
vest
fru
itT
o re
mov
e co
ntam
inan
tsM
atur
e bu
t no
t ov
er-r
ipe
frui
ts a
nd v
eget
able
s ha
rves
ted
as c
aref
ully
as
poss
ible
to
redu
ce
brui
sing
etc
.W
ash
To
rem
ove
cont
amin
ants
Was
h ta
nks
Use
cle
an w
ater
to
rem
ove
ston
es,
leav
es,
pest
icid
e re
sidu
es o
r so
il.
Sor
t/gr
ade
Ess
enti
al t
o pr
oduc
e S
orti
ng t
able
Sor
t by
hand
to p
rodu
ce u
nifo
rm s
ized
pie
ces
of w
hole
un
ifor
m q
uali
ty p
rodu
cts
frui
ts a
nd v
eget
able
s ar
e us
ed a
nd u
nifo
rm c
olou
r or
mat
urit
y.P
eel
Che
ck t
hat
all
trac
es o
f K
nive
s, p
eele
rsU
sual
ly d
one
by u
sing
sha
rp s
tain
less
ste
el k
nive
s,
peel
are
rem
oved
but
peel
ing
mac
hine
s ar
e av
aila
ble
for
som
e ty
pes
of f
ruit
s.C
ut/s
lice
/cor
eC
heck
for
uni
form
K
nive
s, f
ruit
cho
pper
s,
To
redu
ce t
he s
ize
of p
iece
s th
at f
it i
nto
jars
and
si
zed
piec
escu
tter
s, s
lici
ng o
r al
low
fas
t he
at t
reat
men
t.di
cing
mac
hine
sA
cid
dip
Che
ck a
cid
conc
entr
atio
nW
eigh
ing
scal
es o
r D
ippi
ng i
n 2%
cit
ric,
lem
on o
r li
me
juic
e fo
r sc
oops
, he
ater
, fi
lter
5–
10 m
inut
es i
s so
met
imes
use
d to
pre
vent
ba
g, t
herm
omet
er,
brow
ning
of
ligh
t co
lour
ed f
ruit
s.(r
efac
tom
eter
opt
iona
l)M
ix s
ugar
syr
upC
heck
syr
up c
once
ntra
tion
H
ot h
ill
into
pre
-ste
rili
zed
hot
jars
wit
h 30
–50%
an
d te
mpe
ratu
resu
gar
syru
p, h
eate
d to
90
degr
ees
Cel
sius
and
fil
tere
d th
roug
h a
fine
mus
lin
bag.
Jar
s sh
ould
be
ster
iliz
ed
by h
eati
ng t
o bo
ilin
g in
wat
er f
or 1
0 m
inut
es.
Re-
used
jar
s sh
ould
be
care
full
y w
ashe
d.F
ill
and
Sea
l ja
rs
Che
ck f
or c
orre
ct f
ill
wei
ght
Hea
t ge
ntly
in
boil
ing
wat
er f
or 1
0–20
min
utes
, an
d li
dsan
d pr
oper
ly s
eale
d li
dde
pend
ing
on s
ize
of t
he j
ar.
Pas
teur
ize
Che
ck t
empe
ratu
re a
nd
Boi
ling
wat
er-b
ath
Coo
l to
roo
m t
empe
ratu
re i
n ai
r or
usi
ng a
C
ool
tim
e of
hea
ting
wat
er c
oole
r.L
abel
Che
ck l
abel
qua
lity
and
C
oole
r (o
ptio
nal)
by
Che
ck t
he c
orre
ct t
ype
of l
abel
is
used
and
tha
t S
tore
stor
age
cond
itio
nsha
nd o
r w
ith
labe
l th
ey a
re c
orre
ctly
ali
gned
. S
tore
in
cool
dry
pla
ce
appl
icat
or.
By
hand
aw
ay f
rom
sun
ligh
t.or
wit
h la
bel
appl
icat
or.
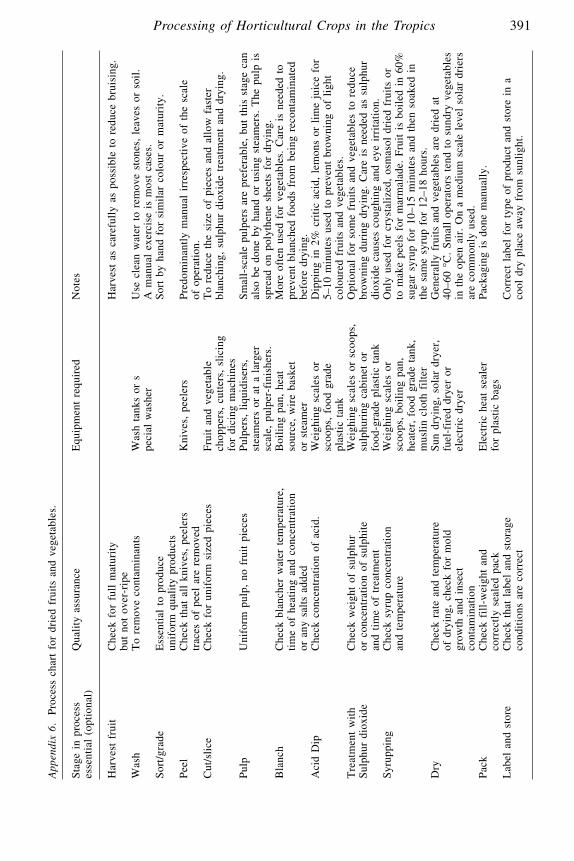
Processing of Horticultural Crops in the Tropics 391
App
endi
x 6.
P
roce
ss c
hart
for
dri
ed f
ruit
s an
d ve
geta
bles
.
Sta
ge i
n pr
oces
s Q
uali
ty a
ssur
ance
Equ
ipm
ent
requ
ired
Not
eses
sent
ial
(opt
iona
l)
Har
vest
fru
itC
heck
for
ful
l m
atur
ity
Har
vest
as
care
full
y as
pos
sibl
e to
red
uce
brui
sing
.bu
t no
t ov
er-r
ipe
Was
hT
o re
mov
e co
ntam
inan
tsW
ash
tank
s or
sU
se c
lean
wat
er t
o re
mov
e st
ones
, le
aves
or
soil
. pe
cial
was
her
A m
anua
l ex
erci
se i
s m
ost
case
s.S
ort/
grad
eE
ssen
tial
to
prod
uce
Sor
t by
han
d fo
r si
mil
ar c
olou
r or
mat
urit
y.
unif
orm
qua
lity
pro
duct
sP
eel
Che
ck t
hat
all
kniv
es,
peel
ers
Kni
ves,
pee
lers
Pre
dom
inan
tly
man
ual
irre
spec
tive
of
the
scal
e tr
aces
of
peel
are
rem
oved
of o
pera
tion
. C
ut/s
lice
Che
ck f
or u
nifo
rm s
ized
pie
ces
Fru
it a
nd v
eget
able
T
o re
duce
the
siz
e of
pie
ces
and
allo
w f
aste
r ch
oppe
rs,
cutt
ers,
sli
cing
bl
anch
ing,
sul
phur
dio
xide
tre
atm
ent
and
dryi
ng.
for
dici
ng m
achi
nes
Pul
pU
nifo
rm p
ulp,
no
frui
t pi
eces
Pul
pers
, li
quid
iser
s,
Sm
all-
scal
e pu
lper
s ar
e pr
efer
able
, bu
t th
is s
tage
can
st
eam
ers
or a
t a
larg
er
also
be
done
by
hand
or
usin
g st
eam
ers.
The
pul
p is
sc
ale,
pul
per-
fini
sher
s.sp
read
on
poly
then
e sh
eets
for
dry
ing.
Bla
nch
Che
ck b
lanc
her
wat
er t
empe
ratu
re,
Boi
ling
pan
, he
at
Mor
e of
ten
used
for
veg
etab
les.
Car
e is
nee
ded
to
tim
e of
hea
ting
and
con
cent
rati
on
sour
ce,
wir
e ba
sket
pr
even
t bl
anch
ed f
oods
fro
m b
eing
rec
onta
min
ated
or a
ny s
alts
add
edor
ste
amer
befo
re d
ryin
g.A
cid
Dip
Che
ck c
once
ntra
tion
of
acid
.W
eigh
ing
scal
es o
r D
ippi
ng i
n 2%
cri
tic
acid
, le
mon
s or
lim
e ju
ice
for
scoo
ps,
food
gra
de
5–10
min
utes
use
d to
pre
vent
bro
wni
ng o
f li
ght
plas
tic
tank
colo
ured
fru
its
and
vege
tabl
es.
Tre
atm
ent
wit
h C
heck
wei
ght
of s
ulph
ur
Wei
ghin
g sc
ales
or
scoo
ps,
Opt
iona
l fo
r so
me
frui
ts a
nd v
eget
able
s to
red
uce
Sul
phur
dio
xide
or c
once
ntra
tion
of
sulp
hite
su
lphu
ring
cab
inet
or
brow
ning
dur
ing
dryi
ng.
Car
e is
nee
ded
as s
ulph
ur
and
tim
e of
tre
atm
ent
food
-gra
de p
last
ic t
ank
diox
ide
caus
es c
ough
ing
and
eye
irri
tati
on.
Syr
uppi
ngC
heck
syr
up c
once
ntra
tion
W
eigh
ing
scal
es o
r O
nly
used
for
cry
stal
ized
, os
mas
ol d
ried
fru
its
or
and
tem
pera
ture
scoo
ps,
boil
ing
pan,
to
mak
e pe
els
for
mar
mal
ade.
Fru
it i
s bo
iled
in
60%
he
ater
, fo
od g
rade
tan
k,
suga
r sy
rup
for
10–1
5 m
inut
es a
nd t
hen
soak
ed i
n m
usli
n cl
oth
filt
erth
e sa
me
syru
p fo
r 12
–18
hour
s.D
ryC
heck
rat
e an
d te
mpe
ratu
re
Sun
dry
ing,
sol
ar d
ryer
, G
ener
ally
fru
its
and
vege
tabl
es a
re d
ried
at
of d
ryin
g, c
heck
for
mol
dfu
el-f
ired
dry
er o
r 40
–60
°C.
Sm
all
oper
ator
s te
nd t
o su
ndry
veg
etab
les
grow
th a
nd i
nsec
t el
ectr
ic d
ryer
in t
he o
pen
air.
On
a m
ediu
m s
cale
lev
el s
olar
dri
ers
cont
amin
atio
nar
e co
mm
only
use
d.P
ack
Che
ck f
ill-
wei
ght
and
Ele
ctri
c he
at s
eale
r P
acka
ging
is
done
man
uall
y.
corr
ectl
y se
aled
pac
kfo
r pl
asti
c ba
gsL
abel
and
sto
reC
heck
tha
t la
bel
and
stor
age
Cor
rect
lab
el f
or t
ype
of p
rodu
ct a
nd s
tore
in
aco
ndit
ions
are
cor
rect
cool
dry
pla
ce a
way
fro
m s
unli
ght.

392 R. Madakadze et al.
App
endi
x 7.
P
roce
ss C
hart
for
pro
duct
ion
of f
ried
fru
its.
Sta
ge i
n pr
oces
sQ
uali
ty a
ssur
ance
Equ
ipm
ent
requ
ired
Not
eses
sent
ial
opti
onal
Fru
itS
elec
t fr
uit
that
is
slig
htly
und
er-r
ipe
and
havi
ng a
fi
rm t
extu
re.
Pee
lK
nife
Man
ual
oper
atio
n.S
lice
Thi
ckne
ss o
f sl
ices
Sli
cer
A t
hinn
er,
mor
e un
ifor
m p
rodu
ct i
s ac
hiev
ed
usin
g m
anua
l or
ele
ctri
c sl
icin
g m
achi
nes.
Was
hT
o se
para
te s
lice
sW
ash
tank
Cit
ric
acid
or
sodi
um m
etab
isul
phit
e ca
n be
add
ed
to t
he w
ash
wat
er t
o be
tter
ret
ain
the
colo
ur o
f th
e fr
uit
and
prev
ent
dark
enin
g.(D
ry)
Fry
To
corr
ect
colo
ur
Hea
t so
urce
pan
or
Car
e is
nee
ded
whe
n ad
ding
fru
it t
o ho
t oi
l ch
eck
oil
qual
ity
deep
fat
fry
er(a
t 18
0–20
0 de
gree
s C
elsi
us)
to p
reve
nt s
plas
hing
. H
eat
for
5–10
min
utes
unt
il a
l un
ifor
m c
olou
r is
pro
duce
d.D
rain
/coo
lR
acks
or
mes
hC
ool
to p
reve
nt c
onde
nsat
ion
insi
de t
he p
acka
ge.
Pac
kC
heck
tha
t th
e se
al
Hea
t se
aler
Ens
ure
that
the
sea
l is
com
plet
e be
caus
e th
e pr
oduc
t is
ade
quat
esh
elf
life
is
subs
tant
iall
y re
duce
d if
air
or
moi
stur
e en
ter
thro
ugh
a po
orly
for
med
sea
l.S
tore
Sto
re a
way
fro
m h
eat
and
sunl
ight
to
avoi
d ra
ncid
ity.

Processing of Horticultural Crops in the Tropics 393
App
endi
x 8.
P
roce
ss c
hart
for
jam
s, j
elli
es a
nd m
arm
alad
es.
Sta
ge i
n pp
roce
ssQ
uali
ty a
ssur
ance
Equ
ipm
ent
requ
ired
Not
eses
sent
ial
opti
onal
Fru
it p
ulp
Fil
ter
pulp
Che
ck c
lari
ty o
f ju
ice
Coa
rse
mus
lin
clot
hF
ilte
r th
roug
h co
arse
mus
lin
clot
h to
obt
ain
juic
e.(F
ilte
r)F
ine
filt
er c
loth
, F
ilte
r th
roug
h fi
ne c
loth
to
obta
ined
cry
stal
-cle
ar
juic
e fi
lter
sju
ice
for
jell
ies
or m
arm
alad
e.P
eel,
mix
Che
ck t
hick
ness
of
peel
s an
d co
ncen
trat
ion
of s
yrup
Het
Boi
ling
pan
, he
at
For
mar
mal
ades
, th
inly
sli
ced
citr
us p
eels
are
so
urce
, sc
ales
(pH
boil
ed i
n 60
% s
ugar
syr
up f
or 5
min
utes
met
er o
ptio
nall
y)an
d st
ored
for
at
leas
t 24
hou
rs b
efor
e us
e.M
ixC
heck
am
ount
s of
S
cale
s, s
coop
sA
pre
serv
ativ
e, s
uch
as 0
.8%
sod
ium
ben
zoat
e S
ugar
Aci
d P
ecti
nin
gred
ient
sca
n be
add
ed f
or l
onge
r st
orag
e. A
dd e
qual
wei
ght
of s
ugar
to p
ulp
and
adju
st w
ith
citr
ic a
cid
(if
requ
ired
) to
obt
ain
pH 3
.0–3
.3.
For
som
e fr
uits
, ad
d pe
ctin
at
2%
.B
oili
ngC
heck
tem
pera
ture
s an
d S
tain
less
ste
el b
oili
ng
Boi
l qu
ickl
y w
ith
cons
tant
sti
rrin
g to
pre
vent
bur
ning
ti
me
of b
oili
ngpa
n, r
efra
ctom
eter
, un
til
soli
d co
nten
t re
ache
s 68
–70%
.he
at s
ourc
esF
ill
& S
eal
Che
ck f
ill
wei
ghts
Fil
ler,
cap
per
Coo
l &
Sto
reO
n ra
cks,
in
boxe
s w
ith
a co
ol d
ry a
tmos
pher
e.

394 R. Madakadze et al.
App
endi
x 9.
P
roce
ss c
hart
for
chu
tney
(e.
g. m
ango
chu
tney
).
Sta
ge i
n pr
oces
sQ
uali
ty a
ssur
ance
Equ
ipm
ent
requ
ired
Not
eses
sent
ial
opti
onal
Har
vest
fru
itC
heck
for
ful
l m
atur
ity
Pic
ked
care
full
y to
red
uce
brui
sing
.bu
t no
t ov
er-r
ipe
Was
hW
ash
tank
Use
cle
an w
ater
.S
ort/
grad
eE
ssen
tial
to
prod
uce
Sor
t by
han
d to
get
sim
ilar
col
our
or m
atur
ity.
unif
orm
qua
lity
pro
duct
sP
eel
Che
ck t
hat
all
trac
ts o
f K
nive
s, p
eele
rsM
ost
frui
ts r
equi
re p
eeli
ng,
but
som
e ch
utne
y,
peel
are
rem
oved
incl
ude
unpe
eled
fru
its.
Cut
/sli
ceC
heck
for
uni
form
K
nive
s, s
lice
r, d
icer
sM
ost
frui
ts a
re c
ut i
nto
smal
l st
rips
. C
utti
ng a
lso
size
d pi
eces
allo
ws
fast
er p
enet
rati
on o
f su
gar.
Mix
Spi
ces
Vin
egar
Mix
ing
bow
l, sc
ales
For
eac
h 50
0 g
of m
ango
, sp
ices
suc
h as
gin
ger
(0.5
g),
ust
ard
(0.5
g),
chi
llin
g (1
g)
are
was
hed,
gr
ound
and
mix
ed w
ith
vine
gar
(250
ml)
and
sug
ar
(300
–500
g).
In
som
e re
cipe
s, 7
% o
il i
s ad
ded.
Boi
ling
Che
ck t
ime
and
Hea
t so
urce
s, b
oili
ng
Boi
l un
til
suff
icie
ntly
thi
ck a
nd c
once
ntra
ted.
tem
pera
ture
pan,
(ref
ract
omet
er o
ptio
n)F
erm
ent
Che
ck t
empe
ratu
re a
nd
Cov
ered
pan
sN
atur
al f
erm
enta
tion
ove
r 2–
3 da
ys p
rodu
ces
acid
s in
sect
sto
ass
ist
pres
erva
tion
.F
ill
& S
eal
Jars
/lid
sC
heck
fil
l-w
eigh
t an
d F
unne
l or
pas
ter
Hot
fil
l in
to p
re-s
teri
lize
d ja
rs a
nd h
and
seal
lid
s co
rrec
tly
seal
ed p
ack
fill
er,
scal
esse
e te
xt f
or a
lter
nati
ves.
Coo
l, L
abel
& S
tore
Che
ck l
abel
& s
tora
ge
In b
oxes
on
rack
, w
ith
a co
ol d
ry a
tmos
pher
e.co
ndit
ions
.

Processing of Horticultural Crops in the Tropics 395
App
endi
x 10
. P
roce
ss c
hart
for
tom
ato
sauc
e.
Sta
ge i
n pr
oces
sQ
uali
ty a
ssur
ance
Equ
ipm
ent
requ
ired
Not
eses
sent
ial
(opt
iona
l)
Har
vest
fru
itC
heck
for
ful
l m
atur
ity
Mat
ure
but
not
over
-rip
e fr
uit
(of
the
‘plu
m’
tom
ato
vari
ety)
are
pic
ked
care
full
y an
d tr
ansp
orte
d in
st
acka
ble
boxe
s to
avo
id c
rush
ing.
(was
h)W
ash
tank
Use
cle
an w
ater
to
rem
ove
dust
, le
aves
, pe
stic
ide
resi
dues
, et
c.S
ort
Ess
enti
al t
o pr
oduc
e S
ort
by h
and
for
sim
ilar
col
our,
dis
card
und
er-r
ipe,
un
ifor
m q
uali
ty p
rodu
cts
mou
ly o
r di
scol
oure
d fr
uits
.H
eat/
peal
Che
ck t
empe
ratu
re a
nd
Boi
ling
pan
, w
ire
Tom
atoe
s ar
e pl
aced
int
o a
wir
e ba
sket
and
hea
ted
tim
e fo
r he
atin
gba
sket
(pu
lpie
r-fi
nish
er
in b
oili
ng w
ater
for
10
min
utes
. T
hey
are
then
op
tion
al)
rem
oved
and
pee
led
by h
and.
Alt
erna
tive
, us
e a
pul
pier
fin
ishe
rF
ilte
rC
heck
for
uni
form
Mes
h sc
reen
Cho
p fi
nely
by
hand
if
heat
pee
led.
Mes
h sc
reen
not
ne
eded
if
pulp
ier
fini
sher
use
d.P
ulp
or c
hop
Che
ck a
ll s
eeds
rem
oved
Mix
spi
ces
suga
r, v
ineg
ar s
alt
Che
ck c
orre
ct
Wei
ghin
g sc
ales
or
form
ulat
ion
used
scoo
ps,
mus
lin
bags
Hea
tC
heck
tim
e an
d B
oili
ng p
an,
heat
T
he m
ixtu
re is
hea
ted
to 8
0–90
°C
unt
il th
ink,
usu
ally
te
mpe
ratu
reso
urce
, sc
ales
or
wit
hin
20 m
inut
es.
Vin
egar
is
adde
d to
war
ds t
he e
ndsc
oops
, re
frac
tom
eter
.of
the
boi
ling
to
redu
ce t
he a
mou
nt o
f ac
etic
aci
d th
at i
s lo
st b
y ev
apor
atio
n.F
ill
& s
eal
bott
les
and
caps
Che
ck f
ill-
eigh
t an
d F
unne
l pr
pas
te
Hot
fil
l in
to r
ep-s
teri
lize
d bo
ttle
s an
d ha
nd s
eal
corr
ectl
y se
aled
pac
kfi
ler,
sca
les
lids
– s
ee t
ext
for
alte
rnat
ives
.H
eat
Che
ck t
ime
and
Sta
inle
ss s
teel
P
aste
uriz
e at
88o
c fo
r 20
–30
min
utes
. D
epen
ding
te
mpe
ratu
re o
f he
atin
gbo
ilin
g pa
non
the
siz
e of
the
bot
tle
Coo
l. L
abel
& S
tore
Che
ck l
abel
In b
oxes
on
rack
s, i
n a
cool
dry
atm
osph
ere,
aw
ay f
rom
sun
ligh
t.

396 R. Madakadze et al.
App
endi
x 11
. P
roce
ss c
hart
for
pec
tin
extr
acti
on.
Sta
ge i
n pr
ogre
ss
Qua
lity
ass
uran
ceE
quip
men
t re
quir
edN
otes
esse
ntia
l (o
ptio
nal)
Fru
itN
o sp
ecia
l ch
ecks
, U
nder
-rip
e fr
uit
has
a gr
eat
amou
nt o
f pe
ctin
bu
t m
ould
y fr
uit
shou
ld
than
ove
r-ri
pe f
ruit
.be
dis
card
ed(W
ash)
Was
h ta
nkT
o re
mov
e pe
stic
ides
res
idue
s, l
eave
s, e
tc.
Pee
lK
nive
sR
emov
e ci
trus
pee
ls a
nd u
se f
or e
xtra
ctio
n.
Oth
er f
ruit
s ar
e no
t pe
eled
.C
utC
heck
tha
t pi
eces
are
K
nive
s, s
lice
rsP
eels
are
cut
int
o th
in s
lice
s (e
.g.
1 cm
wid
e) a
nd
smal
l an
d un
ifor
mot
her
frui
ts a
re c
oars
ely
chop
ped
Mix
wat
erA
dd w
ater
– a
ppro
xim
atel
y ti
mes
the
wei
ght
of f
ruit
.H
eat
Che
ck t
he t
empe
ratu
re
Boi
ling
pan
, H
eat
gent
ly t
o si
mm
erin
g an
d ho
ld a
t th
at
and
tim
e of
hea
ting
heat
sou
rce
tem
pera
ture
of
–30
min
utes
Con
cent
rate
Lon
ger
heat
ing
rem
oves
mor
e w
ater
and
con
cent
rate
s th
e pe
ctin
so
that
it
can
be s
tore
d fo
r a
few
day
s.
How
ever
, ov
er-l
ong
heat
ing
degr
ades
the
pec
tin
and
it l
oses
som
e of
its
sel
ling
pow
er.
Use
in
jam
m
akin
g pr
oces
s
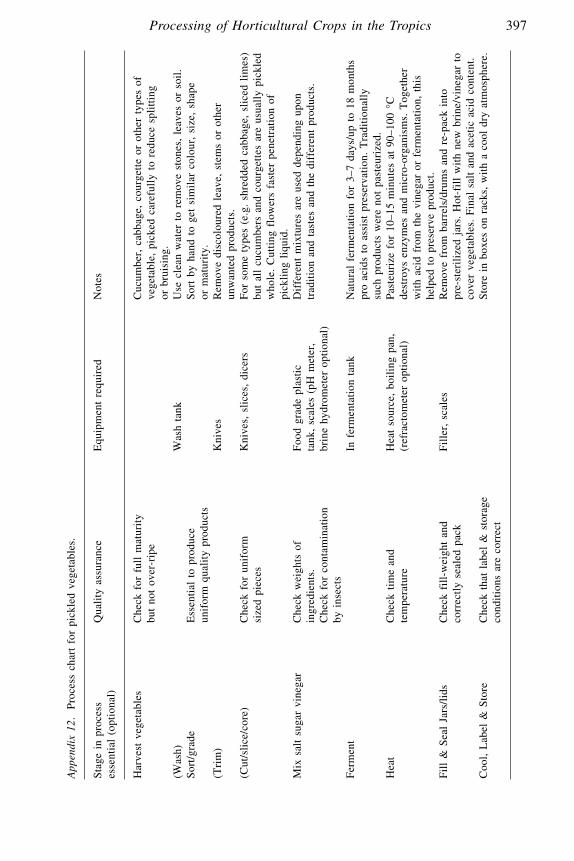
Processing of Horticultural Crops in the Tropics 397
App
endi
x 12
. P
roce
ss c
hart
for
pic
kled
veg
etab
les.
Sta
ge i
n pr
oces
sQ
uali
ty a
ssur
ance
Equ
ipm
ent
requ
ired
N
otes
esse
ntia
l (o
ptio
nal)
Har
vest
veg
etab
les
Che
ck f
or f
ull
mat
urit
y C
ucum
ber,
cab
bage
, co
urge
tte
or o
ther
typ
es o
f bu
t no
t ov
er-r
ipe
vege
tabl
e, p
icke
d ca
refu
lly
to r
educ
e sp
litt
ing
or b
ruis
ing.
(Was
h)W
ash
tank
Use
cle
an w
ater
to
rem
ove
ston
es,
leav
es o
r so
il.
Sor
t/gr
ade
Ess
enti
al t
o pr
oduc
e S
ort
by h
and
to g
et s
imil
ar c
olou
r, s
ize,
sha
pe
unif
orm
qua
lity
pro
duct
sor
mat
urit
y.(T
rim
)K
nive
sR
emov
e di
scol
oure
d le
ave,
ste
ms
or o
ther
un
wan
ted
prod
ucts
.(C
ut/s
lice
/cor
e)C
heck
for
uni
form
K
nive
s, s
lice
s, d
icer
sF
or s
ome
type
s (e
.g.
shre
dded
cab
bage
, sl
iced
lim
es)
size
d pi
eces
but
all
cucu
mbe
rs a
nd c
ourg
ette
s ar
e us
uall
y pi
ckle
d w
hole
. C
utti
ng f
low
ers
fast
er p
enet
rati
on o
f pi
ckli
ng l
iqui
d.M
ix s
alt
suga
r vi
nega
rC
heck
wei
ghts
of
Foo
d gr
ade
plas
tic
Dif
fere
nt m
ixtu
res
are
used
dep
endi
ng u
pon
ingr
edie
nts.
tank
, sc
ales
(pH
met
er,
trad
itio
n an
d ta
stes
and
the
dif
fere
nt p
rodu
cts.
Che
ck f
or c
onta
min
atio
nbr
ine
hydr
omet
er o
ptio
nal)
by i
nsec
tsF
erm
ent
In f
erm
enta
tion
tan
kN
atur
al f
erm
enta
tion
for
3–7
day
s/up
to
18 m
onth
s pr
o ac
ids
to a
ssis
t pr
eser
vati
on.
Tra
diti
onal
lysu
ch p
rodu
cts
wer
e no
t pa
steu
rize
d.H
eat
Che
ck t
ime
and
Hea
t so
urce
, bo
ilin
g pa
n,
Pas
teur
ize
for
10–1
5 m
inut
es a
t 90
–100
°C
tem
pera
ture
(ref
ract
omet
er o
ptio
nal)
dest
roys
enz
ymes
and
mic
ro-o
rgan
ism
s. T
oget
her
wit
h ac
id f
rom
the
vin
egar
or
ferm
enta
tion
, th
ishe
lped
to
pres
erve
pro
duct
.F
ill
& S
eal
Jars
/lid
sC
heck
fil
l-w
eigh
t an
d F
ille
r, s
cale
sR
emov
e fr
om b
arre
ls/d
rum
s an
d re
-pac
k in
to
corr
ectl
y se
aled
pac
kpr
e-st
eril
ized
jar
s. H
ot-f
ill
wit
h ne
w b
rine
/vin
egar
to
cove
r ve
geta
bles
. F
inal
sal
t an
d ac
etic
aci
d co
nten
t.C
ool,
Lab
el &
Sto
reC
heck
tha
t la
bel
& s
tora
ge
Sto
re i
n bo
xes
on r
acks
, w
ith
a co
ol d
ry a
tmos
pher
e.co
ndit
ions
are
cor
rect

398 R. Madakadze et al.
App
endi
x 13
. P
roce
ss c
hart
for
fre
ezin
g pr
oduc
e.
Sta
ge i
n pr
oces
sQ
uali
ty a
ssur
ance
Equ
ipm
ent
requ
ired
Not
eses
sent
ial
(opt
iona
l)
Har
vest
fru
itM
atur
e bu
t no
t ov
er-r
ipe
frui
ts a
nd v
eget
able
s,
harv
este
d as
car
eful
ly a
s po
ssib
le t
o re
duce
br
uisi
ng a
nd d
amag
e.(c
ool)
To
rem
ove
fiel
d he
atC
old
wat
er o
r fr
eezi
ng w
ater
dip
s in
the
fie
ld
Was
hT
o re
mov
e co
ntam
inan
tsW
ash
tank
sU
se c
lean
wat
er t
o re
mov
e st
ones
, le
aves
, pe
stic
ides
res
idue
s or
soi
l.S
ort/
grad
eE
ssen
tial
to
prod
uce
Sor
ting
tab
leS
ort
by h
and
to p
rodu
ce u
nifo
rm s
ized
pie
ces
if
unif
orm
qua
lity
pro
duct
sw
hole
fru
its
and
vege
tabl
es a
re u
sed
and
unif
orm
co
lour
and
mat
urit
y.P
eel
Che
ck t
hat
all
trac
es o
f K
nive
s, p
eele
rsU
sual
ly d
one
by u
sing
a s
harp
sta
inle
ss s
teel
kni
ves,
pe
el a
re r
emov
edbu
t sm
all
peel
ing
mac
hine
s ar
e av
aila
ble
for
som
e ty
pes
of f
ruit
s.
Cut
/sli
ce/c
ore
Che
ck f
or u
nifo
rm
size
d pi
eces
Bla
nch
Che
ck t
empe
ratu
re a
nd
Boi
lers
tim
e of
hea
ting
Fre
eze
Che
ck t
empe
ratu
re a
nd
Air
bla
st f
reez
ers
or
Tem
pera
ture
s of
–23
to
–37
°C a
re u
sed
to
tim
e of
fre
ezin
gpl
ate
free
zers
for
ef
fect
ivel
y fr
eeze
the
pro
duce
as
quic
kly
as
alre
ady
pack
aged
foo
dspo
ssib
le.
Pac
kage
and
lab
elC
heck
lab
el q
uali
tyB
y ha
nd o
r w
ith
Che
ck t
hat
corr
ect
type
of
labe
l is
use
d an
d th
at
labe
l ap
plic
ator
they
are
cor
rect
ly a
lign
ed.
Sto
re i
n fr
eeze
r.S
tore
Che
ck s
tora
ge c
ondi
tion
sP
acka
ge m
ater
ial
shou
ld b
e ab
le t
o w
iths
tand
the
st
ress
es o
f fi
llin
g, f
reez
ing,
sto
rage
, tr
ansp
ort
and
thaw
ing.
REFERENCES
Dauthy (1995). Fruit and Vegetable Processing. Agricultural Services Bulletin, No 119.Department of Agricultural, Technical and Extension Services (Agritex) (1998). IDC-value added
horticulture project.Fellows, P. (1997). Guidelines for Smallscale Fruit and Vegetable Processors. FAO Agricultural Services
Bulletin 127.Kader, A. A. (1992). Postharvest biology and technology: An overview. In A. A. Kader (ed.), Postharvest
technology of horticultural crops, second edition. Div. Agri.Nat. Res. Publ. 3311. Univ. Calif.Berkeley. CA, pp. 15–20.
Leonard, S. (1980). Tomato juice and tomato juice blends. In P. E. Nelson and D. E. Tressler (eds.),Fruit and vegetable juice processing technology. AVI Publishing Company, pp. 548–572.
Lu, B. S., B. Feinberg and J. J. Meehan (1975). Freezing preservation of vegetables. In B. S. Luand J. G. Woodroof (eds.), Commercial vegetable processing. AVI Publishing Company, pp.317–360.
Lu, B. S., C. E. Kean and J. G. Woodroof (1986). Canning of fruits. In J. G. Woodroof and B. S.Luh (eds.), Commercial fruit processing. AVI Publishing Company, pp. 161–260.
Masanganise, P. (1994). Developing a Marketing Strategy for Smallscale Fresh Fruit and VegetableProducers in Zimbabwe. Wye College Press, 25 pp.
Nelson, P. E. and D. K. Tressler (1980). Fruit and Vegetable Juice Processing Technology. AVIPublishing Company. pp. 573–596.
Richter, J., A. Basler and H. Franzen (eds.) (1996). Smallscale Food Processing contributing to FoodSecurity. Proceedings of the International Workshop held from 4 to 8 September 1995 in Bonn-Röttgen, Germany.
Tembo, E. (1996). Postharvest handling of horticultural crops by smallholder farmers: Present statusand prospects. In D. V. Chiuswa and C. Rukuni (eds.), Agricultural engineering technology uti-lization. Proceedings of the Second Zimbabwe Society of Agricultural Engineers Conference,University of Zimbabwe, Harare.
Woodroof J. G. (1975). Washing, blanching, peeling and preparation. In B. S. Lu and J. G. Woodroof(eds.), Commercial vegetable processing. AVI Publishing Company, pp. 176–194.
Woodroof, J. G. (1986). Storage life of canned, frozen, dehydrated and preserved fruits. In J. G.Woodroof and B. S. Luh (eds.), Commercial fruit processing. AVI Publishing Company, pp. 581–610.
Processing of Horticultural Crops in the Tropics 399

QUALITY DYNAMICS AND QUALITY ASSURANCE OFFRESH FRUITS AND VEGETABLES IN PRE- ANDPOSTHARVEST
SUSANNE HUYSKENS-KEILHumboldt-University Berlin, Institute for Horticultural Sciences, Section Quality Dynamics/Postharvest Physiology, Lentzeallee 75, D-14195 Berlin, Germany
MONIKA SCHREINERInstitute of Vegetable and Ornamental Crops Großbeeren/Erfurt e.V., Theodor-Echtermeyer-Weg 1,D-14979 Großbeeren, Germany
1. INTRODUCTION
In the past years the view of product quality has changed drastically. The aggra-vation of competition and surplus production of many horticultural crops as wellas the rising awareness of environmental, nutritional and health concerns of thesociety have led to an alteration process in the purchasing behaviour of consumersincreasingly demanding only highest quality standard products. Therefore, thedemand for developing a new and comprehensive evaluation procedure of productquality, specifically for those designated for the fresh market has shifted more andmore in the centre of attention. Marketing strategies (e.g. labelling, quality man-agement systems) are developing to face these consumer requirements and toimprove the competitiveness on the European and international trade markets.
A comprehensive understanding of the quality dynamics is an essential featurefor an integrated evaluation of product quality where several factors have to beconsidered: (a) the dynamics of consumer requirements (b) the criteria used forquality evaluation and (c) the dynamics of product quality changes in preharvest andpostharvest.
At present, quality classification and evaluation of fresh fruits and vegetablesis conducted according to criteria of the official quality grades and standards likethose of the European Community (UN/ECE) or the USDA standards which arebased on the Codex alimentarius of the Food and Agriculture Organization of theUnited Nations (FAO) and the World Health Organization (WHO) (Bickelmann,1993; Kader, 2002). These quality standards serve as an objective quality measurefor the market value of economically important fresh horticultural commoditiesfor the national and international trade. However, in these official standards productquality is almost exclusively determined by the subjective assessment of mainlyvisual, external product attributes directed primarily to technological concerns oftrade. Therefore, intrinsic product properties such as chemical composition whichreflect the increasing consumer requirements concerning environmental, healthand sensory benefits are not considered (Lennernäs et al., 1997; Pecher and vanOppen, 2000).
Due to the strong impact of the consumer on food quality reglementations new
R. Dris and S. M. Jain (eds.), Production Practices and Quality Assessment of Food Crops,
© 2004 Kluwer Academic Publishers. Printed in the Netherlands.
401
Vol. 3, “Quality Handling and Evaluation”, pp. 401–449.

laws and regulations were established by the European and US governments toreduce undesirable and toxic product attributes and to meet consumers requests (e.g.laws and orders concerning restricted application of pesticides and additives, HACCPstrategy, novel food). Moreover recently, other product attributes like health pro-moting bioactive compounds in horticultural crops (e.g. glucosinolates, polyphenols,carotenoids, and dietary fibres) have shifted into the centre of attention (Thompson,1993; Schreiner et al., 2000), and led to the development of a new image of hor-ticultural product quality, being supported by e.g. the German Cancer Society andthe US program ‘5 a day for better health’.
However, besides the intrinsic product properties, the consumer also evaluate foodquality according to extrinsic factors (e.g. prize, market situation, personal prefer-ences) (Scharf und Schubert, 1996), and thus determine acceptability coveringproduct, consumer and market aspects at the same time (Tijskens, 2000). Hereby,apart from the intrinsic and extrinsic parameters quality is also determined by thedifferent target groups (breeder, producer, wholesale, retail market, consumer, foodindustry), a step forward from product orientation to consumer orientation(Huyskens, 1996; Shewfelt, 2000). In this respect, consumer orientation also meansthe consideration of the process within the production-marketing chain in producing,maintaining and assuring the desired product quality. This had led to the estab-lishment of total quality management systems (TQM) in horticulture (DIN EN 45000ff.), indicating a process from quality control to quality assurance to quality man-agement (Shewfelt, 2000). The introduction of quality management systems in theproduction-marketing chain requests (a) the analysis and specification of thedynamics in customer requirements, (b) the determination and interaction of char-acteristic internal and external attributes of products and (c) the determination oftheir dynamics during production and postharvest in order to develop new integratedmethods and technologies for a comprehensive and continuous evaluation, moni-toring and assurance of product quality.
2. QUALITY OF FRUITS AND VEGETABLES
2.1. Definition of product quality
Quality is a term frequently used but rarely defined (Shewfelt, 1999). The termquality is defined as any of the features that make something what it is, or the degreeof excellence or superiority (Webster, 1968). Schuphan (1961) has defined qualityas the sum of all subjective and objective parameters of a product comprising externalproperties, nutritional quality and processing quality. However, the word ‘quality’is used in various ways for fresh fruits and vegetables such as market quality,utilization quality, sensory quality, nutritional quality, ecological quality, externaland internal quality, shipping quality (Huyskens, 1996; Kader, 2002). Most ofthese various terms are used in different ways to define and describe quality itemsof a product (Shewfelt and Tijskens, 2000), however, they often mean different thingsto different customer groups (Figure 1).
According to Kader (2001) quality is a combination of attributes, properties or
402 S. Huyskens-Keil and M. Schreiner
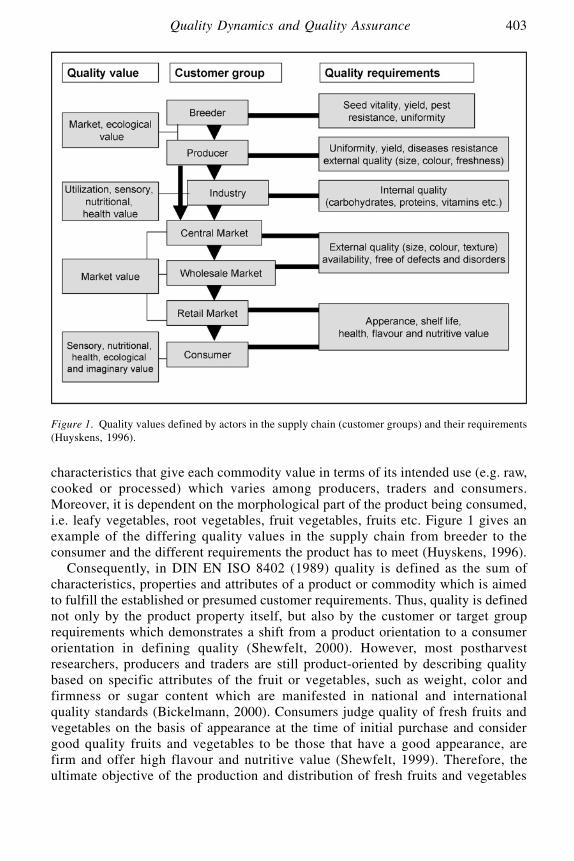
characteristics that give each commodity value in terms of its intended use (e.g. raw,cooked or processed) which varies among producers, traders and consumers.Moreover, it is dependent on the morphological part of the product being consumed,i.e. leafy vegetables, root vegetables, fruit vegetables, fruits etc. Figure 1 gives anexample of the differing quality values in the supply chain from breeder to theconsumer and the different requirements the product has to meet (Huyskens, 1996).
Consequently, in DIN EN ISO 8402 (1989) quality is defined as the sum ofcharacteristics, properties and attributes of a product or commodity which is aimedto fulfill the established or presumed customer requirements. Thus, quality is definednot only by the product property itself, but also by the customer or target grouprequirements which demonstrates a shift from a product orientation to a consumerorientation in defining quality (Shewfelt, 2000). However, most postharvestresearchers, producers and traders are still product-oriented by describing qualitybased on specific attributes of the fruit or vegetables, such as weight, color andfirmness or sugar content which are manifested in national and internationalquality standards (Bickelmann, 2000). Consumers judge quality of fresh fruits andvegetables on the basis of appearance at the time of initial purchase and considergood quality fruits and vegetables to be those that have a good appearance, arefirm and offer high flavour and nutritive value (Shewfelt, 1999). Therefore, theultimate objective of the production and distribution of fresh fruits and vegetables
Quality Dynamics and Quality Assurance 403
Figure 1. Quality values defined by actors in the supply chain (customer groups) and their requirements(Huyskens, 1996).

is to satisfy consumers, demonstrating that consumer satisfaction is related to productquality. An understanding of the different perspectives of different participants withinthe distribution chain – including consumer behaviour, consumer needs and expec-tations – will be essential to improve the evaluation the quality, and thus theproduction and awareness of consumer-oriented quality in supply chains.
However, it is obvious that no single product attribute can meet all the require-ments indicated, being not a fixed value but a process, product and time-dependentvalue, and that there is a strong need for one integrated concept of product qualitythroughout any specific supply chain (Jongen, 2000). There are different attemptsand approaches for integrated concepts described in the literature combining onone hand quality attributes to a quality index (see also chapter 3) and on the otherhand combining consumer and market research, product behaviour and qualitymonitor into one theory on product quality (Prussia, 2000; Tijskens, 2000).
2.2. Consumer requirements
Depending on the expectations of the customer groups handling with fruits andvegetables – like breeder, producer, wholesale, retail market, food industry andconsumer – their requirements on fruit and vegetables quality are specific andoften contradictory (Huyskens, 1996). Regarding the customer orientation of thetotal quality management these various customer requirements have to be fulfilledby fruits and vegetables. However, consumer requirements must be one bench-mark for food quality (Lawless, 1995).
In response to consumer demand there is an increased requirement on internalproduct quality. A pan-EU consumer survey of over 14.000 persons revealed, thatfor 38% of the consumers the flavour is the main decision criterion for purchasingfood, for 32% of the consumers the healthy aspect of food (Lennernäs et al., 1997).Current trend analyses in the consumer behaviour showed, that the health aspecthas an additional value for fruits and vegetables and will gain more importance(Litzenroth, 1995; Forsa, 1997). Functional foods which are characterized by highercontents of health-promoting compounds are estimated to have a market potentialof 500 Mrd. US $ on the European and US market (Brower, 1998). This tendencyis manifested by the increasing supply of functional food in developed countries(Groenevelt, 1998; Wiedow, 1999).
Consumer surveys in Berlin (Germany) showed that freshness, low pesticideresidues and high flavour stand at the highest priority in purchasing vegetables(Brückner et al., 1998). Freshness is a quality characteristic summarizing manyproduct attributes, so that it is also considered as the most important purchasedecision criterion in Atlanta (USA). Furthermore, ‘freedom of defects’ was alsofound to be essential for the US consumers, however distinct national differencesin ranking of sensory attributes in vegetables were widespread. While the Berlinconsumers preferred good flavour of vegetables even when the products showeddefects, vegetables with bruises and blemishes were not accepted by the US con-sumers in Atlanta (Brückner et al., 1998). Thus, the prior-ranking requirements ofGerman consumers focus on the flavour of fruits and vegetables, exemplarily shownin carrots (Schonhof et al., 1997), radishes (Widell et al., 1998) and pepino fruits
404 S. Huyskens-Keil and M. Schreiner

(Huyskens-Keil et al., 2000a). Moreover, US consumers preferred in mangoes andpeaches textural characterics over flavour attributes (Malundo, 1996).
Besides the intrinsic product attributes, the extrinsic factors influence the pur-chasing behaviour of the consumers and thus reflecting the quality requirementsof the consumers (Scharf and Schubert, 1996). One of these extrinsic factor is thepurchase of regional fruit and vegetable products indicating on the one hand regionalpolitical motives for the preservation of regional workplaces (Werder Frucht, 1995;Wirthgen et al., 1999). On the other hand many consumers combine a guaranteedproduct quality with regional fruits and vegetables. Moreover, these regional productsare frequently cheaper than supraregional offers and the price becomes the decisivepurchase criterion (Wirthgen et al., 1999).
Consumer requirements and with that the purchasing behaviour of the con-sumers can be also determined by attitudes and believes as it was shown exemplarilyby genetically modified products. It has been recognized that prejudices, based partlyon an insufficient information level of the consumers, play a key role in consumeracceptance of genetic modified food. Consequently, effective communication strate-gies have to be developed to enable the consumer to make an informed decisionabout consumption or rejection of genetically modified products (Robinson, 1997;Frewer et al., 1998).
The sustainable production is another extrinsic factors which might fulfil theecological requirements of the consumers. Market analyses demonstrate thataccording to the consumers the sustainable production has a considerable imageprofit in comparison with conventional production (Springer, 1998).
According to Ophuis and van Trijip (1996) the extrinsic factors like brand,origin and production process are also demanded by the consumer as indicators offruit and vegetable quality. However, the consumer has no opportunity to assessintrinsic attributes as flavour or texture directly before purchase and thus theconsumer cannot check whether these requirements are satisfied. Therefore, externalattributes like colour are used by the consumer as indicator for internal character-istics. Colour of fresh fruits and vegetables considerably influences acceptanceand purchase behaviour of consumers and has mainly to fulfil the consumer require-ments (Gorini and Testoni, 1990; Clydesdale et al., 1992; Kays, 1999).
In summary, there is no single, universal consumer type, but consumers canhave quite various requirements on one and the same product. Quite variousconsumer segments exists, e.g. for tomatoes (Brückner, 2000), radishes (Widell etal., 1998) and broccoli (Schonhof et al., 1998). Producer, food industry and trademust adapt themselves to the various consumer requirements, if they want to remaincompetitive in future.
2.3. Characteristics for quality determination in pre- and postharvest
At the time of harvest and during postharvest handling, quality of horticulturalproducts is determined by the criteria established in official quality standards likethose of the UN/ECE standards (Bickelmann, 2001). However, these criteria arealmost exclusively determined by the subjective assessment of external productattributes such as color, size, weight, and whole, firm, clean, fresh in appearance,
Quality Dynamics and Quality Assurance 405
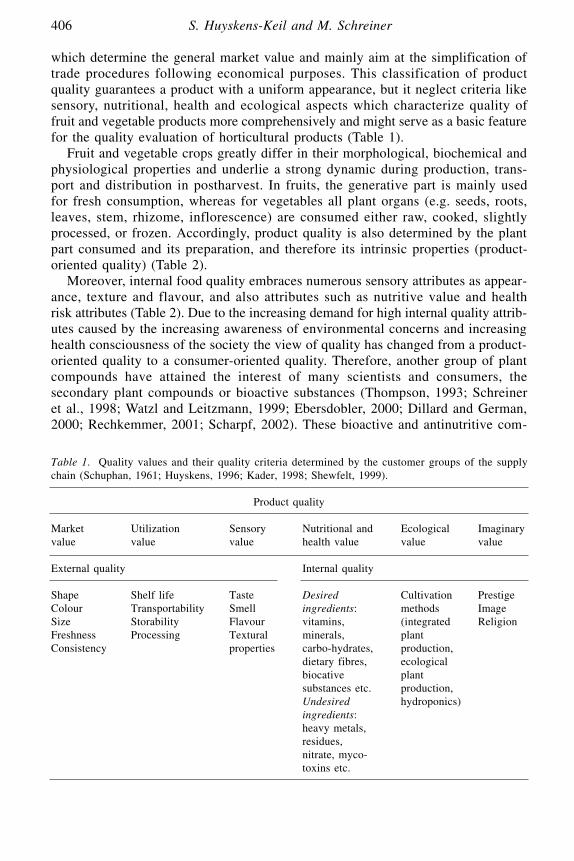
which determine the general market value and mainly aim at the simplification oftrade procedures following economical purposes. This classification of productquality guarantees a product with a uniform appearance, but it neglect criteria likesensory, nutritional, health and ecological aspects which characterize quality offruit and vegetable products more comprehensively and might serve as a basic featurefor the quality evaluation of horticultural products (Table 1).
Fruit and vegetable crops greatly differ in their morphological, biochemical andphysiological properties and underlie a strong dynamic during production, trans-port and distribution in postharvest. In fruits, the generative part is mainly usedfor fresh consumption, whereas for vegetables all plant organs (e.g. seeds, roots,leaves, stem, rhizome, inflorescence) are consumed either raw, cooked, slightlyprocessed, or frozen. Accordingly, product quality is also determined by the plantpart consumed and its preparation, and therefore its intrinsic properties (product-oriented quality) (Table 2).
Moreover, internal food quality embraces numerous sensory attributes as appear-ance, texture and flavour, and also attributes such as nutritive value and healthrisk attributes (Table 2). Due to the increasing demand for high internal quality attrib-utes caused by the increasing awareness of environmental concerns and increasinghealth consciousness of the society the view of quality has changed from a product-oriented quality to a consumer-oriented quality. Therefore, another group of plantcompounds have attained the interest of many scientists and consumers, thesecondary plant compounds or bioactive substances (Thompson, 1993; Schreineret al., 1998; Watzl and Leitzmann, 1999; Ebersdobler, 2000; Dillard and German,2000; Rechkemmer, 2001; Scharpf, 2002). These bioactive and antinutritive com-
406 S. Huyskens-Keil and M. Schreiner
Table 1. Quality values and their quality criteria determined by the customer groups of the supplychain (Schuphan, 1961; Huyskens, 1996; Kader, 1998; Shewfelt, 1999).
Product quality
Market Utilization Sensory Nutritional and Ecological Imaginary value value value health value value value
External quality Internal quality
Shape Shelf life Taste Desired Cultivation PrestigeColour Transportability Smell ingredients: methods ImageSize Storability Flavour vitamins, (integrated ReligionFreshness Processing Textural minerals, plant Consistency properties carbo-hydrates, production,
dietary fibres, ecological biocative plant substances etc. production,Undesired hydroponics)ingredients:heavy metals, residues,nitrate, myco-toxins etc.

pounds are discussed to have health-promoting and disease preventing effects, interms of prevention of chronic disorders, cancer, heart and circulatory diseases, whichnow play a key role in human nutrition (Hirayama, 1990; Block et al., 1992; Howeet al., 1992). Fruits and vegetables contain various bioactive substances (Table 1)playing a multifunctional role in plant metabolism. For example, colour pigmentsas carotenoids and anthocyanins revealed an antioxidativ potential, whereas theglucosinolates which are resonsible for the flavour attributes of vegetables of thefamily Brassicaceae are known for its anticancerogenic and antimicrobiological effect(McDanell et al., 1988; Zhang et al., 1992; Musk and Johnson, 1993; Fahey etal., 1997). Consumer surveys in Europe showed already that 32% of the consumerspreferably buy food according to health aspects (Lennernäs et al., 1997).
Many product specific characteristics of fresh fruits and vegetables have beenused in attempting to provide an adequate estimate of the optimum stage of maturityat the time of harvest and at the time of quality control during postharvest.Physiological processes (ethylene evolution and CO2 production) and changes inquality attributes determine the stage of maturity of a crop. However, physiolog-ical maturity is described as ‘the stage of development when a plant or plant partwill continue ontogeny even if detached’, whereas commercial maturity is definedas ‘the stage of development when a plant or plant part possesses the prerequi-
Quality Dynamics and Quality Assurance 407
Table 2. Quality components of fresh fruits and vegetables (Reid, 2002).
Main factors Components
Appearance Size: dimensions, weight, volumeShape: diameter/depth, ratio, smoothness, compactness, uniformityColour: uniformity, intensityGloss: nature of surface waxDefects: external, internal, morpho1ogical, physical and mechanical, physiological, entomological
Texture Firmness, hardness, softness, elasticityCrispnessSucculence, juicinessMealiness, grittinessToughness, fibrousnesses
Flavour SweetnessSourness (acidity)AstringencyBitternessAroma (volatile compounds)Off-flavours and off-odours
Nutritive value Carbohydrates (including dietary fibres)ProteinsLipidsVitaminsMinerals
Safety Naturally occurring toxicantsContaminants (chemical residues, heavy metals)MycotoxinsMicrobial contamination

sites for utilization by customers for a particular purpose (Watada et al., 1987).Still, quality of fruits and vegetables is mainly determined by the criteria establishedin official quality standards, although the characteristics and indices for estimatingthe stage of development and maturity (Table 3) often differ.
This index should be preferably objective (a measurement) rather than subjec-tive (an evaluation) and must consistently relate to the characteristic product qualityand postharvest life of the commodity (Reid, 2002). However, the search for anobjective and satisfactory maturity index is still in progress. At present, most ofthe maturity indices comprise of one up to three product attributes (see also chapter3). However, considering only single product attributes is not sufficient to com-prehensively describe the overall quality of horticultural crops as there is a dynamicinteraction of all attributes and intercorrelations with other values. Therefore, productquality should be assessed by a combination of several characteristic, sensoric andinternal comprising quality attributes (Huyskens, 1996; Schreiner und Huyskens-Keil, 1998). Moreover, an integral quality value has to be developed by summarizing
408 S. Huyskens-Keil and M. Schreiner
Table 3. Maturity indices for selected fruit and vegetable products (according to Wills et al., 1998;Reid, 2002).
Harvest index Product
Elapsed days from full bloom to harvest Apples, pearsMean heat units during development Peas, apples, sweet cornDevelopment of abscission layer Some melon cultivars, applesSurface morphology and structure Cuticle formation of grapes, tomatoes
Netting of some melonsGloss of some fruits (development of wax)
Size All fruits and many vegetablesSpecific gravity Cherries, watermelons, potatoesShape Angularity of banana fingers
Full cheeks of mangoes and applesCompactness of broccoli and cauliflower
Solidity Lettuce, cabbage, brussels sprouts
Textural properties
Firmness Apples, pears, stone fruits Tenderness Peas
Colour; external All fruits and most vegetablesInternal colour and structure Formation of jellylike material in tomato fruits
Flesh colour of some fruits
Compositional factors
Starch content Apples, pearsSugar content Apples, pears, stone fruits, grapesAcid content, sugar/acid ratio Pomegranates, citrus, papaya, melons, kiwifruitJuice content Citrus fruitsOil content AvocadosAstringency (tannin content) Persimmons, datesInternal ethylene concentration Apples, pears

specific external and internal product attributes, and to ascertaining their relativeimportance for the consumer.
Molnar (1995) developed a model for the overall characterization of food qualitywhich outlined that quality of food products should be in conformity with consumerrequirements and acceptance, and is determined by sensory attributes, chemical com-positions, physical properties, microbiological and toxicological contaminants, andconvenience aspects, e.g. shelf-life, packaging and processing. Schreiner et al. (2000)considered four groups of product attributes for an integrated quality value: sensoryattributes, bioactive substances, essential nutritive compounds and undesired attrib-utes (Table 1). The attributes within each group were then summarized and weighedaccording to the requirements of the different customer groups (consumer, whole-sale, retail and industry). With these attempts, it is possible to characterize andevaluate product quality not as a fixed value, but as a product, customer and timeoriented value which will meet the changing needs and interests in a more flexibleway. In a further step the applicability for the prediction of product quality in posthar-vest has to be investigated in more detail.
3. METHODS OF QUALITY DETERMINATION AND QUALITY EVALUATION
The determination of quality-related, consumer oriented and product specific attrib-utes is essential for the estimation of the appropriate maturity stage at harvest onone hand and on the other hand for controlling and inspection of the productquality during transport, handling and distribution processes. A wide range ofmethods are known to determine quality of horticultural commodities in terms ofchemical constituents, nutritive values, sensory attributes and physical properties(Monnot, 1990; Abbott, 1999; Kader, 2002). This chapter is aimed to present anoverview of common and recently developed new methods. For detailed informa-tion on these methods (target of the method, physical-chemical principle, equipmentsused and practical applications) actual references are cited.
Quality evaluation methods can be destructive or non-destructive. They includeobjective scales based on instrumental reading and subjective methods, based onhuman judgments, using hedonic scales. In Table 4 an overview of the most commonmethods for the determination of chemical compounds and physical properties offruits and vegetables is presented.
Visual evaluation of quality characteristics by an expert judge is still a widelyused and accepted technique, specifically for quality control in postharvest.Numerical scale for specific attributes are available for various commodities rangingfrom 0–10 points (Shewfelt, 1993). However, scoring is subject to the variabilityby the expert judge.
Chemical analysis of fruit and vegetable composition is used to estimate nutri-tional and consumption quality. Fresh fruits and vegetables play a very significantrole in human nutrition, especially as sources of vitamins (vitamin C, vitamin A,vitamin B, thiamine, niacin), minerals and dietary fibre (Kader, 2002). Therefore,the most commonly measured nutrients in fresh fruits and vegetables are ascorbic
Quality Dynamics and Quality Assurance 409

acid and β-carotene (Herrmann, 1998; Eitenmiller, 1990) being frequently used asa quality indicator. However, nutrient composition varies widely in fresh harvestedcommodities because of genetics, preharvest factors (soil, climate conditions duringgrowth, cultural practices etc.), maturity at harvest, and postharvest handling con-ditions (transport and storage duration, temperature, relative humdity, gaseousatmosphere, postharvest treatments). Therefore, the contents of nutritionally valuablecompounds are not reliable indicators of quality (Eitenmiller, 1990).
Grubben (1987) made an attempt to assess the overall nutritive value of a cropby calculating the ‘Average nutritive value’ (AVN) of 100 g of edible portion asfollows:
protein(g) Ca(mg) Fe(mg)ANV(100gedibleportion) = –––––––––– + fiber(g) + –––––––– + –––––––
5 100 2
vitaminC(mg)+ carotene(mg) + ––––––––––––––
40
410 S. Huyskens-Keil and M. Schreiner
Table 4. Methods of quality determination (Olmo et al., 2000; Reid, 2002).
Index Methods of determination Subjec- Objec- Destruc- Non-destruc-tive tive tive tive
Compositional factors
Starch KI test, other chemical tests X XSugar Hand refractometer, chemical tests X X
sensory panels X X XAcidity Titration, other chemical tests X XJuice Extraction, chemical tests X XOil Extraction, chemical tests X XTannin Ferric chloride test X XInternal ethylene Gaschromatography X X XVolatiles Gaschromatography X X X
Physical characteristics
Size Sizing rings, calipers, weight XSurface struture Visual X XShape Dimensions, ratio charts X X XAbscission layer Visual, force of separation X X XSpecific Use of density gradient solutions, Xgravity flotation techniques, vol/wtColour, Visual colour charts X Xexternal light reflectance X XColour, Light transmittance, delayed X Xinternal light emission
Visual examination X X
Textural properties
Firmness Firmness testers, deformation X X XTenderness Tenderometer X XTougness Texturometer, fibro meter X X
(also: chemical methods for determination of polysaccharides)

The AVN can be used to rank vegetables according to these nutrients beingconsidered important, the yield per unit area and efficiency of production on an area-time basis as shown in Table 5.
Many of the specific quality attributes which determine whether fruits andvegetables appealing to the consumer are closely related to the internal composi-tion. Such attributes include sweetness, flavour, acidity, adstringency, consistencyand colour. For example consumer perception of sweetness is related to the contentof sugar and this is related to the percentage of soluble solids which is measuredby refractometer (°Brix), while sugar composition can be determined by HPLC tech-niques (Spanos and Wrolstad, 1987; Kader, 2002). Moreover, sugars and acidstend to be related to flavour impacts (Jones and Scott, 1983). Flavour is formedby a combination of the taste sensations (sweet, sour, bitter, salty) and volatilecompounds being responsible for the distinctive aromas (Schieberle and Engel,1999). Many fruits and vegetables contain only a single volatile compound, knownas the flavour determining compound, while other products have about 200 to 300character impact compounds being responsible for the product specific flavourattribute (Jellineck, 1985). Gaschromatography in combination with mass spec-troscopy is one of the most frequently used technique for the detection of thesearoma compounds (Krumbein and Auerswald, 1999).
Attempts to provide a better determination and prediction of the stage of matu-ration and thus of quality at the time of harvest the relationship between singleproduct characteristics have been used as a quality index, e.g. relationship betweendry weight and oil content of avocado (Lee et al., 1983), sugar/acid ratio and ripeningstages of apples and tomatoes (Stevens et al., 1979; Kader, 1999), °Brix and maturitystage in kiwi fruits (Bickelmann, 2001; Reid, 2002) and the calculation of an index
Quality Dynamics and Quality Assurance 411
Table 5. Potential yield of average nutritive value (ANV) for several types of vegetables (Grubben,1978).
Vegetable Yield (MT/ha) ANV/ ANV Vegetation organs 100 g (m2) period
Harvest Edible edible portion portion portion
Fruit vegetables
Tomato 45 42.3 2.39 101 160Egg plant 25 24.0 2.14 051 200Sweet pepper 30 26.1 6.61 173 130Cucumber 50 40.0 1.69 068 150Watermelon 40 25.2 0.90 023 120
Leaf vegetables
Lettuce 20 14.8 5.35 079 090White cabbage 40 34.0 3.52 120 050
Bulbs, tubers, roots
Onion 40 38.4 2.05 079 150Carrot 20 16.6 6.48 108 090Turnip 13 10.3 2.03 021 080

(Streiff-Index, DeJagger-Index, Perlim-Index, Thiault-Value) comprising of °Brix,starch index and firmness for various apple cultivars (Winter et al., 1992; DeJagger and Roelofs, 1996; Eccher-Zerbi et al., 1996; Höhn et al., 1996; Johnsonand Luton, 1996). However, as changes in the complex chemical composition varygreatly during development and maturation of fruits and vegetables, most of thesingle compounds failed to be useful for a reliable and satisfactory determinationand prediction of maturity and product quality; also due to the fact that they usuallyrequire destructive sampling and complex chemical analysis (Reid, 2002).
Another possibility for the indirect evaluation of sensory attributes is to useconsumer panels who judge and measure combined sensory characteristics (sweet-ness, sourness, astringency, bitterness, overall flavor intensity) of a commodity.Additionally, laboratory panels (descriptive panels) are used in order to detect anddescribe sensory differences among samples; determine which volatile compoundsare organoleptically important in a commodity, indicating quality preferences.
Besides the chemical and sensory components many physical features are usedto assess product quality, such as color attributes (Gorini and Testoni, 1990;Clydesdale et al., 1992; Delwiche et al., 1993; Shewfelt, 1993; Berger-Schunn, 1994;Kays, 1999) and textural properties (Fekete, 1994; Fekete and Felföldi, 1994; Lesageand Destain, 1996; Sams, 1999) as well as size, shape and surface characteristics(e.g. Kays, 1991; Reid, 2002). Table 6 gives an overview of different methodsused for determining physical and chemical compounds related to sensory attributes.
Recently, specific non-destructive quality inspection techniques using sensors areattracting attention. These methods are often preferred in research and commer-cial places because they reduce variations in judgment among individuals and canprovide a common language among researchers, industry and consumers. Instrumentscan approximate human judgments by imitating the way people test the productor by measuring fundamental properties and combining those mathematically tocategorize the quality (Abbott, 1999). In these methods, energy is applied to a productand the relationship between the input energy and the output energy affected bythe product is examined (Kawano, 1999). These results are compared with tradi-tional chemical analysis in order to test whether the non-destructive data obtainedare related to the stage of maturity and to product quality. Studies on the applica-tion of non-destructive methods for fruits and vegetables started in 1970 in Japan,where the main issue was the determination of surface colour by visible light(Kawano, 1999). Thereafter, numerous investigations on technologies for non-destructive quality measurement were conducted and are summarized in Stroshineet al. (1993), Abbott et al. (1997) and Kawano (1999). There are on one handelectromagnetic technologies using optical properties for measuring colour, appear-ance and some internal compounds (e.g. Martinsen and Schaare, 1998; Schaareand Fraser, 2000; McGlone et al., 2002; Zerbini et al., 2002), applying chloro-phyll fluorescence for the measurement of maturity or mechanical or climate relateddisorders like chilling injury (e.g. Magnussen and Weichmann, 1995), or using X-ray and magnetic resonance for the detection of physiological disorders (e.g.Strohshine et al., 1993; Muramatsu et al., 1999). On the other hand mechanical tech-nologies are applied to describe textural properties which are described in detailby Fekete (1994), Abbott et al. (1997) and Nielson et al. (1998).
412 S. Huyskens-Keil and M. Schreiner

The concentration of aromatic and non-aromatic volatiles within fruits andvegetables (ethylene, acetaldehyde, ethanol etc.) can be detected by electrochem-ical technologies, for example by electronic sniffer concepts which are describedin detail by e.g. Abbott (1999). Selected non-destructive methods used for measuringquality attributes of fruits and vegetables are presented in Table 7.
Quality Dynamics and Quality Assurance 413
Table 6. Instrumental, physical and chemical measurements of sensory quality of fruits andvegetables (according to Kader, 2002).
Methods Characteristic Sensory reactions
Appearance
Tristimulus calorimeters Psychophysical values Spectral (colors attributes):(X, Y, Z; L, a, B.) Lighness
HUE (red, blue, etc.) Saturation (chroma)
Spectrophotometers: Radiant energy (reflection, Defects (internal X-radiation transmission, absorption, color) Visual flavorUltraviolet (UV) scattering of light)Visual light Near-infrared (NIR) etc.Chemical measurements Pigments Geometric attributes Goniophotometers Directional reflection, Gloss, sheen
transmission of light Visual texturePhysical measurements Size, shape, etc. External attributes
Flavor
Chromatography Volatiles Sweetness Mass spectrometry Sugars Bitterness Chemical measurements Organic acids Fruity flavour
Earty flavoursOff-Flavours
Texture
Force measuring: Resistance to compression, Mechanical attributes: Punkture shearing, cutting, etc. HardnessComression-extrusion CrispnessShearCrushingBending, snappingDistance measuring: Resistance to penetration Geometric attributs:Deformation Resonance frequencyAcoustic spectrometer JuicinessMultiple measuring (e.g., Several variables Compactnessinstron texturometers)Miscellaneous techniques Optical principles
Aerodynamic principles Electrical principles Radiographic principles
Physical-chemical measurement Alcohol-insoluble solids Water-related attributes:Starch content JuicenessFiber content Mealiness Moisture content

However, automatic classification of fresh products (grading and sorting accordingto size, colour, firmness and by using NIR) by machine vision poses problems asthey mainly measure single product attributes. Therefore, successful classificationmust be based on multiple sensors that can measure various fruit and vegetablefeatures (Peleg, 1993)
In conclusion, chemists and biochemists determine individual compounds suchas pigments, sugars, acids, vitamins or enzyme activity and gene expression, whereasengineers and postharvest physiologists trace changes in quality characteristicssuch as colour, texture, flavour volatiles, disorders with engineers particularly con-cerned with accuracy and precision of results and kinetic modelling of the data(Shewfelt, 2000). Sensory specialists measure and quantify changes in specificdescriptive values, whereas consumer panels are used to assess the general accept-ability which express acceptance on a hedonic scale (9 points) (Peryam and Pilgrim,1957; Schrödter, 1993) or on a 100-point basis (Moskowitz, 1994) according to DINISO 10950. Nowadays, stepless hedonic scales are preferably used for better reflec-tion of panel evaluations. Up to now there is still the need not only to quantify
414 S. Huyskens-Keil and M. Schreiner
Table 7. Examples of non-destructive methods for the quality determination of fruits and vegetables.
Non-destructive methods Product Quality attributes References
Near-Infrared- Fruits Sugar, Acids Stroshine et al., 1993; Spectroscopy (NIR) Bellon-Maurel et al., 1995;
Purwadaria et al., 1995Starchy plants Amylose, protein Flamme and Jansen, 1999;
and starch Haase et al., 1999Near magnetic Fruits Sugar, oil content, Stroshine et al., 1993; resonance (NMR) starch, water Tollner et al., 1993Chlorophyll fluorescence Cucumber Chilling injury Magnussen and
Weichmann, 1999Acoustic Resonance Fruits and Textural properties, Stroshine et al., 1993;frequency vegetables internal disorders Tollner et al., 1993;
(e.g. melon) Schotte et al., 1999 Headspace-Analysis Vegetables Aroma volatiles Ulrich and Hoberg,
1999; Krumbein and Auerswald, 1998
Water status, Fruits and Freshness Oshita et al., 1995; transpiration behaviour vegetables Jobling, 1997; Geyer
et al., 1999; Herppich and Mempel, 1999
Respiration Fruits and Maturity, Kays, 1991; Wills vegetables postharvest decay, et al., 1998; Reid, 2002
chilling injuryL*a*b*- Fruits and Colour Delwiche et al., 1993; measurement vegetables Shewfelt, 1993Biophotonic Various plant Physiological Popp, 1999
food responsesEthylene production Fruits and Maturity, chilling Weichmann, 1987;
vegetables injury, disorders, Praeger et al., 1999; changes in structural Reid, 2002carbohydrates

these single quality related components (product quality characteristics andconsumer-oriented quality values) but to combine them to a complex and reliablevalue in order to develop a tool for a comprehensive determination, evaluationand prediction of product quality in pre- and postharvest.
Several attempts have been made in assessing product quality by developing acomplex quality index (e.g. Molnar, 1995; Schreiner et al., 1996; Tijskens, 2000;Schreiner et al., 2000). For example for lettuce characteristic quality attributes(e.g. textural properties) and other properties being important for lettuce quality (e.g.nitrate content, contaminants, etc.) were chosen and scored according to maximumtolerable values established in laws or according to consumer requirements(Schreiner et al., 1996):
Qlettuce = x1 * (a * nitrate content) * (x2 * freshness + x3 crispness + xn * quality attributen)
The factor a is zero when nitrate content has reached its maximum tolerable value,and a is 1 when it is below the maximum tolerable value.
Freshness as well as crispness are consisting of several single compounds(turgor, surface composition, reflexion, carbohydrates etc.) which were summa-rized to develop a quality value determining external and internal quality attributes(Figure 2).
As quality is not a fixed value but a consumer oriented and time variable valuethe following formula was developed for a more comprehensive quality evalua-tion (Figure 3) (Schreiner et al., 1998). In this approach the relationship betweendesired and undesired product attributes were characterized:
x1 · P1 + x2 · P2 + x3 · P3QK = a · ( ––––––––––––––––––––––––––)
x4 · P4
where
QK Quality indexa threshold value for undesired attributes
Quality Dynamics and Quality Assurance 415
Figure 2. Methodical approach for a quality index in lettuce (Schreiner et al., 1996).
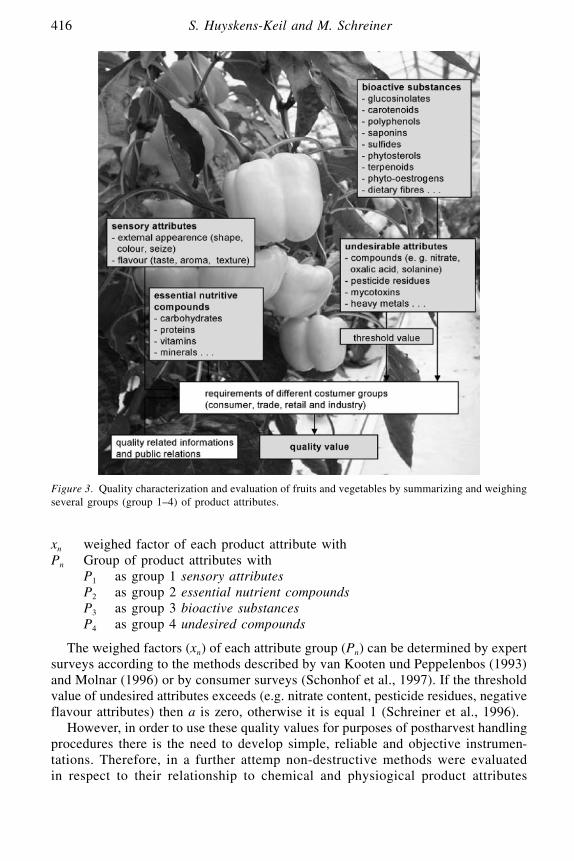
xn weighed factor of each product attribute with Pn Group of product attributes with
P1 as group 1 sensory attributesP2 as group 2 essential nutrient compoundsP3 as group 3 bioactive substancesP4 as group 4 undesired compounds
The weighed factors (xn) of each attribute group (Pn) can be determined by expertsurveys according to the methods described by van Kooten und Peppelenbos (1993)and Molnar (1996) or by consumer surveys (Schonhof et al., 1997). If the thresholdvalue of undesired attributes exceeds (e.g. nitrate content, pesticide residues, negativeflavour attributes) then a is zero, otherwise it is equal 1 (Schreiner et al., 1996).
However, in order to use these quality values for purposes of postharvest handlingprocedures there is the need to develop simple, reliable and objective instrumen-tations. Therefore, in a further attemp non-destructive methods were evaluatedin respect to their relationship to chemical and physiogical product attributes
416 S. Huyskens-Keil and M. Schreiner
Figure 3. Quality characterization and evaluation of fruits and vegetables by summarizing and weighingseveral groups (group 1–4) of product attributes.
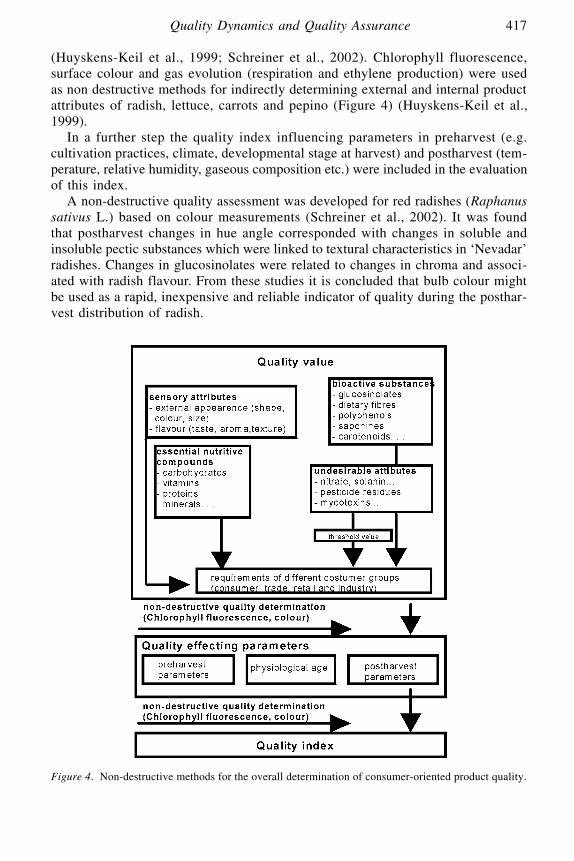
(Huyskens-Keil et al., 1999; Schreiner et al., 2002). Chlorophyll fluorescence,surface colour and gas evolution (respiration and ethylene production) were usedas non destructive methods for indirectly determining external and internal productattributes of radish, lettuce, carrots and pepino (Figure 4) (Huyskens-Keil et al.,1999).
In a further step the quality index influencing parameters in preharvest (e.g.cultivation practices, climate, developmental stage at harvest) and postharvest (tem-perature, relative humidity, gaseous composition etc.) were included in the evaluationof this index.
A non-destructive quality assessment was developed for red radishes (Raphanussativus L.) based on colour measurements (Schreiner et al., 2002). It was foundthat postharvest changes in hue angle corresponded with changes in soluble andinsoluble pectic substances which were linked to textural characteristics in ‘Nevadar’radishes. Changes in glucosinolates were related to changes in chroma and associ-ated with radish flavour. From these studies it is concluded that bulb colour mightbe used as a rapid, inexpensive and reliable indicator of quality during the posthar-vest distribution of radish.
Quality Dynamics and Quality Assurance 417
Figure 4. Non-destructive methods for the overall determination of consumer-oriented product quality.

4. QUALITY DYNAMICS OF FRUITS AND VEGETABLES IN PRE- AND POSTHARVEST
Many pre- and postharvest factors influence the quality of fruits and vegetablesby affecting their physiological processes. Preharvest factors include genetic influ-ence, environmental conditions (cultural practices) and physiological factors. Allthese factors are responsible for the wide variation in quality dynamics in prehar-vest and varying quality characteristics at harvest. As living tissues harvested fruitsand vegetables are characterized by postharverst quality dynamics resulting in qualitychanges due to ongoing physiological activities. Hence, maturity at harvest andpostharvest handling conditions like temperature, relative humidity and gas com-position also affect the quality characteristics of horticultural products. These qualitychanges cannot be suppressed but they can be delayed within certain limits byusing postharvest technologies.
The references cited herein are not intended to be a comprehensive list of allreports on pre- and postharvest factors influencing quality but the major factorsaffecting quality in pre- and postharvest are discussed with the objective of devel-oping an understanding of the action of these influencing factors on quality dynamicsand on expression of quality characteristics.
4.1. Quality dynamics in preharvest
4.1.1. Variation among species, types and cultivars
Genetic factors have a direct influence on all quality characteristics of fruits andvegetables. Environmental conditions and physiological factors may modify theexpression of the quality attributes, but the genetic background of the product isthe major determining factor.
Regarding the primary plant compounds carbohydrates as most abundantcompound group, being important for sensory impressions and as energy sourcein the fruit and vegetable consumption, are present in a wide range from 2 to40 g/100 g FM with lowest contents in cucumber and highest contents in starch accu-mulating cassava (Wills et al., 1998). Main sugars in fruits and vegetables arefructose, glucose and sucrose. Highest contents were found in fruits which candivided in sucrose accumulating fruits like pepino (Huyskens-Keil et al., 2000),mango and banana (Wills, 1987) and in fruits with similar contents in reduced sugarscombined with a low sucrose level like litchi, persimmon or grape (Wills, 1987).A substantial amount of carbohydrates is present as dietary fibre as main compo-nent of cell walls. The content of dietary fibre ranges from 1.5 to 2% of the freshmatter in pome and stone fruits to 1 to 4% in vegetables (Souci et al., 1994;Herrmann, 2001).
In contrast, proteins as important source for essential amino acids in the humandiet vary in a lower range of 6.05 g per 100 g FM in garlic (Souci et al., 1994)up to 0.3% to 0.4% in pome fruits like apple and pear (Herrmann, 2001). Sproutslike pea, lentil and soja sprouts contain relatively high contents of proteins (4.65%
418 S. Huyskens-Keil and M. Schreiner
to 5.53%) (Souci et al., 1994), while in fruits and fruit vegetables low amounts ofprotein occur (0.3% to 1.3%) (Holland et al., 1991; Souci et al., 1994; Wills etal., 1998; Herrmann, 2001).
Vitamins and the secondary plant compounds have particularly to be taken intoconsideration when regarding the health-promoting effect of fruits and vegetablesin human nutrition. These horticultural products may be important nutritional sourcesof vitamin C, A, K, thiamine, peridoxine, tocopherol, folic acid and pantothenic acid.Persimmon and peppers have the highest amount of vitamin C (Vanderslice et al.,1990; Wright and Kader, 1997). In general, cruciferous vegetables showed higherascorbic acid contents than non-cruciferous products due to the reduction ofdehydrascorbic acid to ascorbic acid by glutathione (Lee and Kader, 2000). Highcontents of folic acid are availably in kale (212 µg/100 g FM) and brussels sprouts(179 µg/100 g FM) and only in low amounts in fruits (10–80 µg/100 g FM) (Müller,1995). In horticultural products relatively high contents of tocopherol were foundin black salsifies (6.0 mg/100 g FM) (Elmadfa et al., 1998), while thiamine andpantothenic acid were mainly established in legumes (Elmadfa and Leitzmann, 1998).
Genetic influences affect also the secondary plant compounds. Exemplarily shownby broccoli, the spear type showed higher contents of the antioxidativ effectivecarotenoids lutein and β-carotene than the crown type and violet cultivars. Thistype effect was also manifested by the concentration of the chlorophyll a and b,pigments with anticancer properties. Carrots showed also genotypic variations incarotenoide composition expressed by cultivars rich in α- und β-carotene orlycopene (Chen et al., 2001). Moreover, the broccoli types differed in their contentof glucosinolates which are characterized by anticancerogenic effects. In contrastto the pigments, the crown type showed the highest glucosinolate concentration(Schonhof et al., 1999). Species of the Brassicaceae family are marked by glu-cosinolates. Thus, cruciferous vegetables generally comprise various contents andcompositions of glucosinolates (Fenwick et al., 1982; Lewis and Fenwick, 1987;He et al., 1999; Schonhof et al., 2000). Flavonoids are characterized by a high antiox-idativ and anticancerogenic potential occurring in all fruits and vegetables, howevertheir contents vary to a considerable extent (Herrmann, 1991). Brassicaceae speciesare enriched with flavonols and flavons primarily kale (Bilyk and Sapers, 1985),brussels sprouts, chinese leaves (Herrmann, 2001) as well as species of Lactucaceae,Liliaceae and Rosaceae (Herrmann, 1991). At the type level were also differencesin flavonoid composition (Hertog et al., 1992). In the case of lettuce types, someof them were very poor in flavonoids and other phenolic compounds, while othertypes contained large amounts of flavonols and anthocyanins (DuPont et al., 2000).Based on current knowledge of the genetic variation in various antioxidants (e.g.,tocopherols, carotenoids, flavonoids and vitamin C) in fruits and vegetables as sourceof human food, breeding holds significant promise for developing genotyps withimproved antioxidant content and composition (Kalt and Kushad, 2000). Kushad,2000). This also applies to other vitamins and secondary plant compounds (Beverlyet al., 1993).
Quality Dynamics and Quality Assurance 419

4.1.2. Environmental effects
Climatic conditions including irradiation and temperature have a strong influenceon the chemical composition of fruits and vegetables (Weston and Barth, 1997). Dueto the temperature and irradiation dependency of the photosynthesis increasingirradiation combined with enhanced temperatures promoted the photosynthetic per-formance which caused an accumulation of monosaccharides, exemplarily shownin radish bulbs (Figure 5) (Schreiner et al., 2002).
As metabolites of photosynthesis they had the highest content at the highestphotosynthetic photon flux density (PPFD) and highest mean temperature. This effectwas particularly distinctive for fructose as demonstrated by the regression coeffi-cient of 0.81, while the climatic influence did not have a strong influence on glucose(r2 = 0.52). This could be explained by the fact that in the Calvin cycle fructose1.6 phosphate, as a primary product, is formed by triose phosphates which infurther steps will be converted to different monosaccharides or polymeric carbo-hydrates (Heß, 1999). Irradiation had a definite influence on the amount of vitaminC formed, because ascorbic acid is synthesized from sugars supplied through light-dependent photosynthesis (Lee and Kader, 2000). In general, lower irradiationintensity led to lower contents of ascorbic acid in fruits and vegetables (Nagy andWardowski, 1988; Shewfelt, 1990; Krumbein und Schonhof, 1999). Light inten-
420 S. Huyskens-Keil and M. Schreiner
Figure 5. Fructose content of ‘Nevadar’ radish roots as function of the mean of PPFD and the meantemperature (x: mean temperature, y: mean PPFD, a = 4.82, b = 359111, c = 0.00059; standard error= 0.66, F value = 57.58; p = 0.05)

sity and its wavelength also have important influence on flavonoid metabolism. Ithas been demonstrated that fruits and vegetables as well as parts of them exposedto full sunlight contained more flavonoids than those grown in shade (Mancinelliand Rabino, 1984; Hermann, 1991; Gil et al., 1995). Increasing irradiation combinedwith relatively low daily mean temperatures led to rising contents of the alkyl gucosi-nolate glucoraphanin in broccoli (Schonhof et al., 1999). Unlike the alkenyl andindolyl glucosinolates in radish the glucoraphanin content in broccoli decreasedwith increasing temperature. Thus, various ecophysiological responses may be theresult of different biosynthesis pathways of the different glucosinolate groups. Theglucosinolate groups derive from different amino acids and have various agluconstructures which might lead to a different sensitivity to temperature and irradia-tion (Schreiner et al., 2002). In broccoli increasing contents of indolyl glucosinolateswere also found at higher global radiation (Schonhof et al., 1999b, 2000). However,for white cabbage and kale this effect could not be confirmed when comparingdifferent growing periods, e.g. spring and fall production (Rosa et al., 1996).
In contrast to the flavonoids and glucosinolates, irradiation was not influencingcarotenoid biosynthesis but it was strongly temperature dependent. For example,daily mean temperature below 16.5 °C were beneficial for the β-carotene syn-thesis in broccoli (Schreiner et al., 2000) and 18 °C for carrots (Rosenfeld et al.,1999). Day/night temperatures of 15/10 °C led to a higher β-carotene content inlettuce and spinach in comparison to temperatures of 20/15 °C (Oyama et al.,1999). Beneficial temperatures for lycopene formation in tomato were found inthe range from 16 °C to 21 °C (Gross, 1991). Also for vitamin C formation lowertemperatures were required leading to higher ascorbic acid contents than higher tem-peratures (Islam and Kan, 2000).
CO2 concentration and the relative humidity of the air as further climatic factorsare especially important for protected cultivation and showed also an influence onthe quality of fruits and vegetables (Weston and Barth, 1997; Dorais et al., 2001).As an example, Behboudian and Tod (1995) and Islam et al. (1995) reported thattomato fruits grown under CO2 enrichment had higher contents of monosaccha-rides than ambient CO2-fruits, whereas CO2-enriched tomato fruits contained lowercontents of organic acids (Islam et al., 1995). Also tomato fruits produced under alow relative humidity are firmer, juicier, less mealy and have less physiologicaldisorders than fruits cultivated under high relative humidity (Janse and Schols, 1992).
Moreover, water and nutrition supply influence the content of several qualitydetermining compounds but climatic and genetic variations are often larger thanchanges caused by water and nutrient management (Evers, 1994). A reduced watersupply could lead to increased contents of chemical compounds and hence to qualityimprovement. Exemplarily shown by tomato, the contents of sugars, titratable acids,aroma volatiles and vitamin C could be enhanced by drought stress (Mizrahi etal., 1988; Puiupol et al., 1996; Auerswald et al., 1999; Veit-Köhler et al., 1999). Thiseffect appeared to be caused by a combination of osmoregulation and decreasedyield, which concentrated the photosynthates into fewer and smaller fruits (Beverlyet al., 1993). Saline stress caused the same effect on tomato combined also wihthe negative symptoms of drought stress like reduced yield and enhanced blossom-end rot (Reid et al., 1996). Reduced water supply also affect secondary plant
Quality Dynamics and Quality Assurance 421
compounds. For instance, in the case of broccoli less irrigation caused a duplica-tion in the glucosinolate content (Paschold et al., 2000).
Mineral nutrients have specific and essential functions in plant metabolism(Marschner, 1995). Numerous investigations resulted in recommendations fornutrient supply of fruits and vegetables in order to optimise quality formation (e.g.Fink und Scharpf, 1992; Alt et al., 1998; Feller et al., 2001). However, new aspectshave arisen in the context of sulfur application. Due to the drastically decreasedindustrial SO2 emmissions sulfur deficiency is becoming more widespread in agri-cultural areas of northern Europe (Schnug, 1993). According to this environmentalcircumstances enhancement of health-promoting alliin and glucosinolates as sulfurcontaining compounds is possible via increased sulfur supply. An increasing sulfurapplication was related to an increasing allin content in garlic and onion by theenhanced formation of sulfur contaning amino acids as precursor of alliin (Hoppeet al., 1996). Rising levels of sulfur led also to increased glucosinolate contents inbroccoli and radish. This effect was mainly due to glucoraphanin in broccoli andglucobrassicin in radish (Krumbein et al., 2001). Decreasing nitrogen supplypromoted rising amounts of glucosinolates (Paschold et al., 2000; Krumbein etal., 2001) assumingly being caused by an enhanced non-protein sulfur content andhence in an increased availability of methionine (Dick-Hennes and Bünning-Pfaue,1992). In contrast enhanced nitrogen application increased volatile production andthe formation of proteins, carotenoids and chlorophylls (Beverly et al., 1993; Igbasanet al., 1996; Mattheis and Fellmann, 1999; Krumbein et al., 2001), whereas itmight reduce contents of vitamin C, phenolic compounds and carbohydrates (Beverlyet al., 1993; Mozafar, 1996; Lee and Kader, 2000; Sanchez et al., 2000).
Further possibilities for increasing glucosinolates and flavonoids consist in theapplication of elicitors. Jasmonic acid and methyle jasmonate induced large increasesin the concentration of indolyl glucosinolats in cotyledons and leaves of oilseed rape(Bodnaryk, 1994). Also methyle jasmonate enhanced the anthocyanin content inapple (Rudell et al., 2002). Applications of the amino acids like leucin, phenylalaninor valin as precurser in anthocyanin synthesis led also to rising amounts of antho-cyanin in radish (Ishikura and Hayashi, 1966 a, b).
4.1.3. Physiological factors
During development of fruits and vegetables the contents of the quality deter-mining compounds is changing being demonstrated e.g. in pepino fruits (Huyskens-Keil et al., 2000), in tomato and banana (Wills et al., 1998) and pineapple (Kays,1991). The developmental stage at harvest is one of the major factors that deter-mines the external appearance and chemical composition of fruits and vegetables(Goldmann et al., 1999).
Close correlations were found between the development stage of broccoli andthe content of secondary plant compounds (Schonhof et al., 1999). The content ofβ-carotene, lutein and chlorophyll a and b in broccoli heads increased during thedevelopment. Fully developed heads showed the highest contents of carotenoids andchlorophylls. Highest amounts of these secondary plant compounds as well as antho-cyanins were also found in ripe fruits and fruit vegetables which undergo distinct
422 S. Huyskens-Keil and M. Schreiner

alterations in colour during maturation. In contrast, with increasing head size oflettuce the amounts of β-carotene, vitamin C and sugars were reduced (Drews etal., 1995). The ripening process generally is going along with an increase in sugars,aroma volatiles and vitamins and a decrease in organic acids, starch and cell wallcarbohydrates (e.g. Kays, 1991, 1999; Fischer et al., 1997; Wills et al., 1998; Scheeret al., 1999; Mattheis and Feldmann, 1999; Goldmann et al., 1999; Huyskens-Keilet al., 2000). In contrast, the content of indolyl glucosinolates decreased withadvanced development of broccoli heads (Krumbein und Schonhof, 1999). Thecontent of saponins – a cholesterol-binding secondary plant compound – decreasedconsiderably during maturation of peas (Daveby et al., 1997). Young leaves of turnip(Brassica rapa L.) contained more thiamine and riboflavin but less carotene thenolder leaves (Salunkhe et al., 1991).
It is evident that a diverse range of preharvest factors can alter the quality of fruitsand vegetables. Although it is possible to enhance the quality of fruits and vegetablesby considering the preharvest influence in cultural management, the quality at harvesthas to be maintained during postharvest handling.
4.2. Quality dynamics in postharvest
After harvest all fresh fruits and vegetables carry on physiological activities thatare essential to the maintenance of life. Respiration, transpiration and ethyleneevolution are the central quality determining physiological process in postharvestbeing affected by climate factors like temperature, exposed gas composition (oxygen,carbon dioxide and ethylene) and air humidity (e.g. Böttcher, 1996; Reid andSerek, 1999; Paull, 1999) as well as by the horticultural product itself. Extremelylarge differences in respiration, transpiration and ethylene evolution intensity canbe found between different plant parts (Van den Berg, 1987; Kays, 1991), speciesand cultivars (Kader, 2002) and developmental stages (Wills et al., 1998). Thus,the level of quality loss of harvested fruits and vegetables is generally propor-tional to the respiration and transpiration rate. Maintaining postharvest quality interms of the chemical composition of the product and hence extending shelf-lifemeans the reduction of respiration, transpiration and ethylene evolution rates byinfluencing the above mentioned climate factors and to a limited extend by the selec-tion of genotype and maturity stage at harvest.
Numerous studies include storage recommendations for temperate as well as sub-tropical and tropical fruits and vegetables regarding air temperature, relative airhumidity and the atmospheric composition (e.g. Hardenburg et al., 1990; Salveit,1997; Kader, 1997; Kupfermann, 1997; Reid and Serek, 1999). Earlier investiga-tions on postharvest climate effects mainly focused on the external appearance ofthe horticultural product like changes in colour, gloss and fresh weight. The risinghealth consciousness of the consumer and the progress in analytical methodsextended the investigated quality characteristics in terms of consumer orientedquality aspects such as sensory, nutritional and health value of fruits and vegeta-bles (Paull, 1999). In this chapter, examples of the quality dynamics in fruits andvegetables affected by climate factors in postharvest will be presented.
Quality Dynamics and Quality Assurance 423

4.2.1. Temperature
Temperature is a climate factor that mostly influences the quality loss of fruitsand vegetables. Storage recommendations for fruits and vegetables mainly focuson the minimum temperature that provides the maximum shelf-life (Paull, 1999) andalso considering the threshold levels of chilling injury or freezing damage of thetissue (Nilsson, 2000). Proper temperature management begins with rapid precooling.Delays between harvest and cooling can lead in direct losses due to water lossand decay and indirect losses such as flavour, nutritional and health quality (Lee andKader, 2000). For example, delaying the start of precooling of strawberries resultedin about 50% greater water loss than in control fruit, which was evident as increasesin superficial shrivelling. Moreover, accelerated losses of titratable acidity, fructose,glucose and sucrose are caused by increasing product temperature due to a delayedprecooling (Nunes et al., 1995).
The texture determining cell wall carbohydrates show a strong temperature depen-dency as well. This was mainly reported for pectic substances (e.g. Heyes et al.,1994; O’Donoghue et al., 1997; Sams, 1999) and pectolytic enzyme systems(Tijskens and van Dijk, 2000). As an example, total pectin in the cortex tissue ofcarrots decreased by 40% within two days at 20 °C, while bulbs of untopped radishesshowed a 16% loss in pectic substance at 18 °C (Huyskens-Keil et al., 2001).
Vitamins are also affected by postharvest temperature impact. Losses in ascorbicacid content accelerated in response to elevated temperatures (20 °C) in vegeta-bles like kale, spinach, cabbage and snap beans (Zepplin and Elvehjein, 1944;Ezell and Wilcox, 1959). In contrast, Wu et al. (1992) found that ascorbic acid ingreen beans decreased rapidly kept at lower temperatures of 5 °C after three days.In broccoli retention of ascorbic acid is possible at low temperatures (Albrecht etal., 1990), while asparagus showed an enhanced ascorbic acid content in cool storage(Esteve et al., 1995). Postharvest losses in other vitamins may occur due to degra-dation at high temperatures in the presence of oxygen (Kader, 1988). The degradationof all vitamins can be considerably reduced at storage temperatures of 1 °C (Böttcher,1996).
Regarding secondary plant compounds extensive investigations were conductedon the effect of temperature on the synthesis and degradation processes of chloro-phylls and carotenoides (e.g. Strmiska und Holckova, 1969; Gross, 1991; Shi andChen, 1997). For example, storage temperature can effect the β-carotene content,and the nature of this effect depends on the maturity stage of the product. The β-carotene content of tomatoes increased during storage as fruits were still ripeningprocess (Watada, 1987). The rate of increase was greater at higher temperaturesup to 25 °C, while in the case of some sweet potato cultivars no rise in β-caroteneduring storage occurred as the synthesis of carotenoids was completed already bythe time of harvest (Watada, 1987). This combined maturity-temperature-effectwas also observed by Pepino (Widayat et al., 2001). Premature and mature pepinofruits stored at 18 °C showed a stronger increase of β-carotene than at 5 °C, butin ripe pepinos β-carotene were unaffected by temperature. In contrast to the steadyincrease in lycopene at temperatures about 25 °C, no lycopene synthesis takes
424 S. Huyskens-Keil and M. Schreiner

place above 30 °C as found in several fruits and vegetables (Goodwin and Jamikorn,1952; Wills et al., 1998).
Storage at low temperatures can also have positive and negative effects on fruitand vegetable phenolics (Tomas-Barberan and Espin, 2001). Cool storage lead toincreased contents of anthocyanins in strawberries (Gil et al., 1997), blueberries(Kalt and McDonald, 1996) grapes (Cantos et al., 2000) and pomegranates (Holcroftet al., 1998). An enhanced content of hydroxicinnamic acid derivates as anotherphenolic compound was observed in cold stored artichokes (Tomas-Barberan andEspin, 2001), however quercitin in onions was unaffected during six month coldstorage (Price, 1997). In contrast, berries stored at room temperature contained ahigher antioxidant capacity in comparison to low temperature conditions (Kalt et al.,1999).
While numerous studies exist about the influence of thermal treatments in foodprocessing like freezing, blanching and cooking on glucosinolate content (e.g.Fenwick et al., 1982; Rosa and Heany, 1993; Nugon-Baudon and Rabot, 1994;Ruiz et al., 1996; Crozier et al., 1997; Clinton, 1998), only limited information isavailable on the effect of storage temperatures in the range of 0 °C to 20 °C. Adecline of glucosinolates was reported in cabbage during storage at 5 °C (Chongand Berard, 1983), while in radish it occurred at 18 ° C (Widell et al., 1999; Schreineret al., 1999). Moreover, it was found that the glucosinolate decomposition was propo-tional to the progress in physiological aging.
4.2.2. Relative humidity
The transpiration rate of fruits and vegetables is determined by the water vapourpressure deficit as difference between the actual water pressure of the ambient air(relative humidity) and of the intercellular spaces in the plant material. Even inthe absence of wilting symptoms, water loss result in undesirable changes in nutri-tional and health-promoting compounds (Kays, 1991; Wills et al., 1998). In lettuceit was shown that respiration rate and the content of total pectic substances dependon the water status of the product, i.e. the rise of respiration coincided with a decreaseof pectin at a low water content (65%) (Schreiner et al., 1995). Drought stress inpostharvest led to an enhanced respiration, where monosaccharides attached to pectinmolecules might serve as additional respiration substrate, indicating the breakdown of insoluble pectic substances. At a higher water content (85%) the pectinsalmost remain constant. Water deficit stress can also result in the discoloration ofleafy vegetables and some fruits (e.g. oranges) due to the loss of health-promotingpigments like chlorophylls, carotenoids and anthocyanins (Watada, 1978; Kays, 1991;Paull, 1999). Carotene retention was found to be improved in carrots when relativehumidity was enhanced by surface coating of the product (Li and Barth, 1998). Incoated litchis the changes in anthocyanins were delayed by an delayed increase inpolyphenol oxidase (Zhang and Quantik, 1997). Postharvest conditions favourableto water loss cause a more rapid loss in ascorbic acid (Watada, 1987; Lee and Kader,2000). Wrapping as means for minimizing water loss reduced the degradation ofvitamin C in strawberries (Nunes et al., 1998) and in pomegranates (Nanda et al.,
Quality Dynamics and Quality Assurance 425

2001). In general, water stress deficit caused by low relative humidity acceleratethe process of senescence leading to a loss in flavour and to a decline in nutri-tional and health value in fruits and vegetables.
4.2.3. Atmospheric composition
Controlled atmospheres (CA) in storage and modified atmosphere packaging (MAP)generally reduce the oxygen concentration and elevate the carbon dioxide concen-tration in the ambient atmosphere of the product and influence thereby fruit andvegetable quality. This atmospheric modification can either delay or accelerate dete-rioration of horticultural products (Kader, 2002). The magnitude of these productresponses depends upon genotype, maturity stage at harvest, oxygen and carbondioxide concentration applied, temperature and duration of storage or packaging.Regarding the numerous CA and MA recommendation for fruits and vegetablesthe nutritional and health-promoting compounds as well a flavour can be preservedfor a particular period. Oxygen levels below or carbon dioxide levels above therecommended threshold lead to off-flavour and off-odors, discoloration (degrada-tion of chlorophylls, carotenoids and anthocyanins), softening (degradation of cellwall carbohydrates), impaired ripening, skin and flesh browning (Salveit, 1997;Kader, 1997; Kupfermann, 1997; Reid and Serek, 1999; Beaudry, 1999).
Beside static CA conditions during storage, the application of short time high CO2
shocks on storage performance was newly investigated. For example, ripe pepinofruits were kept at 20% CO2 and 5% O2 at the first two storage days and then reducedto 5% CO2 and 5% O2 for the following storage period of 19 days (Widayat etal., 2002). In terms of preventing the degradation of chlorophylls, β-carotene, pectin,organic acids and mono- and disaccharide CA storage with CO2 shocks was the mostbeneficial treatment.
In recent years, research in CA and MA was also focused on the suppressionof microbial activity which is highly demanded by the consumer and by the foodindustry due to new food safety laws. The activity of various organism can causingdecay be reduced by modification of the ambient atmosphere. Ultra-low oxygen(0.1–0.05 kPa) could provide as a non-chemical suppression of green mold in grape-fruit (Shellie, 2002). Moreover, superatmospheric oxygen levels (80 kPa) are reportedto inhibit the growth of some bacteria and fungi in fresh fruits and vegetables (Kaderand Ben-Yehoshua, 2000; Ben-Yehoshua, 2002). Also carbon dioxide concentrationsof 10% and more, as it is recommended for strawberries, figs, cherries, blueber-ries, blackberries and raspberries, reduce rotting by micro organism and give avaluable extension in marketing life and food safety (Kader, 1997; Wills et al., 1998).
Food borne illness and industry products recall have led to a greater concern aboutthe management of temperature, relative humidity and atmospheric compositionduring storage and transport. These three parameters are major criteria to definecritical limits in monitoring fruit and vegetable quality also in terms of food safetywithin HACCP concepts and quality management systems.
426 S. Huyskens-Keil and M. Schreiner

5. POSTHARVEST TECHNOLOGY AND QUALITY ASSURANCE IN POSTHARVEST
Postharvest handling includes all steps involved in moving a commodity from theproducer to the consumer including harvesting, handling, postharvest treatment,packaging, cooling, storing, shipping, wholesailing and retailing. Maintaining productquality from farmer to the customer is the major prerequisite of successful mar-keting. The intitial step required insuring successful marketing is to harvest thecrop at the optimum stage of maturity where it has reached it’s optimum in respectto shelf life and storabilty as well as in respect to its optimum sensory quality.However, losses in postharvest from harvest until the product has reached theconsumer are high, specifically in highly perishable fresh fruits and vegetablesbeing very subceptible to decay and deterioration. Postharvest losses of fruits andvegetables can comprise of up to 20% in developed countries, while it can reach60% in developing countries. Causes of postharvest quality losses comprise ofmechanical damages, diseases and abiotic related disorders (Table 8).
The occurrence of abiotic disorders can be prevented by the optimization ofpreharvest factors as they are often being caused by the deficiency or irregula-tions in mineral and water supply leading to e.g. stem end rot in solanaceousproduces, scald and bitter pit in apples, brown heart in salad and hollow heart inbroccoli (e.g. Snowdon, 1992; Böttcher, 1996; Osterloh et al., 1996; Barkai-Golan,2001). Moreover, they might be caused by unfavourable temperatures being toolow (0–15 °C) or too high (>35 °C) leading either to chilling injury (mainly intropical and subtropical commodities), or to heat injury (sunscore, surface burning,inhibition of ripening) of the product (e.g. Kays, 1991; Snowdon, 1992; Wills etal., 1998).
Physical damages (surface injuries, impact bruising) are often major contribu-
Quality Dynamics and Quality Assurance 427
Table 8. Causes of postharvest quality losses in fruits and vegetables (Kader, 2002).
Products Mechanical Parasitic Nonparasitic injury (%) disease (%) disorder (%)
Apples ‘Red Delicious’ 1.8 00.5 1.3Cucumbers 1.2 03.3 3.4Grapes
‘Emperor’ 4.2 00.4 0.9‘Thompson’ 8.3 00.6 1.6
Lettuce ‘Ìceberg’ 5.8 02.7 3.2Oranges
‘Navel’ 0.8 03.1 0.3‘Valencia’ 0.2 02.6 0.4
Peaches 6.4 06.2 –Pears ‘Bosc’ 4.1 03.8 2.2Peppers, Bell 2.2 04.0 4.4Potatoes 2.5 01.4 1.0Strawberries 7.7 15.2 –Sweetpotatoes 1.7 09.2 4.2
tors to deterioration in postharvest. Mechanical injuries accelerate water loss, providesites for fungal infection and stimulate undesired metabolic processes such asrespiration and ethylene production. These mechanical damages can be avoidedby applying harvest and postharvest handling technologies being adapted to productmorphological and physiological concerns (Kader, 1983; Kasmire, 1983; Studer,1983; Morris, 1990; Kader, 2002).
Recently, consumers increasingly concern about food safety, e.g. microbiolog-ical hazards, pesticide residues, and toxic biogenic product compounds leading tofoodborn illness. New methods were established to face these problems, i.e. mod-ifications by biotechnology and optimized postharvest treatments by irradiation, heattreatments, coating and waxing.
Biotechnology or genetic modification is used for creating new varieties withhigher quality or that can be grown with reduced pesticides. For example in tomatoesmodifications of textural properties inhibiting softening processes and thus extendingshelf life was one of the major issue on improving tomato quality by gentech-nology (Murray et al., 1995; Brummell et al., 2002) However, these modificationsmore and more focus to improve nutritional valuable and health promoting ingre-dients and postharvest life of various fresh commodities (Hall et al., 2000; Rosatiet al., 2000; Fraser et al., 2001; Fraser et al., 2002).
Recently, strong emphasis is place upon the development and improvement ofnew postharvest treatments ranging from the improvement of film packaging andcoatings to the application of substances accelerating the synthesis of stress com-pounds in products, e.g. heat shock proteins, lignin, phenolic compounds, leadingto an extended storage life.
5.1. Film packaging and waxing
The growing consumer demand for healthy and convenient food began to mergewith advantages in postharvest technology and handling that improved the quality,presentation, and shelf life of fresh-cut produce at the wholesale and retail market.In Europe, there is an increasing demand for convenience-products, such as baggedsalads and broccoli florets, sliced mushrooms, peeled or fresh-cut asparagus, coredpineapples, stir-fry vegetable mixes and packaged baby carrots (ZMP, 2000;Huyskens-Keil, 2001). According to consumer surveys in the United States, 84%of consumers had purchased fresh-cut, convenience fruits and vegetables at leasttwice a year (The Packer, 2000). However, the benefits for sale depend on theuse of modifies atmosphere packaging which extend the shelf life of these highlyperishable commodities. Film packaging and waxing extend shelf life and improvesthe flavour, freshness, and the appearance of many products (e.g. Hagenmaier,2000; Hagenmaier, 2002). Moreover, film packaging prevented e.g. radish, pepinoand fresh-cut white asparagus from rapid deterioration in respect to nutritive andsensory compounds (Huyskens-Keil et al., 2000b; Huyskens-Keil and Kadau, 2001;Huyskens-Keil et al., 2002; Schreiner et al., 2002). However, the film packagingmaterials used commercially do often not fulfill product physiological concerns,specifically in respect to textural changes and contamination with microorganism.Recently, various studies had focused on the effect of the modification of the gaseous
428 S. Huyskens-Keil and M. Schreiner

atmosphere within film packaging on vegetable-associated microorganisms (Farr andKogoma, 1991; Amanatidou et al., 1999; Amanatidou et al., 2000; Jacxsens et al.,2001).
On the other hand, there is an increasing demand for the commercial use ofbiodegradable films being an important tool for reducing the need for plastics whichis required by the European Parliament and Council Directive on packaging andpackaging waste (EC/94/62, 1994). The comparative effect of conventional and newpackaging films such as foodtainer, biodegradable films and edible coatings wereinvestigated in respect to their suitability to improve shelf life and prevent qualityloss of bioactive compounds in highly perishable fruits and vegetables during shelflife (Baldwin and Nisperos-Carriedo, 1994; Huyskens-Keil et al., 2002; Schreineret al., 2002). In these studies, it was found that in pepino fruits the use of food-tainer maintained the β-carotene and chlorophyll contents, whereas sucrose estercoating led to a desired inhibition of pectin degradation. Starch coating, OPP-Coex-film and foodtainer packaging prevented the loss of total pectins in radishesduring five days of storage, while cellulose film packaging and sucrose ester coatingcaused a decline of total pectins with a partly stronger degradation than it appearedin the untreated control (Figure 6).
Cellulose film packaging of radish led to an accumulation of glucosinolatesin radishes, while all other packaging treatments caused a degradation of glu-cosinolates which was mainly due to high contents of alkenyl glucosinolates(Figure 7).
This effect was caused by an enhanced CO2 concentration within the cellulosefilm coating. Drastically enhanced CO2 concentration up to 16% were also found
Quality Dynamics and Quality Assurance 429
Figure 6. Total pectin content of radish cv. ‘Rudi’ during storage as effected by different types ofpackaging material and film coatings (5 °C storage temperature).

in broccoli wrapped with cellulose film after 24 h at 20 °C. Broccoli heads storedat 0.5% O2 and 20% CO2 showed rising total glucosinolates (42%) compared to freshharvested broccoli (Hansen et al., 1995). This increase in glucosinolates couldhave been associated with an enhanced synthesis or a release of bound compounds,e.g. amino acids.
5.2. Treatments with chlorinated water, fungicides and insecticides
Decay caused by moulds or bacteria is a major cause of loss of fresh produceduring marketing (Artes and Martinez, 1996). Infection may occur before or afterharvest, either through injuries or by direct penetration of the intact skin of produce.Preharvest infections often lie dormant until after harvest, especially in fruits, wherethey may develop only as the fruit ripens. Therefore, sanitation is of great concernto producers and traders, not only to protect produce against postharvest diseases,but also to protect consumers. Echirichia coli, Salmonella spp., Chryptosporidiumspp., and Cyclospera spp. are among the disease-causing organisms that are trans-ferred via fresh fruits and vegetables (Shewfelt, 1993). Use of disinfectants inwash water can help to prevent both postharvest diseases and food borne illnesses.Mangoes, bananas, avocados and sweet peppers are subject to latent anthracnose(e.g. Snowdon, 1992), and therefore postharvest application of fungicide is appliedas they are to be stored for a long period and often undergo long periods of trans-port to distant markets.
Chlorine as sodium hypochlorite solution or as a dry, powdered calcium hypochlo-rite can be used in hydro-cooling or wash water as a disinfectant, e.g in table
430 S. Huyskens-Keil and M. Schreiner
Figure 7. Total glucosinolate content of radish cv. ‘Rudi’ as effected by different types of packagingmaterial and film coatings (5 °C storage temperature).

grapes for the prevention of Botrytis spp. (Zoffoli et al., 1999). Some pathogens suchas Chryptosporidium spp., however, are very resistant to chlorine, and even sensi-tive pathogens, such as Salmonella spp. and Echirichia coli may be located ininaccessible sites on the plant surface. For the majority of vegetables, chlorineconcentrations in wash water should be in the range of 75 to 150 ppm. Concentrationsabove 200 ppm can injure some vegetables (such as leafy greens and celery) or mightcause undesirable off-flavours.
Ozonation is another technology that can be used to sanitize produce. Ozonehas been used for a long time in food treatment in order to prevent foodbornepathogens and destroy microbes and insects responsible for decay. The effect ofozone is the destruction of membranes in pathogens by radicals formed by thereaction of ozone (Kim et al., 1999). At very low ozone concentrations between 0.01and 0.04 ppm enhancement of flavour in fruits such as strawberries is reported(Lidster et al., 1988), while concentrations of 0.3 ppm led to reduced decay inpeaches and table grapes (Palou et al., 2002). Furthermore, it is assumed that theformation of fragrances and odours giving the fruit its characteristic flavour isassisted by the action of ozone. The sterilization of storage container using ozonemight also prevent the development of off-flavour in packaging units.
Hydrogen peroxide can also be used as a disinfectant (Shewfelt, 1993).Concentrations of 0.5% or less are effective for inhibiting development of posthar-vest decay caused by a number of fungi. Hydrogen peroxide has a low toxicity ratingand is generally recognized as having little potential for environmental damage.
Carbonmonoxide at concentrations of 1–5% is added to reduced O2-atmosphere(2–5%) in MA packaging or CA storage and inhibits discoloration of vegetables,inhibit growth of several pathogens and prevent decay development of severalfruits and vegetables (Shewefelt, 1993).
Sulphur dioxide can be used to control mould growth in some fruits, e.g. intable grapes. Therefore, it is recomended to refrigerate grapes in combination withfumigation using low levels of sulphur dioxide.
5.3. Irradiation
Irradiation treatment involves exposing the product to a radiation source (up to 1000Gy) until it absorbs the requires dosage of gamma or X-rays (Mitcham et al.,2002). This food safety application is mainly aimed to disinfection, insect steril-ization and to destroy food-borne pathogens specifically in processed products, suchas Salmonella spp., Listeria monocytogenes and Staphylococcus aureus (Delincee,1996; Harris et al., 2002). New hygienic related concepts like the Hazard Analysisof Critical Control Points (HACCP) were already established in national and inter-national laws and orders (HACCP concept, 1998) as well as in quality managementsystems to meet the requirements of the industry. Food irradiation is also an effec-tive quarantine treatment for control insect infestation, prevention of sprouting oftubers like potatoes and onions, and extention of the shelf life of various poducts(Mitcham et al., 2002). Moreover, irradiation is applied to several tropical andsubtropical commodities, e.g. papaya, avocado, banana, lychee, atemoya and orangesin order to suppress disease-causing bacteria and fungi such as Botrytis sp., Alternaria
Quality Dynamics and Quality Assurance 431

spp. and Anthracnose causing severe losses during long distance transports (e.g.Snowdon, 1992).
It is reported that UV treatment has proven to be beneficial in reducing micro-bial spoilage during storage of strawberries and tomatoes (Marquenie et al., 2002).A mild treatment inhibits the fungal growth on the sepals of strawberry and henceimproves the quality, but when the dose is increased the destructive effect of UV-C treatment on the sepals becomes important. Marquenie et al. (2002) found abeneficial effect of 0.1 J cm–2 on fungal development on strawberries, whereas intomatoes higher doses of 0.4 J cm–2 led to a more pronounced effect (Charles etal., 2002). These effects might be due to the production of specific product com-pounds, as it was found in citrus where irradiation with UV (0.5–3.0 kJ m–2) causeda production of lignin-like compounds eliciting the synthesis of phytoalexins, suchas scoparone and scopoletin (Ben-Yehoshua, 2002), leading to an inhibition ofdecay. Several other reports demonstrated the induction of resistance by UV inkumquat, pepper, Valencia oranges, and grapefruit. UV-C irradiation was foundnot to negatively affect fruit flavour and taste in some citrus fruits, however it isstill discussed whether UV is a potential postharvest treatment for substituting presentfungicides.
5.4. Heat treatment
Heat treatment is one method used to induce modifications of physiological andphysicochemical characteristics of fruits and vegetables after harvest (Brodl, 1989).Exposure of fresh commodities to heat (40 °C) results in the interruption of normalcellular protein synthesis, inactivation of enzymes related to quality loss and pro-duction of other enzyme systems (Lurie, 1998; Ben-Yehoshua, 2002). It may reducethe susceptibility to browning and maintained firmness and colour in several applescultivars (Kim et al., 1999). Such heat shock treatments are reported to vary greatlydepending on cultivar, temperature and duration of the treatment.
Heat treatments are also commonly used for postharvest decay control includinghot water treatment e.g. for mango and lycee and vapor heat and high-tempera-ture forced air e.g. for mango, papaya, and various citrus fruits (Mitcham, 2002).High-temperature forced air is a modified procedure of vapor heat with greaterairflow to speed heating and lower relative humidity to reduce product damage.These treatments are applied for 10 seconds up to 40 minutes at temperaturesbetween 30 °C to 62 °C depending of the product, and it is often combined withirradiation doses in order to enhance host resistance and to prevent e.g. Anthracnoseand Colletotricum sp. (Snowdon, 1992; Lurie, 1999). Furthermore, heat applica-tion is reported to markedly reduce the sensitivity of various commodities to chillinginjury and to delay ripening of several fruits (Lurie, 1999; Funamoto et al., 2002;Vicente et al., 2002; Holland et al., 2002). In tomato, papaya and durian heat treat-ment (at 35 °C for 12 h, at 55 °C for 5 min and 42 °C for 24 h, respectively) resultedin an inhibition of polygalacturonase activity being responsible for undesired soft-ening and thus maintaining textural properties (Picton and Grierson, 1988; Ketsaet al., 2002). The mode of action of the heat treatment in reducing decay and pro-moting stress inhibiting processes is due to the inhibition of the pathogen growth
432 S. Huyskens-Keil and M. Schreiner

enabling the fruit to develop its mechanism of resistance, e.g. producing barriersagainst the invasion of wound barrier (e.g. by lignification), synthesis of phytoalexinsor heat shock proteins (Ben-Yehoshua, 2002).
For the international and domestic commerce of tree fruits and nuts thermal treat-ments based on electromagnetic energy in radio frequency range, in combinationwith conventional thermal methods such as water or air heating are in progress tobe developed in order to reduce insect pests and maintain produce quality (Ikedialaet al., 2002; Tang et al., 2000).
5.5. Curing
Curing root and tuber crops, such as sweet potatoes, potatoes, cassava and yamsis an important practice for short and long-term storage. Curing is accomplishedby holding the produce after harvest at high temperature and high relative humidityfor several days, until harvesting wounds heal and a new, protective layer of cellsform (Table 9) (Lidster et al., 1988). While curing can be initially costly, the longextension of storage life makes the practice economically worthwhile.
Curing, when used for onions and garlic flowering bulbs refers to the practicedirectly following harvest, of allowing the external layers of skin tissue to dry outprior to handling and storage. If local weather conditions permit, these crops canbe undercut in the field, windrowed and left there to dry for five to ten days. Thedried tops of the plants can be arranged to cover and shade the bulbs during thecuring process, protecting the produce from excess heat and sunburn. If forced heatedair is used for curing onions and other bulbs, one day or less at 35–45 °C and 60–75%relative humidity is recommended. The dried layers of skin protect the produce fromfurther water loss during storage.
5.6. Ethylene application
The importance of ethylene as a plant regulator, affecting many phases of plantgrowth and development have been known for centuries (e.g. Roberts and Tucker,1985; Abels et al., 1992). However, ethylene also plays an important role in thepostharvest life of many horticultural products. Some of the effects of ethylene appli-cation are economically useful, e.g. for achieving uniform ripening of tomatoesand bananas, and the degreening of citrus fruits (Reid, 2002), whereas often, ethyleneis involved in the decline of the quality in terms of undesired enhancement of
Quality Dynamics and Quality Assurance 433
Table 9. Curing conditions for several commodities (Lidster et al., 1988).
Commodity Temperature (°C) Rel. humidity (%) Days
Potato 15–20 90–95 5–10Sweet potato 30–32 85–90 4–7Yams 32–40 90–100 1–4Cassava 30–40 90–95 2–5

ripening and senescence and thus reducing shelf life (Kader, 1985; Watada, 1986;Reid, 1995; Zagori, 1995; Saltveit, 1999; Wills et al., 1999; Reid, 2002).
Recently, specific attention has been spent to postharvest disorders of fruits andvegetables being caused by low ethylene exposure. Examples are russet spottingof crisphead lettuce and sprouting of potatoes (Kader, 1985; Zagory, 1995), tough-ening of asparagus in which ethylene stimulates the lignification of xylem andother structural carbohydrates (Reid, 2002), and bitterness of carrots being causedby the synthesis of isocumarins which accelerate at ethylene concentrations of0.5 ppm (Shattuck et al., 1988; Abe et al., 1996; Ulrichs, 1999; Reid, 2002).
Apart from commercial materials such as potassium permanganat, new chemi-cals, e.g. aminoethoxyvinylglycine (AVG) and 1-methylcyclo-propene (1-MCP) havebeen approved inhibiting these undesired effects of ethylene in fruits and vegeta-bles leading to a prolonged postharvest life (Yang, 1987; Sisler et al., 1999; Palouet al., 2002). Another possibility recently discussed for ethylene removal is theuse of ultraviolet light producing a precursor of ozone which then oxidize ethylene(Reid, 2002).
5.7. High oxygen application
Several assessments carried out on selected fresh products showed that O2 con-centrations higher than 70% under modified atmosphere packaging or greater than21 kPa (induced through high O2 atmospheres or hyperbaric atmosphere) inhib-ited microbial growth, decay and influenced postharvest physiology and quality(Allende et al., 2000; Amanatidou et al., 2000; Kader and Ben-Yehoshua, 2000).Superatmospheric oxygen effects are caused by an alteration of the CO2 and C2H4
production rates. However, exposure to high oxygen may also have no effect or evenstimulate growth of different microorganism or may result in toxic reactions whenthe degree of oxidative stress exeeds the capacity of the cell defense systems.High O2 concentrations in combination with elevated CO2 (10–20%) have shownto have an inhibiting effect on the growth of microorganism in carrots, rather thanindividual gases alone (Amanatidou et al., 1999). In lettuce high O2 treatmentsled only to a slight inhibition of microbiological growth, while it did not effectsensory attributes.
5.8. Application of nitric oxide
Nitric oxide (NO) is a highly reactive free radical gas. Its production has longbeen associated with harmful effects on animals, plants and the ozone layer.However, extensive research in the past 10 years has found nitric oxide to havean important regulatory role in many human physiological systems and posthar-vest life of horticultural products (Leshem and Haramaty, 1996; Leshem, 2000).For example, it is reported that ethylene production in growing plants is regulatedby nitric oxide and conclusively might be involved in the inhibition of ethylenesynthesis in postharvest. Studies on the effect of nitric oxide (1–10 µL L–1) on 40types of fruits, vegetables and flowers had shown an increase in an extention of shelf
434 S. Huyskens-Keil and M. Schreiner
life (Wills et al., 2002). However, further investigations are required to determinethe mode of action of nitric oxide and its application in postharvest.
In conclusion, research and development efforts are aimed at improving existingtechnologies and testing new ideas for possible alternatives to current postharvesttechnological procedures. Major topics comprises of e.g. the reduction of quanti-tative and qualitative losses due to chilling injury of chilling-sensitive commodities,the replacements of chemicals used for control of physiological disorders and decay-causing pathogens, expanded use of film wrapping and edible coatings which mightreplace waxing, extended use of MA packaging for fresh, half prepared, convenience-products under safe and hygienic controlled conditions (Kader, 1983; Aylesworth,1992). However, future research fields should also focus on a better understandingof the mode of action of postharvest technologies on product physiology in orderto improve technologies which are adapted to product physiological concerns toguarantee high sensory and nutritional quality products. Moreover, the harmoniza-tion of national and international regulations on the applications of postharvesttechnologies should receive more attention.
6. CONCLUSIONS AND FUTURE ASPECTS
Product quality has become an essential force leading to economic success in markets(Lidror and Prussia, 1993). Quality has been viewed from the standpoint of theproduct in terms of gentechnological modifications (Wehling, 2000), maturity(Nilsson, 2000) and grades and standards (Florkowski, 2000). It has been viewedfrom the standpoint of the consumer regarding the consumer requirements (Pecherand Von Oppen, 2000), food choice (Adani and McFie, 2000), quality limits inte-grating the concepts of quality and acceptability (Tijskens, 2000) and the consumeroriented purchase and consumption (Brückner and Auerswald, 2000; Florkowski,2000; Shewfelt, 2000). Therefore, consumer requirements are one of the most impor-tant benchmark for food quality. Thus, chain reversal in which the consumer hasbecome the starting point of quality evaluation has to be taken into considerationfor the quality management of horticultural products (Huyskens, 1996; Jongen,2000). This change in paradigm needs the knowledge of consumer requirementsto provide quality monitoring throughout the chain. Consumer do not separate andanalyse all of the individual quality attributes that may be contributing to theirperception of the quality of fruits and vegetables, and hereby, the human responseis a complex judgement of the provided quality. Therefore, a definition of productquality is an important item to translate consumer preferences into specific productcharacteristics that should be measured by reliable, rapid and non-destructivemethods.
These product characteristics are however influenced by various factors duringproduction, marketing and distribution. Plants integrate their individual environ-mental conditions into physiological responses (Beverly et al., 1993) leading tovarying contents of chemical quality compounds during plant development from ger-mination to senescence. Achieving the desired product quality product modulation
Quality Dynamics and Quality Assurance 435
is possible by the optimisation of the synthesis of sensory, nutritive and health-promoting compounds in plants via e.g. cultivation practices and biotechnology.In postharvest the optimisation of technological procedures being adapted to thespecific product physiological responses is an additional tool within the quality chainin order to achieve the overall aim of total quality management that meets consumerrequirements.
The single pre- and postharvest factors and their interaction effect the overallquality of fruit and vegetable products. Therefore in a first step, a comprehensiveknowledge of metabolic processes determining quality changes is an essential pre-requisite for estimating the quality dynamics. In a second step a new concept inwhich the consumer requirements as well as the technologies and research in pre-and postharvest have to be combined into an integrated chain management.Establishing effective chain management this interrelationship should receive moreattention. Another driving force for new integrated concepts is the changingconsumer requirements and consumer behaviour which will stimulate innovationsin food industry and new technologies in order to create suitable new products,e.g. minimally processed, convenience-products and functional foods.
REFERENCES
Abe, K., K. Yoshimura and K. Chachin (1996). Production of bitter compounds induced by ethylenetreatment in fresh-cut carrots and ist suppression by low O2 and/or high CO2 atmosphere. J. Japa.Soc. Hort. Sci. 65: 193–198.
Abeles, F. B., P. W. Morgan and M. E. Saltveit (1992). Ethylene in Plant Biology. Academic Press,Inc., p. 414.
Abbott, J. (1999). Quality measurement of fruits and vegetables. Postharvest Bio. Technol. 15: 207–225.
Abbott, J., R. Lu, B. Upchurch and R. Stroshine (1997). Technologies for nondestructive quality eval-uation of fruits and vegetables. Hortic. Rev. 20: 1–120.
Adani, Z. and H. MacFie (2000). Consumer preferences. In R. Shewfelt and B. Brückner (eds.), Fruitand vegetable quality: An integrated view. Technomic Publishing INC, Lancaster Pennsylvania USA,pp. 158–177.
Albrecht, J., H. Schafer and E. Zottola (1991). Relationship of total sulfur to initial and retained ascorbicacid in selected crucifererous and noncrucifererous vegetables. J. Food Sci. 55: 181–183.
Allende, A., L. Jacxsens, Devlieghere, J. Debevere and F. Artès (2000). Improving modified atmospherepackaging system for keeping quality of ready-to-eat-lettuce salad. In F. Artès, M. Gil, M. A. Conesa(eds.), Improving postharvest technologies of fruits, vegetables and ornamentals. IIR Conference,Murcia 2000, pp. 437–443.
Alt, D., H. Ladebusch und O. Melzer (1998). Düngen mit Phosphor, Kalium und Magnesium. Gemüse,Spezial 34: 2–7.
Amanatidou, A., E. J. Smid and L. G. M. Gorris (1999). Effect of elevated oxygen and carbon dioxideon the surface growth of vegetable-associated microorganisms. J. Appl. Microbiol. 86: 429–438.
Amanatidou, A., R. A. Slump, L. M. G. Gorris and E. J. Smid (2000). High oxygen and high carbondioxide modified atmospheres for shelf life extension of minimally processed carrots. J. Food Sci.65: 61–66.
Artes, F. and J. A. Martinez (1996). Influence of packaging treatment on the keeping quality of Salinaslettuce. Food Sci. Technol. 7: 664–668.
Auerswald, H., D. Schwarz, C. Kornelson, A. Krumbein and B. Brückner (1999). Sensory analysis, sugarand acid contentof tomato at different EC values of the Nutrient solution. Sci. Hort. 82: 227–242.
Aylesworth, J. (1992). Deliver quality. American Vegetable Grower 6: 19–20.
436 S. Huyskens-Keil and M. Schreiner

Barkai-Golan, R. (2001). Postharvest Diseases of Fruits and Vegetables. Development and control,Elsevier Sciences, Amsterdam, p. 432.
Beaudry, R. (1999). Effect of O2 and CO2 partial pressue on selected phenomena affectingfruit andvegetable quality. Postharvest Biol. Technol. 15: 293–300.
Baldwing, E. A. and M. Nisperos-Carriedo (1994). Edible films applied on fruits and vegetables. InEdible coatings and films to improve tood quality. Ed. Technomic.
Behboudian, M. and C. Tod (1995). Postharvest attributes of ‘Virosa’ tomato fruits produced in anenriched carbon dioxide environment. HortSci. 30: 490–491.
Bellon-Maurel, V., C. Vallat and D. Goffinet (1995). F.T.-I.R./ATR Spectrometer as At-line Sugar Sensorin Enzymatic Hydrolysis. Proceedings of the 1st IFAC/CIGR/EURAGENG/ISHS Workshop on‘Control Applications in Postharvest and Processing Technology (CAPPT’ 95)’. Ostende, Belgium,pp. 247–252.
Ben-Yehoshua, S. (2002). Effect of the postharvest physical treatments of heat and UV applicationson decay, chilling injury and resistance against pathogens of citrus and other fruits and vegeta-bles. Act Hort: in press.
Beverly, R., J. Latimer and D. Smittle (1993). Preharvest physiological and cultural effects on posthar-vest quality, In R. Shewfelt and S. Prussia (eds.), Postharvest handling: A system approach. Academicpress INC., San Diego, pp. 74–98.
Bickelmann, U. (2001). Vermarktungsnormen für Obst und Gemüse. Auswertungs- und Informa-tionsdienst für Ernährung, Landwirtschaft und Forsten e.V., Bonn, Germany, p. 101.
Bickelmann, U. (1996). Leitfaden für die Anwendung der EG-Qualitätsnormen für frische Obst, Gemüseund Citrusfrüchte. Rheinischer Landwirtschaftsverlag Bonn, Germany p. 108.
Bilyk, A. and G. Sapers (1985). Distribution of quercetin and kaempferol in lettuce, kale, chive,garlic chive, leek, horseradish, red radish, and red cabbage tissues. J. Agric. Food Chem. 33: 226–228.
Block, G., B. Patterson and A. Subar (1992). Fruit, vegetables, and cancer preventation: A review ofthe epidemiolocal evidence. Nutr. Cancer 18: 1–29.
Bodnaryk, R. (1994). Potent effect of jasmonates on indole glucosinolates in oilseed rape and mustard.Phytochem 35: 301–305.
Böttcher, H. (1996). Frischhaltung und Lagerung von Gemüse. Eugen Ulmer, Stuttgart, Germany,p. 252.
Brower, V. (1998). Neutraceuticals: Poised for a healthy slice of the healthcare market? Nat. Biotechnol.16: 728–731.
Brückner, B. and H. Auerswals (2000). Accetability of tomatoes defined by sensory attributes andconsumer segment. In W. Florkowski, S. Prussia and R. Shewfelt (eds.), Integrated view of fruitand vegetable quality. Technomic Publishing Co., Inc. Lancaster, pp. 229–240.
Brückner, B., H. Auerswald and I. Schonhof (1998). Qualitätserwartungen an Gemüse seitens derVerbraucher. Bornimer Agrartechnische Berichte 18: 137–147.
Brückner, B., I. Schonhof, W. Florkowski, H. Auerswald and B. Röger (1998). Qualitätserwartungenan Gemüse seitens der Konsumenten. Aid 3474/97: 128–138.
Brummell, D. A., W. J. Howie, C. Ma and P. Dunsmuir (2002). Postharvest fruit quality of trangenictomatoes suppressed in expression of a ripening-related expansin. Postharvest Biol. Technol. 25(2):209–220.
Cantos, E., C. Garcia-Viguera, S. de Pascual-Teresa and F. Tomas-Barberan (2000). Effect of posthar-vest ultraviolet irradiation on reveratrol and other phenolics of cv. Napoleon table grapes. J. Agric.Food Chem. 48: 4606–4612.
Charles, M. T., R. Corcuff, D. Roussel and J. Arul (2002). Effect of maturity and storage conditionson rishitin accumulation and disease resistance to Botrytis cinerea in UV-C treated tomato. ActaHort.: in preparation.
Chong, C. and L. Berard (1983). Changes in glucosinolates during refrigerated storage of cabbage.J. Amer. Soc. Hort. Sci. 108: 688–691.
Clinton, S. (1998). Lycopene: Chemestry, biology and implications for human health and disease.Nutr. Rev. 56: 35–51.
Clydesdale, F., R. Gover and C. Fungardi (1992). The effect of color on thirst quenching, sweetness,acceptability and flavor intensity in fruit punch flavored beverages. J. Food Qual. 15: 19–38.
Quality Dynamics and Quality Assurance 437

Crozier, A., M. Lean, M. McDonald and C. Black (1997). Quantitative analysis of the flavonoidcontent of commercial tomatoes, onions, lettuce, and celery. J. Agric. Food Chem. 45: 590–595.
Daveby, Y., P. Aman, J. Betz, S. Musser and W. Obermeyer (1997). The variation in content and changesduring development of soyasaponin in dehulled swedish peas (Pisum sativum L.). J. Sci. Food Agric.73: 391–395.
De Jagger, A. and F. Roelofs (1996). Prediction of optimum harvest date of Jonagold. In A. De JagerA., D. Johnson and E. Höhn (eds.), Determination and prediction of optimum harvest date ofapples and pears. Proceedings of the working group COST 94: The postharvest treatment of fruitsand vegetables. Lofthus, Norway, pp. 21–32.
Delincée, H. (1996). Behandlung von Lebensmitteln mit ionisierenden Strahlen. Ernährungsbericht 1996.pp. 152–160.
Delwiche, M., H. Affeldt, G. Birth, G. Brown, D. Guyer, A. Hetzroni, K. Peleg and C. Thai (1993).Surface color measurement of fruits and vegetables. In American Society of Agricultural Engineers(eds.), Nondestructive technologies for quality evaluation of fruits and vegetables. Proceedings ofthe International Workshop United States-Israel binational agricultural research and developmentfund (BARD), Spokane, Washington, pp. 63–71.
Dick-Hennes, E. and H. Bünning-Pfaue (1992). Investigations of the influence of nitrogen andfertilization on the glucosinolate pattern of kohlrabi, cabbage, and radish. In P. Schreier and P.Winterhalter (eds.), Progress in flavour precursor studies. Alluerd publishing coporation, USA,pp. 185–188.
Dillard, C. and J. German (2000). Phytochemicals: Nutraceuticals and human health. J. Sci. FoodAgric. 80: 1744–1756.
Dorais, M., A. Papadopoulus and A. Gosselin (2001). Greenhouse tomato fruit quality. Hort. Reviews26: 239–319.
Drews, M., I. Schonhof und A. Krumbein (1995). Nitrat-, Vitamin C-, β-Carotin- und Zuckergehaltvon Kopfsalat im Jahresverlauf beim Anbau im Gewächshaus. Gartenbauwiss. 60: 180–187.
DuPont, M., Z. Mondin, G. Williamson and K. Price (2000). Effect of variety, processing, and storageon the flavonoid glycoside content and composition of lettuce and endive. J. Agric. Food Chem.48: 255–259.
Eccher-Zerbi, P., M. Grassi, S. Perego, G. Spada and C. Liverani (1996). Harvesting index of Comicepears by a multivariate method in relation to post-storage quality. In A. De Jager A., D. Johnsonand E. Höhn (eds.), Determination and prediction of optimum harvest date of apples and pears.Proceedings of the working group COST 94: The postharvest treatment of fruits and vegetables.Lofthus, Norway, pp. 157–164.
Eitenmiller, R. (1990). Strenght and weaknessess of assessing vitamin content in food. J. Food Qual.13: 7–20.
Erbersdobler, H. (2000). Wirkstoffe. In H. Erbersdobler und A. Meyer (eds.), Praxishandbuch func-tional food. B. Behr’s Verlag GmbH & Co Hamburg, pp. 1–14.
Elmadfa, I., W. Aign, E. Muskat, D. Fritzsche and H.-D. Cremer (1998). Die große GU Nährwert Tabelle.Gräfe und Unzer, München, Germany.
Esteve, M., R. Farre and A. Frigola (1995). Changes in ascorbic acid content of green asparagusduring the harvesting period and storage. J. Agric. Food Chem. 43: 2058–2061.
Evers, A. (1994). The influence of fertilization and environment on some nutrionally importantquality criteria in vegetables – a review of research in the nordic countries. Agric. Sci. Finland 3:177–187.
Ezell, B. and M. Wilcox (1959). Loss of vitamin C in fresh vegetables as related to wilting and tem-perature. J. Agric. Food Chem. 7: 507–509.
Fahey, J., Y. Zhang and P. Talalay (1997). Broccoli sprouts: An exceptionally rich source of inducersof enzymes that protect against chemical carcinogens. Proc. Natl. Acad. Sci. USA 94: 1367–1372.
Farr, S. B. and T. Kogoma (1991). Oxidative stress responses in Escherischia coli and Salmonellatyphimurium. Microbiol. Rev. 55: 561–585.
Feller, C., M. Fink, A. Maynac, P. Paschold, H.-C. Scharpf, J. Schlaghecken, K. Strohmeyer,U. Weyer and J. Ziegler (2001). Düngung im Freilandgemüsebau. Schriftenreihe des Instituts fürGemüse- und Zierpflanzenbau Großbeeren/Erfurt e. V. Heft 4.
Fekete, A. (1994). Quality parameters of fruits and vegetables. Acta Hort. 368: 199–206.
438 S. Huyskens-Keil and M. Schreiner
Fekete, A. and J. Felföldi (1994). Firmness testers for fruits and vegetables. Acta Hort. 368: 206–212.Fenwick, G., R. Heany and W. Mullin (1982). Glucosinolates and their breakdown products in food
and food plants. CRC Critical Reviews in Food Sciences and Nutrition 18: 123–201.Fink, M. und H.-C. Scharpf (1992). Dünger-Dosierung im Freilandgemüsebau, Entscheidungsunter-
stützung durch N-Expert. Deutscher Gartenbau 46: 1688–1699.Fischer, G., P. Lüdders und F. Gallo (1997). Qualitätsveränderungen der Kapstachelbeere während
der Fruchtreifung. Erwerbsobstbau 39: 153–156.Flamme, W. and G. Jansen (1999). Analyse der Getreide- und Stärkequalität mittels NIR- und
Farbmessung. Deutsche Gesellschaft für Qualitätsforschung e.V. (DGQ). XXXIV. Vortragstagung‘Zerstörungsfreie Qualitätsanalyse’, Freising-Weihenstephan, Germany, pp. 25–42.
Florkowski, W. (2000). Economics of quality. In W. Florkowski, S. Prussia and R. Shewfelt (eds.),Integrated view of fruit and vegetable quality. Technomic Publishing Co., Inc. Lancaster, pp.227–245.
Forsa (1997). Die Deutschen und ihre Ernährung. Was werden wir übermorgen essen? p. 8.Fraser, P., S. Romer, C. Shipton, P. Mills, J. Kiano, N. Misawa, R. Drake, W. Schuch and P. Bramley
(2002). Evaluation of Transgenic Tomato Plants Expressing an Additional Phytoene Synthase in aFruit-specific Manner. Proceedings of the national academy of sciences of the united states ofAmerica 99, pp. 1092–1097.
Fraser, P., S. Romer, J. Kiano, C. Shipton, P. Mills, R. Drake, W. Schuch and P. Bramley (2001).Elevation of carotinoids in tomato by genetic manipulation. J. Sci. Food Agri. 81: 822–827.
Frewer, L., C. Howard and J. Aaron (1998). Consumer acceptance of transgenic crops. Pestic. Sci.52: 388–393.
Funamoto, Y., N. Yamauchi, T. Shigenaga and M. Shigyo (2002). Effects of heat treatment on chloro-phyll degrading enzymes in stored broccoli (Brassica oleracea L.). Postharvest Biol. Technol. 24(2):163–170.
Geyer, M., M. Linke and W. Herppich (1999). Nicht-destruktive Verfahren zur Bestimmung desWasserstandes als Ausdruck der Frische von Gemüse. Deutsche Gesellschaft für Qualitätsforschunge.V. (DGQ). XXXIV. Vortragstagung ‘Zerstörungsfreie Qualitätsanalyse’, Freising-Weihenstephan,Germany, pp. 131–142.
Gil, M., D. Holcroft and A. Kader (1997). Changes in strawberry anthocyanins and other polyphenolsin response to carbon dioxide treatment. J. Agric. Food Chem. 45: 1662–1667.
Gil, M., C. Garcia-Viguera, F. Artes and F. Tomas-Barberan (1995). Changes in pomegranate juicepigmentation during ripening. J. Sci. Food Agric. 68: 77–81.
Goodwin, T. and M. Jamikorn (1952). Biosynthesis of carotenes in ripening tomatoes. Nature 170:104–105.
Goroni, G. and A. Testoni (1990). The relation between color and quality of vegetables. Acta Hort.259: 141–167.
Groenevelt, M. (1998). Funktionelle Lebensmittel: Defnitionen und lebensmittelrechtliche Situation.Ernährungs-Umschau 45: 156–161.
Gross, J. (1991). Pigments in Vegetables. Van Nostrand Reinhold, New York, p. 351.Grubben, G. J. H. (1978). Tropical Vegetables and their Genetic Resources. International Board for
Plant Genetic Resources, FAO-UN, Rome, Italy.Haase, N. U., L. Weber and B. Putz (1999). Kartoffelerzeugnisse und Kartoffelstärke – Qualitätsbe-
wertung mittels Nahinfrarot-Spektroskopie. Deutsche Gesellschaft für Qualitätsforschung e.V. (DGQ).XXXIV. Vortragstagung ‘Zerstörungsfreie Qualitätsanalyse’, Freising-Weihenstephan, Germany, pp.67–72.
Hagenmaier, R. D. (2002). The flavor of mandarin hybrids with different coatings. Postharvest Biol.Technol. 24(1): 79–88.
Hagenmaier, R. D. (2000). Evaluation of a polyethylene-candelilla coating for ‘Valencia’ oranges.Postharvest Biol. Technol. 2: 147–154.
Halcroft, D., M. Gil and A. Kader (1998). Effect of carbon dioxide on anthocyanins, phenylalanineammonia lyase and glucosyl-transferase in the arils of stored pomegranates. J. Am. Soc. Hort. Sci.123: 136–140, 98.
Hall, R., R. Bino and J. Ketelaars (2000). Plants for Food and Non-food – A New Approach. Annualreport of Plant research International, pp. 14–15.
Quality Dynamics and Quality Assurance 439

Hansen, M., P. Moller and H. Sorensen (1995). Glucosinolates in Broccoli stored under controlled atmos-phere. J. Amer. Soc. Hort. Sci. 120: 1069–1074.
Hardenburg, R., A. Watada and C. Wang (1990). The Commercial Storage of Fruits, Vegetables, andFlorist and Nursery Stocks. Agriculture Handbook No 66, United States Department of Agriculture,p. 130.
He, H., G. Fingerling und W. Schnitzler (2000). Jahreszeitlicher Variation der Gucosinolatgehalte inBrassica campestris L. ssp. chinensis. J. Appl. Bot. 74: 198–202.
Herrmann, K. (2001). Inhaltsstoffe von Obst und Gemüse. Verlag Eugen Ulmer, Stuttgart, Germany,p. 200.
Herrmann, K. (1991). Vorkommen, Gehalte und Bedeutung von Inhaltsstoffen des Obstes und Gemüses.II. Flavonoide: Catechine, Proanthocyanide, Anthocyanide. Die industrielle Obst- und Gemüsever-wertung 5–6: 170–175.
Herman, K. (1988). On the occurence of flavonols and flavone glycosides in vegetables. Z. Lebensm.Unters. Forsch. 186: 1–5.
Herppich, W. B. and H. Mempel (1999). Wasserzustand und mechanische Eigenschaften vonMöhren: Einfluss der Lagerung bei unterschiedlichen Luftfeuchten. Deutsche Gesellschaft fürQualitätsforschung e.V. (DGQ). XXXIV. Vortragstagung ‘Zerstörungsfreie Qualitätsanalyse’,Freising-Weihenstephan, Germany, pp. 143–148.
Hertog, M., P. Hollmann and M. Katan (1992). Content of potentially anticancerogenic flavonoids of28 vegetables and 9 fruits commonly consumed in the Netherlands. J. Agric. Food Chem. 40:2379–2383.
Heß, D. (1999). Pflanzenphysiologie. Verlag Eugen Ulmer, Stuttgart, Germany, p. 608.Heyes, J., F. Blaikie, C. Downs and D. Sealey (1994).Textural and physiological changes during
pepino (Solanum muricatum Ait.) ripening. Sci. Hort. 58: 1–15.Hirayama, T. (1990). Life-style and Mortality. Contributions to epidemiology and biostatistic Vol. 6,
Basel.Höhn, E., D. Dätwyler and F. Gasser (1996). Maturity indices to predict optimum harvest date for
the storage of Conference pears in Switzerland. In A. De Jager A., D. Johnson and E. Höhn (eds.),Determination and prediction of optimum harvest date of apples and pears. Proceedings of theworking group COST 94: The postharvest treatment of fruits and vegetables. Lofthus, Norway,pp. 149–156.
Holland, N., H. C. Menezes and M. T. Lafuente (2002). Carbohydrates as related to the heat-inducedchilling tolerance and respiratory rate of ‘Fortune’ mandarin fruit harvested at different maturitystages. Postharvest Biol. Technol. 25(2): 181–192.
Holland, B., A. Welch, I. Unwin, D. Buss, A. Paul and D. Southgate (1991). McCane and Widdowson’sthe Composition of Foods. Royal Society of Chemistry, Cambridge, UK.
Hollander, B. und H. Krug (1991). Wirkungen hoher CO2-Konzentrationen auf Gemüsearten. I.Symptome, Schadbereiche und Artenreaktionen. Gartenbauwiss 56: 193–205.
Hoppe, L., M. Bahadir, S. Haneklaus and E. Schnug (1996). Sulphur supply and alliin content ofAllium species. Tagungsband zur 31. Tagung der Deutschen Gesellschaft für Qualitätsforschung,Kiel, pp. 189–198.
Howe, G., T. Hirohata, T. Hislop, J. Iscovich, J. Yuan, K. Katsouyanni, F. Lubin, E. Marubini,B. Modan, T. Rohan, P. Toniolo and Y. Shunzhang (1990). Dietary factors and risk of breastcancer: Combined analysis of 12 case-control studies. J. Nat. Cancer Inst. 82: 561–569.
Huyskens-Keil, S. and R. Kadau (2001). Postharvest Quality Dynamics of Fresh-Cut Asparagus(Asparagus officinalis L.) in different film packaging. Acta Hort (in press).
Huyskens-Keil, S., M. Schreiner and C. Ulrichs (2001). Cell wall carbohydrate metabolism of perish-able vegetables in pre- and postharvest. Acta Hort. 553: 201–203.
Huyskens-Keil, S., M. Schreiner, H. Widayat, P. Peters and P. Lüdders (2000a). Physiologicalchanges of Pepino (Solanum muricatum Ait.) during maturation and ripening. Acta Hort. 531:251–256.
Huyskens-Keil, S., M. Schreiner, H. Prono-Widyat and P. Peters (2000b). Effect of surface coatingand film packaging on the keeping quality of solanaceous crops. Acta Hort. 553: 621–626.
Huyskens, S. (1996). Qualität von Obst und Gemüse – Möglichkeiten und Grenzen einer integralenBewertung. Bornimer Agrartechnische Berichte 8: 9–15.
440 S. Huyskens-Keil and M. Schreiner

Igbasan, F., W. Guenter, T. Warentin and D. McAndrew (1996). Protein quality of peas as influencedby location, nitrogen application and seed inoculation. Plant Foods Human Nut. 49: 93–105.
Ikediala, J. N., J. Tang, J. Hansen, S. R. Drake and S. Wang (2002). Quarantine treatment of fruitsusing radio frequenzy energy and ionic-water-immersion technique. Postharvest Biol. Technol. 21:129–145.
Ishikura, N. and K. Hayashi (1966b). Studies on anthocyanins. LII. Fate of 14C-labeled amino acidsadministered to the seedlings of red radish with special regard to anthocyanin biosynthesis. Bot. Mag.79: 79–156.
Ishikura, N. and K. Hayashi (1966a). Anthocyanins. LIII. Incorporation of leucine-14C into the mol-ecular framework of anthocyanin appearing in red radish. Bot. Mag. 79: 157–308.
Islam, M. and S. Kan (2000). Changes in quality characteristics of three tomato cultivars maturing atseven different sowing times. Trop. Agric. 77: 236–243.
Islam, M., T. Matsui and Y. Yoshida (1995). Effect of preharvest carbon dioxide enrichment on thepostharvest quality of tomatoes. J. Japan. Soc. Hort. Sci. 64: 649–655.
Jacxsens, L., F. Devlieghere, C. van der Stehen and J. Debevere (2001). Effect of high oxygen modifiedatmosphere packaging on microbial growth and sensorial qualities of fresh-cut produce. Intern. J.Food Microbiol. 71: 197–210.
Janse, J. and M. Schols (1992). Specific Temperature and Transpiration Effects on the Flavor ofTomatoes. Ann. Rep. Glasshouse crops research station. Naaldwijk, Netherlands, pp. 39–40.
Jellinek, G. (1985). Sensory Evaluation of Food. VCH Weinheim, p. 429.Jobling, J. J., B. D. Patterson, S. Moradi and D. Joyce (1997). A non-destructive method for mea-
suring the water potential of fruits and vegetables. Postharvest Biol. Technol. 10(1): 1–8.Johnson, D. and M. Luton (1996). Maturity indices to predict optimum harvest date for the storage of
Conference pears in the UK. In A. De Jager A., D. Johnson and E. Höhn (eds.), Determinationand prediction of optimum harvest date of apples and pears. Proceedings of the working group COST94: The postharvest treatment of fruits and vegetables. Lofthus, Norway, pp. 133–148.
Jongen, W. (2000). Food supply chains: From productivity toward quality. In R. Shewfeld andB. Brückner (eds.), Fruit and vegetable quality: An integrated view. Technomic Publishing INC,Lancaster Pennsylvania USA, pp. 3–20.
Jones, R. and S. Scott (1983). Improvement of tomato flavor by genetically increasing sugar and acidcontents. Euphytica 32: 845–855.
Kader, A. A. (2002). Postharvest Technology of Horticultural Crops. University of California, Divisionof Agriculture and Natural Resources, Publication No. 3311, p. 535.
Kader, A. A. (2001). Quality assurance of harvested horticultural perishables. Acta Hort 553: 51–55.Kader, A. A. and S. Ben-Yehoshua (2000). Effects of superatmospheric oxygen levels on postharvest
physiology and quality of fresh fruits and vegetables. Postharvest Biol. Technol. 1: 1–13.Kader, A. A. (1999). Fruit maturity, ripening, and quality relationship. Acta Hort. 485: 203–208.Kader, A. A. (1997). A summary of CA requirements and recommendations for fruits other than
apples and pears. CA’97 Proceedings Volume 2: Fruits other than Apples and Pears. Universityof California, Davis. Postharvest Hort Series 17: 1–34.
Kader, A. A. (1988). Influence of preharvest and postharvest environment on nutritional compositionof fruits and vegetables. Proceedings of the 1st international symposium on horticulture and humanhealth, pp. 18–32.
Kader, A. A. (1986). Biochemical and physiological basis for effects of controlled and modifiedatmospheres on fruits and vegetables. Food Technol. 40(5): 90–100, 102–104.
Kader, A. A. (1985). Ethylene-induced senescence and physiological disorders in harvested horticul-tural crops. HortSci. 20: 54–57.
Kader, A. A. (1983). Influence of harvesting methods on quality of deciduous tree fruits. HortSci. 18:409–411.
Kalt, W. and M. Kushad (2000). The role of oxidative stress and antioxidants in plant and human health:introduction to the colloquium. HortSci. 35: 572.
Kalt, W., C. Forney, A. Martin and R. Prior (1999). Antioxidante capacity, vitamin C, phenolics andanthocyanins after fresh storage of samall fruits. J. Agric. Food Chem. 47: 4638–4644.
Kalt, W. and J. McDonald (1996). Chemical composition of lowbush blueberry cultivars. J. Amer.Hort. Sci. 121: 142–146.
Quality Dynamics and Quality Assurance 441
Kasmire, R. (1983). Influence of mechanical harvesting on quality of nonfruit vegetables. HortSci.18: 421–423.
Kays, S. (1991). Postharvest Physiology and Handling of Perishable Plant Products. Van Nostrand-Reinhold, New York, p. 532.
Kays, S. (1999). Preharvest factors affecting appearance. Postharvest Biol. Technol. 15: 233–247.Kawano, S. (1999). Non-destructive Methods for Quality Analysis – Especially for Fruits and Vegetables.
34. Vortragstagung der Deutschen Gesellschaft für Qualitätsforschung: ZerstörungsfreieQualitätsanalyse, Freising-Weihenstephan, Germany, pp. 5–12.
Keta, S., W. Imsabai, W. G. van Doorn (2002). Firmness and cell wall hydrolase activities in heat-treated durian fruit. Acta Hort.: in preparation.
Kim, J. G., A. E. Yousef, S. Davies (1999). Application of ozone for enhancing the microbiologicalsafety and quality of foods: A review. J. Food Protection 62: 1071–1087.
Kim, S. B. and C. S. Kim (1989). Effect of phenolic compounds on the resistance against apple rot.Studies on pathogenity and ecology of apple rot caused by Botryosphaeria dothidea. Kor. J. Hort.Sci. 30: 285–293.
Krumbein, A. and H. Auerswald (1998). Characterization of aroma volatiles in tomatoes by sensoryanalyses. Nahrung 42 (6): 395–399.
Krumbein A. and H. Auerswald (1999). Aroma volatiles in tomato varieties – instrumental, sniffingand quantitative decriptive analysis. In P. Schieberle and K.-H. Engel (eds.), Frontiers of flavourscience. WB-Druck GmbH Rieden am Forggensee, Germany, pp. 51–55.
Krumbein, A. und I. Schonhof (1999). Variationsbreite von Vitamin C und sekundären Inhaltsstoffenin Brokkoli. Proceedings of the 7th Symposium on Vitamine und Zusatzstoffe in der Ernährungvon Mensch und Tier. Jena, pp. 346–349.
Krumbein, A., I. Schonhof, J. Rühlmann and S. Widell (2001). Influence of sulphur and nitrogensupply on flavour and health-affecting compounds in Brassicaceae. In W. Horst (ed.), Plant nutri-tion – food security and sustainability of agro-ecosystems. Kluwer Academic Publishers, Netherlands,pp. 294–295.
Kupferman, E. (1997). Controlled atmosphere storage of apples. CA’97 Proceedings Volume 2: Applesand Pears. University of California, Davis. Postharvest Hort. Series 16: 1–30.
Lawless, H. (1995). Dimensions of sensory quality – a critique. Food Qual. Pref. 6: 191–199.Lee, S. and A. Kader (2000). Preharvest and postharvest factors influencing vitamin C content of
horticultural crops. Postharvest Biol. Technol. 20: 207–220.Lee, S. K., R. E. Young, P. M. Schiffman and C. W. Coggins (1983). Maturity studies on avocado
fruit based on picking dates and dry weight. J. Am. Soc. Hort. Sci. 108: 390–394.Lennernäs, M., C. Fjellström, I. Giachetti, A. Schmitt, A. Remaut de Winter and M. Kearny (1997).
Influences on food choice perceived to be important by nationally-representative samples of adultsin the European union. Eur. J. Clin. Nutr. 51: 8–15.
Lesage, P. and M. F. Destain (1996). Measurement of tomato firmness by using a non-destructivemechanical sensor. Postharvest Biol. Technol. 8: 45–55.
Leshem, Y. Y. (2000). Nitric Oxide in Plants: Occurence, Function and Use. Kluwer Academic Press,Dordrecht.
Leshem, Y. Y. and E. Haramaty (1996). The characterization and contrasting effects of the nitricoxide free radical in vegetative stress and senescence of Pisum sativum Linn. Foliage. J. PlantPhysiol. 148: 258–263.
Lewis, J. and G. Fenwick (1987). Glucosinolate content of Brassica vegetables: analysis of twenty-four cultivars of calabrese (green sprouting broccoli, Brassica oleracea L. var. botrytis subvar. cymosaLam.). Food Chem. 25: 259–268.
Li, P. and M. Barth (1998). Impact of edible coatings on nutritional and physiological changes in lightly-processed carrots. Postharvest Biol. Technol 14: 51–60.
Lidror, A. and S. Prussia (1993). Quality management: An industrial approach to produce handling,In R. Shewfelt and S. Prussia (eds.), Postharvest handling: A system approach. Academic press INC.,San Diego, pp. 277–293.
Lidster, P. D., P. D. Hilderbrand, L. S. Brard and S. W. Porritt (1988). Commercial Storage of Fruitsand Vegetables. Can. Dept. Agric. Publ., p. 88.
442 S. Huyskens-Keil and M. Schreiner
Litzenroth, H. (1995). Dem Verbraucher auf der Spur – quantitative und qualitative Konsumtrends. GFKMarktforschung Jahrbuch der Absatz- und Verbrauchsforschung 41: 255–261.
Lurie, S. (1999). Postharvest heat treatments of horticultural crops. Hort. Rev. 22: 91–121.Lurie, S. (1998). Postharvest heat treatment. Postharvest Biol. Technol. 14: 257–269.Malundo, T. (1996). Application of the Quality Enhancement (QE) Approach to Mango (Mangifera
indica L.). Flavor Research, University of Georgia, p. 134.Mancinelli, A. and I. Rabino (1984). Photoregulation of anthocyanin synthesis. X. Dependence of
photosynthesis of high irradiance anthocyanin synthesis in Brassica oleracea leaf disk on Spirodelapolyrrhiza. Plant Cell Physiol. 25: 1153.
Marschner, H. (1995). Mineral Nutrition of Higher Plants. Academic press, London, p. 889.Marquenie, D., C. W. Michiels, A. H. Geeraerd, A. Schenk, A. Soontjens, J. F. Van Impe and B. M.
Nicolai (2002). Using survival analysis to investigate the effect of UV-C and heat treatment onstorage rot of strawberry and sweet cherry. Intern. J. Food Microbiol. 73(2–3): 191–200.
Martinsen, P. and P. Schaare (1998). Measuring soluble solids distribution in kiwifruit using near-infraredspectroscopy. Postharvest Biol. Technol. 14(3): 271–282.
Mattheis, J. and J. Fellmann (1999). Preharvest factors influencing flavor of fresh fruit and vegeta-bles. Postharvest Bio. Technol. 15: 227–232.
Mayer, U and D. Treutter (1998). Flavonols as defence barriers in apple leaves against the apple scabfungus, Venturia inaequalis. Acta Hort. 466: 79–82.
McDanell, R., A. McLean, A. Hanley, R. Heany and G. Fenwick (1988). Chemical and biologicalproperties of indole glucosinolates (glucobrassicins): A review. Food Chem. Toxic. 26: 59–70.
McGlone, V. A., R. B. Jordan and P. J. Martinsen (2002). Vis/NIR estimation at harvest of pre- andpost-storage quality indices for Royal Gala apple. Postharvest Biol. Technol. 25(2): 135–144.
Mitcham, E., F. Mitchell, M. Arpaia and A. Kader (2002). Postharvest treatments for insect control.In A. Kader (ed.), Postharvest technology of horticultural crops. University of California Publ. 3311,pp. 251–258.
Mizrahi, Y., E. Taleisnik, V. Kagan-Zur, R. Offenback, E. Matan and R. Golan (1988). A saline irri-gation regime for improving tomato fruit quality without reducing yield. J. Amer. Soc. Hort. Sci.113: 202–205.
Molnar, P. (1995). A model for overall description of food quality. Food Qual. Pref. 6: 185–190.Monnot, P. (1990). Internal product quality as a marketing instrument. Acta Hort. 259: 25–31.Moskowitz, H. (1994). Food Concepts and Products: Just-in-time Development. Food and Nutrition
Press, Trumbull, CT.Morris, J. (1990). Fruit and vegetable harvest mechanization. Food Technol. 44: 97–101.Mozafar, A. (1996). Decreasing the NO3 and increasing the vitamin C contents in spinach by a nitrogen
deprivation method. Plant Foods Human Nut. 49: 155–162.Müller, H. (1995). Neubestimmung und Bewertung der Folsäuregehalte von ausgewählten Lebensmitteln
pflanzlicher und tierischer Herkunft. Ernährungs-Umschau 42: 170–174.Muramatsu, N., N. Sakurai, N. Wada, R. Yamamota and T. Takahara (1999). Evaluation of fruit tissue
texture and internal disorders by laser doppler detection. Postharvest Biol. Technol. 15(1):83–88.
Murray, A. J., C. R. Bird, W. W. Schuch and G. E. Hobson (1995). Evaluation of the transgenictomato fruit with reduced polygalacturonase activity in combination with the rin mutation. PostharvestBiol. Technol. 6: 91–101.
Musk, S. and I. Johnson (1993). In vitro studies into toxicity of allyl isothyiocyanate towards trans-formed human tumor cells. In K. Waldron, I. Johanson and G. Fenwick (eds.), The royal societyof chemistry, pp. 286–289.
Nagy, S. and W. Wardowski (1988). Effects of agricultural practices, handling and storage on fruits,In E. Karmas and R. Harris (eds.), Nutritional evaluation of food processing. Van Nostrand Reinhold,New York, pp. 73–100.
Nanda, S., D. Sudhakar Rao and S. Krishnamurthy (2001). Effect of shrink film wrapping and storagetemperature on the shelf life and quality of pomegranate fruits cv. Ganesh. Postharvest Biol. Technol.22: 61–69.
Nielson, M., H. J. Martens and K. Kaack (1998). Low frequency ultrasonics for texture measure-
Quality Dynamics and Quality Assurance 443

ments in carrots (Daucus carota L.) in relation to water loss and storage. Postharvest Biol. Technol.14(3): 297–308.
Nilsson, T. (2000). Postharvest handling and storage of vegetables. In W. Florkowski, S. Prussia andR. Shewfelt (eds.), Fruit and vegetable quality: An integrated view. Technomic Publishing INC,Lancaster Pennsylvania USA, pp. 96–121.
Nugon-Baudon, L. and S. Rabot (1994). Glucosinolates and glucosinolate derivates: Implications forprotection against chemical carcinogenesis. Nutr. Res. Rev. 7: 205–231.
Nunes, M., J. Brecht, A. Morais and S. Sargent (1998). Controlling temperature and water loss tomaintain ascorbic acid in strawberries during postharvest handling. J. Food Sci. 63: 1033–1036.
Nunes, M., J. Brecht, A. Morais and S. Sargent (1995). Physical and chemical quality characteristicsof strawberries after storage are reduced by a short delay to cooling. Postharvest Biol. Technol. 6:17–28.
O’Donoghue, E., S. Somerfield, L. de Vré and J. Heyes (1997). Developmental and ripening-relatedeffects on the cell wall of pepino (Solanum muricatum) fruit. J. Sci. Food Agric. 73: 455–463.
Olmo, M., A. Nadas and J. M. Garcia (2000). Nondestructive methods to evaluate maturity level oforanges. J. Food Sci. 65(2): 365–369.
Ophius, P. and H. van Trijp (1995). Perceived quality. A market driven and consumer oriented approach.Food Qual. Pref. 6: 177–183.
Oshita, S., Y. Kawagoe, Y. Seo and A. Hashimoto (1995). Control of the State of Intracellular Waterfor High Quality Storage. Proceedings of the 1st IFAC/CIGR/EURAGENG/ISHS Workshop on‘Control Applications in Postharvest and Processing Technology (CAPPT’ 95)’. Ostende, Belgium,pp. 241–246.
Osterloh, A., G. Ebert, W. Held, H. Schulz und E. Urban (1996). Lagerung von Obst und Südfrüchten.Verlag Eugen Ulmer Stuttgart, Germany, p. 253.
Oyama, H., Y. Skinohara and T. Ito (1999). Effects of air temperature and light intensity on β-caroteneconcentration in spinach and lettuce. J. Japan. Soc. Hort. 68: 414–420.
Palou, L., C. H. Crisosto, J. L. Smilanick, J. E. Adaskaveg and J. P. Zoffoly (2002). Effects of con-tinuous 0.3 ppm ozone exposure on decay development and physiological responses of peachesand table grapes in cold storage. Postharvest Biol. Technol. 24: 39–48.
Paschold, P., J. Kleber, S. Adam, A. Bognar und B. Tauscher (2000). Einfluss von Bewässerung undN-Düngung auf Ertrag und Sulforaphangehalt von Brokkoli (Brassica oleracea). Tagungsband zur35. Tagung der Deutschen Gesellschaft für Qualitätsforschung, Karlsruhe, Germany, pp. 57–66.
Paul, R. (1999). Effect of temperature and relative humidity on fresh commodity quality. PostharvestBiol. Technol. 15: 263–277.
Pecher, S. and M. von Oppen (2000). Consumer preferences and breeding goals. In R. Shewfeld andB. Brückner (eds.), Fruit and vegetable quality: An integrated view. Technomic Publishing INC,Lancaster Pennsylvania, USA, pp. 43–64.
Peleg, K. (1993). Multi sensor adaptive sorting of fruits and vegetables. In American Society ofAgricultural Engineers (ed.), Nondestructive technologies for quality evaluation of fruits and vegetables. Proceedings of the International Workshop United States-Israel binational agriculturalresearch and development fund (BARD), Spokane, Washington, pp. 111–147.
Peryam, D. and F. Pilgrim (1957). Hedonic scale method for measuring food preferences. FoodTechnology 11: 568–570.
Picton, S. and D. Grierson (1988). Inhibition of expression of tomato-ripening genes at high temper-ature. Plant Cell Environment 11: 265–272.
Popp, F.-A. (1999). ‘Biophotonik’ als nicht-invasive ‘ganzheitliche’ Methode zur Qualitätsanalytik.Deutsche Gesellschaft für Qualitätsforschung e.V. (DGQ). XXXIV. Vortragstagung ‘ZerstörungsfreieQualitätsanalyse’, Freising-Weihenstephan, Germany, pp. 237–248.
Praeger, U., T. M. Onggo and J. Weichmann (1999). Unterscheidung der Stressempfindlichkeit vonEinlegegurkensorten mittels Atmungs- und Ethenmessung. Deutsche Gesellschaft fürQualitätsforschung e.V. (DGQ). XXXIV. Vortragstagung ‘Zerstörungsfreie Qualitätsanalyse’,Freising-Weihenstephan, Germany, pp. 119–130.
Price, K., J. Bacon and M. Rhodes (1997). Effect of storage and domestic processing on the contentand composition of flavonol glucosides in onion (Allium cepa). J. Agric. Food Chem. 45: 938–942.
Prussia, S. (2000). Methods and examples of integration. In R. Shewfeld and B. Brückner (eds.), Fruit
444 S. Huyskens-Keil and M. Schreiner
and vegetable quality: An integrated view. Technomic Publishing INC, Lancaster Pennsylvania, USA,pp. 267–284.
Puiupol, L., M. Behboudian and K. Fisher (1996). Growth, yield, and postharvest attributes of glasshousetomatoes produced under deficit irrigation. HortSci. 31: 926–929.
Purwadaria, H. K., I. W. Budiastra and D. Saputra (1995). Near Infrared Reflectance Testing to PredictSucrose and Malic Acid Concentrations of Mangoes. Proceedings of the 1st IFAC/CIGR/EURAGENG/ISHS Workshop on ‘Control Applications in postharvest and Processing Technology(CAPPT’ 95)’. Ostende, Belgium, pp. 253–258.
Rechkemmer, G. (2001). Funktionelle Lebensmittel – Zukunft der Ernährung oder Marketing-Strategie.Forschungsreport Sonderheft, pp. 12–15.
Reid, M. (2002). Maturation and maturity indeces. In A. Kader (ed.), Postharvest technology of hor-ticultural crops. University of California, Division of Agriculture and Natural Resources, PublicationNo. 3311, pp. 55–62.
Reid, M. (2002). Ethylene in postharvest technology. In A. A. Kader (ed.), Postharvest technology ofhorticultural crops. University of California, Division of Agricultural and Natural Resources.Publication No. 3311, pp. 55–62.
Reid, M. and M. Serek (1999). Guide to Food Transport – Controlled Atmosphere. Mercantila Publishers,Copenhagen, Denmark, p. 153.
Reid, J., D. Winfield, I. Sorenson and A. Kale (1996). Water deficit, root demography, and the causesof internal blackening in field-grown tomatoes. Ann. Appl. Biol. 129: 137–149.
Reid, M. (1995). Ethylene in plant growth, development, and senescence. In P. Davies (ed)., Planthormones, 2nd edition. Kluver, Dordrecht, pp. 486–508.
Roberts, J. and G. Tucker (1985). Ethylene and Plant Development. Butterworth, London, p. 416.Robinson, C. (1997). Genetically modified foods and consumer choice. Trends Food Sci. Tech. 8:
84–88.Rosa, E., R. Heany, C. Portas and G. Fenwick (1996). Changes in glucosinolate concentrations in
Brassica crops (B. oleracea and B. napus) throughout growing seasons. J. Sci. Food Agric. 71:237–244.
Rosa, E. and R. Heany (1993). The effect of cooking and processing on the glucosinolate content: Studieson four varieties of portuguese cabbage and hybrid white cabbage. J. Sci. Food Agric. 62: 259–265.
Rosati, C., R. Aquilani, S. Dharmapuri, P. Pallata, C. Marusic, R. Gavazza, F. Bouvier, B. Camaraand G. Giuliano (2000). Metabolic engineering of beta-carotene and lycopene content in tomato fruit.Plant J. 24: 413–419.
Rosenfeld, H., R. Samuelsen and P. Matforsk (1999). The effect of temperature on sensory quality,chemical composition and growth of carrots (Daucus carota L.). III. Different diurnal temperatureamplitude. J. Hort Sci. Biotechnol. 74: 196–202.
Rudell, D., J. Mattheis and J. Fellmann (2002). Methyl jasmonate enhances anthocyan accumulationand modifies production of phenolis and pigments in ‘Fuji’ apples. J. Amer. Soc. Hort. Sci. 127:435–441.
Ruiz, R., K. Price, A. Arthur, M. Rose, M. Rhodes and R. Fenwick (1996). Effect of soaking and cookingon the saponin content and composition of chickpeas (Cicer arietinum) and lentils (Lens culi-naris). J. Agric. Food Chem. 44: 1526–1530.
Saltveit, M. (1999). Effect of ethylene on fresh fruits and vegetables. Postharvest Biol. Technol. 15:279–292.
Salveit, M. (1997). A summary of CA and MA requirements and recommendations for harvestedvegetables. CA’97 Proceedings Volume 4: Vegetables and Ornamentals. University of California,Davis. Postharvest Hort. Series 18: 98–117.
Salunkhe, D., H. Bolin and N. Reddy (1991). Preharvest factors on postharvest yield and quality. InStorage, processing, and nutritional quality of fruits and vegetable. CRC Press, Boca Raton,pp. 7–44.
Sams, C. (1999). Preharvest factors affecting postharvest texture. Postharvest Biol. Technol. 15: 249–254.Sanchez, E., J. Soto, P. Garcia, L. Lopez-Lefebre, R. Rivero, J. Ruiz and L. Romero (2000). Phenolic
compounds and oxidative metabolism in green beans plants under nitrogen toxicity. Aust. J. PlantPhysiol. 27: 973–978.
Scharf, A. and B. Schubert (1996). Ermittlung und Vergleich hedonischer Produkterwartungen und
Quality Dynamics and Quality Assurance 445
Produkterlebnisse bei Nahrungs- und Genußmitteln. In H. Knoblich, A. Scharf and B. Schubert (eds.),Geschmacksforschung: Marketing und Sensorik für Nahrungs- und Genussmittel, Oldenbourg VerlagGmbH, München, Germany, pp. 247–275.
Schaare, P. N. and D. G. Fraser (2000). Comparison of reflectance, interactance and transmission modesof visible-near infrared spectroscopy for measuring internal properties of kiwifruit. PostharvestBiol. Technol. 20(2): 163–174.
Scharpf, H. (2002). Chance für den Gartenbau. Taspo-Magazin 2: 4–6.Schattuck, V., R. Yada and E. Lougheed (1988). Ethylene-induced bitterness in stored parsnips. Hort.
Sci. 23: 912–915.Scheer, C., M. Schreiner, S. Huyskens-Keil und P. Lüdders (1999). Korrelation zwischen Schalenfarbe
und geschmacksgebenden Eigenschaften in Physalis peruviana L. Tagungsband der 34. Tagungder Deutschen Gesellschaft für Qualitätsforschung, Freising-Weihenstephan, Germany, pp. 195–198.
Schieberle, P. and Engel, K.-H. (1999). Frontiers of flavour science. WB-Druck GmbH Rieden amForggensee, Germany, p. 602.
Schnug, E. (1993). Physiological functions and environmental relevance of sulfur-containing sec-ondary metabolites. In L. De Kok, I. Stulen, H. Rennenberg, C. Brunold and W. Rauser (eds.), Sulfurnutrition and assimilation in higher plants, Academic publishing. The Hague, Netherlands,pp. 179–190.
Schonhof, I., A. Krumbein und S. Widell (2000). Glucosinolate in Brassicaceae und Möglichkeiten ihrerBeeinflussung. Tagungsband zur 35. Tagung der Deutschen Gesellschaft für Qualitätsforschung,Karlsruhe, Germany, pp. 47–56.
Schonhof, I., A. Krumbein, M. Schreiner and B. Gutezeit (1999a). Bioactive substances in crucif-erous products. In Agri-Food II – Quality management of fruits and vegetables. The Royal Societyof Chemistry. Special Publication 229: 222–226.
Schonhof, I., A. Krumbein und B. Gutezeit (1999b). Vorerntemaßnahmen zur Beeinflussung desGlucosinolatgehaltes in Brokkoli. Tagungsband zur 36. Wissenschaftlichen Arbeitstagung derDeutschen Gartenbauwissenschaftlichen Gesellschaft und des BDGL, Dresden, Germany, p. 56.
Schonhof, I., B. Brückner, A. Krumbein and B. Gutezeit (1998). Was Verbraucher an Brokkoli schätzen.DeGa 32: 43–45.
Schonhof, I., B. Brückner and B. Röger (1997). Innere Werte von Möhren rangieren beim Verbrauchervor den äußeren. Taspo Gartenbaumagazin 2: 41–42.
Schreiner, M., S. Huyskens-Keil, P. Peters, I. Schonhof, A. Krumbein and S. Widell (2002). Seasonalclimate effects on root colour and compounds of red radish. J. Sci. Food Agric. (accepted).
Schreiner, M., S. Huyskens-Keil, A. Krumbein, I. Schonhof and M. Linke (2000). Environmental effectson product quality. In R. Shewfelt and B. Brückner (eds.), Fruit and vegetable quality: An integratedview. Technomic Publishing INC, Lancaster Pennsylvania, USA, pp. 85–95.
Schreiner, M., I. Schonhof, S. Widell, A. Krumbein, P. Peters, H. Auerswald, S. Huyskens-Keil undM. Linke (1999). Qualität von Radies. Annual report 1998 of the Institute of Vegetable andOrnamental Crops Großbeeren/Erfurt e.V., Germany, pp. 39–46.
Schreiner, M., I. Schonhof and A. Krumbein (1998). Eine neue Dimension der Produktqualität –Bioaktive Substanzen im Gemüse. Gemüse 2: 80–84.
Schreiner, M. and S. Huyskens-Keil (1998). Development of an integrated quality index for the com-prehensive evaluation of fruits and vegetables. Proceedings of the 25. International HorticulturalCongress, Brüssel, Belgium, p. 362.
Schreiner, M., M. Linke und S. Huyskens (1996). Nacherntequalitätskriterien bei Kopfsalat (Lactucasativa L. var. capitata L.). Bornimer Agrartechnische Berichte 8: 33–50.
Schreiner, M., M. Linke and S. Huyskens (1995). Measurement of produce responses on climatic impactsin postharvest. Proceedings of the IFAC/CIGR/EURAGENG/ISHS Workshop on ‘Control Applicationsin postharvest and Processing Technology (CAPPT’ 95)’. Ostende, Belgium, pp. 193–200.
Schrödter, R. (1993). Sensorische Analye – eine unverzichtbare Methode der Qualitätsbewertungpflanzlicher Nahrungsmittel. Tagungsband der 28. Tagung der Deutschen Gesellschaft fürQualitätsforschung, Trier, Germany, pp. 108–125.
Schuphan, W. (1961). Zur Qualität der Nahrungspflanzen. BLV Verlagsgesellschaft München BonnWien, p. 170.
Shewfelt, R. (2000). Fruit and vegetable quality. In R. Shewfield and B. Brückner (eds.), Fruit and
446 S. Huyskens-Keil and M. Schreiner

vegetable quality: an integrated view. Technomic Publishing INC, Lancaster Pennsylvania, USA,pp. 144–157.
Shewfelt, R. and L. Tijskens (2000). A more integrated view. In R. Shewfield and B. Brückner (eds.),Fruit and vegetable quality: An integrated view. Technomic Publishing INC, Lancaster Pennsylvania,USA, pp. 296–306.
Shewfelt, R. (1999). What is quality? Postharvest Biol. Technol. 15: 197–200.Shewfelt R. (1993). Measuring quality and maturity. In R. Shewfelt (ed.), Postharvest handling: A system
approach. Academic Press, Inc., pp. 99–124.Shewfelt, R. (1990). Sources of variation in the nutrient content of agricutural commodities from the
farm to the consumer. J. Food Qual. 13: 37–54.Shellie, K. (2002). Ultra-low oxygen refrigerated storage of ‘rio red’ grapefruit: Fungistatic activity
and fruit quality. Postharvest Biol. Technol. 25: 73–85.Shi, X.-M. and F. Chen (1997). Stability of lutein under various storage conditions. Nahrung 41:
38–41.Sisler, E., M. Serek, E. Dupille and R. Goren (1999). Inhibition of ethylene responses by 1-methyl-
cyclopropene and 3-methylcyclopropene. Plant Growth Reg. 27: 105–112.Snowdon, A. (1992). A color atlas of postharvest diseases and disorders of fruits and vegetables. 2
vols. Boca Raton, Florida, CRC Press, p. 718.Souci, S., W. Fachmann und H. Kraut. (1994). Die Zusammensetzung der Lebensmittel. Nährwerttabellen.
Medpharm, Stuttgart, Germany.Spanos, G. and R. Wrolstad (1987). Anthocyanin pigment, nonvolatile acid, and sugar composition of
red raspberry juice. J. Assoc. Off. Anal. Chem. 70: 1036–1046.Springer, P. (1998). Integrierter Anbau besser als sein Ruf. Deutscher Gartenbau 2: 44–45.Stevens, M. A., A. A. Kader and M. Albright-Holton (1979). Potential for increasing tomato flavour
via increased sugar and acid content. J. Am. Soc. Hort. Sci. 104: 40–42.Strmiska, C. und C. Holcikova (1969). Die Veränderung des Carotinoidgehaltes bei der Lagerung
und Verarbeitung von Obst und Gemüse. Flüssiges Obst 36: 46–53.Stroshine, R. L., G. G. Dull, J. Abbott, V. Bellon, D. Beaumelle, M. Benady, R. Cavalieri, P. Chen,
W. R. Forbus, N. Galili Jr., A. Mizrach, S. Nelson, Y. Sarig, D. Slaughter, J. E. Simon andB. Zion (1993). Nondestructive sensing of internal composition. In American Society of AgriculturalEngineers (eds), Nondestructive technologies for quality evaluation of fruits and vegetables.Proceedings of the International Workshop United States-Israel binational agricultural researchand development fund (BARD), Spokane, Washington St. Joseph Michigan, USA, pp. 97–110.
Studer, H. (1983). Influence of mechanical harvesting on the quality of fruit vegetables. HortSci. 18:417–421.
Tang, J., J. N. Ikediala, S. Wang, J. Hansen and R. Cavalieri (2000). High-temperature-short-time thermalquarantine methods. Postharvest Biol. Technol. 21: 129–145.
The Packer (2000). Fresh trends 2000. Detailed demographic tabulations for purchase preferencesand influences. Report 4, pp. 287.
Thompson, L. (1993). Potential health benefits and problems associated with antinutrients in foods. FoodRes. Internat. 26: 131–149.
Tijskens, L. (2000). Acceptability. In R. Shewfeld and B. Brückner (eds.), Fruit and vegetable quality:An integrated view. Technomic Publishing INC, Lancaster Pennsylvania, USA, pp. 144–157.
Tijskens, L. and C. van Dijk (2000). Enzyme activity and firmness in tomatoes. In W. Florkowski,S. Prussia and R. Shewfelt (eds.), Fruit and vegetable quality: An integrated view. TechnomicPublishing INC, Lancaster Pennsylvania, USA, pp. 73–80.
Tollner, E. W., J. K. Brecht and B. L. Upchurch (1993). Nondestructive evaluation: Detection ofexternal and internal attributes frequently associated with quality or damage. In R. Shewfelt andS. Prussia (eds.), Postharvest handling: A systems approach. Academic Press. INC., San Diego,pp. 234–242.
Tomas-Barberan, F. and J. Espin (2001). Phenolic compounds and related enzymes as determinantsof quality in fruits and vegetables. J. Sci. Food Agric. 81: 853–876.
Ulrichs, Ch. (1999). Dynamik des Kohlenhydratmetabolismus in der Nachernte am Beispiel von Daucuscarota L. PhD Humboldt University Berlin, Germany, p. 121.
Ulrich, D. and E. Hoberg (1999). Headspace – Analysen von intakten Früchten mit einem massen-
Quality Dynamics and Quality Assurance 447

spektrometrischen Sensor. Deutsche Gesellschaft für Qualitätsforschung e.V. (DGQ). XXXIV.Vortragstagung ‘Zerstörungsfreie Qualitätsanalyse’, Freising-Weihenstephan, Germany, pp. 281–286.
Van Den Berg, L. (1987). Water vapor pressure. In J. Weichmann (ed.), Postharvest physiology ofvegetables. Marcel Dekker, New York, pp. 203–230.
Vanderslice, J., D. Higgs, J. Hayes and G. Block (1990). Ascorbic acid and dehydroascorbic acid contentof foods-as-eaten. J. Food Compos. Anal. 3: 105–118.
Van Kooten, O. and H. Peppelenbos (1993). Predicting the Potential to Form Roots on ChrysanthemumCuttings during Storage in Controlled Atmospheres. Proceedings of the 6th international controlledatmosphere reasearch conference, Cornell University Ithaca, New York, pp. 610–619.
Veit-Köhler, U., A. Krumbein and H. Kosegarten (1999). Effect of different water supply on plant growthand fruit quality of Lycopersicum esculentum. J. Plant Nutr. Soil Sci. 162: 583–588.
Vicente, A. R., G. A. Martinez, P. M. Civello and A. R. Chaves (2002). Quality of heat-treated straw-berry fruit during refrigerated storage. Postharvest Biol. Technol. 25(1): 59–72.
Watada, A. (1987). Vitamins. In J. Weichmann (ed.), Postharvest physiology of vegetables. MarcelDekker, New York, pp. 455–468.
Watata, A. (1986). Effects of ethylene on the quality of fruits and vegetables. Food Technol. 40:82–85.
Watada A., R. Herner, A. Kader, R. Romani and G. Staby (1984). Terminology for the description ofdevelopmental stages of horticultural crops. HortSci. 19: 20–21.
Watzl, B. und C. Leitzmann (1999). Bioaktive Substanzen in Lebensmitteln. Hippokrates Verlag Stuttgart,Germany, p. 254.
Webster, T. (1968). Webster’s New World Dictionary of the American Language. The world pub-lishing company, Cleveland, New York, p. 823.
Wehling, P. (2000). Quality and breeding-cultivars, genetic engineering. In R. Shewfeld and B. Brückner(eds.), Fruit and vegetable quality: An integrated view. Technomic Publishing INC, LancasterPennsylvania, USA, pp.21–42.
Werder Frucht (1995). Projektstudie Werder Frucht 2000. Humboldt-Universität, Berlin.Weston, L. and M. Barth (1997). Preharvest factors affecting postharvest quality of vegetables. HortSci.
32: 812–816.Widayat, H., S. Huyskens-Keil, M. Schreiner, P. Peters and P. Lüdders (2002). Dynamic CA-storage
for the quality assurance of pepino (Solanum muricatum Ait.). Acta Hort (accepted).Widell S., A. Krumbein, M. Linke und H. Auerswald (1999). Einfluss klimatischer Belastung auf den
Gehalt an Glucosinolaten und sensorischen Eigenschaften bei Radies. Tagungsband zur 36.Wissenschaftlichen Arbeitstagung der Deutschen Gartenbauwissenschaftlichen Gesellschaft unddes BDGL, Dresden, Germany, p. 106.
Widell, S., A. Krumbein and H. Auerswald (1998). Glucosinolate in Radies und sensorische Bewertung.Tagungsband zur 35. Wissenschaftlichen Arbeitstagung der Deutschen GartenbauwissenschaftlichenGesellschaft und des BDGL, Berlin, Germany, p. 151.
Wiedow, K. (1999). Medikamente der Zukunft? Rationelle Hauswirtschaft 36: 10–11.Wills, R. B. H., M. C. Bowyer and Y. Y. Leshem (2002). Use of nitric oxide to extend the posthar-
vest life of horticultural produce. Acta Hort: in preparation.Wills, R., V. Ku, D. Shonet and G. Kim (1999). Importance of low ethylene levels to delay senes-
cence of non-climacteric fruit and vegetables. Austral. J. Exp. Agr. 39: 221–224.Wills, R., T. Lee, D. Graham, W. McGlasson and E. Hall (1998). Postharvest, an Introduction to the
Physiology and Handling of Fruit and Vegetables. UNSW Press Australia, p. 262.Wills, R. (1987). Composition of Australian fresh fruit and vegetables. Food Technol. Aust. 39: 523–526.Winter, F., H. Jansen, W. Kennel, H. Link, F. Scherr, R. Silbereisen and J. Streif (1992). Lucas’ Anleitung
zum Obstbau. Verlag Eugen Ulmer GmbH & Co., Stuttgart, Germany, p. 415.Wirthgen, B., H. Kuhnert, M. Altmann, J. Osterloh and A. Wirthgen (1999). Die regionale Herkunft
von Lebensmitteln und ihre Bedeutung für die Einkaufsentscheidung der Verbraucher. Berichteüber Landwirtschaft 77: 243–261.
Wright, K. and A. Kader (1997). Effect of slicing and controlled-atmosphere storage on the ascorbatecontant and quality of strawberries and persimmons. Postharvest Biol. Technol. 10: 39–48.
Wu, Y., A. Perry and B. Klein (1992). Vitamin C and β-carotene in fresh and frozen beans andbroccoli in simulated system. J. Food Qual. 15: 87–96.
448 S. Huyskens-Keil and M. Schreiner

Yang, S. (1987). Regulation of biosynthesis and action of ethylene. Acta Hort. 201: 53–59.Zagory, D. (1995). Ethylene removing packaging. In M. Rooney (ed.), Active food packaging. Blackie
Academic and Professional, London, UK, pp. 38–54.Zepplin, M. and C. Elevehjein (1944). Effect of refrigeration on retention of ascorbic acid in vegeta-
bles. Food Res. 9: 100–111.Zhang, D. and P. Quantick (1997). Effects of chitosan coating on enzymatic browning and decay
during postharvest storage of litchi (Litchi chinensis Sonn.) fruit. Postharvest Biol. Technol. 12:195–202.
Zhang, Y., P. Talalay, C.-G. Cho and G. Posner (1992). A major inducer of anticarcinogenic protec-tive enzymes from broccoli: Isolation and elucidation of structure. Proc. Natl. Acad. Sci. USA 89:2399–2403.
Zoffoli, J. P., B. A. Latorre, E. J. Rodriguez and P. Aldunce (1999). Modified atmosphere packagingusing chlorine gas generators to prevent Botrytis cinerea on table grapes. Postharvest Biol. Technol.15(2): 135–142.
Quality Dynamics and Quality Assurance 449

MODIFICATION OF FRUIT RIPENING BY GENETICTRANSFORMATION
LECH MICHALCZUKLech Michalczuk: Research Institute of Pomology and Floriculture, 96–100, Skierniewice, Poland. E-mail: [email protected]
1. INTRODUCTION
Genetic transformation, or gene transfer technology, is beginning to make a world-wide impact on the genetic improvement of crop species. Transgenic plants, in whichforeign genes have been inserted and expressed, can now be produced in morethan 40 crop species. The global area devoted to all biotechnology crops increasedfrom 27.5 million hectares in 1998 to almost 40 million in 1999, of which 72% weregrown in the United States, followed by Argentina (17%), Canada (10%) and China(1%). The balance was grown in Australia, South Africa, Mexico, Spain, France,Portugal, Romania and Ukraine. Global sales of transgenic crops more than doubledin 1999 over 1998, reaching an estimated $2.1 to $2.3 billion worldwide (Hagedorn,2001). Farmers who planted them generally enjoyed higher yields, higher profitsand lower input costs. However, this new trend affected little fruit production.The transgenic crops grown most commonly are soybean (52% of total acreage),followed by corn (30%), cotton (9%), canola (9%) and potato (about 1%). Thecultivation area of other crops, including tomato and cantaloupe, is marginal. Themost important traits introduced to transgenic crops are herbicide and pest resis-tance, yet plants with improved product quality are planted on less than 0.1% oftotal acreage. However, the situation may change in the near future as intensiveresearch is done on transformation of fruit trees. The targets include resistance topests and pathogens, control of fruit development including growth, ripening andsenescence, improvement of fruit colour, scent and flavour, and processing quality.Also of great importance to fruits are biotechnological strategies for the produc-tion of seedless fruits via parthenocarpy by overproduction of auxin. This paperreviews the current state and perspectives of applying biotechnology for controlledfruit ripening.
2. FRUIT RIPENING
Botanically, a fruit is the product of a matured ovary. Thus, fruits are dry seeds ofcereals, nuts, oilseeds like rape or flax as well as fleshy, succulent structures of apple,grape or banana. On the other hand, strawberry is not a fruit but a swollen recep-tacle supporting the real fruits, achenes. It should also be noted that many vegetableslike tomato, cucumber, squash, peppers or eggplant are botanically fruits. As willbe shown later, ripening physiology and biochemistry of a fruit like the apple is verysimilar to that of a vegetable like the tomato. Therefore, in this chapter the biotech-
R. Dris and S. M. Jain (eds.), Production Practices and Quality Assessment of Food Crops,
© 2004 Kluwer Academic Publishers. Printed in the Netherlands.
451
Vol. 3, “Quality Handling and Evaluation”, pp. 451–472.

nology of all fleshy fruits will be discussed, regardless of their horticultural clas-sification.
2.1. Hormonal and developmental control of fruit ripening
The biological function of a fruit is to facilitate efficient seed dispersion. Thus, whenseed maturation changes in the fruit occur they become attractive to seed-spreadinganimals. This includes an increase in ‘sweetness’ due to conversion of starch, soft-ening due to a breakdown of cell walls, loss of ‘tartness’ due to a decrease in acidity,colour changes due to a breakdown of chlorophyll and synthesis of new pigments,and production of highly distinctive flavours and aromas. All those physiologicalprocesses, called ‘fruit ripening,’ must be precisely coordinated with seed matura-tion. If it happens too early, the immature seeds would be destroyed. Upon fulfillingits function of attracting animals, the fruit flesh should deteriorate rapidly so theseed would be free to germinate.
Fruit have always been an attractive food for humans, although occurring onlyseasonally. Therefore, attempts to prolong their availability either by accelerationof ripening or storage for a period of time probably started very early. The earliestwritten record of human studies on fruit ripening can be dated back to antiquity. TheGreek philosopher Theophranus wrote that ripening of fig fruit can be signifi-cantly accelerated by wounding its skin (cited after Theologis, 1992). Modern studieson fruit ripening started in the 1920s when California growers noticed that orangesturned orange in colour when kept in rooms heated with kerosene stoves. Assumingthat the heat was responsible, they erected ‘sweet rooms’ in which the fruits werekept to ripen. The effect wasn’t always what was expected. Instead of turning‘orange,’ the oranges in some ‘sweet rooms’ became dehydrated. It was soondiscovered that it wasn’t the heat but ethylene, a product of partial combustion ofkerosene, that was responsible for fruit degreening. Extensive studies that followedshowed that the physiology of fruit ripening differs for different species. In somefruits, like apple, pear, avocado, mango or banana, the onset of ripening is associ-ated with a sudden burst of ethylene production and respiration rate. In others,like grapes, strawberries, raspberries, cherries or currants, respiration and ethyleneproduction remains at the steady level during ripening and senescence (Kid and West,1933). The fruits showing the rise of ethylene and respiration are called climac-teric, whereas all the others are classified as not climacteric.
The data accumulated shows with little doubt that ethylene is the main factor con-trolling ripening of climacteric fruits. It has been shown that treatment withexogenous ethylene triggers the climacteric rise of respiration and acceleratesripening whereas inhibition of its synthesis retards ripening (Tucker and Grierson,1987). The climacteric rise of ethylene is apparently autocatalytic – once started,it promotes itself and becomes self-sustaining (feedback promotion) (Young andHofmann, 1984). However, the reaction of fruit to ethylene treatment is controlleddevelopmentally. Fruits that are not developed would not react even to a high doseof the hormone. As Hansen (1966) expressed it, a fruit must be ‘ready to ripen.’The prime eating quality occurs usually at the climacteric peak, which also triggersirreversible senescence and decay.
452 Lech Michalczuk
Besides ethylene, there are evidences that other plant growth regulators mightbe involved in control of fruit ripening. It has been shown that the mother plantproduces some substance(s) that retard ripening of attached fruits. For example,avocado and some pear varieties will not ripen unless detached from the tree(Hansen, 1966; Biale and Young, 1971), whereas harvesting significantly acceler-ated apple ripening (Blanpied, 1993). The identity of these compound(s) has notbeen elucidated yet, although some evidence suggests that it may be auxins. Ithas been known for a long time that those growth regulators inhibit fruit ripening.In climacteric fruits treatment with exogenous auxins counteracts ethylenetreatment (Frenkel and Dyck, 1973; Vendrell, 1969, 1985). The classic studies ofNitch (1950) showed that the growth and development of strawberry receptacle(pseudofruit) is controlled by auxins produced in achenes. There is also evidencethat auxins control ripening of those fruits as well. The onset of ripening in the intactstrawberry is associated with decrease of free IAA level in both achenes and thereceptacle (Mudge et al., 1981; Archbold and Denis, 1984). Removal of the achenesaccelerates fruit ripening, which can be counteracted by application of the endoge-nous hormone (Kano and Ashira, 1978; Mudge et al., 1981; Given et al., 1988).All this data suggests that auxins may be the main hormone controlling ripeningof strawberry. This hypothesis is supported by the observation that strawberryfruits produce a negligible amount of ethylene during their growth and maturationand do not react to treatments with exogenous ethylene or ethylene synthesisinhibitors (Knee at al., 1977; Given at al., 1988; Abeles and Takeda, 1990; Plichet al., 1995).
Jasmonates are a class of oxylipids that induce a wide variety of higher plantresponses. Applied to ripening fruits, they stimulate ethylene biosynthesis, colourchanges and volatiles’ production (Czapski and Saniewski, 1992; Fan at al., 1998;Fan and Mattheis, 1999; Saniewski et al., 1999). In apples and tomatoes the onsetof ripening was preceded by an increase in the content of the cis-isomer of jasmonicacid (Fan and Mattheis, 1999). These results suggest jasmonates may play a roletogether with ethylene in regulating the early steps of climacteric fruit ripening.
The level of abscisic acid (ABA) commonly rises during late stages of fruit devel-opment and ripening (Zhang and Lu, 1983; Manning, 1993; Kondo et al., 1999).Treatment with exogenous hormone promoted colour changes in Pinalate orangemutant (Alferez et al., 1999) and in ripening cherries (Hartman, 1992) withoutaffecting ethylene production and hastened ripening of strawberry receptaclescultured in vitro (Kano and Ashira, 1981) and tomato (Mizrahi et al., 1975).
Exogenous gibberellins and cytokinins were shown to delay fruit ripening ofseveral species (Martinez et al., 1996; Zilkah et al., 1997; Schirra et al., 1999).However, no consistent relationship between those growth regulators and fruitripening and senescence has been found.
More detailed information about physiology and biochemistry of fruit ripeningcan be found in Tucker and Grierson (1987), Chopra (1991), Theologis (1992), Bradyand Johnson (1994), Seymour, Taylor and Tucker et al. (1993) and Zarembinskiand Theologis (1994).
Modification of Fruit Ripening by Genetic Transformation 453

3. PLANT GENETIC TRANSFORMATION
Nearly all agricultural plants are genetically modified, i.e., their genetic make updiffers significantly from wild species that they derived from. This was obtainedeither by selection of spontaneous mutants or hybrids or by selective breedingdirected on an exchange of genetic material between two parent plants to producethe offspring having desired traits such as increased yield, disease resistance andenhanced product quality. However, traditional methods of gene exchange are limitedto crosses between the same or very closely related species. It can take consider-able time to achieve desired results and, frequently, characteristics of interest donot exist in any related species. Modern biotechnology vastly increases the preci-sion and reduces the time with which these changes in plant characteristics can bemade and greatly increases the potential sources from which desirable traits canbe obtained. The application of recombinant DNA technology to facilitate geneticexchange in crops has several advantages over traditional breeding methods. Theexchange is far more precise because only a single (or, at most, a few), specific genethat has been identified as providing a useful trait is being transferred to the recip-ient plant. As a result, there is no inclusion of ancillary, unwanted traits that needto be eliminated in subsequent generations, as often happens with traditional plantbreeding. Application of recombinant DNA technology to plant breeding also allowsmore rapid development of varieties containing new and desirable traits. With genetictransformation it is also possible to introduce traits that do not exist in a givenplant species or genera by introducing genes from very distant species such asbacteria or animals, for example. Furthermore, recombinant DNA technology allowsproducing traits that do not exist naturally in the whole plant kingdom by switchingoff (gene silencing) or changing the time and/or place expression of a native geneand thus eliminating some physiological processes.
3.1. Methods of plant genetic transformation
All the characteristics of a given organism are encoded within its genetic material,which consists of the collection of deoxyribonucleic acid (DNA) molecules that existin each cell of the organism. Higher organisms contain a specific set of linearDNA molecules called chromosomes and a complete set of chromosomes in anorganism comprises its genome. Each genome is divided into a series of func-tional units, called genes There are 20,000 to 25,000 such genes in typical crop plantssuch as corn or apple. The collection of traits displayed by any organism (pheno-type) depends on the genes present in its genome (genotype). The appearance of anyspecific trait also will depend on many other factors, including whether the gene(s)responsible for the trait is turned on (expressed) or off, the specific cells withinwhich the genes are expressed, and how the genes, their expression, and the geneproducts interact with environmental factors.
The linear macromolecule of DNA is consisted of four monomers – desoxyri-bonucleotides, linked in a sequence that forms an encrypted ‘blueprint’ for a givenorganism. In the 1950s Crick and Watson deciphered the code and found that it isuniversal for all living organisms. This finding opened the possibility for unlim-
454 Lech Michalczuk
ited exchange of genetic information between different species by genetic trans-formation.
Genetic transformation is defined as the introduction of a single gene or genesfrom either the same or a different species conferring potentially useful traits intoliving organisms. The transfer of genes into plants can be achieved in severalways. The first technique developed and by far the most popular is an Agrobacteriumtumefaciens-mediated method. Bacteria belonging to Agrobacterium harbour tumour-inducing (Ti) or root-inducing (Ri) plasmids and have the ability to cause tumoursor root proliferation in a wide range of dicotyledonous plants. It has been shownthat their pathogenicity is due to the transfer of a segment of Ti or Ri plasmids,known as T-DNA (transferable DNA), into the nuclear genome of the susceptibleplant. The gene transfer itself is made possible by the function encoded in the viroperon of the plasmid whereas the content of T-DNA is for the transformationirrelevant. It has been demonstrated that genes encoded within T-DNA can beremoved (‘disarming’ Ti plasmid) and replaced with virtually any other genes –those introduced will be transferred as well into plant cells (Zambryski et al.,1983). The transferred genes have been shown to be stably incorporated into plantgenome, and genetic analysis showed that their inheritance follows Mendelianpattern (De Block et al., 1984). With time, several transformation vehicles havebeen developed consisted of selected Agrobacterium tumefaciens strains varyingin virulence and harbouring various types of disarmed Ti plasmids. The advantageof this method of transformation is a high frequency of stable introduction of thetransgene and relatively easy plant regeneration from transformed tissue. Therefore,it is not surprising that agrobacterium-mediated gene transfer produced most trans-genic plants obtained thus far.
The main disadvantage of Agrobacterium-mediated transformation is that it islimited to dicots. Of the several other gene delivery systems, such as virus-mediatedgene transfer, protoplast electroporation, microinjection and microprojectiles, thewider use found only the last. It involves bombardment of intact plant cells withsmall gold or tungsten particles covered with DNA. The microprojectiles can be pro-pelled by either explosion of pistol cartridges (Klein et al., 1987) or more commonlyby compressed gas (Oard et al., 1990). Transformation by particle bombardments,however, often leads to integration of multiple copies of the introduced genesincluding plasmid vector DNA, often fragmented and rearranged. This can lead toinstability of their expression; multiple copies of transgenes can inactivate each otherby cosuppression (gene silencing) (Hansen and Cilton, 1996). Multiple copies canbe genetically segregated during subsequent breeding, but this approach is unreal-istic in perennials and most fruit plants are perennials. Another disadvantage ofthis method is that plant regeneration from cells injured by microparticles is oftenvery difficult.
The application of recombinant DNA technology frequently has been referredto as genetic engineering. Today it has reached a stage where scientists can take apiece of DNA containing one or more specific genes from nearly any organism,including plants, animals, bacteria, or viruses, and introduce it into a specific cropspecies. The main problem, however, is the limited availability of agriculturallyuseful genes.
Modification of Fruit Ripening by Genetic Transformation 455

3.2. Modification of fruit ripening by genetic transformation
Basically, two strategies has been adopted for modification of fruit ripening bygenetic engineering – first by altering the metabolism of growth regulators con-trolling ripening processes and second by modification of enzyme activity affectingtissue softening, colour changes or carbohydrate metabolism.
3.2.1. Transformation with genes regulating ethylene biosynthesis and reception
3.2.1.1. Ethylene biosynthesisOf all the known plant growth regulators, only metabolism of ethylene is knownin details. Coincidentally, it is also the key hormone involved in fruit ripeningcontrol. The extensive research conducted by Lieberman, Young and co-workersduring 1960–1980 documented that in higher plants ethylene is synthesised frommethionine via the following pathway:
methionine → S-adenosylomethionine (SAM) →1-aminocyclopropane-1-carboxylic acid (ACC) → C2H4.
The rate-limiting steps in ethylene biosynthesis are the conversion of SAM toACC catalysed by ACC-synthase, and the conversion of ACC to ethylene by ACC-oxidase. Therefore, altering activities of those two enzymes can change ethyleneproduction and, in effect, the process of ripening.
ACC-synthase was first purified to homogeneity from tomato (Bleecker et al.,1986) and squash fruits (Nakajima and Imaseki, 1986) and then its gene cloned (Satoand Theologis, 1989). ACC-oxidase proved to be much more difficult to purify.Several attempts failed and it was speculated that it isn’t a single protein but acomplex that disintegrates during purification. The term ethylene-forming enzyme(EFE) was coined for this hypothetical enzyme. However, analysis of tomato cDNAlibrary revealed that the ripening-related pTOM13 clone encodes the enzyme thatcatalyses oxidation of ACC to ethylene (Hamilton et al., 1990).). Further studiesshowed that multigene families encode both ACC-synthase and ACC-oxidase inplants. In climacteric fruit, the transition to autocatalytic ethylene production appearsto be due to a series of events in which ACC-synthase and ACC-oxidase geneshave been expressed developmentally. In tomato, for example, at least 6 ACCsynthase genes were discovered but only two of them are expressed during fruitripening (Nakatsuka et al., 1998 Oetiker et al., 1997). Multiple copies of ACC-oxidase were found in the genomes of the Japanese pear (Kawata et al., 1999), peach(Bonghi, 1999) and apple (Lay-Yee and Knighton, 1995). In nonclimacteric fruitsof papaya and pineapple only a single copy of this gene was found (Cazzonelli etal., 1998; Neupane et al., 1998). A similar pattern was observed for ACC-oxidasegenes. More detailed information on molecular biology of ethylene biosynthesiscan be found in Young and Hofman (1994), Yang et al. (1998) and Zarembinskiand Theologis (1994).
Both ACC-synthase and ACC-oxidase genes in sense and antisense orientationwere used for plant transformation in order to inhibit ethylene biosynthesis and delay
456 Lech Michalczuk

fruit ripening. However, the effect of transformation depended to a great extenton unknown factors. It has been shown that ethylene inhibition varied significantlyin transgenic clones. In tomato fruits expressing antisense ACC-synthase (LE-ACS2)RNA ethylene production varied significantly and ripening was inhibited onlywhen ethylene production was suppressed by more than 99% (>0.1 nl g–1 freshweight). Some antisense fruits accumulated normal level of polygalacturonase (PG),ACC-oxidase and phytoene desaturase (D2) mRNAs, which are thought to beethylene-inducible. However, PG mRNA was not translated, which was evidencedby immunoblotting. These results suggested that at least two signal-transductionpathways were operating during fruit ripening. The independent (developmental)pathway was responsible for the transcriptional activation of genes involved infruit ripening whereas the ethylene-dependent pathway was responsible for theirtranscriptional and posttranscriptional regulation (Theologis et al., 1993). In the studyconducted by Nagata et al. (1995), only one of 43 clones transformed with anti-sense ACC-synthase and four of 26 clones transformed with the sense constructshowed inhibition of ethylene production and a marked retardation in red colourdevelopment. This was despite the fact that in all transgenic clones the incorpora-tion and expression of transgenes was confirmed by Southern and Northern blots.Different rates of ethylene biosynthesis inhibition and retardation of ripening intomato fruits transformed with antisense ACC-synthase gene were also observedby Sitrit and Bennett (1998) and Grierson and Fray (1994).
A variation in the rate of ethylene production was also observed in tomato fruittransformed with antisense ACC-oxidase gene. Bolitho et al. (1997) have shown thatthe rate of ethylene inhibition in several transgenic clones varied from 50% to95%. The line showing the greatest reduction in ethylene production showed a delayin the development of fruit colour. Northern analysis of steady-state RNA levelsusing strand-specific probes indicated that fruit of the low-ethylene line had verylow levels of ACC-oxidase sense RNA, and high levels of antisense RNA. In otherlines, high levels of antisense RNA were not always associated with a reductionin the levels of either the sense transcript or ethylene production. Hamilton et al.(1998) have shown that reduction of ethylene biosynthesis could also be achievedby transformation with sense ACC-oxidase gene. Some 15% of tomato plantstransformed with a 35S-ACC-oxidase (ACO1) sense gene had reduced ACC-oxidase activity, compared to 96% of plants transformed with an ACC-oxidase sensegene containing two additional inverted copies upstream of its 5′ region. In thethree plants chosen for analysis, there were substantially reduced amounts of bothendogenous and transgenic ACO RNAs, indicating that this was an example ofco-suppression.
Transgenic fruits carrying ACC-oxidase were ripening slower than fruits fromwild-type plants. Murray et al. (1993) showed that transformation did not alter theinterval between anthesis and colour change but thereafter pigment formation wasretarded in homozygous antisense plants, and, in addition, the rate of loss of aciditywas reduced. The softening rate was not inhibited during ripening, but was retardedin the over-ripening phase. Exogenous ethylene enhanced the coloration rate morein antisense fruits than in control samples, but had little effect on the softeningrate. The antisense fruits were less susceptible to damage during ripening and harvest,
Modification of Fruit Ripening by Genetic Transformation 457

and survived in good condition for longer storage periods. However, the antisensefruits softened more rapidly when harvested and stored at a constant 20 °C thanwhen ripened on the plant in the greenhouse. Oeller et al. (1991) and Picton, Barton,Bouzayen, Hamilton and Grierson (1993) obtained different results. In their exper-iments, transformation with antisense LE-ACC2, one of the two ripening-relatedACC-oxidases, resulted in almost complete inhibition of ethylene production. Thetransgenic fruits kept in air for up to 150 days did not turn red and soft or developan aroma. The inhibition of ripening could be reversed by treatment with ethyleneor propylene. Nagata et al. (1995) and Lee et al. (1997) observed similar effectsin tomato transformed with this gene in a sense orientation.
Transformation of melon (Cucumis melo) with antisense ACC-oxidase generesulted in inhibition of ethylene production. The activities of some cell wall-degrading enzymes (pectin methylesterase and exo-polygalacturonase) were identicalin wild type and transgenic fruits, which suggests that they are not controlled byethylene. On the contrary, the activity of galactanase, alpha-arabinosidase, beta-galactosidase and endo-polygalacturonase was higher in wild-type fruit, indicatinga regulatory role for ethylene for at least a portion of activity that could corre-spond to specific isoforms. The increase in ACC synthase activity at the early stagesof ripening occurred exactly at the same time in wild type and transgenic fruits, indi-cating that the initiation of ripening-associated ethylene biosynthesis could occuras a developmentally and ethylene-independent phenomenon (Pech et al., 1999).
Strong inhibition of ethylene synthesis was also achieved in CantaloupeCharentais melons by downregulating the ACC-oxidase gene with antisense con-struct. Compared to the control, transgenic fruit produced less than 1% of ethyleneand did not undergo yellowing of the rind and softening of the flesh, but these effectscould be reversed entirely with exogenous ethylene. Pigmentation of the fleshoccurred before the climacteric and was unaffected by ethylene inhibition. Similarly,total soluble solids content was unaffected. Transgenic fruit failed to develop theabscission zone in the peduncle and remained attached to the plant and accumu-lated a higher concentration of sugars (Guis et al., 1998).
Transformation with antisense ACC-synthase gene has been used by DNA PlantTechnology to produce the tomato cultivar Endless Summer, approved for the useas human food by the U.S. Food and Drug Administration and successfully com-mercialised in the USA. A cultivar Bioscien transformed with antisense ACC-oxidasegene is now being introduced in China (Ye et al., 1999).
3.2.1.2. Transformation with S-adenosylomethionine hydrolase and 3.2.1.2. 1-aminocyclopropane-1-carboxylic acid deaminase genesExpressing enzymes destroying ACC or its precursor, SAM, can also hamperethylene production in transgenic plants. A gene from Esherichia coli bacteriophageT3 that encodes the enzyme S-adenosylomethionine hydrolase (SAM-ase) underthe control of tomato ripening-related E8 gene promoter was used to generatetransgenic plants that produce fruit with a reduced capacity to synthesise ethylene.The ripening phenotype of cantaloupe transformed with this gene exhibited modifiedpostharvest characteristics, including a dramatic reduction in ethylene synthesisand is checked now in greenhouse and field trials (Clendennen et al., 1999).
458 Lech Michalczuk

Reduction of ethylene synthesis and retardation of fruit ripening was also obtainedin transgenic tomato carrying this gene under the control of ripening-specificpromoter. SAM-ase in those fruits was expressed during the breaker and orangestage of fruit ripening and stopped expression after the fruit fully ripened. They prac-tically did not produce ethylene and activity of enzymes affecting colour changesand texture was greatly reduced (Grierson and Schuch, 1993; Good et al., 1994).
1-aminocyclopropane-1-carboxylate (ACC) deaminase gene from Pseudomonassp under the control of constitutive CaMV 35S promoter was introduced into tomatovia Agrobacterium transformation. Transgenic fruits ripened significantly slowerthan control fruit when removed from the vine early in ripening. In contrast, fruitthat remained attached to the plants ripened much more rapidly, exhibiting littledelay relative to the control. Ethylene determinations on attached fruit revealedthat there was significantly more internal ethylene in attached fruit than in detachedfruit. The higher ethylene content could fully account for the observed faster, on-the-vine ripening. Biochemical analyses of transgenic fruit indicated no significantdifferences from controls in the levels of ACC-oxidase or polygalacturonase. Becausetransgenic fruit were significantly firmer than controls, this result indicated that otherenzymes might have a significant role in fruit softening (Klee, 1993; Sheehy etal., 1993).
Transgenic cantaloupe and tomato carrying S-adenosylomethionine hydrolasefrom E. coli bacteriophage T3, submitted by Agritope and one transgenic tomatocarrying S-adenozylomethionine hydrolase from Pseudomonas chloraphis, submittedby Monsanto, were approved for use as human food by the U.S. Food and DrugAdministration.
Transformation with ACC deaminase gene was also attempted in raspberry andstrawberry, which are not climacteric. Such a transformation, therefore, should nothave an effect on fruit ripening (Mathews et al., 1995, Mathews, Wagoner, Kelloggand Bestwick, 1995).
3.2.1.3. Transformation with ethylene receptor genesEthylene perception in plants is co-ordinated by a hormone receptor. Bleecker etal. (1988) found 3 different genes in Arabidopsis that confers sensitivity to ethylene.A mutation in one of them, called ETR1, caused an absence of all measured ethyleneresponses in various parts of the plant. Homologous genes have been cloned alsofrom tomato (Picton et al., 1993), peach (Tonutti et al., 1999), muskmelon (Satoet al., 1999), passionfruit (Mita et al., 1998), and many others. It was demon-strated that NeverRipe phenotype of tomato mutant is caused by mutation of agene homologous to Arabidopsis ETR1 (Wilkinson et al., 1995). Wilkinson et al.(1997) showed that Arabidopsis ETR1-1 could be transformed into other species(tomato, petunia, tobacco) to confer ethylene insensitivity. However, such transgenicfruits would never ripen, thus its practical application is limited.
3.2.2. Transformation with genes regulating IAA biosynthesis
According to Bandurski (1979), endogenous level of idolacetic acid in plant tissueis controlled by its de novo biosynthesis, degradation and reversible conjugation
Modification of Fruit Ripening by Genetic Transformation 459

with sugars and amino acids. Unlike ethylene, biosynthesis of IAA in higher plantsis very little understood. It is probably synthesised by several independent pathways(Schneider et al., 1974, Wright et al., 1991) and, therefore, very difficult to controlby genetic engineering. However, it has been shown that expressing bacterial genescan significantly alter IAA biosynthesis. It has been shown that IAA is biosynthe-sised from tryptophan in bacteria by its decarboxylation and hydrolysis ofindolacetamide (Kosuge et al., 1966). The genes iaM, encoding tryptophan monoox-idase, and iaaH, encoding idolacetamide hydrolase, have been cloned (Thomashowet al., 1984; Van Onckelen et al., 1986).
The decrease of endogenous hormone level can be done by transformation withgenes encoding enzymes catalysing synthesis of IAA conjugates. One such gene,encoding enzyme IAA-lysine synthetase (iaaLys), was cloned from Pseudomonassevastanoi (Glass and Kosuge, 1986) and other, catalysing formation of IAA-glucose(iaglu) has been cloned from maize (Szerszen et al., 1994).
The gene iaaM under the control of a fruitlet-specific promoter was used fortransformation of tomato and eggplant (Rotino, 1997; Ficcadenti et al., 1999).Such a transformation resulted in production of partenocarpic fruits, but did notaffect fruit ripening. Mezzetti et al. (2000) used this gene for transformation ofwild and cultivated strawberry (Fragaria vesca and Fragaria ananassa). Transgenicwild strawberry produced partenocarpic fruits but in the case of cultivated straw-berry the results were inconclusive. In both cases fruit ripening was not affected.
IAA-glucose synthetase gene was used for transformation of strawberry. It resultedin significant increase of the level of esterified IAA but only in a slight increaseof free hormone level (Wawrzynczak et al., 2000). Transgenic plants flowered earlierthan the wild ones, but there was no effect on fruit ripening.
The lack of effect of transformation with genes affecting endogenous auxinlevel on fruit ripening may be explained by improper expression of the transgenes.In contrast to gaseous ethylene, IAA level in the cell would not decrease withinhibition of its biosynthesis but would persist for some time. Therefore, expres-sion of genes affecting auxin biosynthesis must be precisely coordinated with fruitdevelopment. The genes used in those transformations were controlled either byseed-specific or constitutive promoters, which means their expression took placeeither in the seeds or in a whole plant. Perhaps better results could be obtained bytransformation with chimaeric genes containing fruit flesh-specific promoters, butsuch are not available yet.
3.2.3. Genetic transformation affecting activity of enzymes involved in fruit 3.2.3. ripening
Specialised enzymes catalyse all the changes in fruit occurring during ripeningand senescence. By switching off or overexpressing genes encoding those enzymes,one can achieve acceleration or inhibition of some processes without affecting theothers. For example, it is possible to delay tissue softening by removing genesresponsible for cell-wall degradation whereas colour changes and carbohydratemetabolism proceed at a normal rate or to accelerate colour changes in order toobtain better-coloured fruits.
460 Lech Michalczuk
3.2.3.1. PolygalacturonaseThe activity of polygalacturonase (PG), a fruit ripening-specific cell wall pecti-nase, has been strongly implicated as a key determinant of softening during fruitripening. It is hypothesised to have a more general role in the regulation of matu-ration of the fruit as a whole. Numerous genes of this enzyme were found in mostof the plant genomes tested, but only some of them were expressed during fruitripening. The others were active in leaf and fruit abscission. Ripening-relatedPG’s genes were cloned from tomato (Knapp et al., 1989; Biggs et al., 1989),peach (Lee et al., 1990), avocado (Dopico et al., 1993), kiwifruit (Atkinson andGardner, 1993), raspberry (Jones et al., 1998) and melon (Hadfield et al., 1998).It has been demonstrated that expression of both a sense and antisense RNAconstruct cause down-regulation of PG activity (Gray et al., 1992; Seymour et al.,1993). PG gene silencing can be achieved also by site-selected insertion (SSI).It has been shown that Ds insertions in PG exons caused at least a 1000-foldreduction in polygalacturonase levels in mutated plants (Cooley and Yoder,1998).
Pectin solubilization in fruits of transgenic tomato carrying antisense PG genewas retarded in comparison with fruits from wild-type plants. The composition ofcell wall fractions of mature green fruit from transgenic and wild-type plants wereindistinguishable except for trans-1,2-diaminocyclohexane-N,N,N′,N′-tetraacetic acid(CDTA)-soluble pectins of transgenic fruit, which had elevated levels of arabi-nose and galactose. Neutral polysaccharides and polyuronides increased in thewater-soluble fraction of wild-type fruit during ripening, and this was matched bya decline in Na2CO3-soluble pectins, equal in magnitude and timing. This, togetherwith compositional analysis showing increasing galactose, arabinose and rhamnosein the water-soluble fraction, mirrored by a decline of these same residues in theNa2CO3-soluble pectins, suggested that the polyuronides and neutral polysaccharidessolubilized by PG came from the Na2CO3-soluble fraction of the tomato cell wall.In addition to the loss of galactose from the cell wall resulting from PG activity,both antisense and control fruit exhibited an independent decline in galactose in boththe CDTA-soluble and Na2CO3-soluble fractions, which may play a role in fruit soft-ening (Carrington et al., 1993).
Transgenic fruits showed a significant decrease in softening during storage offresh market fruit relative to non-transgenic controls. In laboratory tests, fruitswith reduced PG were also shown to have increased resistance to Geotrichumcandidum and Rhizopus stolonifer, fungi which normally infect ripening fruits(Kramer et al., 1992). Transgenic fruits also have better processing properties. Thejuice pressed from them had significantly higher consistency and its pulp had higherviscosity (40–60%), better colour (30–40%) and many sensory attributes in com-parison with their conventional counterparts (Kramer et al., 1992; Poretta et al.,1998).
The antisense PG construct have been used in production the FLAVR SAVRTM
tomato, the first transgenic fruit with delayed ripening that has been successfullycommercialised (Kramer and Redenbaugh, 1994).
Modification of Fruit Ripening by Genetic Transformation 461

3.2.3.2. Polygalacturonase inhibitorsPolygalacturonase inhibitors are proteins that inhibit endo-polygalacturonases (endo-PGs) released by invasive fungi and are part of the defensive mechanism of plants.A gene encoding polygalacturonase-inhibiting protein has been cloned from rasp-berry (Ramanathan et al., 1996) and used for transformation of strawberry (Grahamet al., 1996). It is expected that transgenic fruits will be firmer and tolerant/resis-tant to Botrytis cinerea and other fungal infection.
3.2.3.3. Pectin methylesteraseAnother enzyme affecting the integrity of pectic substances is pectin methylesterase(pectinesterase, PE). Transgenic tomatoes carrying antisense construct of the genewere softening slower than the wild fruits. The effect was probably mediated bymagnesium and calcium ions binding to cell walls (Gaffe et al., 1994; Tieman andHanda, 1994).
3.2.3.4. CellulasePectin degradation during ripening of some fruits is not sufficient to explain theextent of their softening, suggesting the involvement of cell wall hydrolases otherthan polygalacturonase. It has been found that activity of cellulase (endo-1,4-∃-glucanase) and its gene expression increase significantly during ripening of tomato(Lashbrook et al., 1993), avocado (Tonutti et al., 1995), peach (Bonghi et al.,1994), mango (Abu Sarra and Abu Goukh, 1992) and pepper (Harpster and Lee,1997). However, antisense downregulation of glucanase activity in tomato resultedin an increase of the force required to break the fruit abscission zone but did notaffect fruit ripening (Brummell, Hall and Bennett, 1999).
Especially high expression of cellulase genes was observed in ripening straw-berries (Harpster et al., 1998; Llop-Tous et al., 1999). Since PG activity in thisnon-climacteric fruit is very low (Nogata et al., 1993), it may indicate that cellu-lase is a major enzyme affecting its softening. Therefore, the cellulase gene canbe a good candidate for transformation of this species in order to obtain a plantwith delayed ripening fruits.
3.2.3.5. ExpansinsExpansins are plant cell wall proteins proposed to disrupt hydrogen bonds withinthe cell wall polymer matrix and are associated with fruit ripening (Rose et al., 1997,Civello et al., 1999). In transgenic tomato suppression of Exp1 expansin gene sub-stantially inhibited polyuronide depolymerization late in ripening but did not preventthe breakdown of structurally important hemicelluloses, a major contributor tosoftening. In contrast, fruit overexpressing high levels of recombinant Exp1 proteinwere much softer than controls, even in mature green stage before ripening began(Brummell et al., 1999).
3.2.3.6. Enzymes affecting fruit colour and flavourAlcohol dehydrogenase (ADH) is an enzyme that is expressed in fruits in hypoxia(Podd and Staden, 1998). Overexpressing this gene in transgenic tomato caused
462 Lech Michalczuk

an increase of volatiles’ biosynthesis and improvement of fruit flavour (Speirs et al.,1998; Griffiths et al., 1999).
Carbohydrate content and balance play an important role in determining theflavour and processing quality of many fruits. As the fruit ripens, the sugar balancefavours the hexoses glucose and fructose rather than sucrose. In many fruit speciesinvertase (β-fructofuranosidase) is responsible for catalysing the breakdown ofsucrose. Invertase genes cloned from potato were integrated into strawberry.Transgenic plants are now being assessed for their growth, sugar balance, flavourand processing quality (Bachelier et al., 1997)
Fruit sweetness can be also enhanced by transformation with ‘sweet proteins’genes. A taumatin II gene Thaumatococcus daniellii has been introduced intoapple, pear and strawberry (Dolgov et al., 1999). The thaumatin II expression washigh in callus tissues but low in leaves of greenhouse-grown plants.
A cDNA clone encoding a putative dihydroflavonol 4-reductase (dihy-drokampferol 4-reductase) gene was isolated from a strawberry (Fragaria ananassacv. Chandler) DNA subtractive library. It is proposed that the putative dihy-droflavonol 4-reductase gene in strawberry plays a main role in the biosynthesisof anthocyanin during colour development at the late stages of fruit ripening andtherefore its overexpression could improve colour (Moyano et al., 1998).
4. ETHICAL AND SAFETY ASPECTS
The introduction of transgenic crops on the market triggered the bitter dispute. Viewsdiffer sharply over the risk and benefits – while some see it as a panacea forworld malnutrition problems, others treat it as a potential danger for humankindand natural environment. Much of the argument is emotive, with talk of ‘demonseeds’, ‘terminator technology’, ‘Frankenstein foods’, etc. Scientists must realise,however, that the general public is concerned and, therefore, the risks and benefitsmust be carefully tested.
The results of wholesale tests performed hitherto shows that the performanceof transgenic plants (except for the properties introduced by the specific gene orgenes) is within the natural range that could be created by any other traditional tech-nology such as mutagenesis or out-crossing and the concern about creating plantswith unknown properties unfounded. The FLAVR SAVRTM tomato, the first genet-ically engineered whole food on the market, was tested especially carefully. The datagenerated demonstrated that it does not significantly differ from traditionally bredtomato varieties, is functionally unchanged except for the intended effects of thepolygalacturonase and nptII genes, and as such remains a food and should be sub-jected to regulation as a food (Redenbaugh et al., 1992, 1994).
However, transgenic crops may be able to invade (or colonise) and multiply inmany habitats. Besides, transgenes can be incorporated into genomes of wild rela-tives by so-called horizontal gene transfer (via pollen). This is especially importantwhen an introduced trait gives a transgenic plant evolutionary advantage over herwild relatives. For example, plants resistant to pests and pathogens can quickly elim-
Modification of Fruit Ripening by Genetic Transformation 463

inate susceptible counter partners from their natural habitats. On the other hand,weeds that acquired resistance to herbicides would create problems on cultivatedlands. Therefore, the risk assessment of a genetically modified living organism mustconsider the risk to the environment.
Another problem constitutes horizontal gene transfer to not-engineered crops.It has been shown that dispersal of the native genes and transgenes is identical(Hokanson et al., 1997). Therefore spreading out transgenic traits is practicallyunavoidable. Because some consumers prefer to have ‘natural’ food that has notbeen modified by genetic engineering, this aspect of biotechnology must be seri-ously considered before realising transgenic plants.
Possible risk to humans and environment carries antibiotic resistance introducedto transgenic plants. Besides genes conferring usable traits, most transgenic plantscontain a selective gene necessary for selecting transformed cells at the early stagesof transformation. Typically it is aminoglycoside 3′-phosphotransferase II (APH(3′)[neomycin phosphotransferase (nptII)]. This gene contains FLAVR SAVRTM tomatoand many other transgenic crops. It has been suggested that this gene can move fromthe plant genome into microorganisms via horizontal gene transfer or that its productmay be toxic or allergenic to humans. The extensive clinical studies showed thatAPH(3′)II protein is safe and that its incidental incorporation into bacteria is unlikely(Redenbaugh et al., 1994; Noteborn et al., 1993). Based on those studies, theUnited States Food and Drug Administration’s Advisory Committee concludedthat it is safe for use as a processing aid in the development of new varieties ofagricultural crops. However, the public is still concerned and nowadays eitherother selective markers are used in transformation (like herbicide-resistance genes)or nptII is eliminated from transgenic plants, by the use of transposons in trans-formation, for example (Goldsbrough et al., 1993).
Despite many controversies, consumers accept transgenic food. Studies conductedin Europe and the United States (Dixon, 1995; Rothenberg and Macer, 1995) showthat both processed transgenic crops like soybean or corn and whole food like tomatoare generally accepted. It is concluded that consumers accept or reject productson their individual merits and not simply because they are bred traditionally or genet-ically engineered.
5. CONCLUSIONS
Striking progress has been made in the last several years in methods that permitthe identification, isolation and characterisation of a number of genes of potentialhorticultural importance. Although relatively few such genes have been transferredto fruit plants, this picture is now changing rapidly. Each year several new ripening-related genes are cloned from various fruit species. Their usefulness in geneticengineering of new crops with prolonged fruit shelf life and improved quality isbeing tested by genetic transformation.
The existing technologies enable to modify ripening of practically all climac-teric fruits. However, in many cases introduction of transgenic cultivars is noteconomically sound. For example, the existing technologies enable storage of apple
464 Lech Michalczuk

for up to one year without a loss of their quality and storage facilities in apple-producing countries are more than ample. Therefore, even though experiments ongenetic engineering ethylene biosynthesis in this species to delay fruit ripeningare conducted in several laboratories (Aldwinckle, 1998; James, 1998) the intro-duction of transgenic cultivars, in my opinion, is unlikely. On the other hand, softfruits, especially strawberry, cannot be stored effectively for a longer period of time,therefore, fruits with prolonged life would be of great importance. A big efforthas been made to determine and clone ripening-related genes in this fruit and onthe molecular control of its ripening. Therefore, some practical results can beexpected soon.
The future of genetically engineered fruits with delayed ripening depends moreon economics than on technology. Because development costs are very high, theexpected profits must be high, too. As a result, most transgenic plants cultivatednowadays are large area/high output crops. It must also be emphasised that trans-formation of woody species, including most fruit plants, is much more difficult(and therefore costly) than transformation of herbaceous ones such as soybean orcorn. Consequently, despite significant advancement in cloning ripening-relatedgenes and development of transformation method, no revolutionary changes canbe expected in that field in the next several years.
REFERENCES
Abeles, F. B. and F. Takeda (1990). Cellulase activity and ethylene in ripening strawberry and applefruits. Scientia Horticulturae 42: 269–275.
Abu-Sarra, A. F. and A. A. Abu-Goukh (1992). Changes in pectinesterase, polygalacturonase andcellulase activity during mango fruit ripening. Journal of Horticultural Science 67: 561–568.
Aldwinckle, H. and J. Norelli (1998). Genetic Engineering of Apple for Disease Resistance. AgritopeApple Biotechnology Workshop (on line). Cited 9.04.2001, available from: www.agritope.com/news/98AppleConference/resistance.htm
Alferez, F. and L. Zacarias (1999). Interaction between ethylene and abscisic acid in the regulationof Citrus fruit maturation. In A. K. Kanellis, C. Chang, H. Klee, A. B. Bleecker, J. C. Pech andD. Grierson (eds.), Biology and biotechnology of the plant hormone ethylene II. Proceedings ofthe EU-TMR Euroconference Symposium, Thira (Santorini), Greece, 5–8 September, 1998, KluwerAcademic Publishers, Dordrecht, Netherlands, pp. 183–184.
Archbold, D. D and F. G. Dennis (1984). Quantification of free ABA and free and conjugated IAAin strawberry achene and receptacle tissue during fruit development. J. American Society forHorticultural Science 109: 330–335.
Atkinson, R. G. and R. C. Gardner (1993). A polygalacturonase gene from kiwifruit (Actinidia deli-ciosa). Plant Physiology 103: 669–670.
Bachelier, C., J. Graham, G. Machray, J. Manoir, J. F. Roucou, R. J. McNicol, H. Davies andJ. Dijkstra (1997). Integration of an invertase gene to control sucrose metabolism in strawberrycultivars. Acta Horticulturae 439: 161–163.
Bandurski, R. S. (1979). Homeostatic control of concentration of indole-3-acetic acid. In F. Skoog(ed.), Plant growth substances 1979. Springer-Verlag, Berlin and Heidelberg, pp. 37–49.
Biale, J. B. and E. E. Young (1971). The avocado pear. In A. C. Hulme (ed.), The biochemistry offruit and their products. Academic Press, London, pp. 1–63.
Biggs, M. S. and A. K. Handa (1989). Temporal regulation of polygalacturonase gene expression infruits of normal, mutant, and heterozygous tomato genotypes. Plant Physiology 89: 117–125.
Blanpied, G. D. (1993). Studies of the ‘tree factor’ that inhibits the ripening of attached apples. ActaHorticulturae 343: 6–11.
Modification of Fruit Ripening by Genetic Transformation 465

Bleecker, A. B., M. A. Estelle, C. Somerville and H. Kende (1988). Insensitivity to ethylene con-ferred by a dominant mutation in Arabidopsis thaliana Science 242: 1086–1089.
Bleecker, A. B., W. H. Kenyon, S. C. Somerville and H. Kende (1986). Use of monoclonal antibodiesin the purification and characterization of 1-aminocyclopropane-1-carboxylate-synthase, an enzymein ethylene biosynthesis. Proc. Natl. Acad. Sci. USA 83: 7755–7759.
Bolitho, K. M., M. Lay-Yee, M. L. Knighton and G. S. Ross (1997). Antisense apple ACC-oxidase RNAreduces ethylene production in transgenic tomato fruit. Plant Science 122: 91–99.
Bonghi, C., B. Ruperti, A. Rasori, P. Tonutti and A. Ramina (1999). Organization and structure of 1-aminocyclopropane-1-carboxylate oxidase gene family from peach. In A. K Kanellis, C. Chang,H. Klee, A. B. Bleecker, J. C. Pech and D. Grierson (eds.), Biology and biotechnology of the planthormone ethylene II. Proceedings of the EU-TMR Euroconference Symposium, Thira (Santorini),Greece, 5–8 September, 1998, Kluwer Academic Publishers, Dordrecht, Netherlands, pp. 31–32.
Bonghi, C., S. Ruzzon, P. Tonutti, A. Ramina and M. Sattin (1994). Peach fruit ripening: the involve-ment of cellulase and polygalacturonase. In M. Borin (ed.), Proceedings of the third congress ofthe European society for agronomy. Padova University, Abano-Padova, Italy, 18–22 September 1994,pp. 580–581.
Brady, C. J. and G. I. Johnson (1994). Biochemical and molecular approaches to fruit ripening and senes-cence. In B. R. Champ and E. Highley (eds.), Postharvest handling of tropical fruits. Proceedingsof an International Conference, Chiang Mai, Thailand, 19–23 July 1993, pp. 205–217.
Brummell, D. A., M. H. Harpster, P. M. Civello, J. M. Palys, A. B. Bennett and P. Dunsmuir (1999).Modification of expansin protein abundance in tomato fruit alters softening and cell wall polymermetabolism during ripening. Plant Cell 11: 2203–2216.
Brummell, D. A., B. D. Hall and A. B. Bennett (1999). Antisense suppression of tomato endo-1,4-beta-glucanase Cel2 mRNA accumulation increases the force required to break fruit abscission zonesbut does not affect fruit softening. Plant Moecular Biology 40: 615–622.
Carrington, C. M. S., L. C. Greve and J. M. Labavitch (1993). Cell wall metabolism in ripening fruit.VI. Effect of the antisense polygalacturonase gene on cell wall changes accompanying ripening intransgenic tomatoes. Plant Physiology 103: 429–434.
Cazzonelli, C. I., A. S. Cavallaro and J. R. Botella (1998). Cloning and characterisation of ripening-induced ethylene biosynthetic genes from non-climacteric pineapple (Ananas comosus) fruits.Australian Journal of Plant Physiology 25: 513–518.
Chopra, S. K. (1991). Recent advances in the understanding of gene expression in ripening fruit – areview. Agric. Rev. 12: 55–65.
Civello, P. M., A. L. T. Powell, A. Sabehat and A. Bennett (1999). An expansin gene expressed inripening strawberry fruit. Plant Physiology 121: 1273–1279.
Clendennen, S. K., J. A. Kellogg, K. A. Wolff, W. Matsumura, S. Peters, J. E. Vanwinkle, B. Copes,M. Pieper and M. G. Kramer (1999). Genetic engineering of cantaloupe to reduce ethylene biosyn-thesis and control ripening. In A. K. Kanellis, C. Chang, H. Klee, A. B. Bleecker, J. C. Pech andD. Grierson (eds.), Biology and biotechnology of the plant hormone ethylene II. Proceedings ofthe EU-TMR Euroconference Symposium, Thira (Santorini), Greece, 5–8 September, 1998, KluwerAcademic Publishers, Dordrecht, Netherlands, pp. 371–379.
Cooley, M. B. and J. I. Yoder (1998). Insertional inactivation of the tomato polygalacturonase gene.Plant Molecular Biology 38: 521–530.
Czapski, J. and M. Saniewski (1992). Stimulation of ethylene production and ethylene-forming enzymeactivity in fruits of the non-ripening nor and rin tomato mutants by methyl jasmonate. Journal ofPlant Physiology 139: 265–268.
De Block, M., L Herrera-Estrella., M. Van Montagu, J. Schell and P. Zambryski (1984). Expressionof foreign genes in regenerated plants and their progeny. EMBO J. 6: 2513–2518.
Dixon, B. (1995). Biotech consumers discriminate. Bio-Technology 13: 20–21.Dolgov, S. V., V. G. Lebedev, A. P. Firsov, S. A. Taran, G. B. Tjukavin and M. A. Pagnotta (1999).
Expression of thaumatin II gene in horticultural crops. In G. T. Scarascia-Mugnozza and E. Porceddu(eds.), Genetics and breeding for crop quality and resistance. Proceedings of the XV EUCARPIACongress, Viterbo, Italy, 20–25 September 1998, Kluwer Academic Publishers, Dordrecht,pp. 165–172.
Dopico, B., A. L. Lowe, I. D. Wilson, C. Merodio and D. Grierson (1993). Cloning and characteriza-
466 Lech Michalczuk

tion of avocado fruit mRNAs and their expression during ripening and low-temperature storage. PlantMolecular Biology 21: 437–449.
Drecher, T. W. and B. Poovayah (1982). Changes in auxin content during development of strawberryfruits. Journal of Growth Regulators 1: 267–276.
Fan, X. T., J. P. Mattheis and J. K. Fellman (1998). A role for jasmonates in climacteric fruit ripening.Planta 204: 444–449.
Fan, X. T. and J. K. Mattheis (1999). Impact of 1-methylcyclopropene and methyl jasmonate on applevolatile production. Journal of Agriculture and Food Chemistry 47: 2847–2853.
Ficcadenti, N., S. Sestili, T. Pandolfini, C. Cirillo, G. L. Rotino and A. Spena (1999). Genetic engi-neering of parthenocarpic fruit development in tomato. Molecular Breeding 5: 463–470.
Frenkel, C. and R. Dyck (1973). Auxin inhibition of ripening in Bartlet pears. Plant Physiology 51:6–9.
Gaffe, J., D. M. Tieman and A. K. Handa (1994). Pectin methylesterase isoforms in tomato (Lycopersiconesculentum) tissues. Effects of expression of a pectin methylesterase antisense gene. Plant Physiology105: 199–203.
Given, N. K., M. A. Venis and D. Grierson (1988). Hormonal regulation of ripening in the straw-berry, a non-climacteric fruit. Planta 174: 402–406.
Glass, N. L. and T. Kosuge (1986). Cloning of the gene for indoleacetic acid-lysine synthetase fromPseudomonas syringae subsp. savastanoi. J. Bacteriology 166: 598–603.
Goldsbrough, A. P., C. N. Lastrella and J. I. Yoder (1993). Transposition mediated re-positioning andsubsequent elimination of marker genes from transgenic tomato. Bio-Technology 11: 1286–1292.
Good, X., J. A. Kellogg, W. Wagoner, D. Langhoff, W. Matsumura and R. K. Bestwick (1994). Reducedethylene synthesis by transgenic tomatoes expressing S-adenosylmethionine hydrolase. Plant Mol.Biol. 26: 781–790.
Graham, J., S. C. Gordon and B. Williamson (1996). Progress towards the use of transgenic plants asan aid to control soft fruit pests and diseases. Brighton Crop Protection Conference: Pests & Diseases.Brighton, UK, 18–21 November 1996, vol. 3, pp. 777–782.
Gray, J., S. Picton, J. Shabbeer, W. Schuch and D. Grierson (1992). Molecular biology of fruit ripeningand its manipulation with antisense genes. Plant Mol. Biol. 19: 69–87.
Grierson, D. and W. Schuch (1993). Control of ripening. Philosophical Transactions of the Royal Societyof London. Series B – Biological Sci. 342: 241–250.
Griffiths, A., S. Prestage, R. Linforth, J. L. Zhang, A. Taylor and D. Grierson (1999). Fruit-specificlipoxygenase suppression in antisense-transgenic tomatoes. Postharvest Biol. Technol. 17: 163–173.
Guis, M., M. B. Amor, R. B. Botondi, R. Ayub, A. Latche, M. Bouzayen, J. C. Pech and J. D. Quinlan(1998). Ethylene and biotechnology of fruit ripening: Pre- and postharvest behaviour of transgenicmelons with inhibited ethylene production. Acta Hortic. 463: 31–37.
Hadfield, K. A., J. K. C. Rose, D. S. Yaver, R. M. Berka and A. B. Bennett (1998). Polygalacturonasegene expression in ripe melon fruit supports a role for polygalacturonase in ripening-associated pectindisassembly. Plant Physiol. 117: 363–373.
Hagedorn, C. (2001). Transgenic crops (on line). [cited 2001-04-6], available from <http://filebox.vt.edu/cals/cses/chagedor/crops.html>.
Hamilton, A. J., S. Brown, Y. H. Han, M. Ishizuka, A. Lowe, A. G. A. Solis and D. Grierson (1998).A transgene with repeated DNA causes high frequency, post-transcriptional suppression of ACC-oxidase gene expression in tomato. Plant J. 15: 737–746.
Hamilton, A. J., G. W. Lycett and D. Grierson (1990). Antisense gene that inhibits synthesis of thehormone ethylene in transgenic plants. Nature 346: 284–287.
Hansen, E. (1966). Postharvest physiology of fruits. Annual Review of Plant Physiology 17: 459–480.Harpster, M. H., K. Y. Lee and P. Dunsmuir (1997). Isolation and characterization of a gene encoding
endo-β-1,4-glucanase from pepper (Capsicum annuum L.). Plant Molecular Biology 33: 47–59.Harpster, M. H., D. A. Brummell and P. Dunsmuir (1998). Expression analysis of a ripening-specific,
auxin-repressed endo-1,4-β-glucanase gene in strawberry. Plant Physiology 118: 1307–1316.Hartmann, C. (1992). Biochemical changes in harvested cherries. Postharvest Biology and Technology
1: 231–240.Hokanson, S. C., J. F. Hancock and R. Grumet (1997). Direct comparison of pollen-mediated movement
of native and engineered genes. Euphytica 96: 397–403.
Modification of Fruit Ripening by Genetic Transformation 467

James, D. (1998). Genetic modification of top and soft fruit – Progress at East Malling and the Europeanperspective. Agritope Apple Biotechnology Workshop (on line) [Cited 9.04.2001], available from:www.agritope.com/news/98AppleConference/resistance.
Jones, C. S., H. V. Davies, R. J. McNicol and M. A. Taylor (1998). Cloning of three genes up-regu-lated in ripening raspberry fruit (Rubus idaeus cv. Glen Clova). Journal of Plant Physiology 153:643–648.
Kano, Y. and T. Ashira (1979). Effect of some plant growth regulators on the development ofstrawberry fruits in in vitro culture. Journal of Japenese Society for Horticultural Science 47:463–472.
Kawata, T., K. Tanabe, F. Tamura, M. Uchiyama, M. Tomomitsu and N. Shiraiwa (1999). Identificationof 1-aminocyclopropane-1-carboxylic acid synthase genes controlling the ethylene level of ripeningfruit in Japanese pear. Molecular General Genet. 261: 42–49.
Kid, F. and C. West (1933). The influence of composition of the atmosphere upon the incidence ofthe climacteric in apples. Ann. Rep. Food Invest. Board, London, pp. 51–57.
Klee, H. J. (1993). Ripening physiology of fruit from transgenic tomato (Lycopersicon esculentum)plants with reduced ethylene synthesis. Plant Physiology 102: 911–916.
Klein, T. M., E. D. Wolf, R. Wu and J. C. Sanfor (1987). High-velocity microprojectiles for deliv-ering nucleic acids into living cells. Nature 327: 70–73.
Knapp, J., P. Moureau, W. Schuch and D. Grierson (1989). Organization and expression of poly-galacturonase and other ripening related genes in Ailsa Craig ‘Neverripe’ and ‘Ripening inhibitor’tomato mutants. Plant Molecular Biology 12: 105–116.
Knee, M., J. A. Sargent and D. G. Osborne (1977). Cell wall metabolism in developing strawberry fruits.J. Exp. Bot. 28: 377–396.
Kondo, S., K. Inoue, and M. Tamaki (1999). Changes of abscisic acid and its metabolite during devel-opment of apple fruit. Journal of Horticultural Science and Biotechnology 74: 762–767.
Kosuge, T., M. G. Heskett and E. E. Wilson (1966). Microbial synthesis and degradation of indole-3-acetic acid. I. The conversion of L-tryptophan to indole-3-acetamide by an enzyme system fromPseudomonas sevastani. Journal of Biology and Chemistry 241: 3738–3744.
Kramer, M., R. Sanders, H. Bolkan, C. Waters, R.E. Sheehy and W. Hiatt (1992). Postharvest evalu-ation of transgenic tomatoes with reduced levels of polygalacturonase: Processing, firmness anddisease resistance. Postharvest Biology and Technology 1: 3, 241–255.
Kramer, M. G. and K. Redenbaugh (1994). Commercialization of a tomato with an antisense poly-galacturonase gene: The FLAVR SAVRTM tomato story. Euphytica 79: 293–297.
Lanahan, M. B., H.C. Yen, J. J. Giovannoni and H. J. Klee (1994). The Never ripe mutation blocksethylene perception in tomato. Plant Cell 6: 521–530.
Lashbrook, C. C., A. B. Bennett and C. Balague (1993). Functional analysis of Cx-cellulase (endo-β-1,4-glucanase) gene expression in transgenic tomato fruit. In J. C. Pech and A. Latche (eds).,Cellular and molecular aspects of the plant hormone ethylene. Proceedings of the InternationalSymposium on Cellular and Molecular Aspects of Biosynthesis and Action of the Plant HormoneEthylene, Agen, France, 31 August–4 September 1992, Kluwer Academic Publishers, Dordrecht,Netherlands, pp. 123–128.
Lay-Yee, M. and M. L. Knighton (1995). A full-length cDNA encoding 1-aminocyclopropane-1-car-boxylate synthase from apple. Plant Physiology 107: 1017–1018.
Lee, E., J. Speirs, J. Gray and C. J. Brady (1990). Homologies to the tomato endopolygalacturonasegene in the peach genome. Plant Cell Environment 13: 513–521.
Lee, K. Y., C. Baden, W. J. Howie, J. Bedbrook and P. Dunsmuir (1997). Post-transcriptional genesilencing of ACC synthase in tomato results from cytoplasmic RNA degradation. Plant Journal12: 1127–1137.
Llop-Tous, I., E. Dominguez-Puigjaner, X. Palomer and M. Vendrell (1999). Characterization of twodivergent endo-beta-1,4-β-glucanase cDNA clones highly expressed in the nonclimacteric strawberryfruit. Plant Physiology 119: 1415–1421.
Manning, K. (1993). Soft fruits. In G. Seymour, S. Taylor and G. Tucker (eds.), Biochemistry of fruitripening. Chapman and Hall, London, pp. 347–377.
Martinez, G. A., A. R. Chaves and M. C. Anon (1996). Effect of exogenous application of gibberellicacid on color change and phenylalanine ammonia-lyase, chlorophyllase, and peroxidase activities
468 Lech Michalczuk

during ripening of strawberry fruit (Fragaria × ananassa Duch.). Journal of Plant Growth Regulators15: 139–146.
Mathews, H., W. Wagoner, C. Cohen, J. Kellogg and R. Bestwick (1995). Efficient genetic transfor-mation of red raspberry, Rubus ideaus L. Plant Cell Rep. 14: 471–476.
Mathews, H., W. Wagoner, J. Kellogg and R. Bestwick (1995). Genetic transformation of strawberry:stable integration of a gene to control biosynthesis of ethylene. In Vitro Cellular and Develop. BiologyPlant 31: 36–43.
Mezzetti, B., L. Landi, L. Scortichini, M. Mazzara, T. Pandolfini and A. Spena (2000). Proof ofconcept of parthenocarpic fruit development in strawberry caused by the expression of the DefH9-iaaM gene. In T. Hietaranta and M.-M. Linna (eds.), Book of abstracts, 4th International StrawberrySymposium. Tampere, Finland, 9–14 July 2000, p. 27.
Mita, S., S. Kawamura, K. Yamawaki, K. Nakamura and H. Hyodo (1998). Differential expression ofgenes involved in the biosynthesis and perception of ethylene during ripening of passion fruit(Passiflora edulis Sims). Plant Cell Physiology 39: 1209–1217.
Mizrahi, Y., H. C. Dostal, W. B. McGlasson and J. H. Cherry (1975). Effects of abscisic acid andbenzyladenine on fruits of normal and rin mutant tomatoes. Plant Physiology 56: 544–46.
Moyano, E., I. Portero-Robles, N. Medina-Escobar, V. Valpuesta, J. Munoz-Blanco and J. L. Caballero(1998). A fruit-specific putative dihydroflavonol 4-reductase gene is differentially expressed in straw-berry during the ripening process. Plant Physiology 117: 711–716.
Mudge, K. W., K. R. Narayanan and B. W. Poovaiah (1981). Control of strawberry fruit set anddevelopment with auxins. Journal of American Society for Horticultural Science 106: 80–84.
Murray, A. J., G. E. Hobson, W. Schuch and C. R. Bird (1993). Reduced ethylene synthesis in EFEantisense tomatoes has differential effects on fruit ripening processes. Postharvest Biolology andTechnology 2: 301–313.
Nagata, M., H. Mori, Y. Tabei, T. Sato, M. Hirai and H. Imaseki (1995). Modification of tomato fruitripening by transformation with sense or antisense chimeric 1-aminocyclopropane-1-carboxylatesynthase genes. Acta Horticulturae 394: 213–218.
Nakajima, N. and H. Imaseki (1986). Purification and properties of 1-aminocyclopropane-1-carboxy-late synthase of mesocarp of Cucurbita maxima Duch. fruits. Plant Cell Physiology 27: 969–980.
Nakatsuka, A., S. Murachi, H. Okunishi, S. Shiomi, R. Nakano, Y. Kubo and A. Inaba (1998).Differential expression and internal feedback regulation of 1-aminocyclopropane-1-carboxylatesynthase, 1-aminocyclopropane-1-carboxylate oxidase, and ethylene receptor genes in tomato fruitduring development and ripening. Plant Physiology 118: 1295–1305.
Neupane, K. R., U. T. Mukatira, C. Kato, J. I. Stiles and R. A. Drew (1998). Cloning and character-ization of fruit-expressed ACC synthase and ACC-oxidase from papaya (Carica papaya L.). ActaHorticulturae 461: 329–337.
Nitch, J. P. (1950). Growth and morphogenesis of the strawberry as related to auxin. American Journalof Botany 37: 211–215.
Nogata, Y., H. Ohta and A. G. J. Voragen (1993). Polygalacturonase in strawberry fruit. Phytochemistry34: 617–620.
Noteborn, H. P. J. M., M. E. Bienenmann-Ploum, J. H. J. Berg, G. A. Alink, L. Zolla and H. A.Kuiper (1993). Food safety of transgenic tomatoes expressing the insecticidal crystal protein CryIA(b)from Bacillus thuringiensis and the marker enzyme APH(3′)11. Mededelingen van de FaculteitLandbouwwetenschappen, Universiteit Gent. 58(4b): 1851–1858.
Oard, J. H., D. F. Paige, J. A. Simmonds and T. M. Gradzial (1990). Transient gene expression in maize,rice and wheat cells using an airgun apparatus. Plant Physiology 92: 334–339.
Oeller, P. W., M. W. Lu, L. P. Taylor, D. A. Pike and A. Theologis (1991). Reversible inhibition oftomato fruit senescence by antisense RNA. Science 254: 437–439.
Oetiker, J. H., D. C. Olson, Y. S. Oi and F. Y. Shang (1997). Differential induction of seven 1-aminocyclopropane-1-carboxylate synthase genes by elicitor in suspension cultures of tomato(Lycopersicon esculentum). Plant Mol. Biol. 34: 275–286.
Rose, J. K. C., H. H. Lee and A. B. Bennett (1997). Expression of a divergent expansin gene is fruit-specific and ripening-regulated. Proc. Nat. Acad. Sci. USA 94: 5955–5960.
Pech, J. C., M. Guis, R. Botondi, R. Ayub, M. Bouzayen, J. M. Lelievre, F. El Yahyaoui andA. Latche (1999). Ethylene-dependent and ethylene-independent pathways in a climacteric fruit,
Modification of Fruit Ripening by Genetic Transformation 469
the melon. In A. K. Kanellis, C. Chang, H. Klee, A. B. Bleecker, J. C. Pech and D. Grierson(eds.), Biology and biotechnology of the plant hormone ethylene II. Proceedings of the EU-TMREuroconference Symposium, Thira (Santorini), Greece, 5–8 September, 1998, Kluwer AcademicPublishers; Dordrecht; Netherlands, pp. 105–110.
Picton, S., S. L. Barton, M. Bouzayen, A. J. Hamilton and D. Grierson (1993). Altered fruit ripeningand leaf senescence in tomatoes expressing an antisense ethylene-forming enzyme transgene. PlantJournal 3: 469–481.
Picton, S., J. Gray, S. Barton, U. Abu Bakar, A. Lowe and D. Grierson (1993). cDNA cloning andcharacterisation of novel ripening-related mRNAs with altered patterns of accumulation in theripening inhibitor (rin) tomato ripening mutant. Plant of Molecular Biology 23: 193–207.
Plich, H., L. Sas and A. Miszczak. (1995). Ethylene production, 1-aminocyclopropane-1-carboxylic acid(ACC) content and the ACC-conversion capability in strawberry fruits in consecutive stages oftheir growth and ripening. Journal of Fruit and Ornamentals. Plant Res. 39–52.
Podd, L. A. and J. Staden (1998). The role of ethanol and acetaldehyde in flower senescence andfruit ripening – a review. Plant Growth Regulator 26: 3, 183–189.
Porretta, S., G. Poli and E. Minuti (1998). Tomato pulp quality from transgenic fruits with reduced poly-galacturonase (PG). Food Chemistry 62: 283–290.
Ramanathan, V., C. G. Simpson, G. Thow, P. P. M. Iannetta, R. J. McNicol and B.Williamson (1997).cDNA cloning and expression of polygalacturonase-inhibiting proteins (PGIPs) from red raspberry(Rubus idaeus). Journal of Experimental Botany 48: 1185–1193.
Redenbaugh, K., W. Hiatt, B. Martineau and D. Emlay (1994). Regulatory assessment of the FLAVRSAVR tomato. Trends in Food Science and Technology 5: 105–110.
Redenbaugh, K., W. Hiatt, B. Martineau, M. Kramer, R. Sheehy, R. Sanders, C. Houck and D. Emlay(1992). Safety assessment of genetically engineered fruits and vegetables: A case study of the FLAVRSAVRTM tomato. CRC Press, Boca Raton, FL, USA.
Redenbaugh, K., W. Hiatt, B. Martineau, J. Lindemann and D. Emlay (1994). Aminoglycoside 3′-phosphotransferase II (APH(3′)II): Review of its safety and use in the production of geneticallyengineered plants. Food Biotechnol. 8: 137–165.
Rothenberg, L. and D. Macer (1995). Public acceptance of food biotechnology in the USA. Biotechnol.Development Monitor 24: 10–13.
Rotino, G. L., E. Perri, M. Zottini, H. Sommer and A. Spena (1997). Genetic engineering of partheno-carpic plants. Nature 15: 1398–1401.
Saniewski, M., J. Ueda and K. Miyamoto (1999). Interaction of ethylene with jasmonates in the reg-ulation of some physiological processes in plants. In A. K. Kanellis, C. Chang, H. Klee, A. B.Bleecker, J. C. Pech and D. Grierson (eds.), Biology and biotechnology of the plant hormone ethyleneII. Proceedings of the EU-TMR Euroconference Symposium, Thira (Santorini), Greece, 5–8September, 1998,. Kluwer Academic Publishers, Dordrecht, Netherlands, pp. 173–180.
Sato Nara, K., K. I. Yuhashi, K. Higashi, K. Hosoya, M. Kubota and H. Ezura (1999). Stage- and tissue-specific expression of ethylene receptor homolog genes during fruit development in muskmelon.Plant Physiology 120: 321–329.
Sato, T. and A. Theologis (1989). Cloning the mRNA encoding 1-aminocyclopropane-1-carboxylatesynthase, the key enzyme for ethylene biosynthesis in plants. Proc. Natl Acad. Sci. USA 86:6621–6625.
Schirra, M., G. D’hallewin, P. Inglese and T. Mantia (1999). Epicuticular changes and storage poten-tial of cactus pear [Opuntia ficus-indica Miller (L.)] fruit following gibberellic acid preharvest spraysand postharvest heat treatment. Postharvest Biology and Technology 17: 79–88.
Schneider, E. A. and F. Wightman (1974). Metabolism of auxin in higher plants. Annual Review of PlantPhysiology 25: 487–513.
Seymour, G., J. Taylor and G. Tucker (1993). Biochemistry of Fruit Ripening. Chapmann and Hall,London.
Seymour, G. B., R. G. Fray, P. Hill and G. A. Tucker (1993). Down-regulation of two non-homolo-gous endogenous tomato genes with a single chimaeric sense gene construct. Plant Molecular Biology23: 1–9.
Sheehy, R. E., V. Ursin, S. Vanderpan, W. R. Hiatt and C. Balague (1993). Expression of a bacterialACC deaminase gene in tomato. In J. C. Pech and A. Latche (ed.), Cellular and molecular aspects
470 Lech Michalczuk

of the plant hormone ethylene. Proceedings of the International Symposium on Cellular and MolecularAspects of Biosynthesis and Action of the Plant Hormone Ethylene, Agen, France, 31 August–4September, Kluwer Academic Publishers, Dordrecht, Netherlands, pp. 106–110.
Sitrit, Y. and A. B. Bennett (1998). Regulation of tomato fruit polygalacturonase mRNA accumula-tion by ethylene: A re-examination. Plant Physiology 116: 1145–1150.
Speirs, J., E. Lee, K. Holt, Y. D. Kim, N. S. Scott, B. Loveys and W. Schuch (1998). Genetic manip-ulation of alcohol dehydrogenase levels in ripening tomato fruit affects the balance of some flavoraldehydes and alcohols. Plant Physiology 117: 1047–1058.
Szerszen, J. B., K. Szczyglowski and R. S. Bandurski (1994). iaglu, a gene from Zea mays involvedin conjugation of growth hormone indole-3-acetic acid. Science 265: 1699–1701.
Theologis, A. (1992). One rotten apple spoils the whole bushel: The role of ethylene in fruit ripening.Cell 70: 181–184.
Theologis, A., P. W. Oeller, L. M. Wong, W. H. Rottmann and D. M. Gantz (1993). Use of a tomatomutant constructed with reverse genetics to study fruit ripening, a complex developmental process.Dev. Genet. 14: 282–295.
Thomashow, L. S., S. Reeves and M. F. Thomashow (1984). Crown gall oncogenesis: evidence thatT-DNA gene from Agrobacterium Ti plasmid pTiA6 encodes an enzyme that catalyses synthesisof indole-3-acetic acid. Proc. Natl. Acad. Sci. USA 80: 5071–5075.
Tieman, D. M. and A. K. Handa (1994). Reduction in pectin methylesterase activity modifies tissueintegrity and cation levels in ripening tomato (Lycopersicon esculentum Mill.) fruits. Plant-Physiology106: 429–436.
Tonutti, P., L. G. Cass and R. E. Christoffersen (1995). The expression of cellulase gene family membersduring induced avocado fruit abscission and ripening. Plant Cell Environment. 18: 709–713.
Tonutti, P., C. Bonghi, B. Ruperti, A. Scapin and A. Ramina (1999). An arabidopsis ETR1 homo-logue is constitutively expressed in peach fruit abscission zone and mesocarp. In A. K. Kanellis,C. Chang, H. Klee, A. B. Bleecker, J. C. Pech and D. Grierson (eds.), Biology and biotechnologyof the plant hormone ethylene II. Proceedings of the EU-TMR-Euroconference Symposium, Thira(Santorini), Greece, 5–8 September, Kluwer Academic Publishers, Dordrecht, Netherlands,pp. 267–268.
Tucker, G. A. and D. Grierson (1987). Fruit Ripening. In D. D. Davies (ed.), The biochemistry of plants.Vol. 12. Physiology and metabolism. Academic Press, pp. 265–318.
Van Onckelen, H., E. Prinsen, D. Inze, P. Rudelsheim, M. Van Lijsebettens, A. Follin, J. Schell,M. Van Montagu and J. DeGreef (1986). Agrobacterium T-DNA gene 1 codes for tryptophan-2-monooxygenase activity in tobacco crown gall cells. FEBS Lett. 198: 357–360.
Vendrell, M. (1969). Reversion of senescence: effect of 2,4-dichlorphenoxyacetic acid and indole-aceticacid on respiration, ethylene production ad ripening n banana fruit slices. Australian Journal ofBiology and Science 22: 601–610.
Vendrell, M. (1985). Dual effect of 2,4-D on ethylene production and ripening of tomato fruit tissue.Physiology Plantarium 64: 559–563.
Wawrzynczak, D., I. Sowik and L. Michalczuk (2000). Transgeniczna truskawka zawierajaca gensyntetazy estru glukozowego kwasy indolilooctoweg (iaglu) z kukurydzy. Biotechnologia 4(51):103–106.
Wilkinson, J.Q., M. B. Lanahan, H. C. Yen, J. J. Giovannoni and H. J. Klee (1995). An ethylene-induciblecomponent of signal transduction encoded by Never-ripe. Science 270: 1807–1808.
Wilkinson, J. Q., M. B. Lanahan, D. G. Clark, A. B. Bleecker, C. Chang, E. M. Meyerowitz andH. J. Klee (1997). A dominant mutant receptor from Arabidopsis confers ethylene insensitivity inheterologous plants. Nature Biotechnology. 15: 444–447.
Wright, A. D., M. B. Sampson, M. G. Neuffer, L. Michalczuk, J. P. Slovin and J. D. Cohen (1991).Indole-3-acetic biosynthesis in the mutant maize orange pericarp, a tryptophan auxotroph. Science254: 998–1000.
Yang, S. F., J. H. Oetiker and R. Sakiyama (1998). Molecular biology of ethylene biosynthesisand its application in horticulture. Journal of Japenese Society for Horticultural Science. 67:1209–1214.
Ye, Z. B., H. X. Li and X. J. Liu (1999). A new transgenic tomato cultivar – Bioscien bred with anti-sense EFE cDNA. China Vegetables 1: 6–10 (in Chinese, cited after HORTCD 1989-2000/06).
Modification of Fruit Ripening by Genetic Transformation 471

Young, S. F. and N. E. Hofmann (1984). Ethylene biosynthesis and its regulation in higher plants.Ann. Rev. Plant Physiology 35: 155–189.
Zambryski, P., H. Joose, C. Genetello, J. Leemans, M. Van Montagu and J. Schell (1983). Ti plasmidvector for the introduction of DNA into plant cell without alteration of their natural regenerationcapacity. EMBO J. 2: 2143–2150.
Zarembinski, T. I. and A. Theologis (1994). Ethylene biosynthesis and action: A case of conserva-tion. Plant Molecular Biology 26: 1579–1597.
Zhang, W. and Z. S. Lu (1983). Relationship between abscisic acid and apricot (Prunus armeniaca) fruitripening. Acta Bot. Sin. 25: 537–543.
Zilkah, S., S. Lurie, Z. Lapsker, Y. Zuthi, I. David, Y. Yesselson, S. Antman and R. Ben Arie (1997).The ripening and storage quality of nectarine fruits in response to preharvest application of gib-berellic acid. Journal of Horticultural Science 72: 355–362.
472 Lech Michalczuk

QUALITY OF EQUILIBRIUM MODIFIED ATMOSPHEREPACKAGED (EMAP) FRESH-CUT VEGETABLES
LIESBETH JACXSENS, FRANK DEVLIEGHERE AND JOHAN DEBEVERELaboratory of Food Microbiology and Food Preservation, Faculty of Agricultural and AppliedBiological Sciences, University of Ghent, Coupure links 653, 9000 Gent, Belgium
1. INTRODUCTION
Minimally processed vegetables are fresh vegetables that have been subjected toprocessing operations such as cutting, chopping, shredding, peeling, washing etc.before being presented for sale. They are marketed on expanded polystyrene or PVCtrays, wrapped by stretch film, but may also be in pillow packs with differenttypes of polymeric films (Nguyen-the and Carlin, 1994; Day, 2001). All of thesemethods involve processing procedures that change the inherent fresh-like qualityattributes of the food product as little as possible, while providing sufficient shelflife to allow distribution to the consumer (Ohlsson, 1994; Alzamora et al., 2000b).Many synonyms are used for the term ‘minimally processed vegetables’, and theseinclude ‘lightly processed’, ‘fresh prepared’, ‘partially processed’, ‘pre-cut’, ‘ready-to-eat’ and ‘fresh-cut’ produce (Day, 2001). These types of products are indicatedin France as ‘légumes de la 4e gamme’ referring to the fourth form of trading,preceded by fresh (raw vegetables), canned and frozen vegetables (CNERNA-CNRS,1996). A general flow sheet for minimally processed refrigerated vegetables is shownin Figure 1.
Raw vegetables (the primary product) may undergo no process at all, or be washedand sorted before being placed into bags, boxes or crates (CNERNA-CNRS, 1996;ICMSF, 1998). Due to processing, ready-to-eat vegetables will have different phys-iological responses than untreated intact plant tissue: minimal processing drasticallyincreases the physiological activity, leading more rapidly to senescence. Moreover,the primary product has natural barriers against microbial invasion, which areoften lost due to processing. Fresh-cut vegetables are, therefore, intrinsicallyperishable (Martens, 1999; Martinez et al., 2000). The main features of minimallyprocessed vegetables are (1) the presence of cut surfaces or damaged plant tissues,(2) absence of certainty regarding sterility or microbial stability of the productand (3) active metabolism of the plant tissue. Consequently, spoilage of fresh-cutvegetables is at the same time autolytic (physiological) and microbiological.Refrigeration and packaging may be optional for raw vegetables, but are manda-tory for the minimally processed ones in order to slow down these processes.
The various types of fresh-cut vegetables can be divided into single commoditypacks of ready-to-eat washed, sliced, chopped or shredded vegetables or mixturesof different kinds of vegetables. A difference can also be made between the products,which are consumed raw such as baton carrots, mixed lettuces, and the products,which are cooked before consumption as soup vegetables or broccoli florets.Sometimes, they are combined with a dressing or mayonnaise or pasteurised products
R. Dris and S. M. Jain (eds.), Production Practices and Quality Assessment of Food Crops,
© 2004 Kluwer Academic Publishers. Printed in the Netherlands.
473
Vol. 3, “Quality Handling and Evaluation”, pp. 473–523.

such as cheese or pastas (ICMSF, 1998; Francis et al., 1999; Thomas et al.,1999).
As an answer to consumer demand of nutritious, fresh-like, tasty convenienceproducts, minimally processed vegetables originated in the 1980s in the UK and30 years ago in the USA, mostly intended for the catering and fast food industry(Nguyen-the and Carlin, 1994; Day, 2001). During recent years, there has been anexplosive growth in the market for fresh-cut produce both in sales volumes andassortment of vegetables in Western Europe and North America. In the USA, themarket share of fresh prepared vegetables was estimated to account for 8–10% oftotal produce sales in 1996. In 2000, the market was good for 12 billion $ sales whilea 19 billion $ is expected in 2003 (Gorny, 2001). In Western Europe, fresh processedvegetables have been accounting for an increasing proportion of the total freshproduce market with an estimated growth of 10–25% per annum since 1990. TheUK and France are considered as the biggest markets in Europe, worth 10.43billion EUR in 1999 in the UK (Day, 2001). In Belgium, the amount of fresh-cutproduce sold in 2000 by one group of supermarkets was 5,829,964 kg (Ham, 2001).Note that the price per kg fresh-cut product can be 3 to 5 times the price of rawintact vegetables, while 1 kg finished product corresponds to almost 2 kg raw product
474 L. Jacxsens et al.
Figure 1. General flow sheet for minimally processed refrigerated vegetables (after Seymour, 1999).

(Willocx, 1995). The benefits of adding-value to whole commodities, such asreducing wastage, preparation time and costs have been attractive for food servicesand retail industries. The main driving force for this growth of the market is stillthe increasing consumer demand for healthy, fresh, convenient and additive-freeprepared produce items, which are safe and nutritious (Francis et al., 1999; Day,2001).
2. INTRINSIC PROPERTIES OF MINIMALLY PROCESSED VEGETABLES
2.1. Composition and nutritive value
The consumption of fresh produce (i.e., fruit and vegetables) has long been asso-ciated with a healthy diet. Epidemiological evidence exists to demonstrate thatincreased consumption of fresh produce is correlated with a lower risk of mostcancers, coronary heart disease (CHD) and other degenerative diseases (Southon,2000; Temple, 2000). Fresh produce contains an array of bioactive compounds, whichare thought to play an important role in the prevention of several chronic diseases.Fresh produce also contains many other compounds (e.g., minerals, dietary fibre,prebiotic oligo-saccharides, phytooestrogens, phytosterols, glucosinolates and bioac-tive peptides and proteins) with either established or potential health benefits(Southon, 2000). Despite recent advances, however, much remains to be learnedabout the role of these compounds in human health. Temple (2000) concluded thatthe role of oxidative stress in disease, especially cancer and CHD, has probably beenoverstated; other components of the diet (other nutrients, phytochemicals and dietaryfiber) are likely to play a more significant role. The types of vegetables or fruitthat most often appear to be protective against cancer are allium vegetables, carrots,green vegetables, cruciferous vegetables and tomatoes.
Transport and marketing conditions can affect the vitamin and flavonoids contentof intact fresh fruits and vegetables. The same trends shown in intact produce shouldalso be evident in minimally processed vegetables (Tomas-Barberan et al., 2000).It is expected, however, that the amount of these compounds in fresh-cut produceis somewhat lower than the values of intact vegetables due to loss of cell juiceand nutrients during slicing steps and washing and due to oxidation during storage.Shredding of cabbage reduces the ascorbic acid content of white cabbage with15% (Matthews and McCarthy, 1994). Minimal processing (wounding) inducesphenolic compound biosynthesis (demonstrated for potato, tomato, lettuce andcarrots) (Tomas-Barberan et al., 2000). Barth and Zhuang (1996) investigated theeffect of modified atmosphere packaging on the vitamin C content of broccoli florets,Gil et al. (1998a) of minimally processed Swiss chard, Gil et al. (1999) of fresh-cut spinach, and Hussein et al. (2000) of green bell peppers. However, the effectof minimal processing and packaging on nutritional quality, including maintenanceof vitamin level in vegetables, has not been clearly established. Moreover, avail-able information is varying depending on cultivar and commodity (Artes andMartinez, 1996).
Quality of Equilibrium Modified Atmosphere Packaged (EMAP) 475
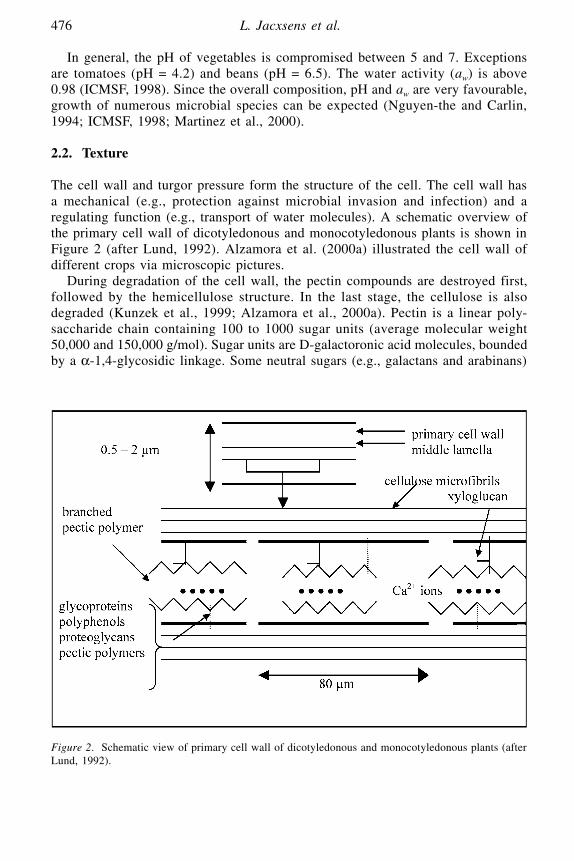
In general, the pH of vegetables is compromised between 5 and 7. Exceptionsare tomatoes (pH = 4.2) and beans (pH = 6.5). The water activity (aw) is above0.98 (ICMSF, 1998). Since the overall composition, pH and aw are very favourable,growth of numerous microbial species can be expected (Nguyen-the and Carlin,1994; ICMSF, 1998; Martinez et al., 2000).
2.2. Texture
The cell wall and turgor pressure form the structure of the cell. The cell wall hasa mechanical (e.g., protection against microbial invasion and infection) and aregulating function (e.g., transport of water molecules). A schematic overview ofthe primary cell wall of dicotyledonous and monocotyledonous plants is shown inFigure 2 (after Lund, 1992). Alzamora et al. (2000a) illustrated the cell wall ofdifferent crops via microscopic pictures.
During degradation of the cell wall, the pectin compounds are destroyed first,followed by the hemicellulose structure. In the last stage, the cellulose is alsodegraded (Kunzek et al., 1999; Alzamora et al., 2000a). Pectin is a linear poly-saccharide chain containing 100 to 1000 sugar units (average molecular weight50,000 and 150,000 g/mol). Sugar units are D-galactoronic acid molecules, boundedby a α-1,4-glycosidic linkage. Some neutral sugars (e.g., galactans and arabinans)
476 L. Jacxsens et al.
Figure 2. Schematic view of primary cell wall of dicotyledonous and monocotyledonous plants (afterLund, 1992).

occur as side chains. The chain can be partly esterified by methyl groups (Alzamoraet al., 2000a, van Dijk and Tijskens, 2000). The esterified chain is known as pectin(pectinic acids), while the non-esterified one is called pectate (pectic acids) (Lund,1992). The ratio of the esterified groups on the non-esterified groups is defined asthe degree of esterification (DE). This ratio has an important effect on the proper-ties of the pectin. Pectin with a DE above 50% is called a ‘high ester pectin’ (HM= high methylated), while ‘low ester pectin’ has a DE < 50% (LM = low methy-lated). The highest DE which can be extracted out of plant material is about 75%(Lund, 1992; Kunzek et al., 1999). During ageing or ripening, the plant tissue issoftening by the action of plant specific enzymes such as polygalacturonases andβ-galactosidases (Alzamora et al., 2000a; van Dijk and Tijskens, 2000) and resultsin the liberation of molecules of galactans and arabinans. The break-down of pectinis also possible via enzymes produced by spoilage microorganisms: hydrolysis(hydrolases) or by elimination (lyases) (Lund, 1992).
2.3. Respiration
Plant parts as seeds, fruits, leaves and roots continue to live after harvest. The energynecessary for the plant cell to stay alive and/or proceed ripening is generated bythe aerobic respiratory processus (Kader et al., 1989; Kays, 1991; Gorris andPeppelenbos, 1999). Respiration is an indicator of metabolic activity of livingplant produce. The rate of respiration is often a good indication of the storagelife of a crop: the higher the respiration rate, the shorter the shelf life and viceversa. All living organisms convert matter into energy. In plants, respiration pri-marily involves the enzymatic oxidation of sugars to carbon dioxide and water,accompanied by a release of energy (Figure 3). Fermentation occurs when the O2-concentration is too low and will result in negative quality perception of thevegetables/fruits (Mathooko, 1996).
Vegetables can be classified in groups depending on their respiration intensity.Several classifications have been proposed, but most of the data are generated forintact, unprocessed vegetables (Kader et al., 1989; Kays, 1991; Exama et al., 1993;Gamage and Shafiur Rahman, 1999).
Several intrinsic and extrinsic factors are influencing the respiration intensity:cultivar, part of the plant and degree of development of the vegetables arethe most important intrinsic factors while temperature, gas composition (O2, CO2
and ethylene), degree of wounding are examples of environmental (extrinsic)factors affecting the respiration rate. The influence of these factors on the respira-tion of minimally processed vegetables is intensively investigated (Kays, 1991;Exama et al., 1993; Zagory, 1995; Mathooko, 1996; Beaudry, 1999, 2000; Watkins,2000).
Quality of Equilibrium Modified Atmosphere Packaged (EMAP) 477
Figure 3. General formula for dark respiration of harvested plant products (after Kays, 1991).

2.4. Ethylene production
Ethylene (CH2=CH2) is a chemically simple molecule that has diverse and profoundeffects on the physiology of plants. The physiological effects of ethylene are soimportant and so diverse and are induced by such small amounts that it is consid-ered as a plant hormone. Moreover, its effect is dose-dependent. Ethylene plays arole in plant stress reactions, senescence and fruit ripening. Some of the effects ofethylene are economically useful such as in ripening of tomatoes and degreeningof citrus fruits, but often ethylene is involved in the decline of the quality andlongevity of many horticultural crops, fruits and flowers (Zagory, 1995). Responseto ethylene must be dependent upon binding to a receptor, which presumablyundergoes a conformational change leading indirectly to changes in the tissuemetabolism.
Generally, vegetables do not produce ethylene as they are non-reproductiveplant parts (ethylene production rate at 20 °C for asparagus, cauliflower, leafyvegetables, root vegetables and potatoes is smaller than 0.1 µl C2H4/kg.h), butsome fruit vegetables do: (1) immature fruit vegetables (e.g., pepper, eggplant,squash) are low ethylene producing fruits (0.1–1.0 µl C2H4/kg.h at 20 °C), (2) maturefruit vegetables (e.g., tomato) belong to the moderate ethylene producing fruits(1.0–10.0 µl C2H4/kg.h), while (3) climacteric types of fruits (e.g., kiwi, banana)are highly producing fruits (after Knee, 1990; Zagory, 1995).
Ethylene increases the rate of chlorophyll breakdown in leaf, fruit and flowertissue. This can be of particular concern in the case of leafy green vegetables suchas spinach, immature fruits as squash and flowers such as broccoli (Knee, 1990).Specific postharvest disorders of fruits and vegetables can also be caused by exposureto ethylene. Examples are russet spotting of crisphead lettuce, sprouting of potatoesand toughening of asparagus (Zagory, 1995).
3. MICROBIOLOGICAL SPOILAGE OF MINIMALLY PROCESSED VEGETABLES
3.1. Sources of contamination
Fresh fruits and vegetables normally already contain high amounts of microorgan-isms before they enter the process chain. Soil, water, air and insects all contributeto the microflora of vegetables, but their relative importance as sources differswith the structural entity of the plant; e.g., leaves will have great exposure towater, whereas roots will have more contact with soil. Human contact is alsoimportant. Cultivation, manually or mechanically, introduces and/or distributesmicroorganisms into ecological niches in which they were previously absent(Nguyen-the and Carlin, 1994; ICMSF, 1998; Kaneko et al., 1999). Intact, healthytissues may be expected to be a poor substrate for growth of opportunistic microor-ganisms. Only by microorganisms able to penetrate through the skin, which requiresthe presence of specific enzyme systems, microbial spoilage of undamaged productscan be affected (ICMSF, 1998; Björklöf et al., 2000). Scanning electronic micro-
478 L. Jacxsens et al.

graphs illustrated that microorganisms were not present on the surface of healthyunbroken spinach leaves. But large numbers of bacteria were found in areas wherethe cell wall and cuticle were broken and could be seen infecting the internal palisadeparenchyma (Babic et al., 1996). Björklöf et al. (2000) describe the colonisationstrategies of Pseudomonas fluorescens (biotype II) and P. syringae on broccoliand the leaf surface of bean plants. Formation of a biofilm by opportunistic bacteriawas found on alfalfa sprouts and other types of sprouts (Babic et al., 1996; Fett,2000). Different protective mechanisms are available in raw vegetables such assynthesis of antimicrobial phytoalexines or the presence of a thick cuticula (e.g.,cabbages) and are reviewed by Moss (2000).
The numbers and the species of microorganisms found on fresh produce, andspecifically on minimally processed produce, are highly variable. The range ofcontamination is depending on e.g., time of harvest, weather conditions at themoment of harvest, applied fertilizer, human contact during picking, trimming,sorting and packaging, and later, during further processing, contact with knives,transport belts, boxes or washing water (Nguyen-the and Carlin, 1994; ICMSF,1998; Kaneko et al., 1999; Heard, 2000). The non-homogenous contamination ofvegetables was demonstrated by Lund (1992), Mercier and Lindow (2000) andSoriano et al. (2000). Mesophilic bacteria from plate count studies typically rangefrom 103 to 109 CFU/g for raw vegetables (Hagermaier and Baker, 1998; ICMSF,1998; Heard, 2000; Szabo et al., 2000). Studies on celery, cabbage and cauliflowershowed a contamination between 105–106 CFU/g at the moment of harvest, whiletotal counts after processing ranged from 103 to 106 CFU/g (Nguyen-the and Carlin,1994; Hagenmaier and Baker, 1998). Of a total of 120 minimally processed, cutand packaged lettuce samples, 76% contained between 105 and 107 CFU/g totalaerobic mesophilic bacteria (Szabo et al., 2000). Table 1 gives an overview of thenumber of microorganisms before and after processing found in literature.
The bacteria found on the vegetables in the field are those found as well onthe fresh-cut product. But, as optimally, vegetables and surely, fresh-cut vegeta-bles are stored in refrigerated conditions, a shift from mesophilic towards morepsychrotrophic bacteria will occur during storage and spoilage. The enumerationof the mesophilic total count is, therefore, better replaced by the psychrotrophic totalcount (Babic et al., 1996; Zagory, 1999). Willocx (1995) demonstrated that theshelf life of minimally processed vegetables was not determined by mesophiliccounts but by psychrotrophic Pseudomonas spp. which can grow in the tempera-ture range of 4–16 °C.
3.2. Gram negative microorganisms
Bacteria are responsible for approximately one-third of the total microbial spoilageloss of raw vegetables (Nguyen-the and Carlin, 1994). In raw vegetables, pectinolyticGram negative bacteria of the genera Pseudomonas and Enterobacter are ofteninvolved in spoilage of raw vegetables. Their type of spoilage is resulting in softrot, spots, blight and wilts. Often pectionolytic action is followed by soft rotting(Nguyen-the and Carlin, 1994; ICMSF, 1998; Cousin, 2000). Gram negative microor-ganisms occur to be responsible for the microbial spoilage of green, leafy vegetables.
Quality of Equilibrium Modified Atmosphere Packaged (EMAP) 479
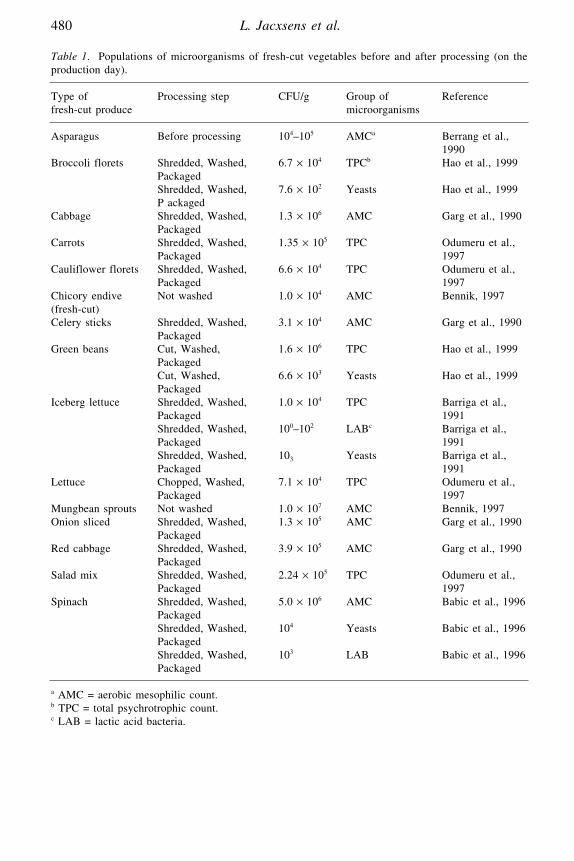
480 L. Jacxsens et al.
Table 1. Populations of microorganisms of fresh-cut vegetables before and after processing (on theproduction day).
Type of Processing step CFU/g Group of Referencefresh-cut produce microorganisms
Asparagus Before processing 104–105 AMCa Berrang et al., 1990
Broccoli florets Shredded, Washed, 6.7 × 10⁴ TPCb Hao et al., 1999PackagedShredded, Washed, 7.6 × 10² Yeasts Hao et al., 1999P ackaged
Cabbage Shredded, Washed, 1.3 × 10⁶ AMC Garg et al., 1990Packaged
Carrots Shredded, Washed, 1.35 × 10⁵ TPC Odumeru et al., Packaged 1997
Cauliflower florets Shredded, Washed, 6.6 × 10⁴ TPC Odumeru et al., Packaged 1997
Chicory endive Not washed 1.0 × 10⁴ AMC Bennik, 1997(fresh-cut)Celery sticks Shredded, Washed, 3.1 × 10⁴ AMC Garg et al., 1990
PackagedGreen beans Cut, Washed, 1.6 × 10⁶ TPC Hao et al., 1999
PackagedCut, Washed, 6.6 × 10³ Yeasts Hao et al., 1999Packaged
Iceberg lettuce Shredded, Washed, 1.0 × 10⁴ TPC Barriga et al., Packaged 1991Shredded, Washed, 100–102 LABc Barriga et al., Packaged 1991Shredded, Washed, 103 Yeasts Barriga et al., Packaged 1991
Lettuce Chopped, Washed, 7.1 × 10⁴ TPC Odumeru et al., Packaged 1997
Mungbean sprouts Not washed 1.0 × 10⁷ AMC Bennik, 1997Onion sliced Shredded, Washed, 1.3 × 10⁵ AMC Garg et al., 1990
PackagedRed cabbage Shredded, Washed, 3.9 × 10⁵ AMC Garg et al., 1990
PackagedSalad mix Shredded, Washed, 2.24 × 10⁵ TPC Odumeru et al.,
Packaged 1997Spinach Shredded, Washed, 5.0 × 10⁶ AMC Babic et al., 1996
PackagedShredded, Washed, 104 Yeasts Babic et al., 1996PackagedShredded, Washed, 103 LAB Babic et al., 1996Packaged
a AMC = aerobic mesophilic count.b TPC = total psychrotrophic count.c LAB = lactic acid bacteria.

Due to its low nutritional demands Pseudomonas spp. will normally dominateGram positive bacteria and yeasts in refrigerated minimally processed green leafyvegetables. A typical soft rot is formed resulting in a leakage of cell juice, nutri-ents and a green shiny colour (Szabo et al., 2000).
Pseudomonas fluorescens is an important spoilage causing agent for minimallyprocessed vegetables. P. fluorescens is divided into different biotypes. P. margin-alis belongs to the biotype II of P. fluorescens (Brocklehurst and Lund, 1981). Thesesaprophytes have low nutritive demands and are psychrotrophic, which are idealproperties to grow and proliferate on minimally processed vegetables (Willocx,1995). P. fluorescens is capable to produce pectinolytic enzymes at the end of itsexponential phase in growth. They use pectin as an energy source. The main enzymeproduced by Pseudomonas fluorescens and P. viridiflava is pectate-lyase I and II.For the action of the enzymes, Ca2+ ions are demanded, optimally at a concentra-tion of 0.5 mM. Optimal pH is between 8.5 and 9.0 and optimal temperature isestimated between 46 °C and 52 °C for respectively pectate-lyase I and II. Theseenzymes are responsible for the β-elimination of the α-1,4-glucosidic bounding ofpectin. At lower temperature (until 4 °C) these enzymes are still stable but theiractivity decreases (Liao et al., 1997). The enzymatic system of P. fluorescens is moresimple compared to the one of Erwinia spp. Consequently, their pectinolytic decaywill occur more slowly. By isolating representative samples of colonies from countplates, 10 to 20% of isolates among the mesophilic bacteria of shredded lettuce werefound pectinolytic (Martinez et al., 2000). Heard (2000) mentioned even 20 to30%. Pseudomonas normally dominate the bacterial population and P. fluorescensnormally dominates the pseudomonads group (50 to 90%) (Lund, 1992; Nguyen-the and Carlin, 1994).
Rahnella aquatilis, Erwinia herbicola (= Pantoea agglomerans), Enterobacteragglomerans, Serratia spp. or other fecal coliforms (applied as an indication of fecalcontamination by human, irrigation water and/or fertilizer) belong to the family ofthe Enterobacteriaceae. They are part of the epiphytic, mesophilic microflora ofmany vegetables. But during refrigerated storage of fresh-cut vegetables, theiramount will be less important and only Erwinia carotovora, Rahnella aquatilisand Pantoea agglomerans are frequently isolated (Bennik, 1997). This group hasan important pectinolytic activity and a complex system of different enzymes(pectate-lyase isozyms, polygalacturonates and methylesterases) (Laurent et al.,2000). Fraaije et al. (1997) are describing the breakdown processes of pectin byErwinia spp. By the combined action of polygalacturonates and pectate-lyases, pectincan be used very efficiently as a source of energy (both hydrolysis and β-elimina-tion). Soft rotting of raw vegetables is mainly due to the pectinolytic action ofErwinia carotovora sp. carotovora. The more psychrotrophic species, Pantoeaagglomerans and Rahnella aquatilis show, however, no pectinolytic activity(Nguyen-the and Carlin, 1994).
Other identified Gram negative species belong to the family of the Vibrionaceae(e.g., Aeromonas hydrophila, Aeromonas caviae complex), typical water organ-isms. The occurrence of Aeromonas spp. on fresh and minimally processedvegetables is reviewed by Martinez et al. (2000). Neyts et al. (2000) isolatedAeromonas spp. on 25% of retail vegetables. Xanthomonas spp. are responsible
Quality of Equilibrium Modified Atmosphere Packaged (EMAP) 481
for spoilage of beans, cauliflower and cabbage, while Corynebacterium spp. arerelated to spoilage of tomatoes and potatoes.
3.3. Gram positive microorganisms
Lactobacillus spp. and Leuconostoc spp. are important spoilage causing Grampositive bacteria, belonging to the natural microflora of vegetables (Nguyen-theand Carlin, 1994; Batt, 2000). Recently, a new species was described, Leuconostocgasicomitatum, being responsible for spoilage at low temperatures (Björkroth etal., 2000). They are psychrotrophic and have a heterofermentative character with theproduction of lactic acid, acetic acid, propionic acid, CO2 and ethanol (Batt, 2000).Leuconostoc mesenteroides, a very important spoiler of carrots, has a pectinolyticactivity (Nguyen-the and Carlin, 1994). Normal contamination levels of plants are103–104 CFU/g and Leuconostoc species are more present as are Lactobacillusspp. (Lund, 1992; Nguyen-the and Carlin, 1994; Kelly et al., 1998). High initialcount of lactic acid bacteria on minimally processed vegetables indicate a baddisinfection of cutting machines, a temperature abuse or a too long storage periodof the product.
The spoilage of sugar-rich products such as carrots, by lactic acid bacteria willresult in acidification of the product (Nguyen-the and Carlin, 1994; Kakiomenouet al., 1996). From 108 CFU/g, lactic acid bacteria produce for the consumer notice-able amounts of lactic acid, causing a pH drop. Their spoilage is generally moreacceptable than the type of spoilage caused by Gram negative species because ofthe low pervasive character of the compounds produced (Kakiomenou et al., 1996).Lactic acid bacteria are not so important in the spoilage of green leafy vegetablesbecause they need a more complex growth medium and act generally not pectinolytic(Babic et al., 1996; Garcia-Gimeno and Zurera-Cosano, 1997; Batt, 2000). But duringstorage of packaged minimally processed vegetables, anoxic conditions can favourthe lactic acid bacteria as they are micro-aerophilic and can sustain higher CO2-concentrations compared to Gram negative bacteria (Amanatidou et al., 1999; Batt,2000). This shift towards lactic acid bacteria at the end of the storage period wasfound on carrots by Kakiomenou et al. (1996) and on lettuce by Garcia-Gimenoand Zurera-Cosano (1997). Production of slime during spoilage is caused byLeuconostoc mesenteroides, which can easily colonize on cut surfaces of mini-mally processed vegetables. Spoilage of carrots, by lactic acid bacteria, results inthe production of metabolites such as indicated in Table 2 (Carlin et al., 1989), whileGram negative species and a fermentation will cause other metabolites (Lopez-Galvez et al., 1997). These metabolites can be responsible for a deviation in taste,aroma and flavour of the product.
3.4. Yeasts
Since yeasts can generally resist extreme conditions better than bacteria, they areoften found in low pH products or products in which the other spoilage flora issuppressed. Yeasts spoilage has increased in recent years as a result of milder preser-vation processes, required for higher standards of food quality (Fleet, 1992; Loureiro,
482 L. Jacxsens et al.

2000). Candida spp., Cryptococcus spp., Rhodotorula spp., Trichosporon spp., Pichiaspp. and Torulaspora spp. were isolated on minimally processed vegetables (Fleet,1992; Nguyen-the and Carlin, 1994). Some yeasts such as Trichosporon spp.,Rhodotorula spp. and Cryptococcus albidus have pectinolytic enzymes to invase intothe plant tissue (Babic et al., 1992; Moss, 2000). The latter is an important spoilerof fresh-cut spinach (Babic et al., 1996). Trichosporon spp. produces cellulases aswell (Fleet, 1992). An initial count of yeasts on minimally processed vegetablesis on average around 103 CFU/g but 104–105 CFU/g are no exception (Nguyen-theand Carlin, 1994). Fleet (1992) indicates that changing sensory properties will bedetectable from yeast populations of 105–106 CFU/g. Babic et al. (1992) detecteda high population of C. lambica on grated carrots without detecting spoilage.Pectinolytic yeasts were only found in the beginning of the storage period. Yeastswill ferment sugars with the production of CO2, ethanol, and other products, respon-sible for the off-flavour of some minimally processed vegetables. Modifiedatmospheres, applied for packaging minimally processed vegetables, will gener-ally not affect the growth of yeasts, which was demonstrated by Barriga et al. (1991)on cut lettuce and on shredded carrots (Babic et al., 1992).
3.5. Moulds
Moulds are less important in the spoilage of minimally processed vegetablescompared to raw vegetables. Spoilage caused by Gram negative and Grampositive bacteria and yeasts will be faster than the development of moulds onprocessed vegetables. Natural occurring genera are Sclerotinia, Mucor, Aspergillus,Cladosporium and Rhizopus (Tahvoinen, 1999; Brackett, 2000). The typical rotand spoilage caused by moulds on raw vegetables is reviewed intensively (ICMSF,1998; Sarbhoy and Kulshreshtha, 2000). Also some moulds produce pectinolyticenzymes to invase inside the plant tissue such as Mucor spp. and Sclerotina
Quality of Equilibrium Modified Atmosphere Packaged (EMAP) 483
Table 2. Two examples of produced metabolites during spoilage of packaged minimally processedvegetables.
Product Storage Lactic Acetic Ethanol Acetal- O2 CO2
period acid (%) acid (%) (µl.kg–1) dehyde (%) (%)(µl.kg–1)
Shredded Day 7 0.1 0.1 000–200 – 1–5 09–15carrotsa Day 14 0.1–0.17 0.1–0.17 000–1000 – 1–5 10–22
Mixed Day 0 – – 000–250 05–15 0.2–0.75 07.5–12.5lettuce Day 10 – – 250–1500 07.5–12.5 0.2–0.5 07–22.5(iceberg Day 15 – – 250–2750 15–45 0.25–0.75 05–30lettuce,carrots,redcabbage)b
a analysis of the plant tissue, reference Carlin et al., 1989.b headspace analysis, reference Lopez-Galvez et al., 1997.

sclerotium (Alzamora et al., 2000b; Moss, 2000). Moulds are strictly aerobicmicroorganisms and modified atmospheres with decreased O2-concentrations shouldinhibit their growth (Nguyen-the and Carlin, 1994; Moss, 2000).
3.6. Microbiological criteria for spoilage microorganisms
Microbiological criteria of spoilage microorganisms for prepared, mixed saladvegetables have been published in some European countries (Francis et al., 1999).Presently, in the USA, there are no industrial standards for microbial populationof bagged lettuce and other minimally processed vegetables (Hagenmaier and Baker,1998; Gorny, 2001). In Table 3, microbial specifications for minimally processedvegetables are represented as applied in France, Germany, the Netherlands, UKand Belgium. These criteria are only an indication and are not (yet?) consideredin the legislation. Mostly, the vegetable-processing industry is applying its owncriteria or the criteria given by their customers, and this can provoke confusion.
4. NON-MICROBIOLOGICAL SPOILAGE OF MINIMALLY PROCESSED VEGETABLES
4.1. Physical spoilage
Before harvest, vegetables can be physically damaged by heavy rainfall, wind,diseases, rodents and insects. During harvest, further damage can occur due to manip-ulation which can have a negative effect towards the quality and the final storagelife (Gamage and Shafiur Rahman, 1999; Nilsson, 2000). Injury stress, caused byprocessing, results in cellular decompartmentalisation or delocalisation of enzymesand substrates which lead to various biochemical deteriorations such as browning,off-flavours, and texture breakdown (Ahvenainen, 2000). Moreover, peeling andcutting facilitate primary infection of plant tissues by epiphytic microorganisms.Slicing plant tissues generally results in loss of firmness. Next to a direct waterloss due to cell leakage, Lund (1992) and Kunzek et al. (1999) suggested that texturalbreakdown of minimally processed vegetables during storage is due to enzymatichydrolysis of cell wall compounds. Also loss of turgor pressure will be respon-sible for textural degradation and fresh vegetables will loose their typical crispness.
The successive operations in the processing of fresh-cut produce (Figure 1) mayplay a role in mechanical spoilage mechanisms. The most damaging unit opera-tions are those that alter the tissue integrity. It is clear that slicing with dull knivesimpairs quality retention because of breaking cells and the release of tissue fluid.Therefore, the ideal method would be hand peeling and slicing with a sharp knife(Ahvenainen, 2000).
Also spin drying can cause physical damage to the cut product. It is recommendedthat the wash water is removed gently from the product to reduce damage (Seymour,1999; Ahvenainen, 2000). Evidence of mechanical damage may not be immedi-ately apparent at the time it is provoked. This type of damage is defined by Shewfelt
484 L. Jacxsens et al.
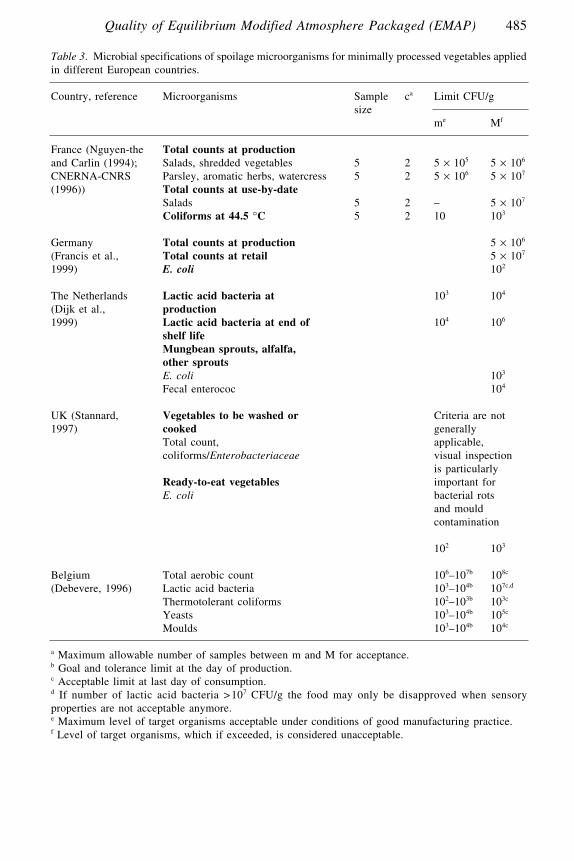
Quality of Equilibrium Modified Atmosphere Packaged (EMAP) 485
Table 3. Microbial specifications of spoilage microorganisms for minimally processed vegetables appliedin different European countries.
Country, reference Microorganisms Sample ca Limit CFU/gsize
me Mf
France (Nguyen-the Total counts at productionand Carlin (1994); Salads, shredded vegetables 5 2 5 × 10⁵ 5 × 10⁶
CNERNA-CNRS Parsley, aromatic herbs, watercress 5 2 5 × 10⁶ 5 × 10⁷
(1996)) Total counts at use-by-dateSalads 5 2 – 5 × 10⁷
Coliforms at 44.5 °C 5 2 10 103
Germany Total counts at production 5 × 10⁶
(Francis et al., Total counts at retail 5 × 10⁷
1999) E. coli 102
The Netherlands Lactic acid bacteria at 103 104
(Dijk et al., production1999) Lactic acid bacteria at end of 104 106
shelf lifeMungbean sprouts, alfalfa, other sproutsE. coli 103
Fecal enterococ 104
UK (Stannard, Vegetables to be washed or Criteria are not 1997) cooked generally
Total count, applicable, coliforms/Enterobacteriaceae visual inspection
is particularly Ready-to-eat vegetables important for E. coli bacterial rots
and mould contamination
102 103
Belgium Total aerobic count 106–107b 108c
(Debevere, 1996) Lactic acid bacteria 103–104b 107c,d
Thermotolerant coliforms 102–103b 103c
Yeasts 103–104b 105c
Moulds 103–104b 104c
a Maximum allowable number of samples between m and M for acceptance.b Goal and tolerance limit at the day of production.c Acceptable limit at last day of consumption.d If number of lactic acid bacteria >107 CFU/g the food may only be disapproved when sensoryproperties are not acceptable anymore.e Maximum level of target organisms acceptable under conditions of good manufacturing practice.f Level of target organisms, which if exceeded, is considered unacceptable.

(1990) as ‘latent damage’. An example is the production of a white colouredlignified layer on abrasion peeled carrots (Howard and Griffin, 1993) or enzy-matic browning intensifying during further contact with O2. Although for consumers,the visual appearance is the first and important quality attribute of minimallyprocessed vegetables, evaluated during purchase (Watada and Qi, 1999; Ahvenainen,2000), only 62% of the vegetable processing industry in the UK is analysing formechanical damage of the finished product (Seymour, 1999).
About 40% of fresh produce in the market is chilling sensitive, thus chilling injuryis a concern with fresh-cut products held at chilling temperatures. But, since fresh-cut vegetables are highly perishable and only stored for a short period, chilling injurycan be preferred over temperature abuse. Especially sliced ‘fruit vegetables’ (e.g.,bell pepper cubes, zucchini slices, cucumber slices) are more sensitive for chillinginjury resulting in texture loss and loss of cellular fluids. With the lesions anddecay being greatest from chilling injury at 0 °C and from natural deterioration at10 °C, 4–5 °C was the best holding temperature even though it caused in some casessome chilling injury (CNERNA-CNRS, 1996; Watada and Qi, 1999).
Due to dehydration, a white discolouration can occur on the cut surfaces of celery,grated carrots and other strong coloured products such as leek (Ahvenainen, 2000).
4.2. Browning
Browning is one of the most common deteriorating symptoms of ready-to-eatvegetables during storage (Ahvenainen, 2000). Polyphenol oxidase (PPO) is a genericterm for the group of enzymes that catalyse the enzymatic browning oxidationreaction to produce a brown colour on the cut surfaces of minimally processed fruitsand vegetables. The enzymes play a role in the resistance of the plants to micro-bial or viral infections. Phenylalanine ammonia-lyase (PAL or PPO I) catalysesthe first step to produce polyphenols from phenolic compounds (Laurila et al., 1998).Fruits and vegetables contain a wide variety of phenolic compounds, however,only a small part of these serve as substrates to PAL and PPO (i.e., catechins,cinnamic acid esters, 3,4-dihydroxy phenylalanine (DOPA) and tyrosine). A generaloverall equation describing the reaction catalysed by PAL and PPO is given inFigure 4. Cu2+ is required for the action of PPO, a reduction towards Cu+ is nec-essary before O2 can bind with the enzyme. In undamaged cells, phenolic substratesand enzymes (PPO is located in chloroplasts and mitochondria) are separated inspace but, by slicing cells, are disrupted and substrate, enzyme and O2 can react.Wounding and ethylene are increasing the activity of PPO and PAL (Laurila et
486 L. Jacxsens et al.
Figure 4. The general overall equation describing the enzymatic browning reaction catalysed by PPO(after Watada and Qi, 1999; Dorantes-Alvarez and Chiralt, 2000).

al., 1998; Watada and Qi, 1999). Enzymatic browning requires four different com-ponents: oxygen, an enzyme, copper, and a substrate. To prevent browning, at leastone component must be removed from the system.
Browning can also be limited by selecting cultivars of low browning suscepti-bility (Castaner et al., 1999). Oxidation of ascorbic acid can also be responsiblefor a brown discolouration of cut surfaces. This can partly explain the differencein susceptibility to browning between different cultivars. The rate of browning inminimally processed vegetables varies according to pre- and postharvest factorsas well (Laurila et al., 1998). This can be a reason why in the storage of mini-mally processed lettuces differences are found in browning while all extrinsicparameters (temperature, gas composition, processing treatments, . . .) are uniform(Artes and Martinez, 1996).
4.3. Enzymatic spoilage
Peroxidase (POD) is believed to be ubiquitous in the plant kingdom. It has beendetected in most fruits and vegetables. POD is primarily connected to off-flavourgeneration in canned or frozen horticultural products. Ethylene increases PODactivity of vegetables (Howard and Griffin, 1993). POD activity could be inducedin sweet potato tissue due to cut injury, in cucumber due to mosaic virus infectionand fibre formation in asparagus. In general, peroxidases are considered to be indicesof ripening and senescence.
According to Huis in ‘t Veld (1996), enzymatic peroxidation of unsaturatedfatty acids is the most dramatic example of the biochemical modifications of naturalaromas of vegetables that have been minimally processed. This peroxidation iscatalysed by lipoxidase and leads to the formation of numerous aldehydes andketones. Especially, peas, green beans and soy beans are sensitive to the off-flavourdevelopment in the case of a temperature abuse, giving rise to a range of off-flavoursdescribed as beany, grassy and rancid (e.g., n-hexanal).
Other reactions than oxidation catalysed by PPO, can alter the natural colourof fresh vegetables, but these colour changes are not specifically caused by minimalprocessing. Examples are acidification of cellular cytoplasm, a reaction that isresponsible for the degreening of broccoli, destruction of chlorophyll by ethylenedue to increased chlorophyllase activity, oxidation of carotenoides with lipoxi-dase-catalyzed hydroperoxides resulting in the discolouration of grated carrots(Varoquaux and Wiley, 1994).
Pectinolytic and proteolytic enzymes, liberated from cells damaged by slicing,can diffuse into inner tissues (Kunzek et al., 1999; van Dijk and Tijskens, 2000)and dissolve the cell wall with loss of textural properties. Tremendous efforts havebeen made to study the role of pectins and pectolytic enzymes in the softening ofvegetables during storage (van Dijk and Tijskens, 2000). Different from microbio-logical enzymes, pectin methyl esterase removes methanol from the methylatedpectin blockwise. The demethylated pectin forms a substrate for endopolygalac-turonase, which depolymerises the pectin, causing a softening of the plant tissue(van Dijk and Tijskens, 2000).
Quality of Equilibrium Modified Atmosphere Packaged (EMAP) 487
4.4. Physiological damage
The occurrance of brown spots is visual physiological disorder encountered onminimally processed leafy vegetables. Brown stain for lettuce, for instance, is a formof CO2 injury, and is characterized by slightly sunken, oval spots, surrounded bydark borders in the tissue. Another kind of CO2-damage is heart-leaf injury, resultingin a brown discolouration of the innermost leaves (Artes and Martinez, 1996).
Commodities vary widely to their tolerances to different atmospheres. A classi-fication of fresh fruits and vegetables to their tolerance to reduced oxygen andelevated carbon dioxide has been presented by Kader et al. (1989), but less is knownabout the atmosphere requirements of minimally processed vegetables. Recently,Beaudry (2000) and Watkins (2000) published the limits to expanded use of MApackaging. Kader et al. (1989) defined the minimal O2-concentration for mini-mally processed vegetables as 1%; lower compared to most unprocessed productsbecause of the lack of diffusive resistance (Beaudry, 2000). Below these oxygen-and above these CO2-concentrations (10–15%), a change in metabolic processescan occur resulting in a detrimental quality (Mathooko, 1996; Watkins, 2000).
If the dark borders are absent, brown stain can resemble russet spotting, whichsituates mostly on the midribs of lettuce. Russet spotting may be caused by over-mature harvest, high temperature storage, but the primary cause is exposure toethylene (Artes and Martinez, 1996). Russet spotting can be reduced by storage under2 °C, low oxygen concentrations (1 to 8%) and absence of ethylene (< 1 µl/l).
These damages can be intensified during extended storage and sensitivity not onlydiffers with cultivar but even with the time of harvest. For minimally processed veg-etables, it is necessary to identify and select those cultivars which will remain thehighest quality until the moment of purchase and consumption. Cultivars, origi-nally intended for the fresh market, are also used today for minimal processing,but especially those cultivars with a constant quality during the whole season andwhich are best adopted for their final use (Laurila et al., 1998; Ahvenainen, 2000).Recently, specifically cultivated vegetables such as baby leaf lettuces have madetheir entrance in the vegetable processing industry.
5. SAFETY OF MINIMALLY PROCESSED VEGETABLES
5.1. Some figures and facts
A number of outbreaks of foodborne disease have been attributed to the consump-tion of ready-to-eat vegetables (Table 4). Because of the excellent marketingproperties of the products, fresh-cut vegetables have been quickly introduced withoutextensive evaluation of the safety aspects of this type of product. Between 1988and 1991, 5% of the outbreaks and 8% of the outbreak-associated cases in theUSA were attributed to packaged ready-to-use vegetables. No data are, however,available on the number of outbreaks specifically associated with packaged ready-to-eat vegetables (Tauxe et al., 1997). There are several reasons why minimallyprocessed produce is relatively safe when compared to other foods. First, condi-
488 L. Jacxsens et al.

tions used with fresh produce are usually unfavourable for the growth of mostpathogens (refrigeration temperatures, relatively low nutrients available). Second,the normal spoilage microorganisms in refrigerated produce are usually psy-chrotrophic and therefore have a competitive advantage over most pathogens.Sometimes, this competition prevents the growth of pathogens. In other cases, thefood simply spoils before it is eaten. Nevertheless, foodborne disease can and doesoccur with fruits and vegetables, especially when fresh-cut produce is packagedunder modified atmosphere. These gas conditions inhibit spoilage of the mini-mally processed vegetables and pathogens will have less competition to grow.Second, modified atmosphere packaging increases the shelf life of the products,and pathogens have more time to develop until infectious numbers or producetoxin before the product is notably spoiled. Third, although low levels of oxygenwithin the MA-packages of fresh-cut vegetables should inhibit the growth of obligateanaerobes such as Clostridium botulinum, if MA-packages are subjected to tem-perature abuse, they may become anaerobic as a result of increased productrespiration (Philips, 1996; Francis et al., 1999).
Although practically any bacterial pathogen could potentially be a problem,only few are of most concern for fresh (cut) produce (Table 5). Genotypes of Yersiniaenterocolitica, associated with minimally processed vegetables, are mainly non-path-ogenic for humans (Francis et al., 1999). Psychrotrophic strains of Bacillus cereuswere recently identified from pasteurised ready-to-eat meals but no toxine pro-duction was possible at refrigerating temperatures and most studies indicate thatB. cereus is very sensitive to CO2 (Farber, 1991). L. monocytogenes, Aeromonascaviae and the non-proteolytic C. botulinum are the only pathogens that have apsychrotrophic character and occur frequently on fresh-cut vegetables. In the caseof temperature abuse, also mesophylic pathogens, as Salmonella/Shigella and E. coli
Quality of Equilibrium Modified Atmosphere Packaged (EMAP) 489
Table 4. Examples of foodborne illness linked to the consumption of raw, minimally processedvegetables.
Microorganism Suspected produce Country Reference
C. botulinum Romaine lettuce, USA Petran et al., 1995shredded cabbage
E. coli Salads of raw Mexico Nguyen-the and (enterohemorrhagic) vegetables Carlin, 1994
Lettuce USA Tauxe et al., 1997Alfalfa sprouts USA Francis et al., 1999
L. monocytogenes Shredded cabbage Canada Farber et al., 1996; in coleslaw Francis et al., 1999Raw vegetables in USA Francis et al., 1999salads (celery, tomatoes, lettuce)
Salmonella Mustard cress UK, Canada Beuchat, 1996(alfalfa sprouts) and Finland
Shigella flexneri Green onions USA Beuchat, 1996Shigella sonnei Chopped parsley Canada Wu et al., 2000Vibrio cholerae Cabbage Peru Nguyen-the and Carlin, 1994Virus hepatitis A Tomatoes USA Tauxe et al., 1997

can cause problems. Several studies have been conducted to determine thesurvival/growth characteristics of pathogens on a range of ready-to-eat vegetables(A. hydrophila/L. monocytogenes by Berrang et al., 1989a, b; Shigella sonnei bySatchell et al., 1990; C. botulinum by Solomon et al., 1990, 1998; Petran et al., 1995;Listeria spp. by Nguyen-the and Lund, 1991; L. monocytogenes by Carlin andNguyen-the, 1994; Carlin et al., 1995; Farber et al., 1998; Castillejo-Rodriguez etal., 2000; Staphylococcus aureus/B. cereus/L. innocua/S. Typhimurium/C. perfrin-gens by Finn and Upton, 1997; A. caviae/L. monocytogenes by Jacxsens et al., 1999a,2001a, 2002a, b). Challenge tests with artificial inoculated pathogenic microor-ganisms are important in order to define the safety of a specific product(growth/survival/die-off of specific pathogens on the product) (Norrung, 2000).An important factor with respect to microbial safety is whether the minimallyprocessed vegetables are intended for direct consumption or require heating beforeconsumption. The majority of fresh-cut produce is sold as ‘ready-to-eat’, so safetyconsiderations are very important.
5.2. Listeria monocytogenes
Listeria monocytogenes has increasingly been considered as a cause of foodbornedisease, sometimes responsible for large outbreaks of infection. Moreover, lettuceand other raw vegetables have been identified as potential vectors of listeriosis(Table 4). A screening of imported vegetables in the UK revealed that on the 151samples no L. monocytogenes was isolated (Little et al., 1999). Same results wereobtained in Italy for the period 1989–1999 (Messi et al., 2000), in Canada on 100samples of lettuce, celery, radishes and tomatoes (Farber et al., 1989). Fresh-cutvegetables showed an incidence of L. monocytogenes varying from 0 to 19%(Carlin and Nguyen-the, 1994). A contamination level of fresh vegetables for L.monocytogenes was reviewed by Francis et al. (1999) as being 0 to 44%. Severalinvestigations demonstrated possible growth of L. monocytogenes on modifiedatmosphere packaged fresh-cut vegetables, although the results depended very muchon the type of vegetables and the storage temperature (Carlin et al., 1995; Carlinet al., 1996a, b; Zhang and Farber, 1996; Juneja et al., 1998; Bennik et al., 1999;Jacxsens et al., 1999a; Liao and Sapers, 1999; Thomas et al., 1999; Castillejo-Rodriguez et al., 2000). It is generally accepted that L. monocytogenes is an importanthuman pathogen associated with fresh-cut produce because:
490 L. Jacxsens et al.
Table 5. Pathogenic organisms of concern or potential concern in minimally processed produce (afterFrancis et al., 1999).
Pathogens of concern Pathogens of possible concern
Listeria monocytogenes E. coli (O157:H7)Non-proteolytic Clostridium botulinum type B, E, F Aeromonas hydrophila/caviaeShigella spp. Bacillus cereusSalmonella spp. Yersinia enterocoliticaParasitesViruses

(1) The pathogen is widespread in the environment (soil, manure, water, animals,man) and is associated with plant material including wild grasses, cereals, a widerange of vegetables (Nguyen-the and Carlin, 1994; ICMSF, 1996; Francis etal., 1999) but may also be present and can survive in the environment of foodprocessing plants particularly in moist conditions (Zhang and Farber, 1996).
(2) The minimal temperature for growth on vegetable matter is reported as4 °C (Doyle, 1990). Carlin et al. (1995) published even 3 °C. Farber et al. (1998)and Castillejo-Rodriguez et al. (2000) found a survival at that temperature onintact vegetables. Although some microorganisms are capable of growth atlow temperatures, reducing the storage temperature will extend the lag phaseand reduce the growth rate (Carlin et al., 1995). This implies that in the caseof a temperature abuse a severe risk towards fast proliferation exists.
(3) The minimal pH of L. monocytogenes for growth is 4.5–5.0 (ICMSF, 1996).Therefore, most vegetables allow growth based on this pH except shreddedbell peppers and mixtures of minimally processed vegetables with mayonnaiseor dressing (George and Levett, 1990).
(4) The behaviour of L. monocytogenes is not influenced by the modified atmos-pheres applied for minimally processed vegetables (Bennik et al., 1995; Carlinet al., 1996a; Francis and O’Beirne, 1997; Jacxsens et al., 1999a) or was evenstimulated (Doyle, 1990). Carrots have an antilisterial effect as demonstrated byNguyen-the and Lund (1991), Farber et al. (1998) and Jacxsens et al. (1999a).
5.3. Aeromonas spp.
Aeromonas species were first recognized as pathogens for cold-blooded animals.The ability of A. hydrophila and A. sobria to cause human infection has not beenfully confirmed but their potential as infectious agents exists. They are more con-sidered as opportunistic pathogens, infecting humans with weakened resistance(ICMSF, 1996; Neyts et al., 2000). Three Aeromonas hybridisation groups are knownto cause septicemia or gastroenteritis in humans, i.e., A. hydrophila (HG1), A. caviae(HG4) and A. veronii subgroup sobria (HG8) (Abbott et al., 1994). Aeromonasspp. are considered by Callister and Agger (1987) and Neyts et al. (2000) as ubiq-uitous in grocery store produce. At the time of purchase maximum levels of 104
CFU/g Aeromonas spp. were reached from which 48% were identified as Aeromonashydrophila (Callister and Agger, 1987), while Neyts et al. (2000) isolated on 26%of the vegetables samples Aeromonads mostly belonging to the Aeromonas caviaecomplex. Contamination occurs mainly via irrigation water (Francis et al., 1999).In a study by Berrang et al. (1989a), regarding controlled atmosphere storage ofbroccoli, cauliflower and asparagus stored at 4 °C and 15 °C, fast proliferation ofA. hydrophila was observed at both temperatures, but growth was not significantlyaffected by gas atmosphere. Garcia-Gimeno et al. (1996a) published the survivalof A. hydrophila on mixed vegetables salads (lettuce, red cabbage and carrots)packaged under MA (initial 10% O2 – 10% CO2, after 48h 0% O2 – 18% CO2)and stored at 4 °C while at 15 °C a fast growth was noticed (5 log units in 24 h).The combination of high CO2-concentration and low temperature was revealed asresponsible for the inhibition of growth. Bennik et al. (1995) concluded from their
Quality of Equilibrium Modified Atmosphere Packaged (EMAP) 491

solid-surface model that at MA-conditions, generally applied for minimally processedvegetables (1–5% O2 and 5–10% CO2), growth of A. hydrophila is possible. Growthwas virtually the same under 1.5% and 21% O2. The behaviour of a cocktail of A.caviae (HG4) and A. bestiarum (HG2) in air or in low O2-low CO2 atmospherewas investigated in fresh-cut vegetables: no difference between both atmosphereswas observed on grated carrots, a decreased growth on shredded Belgian endiveand Brussels sprouts in MA but an increased growth on shredded iceberg lettucein MA storage (Jacxsens et al., 1999a).
5.4. Clostridum botulinum
In the early days of MA packaging of vegetables, attention was focused primarilyon anaerobic pathogens, especially proteolytic Clostridium botulinum, whichproduces a deadly heat unstable toxin but does not grow below 10 °C, although non-proteolytic types B, E and F have been recorded as growing and producing toxinsat temperatures as low as 3.3 °C (Francis et al., 1999). The organism is not markedlyaffected by the presence of CO2 and also not by low O2-concentrations (ICMSF,1996). The growth of aerobic spoilage microflora rapidly decreases the redox poten-tial of the food, improving conditions for the growth of C. botulinum (Francis etal., 1999). These findings stimulated the USFDA to recommend the puncturing ofpackaging films applied to high respiring mushrooms (Doyle, 1990). The organismcan be present in soils and spores generally contaminate food products. It is theirgermination and outgrowth during further processing that leads to toxin produc-tion. An important finding is that spores formed at 10 °C have a lower germinabilitycompared to the ones formed at 20 °C (Evans et al., 1997). A study by Lilly etal. (1996) showed an overall incidence rate (0.36%) of C. botulinum spores typeA or B in commercially available precut vegetables. According to Notermans etal. (1989) an incidence of <0.08 to 0.16 organisms of C. botulinum is reportedper 100 g mushrooms (type not specified). In the case of temperature abuse, anaer-obic conditions will be created inside the MA-packages due to increased respiration,which can favour the growth of C. botulinum (Exama et al., 1993). Also the appli-cation of a barrier film or the presence of a modified atmosphere containing notenough O2 due to produce respiration, may create microenvironments containinglittle or no O2, conditions which enhance the germination of the spores.
Most of the studies regarding growth of C. botulinum on fresh-cut vegetableswere performed at room temperature and/or were performed with non-proteolyticstrains (Petran et al., 1995; Lilly et al., 1996; Hao et al., 1998; Solomon et al.,1998; Hao et al., 1999). Larson et al. (1997) identified a probability of <1 on 105
for toxin production to occur in MA-packaged vegetables. Important is that at hightemperatures within the time toxin is produced, the sensory quality of the packagedproduce is not acceptable anymore for consumption due to anaerobic conditions(change in odour and texture). However, in the case of refrigeration temperatures,spoilage was not great enough to render the samples unacceptable to consumersat the time of toxin production (Nguyen-the and Carlin, 1994).
492 L. Jacxsens et al.

5.5. Salmonella/Shigella spp.
Salmonella and Shigella spp. are both mesophilic fecal-associated pathogens. Theirgrowth on minimally processed vegetables is mostly provoked by a temperatureabuse (T > 10–12 °C). Minimal temperature for growth of Shigella sonnei wasreported to be 6 °C, for Shigella flexneri 7 °C (ICMSF, 1996). Although relativelyfragile, at least some strains of Shigella are able to tolerate acidic conditions lessthan pH 6, with pH 4.5 (Bagamboula et al., 2001a) and 5 (ICMSF, 1996) as thelowest reported pH. Shigellosis is usually transmitted from person to person but mayalso occur by consumption of contaminated water and foods, particularly foods suchas salad vegetables. It concerns mostly imported vegetables from southern regions(i.e., Mexico, North of Africa). The pathogen has a very low infectious dose ofless than 100 cells. Imported food products from endemic regions where hygienicstandards are insufficient have become a potential source of contaminated foods(ICMSF, 1996). Laboratory studies revealed that S. sonnei can survive on shreddedcabbage at 0–6 °C for 3 days without decrease in number but soon died at 24 °Cbecause of the pH drop of the cabbage due to the fast outgrowth of the spoilagemicroorganisms at this high temperature (Satchell et al., 1990). No difference wasfound between a vacuum atmosphere, a modified atmosphere (30% N2 – 70% CO2)or aerobic conditions. However, Shigella spp. survived for several days at bothambient (22 °C) and refrigerator temperatures (5 and 10 °C) when inoculated ontovarious commercially prepared salads and vegetables (carrots, coleslaw, radishes,broccoli, cauliflower, lettuce and celery) (Rafii et al., 1995). S. flexneri was ableto survive at 4 °C for at least 11 days on coleslaw, carrot and potato salad (Rafiiand Lunsford, 1997). Experiments conducted at 12 °C demonstrated that Shigellaflexneri and S. sonnei were able to proliferate on minimally processed mixedlettuce and shredded carrots at 12 °C, while not on shredded bell peppers due totheir lower pH. At 7 °C only a survival or a decrease in number was detected(Bagamboula et al., 2001b). No difference in growth/survival/die-off was noticedbetween air-conditions and low O2-low CO2-atmospheres.
The genus Salmonella is relatively well represented on raw vegetables, asreviewed by Tauxe et al. (1997) and Francis et al. (1999). Vegetables sampled inthe field or retail outlets were contaminated with Salmonella spp. at frequenciesof 7.5% in Spain and 8 to 63% in the Netherlands (Pirovani et al., 2000). The growthrate is substantially reduced at <15 °C, while growth is prevented at <7 °C. Minimalreported temperature for growth to occur is 5.2 °C (ICMSF, 1996). Piagentini etal. (1997) observed a survival of inoculated S. Hadar on cut cabbage after 10 daysof storage at 4 °C, while an increase was detected at 12 and 20 °C. The cabbagewas packaged in OPP films resulting in a steady-state atmosphere around 1.5%O2 – 8–10% CO2. On the surfaces of tomatoes, no significant change in popula-tion of S. Montevideo was found at 10 °C (18 days storage), but at 20 °C growthoccurred (7 days storage) (Zhuang et al., 1995). Finn and Upton (1997) found anabsence (after preenrichment step) of inoculated Salmonella Typhimurium after2 days of storage at 7 °C on shredded carrots and cabbage (<1% O2 and >25%CO2). In general, increased CO2-concentrations (50–100%) reduced growth butthese conditions would cause damage to most minimally processed vegetables.
Quality of Equilibrium Modified Atmosphere Packaged (EMAP) 493

Refrigeration is the best preservation method to prevent an outgrowth of thesemesophilic pathogens.
5.6. E. coli
A contamination by E. coli and E. coli O157:H7 is mostly introduced by the appli-cation of infected manure during the primary production (Tauxe et al., 1997).However, information regarding contamination rates from ready-to-eat vegetables islimited (Francis et al., 1999). A recent research showed the survival of a cocktailof three strains of E. coli O157:H7 on broccoli, cucumbers and bell peppers, bothintact and shredded at 4 °C. At 15 °C, they were even able to proliferate (Richertet al., 2000). The failure of 10% CO2 to inhibit E. coli O157:H7 at refrigeration tem-peratures was illustrated by Diaz and Hotchkiss (1996) where CO2 (5% O2 – 30%CO2) did not have an inhibitory effect on growth on shredded lettuce stored at 13or 22 °C compared to air-conditions. The mesophilic status of E. coli O157:H7 makesgrowth on minimally processed vegetables unlikely under good refrigeration. Theminimal temperature for growth on minced beef was reported as 8 °C (ICMSF, 1996).
5.7. Viruses
Viruses are another group of microorganisms that might pose a health problemfor minimally processed vegetables. Even at low temperatures (3–10 °C) a longsurvival of minimally 90 days was found of Poliomyelitis, ECHO and Coxsackievirus in soils (Brackett, 1992). This might be long enough to contaminate short-season vegetables. Viruses are not likely to grow on contaminated vegetables butcan survive long enough to cause life-threatening illness in humans. However, out-breaks have only been associated with hepatitis A and Norwalk virus on respectivelylettuce, tomatoes, green salad and celery (Tauxe et al., 1997; Francis et al., 1999)(Table 4). Outbreaks of viral gastroenteritis have also been documented in whichfood handlers became ill after preparing or serving implicated foods (Bidawid etal., 2000a). Enteroviruses survived on radishes, tomatoes and lettuce stored at 6to 10 °C for periods exceeding the normal shelf life of salad vegetables. Badawyet al. (1985) studied the survival of rotavirus on lettuce, radishes and carrots storedat 4 °C and room temperature. The virus survived for 25 to 30 days at 4 °C butonly 5 to 25 days at room temperature. The greatest survival was observed on lettuce,indicating that salad vegetables can serve as vehicles to transmit viral pathogensto humans. A recent research challenged the inactivation of hepatitis A virus in fruitsand vegetables by the application of gamma irradiation (Bidawid et al., 2000b).The most important transfer of viruses is via direct or indirect (sneezing, coughing)contact with infected persons.
5.8. Protozoan pathogens
Infection with Giardia lamblia may be acquired through person-to-person trans-mission or ingestion of fecally contaminated water, ice or food. In at least severaloutbreaks, raw vegetables were indicated as the vehicle of transmission in 1993
494 L. Jacxsens et al.

(Beuchat, 1996; Robertson and Gjerde, 2000). Common parasites that occur on freshvegetables include Giardia lamblia, Entamoeba histolytica, Cryptosporidium,Cyclospora as intestinal protozoa responsible for intestinal infections and diar-rhoea, tissue protozoa Toxoplasma gondii causing fetus malformations and tissuehelminths Ascaris spp. (Rose and Slifco, 1999; Robertson and Gjerde, 2000). Thisgroup of foodborne pathogens has received little attention in developed countries.But the review of Rose and Slifco (1999) made clear that the problem is of increasingconcern. Key points to support this view include the increasing number of sus-ceptible persons, more extensive trade in produce across the borders, advancementin food-processing technology and changes in national and international policiesconcerning food safety. Recovery of parasites from fruit and vegetables is gener-ally inadequate, with low and variable recovery efficiencies. Robertson and Gjerde(2000) proposed new methods for the isolation and enumeration of several para-sites from fruits and vegetables. Vegetables get normally contaminated as a resultof contaminated irrigation water and poor hygiene practices (Francis et al., 1999).
5.9. Microbiological criteria for pathogenic microorganisms
The safety of food must be assured by a preventive approach based on the appli-cation of a Hazard Analysis Critical Control Point (HACCP) at all stages of thesupply chain. It is recognised that microbiological criteria are widely used in thefood industry but they have been published rarely (Stannard, 1997).
L. monocytogenes is generally considered as the most emerging pathogen onmodified atmosphere packaged ready-to-use, minimally processed vegetables.Several countries have concluded that a complete absence of L. monocytogenesfor certain ready-to-eat foods is an unrealistic and unattainable requirement, espe-cially, in European countries where the application of disinfectants on minimallyprocessed vegetables is very limited. At present, international criteria for L. mono-cytogenes in foods are being considered by a drafting group within the CodexCommittee on Food Hygiene (Alinorm 99/13A, 1999). These considerations includespecific reference to risk assessment (Norrung et al., 1999). Using differentapproaches, several authors have concluded that the risk of listeriosis from foodscontaining less than 100 L. monocytogenes/g is very low (Farber et al., 1996;Buchanan et al., 1997). In France, microbiological criteria for prepared vegetablesstate that it is desirable to test for the presence and levels of L. monocytogenes.The French authorities have proposed to use a limit of <100 CFU/g for minimallyprocessed vegetables at their ‘use-by-date’ indicated on the package (absence in 0.01g) (Nguyen-the and Carlin, 1994; CNERNA-CNRS, 1996). The same reasoning wassuggested in Belgium by Debevere (1996), in Canada by Farber et al. (1996), inDenmark by Norrung et al. (1999) and in the Netherlands (Norrung, 2000). Theperformance of a challenge test is encouraged, where the growth or survival ofthe pathogen in the specific product is defined in order to be able to set criteriaof the product on the day of production (Norrung et al., 1999; Norrung, 2000).Moreover, Denmark and Canada introduced a zero tolerance for some foods, espe-cially those which are supportive of growth and with extended shelf lives, butevaluation must be performed based on a risk assessment of the specific product
Quality of Equilibrium Modified Atmosphere Packaged (EMAP) 495
(Norrung, 2000). In Germany, official recommendations for the microbiologicalquality have been published by the Federal Health Office (Francis et al., 1999). Theseinclude a quantitative test for L. monocytogenes. If the pathogen is present butnumbers are <100 CFU/g no further action has to be taken. If numbers are >100CFU/g further investigations are made. The current target in Italy, the UK and theUSA is the ‘zero-tolerance’ or absence of L. monocytogenes in 25 g (Stannard, 1997;Francis et al., 1999; Norrung et al., 1999).
Absence of Salmonella in 25 g is generally recommended for minimally processedvegetables in France (Nguyen-the and Carlin, 1994), in the UK (Stannard, 1997;Francis et al., 1999), in the USA (Francis et al., 1999) and in Germany (Franciset al., 1999) and followed in Belgium (Debevere, 1996).
An indicator of personal hygiene is Staphylococcus aureus of which 100 tomaximum 1000 cells/g are tolerated on the food product (Debevere, 1996).
6. SENSORY PROPERTIES OF MINIMALLY PROCESSED VEGETABLES
Quality of perishable products is becoming increasingly important to the consumer.At the end of a logistic chain, the consumer decides whether or not a product isstill acceptable (Shewfelt, 1999). Keeping quality is defined as the time a productremains acceptable and it can be used as a general indication of the overall productquality. Sensory characteristics of a food product include both visual and organolep-tical properties (Shewfelt, 2000). The sensory quality of minimally processedvegetables can never improve during further storage, it can only be retained ordeterioration can be retarded by applying optimal packaging techniques, storage tem-perature, application of enzymatic browning inhibitors, or application of sharp cuttingtools (Watada and Qi, 1999).
Instrumental measurements are often preferred over sensory evaluations becauseinstruments reduce variations among individuals, are more precise, and can providea common language among researchers and industry. Abbott (1999) recentlyreviewed available techniques to measure the sensory quality of uncut fruits andvegetables. For fresh-cut vegetables, these measurements are, however, less evidentto use. Moreover, the relationship between an instrumental measurement and sensoryattributes (e.g., descriptive sensory analysis) and the relationship between thosesensory attributes and consumer acceptability is difficult to establish (Abbott, 1999;Shewfelt, 1999; Lyon, 2001). Kader (2001) stressed to apply non-instrumentalsensory quality evaluation next to instrumental evaluation and to include sensoryproperties as taste, aroma, juiciness next to texture and colour characteristics.
The research methodology available to evaluate the sensory properties of foods,can be based on primary exploratory (qualitative) and conclusive (quantitative)consumer research. The consumer acceptability study applies a large number of con-sumers. The question to be answered is ‘Would you like to consume this sample?’.The panel has normally a limited time to perform the judgement, is not trained tospecific deterioration problems of the food and is representative for the focussedgroup on the market (Vankerschaver et al., 1996; Lyon, 2001).
496 L. Jacxsens et al.

Via descriptive sensory analysis, individual sensory components can be qualita-tively and quantitatively evaluated by a trained panel (Murray et al., 2001). Thequalitative aspects of a product include all aroma, appearance, taste, texture prop-erties, which distinguish it from others. Sensory judges then quantify these aspectson a chosen scale (Lyon, 2001; Murray et al., 2001; Talcott et al., 2001).
6.1. Visual properties
For the evaluation of the quality of minimally processed vegetables, the visual prop-erties of the packaged product are the most important: lack of discolouration (e.g.,enzymatic browning of cut surfaces, yellowing of green vegetables, pale colour ofbright vegetables) and free of mechanical damage (e.g., foiled lettuce leaves) areprimary demands (Watada and Qi, 1999). In the case of raw, unprocessed vegeta-bles, also the shape and the size of the vegetables play a role in the acceptanceby the consumers. Consumers have developed a direct correlation between overallquality and colour of intact vegetables: bananas must be yellow, tomatoes red,. . . (Shewfelt, 2000). A study by Jaros et al. (2000) demonstrates that appearancedescriptors are as frequently associated with food products as texture or flavourdescriptors. It underlines the importance of appearance properties such as colouror physical form within the total process of the assessment of food quality. Moreover,the appearance properties are strongly linked to specific food materials: carrotsand spinach, for example, may be sliced or diced but they are still perceived ascarrots or spinach because of their colour, whereas shape is mainly used to identifyfoods which are usually served as such (e.g., water melon). For apple and tomato,on the other hand, colour and shape have the same importance in quality evalua-tion. Vankerschaver et al. (1996) were able to model the binary response of aconsumer panel, which answered ‘yes’ or ‘no’ on the question for acceptance ofthe visual quality of minimally processed endive, against storage time through alinearized log function. Garcia-Gimeno et al. (1998) described the relation betweenthe natural logarithm of the visual shelf life time and the storage temperature by alinear equation for green asparagus.
6.2. Organoleptical properties
Most important organoleptical characteristics related to (ready-to-eat) vegetablesare texture/firmness, taste and smell/aroma (Watada and Qi, 1999). Low O2-concentrations (generally <1%) result in a significant increase in ethanol andacetaldehyde levels, resulting in a negative perception of the organoleptical quality(taste and odour) of the packaged salads and other minimally processed vegeta-bles (Beaudry, 2000). The texture of the vegetables is defined as the perceptionof the mouthfeel. It is determined by the typical turgor pressure and cell wall/middle lamella strength of intact plant cells, which provoke a certain firmness.By shredding, cell walls are disrupted and cytoplasm is leaking. Together with thefurther water loss during storage due to transpiration of the fresh-cut vegetables,the typical firmness is decreasing during storage. Packaging the minimally processedvegetables in a plastic film with low water vapour permeability and sufficient
Quality of Equilibrium Modified Atmosphere Packaged (EMAP) 497

antimoisturing properties can improve the retention of the firmness of the vegeta-bles (Lopez-Galvez et al., 1997).
7. PRESERVATION TECHNOLOGIES OF MINIMALLY PROCESSED VEGETABLES
Minimally processed, ready-to-eat products such as fresh-cut vegetables have shortshelf lives – a few days only – limiting the geographical area in which they canbe marketed. Technologies that allow a two- or threefold extension of the shelflife are much in demand by producers and distributors. However, long shelf life isnot the most important selling argument anymore, with the market trends tendingtowards more fresh-like products. Therefore, preservation technologies that prolongthe shelf life but do not have a detrimental effect on the quality attributes of theproduct are in favour. In minimally processed foods, storage, processing, pack-aging and distribution are accomplished using highly integrated systems, eachstage being considered in conjunction with the others. In recent years, many foodprocessing companies have adopted Total Quality Management (TQM) programs,designed to constantly improve the quality of their products, services and mar-keting process. The concept Integrated Quality Management (IQM) goes beyond theindividual company’s quality management: TQM in each link and company of themarket chain (Viaene et al., 2000).
7.1. Cold chain of minimally processed vegetables
Storage temperature is found to be of paramount importance for the microbial andsensory quality evolution of minimally processed vegetables. This is demonstratedin numerous publications (Nguyen-the and Carlin, 1994; Garcia-Gimeno and Zurera-Cosano, 1997; Garcia-Gimeno et al., 1998; Lopez-Osornio and Chaves, 1998; Haoet al., 1999; Silva et al., 1999; Jacxsens et al., 2002a, b). Optimal temperature andrelative humidity recommendations for vegetables and fruits are recently summarisedby Paull (1999). For fresh-cut vegetables, generally lower temperatures can beapplied compared to the raw, intact vegetables, as long as the sensory quality isnot negatively influenced. In Belgium, there is no specific temperature controllegislation for minimally processed vegetables and they are, therefore, categorisedwith all refrigerated products. For these products, the temperature must be kept at7 °C at maximum with a tolerance up to 10 °C in the warmest spot (Anonymous,1982). In the French directive for ‘légumes de la 4e gamme’, minimally processedvegetables must be stored at maximum 4 °C (Anonymous, 1988). In the UK, fresh-cut vegetables must be stored below 8 °C (Day, 2001). Time-temperature conditionsat the producer are an essential Critical Control Point in a HACCP system andmust be monitored (IFPA, 1997; De Roever, 1998; Tapia et al., 2000). Air tem-perature during sorting, grading and preparation must be lower than 12 °C, whileduring washing, cutting and packaging, air temperature should be maintainedbetween 4 and 6 °C. From the moment of cutting of the produce, product temper-ature must be controlled at a maximum of 4 °C (Yildiz, 1994; Willocx, 1995).
498 L. Jacxsens et al.
Also the product temperature must be controlled during transport (preferentiallyon the hottest spot in the truck) (Yildiz, 1994). Rapid temperature increase ofproducts can occur when products are transferred from the temperature-controlledvehicles to ambient conditions during unloading at the distributor. Moreover, thetemperature performance and control in chilled display cabinets in supermarketsis rather poor. Temperatures above 7 °C are common and depend on the place(top, middle or bottom) in the chilled counter (Yildiz, 1994; Willocx, 1995). Unlikerefrigeration systems in the rest of the cold chain, domestic refrigerators are not sub-jected to temperature monitoring or legislative control. Although mishandling mayoccur at any stage of the food chain, epidemiological data show that mishandlingoccurs most frequently during the final stages like in food service and home prepa-ration (Brackett, 2000). The consumer is a weak link in the cold chain. Refrigeratedfoods are carried home unprotected and stored at too high temperature in thedomestic refrigerators. In 6 out of 16 consumers’ refrigerators tested in Belgiumin 1995, the minimally processed vegetables were stored at an average tempera-ture above 7 °C (Willocx, 1995). A survey conducted in the UK and Ireland,demonstrated that the average temperature was respectively 6 °C and 6.52 °C(Billiard, 1999). Generally, the cold chain has three weak points, being the trans-portation, the presentation in the display cabinet and storage at the consumer(Martinsen et al., 1999). A study in Norway showed that the temperature of whole-sale stores was on average 2–3 °C higher than the ideal temperatures for ‘cold-stored’vegetables. With the retailers the situation was different: most of the produce wasplaced in a storage room and only a small part of it was placed in the counters.The temperature in the counters was 5 °C too high (Martinsen et al., 1999).
7.2. Pretreatment steps for minimally processed vegetables
7.2.1. Decontamination steps
Washing and disinfection are the only steps in the production chain of minimallyprocessed vegetables where a reduction in the microbial load can be obtained(Beuchat, 1998; Day, 2001). The efficacy of washing is often improved by the inclu-sion of antimicrobials in the wash water. Many antimicrobial washing solutionsspecifically for vegetables have been reported in the conventional and patent liter-ature but probably the most widely used is a hypochlorite solution containing 50–100mg/l available chlorine (Adams et al., 1989). A recent survey in the UK showedthat 76% of the vegetables-processing industry is applying chlorine as disinfec-tant, 20% use potable water only, while the remaining use alternatives (Seymour,1999). When chlorine gas (Cl2) or one of the hypochlorite salts (e.g., NaOCl,Ca(OCl)2) is added to water, each will generate chlorine gas, hypochlorous acid(HOCl), or hypochlorite ions (OCl–) in various proportions, depending on the pHof the solution. The active form for chlorination is HOCl. To maximize the pro-portion of hypochlorous acid and, hence, the effectiveness of the solution, the pHshould be kept in the practical range of 6.5 to 7.5. Citric acid and carbon dioxideinjection are typically used to lower the pH while the addition of small amountsof sodium hydroxide are used to raise the pH (Beuchat, 1998; Seymour, 1999;
Quality of Equilibrium Modified Atmosphere Packaged (EMAP) 499

Beuchat, 2000). In the USA, a chlorine concentration of about 55 to 70 µl/l at pH7.0 with a water temperature of 40 °C is recommended to sanitize most intactfruits and vegetables (Boyette et al., 1993). Higher concentrations are required whenthe solution has a higher pH and a lower temperature. Li et al. (2001) found thatheat treatment (50 °C) combined with 20 mg/l free chlorine for 90 s may delaybrowning and reduce initial populations of some groups of microorganisms natu-rally occurring on iceberg lettuce, but enhanced microbial growth during subsequentstorage due to tissue damage.
In the case of fresh-cut vegetables, lower wash water temperatures are recom-mended and a significant reduction in chlorination efficiency can be expected: 3log CFU/g reduction in initial microbial load was found in lettuce washed in chlo-rinated water at 47 °C (100 µl/l, 3 minutes) compared to 1 log CFU/g at 4 °C(100 µl/l, 3 minutes) (Delaquis et al., 1999). Seymour (1999), on the other hand,published that the germicidal rate of free chlorine decreases at higher water tem-peratures (i.e., 37 °C) because chlorine vaporises. Maximum chlorine solubility isachieved in water about 4 °C (Beuchat, 1998). However, the temperature of the chlo-rinated water should ideally be at least 10 °C higher than that of fruits and vegetablesto achieve a positive temperature difference, thereby minimising the uptake of wash-water through stem tissues (Zhuang et al., 1995) and open areas in the skin or leavesdue to mechanical decay (Beuchat, 1998).
Quick dips are much less effective compared to longer exposures. However, mostof the sanitising action of the chlorine will be accomplished within the first severalminutes of exposure (Adams et al., 1989). A normal contact time is between 1and 5 minutes. Contact times depend very much on the type of the system used.Continuous systems tend to have a large throughput and, therefore, have contacttimes less than 10 minutes. In contrast, batch systems generally have longer soakingtimes, ranging from 20 to 60 minutes (Seymour, 1999). Prolonged exposure to strongchlorine solutions has been known to cause surface bleaching (Day, 2001). Beuchatet al. (1998) have demonstrated comparable efficacy of a chlorine spray and dipapplications of chlorinated water. From the vegetables processing industry in the UK89% uses a chlorine dip (batch or continuous) while 11% use a chlorine spray(Seymour, 1999).
A disadvantage of chlorine is its affinity for organic matter. Chlorination ofdirty produce consumes the available chlorine much faster than relatively cleanproduce. The amount of free available chlorine in the solution constantly decreaseswith washing of the vegetables. An extra washing step with potable water isrecommended before chlorination to remove all the dirt. As a result, the pH andthe free chlorine level should be monitored and adjusted regularly, especially whenlarge loads of produce are being processed (Boyette et al., 1993; Kotula et al., 1997).In the UK, only 12% of the vegetable processing industry monitored free residualchlorine (HOCl). Free chlorine, free available chlorine or free residual chlorineare synonyms of the active compound hypochlorous acid.
Although chlorine is the most commonly used disinfectant for decontamina-tion, there are increasing concerns over the presence and safety of disinfectantby-products (DBPs) that are found. The most notable of these are the trihalomethanes(THM), some of which are reported as mutagens (Richardson et al., 1998). A final
500 L. Jacxsens et al.

rinse in potable water may help to reduce levels of residual chlorine remaining onthe minimally processed product and also reduce the risk of THMs or other poten-tially toxic ‘combined chlorine’ compounds, although no literature is presentlyavailable to support this (Ahvenainen, 1996; Seymour, 1999). Because of theseconcerns, alternative disinfectants such as chlorine dioxide, ozone, organic acids,hydrogen peroxide, trisodium phosphate, sucrose esters and bioflavonoids are beingcommercially used or explored because they produce fewer DBPs (Beuchat, 1998;Seymour, 1999; Day, 2001).
Organic acids (including acetic, citric, malic, lactic and/or sorbic acid) may retardthe growth of some microorganisms and prevent the growth of some others (Beuchat,1998). Their antimicrobial activity is attributed to several factors such as (1) reduc-tion of intracellular pH by the undissociated molecule; (2) antimicrobial activityof the molecule itself via inhibition of various enzymes in the cell or disruptionof the activities of the cell wall (Lück and Jager, 1997). These acids do not gen-erally kill the cells but affect the cell’s ability to maintain pH homeostasis, disruptingsubstrate transport and inhibiting metabolic pathways. A possible disadvantage isthat these treatments may change the flavour and aroma of treated products (Beuchat,1998; Day, 2001). Chlorine dioxide (ClO2) has received attention as a disinfectantfor fruits and vegetables, largely because its efficacy is less affected by pH andorganic matter. But ClO2 is unstable, must be generated on-site and can be explo-sive when concentrated. In the USA, it is only authorised for sanitising equipmentbut not as disinfectant for fresh-cut fruits and vegetables (Beuchat, 1998; Seymour,1999). Ozone (O3) is not yet approved by USFDA for sanitizing fruits and vegetablesbut it is considered as a good alternative to chlorine. Ozone has been shown to beeffective for killing a large number of microorganisms including those that are resis-tant to chlorine, extending the shelf life of a number of fruits and vegetables (e.g.,blackberries, grapes, carrots, broccoli) (Richardson et al., 1998; Beuchat, 1998).Ozone treatment is mainly recommended for recycled water, to control build-upof microbial numbers (Beuchat, 1998).
The obtained reductions in microbial load are related to the populations ofmicroorganisms that may be present on the produce. Experience is the best guideto the correct combination of treatment time, concentration of chlorine/antimicro-bial and the crop being processed. Nevertheless, vigorous washing in potable watercan be as effective as decontamination wash treatments using chlorine (Beuchat,1998; Day, 2001). Washing (or rinsing) the vegetables thoroughly with potable watercan reduce the microbial contamination 10 up to 100 times (Brackett, 1992; Beuchat,1998; Day, 2001). In principle, chlorine may not be used as a disinfectant in Belgium,it can only be applied to make water potable in concentrations until 250 µg/l(Anonymous, 1989). Only potable water can be used to come into contact with foods(Anonymous, 1997). Chlorinated water is permitted to disinfect fresh-cut fruitsand vegetables in some European countries (e.g., France, UK) whereas it is bannedin others (e.g., Belgium, the Netherlands) (Martens, 1999). The legal use of varioustreatments differs from country to country. In the USA, more disinfectants anddisinfections treatments are allowed as in Europe (only the compounds present onthe positive list of the European Community) (Anonymous, 1995; Beuchat, 1998).
The most applied methods to decontaminate fresh fruits and vegetables were clas-
Quality of Equilibrium Modified Atmosphere Packaged (EMAP) 501

sified for the WHO by Beuchat (1998) in which chlorination, application of chlorinedioxide, bromine, iodine, trisodium phosphate, quaternary ammonium compounds,acids, hydrogen peroxide, ozone and irradiation are explained. Further informa-tion and guidance on decontamination can be obtained from the reviews ofAhvenainen (1996), De Roever (1998), Seymour (1999), Beuchat (2000) and Day(2001).
An optimal washing step of fresh-cut vegetables consists out of three stages: afirst wash with potable, possibly recirculated water, to remove soil, insects and otherdirt. Followed by a disinfection treatment and finally a rinse step where the majorityof the applied disinfectant is removed (Seymour, 1999; Ahvenainen, 2000). If thewater and product is agitated during washing, surface contact is more adequate. Thiscan be achieved by air jets, water jets, mechanically or via a counter current waterflow. Suspended solids and vegetables debris are often removed by filters. Thewashing water of the third wash step can be recycled in the primary wash step(Seymour, 1999; Ahvenainen, 2000). In the survey of Seymour (1999), it becameclear that large amounts of water are applied during the production of minimallyprocessed vegetables but are restricted by environmental factors (e.g., waste watertreatment). A volume of < 4 l/kg product is in the majority of the industry applied(67%), while the recommended quantity of water that should be used is 5–10 l/kgof product before peeling/cutting and 3 l/kg after peeling and/or cutting (Ahvenainen,1996). Only 22% of the industry in the UK uses 5–10 l/kg product (Seymour,1999).
7.2.2. Antidiscolouration steps
Control of enzymatic browning in minimally processed vegetables and fruits hasreceived a great deal of attention by researchers because of its importance to thefood processing industry. Washing with water immediately after the slicing steps caninhibit the brown discolouration but for some products such as sliced apple andpotato, washing is not enough for the prevention of discolouration. The USFDArestricted the application of sulfites, which have traditionally been used for pre-vention of browning of fruits and vegetables intended to be served raw to theconsumers, sold raw to the consumers or be presented to consumers as fresh (Taylor,1993; Laurila et al., 1998). EU Directives on sulphite compounds, calculated as SO2,depends on the foodstuff but there are only a few limits for fresh fruits andvegetables, such as peeled potatoes (50 mg/kg) and prepared (included frozen)potatoes (100 mg/kg) (95/2/EU) (Anonymous, 1995; Laurila et al., 1998). At thesame time, interest in substitutes for sulphites is increasing (Martinez and Whitaker,1995; Ahvenainen, 2000; Day, 2001).
In theory, PPO activity can be prevented by heat inactivation of the enzyme(70 to 90 °C), the exclusion or removal of O2 (applied in Equilibrium ModifiedAtmosphere Packaging) or the application of high O2-concentrations (i.e., >70%)to provoke product-inhibition or substrate-inhibition (see section 7.3.2) (Kaderand Ben-Yehoshua, 2000; Day, 2001). Lowering the pH of the minimally processedproduct to two or more units below the optimum pH of PPO (between 6 and 7)will reduce its activity as well, while below pH 3 a complete inactivation is obtained
502 L. Jacxsens et al.

(McEvily et al., 1992). The activity of the enzyme may be decreased by storageat low temperatures (< 10 °C, the optimal temperature for the PPO enzyme is25–30 °C) or chelating catalysing metal ions (Cu2+) with EDTA, . . . (Laurila etal., 1998; Ahvenainen, 2000; Day, 2001).
Chemical methods are mostly dipping or spray methods with organic/anorganicacids or other compounds. Probably the most frequently studied alternative tosulphite is ascorbic acid because it is generally recognized as safe, inexpensiveand consumer-friendly (Gil et al., 1998b). It has the ability to reduce quinonesback to phenolic compounds before they undergo further reaction to form pigments(Figure 4), but once the ascorbic acid has been completely oxidised to DHAA (dehy-droascorbic acid), quinones can accumulate and undergo browning (McEvily etal., 1992; Laurila et al., 1998). Better results are obtained in combination withother compounds as citric acid. Citric acid acts as a chelating agent (binding thecopper ions in the active site) and as acidulant, both inhibiting PPO (Dziezak,1986; Laurila et al., 1998). Both products have a GRAS status (Dziezak, 1986).4-Hexylresorcinol (4HR) is a patented and in the USA approved browning inhibitorfor apples, potatoes and iceberg lettuce. It interacts with PPO and renders it inca-pable of catalysing the enzymatic reaction. It is the active ingredient in a commercialbrowning inhibitor, EverFreshTM (McEvily et al., 1992; Laurila et al., 1998). EDTA,a complexing agent for copper, has been successfully used in combination with otherbrowning inhibitors. Different possible combinations of chemical treatments arereviewed in detail by Dziezak (1986), McEvily et al. (1992), Laurila et al. (1998)and Ahvenainen (2000). The application of chemical methods can be used to controlbrowning in minimally processed vegetables as long as the acidity can be toler-ated taste-wise (Martinez and Whitaker, 1995) and does not result in a loss of texture.In Europe, the legislation restricts the application of antidiscolouration agents andonly the compounds present on the European positive list may be applied(Anonymous, 1995).
It is recommended that non-sulphite dipping procedures should be applied as soonas possible after the fresh produce has been prepared. Enzymatic discolourations canbecome visible within minutes. Hence, when immediate immersion is not possiblethen fresh-cut produce should be immersed temporarily in chilled potable water.Risk exists, however, that produce absorbs extensive amounts of water which canlead to soft waterlogged textures, translucent appearance and faster deterioration(Seymour, 1999; Day, 2001). Out of the review work of Laurila et al. (1998), itbecomes clear that the dipping protocol (concentrations, dipping time and temper-ature) needs to be optimised for each minimally processed product.
However, some general principles can be formulated (1) the compounds of thedipping must be safe and approved for food use (present on the European positivelist for Europe, FDA approved for the USA); (2) no negative effect on aroma,taste, texture and nutritional quality should be observed; (3) the temperature shouldbe between 0–5 °C since the compounds are more rapidly absorbed in the plant tissuewhen the solution is colder than the temperature of the fresh-cut product; (4) dippingtimes are usually in the range of 2–5 minutes as very short times (<1 minute) arenot long enough to permit sufficient absorption and too long dipping times maylead to detrimental effect on the appearance of the product due to excessive water
Quality of Equilibrium Modified Atmosphere Packaged (EMAP) 503
absorption; (5) dipping solutions are made freshly and are replaced at appropriateintervals depending on the quantity of produce to be dipped (Day, 2001).
Enzymatic methods are less numerous compared to chemical possibilities. Proteaseenzymes were found to be effective browning inhibitors for apples and potatoes.It is believed that an effective protease acts to hydrolyse, and, therefore, inacti-vate the enzymes responsible for enzymatic browning (Laurila et al., 1998).
Physical methods can be applied alone or in combination with a dip or spray treat-ment with chemical compounds. The most applied technique to delay enzymaticbrowning is probably the application of reduced O2-concentrations in the storageatmosphere of the fresh-cut product. To inhibit browning, O2-concentrations shouldbe below 1% but these conditions may cause damage to the product by inducinganaerobic metabolism, leading to the breakdown and off-flavour formation (Beaudry,1999; Beaudry, 2000).
The effectiveness of high-O2 modified atmosphere packaging on minimallyprocessed vegetables was reviewed by Kader and Ben-Yehoshua (2000) and Day(2001). This so-called ‘oxygen shock’ or ‘gas shock’ treatment has been found tobe particularly effective in inhibiting enzymatic browning of shredded iceberglettuce, sliced mushrooms, cos lettuce, radicchio lettuce and lollo rossa lettuce (Day,2001). But no improvement against discolouration of potatoes slices and pear sliceswas detected when exposed at 100% O2 (Kader and Ben-Yeshoshua, 2000). Heimdalet al. (1995) concluded that an atmosphere of 80% O2 and 20% CO2 decreased enzy-matic browning of shredded lettuce compared with that resulting from exposureto air + 20% CO2 but best results were obtained with 1–3% O2 and 5–6% CO2.Jacxsens et al. (2001a) demonstrated the browning inhibition of high oxygen atmos-phere for grated celeriac, mushroom slices and shredded chicory endives comparedto low oxygen packaging. It is hypothesised that high O2 levels may cause sub-strate inhibition of PPO or, alternatively, high levels of colourless quinones formedmay cause feedback inhibition of PPO (Day, 2001).
7.2.3. Shredding, chopping, slicing steps
Peeling and slicing steps cause physiological stress (increase of respiration by woundrespiration and ethylene production), physical damage and enhances microbialgrowth due to increased availability of cell juice and nutrients (Barry-Ryan andO’Beirne, 1998; Ahvenainen, 2000). There are several peeling methods available,but on an industrial scale, the peeling is normally mechanically (e.g., rotating car-borundum drums), in some case chemically (potatoes, stone fruits and oranges) orin high pressure steam peelers. However, the ideal method would be hand peelingwith a sharp knife (Ahvenainen, 2000). Consequently, if mechanical peeling isapplied, it should imitate knife peeling.
The results of Barry-Ryan and O’Beirne (1998) provide insights into the mag-nitude and basis of slicing effects and also confirm the importance of gentlyprocessing and the use of a sharp blade. It was previously demonstrated for severalproducts by Garg et al. (1990). It is clear that slicing with dull knives impairs qualityretention because of the breaking of cells and the release of cell juice with nutri-ents. The slicing blades should be regularly disinfected and sharpened (minimally
504 L. Jacxsens et al.

after each 8 h of production, depending on product type (Yildiz, 1994)). Yildiz (1994)is discussing in detail the different parameters which have to be taken into accountin order to obtain an optimal cutting procedure for a specific produce such as: cuttingangle, cutting speed, size, and shape.
Centrifugation is thought to be the best method to reduce the remaining water(Yildiz, 1994; Ahvenainen, 1996) but it is advised that the centrifugation time andrate are chosen carefully for each type of product (Yildiz, 1994; Ahvenainen,2000). Out of a recent questionnaire it became clear that 71% of the vegetableprocessing industry in the UK is using a spin drying system (Seymour, 1999).Advances in dewatering technologies include continuous systems such as rotatingconveyors, dewatering and drying conveyors. These systems operate on-line whichhas the added benefit of reducing manual labour, avoiding dewatering bottle neckand increasing through-put. For large processing lines, continuous systems arerecommended, but they lack the flexibility of spin drying systems (Seymour, 1999).Dewatering systems nowadays include spin dryers (centrifugal), vibrating racks,rotating conveyers, hydro-sieves and spinless dewatering and drying tunnels(Seymour, 1999). Continuous-flow conveyor systems using air removal are usedto avoid injury problems, but may also contribute to product warming, dependingon their design.
Combined foods such as salads and soup-vegetables require mixing and assem-bling before packaging. The final operation in the processing of minimally processedvegetables takes place in the assembly and packaging room. The assembly zone isthe most critical zone in the processing chain and cross or recontamination mustbe avoided. Optimally, a positive air pressure is maintained with filtered air, ambienttemperature is controlled at 10–12 °C and high relative humidity (60–70%). Asmixing machines, trumbles are most widely applied for fresh-cut produce as a gentlemixing is possible to avoid physical deterioration (Yildiz, 1994; Ahvenainen, 2000).Key requirements in processing minimally processed vegetables are summarisedin Figure 5.
Quality of Equilibrium Modified Atmosphere Packaged (EMAP) 505
• Good quality raw materials (cultivar variety, correct and controlled cultivation, harvesting andstorage conditions)
• Strict hygiene and good manufacturing practices, use of HACCP principles• Low product/environmental temperature during processing• Careful cleaning and/or washing before and after peeling• Good quality water (pH, microbiology, minerals) for washing• Use of mild additives in washing water for disinfection or the prevention of browning• Gently spin drying following washing• Gently peeling• Gently cutting, slicing and/or shredding• Correct packaging materials and methods• Correct temperature during distribution and retailing
Figure 5. The key requirements in the minimal processing of vegetables and fruits (afterAhvenainen, 1996; Martens, 1999; Seymour, 1999; Ahvenainen, 2000).

7.3. Packaging of minimally processed vegetables
7.3.1. Equilibrium modified atmosphere packaging
The final, but not the least important, operation step in the production of mini-mally processed vegetables is packaging. The most studied packaging method forfresh-cut vegetables is modified atmosphere packaging (MAP). Lower oxygen con-centrations result in a lower metabolic activity (i.e., respiration rate, chlorophylldegradation, ethylene biosynthesis). The aim of the packaging is to create an atmos-phere, which retards the produce respiration in such way that the minimal necessaryO2-concentration or maximum tolerated CO2-concentration of the packaged produceis not exceeded, to avoid a shift towards fermentation or other metabolic disor-ders. The modified atmosphere can be created passively by produce respiration oractively by direct injection of gas into the packages (mostly flushing during a certaintime with N2). The latter (active modification of the atmosphere, AMAP) is pre-ferred for fresh-cut vegetables, as their shelf life is already relatively short. Thepackaging of fresh-cut vegetables is based on the proper choice of packaging film:the permeability of the film for O2 and CO2 must be adapted to the produce O2
consumption rate and CO2 production rate. If the permeability for O2 and CO2 isperfectly matched to the produce respiration rate, an ideal equilibrium modifiedatmosphere can be established inside the package. In that case, the produce ispackaged under Equilibrium Modified Atmosphere (EMA). This atmosphere is formost produce optimally between 1–5% O2 and 3–10% CO2, balanced by N2 (Kaderet al., 1989). If higher CO2-concentrations are tolerated by the produce (e.g., broccoli,cabbages), eventually concentrations of 15 to 20% CO2 may be applied for its antimi-crobial activity (Watkins, 2000; Gorny, 2001).
The required film permeability for O2 and CO2, in order to obtain equilibriumO2 and CO2-concentrations can be calculated via a mathematical equation (in thecase of an active modification of the atmosphere) or via a dynamic mathematicalmodel if the atmosphere is passively modified (Solomos, 1994; Peppelenbos andvan ‘t Leven, 1996):
d(O2)/dt = {OTR . A . ((O2)out – (O2)in)}/V – {RO2 . W}/V (1)
d(CO2)/dt = {CO2TR . A . ((CO2)in – (CO2)out)}/V + {RCO2 . W}/V (2)
with:
(O2)ou = O2-concentration outside the package (%) (air = 20.9%)(O2)in = O2-concentration inside the package (%) (optimal = 1–5%)(CO2)out = CO2-concentration outside the package (%) (air = 0.03%)(CO2)in = CO2-concentration inside the package (%) (optimal between 3–10%)A = area of the film (m2) = length × width × 2W = fill weight (kg)V = headspace of the package (ml)OTR = O2 transmission rate (ml O2/(m
2.24 h.atm)) at desired storage tem-perature
506 L. Jacxsens et al.

CO2TR = CO2 transmission rate (ml CO2/(m2.24 h.atm)) at desired storage
temperatureRO2 = respiration rate of the packaged vegetable at desired internal oxygen
concentration and temperature, expressed as the O2 consumption (mlO2/(kg.h))
RCO2 = respiration rate of the packaged vegetable at desired internal oxygenconcentration and temperature, expressed as the CO2 production (mlCO2/(kg.h))
From the dynamic equations (1) and (2), the steady state conditions can be derived(3) and (4), by setting d(O2)/dt = 0 and d(CO2)/dt = 0 (Solomos, 1994):
RO2 . W = OTR . A . {(O2)out – (O2)in} (3)
RCO2 . W = CO2TR . A . {(CO2)in – (CO2)out} (4)
Several proposals are made in the literature to design modified atmospherepackages for fresh-cut products, as a function of optimal required O2/CO2-conditionsinside the packages and/or of temperature (Lee et al., 1991; Solomos, 1994; Talasilaet al., 1994; Cameron et al., 1995; Fishman et al., 1995; Talasila et al., 1995;Segall and Scanlon, 1996; Talasila and Cameron, 1997; Hertog et al., 1998; Lakakulet al., 1999; Jacxsens et al., 1999b, 2000).
Nonrespiring products can be exposed to very high CO2-concentrations (>20%CO2) and/or anaerobic conditions to suppress the growth of undesirable organisms(Farber, 1991; Church and Parsons, 1995). Fresh vegetables require the presenceof O2 and do not tolerate high levels of CO2 to maintain their aerobic metabolic func-tions (Beaudry, 2000; Watkins, 2000). Under typical EMA conditions, the extendedshelf life of the packaged vegetables is thought to result from a decreased productrespiration (Kader et al., 1989; Willocx, 1995) and no direct effect towards inhi-bition of the growth of spoilage microorganisms can be expected (Bennik et al.,1995; Carlin et al., 1996a; Bennik, 1997; Bennik et al., 1998). Philips (1996) andZagory (1999) concluded that under conditions that support the physiology of thehost plant tissues (typically 2–3% O2, 5–20% CO2), some reduction in microbialgrowth can be attributed to MAP for vegetables. However, the decreased O2-con-centrations, applied in MA packaging of minimally processed vegetables, werenot inhibiting growth of aerobic bacteria as P. fragi, P. fluorescens and P. putida(Bennik, 1997), Xanthomonas and Erwina spp. (Hao and Brackett, 1993). Thepossible decrease in growth of spoilage microflora is mainly due to the increasedCO2-concentration which increases the lag-phase and generation time (Bennik, 1997;Devlieghere, 2000). Only if higher CO2-concentrations are applied, a direct antimi-crobial effect can be expected. It has been shown that CO2 levels well above 20–50%significantly affect the growth of psychrotrophic microorganisms that are relevantto MA-packaged produce (Bennik et al., 1995). Generally, a concentration of10–15% CO2 is considered as the phytotoxic limit for raw and minimally processedvegetables (Watkins, 2000). Gram negative bacteria, and Pseudomonas species ina greater extent than Enterobacteriaceae species, are sensitive to CO2 resulting inan inhibition of the microbial rotting of the minimally processed vegetables (Bennik,
Quality of Equilibrium Modified Atmosphere Packaged (EMAP) 507
1997; Bennik et al., 1998). Bennik et al. (1995) did not found a difference ingrowth of Pseudomonas spp. and Enterobacteriaceae between different O2-con-centrations (1.5%; 21%) and a constant CO2-concentration but a decreased growthrate was detected with increasing CO2-concentrations (0, 5, 20 or 50%). Scientiststend to accept that the in-vivo inhibition of soft rot is not caused directly by EMAbut is attributed to the fact that the plant tissue is kept longer in a better conditionand has more protection against microbial invasion (Manzano et al., 1995; Bennik,1997).
7.3.2. High oxygen atmosphere packaging
The application of high O2-concentrations (i.e., >70% O2) could overcome thedisadvantages of low O2 modified atmosphere packaging (EMA) for some ready-to-eat vegetables. High O2 was found to be particularly effective in inhibitingenzymatic discolouration, preventing anaerobic fermentation reactions and inhibitingmicrobial growth (Day, 2000; Day, 2001). Amanatidou et al. (1999) screenedmicroorganisms associated with the spoilage and safety of minimally processedvegetables. In general, exposure to high oxygen alone (80 to 90% O2, balance N2)did not inhibit microbial growth strongly and was highly variable. A prolongationof the lag phase was more pronounced in combination with CO2. Amanatidou etal. (1999) as well as Kader and Ben-Yehoshua (2000) suggested that these highO2 levels could lead to intracellular generation of reactive oxygen species (ROS,O2
–, H2O2, OH.), damaging vital cell components and thereby reducing cell via-bility when oxidative stresses overwhelm cellular protection systems. Combined withan increased CO2-concentration (10 to 20%), a more effective inhibitory effect onthe growth of all microorganisms was noticed rather than the individual gasesalone (Amanatidou et al., 1999; Amanatidou et al., 2000). Wszelaki and Mitcham(1999) found that 80–100% O2 inhibited the in-vivo growth of Botrytis cinerea onstrawberries. Based on practical trials (best benefits on sensory quality and antimi-crobial effects), the recommended gas levels immediately after packaging are80–95% O2 – 5–20% N2. Carbon dioxide level is increasing naturally due to productrespiration (Day, 2001; Jacxsens et al., 2001a). Exposure to high O2 levels may stim-ulate, have no effect or reduce rates of respiration of produce depending on thecommodity, maturity and ripeness stage, O22-concentration, time and temperatureof storage, and the CO2 and C2H4-concentrations (Kader and Ben-Yehoshua, 2000).Respiration intensity is directly correlated to the shelf life of produce (Kader etal., 1989). Therefore, the quantification of the effect of high O2 levels on the res-piratory activity is necessary (Jacxsens et al., 2001a). To maximise the benefits ofhigh O2 atmospheres, it is desirable to maintain levels of >40% O2 in the head-space and building up CO2 levels in the range of 10–25%, depending on the typeof packaged produce. These conditions can be obtained by altering packaging para-meters such as storage temperature, selected permeability for O2 and CO2 of thepackaging film and reducing or increasing gas/product ratio (Day, 2001).
High O2 MAP of vegetables is only commercialised in some specific cases,probably because of the lack of understanding of the basic biological mechanismsinvolved in inhibiting microbial growth, enzymatic browning and concerns about
508 L. Jacxsens et al.

possible safety implications. Concentrations higher than 25% O2 are considered tobe explosive and special precautions have to be taken on the work floor (BCGA,1998). In order to keep the high oxygen inside the package, it is advised to applybarrier films or low permeable OPP films (Day, 2001). But for high respiringproducts, such as strawberries or raspberries, it is better to combine high oxygenatmospheres with a permeable film for O2 and CO2, as applied in EMA packaging,in order to prevent a too high accumulation of CO2 (Jacxsens et al., 2001b).
7.3.3. Permeability of packaging films
The most difficult task at this moment in the technology of minimally processedvegetables is to reach the optimal EMA conditions inside the packages. The mainproblem is that only a few packaging materials on the market are permeable enoughto compensate the respiration of fresh-cut vegetables. Most films do not result inoptimal O2 and CO2 conditions, especially when the produce has a high respira-tion rate (Ahvenainen, 2000; Lange, 2000). Nowadays applied BOPP (bi-orientedpolypropylene) or OPP (oriented polypropylene) packaging films will give only goodresults for slow to moderately respiring products, stored at low temperatures. Onepossible solution is to make microholes of defined size and quantity in the film.In most cases, however, an accumulation of CO2 will occur because the selectivity(ratio of CO2 permeability over O2 permeability) of this type of films is about 1(Lange, 2000). Another problem, which is met, is the difference in temperaturesensitivity of the respiration rate of the produce and the film permeability. TheQ10 (2–3) of the respiration is higher compared to the Q10 (1–2) of most packagingfilms (Exama et al., 1993; Jacxsens et al., 2000), resulting in an inbalance betweenO2 diffusion through the film and O2 consumption of the product. To avoid anaer-obic conditions, it would be advantageous for the product shelf life retention to havea film permeability increased by temperature at least as much as the respirationrate increases (Exama et al., 1993; Ahvenainen, 2000). A good overview of thedifferent possibilities of packaging films to package minimally processed vegeta-bles is published by Exama et al. (1993), Ahvenainen (2000) and Lange (2000).They provide information about the different permeability ratio’s for O2 and CO2,the mechanical properties of the films and the composition of the films. A problemexists in most of the literature that gas permeabilities are measured and expressedat relatively high temperatures (23 °C or higher).
Optimally, a relation between temperature and permeability should be definedas an Arrhenius type of equation, from which the permeability at the desiredstorage temperature can be calculated (Exama et al., 1993; Jacxsens et al., 2000;Day, 2001). For some applied polymers, permeability characteristics are changingas a function of relative humidity as well. In this case, also a correction for theapplied humidity in the package (>90%) must be made (Beaudry, 2000).
Several recently developed packaging films are already commercialised or in alate-experimental stage answering to the demand towards more permeable filmsand/or temperature-adaptive films. Examples are (1) a co-extrusion of ethylene vinylacetate with orientated polypropylene (OPP) and low-density polyethylene (LDPE)(Nießner et al., 1998); (2) a combination of ceramic materials with polyethylene
Quality of Equilibrium Modified Atmosphere Packaged (EMAP) 509
(Joyce, 1988). Both composite materials have significantly higher gas permeabili-ties compared to OPP or BOPP, have good sealing properties and are commerciallyavailable (Ahvenainen, 2000); (3) a new breathable film has been patented thathas a three-layer structure with an inner metallocene PE layer resulting in thepossibility to adjust the permeability for O2 in a certain range (Ahvenainen, 2000);(4) films with an adjustable ‘temperature switch’ point, at which the film’s per-meation changes rapidly are another example of new designed packaging films. Theyare based on a long-chain fatty alcohol polymeric chains (Ahvenainen, 2000;Beaudry, 2000); (5) another temperature-sensitive film has been studied in the UK.It is based on two layers which expand or contract differently when temperaturerises or decreases (Ahvenainen, 2000); (6) Lange (2000) mentioned the availabilityof a high O2 permeable, high temperature sensitive film and other possibilities. Arecently published overview by Ozdemir et al. (1999) provides information con-cerning the newest applied techniques to improve different characteristics of thepackaging films.
An emerging packaging trend is to downsize material thickness and to choosepackaging films consisting of only one material. In general terms, a packagingfilm applied for minimally processed vegetables must be crispy, transparent, glossyand approved to the general migration limitations of materials intended for contactwith food products (Yildiz, 1994; Lange, 2000). Whatever packaging material isused for packaging minimally processed vegetables, all of them must comply withstatutory legal requirements and be fully food approved. Maximum migrationlimits from packaging material to food product are set up by Europe (directive90/128/EEG). Each delivery or batch has a reference code to identify it in storageand during further use. All packaging material should be stored off the floor inseparate and dry areas (De Roever, 1998; Day, 2001).
Nowadays, most minimally processed products are packaged on vertical form-fill-seal (VFFS) and horizontal form-fill-seal (HFFS) machines (Hartley, 2000).These ‘flow pack’ machines use a gas flushing technique to introduce gas intoEMA pillow packs. Machines, using a compensated vacuum technique, thermoform-fill-seal (TFFS), are not recommended for sensitive perishable ready-to-eatvegetables and fruits. The application of a vacuum can create physical damage tothe produce (Day, 2001).
8. GMP AND HACCP
Three useful tools in product development of minimally processed foods are: (1)combined process technology (hurdle technology) primarily used in food design(Leistner, 2000); (2) predictive microbiology for process refinement (Devlieghere,2000) and (3) HACCP for process control (Leistner, 2000; Tapia et al., 2000). Toprevent foodborne diseases associated with fresh-cut produce, it is necessary toprevent initial contamination and reduce, eliminate and prevent amplification ofpathogens. Regulation of fresh-cut produce is difficult because they are simulta-neously raw agricultural foods and ready-to-eat foods (Vanconcellos, 2000). Proper
510 L. Jacxsens et al.

sanitation at all levels in the fresh produce chain, from farm-to-table, is crucial(De Roever, 1998; Wilson et al., 2000). Good Agricultural Practices (GAP) and GoodManufacturing Practices (GMP) should give guidance on those agricultural andprocessing steps that can reduce pathogen levels on fresh (minimally processed)produce (Beuchat, 1998; De Roever, 1998; Leistner, 2000; Wilson et al., 2000).In several countries, GMP principles are published for their producers andhandlers of fresh produce. Examples are in the USA (IFPA, 1997; CFSAN, 1998;Wilson et al., 2000), in France (CNERNA-CNRS, 1996) and in the Netherlands(Productschap Tuinbouw, 1997). Further, the production of minimally processedvegetables can be controlled by following the principles of a HACCP system inthe processing plant. Typical Critical Control Points (CCPs) in a vegetable processingunit are (1) presence of chemical residues at reception of the raw vegetables, (2)temperature of the product during processing units, storage units and transport(prevention of microbial outgrowth), (3) control of disinfection step (concentra-tion of disinfectans, pH and temperature), (4) metal detection of final packages,product free of other physical hazards (stones, insects, glass, . . .) (IFPA, 1997; Tapiaet al., 2000). Via the application of properly performed storage tests and challengetests, a realistic shelf life can be defined for a specific minimally processed product,surely if the product is subjected to realistic time-temperature conditions in thedistribution chain from producer until consumer (Tapia et al., 2000).
9. CONCLUSION AND PERSPECTIVES
Consumers attribute healthy, fresh and ‘quality-full’ properties to minimallyprocessed vegetables. It is, therefore, to guarantee a certain sensory, microbial andnutritional quality of the minimally processed fresh-cut produce.
Modified atmosphere packaging is a preservation technique widely applied forthe distribution of minimally processed foods. The design of a package for (fresh-cut) fruits and vegetables needs special attention because of their postharvestrespiratory activity. The respiration activity is complex and depends to a highextent on the plant tissue and environmental conditions.
Temperature control has proven to be the most important extrinsic critical pointfor minimally processed vegetables, for which the intrinsic properties will not inhibitmicrobial growth. Temperature control will also result in maintaining the atmos-phere at aerobic levels, preventing fermentation of the plant tissue and degradationof sensory quality due to autolytic activity. Applied time-temperature combina-tions in the distribution chain of minimally processed foods should respectivelybe as short and low as possible. Responsibility has to be taken on each step, from‘farm to fork’, also by the consumers who are often a weak point in the chain. Furthersensibilisation of the consumers by delivering in an efficient way information con-cerning the risks of temperature abuse, can probably influence the attitude of theconsumer in the agri-food chain.
The following recommendations for reaching an optimal shelf life/quality of EMApackaged fresh-cut vegetables can be formulated:
Quality of Equilibrium Modified Atmosphere Packaged (EMAP) 511

(1) A good package design (realistic packaging configurations and film thickness)must be accompanied with adequate temperature control (4–7 °C) throughoutthe whole distribution chain.
(2) The atmosphere should be actively modified by flushing techniques in orderto obtain the desired atmosphere immediately after packaging. Highly respiringproducts, for which no permeable packaging film can be found, can be packagedin air-conditions.
(3) The packaging film has to be selected towards a sufficient permeability forO2 and also CO2 in order to avoid a shift towards anoxic conditions and meta-bolic CO2 injury. Permeability properties must be defined at the same conditionsas the storage conditions (temperature 4–7 °C, relative humidity 90–95%).
(4) The recommended shelf life must be validated based on both microbial andsensory quality as well as microbial safety in a ‘real’ distribution chain.
(5) Fresh-cut vegetables, very sensitive to enzymatic discolouration such as gratedceleriac, shredded chicory endive, mushroom slices, can be packaged under ahigh oxygen atmosphere.
Information regarding EMA packaging and its effect on respiration, microbialgrowth or other quality aspects related to minimally processed vegetables has beenextensively published during the last years in scientific literature. However, severalaspects must be further studied in detail.
The distinction between deterioration, caused by autolytic activity and micro-bial proliferation is difficult to make and not always obvious. Information aboutmicrobial metabolite production (both volatile and non-volatile) and spoilage of min-imally processed vegetables is limited.
Evaluating sensory properties during the shelf life experiments can give impor-tant additional information. In the past, the sensory quality of fruits and vegetableswas related to texture and visual properties. A trend exists towards the consump-tion of taste-full fruits and vegetables. A consumer oriented approach of sensoryquality is recommended, which also takes into consideration quality aspects suchas aroma, flavour and juiciness. Objective measurements of these properties mustbe evaluated together with a trained taste panel.
Further investigation must be carried out on new and innovative natural preser-vatives, such as those produced by lactic acid bacteria and those derived fromherbs and spices. Also safe and applicable non-chlorine alternatives must be furthervalidated on industrial scale to improve the shelf life periods and the obtained qualityin combination with the optimised packaging systems (EMA and HOA).
A lack of information exists also about the application of high oxygen atmos-pheres, as an alternative gas atmosphere for respiring products. The reason behindthe inconsequent inhibition of the enzymatic browning of some fresh-cut fruitsand vegetables by high oxygen atmospheres, and the mechanism behind the retar-dation or inhibition of microbial growth have not (yet) been elucidated.
512 L. Jacxsens et al.
REFERENCES
Abbott, J. (1999). Quality measurement of fruits and vegetables. Postharvest Biology and Technology15: 207–225.
Abbott, S., H. Serve and J. Janda (1994). Case of Aeromonas veronii (DNA group 10) bacteremia.Journal of Clinical Microbiology 32: 3091–3092.
Adams, M., A. Hartley and L. Cox (1989). Factors affecting the efficacy of washing procedures usedin the production of prepared salads. Food Microbiology 6: 69–77.
Ahvenainen, R. (1996). New approaches in improving the shelf-life of minimally processed fruits andvegetables. Trends in Food Science and Technology 7: 179–186.
Ahvenainen, R. (2000). Minimally processing of fresh produce. In S. Alzamora, M. Tapia and A. Lopez-Malo (eds.), Minimally processed fruits and vegetables (fundamental aspects and applications).An Aspen Publication, Maryland, USA, pp. 277–290.
Alinorm 99/13A (1999). Report of the 31st session of the Codex Committee on Food Hygiene.Alzamora, S., M. Castro, S. Vidales, A. Nieto and D. Salvatori (2000a). The role of tissue microstruc-
ture in the textural characteristics of minimally processed fruits. In S. Alzamora, M. Tapia andA. Lopez-Malo (eds.), Minimally processed fruits and vegetables (fundamental aspects and appli-cations). An Aspen Publication, Maryland, USA, pp. 153–171.
Alzamora, S., A. Lopez-Malo and M. Tapia (2000b). Overview. In S. Alzamora, M. Tapia and A. Lopez-Malo (eds.), Minimally processed fruits and vegetables (fundamental aspects and applications).An Aspen Publication, Maryland, USA, pp. 1–9.
Amanatidou, A., E. Smid and L. Gorris (1999). Effect of elevated oxygen and carbon dioxide on the surface growth of vegetable-associated micro-organisms. Journal of Applied Microbiology 86:
429–438.Amanatidou, A., R. Slump, L. Gorris and E. Smid (2000). High oxygen and high carbon dioxide modified atmospheres for shelf life extension of minimally processed carrots. Journal of Food Science
65: 61–66.Anonymous (1982). Koninklijk besluit van 4 februari 1980 betreffende het in de handel brengen van
te koelen voedingsmiddelen. In De warenwetgeving. Verzamelingen van reglementen betreffendevoedingsmiddelen en andere consumptieproducten. Die Keure, Brugge, Belgium, 1A, 3, pp. 13–14.
Anonymous (1988). Guide de bonnes pratiques hygiéniques concernant les produits végétaux prêts àl’emploi, dits de « IV » gamme. B.O.C.C.R.F. du 13 août 1988.
Anonymous (1989). Besluit van de Vlaamse executieve (15 maart 1989), houdende vaststelling vaneen technische reglementering inzake drinkwater. In De warenwetgeving. Verzamelingen van regle-menten betreffende voedingsmiddelen en andere consumptieproducten. Die Keure, Brugge, Belgium,1A, 2.9. (dranken) pp. 4/6.
Anonymous (1995). Richtlijn 95/2/EG van het Europees Parlement en van de Raad van 20 februari 1995betreffende levensmiddelenadditieven met uitzondering van kleurstoffen en zoetstoffen. In De waren-wetgeving. Europese reglementering. Die Keure, Brugge, Belgium, 1C, 5.2.8 (toevoegsels)pp. 63–106.
Anonymous (1997). Koninklijk besluit van 7 februari 1997 inzake de algemene voedingsmiddlenhy-giëne. In De warenwetgeving. Verzamelingen van reglementen betreffende voedingsmiddelen enandere consumptieproducten. Die Keure, Brugge, Belgium, 1A, 5.2 (hygiënemaatregelen) pp. 3.
Artes, F. and J. Martinez (1996). Influence of packaging treatments on the keeping quality of ‘Salinas’lettuce. Lebensmitteln Wissenschaft und Technologie 29: 664–668.
Babic, I., G. Hilbert, C. Nguyen-the and J. Guiraud (1992). The yeast flora of stored ready-to-use carrotsand their role in spoilage. International Journal of Food Science and Technology 27: 473–484.
Babic, I., S. Roy, A. Watada and W. Wergin (1996). Changes in microbial populations on fresh-cutspinach. International Journal of Food Microbiology 31: 107–119.
Badawy, A., C. Gerba and L. Kelly (1985). Survival of rotavirus SA-11 on vegetables. FoodMicrobiology 2: 199–205.
Bagamboula, C., M. Uyttendaele and J. Debevere (2001a). Acid tolerance of Shigella sonnei and flexneri.Proceedings of Nizo Dairy Conference on Food Microbes, 13–15 June, 2001, Ede, the Netherlands,pp. 127.
Quality of Equilibrium Modified Atmosphere Packaged (EMAP) 513
Bagamboula, C. M. Uyttendaele and J. Debevere (2001b). Growth and survival of Shigella sonneiand S. flexneri in minimal processed vegetables packed under equilibrium modified atmosphereand stored at 7 °C and 12 °C. Food Microbiology, in press.
Barriga, M., G. Trachy, C. Willemot and R. Simard (1991). Microbial changes in shredded iceberglettuce stored under controlled atmospheres. Journal of Food Science 56: 1586–1588, 1599.
Barry-Ryan, C. and D. O’Beirne (1998). Quality and shelf-life of fresh cut carrots slices as affectedby slicing method. Journal of Food Science 63: 851–856.
Barth, M. and H. Zhuang (1996). Packaging desing affects antioxidant vitamin retention and qualityof broccoli florets during postharvest storage. Postharvest Biology and Technology 9: 141–150.
Batt, C. (2000). Lactobacillus/introduction. In R. Robinson, C. Batt and P. Patel (eds.), Encyclopediaof food microbiology. Academic Press, London, UK, pp. 1134–1136.
BCGA (1998). The Safe Application of Oxygen Enriched Atmospheres when Packaging Food. BritishCompressed Gases Association, Hampshire, UK, 39 pp.
Beaudry, R. (1999). Effect of O2 and CO2 partial pressure on selected phenomena affecting fruit andvegetable quality. Postharvest Biology and Technology 15: 293–303.
Beaudry, R. (2000). Responses of horticultural commodities to low oxygen: limits to the expandeduse of modified atmosphere packaging. HortTechnology 10: 491–500.
Bennik, M., E. Smid, F. Rombouts and L. Gorris (1995). Growth of psychrotrophic foodborne pathogensin a solid surface model system under the influence of carbon dioxide and oxygen. Food Microbiology12: 509–519.
Bennik, M. (1997). Biopreservation in modified atmosphere packaged vegetables. PhD. thesis, Universityof Wageningen, the Netherlands, 96 pp.
Bennik, M., W. Vorstman, E. Smid and L. Gorris (1998). The influence of oxygen and carbon dioxideon the growth of prevalent Enterobacteriaceae and Pseudomonas species isolated from fresh andcontrolled-atmosphere-stored vegetables. Food Microbiology 15: 459–469.
Bennik, M., W. van Overbeek, E. Smid and L. Gorris (1999). Biopreservation in modified atmos-phere stored mungbean sprouts: The use of vegetable-associated bacteriogenic lactic acid bacteriato control the growth of Listeria monocytogenes. Letters in Applied Microbiology 28: 226–232.
Berrang, M., R. Brackett and L. Beuchat (1989a). Growth of Aeromonas hydrophila on fresh vegeta-bles stored under a controlled atmosphere. Applied and Environmental Microbiology 55: 2167–2171.
Berrang, M., R. Brackett and L. Beuchat (1989b). Growth of Listeria monocytogenes on fresh vegetablesstored under a controlled atmosphere. Journal of Food Protection 52(10): 702–705.
Berrang, R., R. Brackett and L. Beuchat (1990). Microbial, colour and textural qualities of freshasparagus, broccoli and cauliflower stored under controlled atmosphere. Journal of Food Protection53(11): 391–395.
Beuchat, L. (1996). Pathogenic microorganisms associated with fresh produce. Journal of FoodProtection 59(2): 204–216.
Beuchat, L. (1998). Surface Decontamination of Fruits and Vegetables Eaten Raw: A Review. FoodSafety Issues WHO/FSF/FOS/98.2, 28 pp.
Beuchat, L. (2000). Use of sanitizers in raw fruit and vegetable processing. In S. Alzamora, M. Tapiaand A. Lopez-Malo (eds.), Minimally processed fruits and vegetables (fundamental aspects and appli-cations). An Aspen Publication, Maryland, USA, pp. 63–78.
Beuchat, L., B. Nail, B. Adler and M. Clavero (1998). Efficacy of spray application of chlorinated waterin killing pathogenic bacteria on raw apples, tomatoes and lettuce. Journal of Food Protection 61(10):1305–1311.
Bidawid, S., J. Farber and S. Sattar (2000a). Contamination of foods by food handlers; experimentson Hepatitis A virus transfer to food and its interruption. Applied and Environmental Microbiology66: 2759–2763.
Bidawid, S., J. Farber and S. Sattar (2000b). Inactivation of Hepatitis A virus in fruits and vegetablesby gamma irradiation. International Journal of Food Microbiology 57: 91–97.
Billiard, F. (1999). New developments in the cold chain worldwide. Bulletin of the IRR 6: 2–24.Björklöf, K., E. Nurmiaho-Lassila, N. Klinger, K. Haahtela and M. Romantschuk (2000). Colonization
strategies and conjugal gene transfer of inoculated Pseudomonas syringae on the leaf surface. Journalof Applied Microbiology 89: 423–432.
Björkroth, K., R. Geisen, U. Schillinger, N. Weiss, P. De Vos, W. Holzapfel, H. Korkeala and
514 L. Jacxsens et al.
P. Vandamme (2000). Characterization of Leuconostoc gasicomitatum sp. nov., associated withspoiled raw tomato-marinated broiler meat strips packaged under modified-atmosphere conditions.Applied and Environmental Microbiology 66: 3764–3772.
Boyette, M., D. Ritchie, S. Carbollo, S. Blankenship and D. Sanders (1993). Chlorination and posthar-vest disease control. HortTechnology 3: 395–400.
Brackett, R. (1992). Shelf stability and safety of fresh produce as influenced by sanitation and disin-fection. Journal of Food Protection 55(10): 808–814.
Brackett, R. (1996). Pathogenic microorganisms associated with fresh produce. Journal of FoodProtection 59(2): 204–216.
Brackett, R. (2000). Safe handling of fruits and vegetables. In J. Farber and E. Todd (eds.), Safe handlingof foods. Marcel Dekker, New York, USA, pp. 79–103.
Brocklehurst, T. and B. Lund (1981). Propeties of pseudomonads causing spoilage of vegetables storedat low temperature. Journal of Applied Bacteriology 50: 259–266.
Buchanan, R., W. Damert, R. Whiting and M. van Schothorst (1997). Use of epidemiologic and foodsurvey data to estimate a purposefully conservative dose-response relationship for L. monocyto-genes levels and incidence of listeriosis. Journal of Food Protection 60(8): 918–922.
Callister, S. and W. Agger (1987). Enumeration and characterization of Aeromonas_hydrophila andAeromonas caviae isolated from grocery store produce. Applied and Environmental Microbiology53: 249–253.
Cameron, A., P. Talasila and D. Joles (1995). Predicting film permeability needs for modified atmos-phere packaging of lightly processed fruits and vegetables. HortScience 30: 25–34.
Carlin, F., C. Nguyen-the, P. Cudennec and M. Reich (1989). Microbiological spoilage of fresh ready-to-use carrots. Sciences des Aliments 9: 371–386.
Carlin, F. and C. Nguyen-the (1994). Fate of Listeria monocytogenes on four types of minimallyprocessed green salads. Letters in Applied Microbiology 18: 222–226.
Carlin, F., C. Nguyen-the and A. Abreu da Silva (1995). Factors affecting the growth of L. monocy-togenes on minimally processed fresh endive. Journal of Applied Bacteriology 78: 636–646.
Carlin, F., C. Nguyen-the, A. Abreu da Silva and C. Cochet (1996a). Effects of carbon dioxide onthe fate of L. monocytogenes, of aerobic bacteria and on the development of spoilage in mini-mally processed fresh endive. International Journal of Food Microbiology 32: 159–172.
Carlin, F., C. Nguyen-the and C. Morris (1996b). The influence of the background microflora on thefate of Listeria monocytogenes on minimally processed fresh broad leaved endive. Journal of FoodProtection 59(7): 698–703.
Castaner, M., M. Gil, V. Ruiz and F. Artes (1999). Browning susceptibility of minimally processed Babyand Romaine lettuces. European Food Research Technology 209: 52–56.
Castillejo-Rodriquez, A., E. Barco-Alcala, R. Garcia-Gimeno and G. Zurera-Cosano (2000). Growthmodelling of Listeria monocytogenes in packaged fresh green asparagus. Food Microbiology 17:421–427.
CFSAN (Center for Food Safety and Applied Nutrition) (1998). Guide to Minimize Microbial FoodSafety Hazards for Fresh Fruits and Vegetables. US Department of Health and Human Services,Food and Drug Administration, Washington, USA, 38 pp.
Church, I. and A. Parsons (1995). Modified atmosphere packaging technology: A review. Journal ofScience of Food and Agriculture 67: 143–152.
CNERNA-CNRS (1996). Les legumes de 4ième gamme. In J. L. Jouve (ed.), La qualité microbiologiquedes aliments. Polytechnica, Paris, France, pp. 68–122.
Cousin, M. (2000). Pseudomonas/Introduction. In R. Robinson, C. Batt and P. Patel (eds.), Encyclopediaof food microbiology. Academic Press, London, UK, pp. 1864–1867.
Day, B. (2000). Novel MAP for freshly prepared fruit and vegetable products. Postharvest News andInformation 11: 27–31.
Day, B. (2001). Fresh Prepared Produce: GMP for High Oxygen MAP and Non-suphite Dipping.Guideline No. 31, Campden & Chorleywood Food Research Association Group, Chipping Campden,Gloucestershire, UK, 76 pp.
Debevere, J. (1996). Criteria en praktische methoden voor de bepaling van de houdsbaarheidsdatumin de etikettering. In G. Temmerman, C. Cremer, M. Thyssen and J. Debevere (eds.), Etikettering,houdbaarheid en bewaring (voedingsmiddelen en recht 2). Die Keure, Brugge, Belgium, pp. 35–64.
Quality of Equilibrium Modified Atmosphere Packaged (EMAP) 515

Delaquis, P., S. Stewart, P. Toivonen and A. Moyls (1999). Effect of warm, chlorinated water on themicrobial flora of shredded iceberg lettuce. Food Research International 32: 7–14.
De Roever, C. (1998). Microbiological safety evaluations and recommendations on fresh produce.Food Control 9: 321–347.
Devlieghere, F. (2000). Predictive modelling of the spoilage and the microbial safety of modified atmos-phere packaged cooked meat products. PhD. thesis Faculty of Agricultural and Applied BiologicalSciences, University of Ghent, Gent, Belgium, 207 pp.
Diaz, C. and J. Hotchkiss (1996). Comparative growth of E. coli O157:H7, spoilage organisms and shelflife of shredded iceberg lettuce stored under modified atmospheres. Journal of the Science of Foodand Agriculture 70: 433–438.
Dijk, R., R. Beumer, E. De Boer, M. Bosboom, E. Brinkman, J. Debevere, J. Van Dijk, A. Dijkstraand H. Stegeman (1999). Microbiologie van voedinsmiddelen: Methoden, principes en criteria.Keesing Noordervliet, Houten, the Netherlands, 464 pp.
Dorantes-Alvarez, L. and A. Chiralt (2000). Color of minimally processed fruits and vegetables asaffected by some chemical and biochemical changes. In S. Alzamora, M. Tapia and A. Lopez-Malo, A. (eds.), Minimally processed fruits and vegetables (fundamental aspects and applications).An Aspen Publication, Maryland, USA, pp. 111–126.
Doyle, M. (1990). Fruit and vegetable safety – Microbiological considerations. HortScience 25:1478–1482.
Dziezak, J. (1986). Preservatives: Antioxidants, the ultimate answer to oxidation. Food Technology 9:94–102.
Evans, R., N. Russell, G. Gould and P. McClure (1997). The germinability of spores of a psychrotol-erant, non-proteolytic strain of C. botulinum is influenced by their formation and storage temperature.Journal of Applied Microbiology 83: 273–280.
Exama, A., J. Arul, R. Lencki, L. Lee and C. Toupin (1993). Suitability of plastic films for modifiedatmosphere packaging of fruits and vegetables. Journal of Food Science 56: 1365–1370.
Farber, J. (1991). Microbiological aspects of modified atmosphere packaging technology – a review.Journal of Food Protection 54(1): 58–70.
Farber, J., G. Sanders and M. Johnston (1989). A survey of various foods for the presence of Listeriaspecies. Journal of Food Protection 52(7): 456–458.
Farber, J., W. Ross and J. Harwig (1996). Health rish assessment of L. monocytogenes in Canada.International Journal of Food Microbiology 30: 145–156.
Farber, J., S. Wang, Y. Cai and S. Zhang (1998). Changes in populations of Listeria monocytogenesinoculated on packaged fresh cut vegetables. Journal of Food Protection 61(2): 192–195.
Fett, W. (2000). Naturally occurring biofilms on alfalfa and other types of sprouts. Journal of FoodProtection 63(5): 625–632.
Finn, M. and M. Upton (1997). Survival of pathogens on modified-atmosphere-packaged shredded carrotand cabbage. Journal of Food Protection 60(11): 1347–1350.
Fishman, S., V. Rodov, J. Peretz and S. Ben-Yehoshua (1995). Model for gas exchange dynamics inmodified atmosphere packages of fruits and vegetables. Journal of Food Science 60: 1078–1083,1087.
Fleet, G. (1992). Spoilage yeasts. Critical reviews in Biotechnology 12(1/2): 1–44.Fraaije, B., M. Bosveld, R. Van Den Bulk and F. Rombouts (1997). Analysis of conductant responses
during depolymerization of pectate by soft rot Erwinia spp. and other pectilytic bacteria isolatedfrom potato tubers. Journal of Applied Microbiology 83: 17–24.
Francis, G., and D. O’Beirne (1997). Effect on gas atmosphere, antimicrobial dip and temperatue onthe fate of L. innocua and L. monocytogenes on minimally processed lettuce. International Journalof Food Science and Technology 32: 141–151.
Francis, G., C. Thomas and D. O’Beirne (1999). The microbiological safety of minimally processedvegetables. International Journal of Food Science and Technology 34: 1–22.
Gamage, T. and M. Shafiur Rahman (1999). Postharvest handling of foods of plant origin. In M. M.Rahman (ed.), Handbook of food preservation. Marcel Dekker, New York, USA, pp. 11–28.
Garcia-Gimeno, R., M. Sanchez-Pozo, M. Amaro-Lopez and G. Zurera-Cosano (1996a). Behaviour ofAeromonas hydrophila in vegetables salds stored under modified atmosphere at 4 and 15 °C. FoodMicrobiology 13: 369–374.
516 L. Jacxsens et al.
Garcia-Gimeno, R., G. Zurera-Cosano and M. Amaro-Lopez (1996b). Incidence, survival and growthof Listeria monocytogenes in ready-to-use mixed vegetable salads in Spain. Journal of Food Safety16: 75–86.
Garcia-Gimeno, R. and G. Zurera-Cosano (1997). Determination of ready-to-eat vegetable salad shelflife. International Journal of Food Microbiology 36: 31–38.
Garcia-Gimeno, R., Castillejo-Rodriguez, E. Barco-Alcala and G. Zurera-Cosano (1998). Determinationof packaged green asparagus shelf life. Food Microbiology 15: 191–198.
Garg, N., J. Churey and D. Splittstoesser (1990). Effect of processing conditions on the microflora offresh-cut vegetables. Journal of Food Protection 53(8): 701–703.
George, A. and P. Levett (1990). Effect of temperature and pH on survival of L. monocytogenes incoleslaw. International Journal of Food Microbiology 11: 345–350.
Gil, M., F. Ferreres and F. Tomas-Barberan (1998a). Effect of modified atmosphere packaging on theflavonoids and vitamin C content of minimally processed Swiss chard (Beta vulgaris subspeciescycla). Journal of Agricultural and Food Chemistry 46: 2007–2012.
Gil, M., J. Gorny and A. Kader (1998b). Responses of ‘Fuji’ apple slices to ascorbic acid treatmentsand low-oxygen atmospheres. HortScience 33: 305–309.
Gil, M., F. Ferreres and F. Tomas-Barberan (1999). Effect postharvest storage and processing on theantioxidant constituents of fresh-cut spinach. Journal of Agricultural and Food Chemistry 47:2213–2217.
Gorny, J. (2001). A Summary of CA and MA Requirements and Recommendations for Fresh-cut Fruitsand Vegetables. 8th International Controlled Atmosphere Research Conference, Rotterdam, theNetherlands, 8–13 July, 2001, pp. 59.
Gorris, L. and H. Peppelenbos (1999). Modified-Atmosphere Packaging of Produce. In M. Rahman (ed.),Handbook of food preservation. Marcel Dekker, New York, USA, pp. 437–456.
Hagermaier, R. and R. Baker (1998). A survey of the microbial population and ethanol content of baggedsalad. Journal of Food Protection 61(3): 357–359.
Ham, R. (2001). Personal communiation.
bacteria in media. Journal of Food Protection 56(3): 223–228.Hao, Y., R. Brackett, L. Beuchat and M. Doyle (1998). Microbiological quality and the inability of
proteolytic C. botulinum to produce toxin in film packaged fresh-cut cabbage and lettuce. Journalof Food Protection 61(9): 1148–1153.
Hao, Y., R. Brackett, L. Beuchat and M. Doyle (1999). Microbiological quality and production ofbotulinal toxin in film-packaged broccoli, carrots and green beans. Journal of Food Protection 62(5):499–508.
Hartley, D. (2000). The product design perspective on fresh produce packaging. Postharvest Newsand Information 11: 35–38.
Heard, G. (2000). Microbial safety of ready-to-eat salads and minimally processed vegetables and fruits.Food Science and Technology Today 14: 15–21.
Heimdal, H., B. Kühn, L. Poll and L. Larsen (1995). Biochemical changes and sensory quality ofshredded and MA-packaged iceberg lettuce. Journal of Food Science 60: 1265–1268, 1276.
Hertog, M., H. Peppelenbos, R. Evelo and L. Tijskens (1998). A dynamic and generic model of gasexchange of respiring produce: The effects of oxygen, carbon dioxide and temperature. PostharvestBiology and Technology 14: 335–349.
Howard, L. and L. Griffin (1993). Lignin formation and surface discoloration of minimally processedcarrot sticks. Journal of Food Science 58: 1065–1067, 1072.
Huis in ‘t Veld, J. (1996). Microbial and biochemical spoilage of foods: An overview. InternationalJournal of Food Microbiology 33: 1–18.
Hussein, A., J. Odumeru, T. Ayanbadejo, H. Faulkner, W. McNab, H. Hager and L. Szijarto (2000).Effects of processing and packaging on vitamin C and β-carotene content of ready-to-use vegeta-bles. Food Research International 33: 131–136.
ICMSF (International Commission on Microbiological Specifications for Foods) (1996). Microorganismsin Foods 5. T. Roberts, A. Baird-Parker and R. Tompkin (eds.), Blackie Academic and Professional,London, UK, 513 pp.
Quality of Equilibrium Modified Atmosphere Packaged (EMAP) 517
Hao, Y. and R. Brackett (1993). Influence of modified atmosphere on growth of vegetable spoilage
atmosphere packaging and antibrowning agents. Journal of Food Science 62: 572–575, 582.Gunes, G. and Lee, C. (1997). Color of minimally processed potatoes as affected by modified

ICMFS (International Commission on Microbiological Specifications for Foods) (1998). Microorganismsin foods 6: Microbial ecology of food commodities. T. Roberts, J. Pitt, J. Farkas and F. Grau(eds.), Blackie Academic and Professional, London, UK, 615 pp.
IFPA (International Fresh-cut Produce Asociation) (1997). Food Safety Guidelines for the Fresh-cutProduce Industry, 3th edition. Alexandria, USA, 125 pp.
Jacxsens, L., F. Devlieghere, P. Falcato and J. Debevere (1999a). Behaviour of L. monocytogenesand Aeromonas spp. on fresh-cut produce packaged under equilibrium modified atmosphere. Journalof Food Protection 62(10): 1128–1135.
Jacxsens, L., F. Devlieghere and J. Debevere (1999b). Validation of a systematic approach to designEMA packages for fresh cut produce. Food Science and Technology – Lebensmittel Wissenschaftund Technologie 32: 425–432.
Jacxsens, L., F. Devlieghere, T. De Rudder and J. Debevere (2000). Designing equilibrium modifiedatmosphere packages for fresh-cut vegetables subjected to changes in temperature. Food Science andTechnology – Lebensmittel Wissenschaft und Technologie 33: 178–187.
Jacxsens, L. F. Devlieghere, C. Van der Steen and J. Debevere (2001a). Effect of high oxygen modifiedatmosphere packaging on microbial growth and sensorial qualities of fresh-cut produce. InternationalJournal of Food Microbiology 71: 197–210.
Jacxsens, L., F. Devlieghere, C. Van der Steen, I. Siro and J. Debevere (2001b). Application ofethylene adsorbers in combination with high oxygen atmospheres for the storage of strawberriesand raspberries. Proceedings CA2001, 8th International Conference of Controlled Atmosphere, 8–13thJuly, 2001, Rotterdam, the Netherlands.
Jacxsens, L., F. Devlieghere and J. Debevere (2002a). Predictive modelling for packaging design:Equilibrium modified atmosphere packages of fresh-cut vegetables subjected to a simulated distri-bution chain. International Journal of Food Microbiology 73: 331–341.
Jacxsens, L., F. Devlieghere and J. Debevere (2002b). Temperature dependence of the microbialsafety, the microbial and sensorial quality of equilibrium modified atmosphere packaged fresh-cutproduce. Postharvest Biology and Technology, in press.
Jaros, D., H. Rohm and M. Strobl (2000). Appearance properties – A significant contribution tosensory food quality? Lebensmitteln Wissenschaft und Technology 33: 320–326.
Joyce, D. (1988). Evaluation of a ceramic-impregnated plastic film as a postharvest wrap. HortScience23: 1088.
Juneja, V., S. Martin and G. Sapers (1998). Control of L. monocytogenes in vacuum-packaged pre-peeledpotatoes. Journal of Food Science 63: 911–914.
Kader, A. (2001). Recent advances and future research needs in postharvest technology of fruits. BulletinNational du Refrigeration 1: 3–14.
Kader, A., D. Zagory and E. Kerbel (1989). Modified atmosphere packaging of fruits and vegetables.Critical Reviews in Food Science and Nutrition 28: 1–30.
Kader, A. and S. Ben-Yehoshua (2000). Effects of superatmospheric oxygen levels on postharvest phys-iology and quality of fresh fruits and vegetables. Postharvest Biology and Technology 20: 1–13.
Kakiomenou, K., C. Tassou and G. Nychas (1996). Microbiological, physiochemical and organolepticchanges of shredded carrots stored under modified storage. International Journal of Food Scienceand Technology 31: 359–366.
Kaneko, K., H. Hayashidani, K. Takahaski, Y. Shiraki, S. Limawongpanee and M. Ogawa (1999).Bacterial contamination in the environment of food factories processing ready-to-eat fresh vegeta-bles. Journal of Food Protection 62(7): 800–804.
Kays, S. J. (1991). Postharvest Physiology of Perishable Plant Products. Van Nostrand-Reinhold,New York, USA, 532 pp.
Kelly, W., G. Davey and L. Ward (1998). Characterisation of lactococci isolated from minimallyprocessed fresh fruit and vegetables. International Journal of Food Microbiology 45: 85–92.
Knee, M. (1990). Ethylene effects in controlled atmosphere storage of horticultural crops. In M. Calderonand R. Barkai-Golan (eds.), Food preservation by modified atmospheres. CRC Press, Boca Raton,USA, pp. 225–235.
Kotula, K., A. Kotula, B. Rose, C. Pierson and M. Camp (1997). Reduction of aqueous chlorine byorganic material. Journal of Food Protection, 60(3): 276–282.
Kunzek, H., R. Kabbert and D. Gloyna (1999). Aspects of material science in food processing: changes
518 L. Jacxsens et al.

in cell walls of fruits and vegetables. Zeitschrift für Lebensmittel Untersuchung und Forschung A,208: 233–250.
Lakalul, R., R. Beaudry and R. Hennandez (1999). Modelling respiration of apple slices in modifiedatmosphere packages. Journal of Food Science 64: 105–110.
Lange, D. (2000). New film technologies for horticultural products. HortTechnology 10: 487–490.Larson, A., E. Johnson, C. Barmore and M. Hughes (1997). Evaluation of the botulism hazard for
vegetables in modified atmosphere packaging. Journal of Food Protection 60(11): 1208–1214.Laurent, P., L. Buchon, J. Guespin-Michl and N. Orange (2000). Production of pectate lyases and
cellulases by Chryseomonas luteola strain MFCL0 depends on growth temperature and the natureof the culture medium: Evidence for two critical temperatures. Applied and EnvironmentalMicrobiology 66: 1538–1543.
Laurila, E., R. Kervinen and R. Ahvenainen (1998). The inhibition of enzymatic browning in mini-mally processed vegetables and fruits. Postharvest News and Information 9: 53–66.
Lee, D., P. Haggar, J. Lee and K. Yam (1991). Model for fresh produce respiration in modified atmos-pheres based on principles of enzyme kinetics. Journal of Food Science 56: 1580–1585.
Leistner, L. (2000). Hurdle technology in the design of minimally processed foods. In S. Alzamora,M. Tapia and A. Lopez-Malo (eds.), Minimally processed fruits and vegetables (fundamental aspectsand applications). An Aspen Publication, Maryland, USA, pp. 13–27.
Li, Y., R. Brackett, R. Shewfelt and L. Beuchat (2001). Changes in appearance and natural microfloraon iceberg lettuce treated in warm, chlorinated water and then stored at refrigeration temperature.Food Microbiology 18: 299–308.
Liao, C. J. Sullivan, J. Grady and L. Wong (1997). Biochemical characterization of pectate lyasesproduced by fluorescent pseudomonads associated with spoilage of fresh fruits and vegetables.Journal of Applied Microbiology 83: 10–16.
Liao, C. and G. Sapers (1999). Influence of soft rot bacteria on growth of Listeria monocytogenes onpotato slices. Journal of Food Protection 62(4): 343–348.
Lilly, T., H. Solomon and E. Rhodehamel (1996). Incidence of Clostridium botulinum in vegetablespackaged under vacuum or modified atmosphere. Journal of Food Protection 59(1): 59–61.
Little, C., D. Roberts, E. Youngs and J. De Louvois (1999). Microbiological quality of retail importedunpreprared whole lettuces: A PHLS food working group study. Journal of Food Protection 62(4):325–328.
Lopez-Galvez, G., G. Peiser and X. Nie (1997). Quality changes in packaged salad products duringstorage. Zeitschrift für Lebensmittel Untersuching und Forschung A, 205: 64–72.
Lopez-Osornio, M. and A. Chaves (1998). Quality changes in stored raw grated beetroots as affectedby temperature and packaging film. Journal of Food Science 63: 327–330.
Loureiro, V. (2000). Spoilage yeasts in foods and beverages: Characterisation and ecology for improveddiagnosis and control. Food Research International 33: 247–256.
Lück, E. and M. Jager (1997). Antimicrobial Food Additives: Characteristics, Uses, Effects. Springer,Berlin, Germany, 255 pp.
Lund, B. (1992). Ecosystems in vegetable foods. Journal of Applied Bacteriology 73(S): 115S–126S.Lyon, D. (2001). Internationa l guidelines for proficiency testing in sensory analysis. Guideline No.
35, Campden and Chorleywood Food Research Association Group, Chipping Campden,Gloucestershire, UK, 76 pp.
Manzano, M., B. Citterio, M. Maifreni, M. Paganessi and G. Comi (1995). Microbial and sensory qualityof vegetables for soup packaged in different atmospheres. Journal Science of Food Agriculture67: 521–529.
Martens, T. (1999). Products without heat or equivalent treatments for pathogen reduction. In T. Martensand A. Luchetti (eds.), Harmonization of safety criteria for minimally processed foods. Fair ConcertedAction FAIR CT96-1020, European Commission, Brussels, Belgium, pp. 51–60.
Martinez, M. and J. Whitaker (1995). The biochemistry and control of enzymatic browning. Trendsin Food Science and Technology 6: 195–200.
Martinez, A., R. Diaz and M. Tapia (2000). Microbial ecology of spoilage and pathogenic flora asso-ciated to fruits and vegetables. In S. Alzamora, M. Tapia and A. Lopez-Malo (eds.), Minimallyprocessed fruits and vegetables (fundamental aspects and applications). An Aspen Publication,Maryland, USA, pp. 43–62.
Quality of Equilibrium Modified Atmosphere Packaged (EMAP) 519

Martinsen, B., G. Bengtsson and T. Sorensen (1999). Storage conditions in the Norwegian distribu-tion of fresh produce. In M. Hägg, R. Ahvenainen, A. Evers and K. Tiilikkala (eds.), Agri-food qualityII, Quality management of fruits and vegetables. The Royal Society for Chemistry, Cambridge,UK, pp. 157–160.
Mathooko, F. (1996). Regulation of respiratory metabolism in fruits and vegetables by carbon dioxide.Postharvest Biology and Technology 9: 247–264.
Matthews, R. and M. McCarthy (1994). Nutritional quality of fruits and vegetables subject to minimalprocesses. In R. Wiley (ed.), Minimally processed refrigerated fruits and vegetables. Chapmanand Hall, New York, USA, pp. 313–326.
McEvily, A., R. Iyengar and W. Otwell (1992). Inhibition of enzymatic browning in foods and bev-erages. Critical Reviews in Food Science and Nutrition 32: 253–273.
Mercier, J. and S. Lindow (2000). Role of leaf sugars in colonization of plants by bacterial epiphytes.Applied and Environmental Microbiology 66: 369–374.
Messi, P., C. Casolari, A. Fabio, G. Fabio, C. Gibertoni, G. Menziani and P. Quaglio (2000). Occurrenceof Listeria in food matrices. Industrie Alimentari 39: 151–157.
Moss, M. (2000). Spoilage problems/Problems caused by fungi. In R. Robinson, C. Batt and P. Patel(eds.), Encyclopedia of food microbiology. Academic Press, London, UK, pp. 2056–2062.
Murray, J., C. Delahunty and I. Baxter (2001). Descriptive sensory analysis: Past, present and future.Food Research International 34: 461–471.
Neyts, K., G. Huys, M. Uyttendaele, J. Swings and J. Debevere (2000). Incidence and identificationof mesophilic Aeromonas spp. from retail foods. Letters in Apllied Microbiology 31: 359–363.
Nguyen-the, C. and B. Lund (1991). The lethal effect of carrot on Listeria species. Journal of AppliedBacteriology 70: 479–488.
Nguyen-the, C. and F. Carlin (1994). The microbiology of minimally processed fresh fruits and veg-etables. Critical Reviews in Food Science and Nutrition 34: 371–401.
Nießner, N., G. Skupin, C. Beumelburg, K. Knoll and A. Stiebing (1998). Styroflex® – nueur Kunstsofffür Frischfleish-Verpackungsfolien. Fleischwirtschaft 78(6): 683–689.
Nilsson, T. (2000). Postharvest handling and storage of vegetables. In R. Shewfelt and B. Brückner(eds.), Fruit and vegetable quality: An integrated view. Technomic publishing company, Lancaster,USA, pp. 98–121.
Norrung, B., J. Andersen and J. Schlundt (1999). Incidence and control of L. monocytogenes in foodsin Denmark. International Journal of Food Microbiology 53: 195–203.
Norrung, B. (2000). Microbiological criteria for L. monocytogenes in foods under special considera-tion of risk assessment approaches. International Journal of food Microbiology 62: 217–221.
Notermans, S., J. Dufrenne and J. Gerrits (1989). Natural occurrence of Clostridium botulinum onfresh mushrooms (Agaricus bisporus). Journal of Food Protection 52(10): 733–736.
Odumeru, J., S. Mitchell, D. Alves, J. Lynch, A. Yee, S. Wang, S. Styliadis and J. Farber (1997).Assessment of the microbiological quality of ready-to-use vegetables for health-care food services.Journal of Food Protection 60(8): 954–960.
Ohlsson, T. (1994). Minimal processing – preservation methods of the future: an overview. Trends inFood Science and Technology 5: 341–344.
Ozdemir, M., C. Yurteri and H. Sadikoglu (1999). Physical polymer surface modification methodsand applications in food packaging polymers. Critical Reviews in Food Science and Nutrition 39:457–477.
Paull, R. (1999). Effect of temperature and relative humidity on fresh commodity quality. PostharvestBiology and Technology 15: 263–277.
Peppelenbos, H. and J. van ‘t Leven (1996). Evaluation of four types of inhibition for modelling theinfluence of carbon dioxide on oxygen consumption of fruits and vegetables. Postharvest Biologyand Technology 7: 27–40.
Petran, R., W. Sperber and A. Davis (1995). Clostridium botulinum toxin formation in romaine lettuceand shredded cabbage: Effect of storage and packaging conditions. Journal of Food Protection 58(7):624–627.
Philips, C. (1996). Review: Modified atmosphere packaging and its effects on the microbiological qualityand safety of produce. International Journal of Food Science and Technology 31: 463–479.
Piagentini, A., M. Pirovani, D. Guëmes, J. Di Pentima and M. Tessi (1997). Survival and growth of
520 L. Jacxsens et al.

Salmonella Hadar on minimally processed cabbage as influenced by storage abuse conditions. Journalof Food Science 62: 616–618, 631.
Piovani, M., D. Güemes, J. Di Pentima and M. Tessi (2000). Survival of Salmonella Hadar after washingdisinfection of minimally processed spinach. Letters in Applied Microbiology 31: 143–148.
Productschap Tuinbouw (1997). Hygiënecode voor ongesneden verse groenten en vers fruit. DenHaag, the Netherlands, 16 pp.
Raffi, F., M. Holland, W. Hill and C. Cerniglia (1995). Survival of Shigella flexneri on vegetablesand detection by polymerase chain reaction. Journal of Food Protection 58(7): 727–732.
Rafii, F. and P. Lunsford (1997). Survival and detection of Shigella flexneri on vegetables and com-mercial prepared salads. Journal of AOAC International 80(6): 1191–1197.
Richardson, S., A. Thruston, T. Caughran, T. Colette, K. Patterson and B. Lykins (1998). Chemicalby-products of chlorine and alternative disinfectants. Food Technology 52: 58–61.
Richert, K., J. Albrecht, L. Bullerman and S. Sumner (2000). Survival and growth of E. coli O157:H7on broccoli, cucumber and green pepper. Dairy, Food and Environmental Sanitation 20: 24–28.
Robertson, L. and B. Gjerde (2000). Isolation and enumeration of Gardia cysts, Cryptosporidium oocystsand Ascaris eggs from fruits and vegetables. Journal of Food Protection 63(6): 775–778.
Rose, J. and T. Slifco (1999). Giardia, Cryptosporidium and Cyclospora and their impact on foods: Areview. Journal of Food Protection 62(9): 1057–1070.
Sarbhoy, A. and M. Kulshreshtha (2000). Food-borne fungi-Estimation by classical cultural tech-niques. In R. Robinson, C. Batt and P. Patel (eds.), Encyclopedia of food microbiology. AcademicPress, London, UK, pp. 854–860.
Satchell, F., P. Stephenson, W. Andrews, L. Estala and G. Allen (1990). The survival of Shigellasonnei in shredded cabbage. Journal of Food Protection 53(7): 558–562.
Segall, K. and M. Scanlon (1996). Design and analysis of a modified atmosphere package for mini-mally processed romaine lettuce. Journal of the American Society for Horticultural Sciences 121:722–729.
Seymour, J. (1999). Review of Current Industry Practice on Fruit and Vegetable Contamination. ReviewNo. 14, Campden & Chorleywood Food Research Association Group, Chipping Campden,Gloucestershire, UK, 38 pp.
Shewfelt, R. (1990). Quality of fruits and vegetables. Food Technology 44: 99–106.Shewfelt, R. (1999). What is quality? Postharvest Biology and Technology 15: 197–200.Shewfelt, R. (2000). Fruit and vegetable quality. In R. Shewfelt and B. Brückner (eds.), Fruit and
vegetables quality: An integrated view. A Technomic Publication, Lancaster, USA, pp. 144–157.Silva, F., K. Chau, J. Brecht and S. Sargent (1999). Modified atmosphere packaging for mixed loads
of horticultural commodities exposed to two postharvest temperatures. Postharvest Biology andTechnology 17: 1–9.
Solomon, H., D. Kautter, T. Lilly and E. Rhodehamel (1990). Outgrowth of Clostridium botulinum inshredded cabbage at room temperature under a modified atmosphere. Journal of Food Protection53(9): 831–833.
Solomon, H., E. Rhodehamel and D. Kautter (1998). Growth and toxin production by Clostridiumbotulinum on sliced raw potatoes in a modified atmosphere with and without sulfite. Journal of FoodProtection 61(1): 126–128.
Solomos, T. (1994). Some biological and physical principles underlying modified atmosphere pack-aging. In R. Wiley (ed.), Minimally processed refrigerated fruits and vegetables. Chapman andHall, New York, USA, pp. 183–225.
Soriano, J., H. Rico, J. Molto and J. Manes (2000). Assessment of the microbiological quality andwash treatment of lettuce served in university restaurants. International Journal of Food Microbiology58: 123–128.
Southon, S. (2000). Increased fruit and vegetable consumption within the EU: Potential health benefits.Food Research International 33: 211–217.
Stannard, C. (1997). Development and use of microbiological criteria for foods. Food Science andTechnology Today 11: 137–449.
Suojala, T., R. Pessala and R. Heiniö (1999). Effect of harvest time on the sensory quality of ϕϕϕϕϕSzabo, E., K. Scurrah and J. Burrows (2000). Survey for psychrotrophic bacterial pathogens in mini-
mally processed lettuce. Letters in Applied Microbiology 30: 456–460.
Quality of Equilibrium Modified Atmosphere Packaged (EMAP) 521
Tahvoinen, R. (1999). The effect of pre-harvest practice on the microbiological quality of berries andvegetables. In M. Hägg, R. Ahvenainen, A. Evers and K. Tiilikkala (eds.), Agri-food quality II,Quality management of fruits and vegetables. The Royal Society for Chemistry, Cambridge, UK,pp. 205–207.
Talasila, P., A. Cameron and D. Joles (1994). Frequency distribution of steady-state oxygen partial pres-sures in modified atmosphere packages of cut broccoli. Journal of the American Society forHorticultural Science 119: 556–562.
Talasila, P., K. Chau and J. Brecht (1995). Design of rigid modified atmosphere packages for fresh fruitsand vegetables. Journal of Food Science 60: 758–761.
Talasila, P. and A. Cameron (1997). Prediction equations for gases in flexible modified atmospherepackages for respiring produce are different than those for rigid packages. Journal of Food Science62: 926–930.
Talcott, S., L. Howard and C. Brenes (2001). Factors attributing to taste and quality of commerciallyprocessed strained carrots. Food Research International, 31–38.
Tapia, M., A. Martinez and R. Diaz (2000). Tools for safety control: HACCP, risk assessment, pre-dictive microbiology and challenge tests. In S. Alzamora, M. Tapia and A. Lopez-Malo (eds.),Minimally processed fruits and vegetables (fundamental aspects and applications). An AspenPublication, Maryland, USA, pp. 79–97.
Taylor, S. (1993). Why sulfite alternatives? Food Technology 47: 14.Tauxe, R., H. Kruse, C. Hedberg, M. Potter, J. Madden and K. Wachsmugh (1997). Microbial hazards
and emerging issues associated with produce. A preliminary repeats to the national advisory com-mittee on microbiologic criteria for foods. Journal of Food Protection 60(1): 1400–1408.
Temple, N. (2000). Antioxidants and disease: More questions than answers. Nutrition Research 20(3):449–459.
Thomas, C., O. Prior and D. O’Beirne (1999). Survival and growth of Listeria species in a modelready-to-use vegetable product containing raw and cooked ingredients as affected by storage tem-perature and acidification. International Journal of Food Science and Technology 34: 317–324.
Tomas-Barberan, F., F. Ferreres and M. Gil (2000). Antioxidant phenolic metabolites from fruit andvegetables and changes during postharvest storage and processing. In Atta-ur-Rahman (ed.), Studiesin natural products chemistry (vol. 23). Elsevier Science, Amsterdam, the Netherlands, pp. 739–795.
van Dijk, C. and L. Tijskens (2000). Mathematical modeling of enzymatic reactions as related totexture after storage and mild preheat treatments. In S. Alzamora, M. Tapia and A. Lopez-Malo(eds.), Minimally processed fruits and vegetables (fundamental aspects and applications). AnAspen Publication, Maryland, USA, pp. 127–152.
Vankerschaver, K., F. Willocx, C. Smout, M. Hendrickx and P. Tobback (1996). Modelling and pre-diction of visual shelf life of minimally processed endive. Journal of Food Science 61: 1094–1098.
Varoquaux, P. and R. Wiley (1994). Biological and biochemical changes in minimally processedrefrigerated fruits and vegetables. In R. Wiley (ed.), Minimally processed refrigerated fruits and veg-etables. Chapman and Hall, New York, USA, pp. 226–268.
Vasconcellos, J. (2000). Regulatory and safety aspects of refrigerated minimally processed fruits andvegetables: a review. In S. Alzamora, M. Tapia and A. Lopez-Malo (eds.), Minimally processed fruitsand vegetables (fundamental aspects and applications). An Aspen Publication, Maryland, USA,pp. 319–343.
Viaene, J., X. Gellinck and W. Verbeke (2000). Integrated quality manegement applied to the processedvegetables industry. In R. Shewfelt and B. Brückner (eds.), Fruit and vegetables quality: an inte-grated view. A Technomic Publication, Lancaster, USA, pp. 246–266.
Watada, A. and L. Qi (1999). Quality of fresh-cut produce. Postharvest Biology and Technology 15:201–205.
Watkins, C. (2000). Responses of horticultural commodities to high carbon dioxide as related to modifiedatmosphere packaging. HortTechnology 10: 501–506.
Willocx, F. (1995). Evolution of microbial and visual quality of minimally processed foods: A casestudy on the product life cycle of cut endive. pH.D. thesis, Faculty of Agricultural and AppliedBiological Sciences, Catholic University of Leuven, nr. 280, Leuven, Belgium, 228 pp.
Wilson, L., M. Boyette and E. Estes (2000). Postharvest handling and cooling of fresh fruits, vegeta-
522 L. Jacxsens et al.

bles and flowers for small farms-part I, part II, part III, part IV and part V. http://www. food-safety.org./nc/nc, 17 pp.
Wszelaki, A. and E. Mitcham (1999). Elevated oxygen atmospheres as a decay control alternative onstrawberry. Hortscience 34: 514–515.
Wu, F., M. Doyle, L. Beuchat, J. Wells, E. Mintz and B. Swaminathan (2000). Fate of Shigella sonneion parsley and methods of disinfection. Journal of Food Protection 63(5): 568–572.
Yildiz, F. (1994). Initial preparation, handling and distribution of minimally processed refrigerated fruitsand vegetables. In R. Wiley (ed.), Minimally processed refrigerated fruits and vegetables. Chapmanand Hall, New York, USA, pp. 15–65.
Zagory, D. (1995). Ethylene removing packaging. In M. Rooney (ed.), Active food packaging. BlackieAcademic and Professional, London, UK, pp. 38–54.
Zagory, D. (1999). Effects of post-processing handling and packaging on microbial populations.Postharvest Biology and Technology 15: 313–321.
Zhang, S. and J. Farber (1996). The effects of various disinfectants against L. monocytogenes onfresh-cut vegetables. Food Microbiology 13: 311–321.
Zhuang, R., L. Beuchat and F. Angulo (1995). Fate of S. Montevideo on and in raw tomatoes as affectedby temperature and treatment with chlorine. Applied and Environmental Microbiology 61: 2127–2131.
Quality of Equilibrium Modified Atmosphere Packaged (EMAP) 523