Embed Size (px)
Citation preview
PRODUCTION SYSTEM DESIGN AND OPERATIONAL
PERFORMANCE OF STEEL MANUFACTURERS IN KENYA
BY:
NAME: ANN MUMBI KARIUKI
REG: D61/77422/2015
SUPERVISOR:
NAME: DR. Magutu P. Obara
Lecturer, Department of Management Science
School of Business
University of Nairobi
A Research Project Presented In Partial Fulfillment of the Requirements for the
Award of Degree of Master of Business Administration, School Of Business,
University of Nairobi
ii
2016
DECLARATION
This is my original work and has not been submitted for a study in any University or
Institution.
Name: ANN MUMBI KARIUKI Date……………………
Signature………………………….
SUPERVISOR
This project report has been submitted for assessment with my authorization as the
University Supervisor
Name…DR. MAGUTU P. OBARA Date....................................…
Signature……..................……
iii
ACKNOWLEDGEMENT
This research report is a culmination of hard work, commitment and contribution of
various people and institutions, some of whom only, shall be mentioned here.
I wish to extend special gratitude to all employers who accepted to participate in the
study and actually took their time to fill in and return the questionnaire.
Just to mention, the researchers applause the support and guidance accorded by my
supervisor DR. Magutu P. Obara without whom this work would not have been
concluded, accept the well-deserved thanks for being understanding, helpful, patient yet
so professional. I am forever grateful.
To those entire not individually, we wish to reiterate that your cooperation and support
is cherished and we say „Thank you all‟.
Above all is my utmost gratitude to God almighty who has always filled my cup and
assures He never forsakes His children

iv
DEDICATION
This project is dedicated to my family and friends for their continued support.
v
TABLE OF CONTENTS
DECLARATION............................................................................................................. ii
ACKNOWLEDGEMENT ............................................................................................. iii
DEDICATION................................................................................................................ iv
TABLE OF CONTENTS ............................................................................................... v
ABBREVIATIONS ......................................................................................................... x
ABSTRACT .................................................................................................................... xi
CHAPTER ONE ............................................................................................................. 1
INTRODUCTION........................................................................................................... 1
1.1 Background of the Study .................................................................................... 1
1.1.1 Production System Design .................................................................................. 2
1.1.2 Operational Performance .................................................................................... 3
1.1.3 Steel Manufacturing Industry in Kenya .............................................................. 4
1.2 Research Problem ................................................................................................ 4
1.3 Research Objectives .............................................................................................. 6
1.4 Value of the Study ................................................................................................ 6
CHAPTER TWO ............................................................................................................ 7
LITERATURE REVIEW .............................................................................................. 7
2.1 Introduction ................................................................................................................. 7
2.2 Systems and Assembly System Theories .................................................................... 7
2.3 Deming Theory ........................................................................................................... 7
2.4 Production System Design .......................................................................................... 8
2.3.1 Industry Production System Design......................................................................... 8
2.3. 2 Robust Production System Design.......................................................................... 8
2.4 Operational Performance Measure ............................................................................. 9
vi
2.5 Production System Design and Operational Performance .......................................... 9
2.6 Summary of Literature Review and Research Gaps ................................................... 9
2.8 Conceptual Framework ............................................................................................. 14
CHAPTER THREE ...................................................................................................... 15
RESEARCH METHODOLOGY ................................................................................ 15
3.1 Introduction ............................................................................................................... 15
3.2 Research Design........................................................................................................ 15
3.3 Population of Study................................................................................................... 15
3.4 Data Collection ......................................................................................................... 15
3.5 Data Analysis ............................................................................................................ 16
CHAPTER THREE ...................................................................................................... 18
RESEARCH METHODOLOGY ................................................................................ 18
3.1 Introduction ............................................................................................................... 18
3.2 Research Design........................................................................................................ 18
3.3 Population of Study................................................................................................... 18
3.4 Data Collection ......................................................................................................... 18
3.5 Data Analysis ............................................................................................................ 19
CHAPTER THREE ...................................................................................................... 21
RESEARCH METHODOLOGY ................................................................................ 21
3.1 Introduction ............................................................................................................... 21
3.2 Research Design........................................................................................................ 21
3.3 Population of Study................................................................................................... 21
3.4 Data Collection ......................................................................................................... 21
3.5 Data Analysis ............................................................................................................ 22
CHAPTER FOUR ......................................................................................................... 24
vii
DATA ANALYSIS, RESULTS AND INTERPRETATIONS .................................. 24
4.1 Introduction ............................................................................................................... 24
4.2 Response Rate ........................................................................................................... 24
4.3 Background Information ........................................................................................... 24
4.3.1 Academic qualifications ......................................................................................... 24
4.3.2 Position the respondents ........................................................................................ 25
4.3.3 Years of service...................................................................................................... 26
4.4 Production system design ......................................................................................... 27
4.4.1 The Production System Design .............................................................................. 27
4.4.2 Industry Production System Design....................................................................... 29
4.4.3 Robust Production System Design......................................................................... 31
4.5 Impact of Production System Design on Operational Performance of Steel
Manufacturers in Kenya .................................................................................................. 33
4.6 Regression analysis ................................................................................................... 35
CHAPTER FIVE: SUMMARY, CONCLUSION AND ............................................ 38
RECOMMENDATIONS .............................................................................................. 38
5.1 Introduction ............................................................................................................... 38
5.2 Summary of Findings ................................................................................................ 38
5.3 Conclusion ................................................................................................................ 39
5.4 Recommendations ..................................................................................................... 40
5.5 Limitations of the study ............................................................................................ 40
5.6 Suggestions for further studies .................................................................................. 41
REFERENCES .............................................................................................................. 42
Appendix II: List of Steel Mill Firms in Kenya ......................................................... 48

viii
LIST OF FIGURES
Figure 4. 1 Academic qualifications ............................................................................................. 25
Figure 4. 2 Years of service .......................................................................................................... 26
ix
LIST OF TABLES
Table 2.1: Summary of Literature Gap and Knowledge Gap ....................................................... 10
Table 3.2: Summary of Data Collection & Data Analysis methods ............................................ 20
Table 4. 1 Position the respondents .............................................................................................. 26
Table 4. 2 Production System Design Practices ........................................................................... 27
Table 4. 3 Industry Production System Design Practices ............................................................. 29
Table 4. 4 Robust Production System Design Practices ............................................................... 31
Table 4. 5 Impact of Production System Design Practices on Operational Performance
of Steel Manufacturers in Kenya .................................................................................................. 33
Table 4. 6 Model Summary .......................................................................................................... 35
Table 4. 7 Model Analysis of Variance ........................................................................................ 36
Table 4. 8 Model Coefficients ...................................................................................................... 37
x
ABBREVIATIONS
PSD: Production system design
KAM: Kenya Association of Manufacturers
xi
ABSTRACT
The current competitive world market has positioned many companies under immense
pressure to withstand the completion. The focus on the manufacturing or production
system design performance has become more important. Alongside the growing
competition in the industrial sector, it is apparent that improved levels of, effectiveness,
output, quality and efficiency will only be attained by advancing new and enhanced
production or manufacturing system design. The goals of this study were to find out the
production system design adopted by steel manufacturers in Kenya and the impact these
production system designs have on operational performance of steel manufacturers in
Kenya. The population in this study comprised of all steel manufacturing firms in
Kenya. Particularly, the respondents were the Maintenance Managers, Production
Managers, and Plant/Operations Managers. Primary data was used to collect the data
using questionnaires. The researcher has made use of descriptive and correlation and
regression analysis to present the result in tables and figures. Process Oriented
Production System Design, Industry Production System and Robust Production System
Design were established to be the main systems adopted by the companies. The study
also establishes that the product system designs have impacts on the leadership, quality,
customer satisfaction and the supply chain management. The study thus concludes a
positive relation between product system designs and the operational performance,
which is supported by a coefficient of correlation of 0.784. The study thus recommends
that the management of the companies to not only adopt any product design system, but
also choose the design that works the best for that particular organization.
1
CHAPTER ONE
INTRODUCTION
1.1 Background of the Study
Companies are experiencing a more difficult task in competiting in the current dynamic
market environment. Particularly, in the past decade, the business environment has
undergone drastic changes over the years, with introduction of new strategies. The
managements are thus necessitated to formulate operation strategies which will ensure
their survival. However, today‟s customers‟ demands go beyond just lower pricing of
goods and services because customers want the best quality products, priced at least
possible price and available whenever needed (Jackson, 2000). Thus, in order for
businesses to retain their competitiveness, they are supposed to offer production systems
that can handle the level of the requirements defined by the consumers and the market, at
large. Correct adjustments in order to accommodate the changing requirements and the
effective utilization of the available materials and resources in the context of the
production systems are essential capabilities that these systems need to maintain higher
operational performances. That is, effectiveness and efficiency of systems operations, in a
rapidly changing corporate environment is a necessity (Slack, Chambers and Johnston,
2008).
Scholars, Gaither & Frazier (2001), suggest that whenever a commodity is designed the
product‟s features or attributes are established as well as the manner as it will be
produced. Therefore, whenever a new manufacturing system is developed, its design
(including product and manufacturing system), its planning and controls, and the
improvement activities should take place (Slack et al., 2008). Skinner (1985), on the
other hand, suggests that the PSD (production system design) purposes to establish and
define a clear set of production or manufacturing politics. Additionally, Askin &
Goldberg (2002) cite that the production system designs involve managing resources of
production so as to meet the customers‟ demands.
2
Other authors like Slack et al. (2007), Gaither & Frazier (2001) and Askin & Goldberg
(2002) suggest that the production system designs ought to start earlier on, when
designing the product because this is the time when the item is produced and its
production system is organized or established. This makes it possible to make product
designs decisions that take into account the production processes, to increase the overall
performance of the respective production systems. However, in complex projects in
general costumer requirements change frequently, and the design is developed
simultaneously to the construction stage. In such a context, the production system cannot
be designed completely before production starts. In this case, production and production
system design should overlap (Schönsleben, 2009).
The growth and transformations of markets, operational environment society, and the
customers‟ desires and needs have shaped the progress production systems and
production itself. One can envision that the future production would be flexible, high-
tech, safe, clean, safe, society-driven and highly skilled. The aspects and paradigms that
drove for evolution or change of the past manufacturing systems and production
technology will sustain the change into the unknown (DG Research, 2003).
1.1.1 Production System Design
One can distinguish the approach taken to the production system‟s design that affects the
activities that are carried out by the manufacturing company. The systems design process
is a unique all-inclusive and top-down, recursive, and iterative analytical course, that is
applied in succession via all stages of the development, which is used to: transform the
requirements and needs into a unique set of system‟s process and products description,
produce vital information for the decision makers, and Provide input for the next level of
development. Expanding on Wu (2004) and Engström, Jonsson and Medbo (2008),
Säfsten (2002) identifies three main designs of production systems:
The concept‐generating practice which is driven by different constraints such as, type of
product, number, and volume of variants. The concept‐driven practice is driven by
something external such as a pre‐existing design or the significance of an actor. The
supplier‐driven approach practice driven by an external supplier suggesting possible
alternatives based on more or less detailed requirement specifications. The three designs
3
imply different degrees of involvement by the manufacturing company in the production
system design process.
In a concept‐generating practice the manufacturing company is responsible for all
activities from the analysis of the situation to a complete production system in operation.
On the other hand, in a supplier‐driven practice, the supplier takes care of parts of the
activities. In the most extreme case all work activities are outsourced to a supplier.
Further, it is widely recognized that product and production system design should be
integrated in order to reduce the time required for introducing new products on the
market (Magrab et al., 2010). Gerwin & Barrowman (2002) define integrated product
development to be the approach used in the management that is meant to improve the
new products‟ development performances (or the development time).
As a result, several issues related to the development of the product are considered
simultaneously rather than sequentially. However, in contrast to a non‐overlapping and
non‐interacting development of products, an integrated approach also increases the need
for coordination. One possibility to ensure a high degree of coordination of the different
work activities is the ability to apply a product developmental process. A product
development process describes the sequence of steps and activities the company has to
deploy (Ulrich and Eppinger, 2007).
1.1.2 Operational Performance
Operational performance is a vital component of the organization‟s competitive priorities
in the context of its operations strategy (Narasimhan and Das, 2001). Operational
performance is an important aspect of management (Panupak & Robert, 2008).
Performance is achieved when on organization successfully achieves a competitive edge
over its competitors by using quality, cost, speed, and flexibility (Dangayach &
Deshmukh, 2001). These are best practices that lead to increased operational performance
and which, if a company decides to abandon may lead to poor performance. These
capabilities are applied to contribute to overall performance.
Dimensions employed normally match with the general set of competitive precedence,
i.e. quality, flexibility, delivery, and the cost performance. Quality may be viewed from
4
up to 8 different perspectives; performance, reliability, features, conformance,
serviceability, durability, aesthetics and assumed quality (Ward et al., 2006). Flexibility is
also regarded to be a multifocal notion (Sethi and Sethi, 2000; Gerwin, 2003). D‟Souza &
Williams (2000) name the four proportions of production volume, process, variety,
flexibility;, and the material handling plasticity. Likewise, Das (2007) observes that the
outwardly visible attributes of any extremely flexible production system include a
exceptionally wide product assortment, highly flexible delivery times, and major
opportunities to product customization.
1.1.3 Steel Manufacturing Industry in Kenya
In Kenya's metal industry operations are in steel hot rolling and smelting, manufacture of
wire and wire products, pipes, galvanized steel products and cold rolled metal products.
The subsectors are interconnected since they depend on each other for the supplies. Since
steel is a major raw material for most industries, high growth in the steel industry is
expected. This makes it important to investigate the dynamics of the steel industry in the
country. Furthermore, the Kenya Government Launched `Vision 2030'. This is a road
map on how the country will transform into an industrialized middle income state by the
year 2030 (Kariuki, 2011) Steel industry is one of the key subsector in infrastructure
development. Kenya‟s annual demand for steel is estimated 480,000tonnes to 600,000
tonnes, with most of the steel products are being sold on the domestic market (African
business review and technology, 2012). The major Kenyan steel dealers include Athi
River Steel Ltd, Brollo Kenya Ltd, Devki Steel Mills Ltd, and Accurate Steel Mills Ltd.
(African business review and technology, 2012).
1.2 Research Problem
The today‟s competitive local and global market has placed corporations under intense
amount of pressure resulting in the popularization of the issue of system designs
(Neumann et al., 2012). It is apparent that augmented intensity of productivity,
effectiveness, efficiency, and excellence can be achieved by developing new and better
production system design (Bennett, 2006; Shang and Sueyoshi, 2015). PSD (Production
system design) can take different amount of time, all from a couple of weeks to several
years. When an activity is repeated, such as the development new production systems, the
5
actors can worsen the employment of the previous knowledge and experience.
Nevertheless, by the use of the structured work technique and attempting to use the
experiences of „others‟, the actor may be able overcome similar limitations or challenges.
Any structure enhances the possibility of one concentrating on the vital parts, like the
preparing and creation of the new and precise production system (Bellgran and Säfsten,
2010).
The Kenya steel Industry has continued to grow significantly despite the numerous
challenges it has faced over the years. The industry is bedeviled with challenges of
limited market diversification, high cost of raw material and energy, limited world class
technology for doing steel business, limited value addition to the local steel firm with
reliance to traditional manufacturing technologies. The above cited challenges propel the
industry to take a paradigm shift if it is to remain competitive in the global steel market.
Steel firms in Kenya operates within these tough market conditions with increased
intensity in competition, very challenging external environment, economy‟s slowdown,
growing complexities in running the business, and all these challenges have propelled the
organization to adopt world class manufacturing philosophies to give it an upper edge in
the global competition in the market.
Several studies have been done in this area both globally and locally. Locally, Mwale
(2014) studied the effect of production system design on organizational performance
among large manufacturing firms in Kenya and established that there is a significant
relationship between the variables. Musyoka (2015), studied production system design
practices in the manufacturing sector in Kenya and established that the production system
designs were adopted so as to enhance productivity. Finally, Farah (2015), studied
production system design practices and organizational performance in the public water
sector in Kenya. He established that the production system design practices were highly
dependent on the organization structure.
Based on the above studies, none of the studies concentrated on addressing production
system design and operational performance of steel manufacturers in Kenya. This study
therefore aimed to fill this gap by answering the following question: what are the
production system designs adopted by steel manufacturers in Kenya? What is the
6
relationship between production system designs and operational performance of steel
manufacturers in Kenya? And, what are the challenges facing steel manufacturers when
implementing production system designs?.
1.3 Research Objectives
The research objectives of this study were to:
i. To determine the production system design adopted by steel manufacturers in
Kenya.
ii. To determine the impact of production system design on operational performance
of steel manufacturers in Kenya.
1.4 Value of the Study
The findings of this study can be important to policy makers as it may help them
formulate policies that can steer the government to put in place appropriate infrastructure.
Moreover, with the world becoming a global village, even the small scale entrepreneurs
“Jua Kali” industry may need to be empowered to join forces to qualify being branded as
world class organizations. The report can be of great value to practitioners in the industry,
it will help understand the various production system designs adopted in the
manufacturing industry. The report will also act as a motivation to the industry players to
adopt specific production system design to strategically position themselves in the
competitive business environment. The academicians and scholars may utilize the study‟s
findings as it adds knowledge on the production system design in the manufacturing
sector. In addition, it will form basis of further research and study opportunities in areas
not comprehensively covered in the report.
7
CHAPTER TWO
LITERATURE REVIEW
2.1 Introduction
This chapter explores the contributions of scholars on the production system designs and
their impact on operational performance. Specific aspects covered here are Theories of
production system design, and operational performance, Empirical Literature review and
Conceptual framework
2.2 Systems and Assembly System Theories
Skyttner (2001) define a system as a combination of interacting elements or units that
forms the collective whole that is meant to carry out particular function. The assemblage
system may be perceived as a compilation of organized components like machines and
people that are designed to work collectively towards the completion of the in intended
goal (Wu, 2002). The assemblage scheme can be considered as an open system, that has a
dynamic relation with the environment, adjusts to the competitive market and changes,
and with several factors that might affect the output (Bellgran and Säfsten, 2010).
2.3 Deming Theory
The Deming‟s Theory was initially introduced by Deming‟s (1982). The theory holds that
each organization must endeavour to ensure that it is constantly improving its products.
This will enable them to be not only competitive but also remain customer focused.
Particularly, organizations must adopt and formulate new and effective leadership to
ensure that the goals and targets are attained. The organization must thus ensure proper
coordination between all the parties involved in production. This could be through
building quality into products through mass inspection. Organization should cease
reliance on mass inspection by building quality into a product in the first place.
Organization must cease awarding business based on price instead look at quality of
product, minimize total cost and build relationship with a single supplier with loyalty and
trust. Deming Theory will be useful for this study because it encompasses both PSD and
operational performance for efficient and effective supply chain.
8
2.4 Production System Design
This sections looks into details three production system design; Process Oriented
production system design, robust production system design and industry production
system design.
2.3.1 Industry Production System Design
Industry Production System Design consist of either concept generating, concept-driven
or the supplier driven approach depending on what influenced the design processes inside
a company (Säfsten, 2002). The result of the constraint-driven approach is that a ´new´
system solution is generated; a concept-generating approach to the design process is
described.
Whereas the concept-generating approach was applied, the design process more or less
followed the phases prescribed in the general design process. When the concept-driven
approach was applied, a preferred production system concept was given from the
beginning of the design process and the conceptual design phase was more or less
excluded (Säfsten, 2002).
The supplier-driven approach, involves different degrees of involvement by the
manufacturing companies. From the perspective of the system supplier can the design
process be of either a concept-generating character or a concept-driven character. The
system suppliers often use standard solutions, which are modified according to the
specific situations, i.e. a concept-driven approach is often applied (Engström et al., 2008).
2.3. 2 Robust Production System Design
Continuous improvements, fast and parallel development processes, and reduced set-
uptimes in the production systems are a reality for today‟s enterprises. It requires
production systems to be designed in such a way that internal and external changes as
well as disturbances can be handled during operation without losing efficiency, flexibility
and speed and as a consequence profitability (Corrêa, 1994). Production systems must be
robust enough to handle internal and external changes and disturbances.
A methodology for achieving robustness is robust engineering, which optimizes for the
robust function (Taguchi et al., 2000). The robustness of the production system in
9
meeting the dynamic environment can be the difference between success and failure to a
manufacturing company. The consequences of a non-robust production system can be
low utilization of resources and a disability to handle frequent disturbances (Corrêa,
2014). Opportunities to increase system robustness are improved if the whole life cycle of
systems is taken into account. The single life-cycle phase of production operation only
provides limited possibilities to reduce disturbances (Bellgran et al., 2012). In addition,
robust design solutions are much easier to modify (and at a much lower cost) during early
phases of production development.
2.4 Operational Performance Measure
Operational performance is termed as the extent to which the organization is able to meet
the targets of its stakeholders (Griffin, 2003). According to Swanson (2000), operational
performance is the valued productive output of a system in the form of goods or services.
To achieve operational performance through production system design, the organization
must consider them as assets and they must be treated with great attention so that they
become productive and efficient, (Johannessen, and Olsen, 2010). High levels of
conformance quality must be attained before trying to improve any other performance
dimensions. In the current research, the measures of performance include quality of the
service and products, delivery time, flexibility, reliability and efficiency of service
delivery.
2.5 Production System Design and Operational Performance
Within the corporation the production department mainly interacts with the company‟s
core functions of Marketing and Sales, Finance, Personnel and purchasing, in which the
Marketing and Sales remains in contact with the clients, while the Purchasing remains in
touch with the Suppliers only. Other pertinent elements that also contribute to the all-
important organizational rule are the divisions that deal with Research, Logistics, and
Development, IT, Sales, Customer Service, (or) as well Facility Management. In supply
chains arise customer demands. Effective management of production orders ensures that
a product will be manufactured and delivered on time.
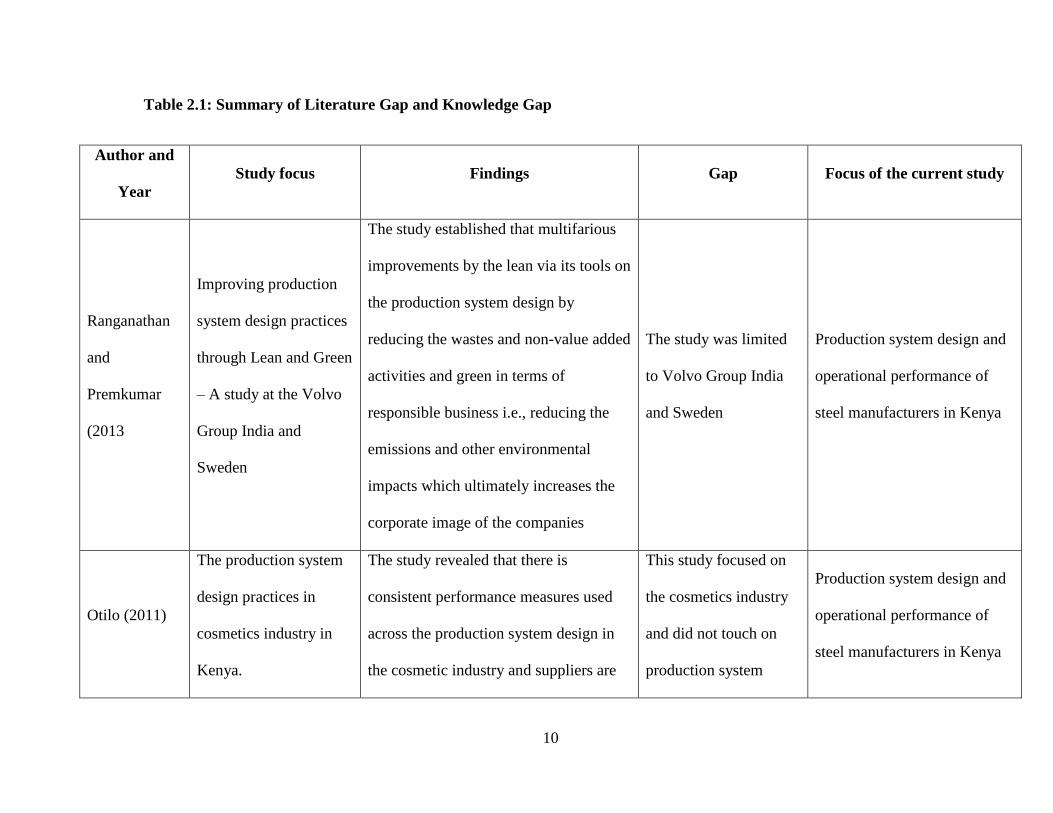
2.6 Summary of Literature Review and Research Gaps
Based on the literature, various gaps have been identified refer to the table 2.1.
10
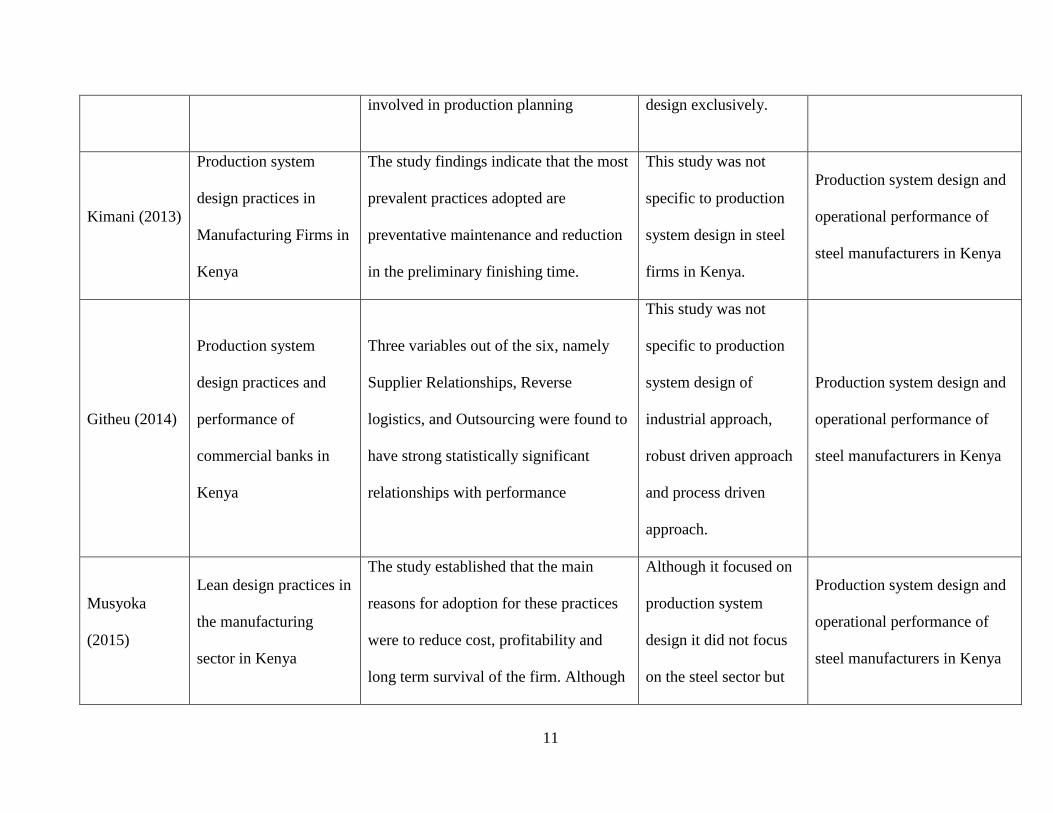
Table 2.1: Summary of Literature Gap and Knowledge Gap
Author and
Year
Study focus Findings Gap Focus of the current study
Ranganathan
and
Premkumar
(2013
Improving production
system design practices
through Lean and Green
– A study at the Volvo
Group India and
Sweden
The study established that multifarious
improvements by the lean via its tools on
the production system design by
reducing the wastes and non-value added
activities and green in terms of
responsible business i.e., reducing the
emissions and other environmental
impacts which ultimately increases the
corporate image of the companies
The study was limited
to Volvo Group India
and Sweden
Production system design and
operational performance of
steel manufacturers in Kenya
Otilo (2011)
The production system
design practices in
cosmetics industry in
Kenya.
The study revealed that there is
consistent performance measures used
across the production system design in
the cosmetic industry and suppliers are
This study focused on
the cosmetics industry
and did not touch on
production system
Production system design and
operational performance of
steel manufacturers in Kenya
11
involved in production planning design exclusively.
Kimani (2013)
Production system
design practices in
Manufacturing Firms in
Kenya
The study findings indicate that the most
prevalent practices adopted are
preventative maintenance and reduction
in the preliminary finishing time.
This study was not
specific to production
system design in steel
firms in Kenya.
Production system design and
operational performance of
steel manufacturers in Kenya
Githeu (2014)
Production system
design practices and
performance of
commercial banks in
Kenya
Three variables out of the six, namely
Supplier Relationships, Reverse
logistics, and Outsourcing were found to
have strong statistically significant
relationships with performance
This study was not
specific to production
system design of
industrial approach,
robust driven approach
and process driven
approach.
Production system design and
operational performance of
steel manufacturers in Kenya
Musyoka
(2015)
Lean design practices in
the manufacturing
sector in Kenya
The study established that the main
reasons for adoption for these practices
were to reduce cost, profitability and
long term survival of the firm. Although
Although it focused on
production system
design it did not focus
on the steel sector but
Production system design and
operational performance of
steel manufacturers in Kenya
12
it focused on production system design
practices it did not focus on the steel
sector but rather on the manufacturing
sector.
rather on the
manufacturing sector.
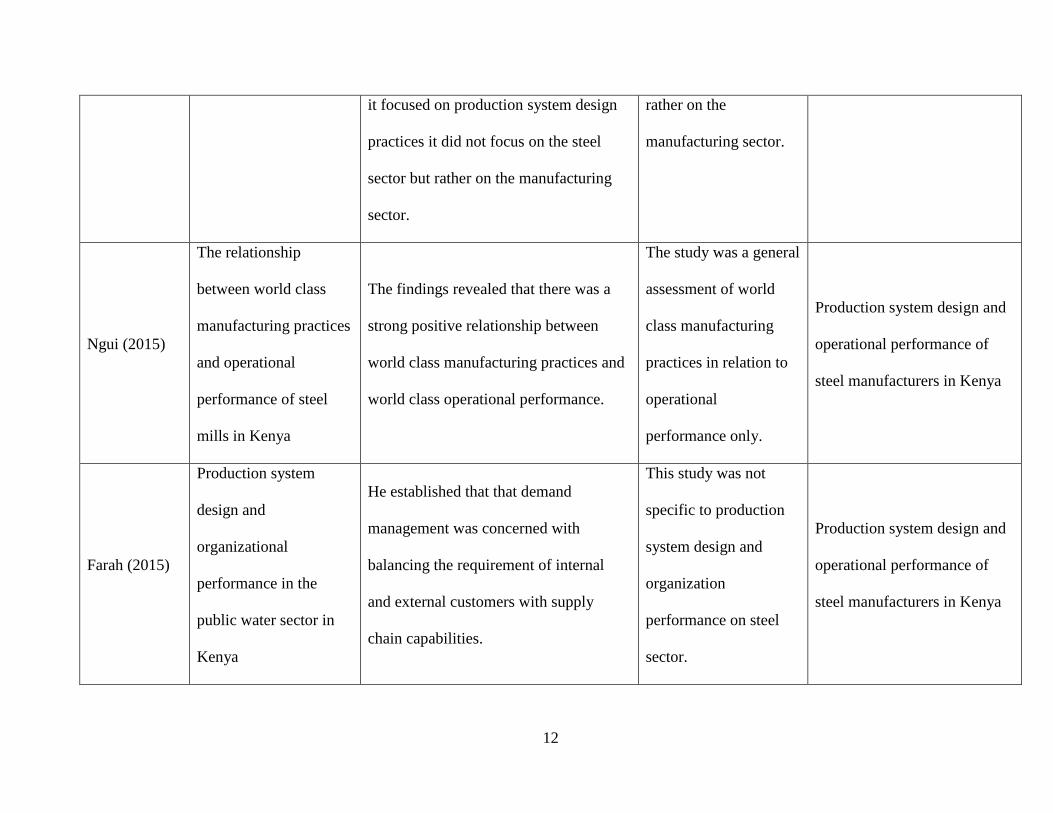
Ngui (2015)
The relationship
between world class
manufacturing practices
and operational
performance of steel
mills in Kenya
The findings revealed that there was a
strong positive relationship between
world class manufacturing practices and
world class operational performance.
The study was a general
assessment of world
class manufacturing
practices in relation to
operational
performance only.
Production system design and
operational performance of
steel manufacturers in Kenya
Farah (2015)
Production system
design and
organizational
performance in the
public water sector in
Kenya
He established that that demand
management was concerned with
balancing the requirement of internal
and external customers with supply
chain capabilities.
This study was not
specific to production
system design and
organization
performance on steel
sector.
Production system design and
operational performance of
steel manufacturers in Kenya
13
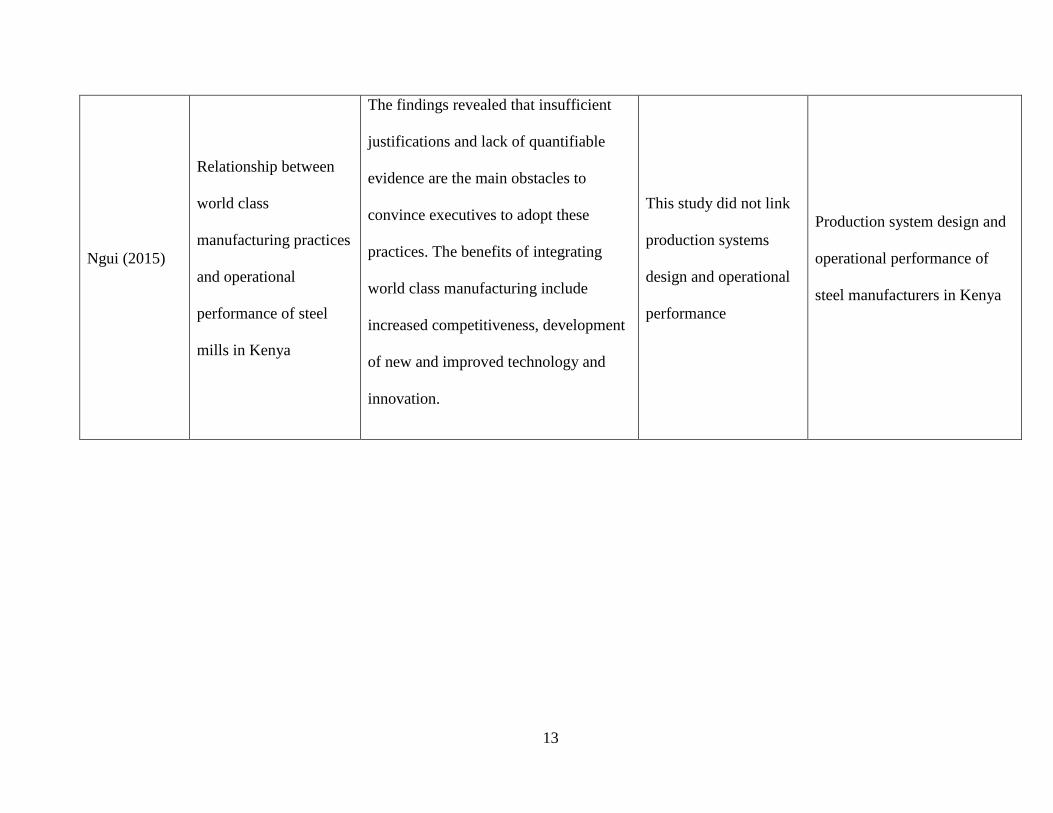
Ngui (2015)
Relationship between
world class
manufacturing practices
and operational
performance of steel
mills in Kenya
The findings revealed that insufficient
justifications and lack of quantifiable
evidence are the main obstacles to
convince executives to adopt these
practices. The benefits of integrating
world class manufacturing include
increased competitiveness, development
of new and improved technology and
innovation.
This study did not link
production systems
design and operational
performance
Production system design and
operational performance of
steel manufacturers in Kenya
14
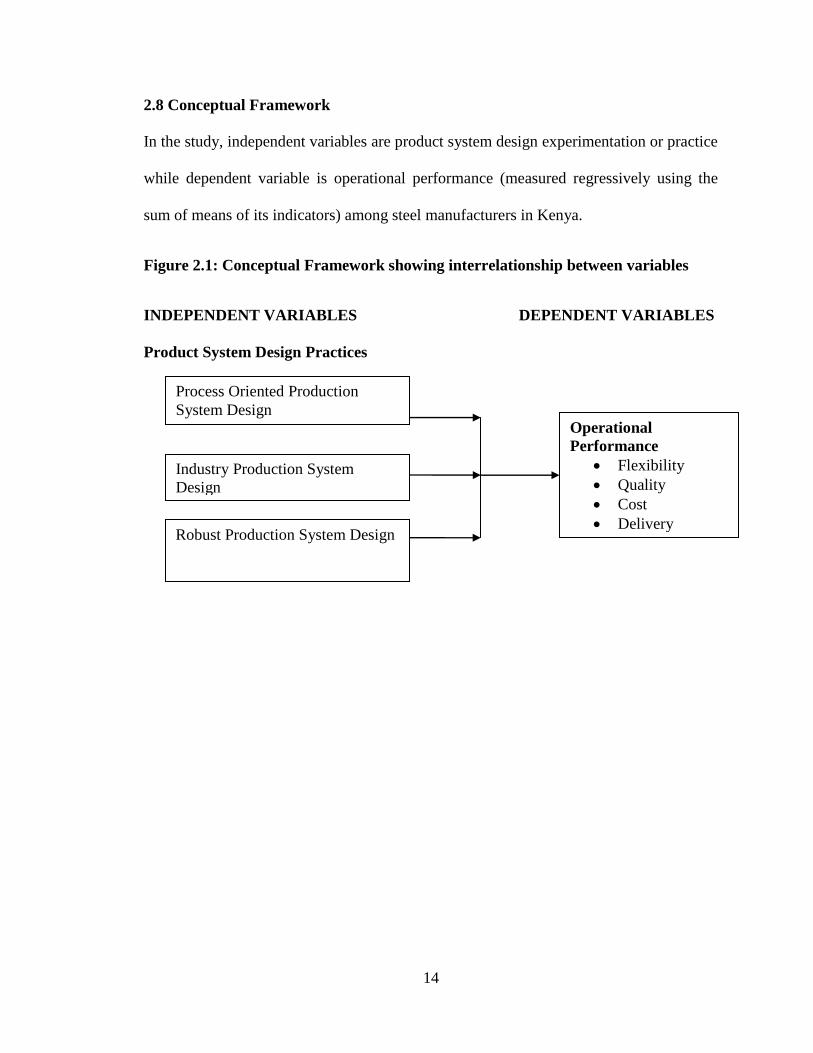
2.8 Conceptual Framework
In the study, independent variables are product system design experimentation or practice
while dependent variable is operational performance (measured regressively using the
sum of means of its indicators) among steel manufacturers in Kenya.
Figure 2.1: Conceptual Framework showing interrelationship between variables
INDEPENDENT VARIABLES DEPENDENT VARIABLES
Product System Design Practices
Process Oriented Production
System Design
Industry Production System
Design
Operational
Performance
Flexibility
Quality
Cost
Delivery Robust Production System Design

15
CHAPTER THREE
RESEARCH METHODOLOGY
3.1 Introduction
This section offers details about the methodology used in this study. The section covers
the research design, research population, the data collection and analysis methodologies.
3.2 Research Design
The researcher used the descriptive cross-sectional design in this study to examine
production system design in the steel mills in Kenya. A cross-sectional research involves
collection that is done just once over a given period of months or weeks or days to
answer the desired research question, (Cooper and Schindler, 2011). This approach
allows for analysis of opinion of management in providing insight into the extent of
adoption of production system design.
3.3 Population of Study
According to the KAM directory (2015), there are 20 steel manufacturing firms in Kenya
(as listed in Appendix 2). A census is proposed given that the population is small
3.4 Data Collection
A questionnaire was the central data gathering tool for this study. The questionnaires
were administered to the Maintenance Managers, Production Managers, and
Plant/Operations Managers. This choice of population and respondents is based on the
fact that the staffs are involved in production planning and execution at the production
level. Moreover, they are the ones who interact with the systems directly as well as
implementation of practices at functional. This method was preferred as it is the most
feasible way of reaching all the respondents. The questionnaire is divided into five parts.
Part one includes questions which are general in nature and will be used to gather some
basic information about the firm. This would be useful in categorizing the firm as either
large or small. The second part, seeks to address the objective of establishing the current
production system design in use, applications and management practices at the steel mill
16
companies in Kenya. Part three addresses the third objective of examining the operational
performance with production system design, while the last part determines the challenges
of production system design application at the Steel mill companies in Kenya.
The “drop and pick later” method was used because the questions are simplified and
unambiguous making it easy for the respondents to answer on their own. For distant
companies, questionnaires were sent via postal mail with stamped envelopes provided to
be mailed back. Where possible, email was used to administer the questionnaire.
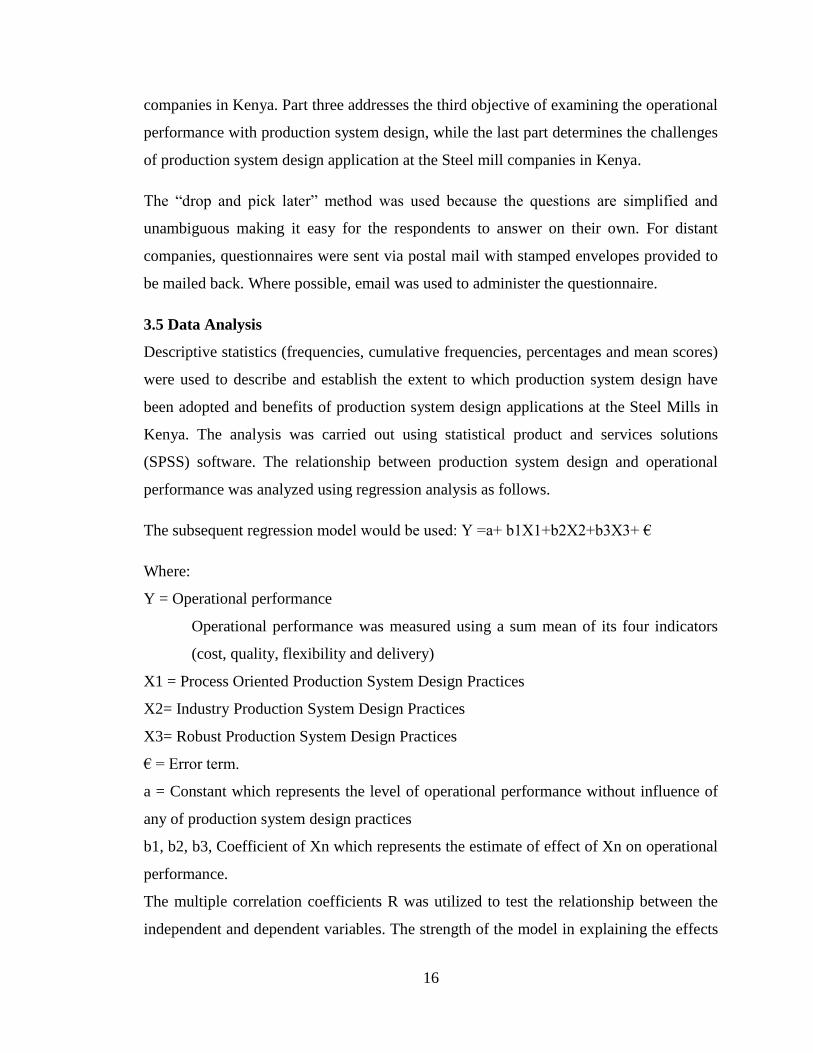
3.5 Data Analysis
Descriptive statistics (frequencies, cumulative frequencies, percentages and mean scores)
were used to describe and establish the extent to which production system design have
been adopted and benefits of production system design applications at the Steel Mills in
Kenya. The analysis was carried out using statistical product and services solutions
(SPSS) software. The relationship between production system design and operational
performance was analyzed using regression analysis as follows.
The subsequent regression model would be used: Y =a+ b1X1+b2X2+b3X3+ €
Where:
Y = Operational performance
Operational performance was measured using a sum mean of its four indicators
(cost, quality, flexibility and delivery)
X1 = Process Oriented Production System Design Practices
X2= Industry Production System Design Practices
X3= Robust Production System Design Practices
€ = Error term.
a = Constant which represents the level of operational performance without influence of
any of production system design practices
b1, b2, b3, Coefficient of Xn which represents the estimate of effect of Xn on operational
performance.
The multiple correlation coefficients R was utilized to test the relationship between the
independent and dependent variables. The strength of the model in explaining the effects
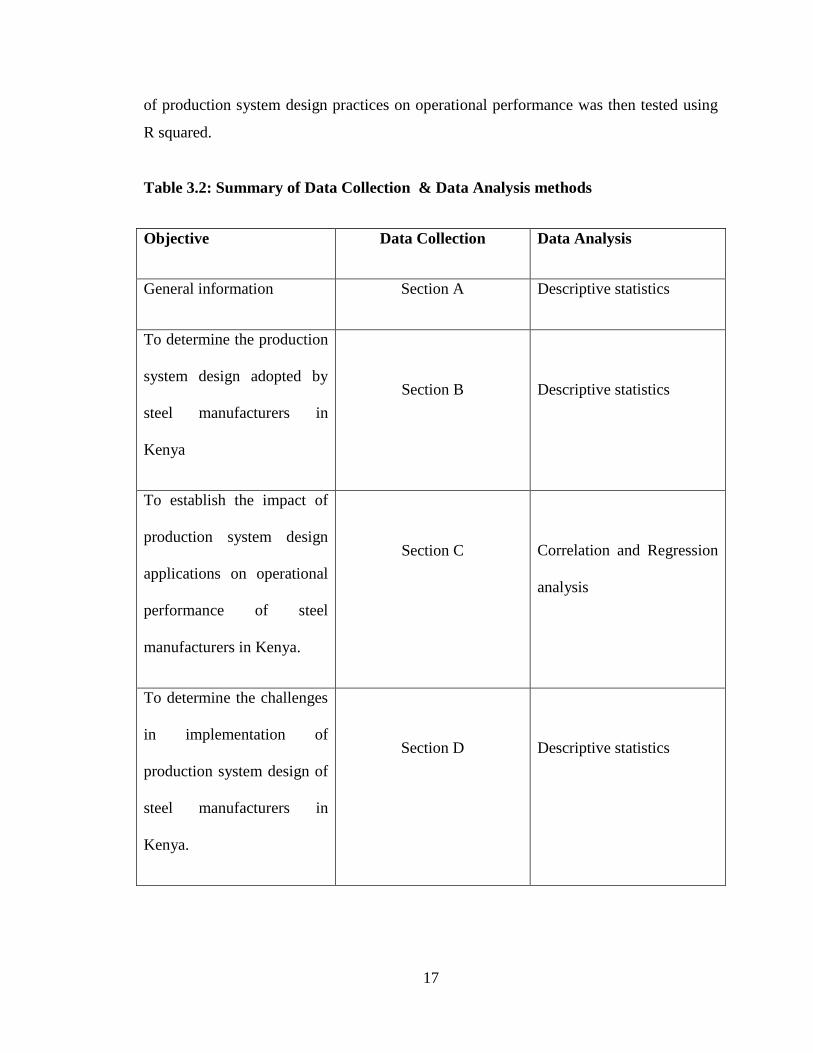
17
of production system design practices on operational performance was then tested using
R squared.
Table 3.2: Summary of Data Collection & Data Analysis methods
Objective Data Collection Data Analysis
General information Section A Descriptive statistics
To determine the production
system design adopted by
steel manufacturers in
Kenya
Section B
Descriptive statistics
To establish the impact of
production system design
applications on operational
performance of steel
manufacturers in Kenya.
Section C
Correlation and Regression
analysis
To determine the challenges
in implementation of
production system design of
steel manufacturers in
Kenya.
Section D
Descriptive statistics
18
CHAPTER THREE
RESEARCH METHODOLOGY
3.1 Introduction
This chapter details the methodology employed in conducting this study. It covers
research design, population of study, data collection and data analysis.
3.2 Research Design
A descriptive cross sectional design was used in this study to examine production system
design in the steel mills in Kenya. A cross sectional study involves data being gathered
just once, perhaps over a period of days or weeks or months in order to answer a research
question, (Cooper and Schindler, 2011). This approach allows for analysis of opinion of
management in providing insight into the extent of adoption of production system design.
3.3 Population of Study
According to the KAM directory (2015), there are 20 steel manufacturing firms in Kenya
(as listed in Appendix 2). A census is proposed given that the population is small
3.4 Data Collection
A questionnaire was used as the main data gathering instrument for this study. The
questionnaires were administered to the Maintenance Managers, Production Managers,
and Plant/Operations Managers. This choice of population and respondents is based on
the fact that the staffs are involved in production planning and execution at the
production level. Moreover, they are the ones who interact with the systems directly as
well as implementation of designs at functional. This method was preferred as it is the
most feasible way of reaching all the respondents. The questionnaire is divided into five
parts. Part one includes questions which are general in nature and will be used to gather
some basic information about the firm. This would be useful in categorizing the firm as
either large or small. The second part, seeks to address the objective of establishing the
current production system design in use, applications and management practices at the
steel mill companies in Kenya. Part three addresses the third objective of examining the
operational performance with production system designs, while the last part determines
19
the challenges of production system design application at the Steel mill companies in
Kenya.
The “drop and pick later” method was used because the questions are simplified and
unambiguous making it easy for the respondents to answer on their own. For distant
companies, questionnaires were sent via postal mail with stamped envelopes provided to
be mailed back. Where possible, email was used to administer the questionnaire.
3.5 Data Analysis
After gathering completed questionnaires from the respondents. Descriptive statistics
(frequencies, cumulative frequencies, percentages and mean scores) were used to
describe and establish the extent to which production system designs have been adopted
and benefits of production system design applications at the Steel Mills in Kenya. The
analysis was carried out using statistical product and services solutions (SPSS) software.
The relationship between production system design and operational performance was
analyzed using regression analysis as follows.
The following regression model will be used: Y =a+ b1X1+b2X2+b3X3+ €
Where:
Y = Operational performance
Operational performance was measured using a sum mean of its four indicators
(cost, quality, flexibility and delivery)
X1 = Process Oriented Production System Design
X2= Industry Production System Design
X3= Robust Production System Design
€ = Error term.
a = Constant which represents the level of operational performance without influence of
any of production system design
b1, b2, b3, Coefficient of Xn which represents the estimate of effect of Xn on operational
performance.
The multiple correlation coefficient R was be used to test the strength of the relationship
between the independent variables and dependent variable. The strength of the model in
20
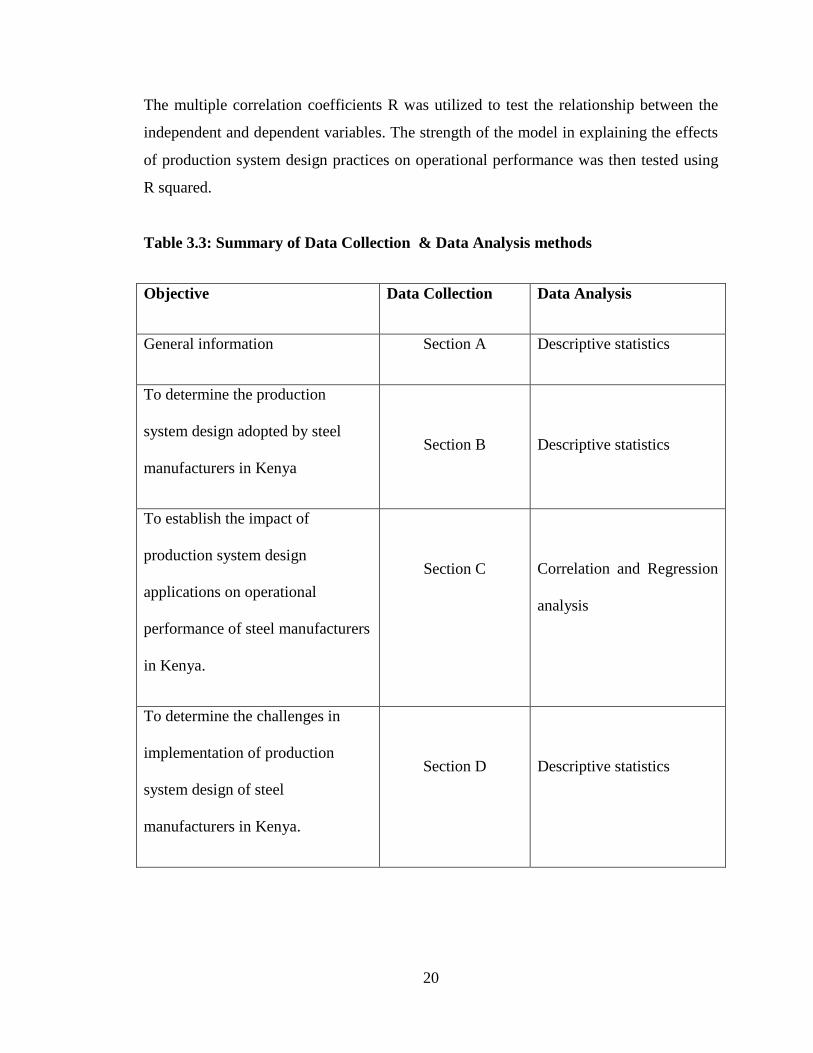
The multiple correlation coefficients R was utilized to test the relationship between the
independent and dependent variables. The strength of the model in explaining the effects
of production system design practices on operational performance was then tested using
R squared.
Table 3.3: Summary of Data Collection & Data Analysis methods
Objective Data Collection Data Analysis
General information Section A Descriptive statistics
To determine the production
system design adopted by steel
manufacturers in Kenya
Section B
Descriptive statistics
To establish the impact of
production system design
applications on operational
performance of steel manufacturers
in Kenya.
Section C
Correlation and Regression
analysis
To determine the challenges in
implementation of production
system design of steel
manufacturers in Kenya.
Section D
Descriptive statistics

21
CHAPTER THREE
RESEARCH METHODOLOGY
3.1 Introduction
This chapter details the methodology employed in conducting this study. It covers
research design, population of study, data collection and data analysis.
3.2 Research Design
A descriptive cross sectional design was used in this study to examine production system
design in the steel mills in Kenya. A cross sectional study involves data being gathered
just once, perhaps over a period of days or weeks or months in order to answer a research
question, (Cooper and Schindler, 2011). This approach allows for analysis of opinion of
management in providing insight into the extent of adoption of production system design.
3.3 Population of Study
According to the KAM directory (2015), there are 20 steel manufacturing firms in Kenya
(as listed in Appendix 2). A census is proposed given that the population is small
3.4 Data Collection
A questionnaire was used as the main data gathering instrument for this study. The
questionnaires were administered to the Maintenance Managers, Production Managers,
and Plant/Operations Managers. This choice of population and respondents is based on
the fact that the staffs are involved in production planning and execution at the
production level. Moreover, they are the ones who interact with the systems directly as
well as implementation of designs at functional. This method was preferred as it is the
most feasible way of reaching all the respondents. The questionnaire is divided into five
parts. Part one includes questions which are general in nature and will be used to gather
some basic information about the firm. This would be useful in categorizing the firm as
either large or small. The second part, seeks to address the objective of establishing the
current production system design in use, applications and management practices at the
steel mill companies in Kenya. Part three addresses the third objective of examining the
operational performance with production system designs, while the last part determines

22
the challenges of production system design application at the Steel mill companies in
Kenya.
The “drop and pick later” method was used because the questions are simplified and
unambiguous making it easy for the respondents to answer on their own. For distant
companies, questionnaires were sent via postal mail with stamped envelopes provided to
be mailed back. Where possible, email was used to administer the questionnaire.
3.5 Data Analysis
After gathering completed questionnaires from the respondents. Descriptive statistics
(frequencies, cumulative frequencies, percentages and mean scores) were used to
describe and establish the extent to which production system designs have been adopted
and benefits of production system design applications at the Steel Mills in Kenya. The
analysis was carried out using statistical product and services solutions (SPSS) software.
The relationship between production system design and operational performance was
analyzed using regression analysis as follows.
The following regression model will be used: Y =a+ b1X1+b2X2+b3X3+ €
Where:
Y = Operational performance
Operational performance was measured using a sum mean of its four indicators
(cost, quality, flexibility and delivery)
X1 = Process Oriented Production System Design
X2= Industry Production System Design
X3= Robust Production System Design
€ = Error term.
a = Constant which represents the level of operational performance without influence of
any of production system design
b1, b2, b3, Coefficient of Xn which represents the estimate of effect of Xn on operational
performance.
The multiple correlation coefficient R was be used to test the strength of the relationship
between the independent variables and dependent variable. The strength of the model in
23
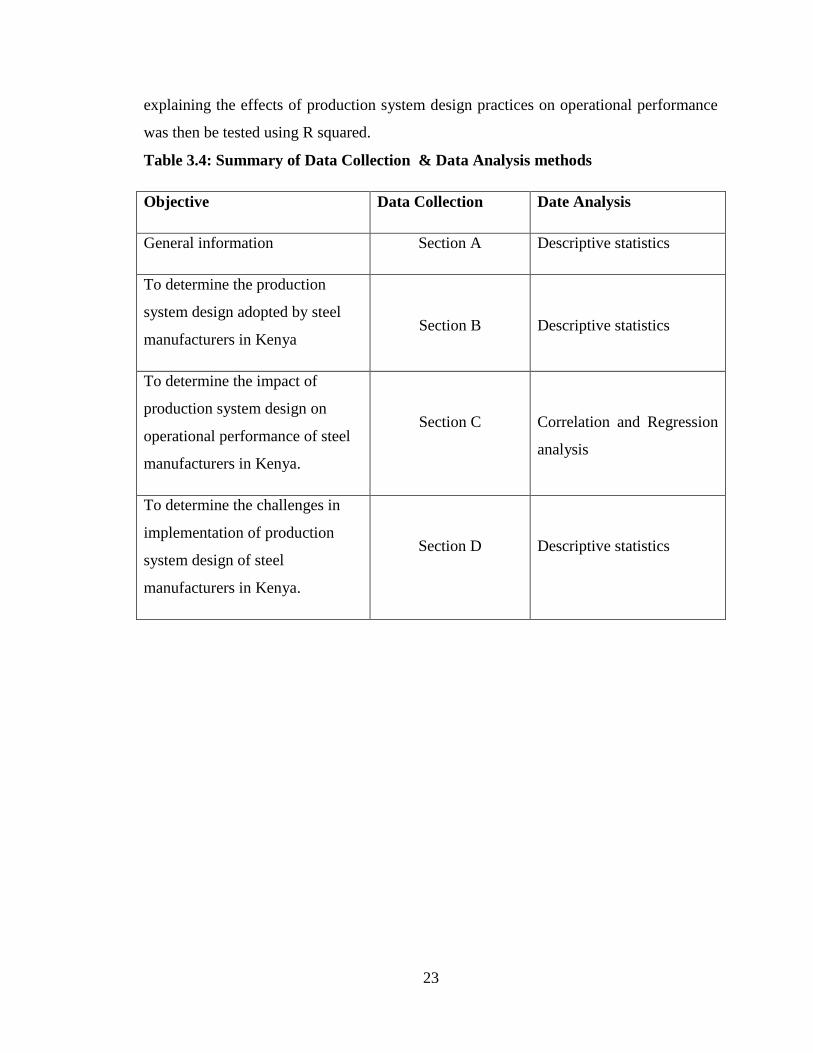
explaining the effects of production system design practices on operational performance
was then be tested using R squared.
Table 3.4: Summary of Data Collection & Data Analysis methods
Objective Data Collection Date Analysis
General information Section A Descriptive statistics
To determine the production
system design adopted by steel
manufacturers in Kenya
Section B
Descriptive statistics
To determine the impact of
production system design on
operational performance of steel
manufacturers in Kenya.
Section C
Correlation and Regression
analysis
To determine the challenges in
implementation of production
system design of steel
manufacturers in Kenya.
Section D
Descriptive statistics
24
CHAPTER FOUR
DATA ANALYSIS, RESULTS AND INTERPRETATIONS
4.1 Introduction
This chapter focuses on the data analysis, interpretation and presentation of the findings.
The main purpose of the study was to determine the production system designs adopted
by steel manufacturers in Kenya and the impact of these production system design have
on operational performance of steel manufacturers in Kenya. The data was gathered
exclusively from the questionnaire as the research instrument. The researcher has made
use of descriptive and correlation and regression analysis to present the result in tables
and figures.
4.2 Response Rate
The study aimed at collecting primary data from the respondents. To achieve this,
questionnaires were issued to 60 respondents who entailed the Maintenance Managers,
Production Managers, and Plant/Operations Managers currently working at the steel
manufacturing firms in Kenya. Out of which 52 questionnaires were dully filled and
returned. This represents a response rate of 87%. The 8 who didn‟t respond, gave reasons
as to having busy schedules. According to Mugenda and Mugenda (2008), a response rate
of 50% is adequate enough, 65% is good while above 75% is very good. This implies that
the response rate obtained was very good and enabled generalization of the findings.
4.3 Background Information
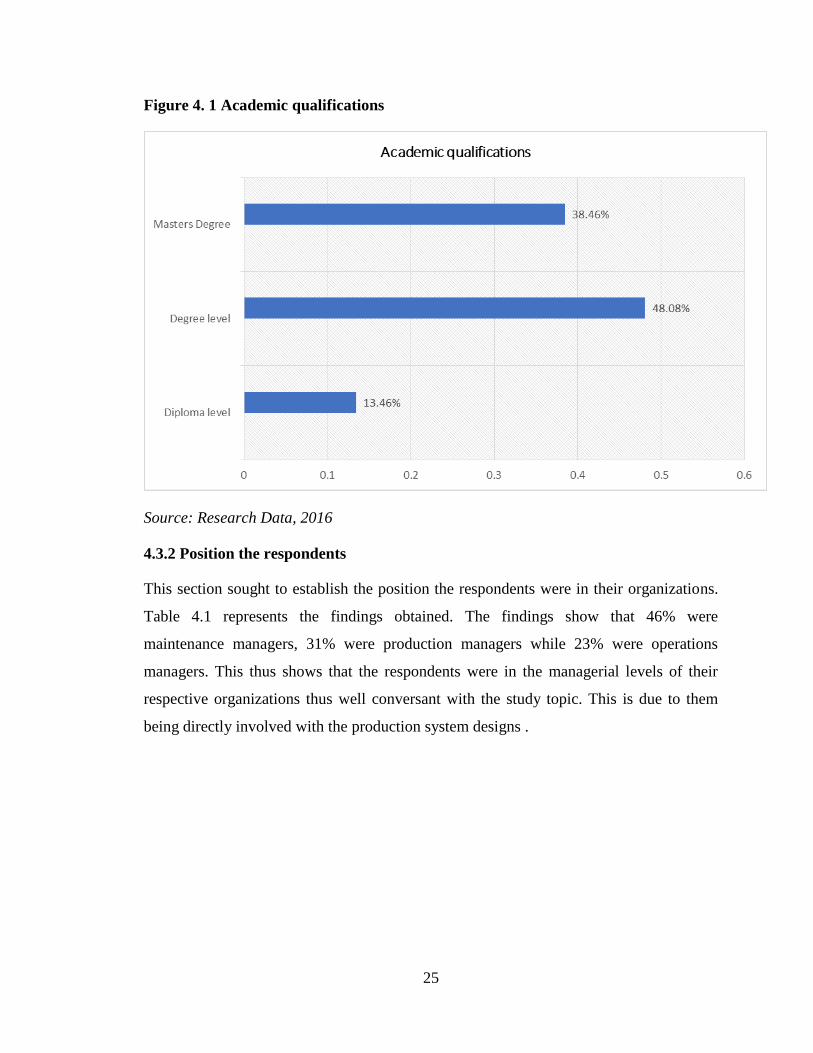
4.3.1 Academic qualifications
The section sought to determine the academic qualifications of the respondents. The
findings as shown by Figure 4.1 indicate that 48% of the respondents were established to
have Degrees, 34% had Master‟s degrees, while the remaining 13% had Diploma‟s. This
implies that respondents were well qualified for their respective jobs. They were thus
knowledgeable of the companies‟ practices and gave valid information.
25
Figure 4. 1 Academic qualifications
Source: Research Data, 2016
4.3.2 Position the respondents
This section sought to establish the position the respondents were in their organizations.
Table 4.1 represents the findings obtained. The findings show that 46% were
maintenance managers, 31% were production managers while 23% were operations
managers. This thus shows that the respondents were in the managerial levels of their
respective organizations thus well conversant with the study topic. This is due to them
being directly involved with the production system designs .

26
Table 4. 1 Position the respondents
Position
Frequency Percentage
Plant/Operations Managers 12 23.08%
Maintenance Managers
24 46.15%
Production Managers
16 30.77%
Total
52 100.00%
Source: Research Data, 2016
4.3.3 Years of service
This section sought to establish the years the respondents had worked at steel
manufacturing companies, as a measure of their experience. The results as indicated by
Figure 4.2, show that 37% had worked for a duration of 5-9 years, 31% for a duration of
10-19 years, 19% for a duration of over 20 years while 13% for a duration of 0-4 years.
This shows that the respondents had worked in their respective organizations for a
considerable length of time and were thus well informed of the company‟s operations.
Figure 4. 2 Years of service
Source: Research Data, 2016
27
4.4 Production system design
This section sought to establish the extent of adoption of the production system designs.
The results obtained showed that all the company had adopted various production system
designs. Thus obtaining 100% percentage frequency. The respondents were thus able to
provide valid and accurate information.
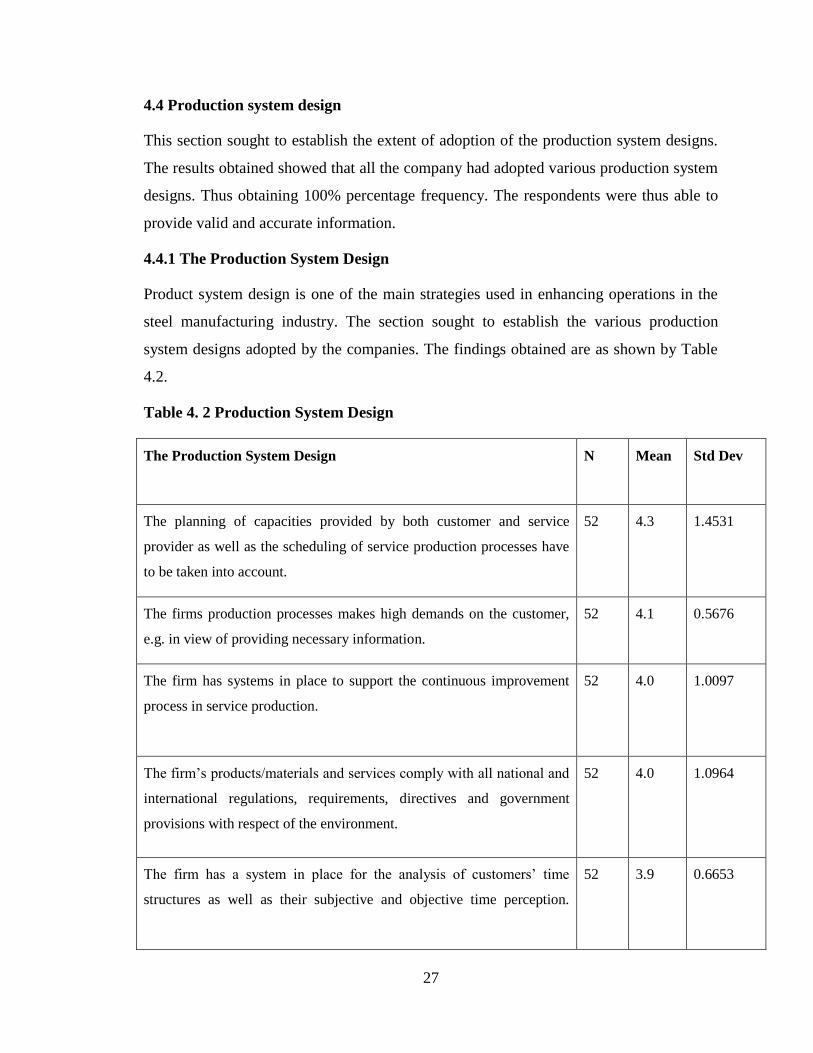
4.4.1 The Production System Design
Product system design is one of the main strategies used in enhancing operations in the
steel manufacturing industry. The section sought to establish the various production
system designs adopted by the companies. The findings obtained are as shown by Table
4.2.
Table 4. 2 Production System Design
The Production System Design N Mean Std Dev
The planning of capacities provided by both customer and service
provider as well as the scheduling of service production processes have
to be taken into account.
52 4.3 1.4531
The firms production processes makes high demands on the customer,
e.g. in view of providing necessary information.
52 4.1 0.5676
The firm has systems in place to support the continuous improvement
process in service production.
52 4.0 1.0097
The firm‟s products/materials and services comply with all national and
international regulations, requirements, directives and government
provisions with respect of the environment.
52 4.0 1.0964
The firm has a system in place for the analysis of customers‟ time
structures as well as their subjective and objective time perception.
52 3.9 0.6653
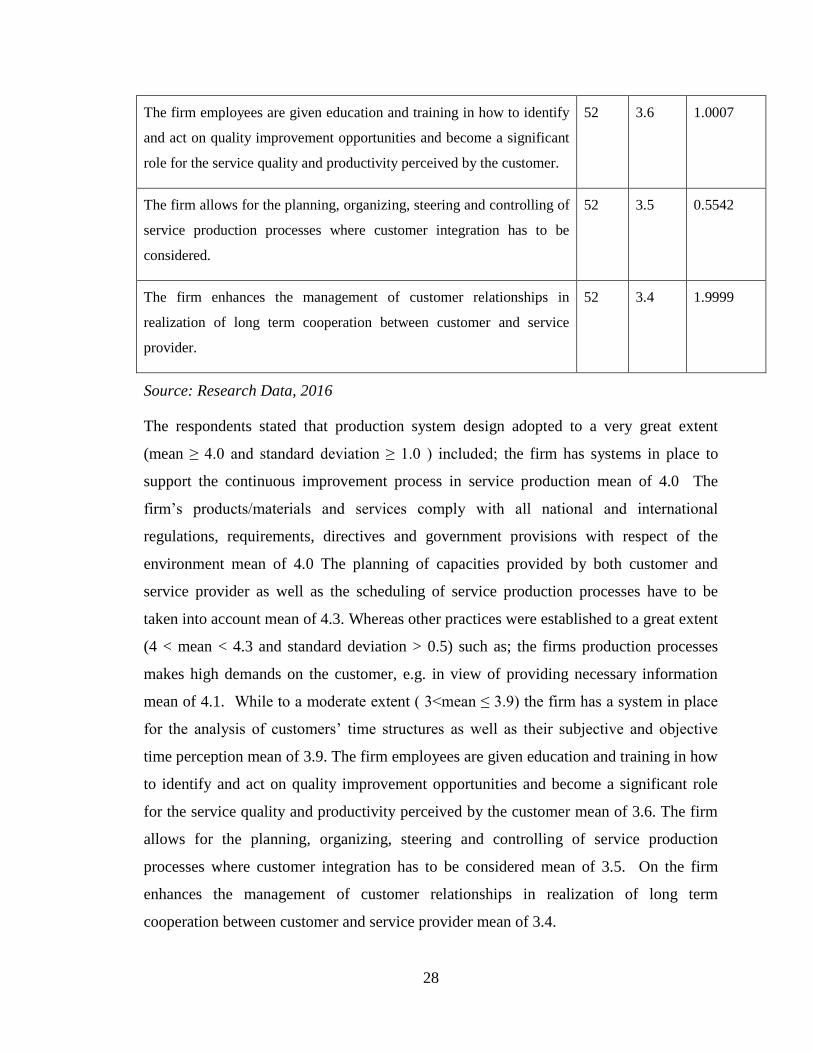
28
The firm employees are given education and training in how to identify
and act on quality improvement opportunities and become a significant
role for the service quality and productivity perceived by the customer.
52 3.6 1.0007
The firm allows for the planning, organizing, steering and controlling of
service production processes where customer integration has to be
considered.
52 3.5 0.5542
The firm enhances the management of customer relationships in
realization of long term cooperation between customer and service
provider.
52 3.4 1.9999
Source: Research Data, 2016
The respondents stated that production system design adopted to a very great extent
(mean ≥ 4.0 and standard deviation ≥ 1.0 ) included; the firm has systems in place to
support the continuous improvement process in service production mean of 4.0 The
firm‟s products/materials and services comply with all national and international
regulations, requirements, directives and government provisions with respect of the
environment mean of 4.0 The planning of capacities provided by both customer and
service provider as well as the scheduling of service production processes have to be
taken into account mean of 4.3. Whereas other practices were established to a great extent
(4 < mean < 4.3 and standard deviation > 0.5) such as; the firms production processes
makes high demands on the customer, e.g. in view of providing necessary information
mean of 4.1. While to a moderate extent ( 3<mean ≤ 3.9) the firm has a system in place
for the analysis of customers‟ time structures as well as their subjective and objective
time perception mean of 3.9. The firm employees are given education and training in how
to identify and act on quality improvement opportunities and become a significant role
for the service quality and productivity perceived by the customer mean of 3.6. The firm
allows for the planning, organizing, steering and controlling of service production
processes where customer integration has to be considered mean of 3.5. On the firm
enhances the management of customer relationships in realization of long term
cooperation between customer and service provider mean of 3.4.

29
The findings thus show that the most adopted production system design practice is the
planning of capacities provided by both the customer and service provider as well as the
scheduling of service production processes have to be taken into account. This is vital in
that it enables proper coordination not only inside the company but also outside the
company. While the least adopted production system design practice is the firm
enhancing the management of customer relationships in realization of long term
cooperation between customer and service provider.
The findings thus established that product system design has been adopted by the steel
manufacturers in ensuring that the operations go on smoothly. This is in line with who
established that Bennett, (2006) effective production system design are vital in the
attainment of a company‟s set goals and targets.
4.4.2 Industry Production System Design
Industry product system design is one of the main product system designs used in the
steel manufacturing industry. As such, the section sought to establish the industry
production system design practices.
Table 4. 3 Industry Production System Design
Industry Production system Design N Mean std. dev
The firm uses the layout and paper models to test the production
system
52 4.5 0.5333
The firms does not consider the design process as being very
structured
52 4.3 0.6233
The firm does not have a formal methods to support the design
processes that are available or used by the system designers
52 4.2 1.9217
The system layout is often the foundation for the discussions
and for the creation of different solutions
52 4.2 0.6678
The firm has systems to measure the extent to which the design
process driven by something external
52 4.1 1.9805
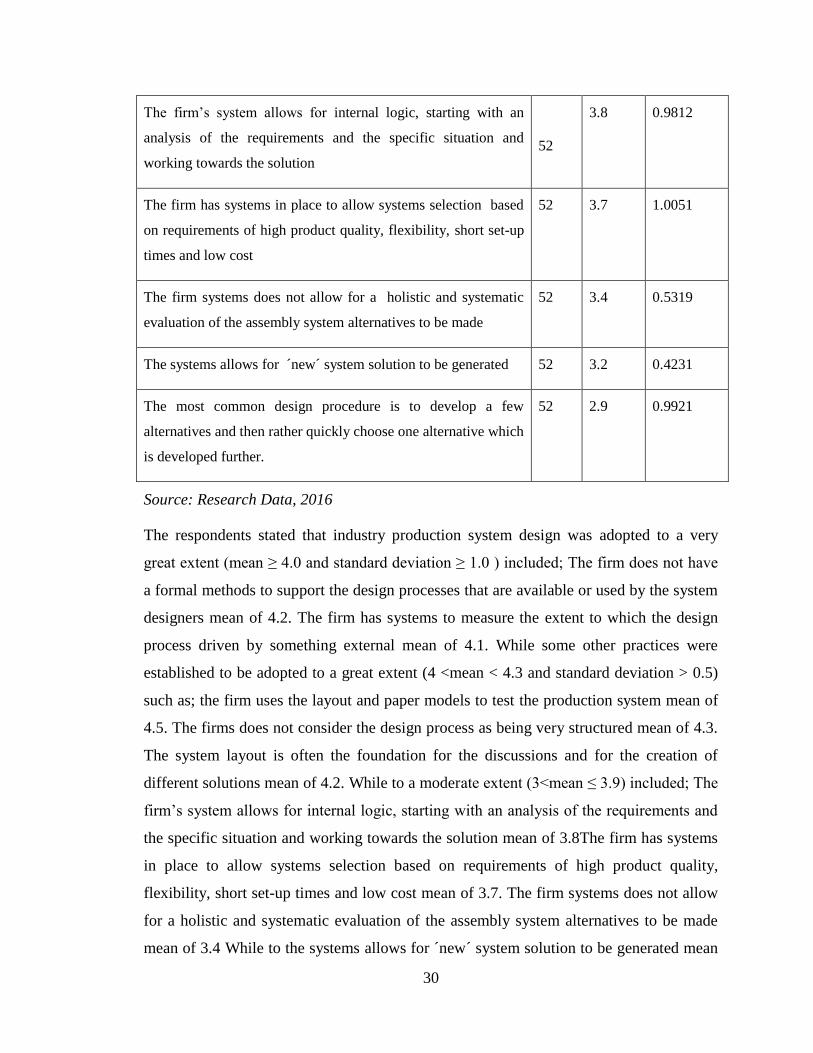
30
The firm‟s system allows for internal logic, starting with an
analysis of the requirements and the specific situation and
working towards the solution
52
3.8 0.9812
The firm has systems in place to allow systems selection based
on requirements of high product quality, flexibility, short set-up
times and low cost
52 3.7 1.0051
The firm systems does not allow for a holistic and systematic
evaluation of the assembly system alternatives to be made
52 3.4 0.5319
The systems allows for ´new´ system solution to be generated 52 3.2 0.4231
The most common design procedure is to develop a few
alternatives and then rather quickly choose one alternative which
is developed further.
52 2.9 0.9921
Source: Research Data, 2016
The respondents stated that industry production system design was adopted to a very
great extent (mean ≥ 4.0 and standard deviation ≥ 1.0 ) included; The firm does not have
a formal methods to support the design processes that are available or used by the system
designers mean of 4.2. The firm has systems to measure the extent to which the design
process driven by something external mean of 4.1. While some other practices were
established to be adopted to a great extent (4 <mean < 4.3 and standard deviation > 0.5)
such as; the firm uses the layout and paper models to test the production system mean of
4.5. The firms does not consider the design process as being very structured mean of 4.3.
The system layout is often the foundation for the discussions and for the creation of
different solutions mean of 4.2. While to a moderate extent (3<mean ≤ 3.9) included; The
firm‟s system allows for internal logic, starting with an analysis of the requirements and
the specific situation and working towards the solution mean of 3.8The firm has systems
in place to allow systems selection based on requirements of high product quality,
flexibility, short set-up times and low cost mean of 3.7. The firm systems does not allow
for a holistic and systematic evaluation of the assembly system alternatives to be made
mean of 3.4 While to the systems allows for ´new´ system solution to be generated mean
31
of 3.2 while the small extent (2<mean ≤ 2.9) included; the most common design
procedure is to develop a few alternatives and then rather quickly choose one alternative
which is developed further mean of 2.9.
The findings established that the firm using the layout and paper models to test the
production system was the most adopted industry production system design practices.
This is due to enhancing the speed of operations. While the most common design
procedure is to develop a few alternatives and then rather quickly choose one alternative
which is developed further was the least used practice. This implies that though most
industry production system design have been adopted up to a considerable level, there
still exists some which require more improvement. This contradicts the findings of
Shang, and Sueyoshi, (2015) who found out that all the practices had been adopted fully.
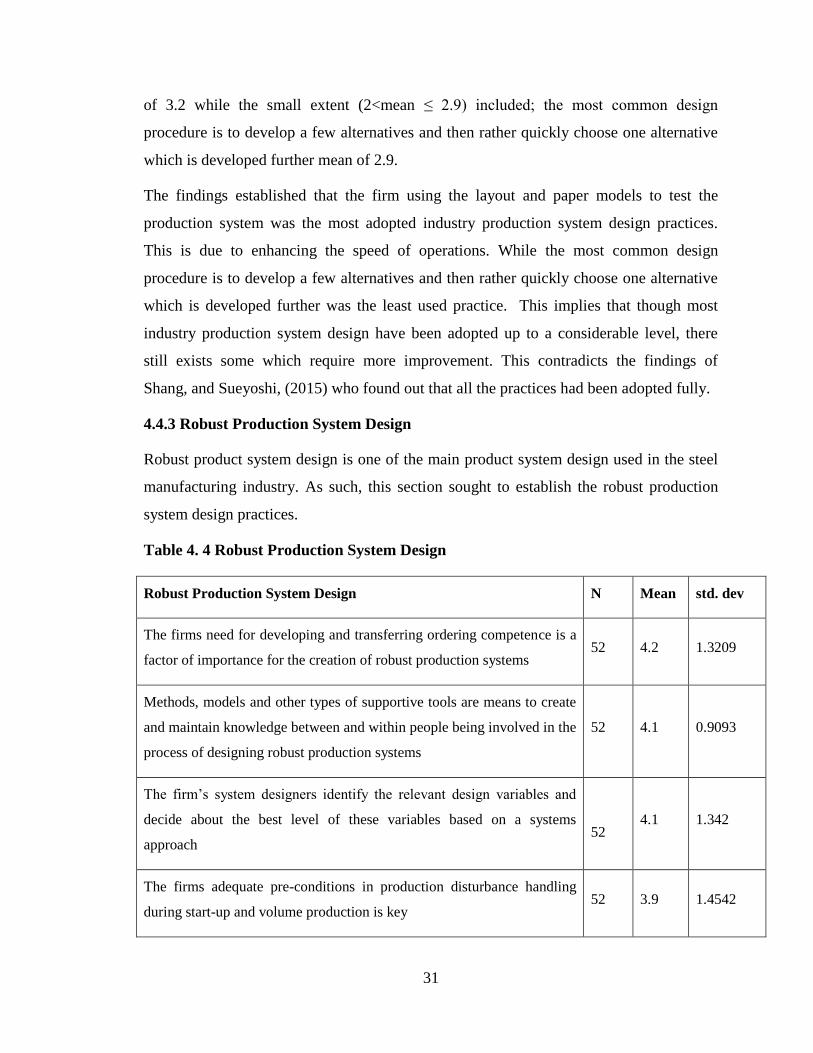
4.4.3 Robust Production System Design
Robust product system design is one of the main product system design used in the steel
manufacturing industry. As such, this section sought to establish the robust production
system design practices.
Table 4. 4 Robust Production System Design
Robust Production System Design N Mean std. dev
The firms need for developing and transferring ordering competence is a
factor of importance for the creation of robust production systems 52 4.2 1.3209
Methods, models and other types of supportive tools are means to create
and maintain knowledge between and within people being involved in the
process of designing robust production systems
52 4.1 0.9093
The firm‟s system designers identify the relevant design variables and
decide about the best level of these variables based on a systems
approach
52 4.1 1.342
The firms adequate pre-conditions in production disturbance handling
during start-up and volume production is key 52 3.9 1.4542
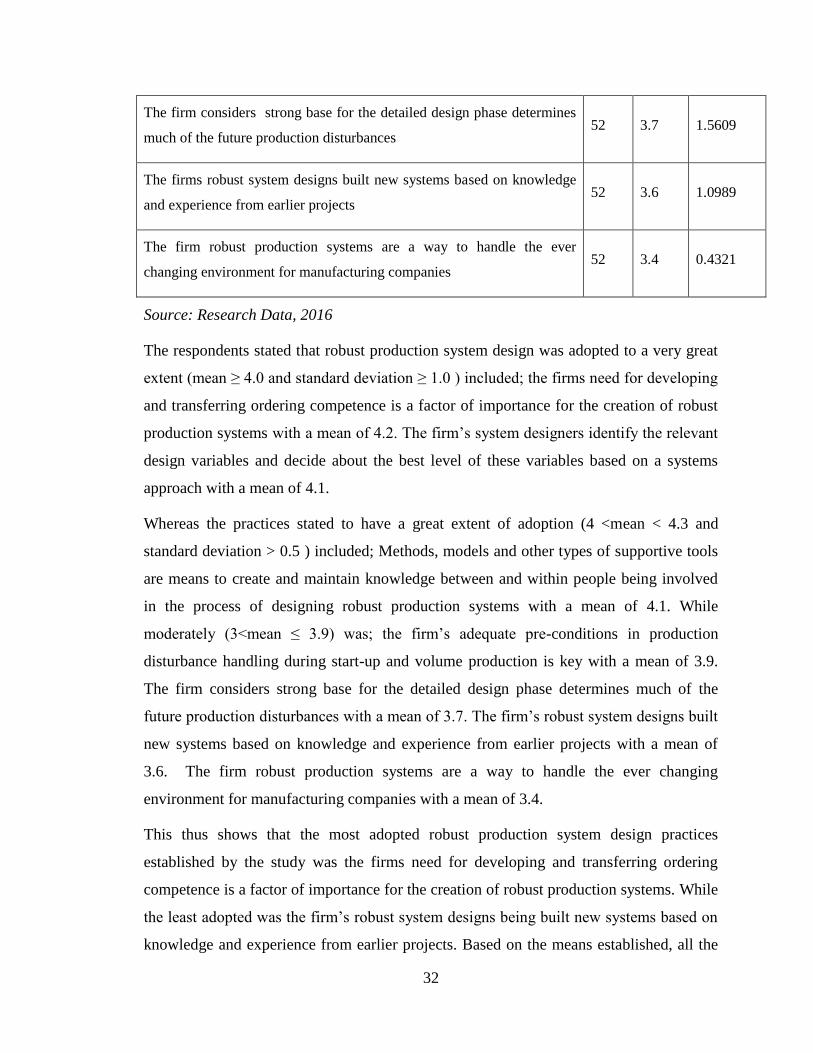
32
The firm considers strong base for the detailed design phase determines
much of the future production disturbances 52 3.7 1.5609
The firms robust system designs built new systems based on knowledge
and experience from earlier projects 52 3.6 1.0989
The firm robust production systems are a way to handle the ever
changing environment for manufacturing companies 52 3.4 0.4321
Source: Research Data, 2016
The respondents stated that robust production system design was adopted to a very great
extent (mean ≥ 4.0 and standard deviation ≥ 1.0 ) included; the firms need for developing
and transferring ordering competence is a factor of importance for the creation of robust
production systems with a mean of 4.2. The firm‟s system designers identify the relevant
design variables and decide about the best level of these variables based on a systems
approach with a mean of 4.1.
Whereas the practices stated to have a great extent of adoption (4 <mean < 4.3 and
standard deviation > 0.5 ) included; Methods, models and other types of supportive tools
are means to create and maintain knowledge between and within people being involved
in the process of designing robust production systems with a mean of 4.1. While
moderately (3<mean ≤ 3.9) was; the firm‟s adequate pre-conditions in production
disturbance handling during start-up and volume production is key with a mean of 3.9.
The firm considers strong base for the detailed design phase determines much of the
future production disturbances with a mean of 3.7. The firm‟s robust system designs built
new systems based on knowledge and experience from earlier projects with a mean of
3.6. The firm robust production systems are a way to handle the ever changing
environment for manufacturing companies with a mean of 3.4.
This thus shows that the most adopted robust production system design practices
established by the study was the firms need for developing and transferring ordering
competence is a factor of importance for the creation of robust production systems. While
the least adopted was the firm‟s robust system designs being built new systems based on
knowledge and experience from earlier projects. Based on the means established, all the
33
robust production system design practices were termed to be adopted to above the
moderate extent. This concurs with, Säfsten, (2002) who conducted a study on the
evaluation of assembly systems: An exploratory study of evaluation situations.
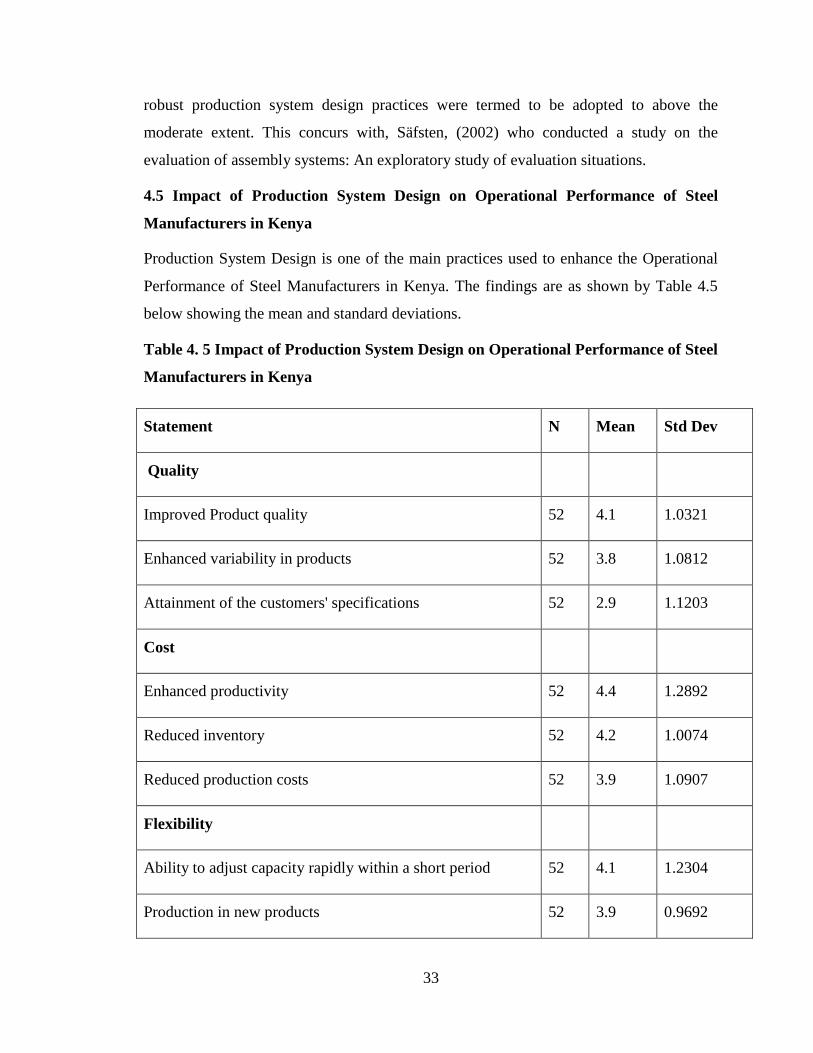
4.5 Impact of Production System Design on Operational Performance of Steel
Manufacturers in Kenya
Production System Design is one of the main practices used to enhance the Operational
Performance of Steel Manufacturers in Kenya. The findings are as shown by Table 4.5
below showing the mean and standard deviations.
Table 4. 5 Impact of Production System Design on Operational Performance of Steel
Manufacturers in Kenya
Statement N Mean Std Dev
Quality
Improved Product quality 52 4.1 1.0321
Enhanced variability in products 52 3.8 1.0812
Attainment of the customers' specifications 52 2.9 1.1203
Cost
Enhanced productivity 52 4.4 1.2892
Reduced inventory 52 4.2 1.0074
Reduced production costs 52 3.9 1.0907
Flexibility
Ability to adjust capacity rapidly within a short period 52 4.1 1.2304
Production in new products 52 3.9 0.9692
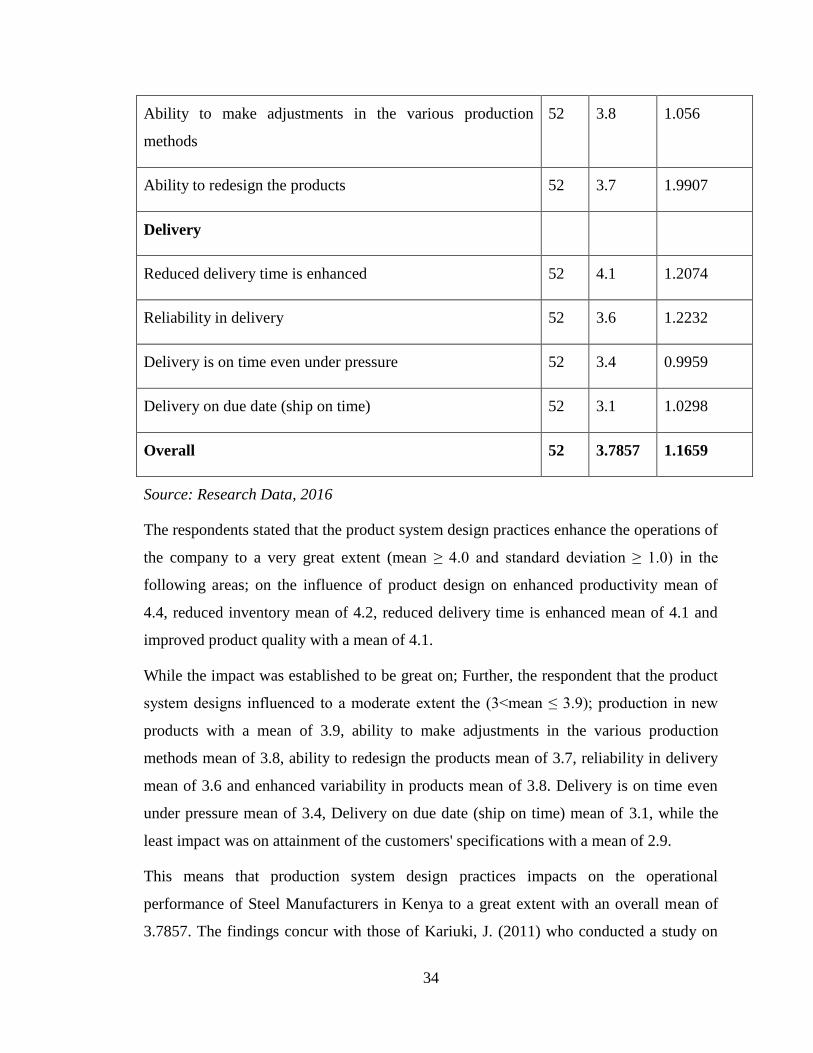
34
Ability to make adjustments in the various production
methods
52 3.8 1.056
Ability to redesign the products 52 3.7 1.9907
Delivery
Reduced delivery time is enhanced 52 4.1 1.2074
Reliability in delivery 52 3.6 1.2232
Delivery is on time even under pressure 52 3.4 0.9959
Delivery on due date (ship on time) 52 3.1 1.0298
Overall 52 3.7857 1.1659
Source: Research Data, 2016
The respondents stated that the product system design practices enhance the operations of
the company to a very great extent (mean ≥ 4.0 and standard deviation ≥ 1.0) in the
following areas; on the influence of product design on enhanced productivity mean of
4.4, reduced inventory mean of 4.2, reduced delivery time is enhanced mean of 4.1 and
improved product quality with a mean of 4.1.
While the impact was established to be great on; Further, the respondent that the product
system designs influenced to a moderate extent the (3<mean ≤ 3.9); production in new
products with a mean of 3.9, ability to make adjustments in the various production
methods mean of 3.8, ability to redesign the products mean of 3.7, reliability in delivery
mean of 3.6 and enhanced variability in products mean of 3.8. Delivery is on time even
under pressure mean of 3.4, Delivery on due date (ship on time) mean of 3.1, while the
least impact was on attainment of the customers' specifications with a mean of 2.9.
This means that production system design practices impacts on the operational
performance of Steel Manufacturers in Kenya to a great extent with an overall mean of
3.7857. The findings concur with those of Kariuki, J. (2011) who conducted a study on
35
steel mill processing and recycling Industry in Kenya whereby the product system
designs were established to impact greatly how the organization performed.
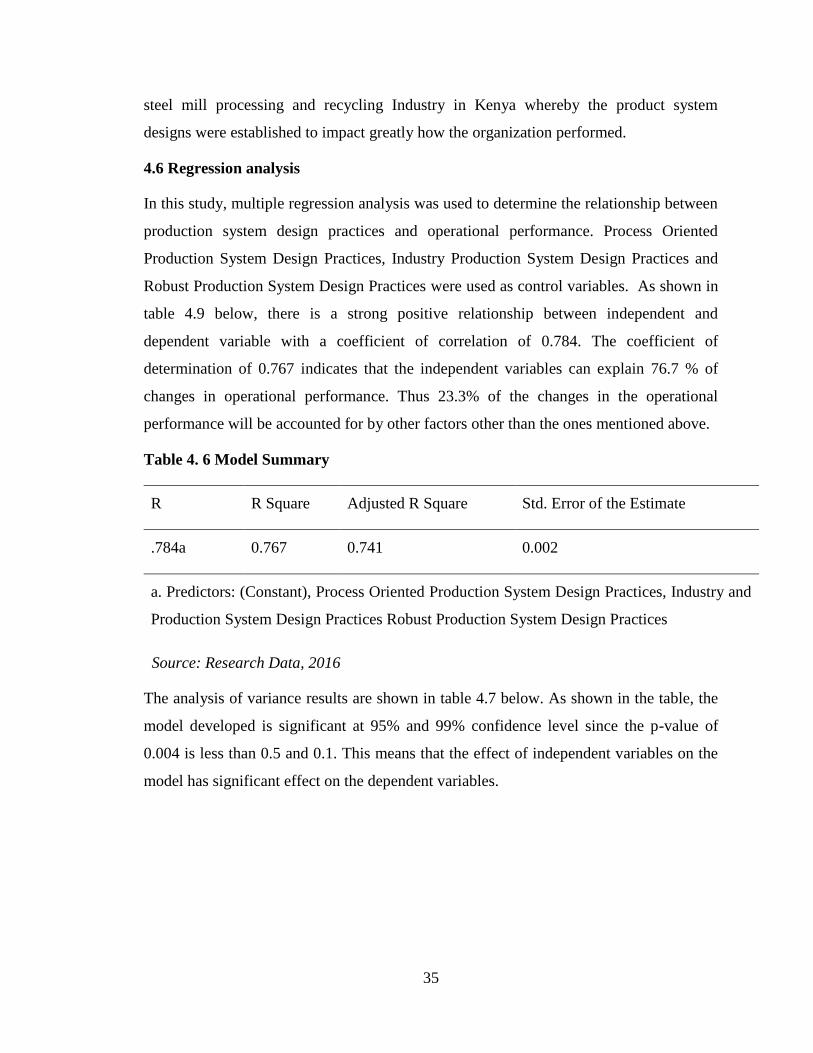
4.6 Regression analysis
In this study, multiple regression analysis was used to determine the relationship between
production system design practices and operational performance. Process Oriented
Production System Design Practices, Industry Production System Design Practices and
Robust Production System Design Practices were used as control variables. As shown in
table 4.9 below, there is a strong positive relationship between independent and
dependent variable with a coefficient of correlation of 0.784. The coefficient of
determination of 0.767 indicates that the independent variables can explain 76.7 % of
changes in operational performance. Thus 23.3% of the changes in the operational
performance will be accounted for by other factors other than the ones mentioned above.
Table 4. 6 Model Summary
R R Square Adjusted R Square Std. Error of the Estimate
.784a 0.767 0.741 0.002
a. Predictors: (Constant), Process Oriented Production System Design Practices, Industry and
Production System Design Practices Robust Production System Design Practices
Source: Research Data, 2016
The analysis of variance results are shown in table 4.7 below. As shown in the table, the
model developed is significant at 95% and 99% confidence level since the p-value of
0.004 is less than 0.5 and 0.1. This means that the effect of independent variables on the
model has significant effect on the dependent variables.
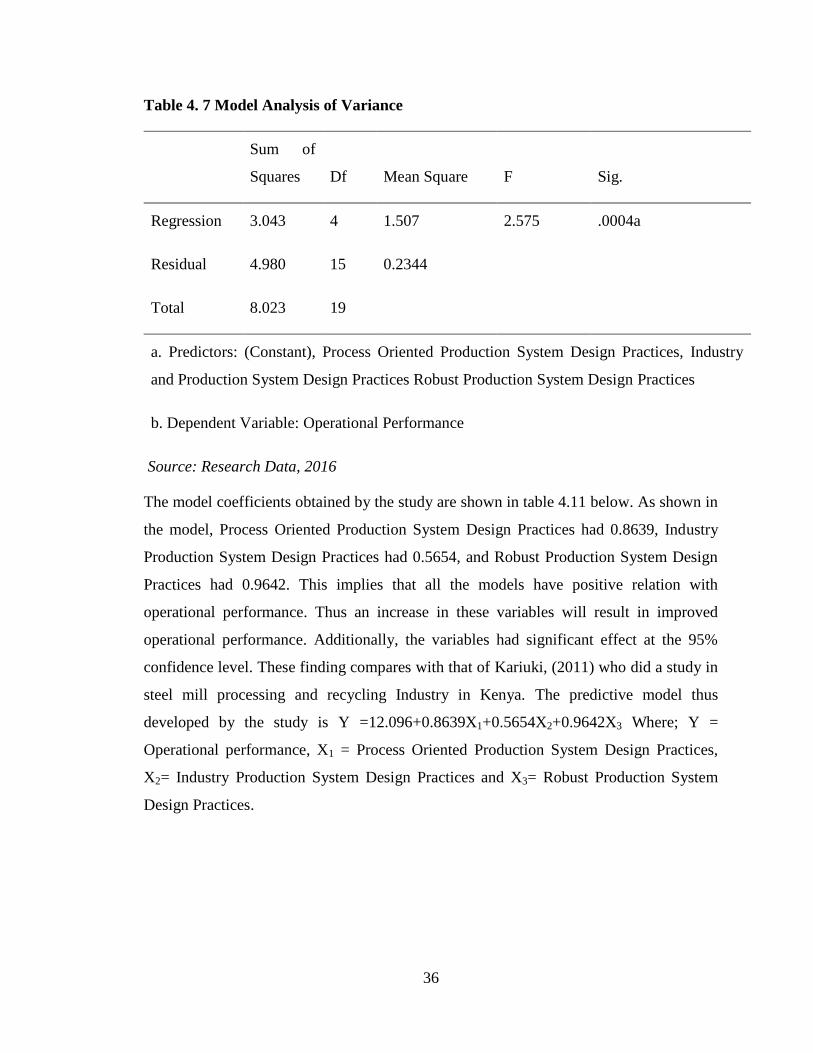
36
Table 4. 7 Model Analysis of Variance
Sum of
Squares Df Mean Square F Sig.
Regression 3.043 4 1.507 2.575 .0004a
Residual 4.980 15 0.2344
Total 8.023 19
a. Predictors: (Constant), Process Oriented Production System Design Practices, Industry
and Production System Design Practices Robust Production System Design Practices
b. Dependent Variable: Operational Performance
Source: Research Data, 2016
The model coefficients obtained by the study are shown in table 4.11 below. As shown in
the model, Process Oriented Production System Design Practices had 0.8639, Industry
Production System Design Practices had 0.5654, and Robust Production System Design
Practices had 0.9642. This implies that all the models have positive relation with
operational performance. Thus an increase in these variables will result in improved
operational performance. Additionally, the variables had significant effect at the 95%
confidence level. These finding compares with that of Kariuki, (2011) who did a study in
steel mill processing and recycling Industry in Kenya. The predictive model thus
developed by the study is Y =12.096+0.8639X1+0.5654X2+0.9642X3 Where; Y =
Operational performance, X1 = Process Oriented Production System Design Practices,
X2= Industry Production System Design Practices and X3= Robust Production System
Design Practices.

37
Table 4. 8 Model Coefficients
Unstandardized
Coefficients Standardized Coefficients
B Std. Error Beta T Sig.
(Constant) 12.096 4.0084
4.017 0.0010
Process Oriented
Production System Design
Practices 0.8639 0.201 -0.331 -1.098 0.004
Industry Production
System Design Practices 0.5654 0.401 -0.303 -0.193 0.035
Robust Production System
Design Practices 0.9642 0.056 -0.466 -1.410 0.047
a. Dependent Variable: Operational Performance
Source: Research Data, 2016
38
CHAPTER FIVE: SUMMARY, CONCLUSION AND
RECOMMENDATIONS
5.1 Introduction
This chapter presents a summary discussion on the production system designs adopted by
steel manufacturers in Kenya and the impact these production system design practices
have on the operational performance of steel manufacturers in Kenya. A conclusion
discussing the general findings of the research is highlighted followed by
recommendation based on the findings of the study. The limitations of the study and
suggestions on areas of further research are discussed at the end of the chapter.
5.2 Summary of Findings
The study sought to establish the production system designs adopted by steel
manufacturers in Kenya and the impact these production system designs have on
operational performance of steel manufacturers in Kenya. The study population
comprised of all steel manufacturing firms in Kenya. Particularly, the respondents were
the Maintenance Managers, Production Managers, and Plant/Operations Managers.
Questionnaires were used as the research instrument of which a response rate of 87% was
obtained. The study establishes that all the steel manufacturers in Kenya have adopted
various product system design practices. This could be mainly due to the benefits accrued
from their incorporation in the operations.
The findings show that the most adopted production system design practice is the
planning of capacities provided by customer and service provider as well as the
scheduling of service production processes have to be taken into account. Using the
layout and paper models to test the production system was established to be the most
adopted industry production system designs. The most adopted Robust Production
System Design established by the study was the firms need for developing and
transferring ordering competence is a factor of importance for the creation of robust
production systems. However the product system designs were yet to attain full adoption
in the companies.
39
The study also sought to establish the impact of Production System Design on
Operational Performance of Steel Manufacturers in Kenya. The results established that
that production system design impacts on the operational performance of Steel
Manufacturers in Kenya to a great extent with an overall mean of 3.7857. Particularly,
the influence of product design on enhanced productivity had the highest mean of 4.4
while least impact was on Attainment of the customers' specifications mean of 2.9. This
means that the designs determine greatly how the operations were conducted.
Additionally, there is a strong positive relationship between independent and dependent
variable with a coefficient of correlation of 0.784. The coefficient of determination of
0.767 indicates that the independent variables can explain 76.7 % of changes in
operational performance. This thus affirms a positive and significant relationship between
product system designs and the operational performance. Of which all the models had a
positive relation with the operational performance, implying an increase in the product
system design practices will cause improved performance .The predictive model thus
developed by the study is Y =12.096+0.8639X1+0.5654X2+0.9642X3 Where; Y =
Operational performance, X1 = Process Oriented Production System Design Practices,
X2= Industry Production System Design Practices and X3= Robust Production System
Design Practices.
5.3 Conclusion
The study sought to establish production system design adopted by steel manufacturers in
Kenya. Process Oriented Production System Design, Industry Production System Design
and Robust Production System Design were established to be the main systems adopted
by the companies. The study concludes that the planning of capacities provided by both
customer and service provider as well as the scheduling of service production processes
have to be taken into account is the used product designs. The study also concludes that
the layout and paper models to test the production system the firms, and need for
developing and transferring ordering competence is a factor of importance for the
creation of robust production systems to be the most adopted Industry Production System
Design and Robust Production System Design respectively. Generally, the study
concludes a fairly good extent of adoption of the practices.
40
The study sought to establish the relationship that existed between the research variables,
which included the product system designs and the operational performance. The study
establishes that the product system designs have impacts on the leadership, quality,
customer satisfaction and the supply chain management. The study thus concludes a
positive relation between product system designs and the operational performance, which
is supported by a coefficient of correlation of 0.784. This is attributed to the fact that the
product system designs will enable operations to be undertaken in a consistent and
efficient way. Thus proper incorporation of the product system designs into the
operations of the steel companies is most likely to result in improved operational
performance.
5.4 Recommendations
The study finds out that the companies adopt various product design systems. The study
thus recommends that the management of the companies to not only adopt any product
design system, but also choose the design that works the best for that particular
organization. This is attributed to the fact that internal variations exist among companies,
thus a product design that works in one organization, will not necessarily work in
another. Additionally, the companies may also differ in terms of the resources available.
The study also established a positive relation between the product system designs and the
operational performance. The study thus recommends that managers aiming to improve
the operational performance of their companies, they should make a keen evaluation onto
the product design employed. They should also allocate the required resources to enable
the proper implementation of the product designs. This will enable the maximum gain
from the product design systems. The government could also formulate policies that
favour how the companies adopt and implement the design systems.
5.5 Limitations of the study
The study was faced with a number of limitations as it was being conducted. To begin
with, the study was largely constrained by the short time available. The informants also
had tight schedules and could only manage limited time to provide the required data.
Therefore, they could not offer detailed descriptions of the phenomena that existed. The
study was also limited that it only focused in the steel manufacturers in Kenya. This may
41
not be an equal representation of steel manufacturers in the region and also other
manufacturers in other sectors.
In addition, some of the respondents were reluctant in providing such information
concerning the product system designs as it were considered very vital. However, the
researcher informed them that all the collected data will be used for academic purposes.
Hence, despite these limitations, the accuracy and creditability of the study‟s findings
was not compromised.
5.6 Suggestions for further studies
Though the research questions been fully answered, there are few areas that still require
further study. To begin with, the manufacturing industry plays a significant role in the
economy of Kenya. However, the industry faces a lot of challenges that threaten its
survival in the globalized market. Adoption of production system design is a key survival
technique for the in Kenya. Hence it is important that more research is done on the
implementation process of these production system designs as this study only established
the relation that exists.
In addition, the study only focused to the steel manufacturers in Kenya. This may not be
an actual representation of other manufacturers. Further study could be conducted on the
giving consideration other manufacturers in various other sectors. This will enable
complete generalization of the relationship that existed. A study could also be conducted
in a different time span to establish whether the current practices will still be in use or
whether other product system designs would have emerged.

42
REFERENCES
Askin, R. G. and Goldberg, J. B. (2002). Design and Analysis of Lean Production
Systems..
Bellgran, M. and Säfsten, K. (2010). Production development, design and operation of
production systems. Springer-Verlag, London, UK.
Bellgran, M. and Säfsten, K. (2010). Production development, design and operation of
production systems. Springer-Verlag, London, UK.
Bennett, D. (2006). Production System Design. Butterworth & Co, Ltd., London, UK.
Bennett, D. J. And Forrester, P. L. (2003). Market-focused Production Systems: Design
and Implementation. Hemel Hempstead: Prentice Hall.
Bennett, D.J. and Forrester, P.L. (2003): Market-focused Production Systems: Design and
Implementation, Prentice Hall International Ltd.; UK.
Bennett, D. (2006). Production System Design. Butterworth & Co, Ltd., London, UK.
Boyer, K. & Lewis, M.W. (2002). Investigating the need for trade-offs in operations
strategy. Production and Operations Management, 11(1), 9-20.
Cochran, G.S. (2002). Key manufacturing capability elements and business performance,
International Journal of Production Research 40 (1), 109- 131.
D‟Souza, D.E. and Williams, F.P. (2000). Towards a taxonomy of manufacturing
flexibility dimensions, Journal of Operations Management 18(5), 577-593.
Dangayach, G.S. & Deshmukh, S.G. (2001). Manufacturing strategy: literature review
and some issues. International Journal of Operations & Production Management,
21(7), 884-932.

43
Engström, T., Jonsson, D. and Medbo, L. (2008). "The Volvo Uddevalla plant and
interpretations of industrial design processes", Integrated Manufacturing Systems,
Vol. 9, No. 5, 279‐295.
Ferdows, A. & De Meyer, T. (2010). Value chains versus supply chains. BPTrends.
Gaither, N. and Frazier, G. (2001). Production and Operations Management.
PioneiraThomson Learning. São Paulo.
Gerwin, D. and Barrowman, N.J. (2002). "An Evaluation of Research on Integrated
Product Development", Management Science, Vol. 48, No. 7, 938‐953.
Hayes, R. H., & Wheelwright, S. C. (1984). Restoring Our Competitive Edge: Competing
through Manufacturing. Wiley, New York, NY.
Hill, T.J., Menda, R. and Dilts, D.M. (2008). Using product-profiling to illustrate
manufacturing-marketing misalignment, Interfaces 28(4), 47-63.
Hobday, M., Prencipe, A. and Davies, A. (2005). "Introduction", in Prencipe, A., Davies,
A. and Hobday, M. (Eds.), The Business of Systems Integration, New York, NY:
Oxford University Press, 1‐14.
Jackson, M. (2000). An Analysis of Flexible and Reconfigurable Production Systems,
Linköping Studies in Science and Technology, Dissertation No. 640, Linköping,
Sweden.
Johannessen, J. and Olsen, B. (2010). The future of value creation and innovations:
Aspects of a theory of value creation and innovation in a global knowledge
economy. International Journal of Information Management, (30), 502–511.
44
Kariuki, J. (2011). A Study in steel mill processing and recycling Industry in Kenya:
(Unpublished MSC Project), Jomo Kenyatta University of Science and
Agriculture.
Li, S., Ragu-Nathan, B., Ragu-Nathan, T.S. and Rao, S.S. (2006), “The impact of supply
chain management practices on competitive advantage and organizational
performance”, OMEGA, Vol. 34 No. 2, pp. 107-24
Liker, J. (2004). The Toyota Way: 14 management principles from the World‟s greatest
manufacturer (1st edn.) McGraw-Hill.
Magrab, E.B., Gupta, S.K., McCluskey, F.P. and Sandborn, P. (2010). Integrated Product
and Process Design and Development: The Product Realization Process, 2nd ed.,
Boca Raton, FL.: CRC Press.
Narasimhan, R. & Das, A. (2001). “The impact of purchasing integration and practices on
manufacturing performance”, Journal of Operations Management, Vol. 19 No. 5,
593-609.
Neumann, W. P., Kihlberg, S., Medbo, P., Mathiassen, S. E. and Winkel, J. (2002). A
case study evaluating the ergonomic and productivity impacts of partial
automation strategies in the electronics industry. International Journal of
Production Research, Vol. 40, No. 16, pp. 4059-4075.
Nof, S. Y., Wilhelm, W. E. and Warnecke, H. (2007). Industrial Assembly. London:
Chapman & Hall.
Ohno, T. (1998). Toyota Production System – Beyond large Scale Production,
Productivity Press, Portland.
45
Panupak,P. and Robert, J. (2008). “Exploring Strategy-misaligned Performance
Measurement”, International Journal of Productivity and Performance
Management,Vol. 57 Iss: 3, 207 – 222.
Porter, M. (1990). The Competitive Advantage of Nations. 1 ed. New York: Free Press.
Porter, M. (1998). The Competitive Advantage of Nations. In: 2 ed. Basingstoke:
Macmillan Press Ltd, p. 33.
Porter, M.E. (1980). Competitive Strategy: Techniques for Analyzing Industries and
Competitors. 1 ed. New York: Free Press.
Porter, M.E. (1985). Competitive Advantage: Creating and Sustaining Superior
Performance. 1 ed. New York: Free Press.
Säfsten, K. (2002). Evaluation of assembly systems: An exploratory study of evaluation
situations, PhD Thesis, Linköping University, Linköping, Sweden.
Säfsten, K., Harlin, U., Fjällström, S. and Berglund, M. (2008). "Proactive and Reactive
Ways of Managing Product Introduction", Proceedings of the 2nd Swedish
Production Symposium, Stockholm, 18‐20.
Seliger, G., Viehweger, B. And Wieneke, B. (1987) Decision support in design and
optimization of flexible automated manufacturing and assembly. Robotics and
Computer Integrated Manufacturing, 3(2): 221–227.
Sethi, A.K. and Sethi, S.P. (2000). Flexibility in manufacturing: a survey, International
Journal of Flexible Manufacturing Systems 2(4), 289-328.
Shang, J. and Sueyoshi, T. (2015). A unified framework for the selection of a Flexible
Manufacturing System. European Journal of Operational Research, Vol. 85, No.
2, pp. 297-315.
46
Shang, J. and Sueyoshi, T. (2015). A unified framework for the selection of a Flexible
Manufacturing System. European Journal of Operational Research, Vol. 85, No.
2, 297-315.
Skinner, W. (1985). Manufacturing, The Formidable Competitive Weapon. New
York: John Wiley & Sons.
Skyttner, L. (2001) General Systems Theory: Ideas and Applications. Singapore: World
Scientific.
Skyttner, L. (2001) General Systems Theory - Ideas and Applications, World Scientific,
London.
Slack, N., Chambers, S. and Johnston, R. (2008). Operations management, fourth edn,
Prentice Hall/Financial Times., Harlow, England.
Taguchi, G., Chowdhury, S. and Taguchi, S. (2000). Robust Engineering, McGraw-Hill,
the U.S.
Treacy, M. & Wiersema, F. (2013). Customer Intimacy and Other Value Disciplines.
Harvard Business Review, Volume January-February, pp. 84-94.
Ulrich, K.T. and Eppinger, S.D. (2007). Product Design and Development, 4th ed., New
York, NY: McGraw‐Hill.
Von Haartman, R. and Bengtsson, L. (2009). "Manufacturing competence: a key to
successful supplier integration", International Journal of Manufacturing
Technology and Management, Vol. 16, No. 3, pp. 283‐299.
Ward, P.T., McCreery, J.K., Ritzman, L.P. & Sharma, D. (2006). Competitive priorities
in operations management. Decision Sciences, 29(4), 1035-1046.

47
Wu, B. (2004). Manufacturing Systems Design and Analysis: Context and techniques,
2nd ed., London, UK: Chapman & Hall.
48
Appendix II: List of Steel Mill Firms in Kenya
1. Apex Steel Ltd.
2. Athiriver Steel Plant Ltd
3. Blue Nile Steel Rolling Mills Ltd
4. Brollo Kenya Limited.
5. Corrugated Sheets Ltd
6. Devki Steel Mills Ltd
7. Doshi Enterprises
8. East African Foundry Works Ltd
9. Insteel Limited
10. Kaluworks Ltd
11. Kenya United Steel Company (2006) Ltd.
12. Mabati Rolling Mills Ltd.
13. Narcol Aluminum Rolling Mills Ltd.
14. Rolmil Kenya Limited.
15. Safal Mitek Ltd
16. Steel makers Ltd.
17. Standard Rolling Mills Ltd.
18. Techno Steel Industries Ltd
19. Tononoka Rolling Mills Ltd
20. Bhachu Industries Accurate Steel Mills Ltd
Source, 11th
Edition Kenya Manufacturers & Exporters Directory 2015.