Embed Size (px)
DESCRIPTION
Production System Techniques to Increase Nitrogen Use Efficiency In Winter Wheat. W.E. Thomason, K.W. Freeman, G.V. Johnson, R.W. Mullen, K.J. Wynn, J.B. Solie, M.L. Stone, and W.R. Raun. Oklahoma State University Department of Plant and Soil Sciences. Introduction. - PowerPoint PPT Presentation
Citation preview
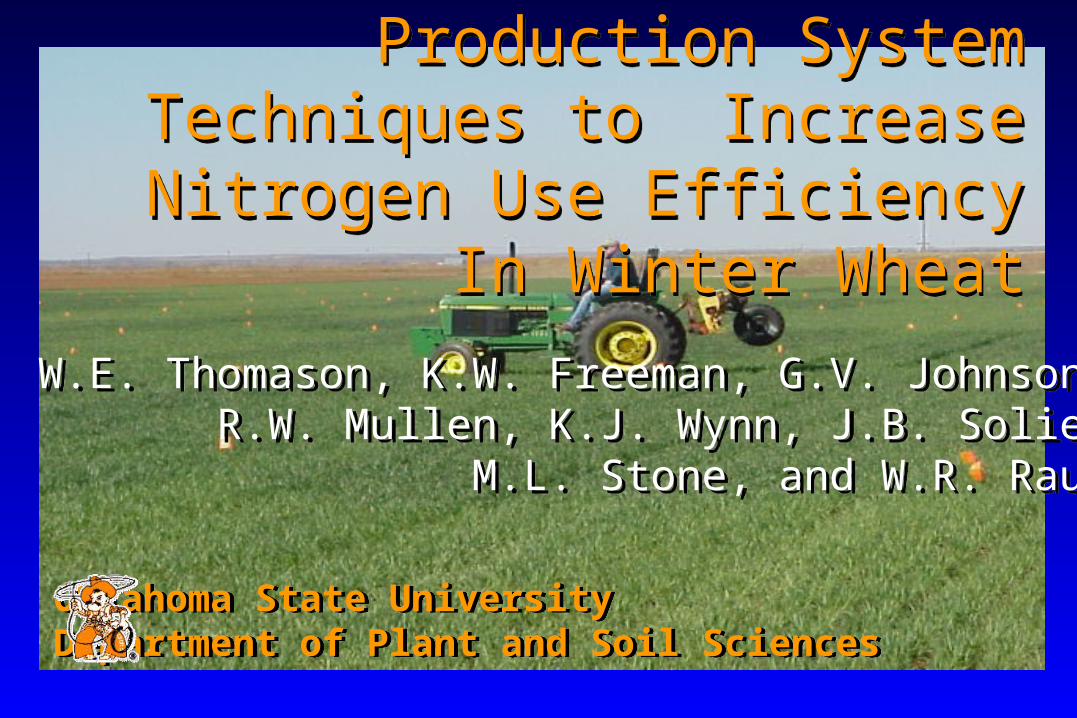
Production System Techniques to Increase Nitrogen Use Efficiency
In Winter Wheat
Production System Techniques to Increase Nitrogen Use Efficiency
In Winter Wheat
W.E. Thomason, K.W. Freeman, G.V. Johnson,R.W. Mullen, K.J. Wynn, J.B. Solie,
M.L. Stone, and W.R. Raun
W.E. Thomason, K.W. Freeman, G.V. Johnson,R.W. Mullen, K.J. Wynn, J.B. Solie,
M.L. Stone, and W.R. Raun
Oklahoma State UniversityDepartment of Plant and Soil SciencesOklahoma State UniversityDepartment of Plant and Soil Sciences
Introduction
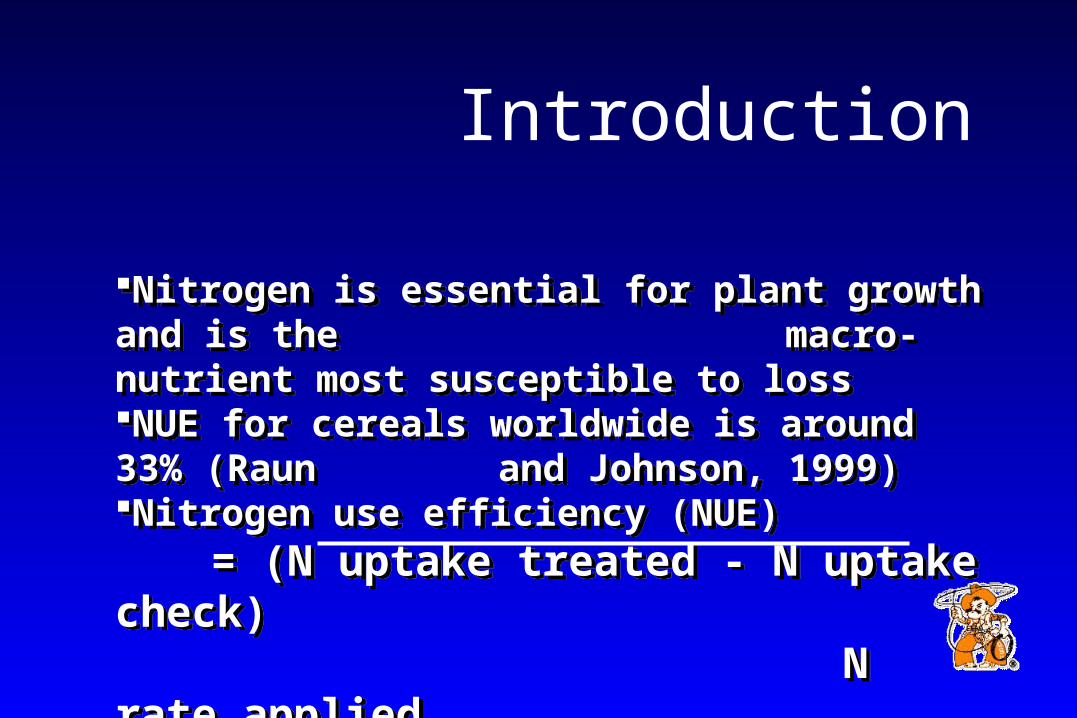
Nitrogen is essential for plant growth and is the macro-nutrient most susceptible to lossNUE for cereals worldwide is around 33% (Raun and Johnson, 1999)Nitrogen use efficiency (NUE)
= (N uptake treated - N uptake check) N rate applied
Nitrogen is essential for plant growth and is the macro-nutrient most susceptible to lossNUE for cereals worldwide is around 33% (Raun and Johnson, 1999)Nitrogen use efficiency (NUE)
= (N uptake treated - N uptake check) N rate applied
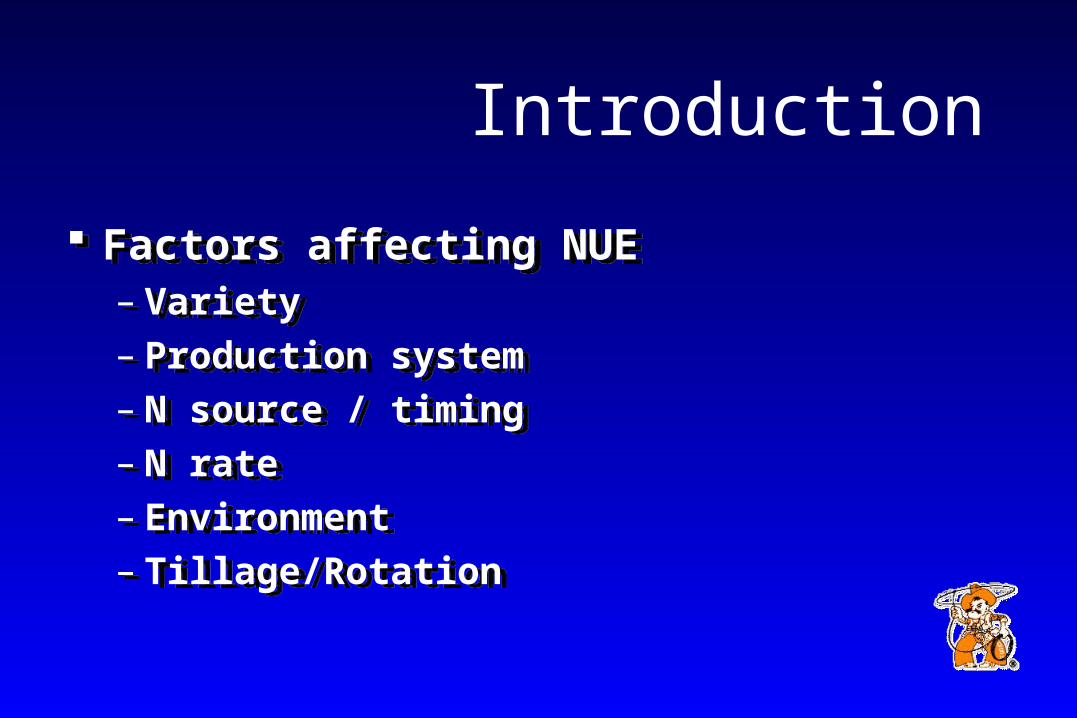
Factors affecting NUE– Variety– Production system– N source / timing– N rate– Environment– Tillage/Rotation
Factors affecting NUE– Variety– Production system– N source / timing– N rate– Environment– Tillage/Rotation
Introduction
Objectives
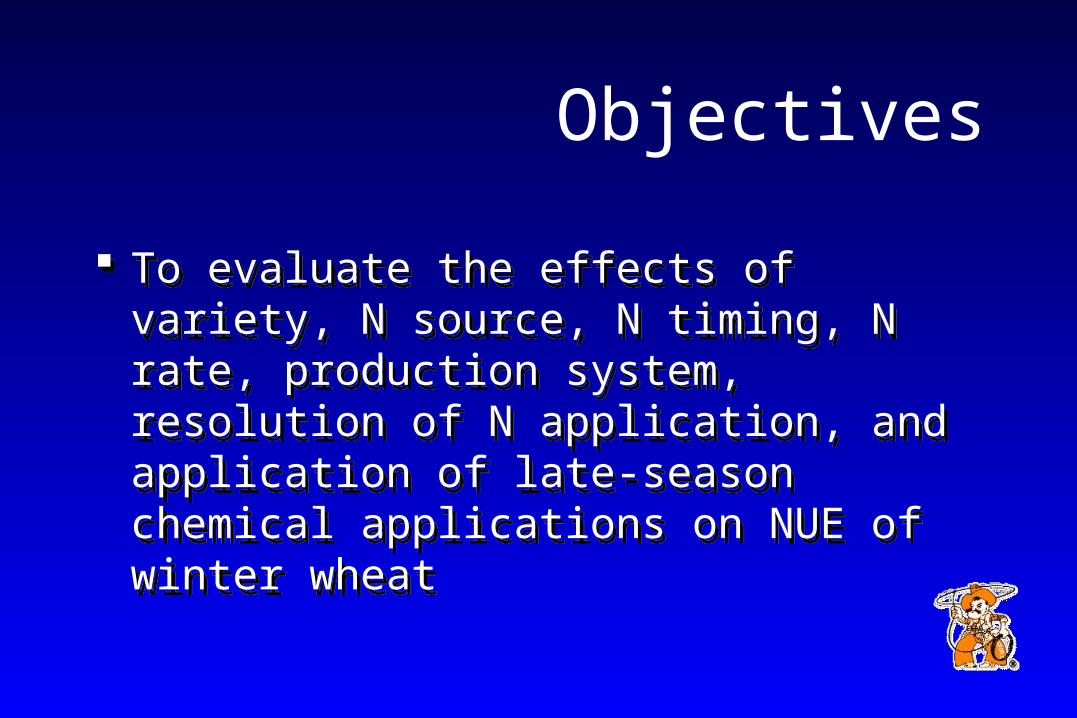
To evaluate the effects of variety, N source, N timing, N rate, production system, resolution of N application, and application of late-season chemical applications on NUE of winter wheat
To evaluate the effects of variety, N source, N timing, N rate, production system, resolution of N application, and application of late-season chemical applications on NUE of winter wheat
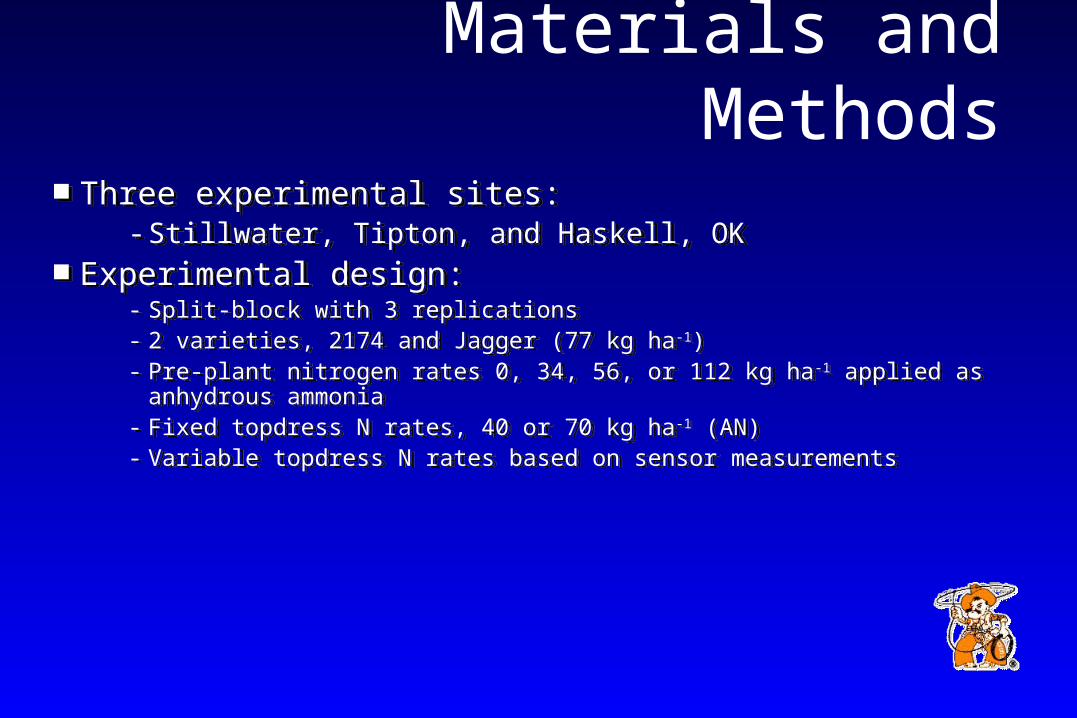
Materials and Methods Three experimental sites:
- Stillwater, Tipton, and Haskell, OK Experimental design:
- Split-block with 3 replications - 2 varieties, 2174 and Jagger (77 kg ha-1)- Pre-plant nitrogen rates 0, 34, 56, or 112 kg ha-1 applied as anhydrous ammonia- Fixed topdress N rates, 40 or 70 kg ha-1 (AN)- Variable topdress N rates based on sensor measurements
Three experimental sites:- Stillwater, Tipton, and Haskell, OK
Experimental design: - Split-block with 3 replications - 2 varieties, 2174 and Jagger (77 kg ha-1)- Pre-plant nitrogen rates 0, 34, 56, or 112 kg ha-1 applied as anhydrous ammonia- Fixed topdress N rates, 40 or 70 kg ha-1 (AN)- Variable topdress N rates based on sensor measurements

Materials and Methods Experimental design (cont):
- Forage-only production system- Forage + grain production system- Chemical application
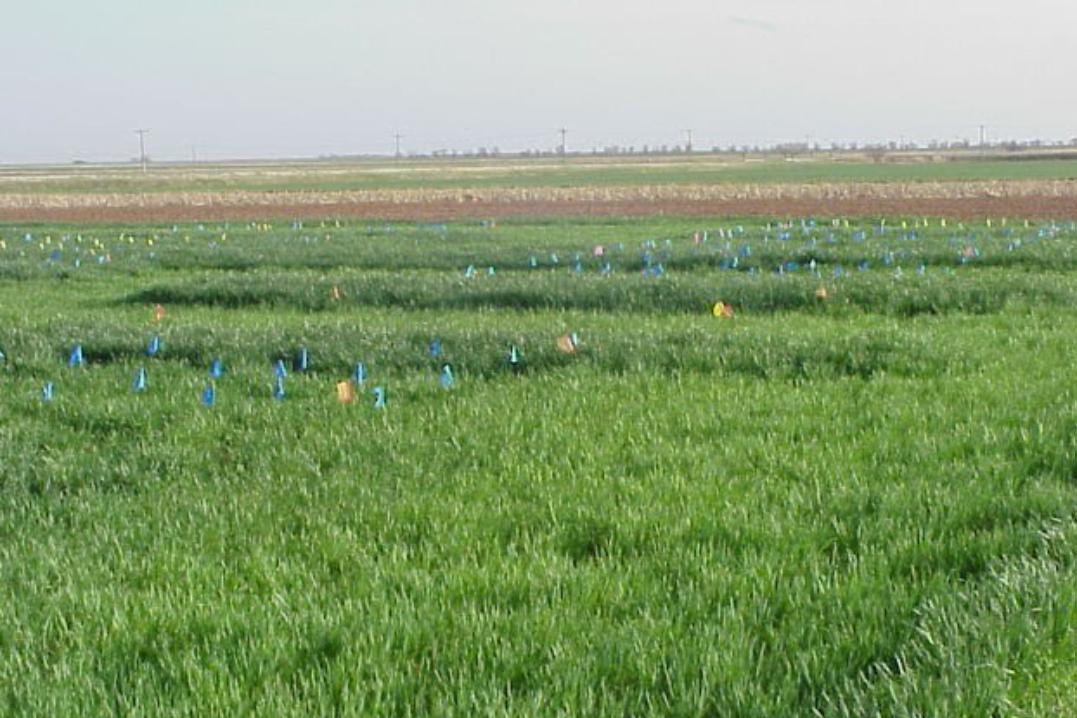
Forage samples- Hand harvested from 1m2 area from center of plots- Analyzed for total N (dry combustion)
Grain Production - Harvest of 3.05 x 2 m area with a self-propelled combine harvester
Experimental design (cont):- Forage-only production system- Forage + grain production system- Chemical application
Forage samples- Hand harvested from 1m2 area from center of plots- Analyzed for total N (dry combustion)
Grain Production - Harvest of 3.05 x 2 m area with a self-propelled combine harvester
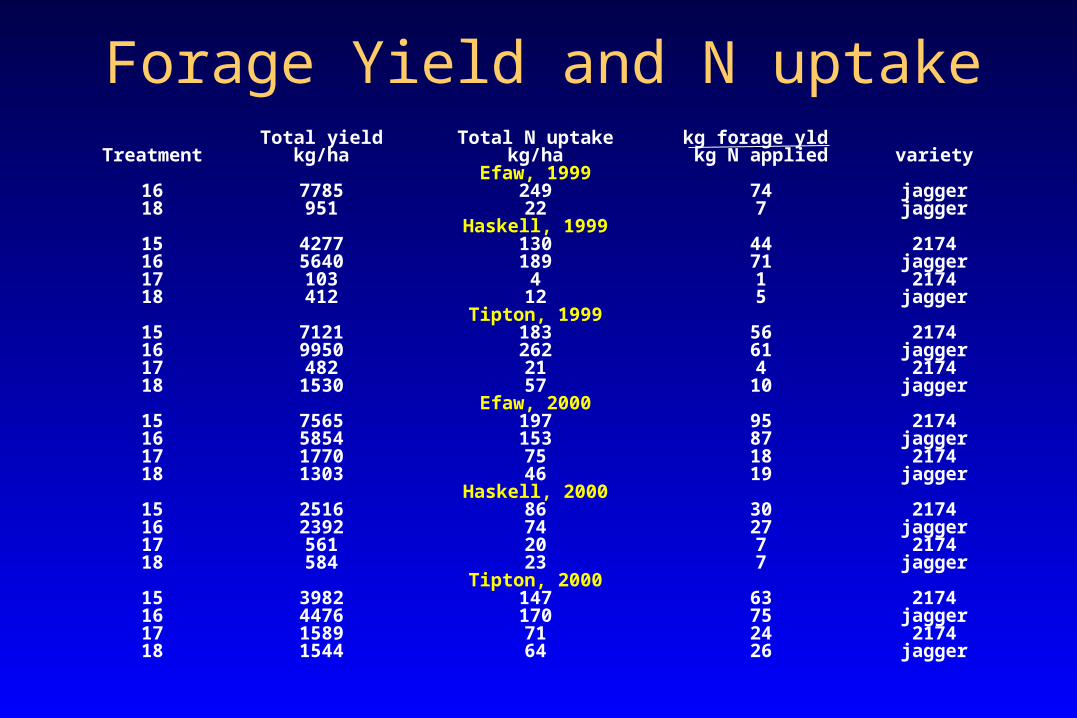
Forage Yield and N uptakeTotal yield Total N uptake kg forage yld
Treatment kg/ha kg/ha kg N applied varietyEfaw, 1999
16 7785 249 74 jagger18 951 22 7 jagger
Haskell, 199915 4277 130 44 217416 5640 189 71 jagger17 103 4 1 217418 412 12 5 jagger
Tipton, 199915 7121 183 56 217416 9950 262 61 jagger17 482 21 4 217418 1530 57 10 jagger
Efaw, 200015 7565 197 95 217416 5854 153 87 jagger17 1770 75 18 217418 1303 46 19 jagger
Haskell, 200015 2516 86 30 217416 2392 74 27 jagger17 561 20 7 217418 584 23 7 jagger
Tipton, 200015 3982 147 63 217416 4476 170 75 jagger17 1589 71 24 217418 1544 64 26 jagger
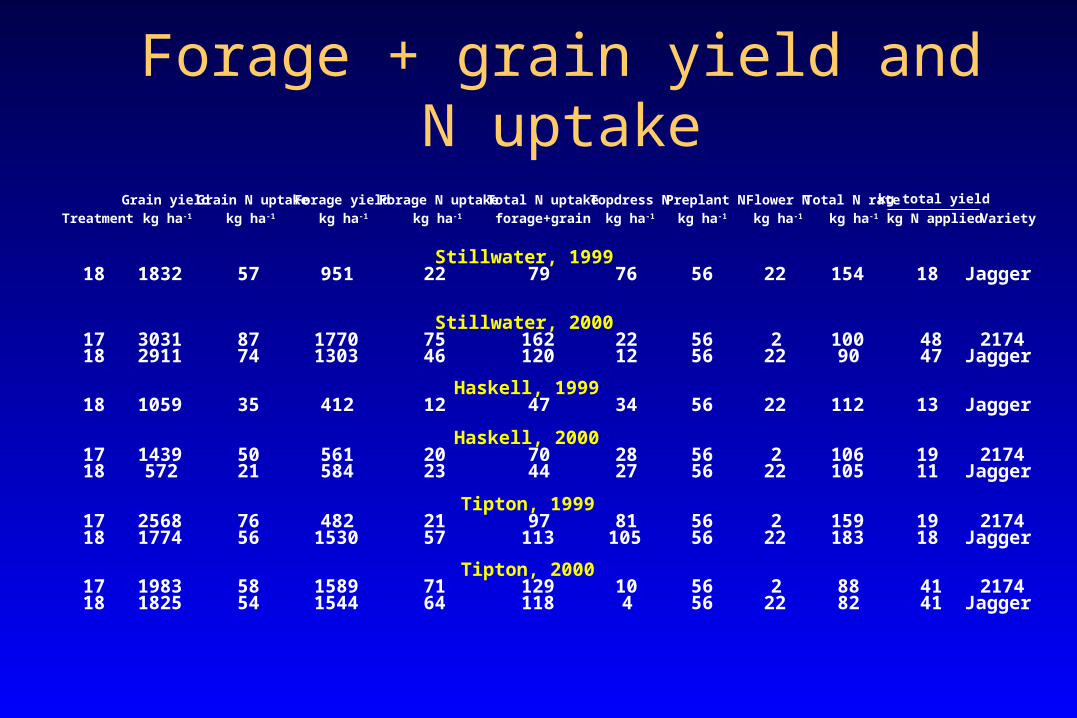
Forage + grain yield and N uptake
Grain yield Grain N uptake Forage yield Forage N uptake Total N uptake Topdress N Preplant N Flower N Total N rate kg total yield
Treatment kg ha-1 kg ha-1 kg ha-1 kg ha-1 forage+grain kg ha-1 kg ha-1 kg ha-1 kg ha-1 kg N applied Variety
Stillwater, 199918 1832 57 951 22 79 76 56 22 154 18 Jagger
Stillwater, 200017 3031 87 1770 75 162 22 56 2 100 48 217418 2911 74 1303 46 120 12 56 22 90 47 Jagger
Haskell, 199918 1059 35 412 12 47 34 56 22 112 13 Jagger
Haskell, 200017 1439 50 561 20 70 28 56 2 106 19 217418 572 21 584 23 44 27 56 22 105 11 Jagger
Tipton, 199917 2568 76 482 21 97 81 56 2 159 19 217418 1774 56 1530 57 113 105 56 22 183 18 Jagger
Tipton, 200017 1983 58 1589 71 129 10 56 2 88 41 217418 1825 54 1544 64 118 4 56 22 82 41 Jagger

Results Forage yields were greatest from the two-cut
system Forage yield : forage uptake ratio
– 2-cuttings = 62 kg forage / kg N applied– one cutting (Feekes 5) = 12 kg forage / kg N
applied Forage + grain plots efficiency
– 27 kg (grain&forage) / kg N applied
Forage yields were greatest from the two-cut system
Forage yield : forage uptake ratio – 2-cuttings = 62 kg forage / kg N applied– one cutting (Feekes 5) = 12 kg forage / kg N
applied Forage + grain plots efficiency
– 27 kg (grain&forage) / kg N applied
0
500
1000
1500
2000
2500
3000
3500
0 70 90 96 112 154-20
0
20
40
60
80
100
yield, kg ha-1
NUE
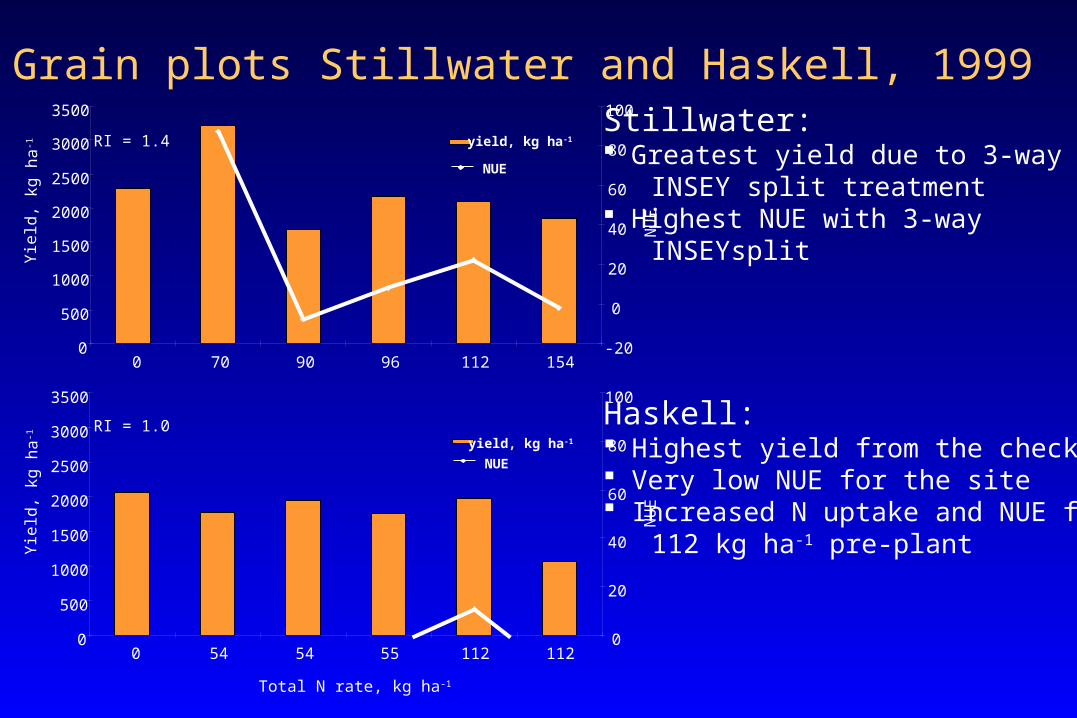
Grain plots Stillwater and Haskell, 1999Stillwater: Greatest yield due to 3-way INSEY split treatment Highest NUE with 3-way INSEYsplit
Haskell: Highest yield from the check Very low NUE for the site Increased N uptake and NUE for 112 kg ha-1 pre-plant
Yie
ld, k
g ha
-1
NU
E0
500
1000
1500
2000
2500
3000
3500
0 54 54 55 112 1120
20
40
60
80
100
yield, kg ha-1
NUE
Yie
ld, k
g ha
-1
Total N rate, kg ha-1
NU
E
RI = 1.4
RI = 1.0
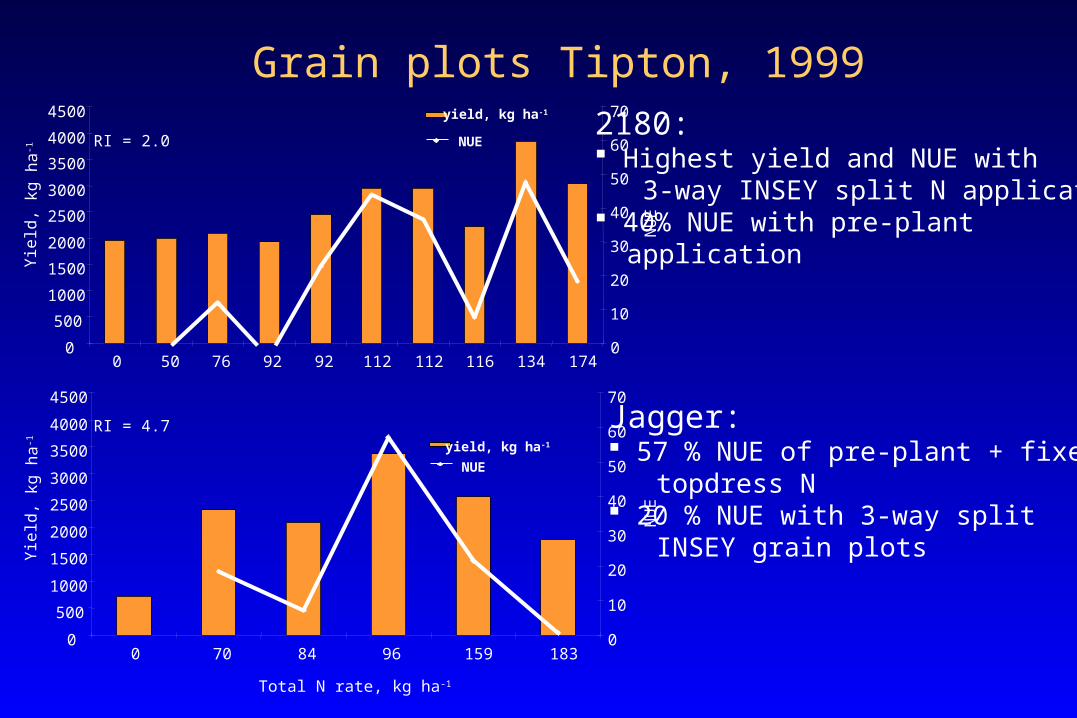
Grain plots Tipton, 1999Y
ield
, kg
ha-1
NU
E
Yie
ld, k
g ha
-1
Total N rate, kg ha-1
NU
E
0 50 76 92 92 112 112 116 134 1740
10
20
30
40
50
60
70yield, kg ha-1
NUE
0
500
1000
1500
2000
2500
3000
3500
4000
4500
0
500
1000
1500
2000
2500
3000
3500
4000
4500
0 70 84 96 159 1830
10
20
30
40
50
60
70
yield, kg ha-1
NUE
2180: Highest yield and NUE with 3-way INSEY split N application 40% NUE with pre-plant application
Jagger: 57 % NUE of pre-plant + fixed topdress N 20 % NUE with 3-way split INSEY grain plots
RI = 2.0
RI = 4.7

Grain plots Stillwater, 2000Y
ield
, kg
ha-1
Total N rate, kg ha-1
NU
E
Yie
ld, k
g ha
-1
NU
E
2174: Highest yield with 78 kg ha –1 TD 55 % NUE with pre-plant + FL 48% NUE with 3-way INSEY split application
Jagger: 14% increase due to INSEY based topdress
0 31 56 57 59 69 78 90 92 1000
10
20
30
40
50
60
70
80
90
100
0
500
1000
1500
2000
2500
3000
3500
4000
4500
0
500
1000
1500
2000
2500
3000
3500
4000
4500
yield, kg ha-1
NUERI = 1.3
0 57 61 70 112 1120
10
20
30
40
50
60
70
80
90
100yield, kg ha-1
NUERI = 1.4
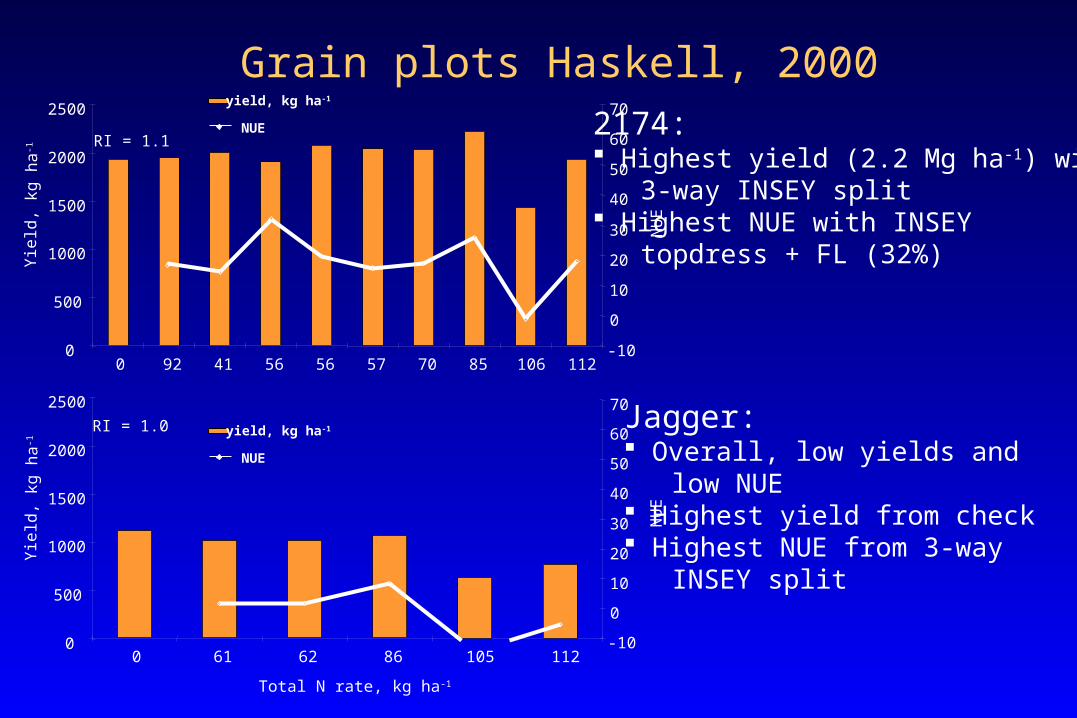
Grain plots Haskell, 2000Y
ield
, kg
ha-1
Total N rate, kg ha-1
Yie
ld, k
g ha
-1
2174: Highest yield (2.2 Mg ha-1) with 3-way INSEY split Highest NUE with INSEY topdress + FL (32%)
Jagger: Overall, low yields and low NUE Highest yield from check Highest NUE from 3-way INSEY split
NU
EN
UE
0
500
1000
1500
2000
2500
0 92 41 56 56 57 70 85 106 112-10
0
10
20
30
40
50
60
70yield, kg ha-1
NUERI = 1.1
0 61 62 86 105 112-10
0
10
20
30
40
50
60
70
yield, kg ha-1
NUE
0
500
1000
1500
2000
2500
RI = 1.0
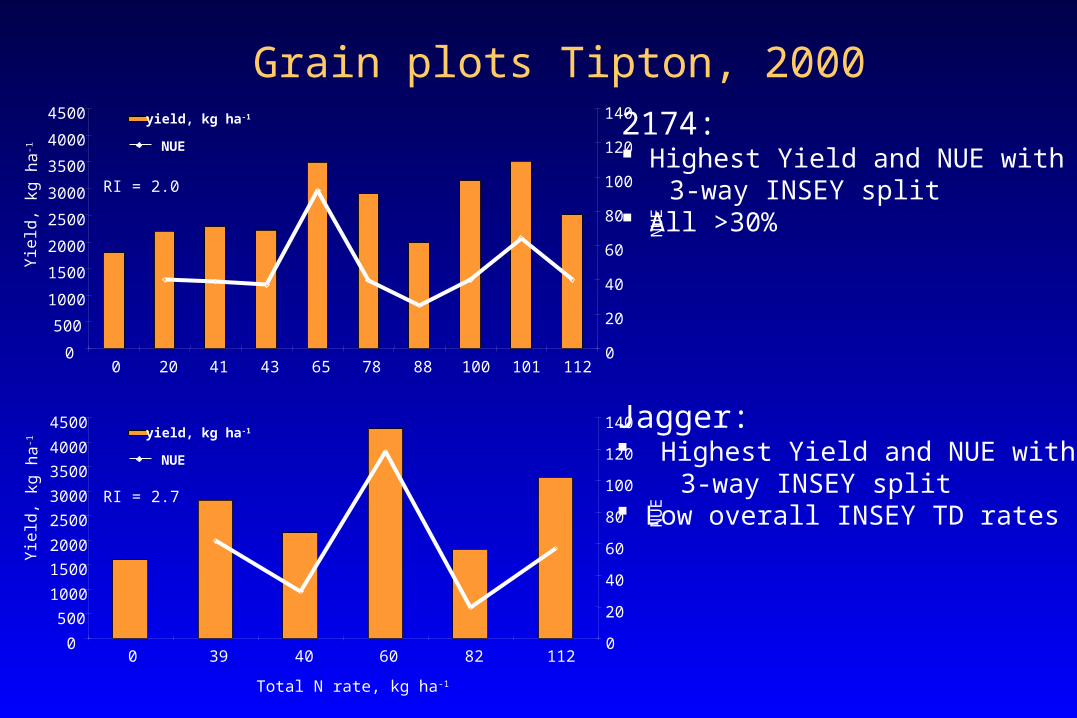
Grain plots Tipton, 2000Y
ield
, kg
ha-1
Yie
ld, k
g ha
-1
2174: Highest Yield and NUE with 3-way INSEY split All >30%
Jagger: Highest Yield and NUE with 3-way INSEY split Low overall INSEY TD ratesN
UE
NU
E
0 20 41 43 65 78 88 100 101 1120
20
40
60
80
100
120
140
0
500
1000
1500
2000
2500
3000
3500
4000
4500
Total N rate, kg ha-1
500
1000
1500
2000
2500
3000
3500
4000
4500
00 39 40 60 82 112
0
20
40
60
80
100
120
140
yield, kg ha-1
NUE
yield, kg ha-1
NUE
RI = 2.0
RI = 2.7
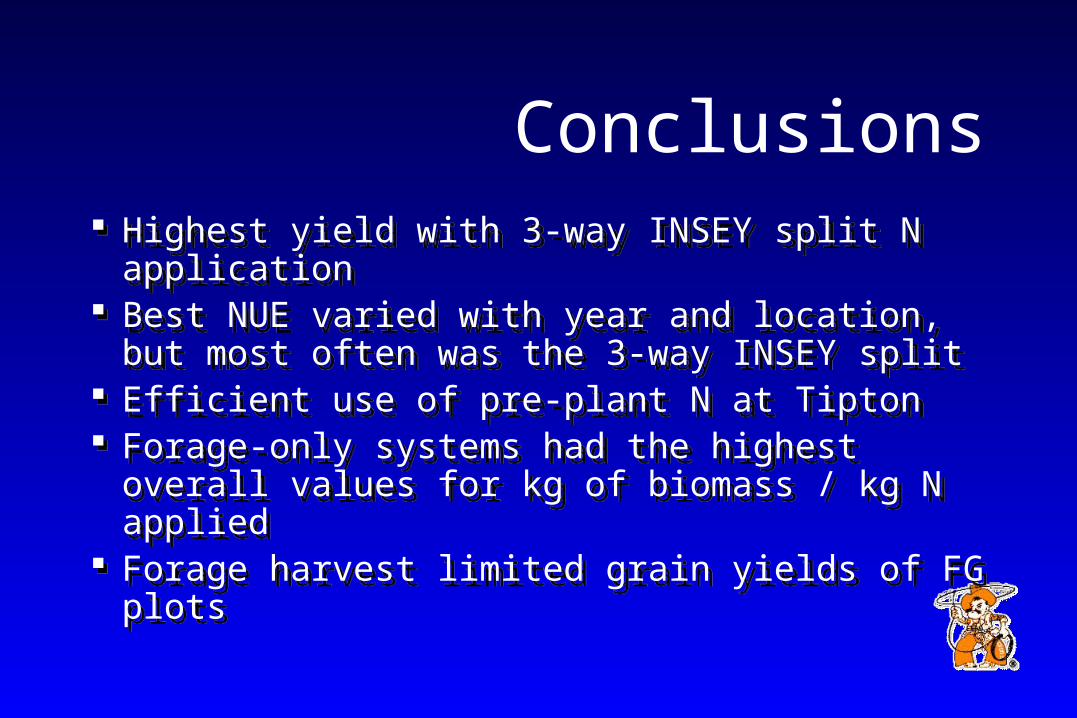
Conclusions Highest yield with 3-way INSEY split N
application Best NUE varied with year and location, but most
often was the 3-way INSEY split Efficient use of pre-plant N at Tipton Forage-only systems had the highest overall
values for kg of biomass / kg N applied Forage harvest limited grain yields of FG plots
Highest yield with 3-way INSEY split N application
Best NUE varied with year and location, but most often was the 3-way INSEY split
Efficient use of pre-plant N at Tipton Forage-only systems had the highest overall
values for kg of biomass / kg N applied Forage harvest limited grain yields of FG plots