Embed Size (px)
Citation preview

PRODUCTIVITY IMPROVEMENT THROUGH LINE BALANCING & LAYOUT IN AN APPAREL INDUSTRY
TO BUILD UP A REFERENCE MODEL
MOHAMMAD SAIDUR RAHMAN
DEPARTMENT OF INDUSTRIAL & PRODUCTION ENGINEERING BANGLADESH UNIVERSITY OF ENGINEERING &
TECHNOLOGY DHAKA, BANGLADESH
April 2016

PRODUCTIVITY IMPROVEMENT THROUGH LINE BALANCING & LAYOUT IN AN APPAREL INDUSTRY
TO BUILD UP A REFERENCE MODEL
By MOHAMMAD SAIDUR RAHMAN
Thesis Submitted To
Department of Industrial & Production Engineering In Partial Fulfillment of the Requirement for the award of the Degree of
MASTER IN ADVANCE ENGINEERING MANAGEMENT
DEPARTMENT OF INDUSTRIAL & PRODUCTION ENGINEERING
BANGLADESH UNIVERSITY OF ENGINEERING & TECHNOLOGY
DHAKA, BANGLADESH April 2016

The thesis titled Productivity improvement through line balancing & layout in an apparel industry to build up a reference model submitted by Mohammad Saidur Rahman, Student No. 0412082124, Session- April 2012, has been accepted as satisfactory in partial fulfillment of the requirement for the award of the degree of Master In Advance Engineering Management on
April 26, 2016.
BOARD OF EXAMINERS
1. Dr. Shuva Ghosh Chairman
Assistant Professor (Supervisor)
Department of Industrial & Production Engineering
BUET, Dhaka
2. Dr. Nikhil Ranjan Dhar Member
Professor
Department of Industrial & Production Engineering
BUET, Dhaka
3. Dr. Ferdous Sarwar Member
Assistant Professor
Department of Industrial & Production Engineering
BUET, Dhaka

This work is dedicated to my loving parents
Mohammad Abul Hossain &
Shahida Begum

ACKNOWLEDGEMENTS First of all, I have to readily acknowledge and thank to Allah, The Omnipotent and Omniscient who created everything and in giving me the ability to start and complete this project. I also wish to express my sincere appreciation to my supervisor, Dr. Shuva Ghosh, for his guidance, advices, motivation, and critics. Without his help and support, this thesis would not have been the same as presented here. I want to thank to my family, and all of my big family, for their affection, prayer, and support throughout my study. Without them, this work of mine will never be a success. Last but not least, I would also like to thank to the people of the garment industry who helped me from collecting data to all information. This study would not be complete without the support that was obtained from that company. Thank you for all the help and advice given.

ABSTRACT RMG industry sustains on customer satisfaction directly or indirectly. Customer
satisfaction comes from value added activities which mainly focus on low cost, quality & on time delivery. For confirming the value added activities, an industry must give concern to decrease the waiting time, process bottleneck and above all, increasing the productivity. Line balancing is an effective technique to improve the productivity. This technique is already applied in different industry and proved its effectiveness to improve the productivity.
In this work, line balancing is considered in an RMG industry at a sewing line as a sample project. At the begging of the project, existing data is collected through time study and then, analyze the data & find out the opportunity. Using the line balancing technique, production line refers to balance through the balance distribution of work among the workstations. In reference production line, productivity may possible to increase almost 38 %. Existing problems are identified and refer to solve considering the sequence of operation.
This research report provides guideline for the garments manufacturer to improve their industrial productivity and capacity by implementing the productivity improvement techniques like line balancing technique.

LIST OF ABBREVIATIONS
RMG : Ready Made Garments
GDP : Gross Domestic Product
IUH : Incremental Utilization Heuristic
KAIZEN : Continuous Improvement
PDM : Precedence Diagram Method
WIP : Work In Process

LIST OF FIGURES FIGURE TITLE PAGE 3.1 Methodology flow chart 07 4.1 Product picture 11 4.2 Process flow chart 12 4.3 Process capacity chart (Before) 15 4.4 Existing layout 16 4.5 Precedence Diagram 17 4.6 Proposed layout 22

LIST OF TABLES TABLE TITLE PAGE 4.1 Calculation before line balancing 14 4.2 Task precedence table 19 4.3 Task allocation table 21

CONTENTS
CHAPTER TITLE PAGE 1 INTRODUCTION 1 1.1 Introduction 1 1.2 Project background 1 1.3 Problem statement 2 1.4 Objective with specific aim & possible outcome 2 2 LITERATURE REVIEW 3 2.1 Introduction 3 2.2 Literature review 3 2.2.1 Productivity 4 2.2.2 Line balancing 5 2.2.3 Layout 6 3 METHODOLOGY 7 3.1 Introduction 7 3.2 Methodology flow chart 7 3.2.1 Company & product choosing 8 3.2.2 Data collection 8 3.2.3 Measuring method 8 3.2.4 Calculation 9 3.3.5 Create the reference model 10 4 DATA ANALYSIS & RESULT 11 4.1 Introduction 11 4.2 Data analysis & calculation 11 4.2.1 Before balancing the line 13 4.2.1.1 Existing layout 16 4.2.2 After balancing the line 17 4.2.2.1 Proposed layout 22 5 LIMITATION & CONCLUSION 23 5.1 Limitation 23 5.2 Conclusion 23
REFERENCE 24

Chapter-1 INTRODUCTION
1.1 Introduction
Every service or manufacturing based industry has a common goal to minimization of the input and maximization of the output. The relation between of those two factors is called productivity. One of the major causes of an industry’s decline is low productivity. Failure to meet targeted productivity can result to high costs per unit which making goods, services not competitive enough on the market. As a result, industry faces low quality, high cost and on time delivery problem. To remain competitive in the market, many industries try to implement strategies to make improvements in productivity levels. Actually productivity varies due to cross county and cross-regional differences, culture & knowledge. Getting the optimum productivity, a management gives concern on scientific management technique to measure man, machine or value utilization. Increment in productivity level reduces manufacturing cost. Industry can make more profit through productivity improvement. Productivity of Bangladesh industry worker is comparable low compare to others country due to the lack of using scientific tools & technique & proper management. This paper intends to improve the productivity of an apparel industry in Bangladesh by the use of line balancing.
1.2 Project Background
The RMG (Ready Made Garment) sector contributes around 76 percent to the total export earnings and contributes around 13 percent to the GDP, which was only around 3 percent in 1991. Of the estimated 4.2 million people employed in this sector, about 50 percent of them are women from rural areas. In 2000, the industry consisting of some 3000 factories employed directly more than 1.5 million workers of whom almost 80% were female. [1] McKinsey forecasts export-value growth of 7 to 9 percent annually within the next ten years, so the market will double by 2015 and nearly triple by 2020. [2]
To obtain the forecasts growth, each RMG industry must manage the production line very well & follow the cost effective strategy. Cost effective strategy mainly includes two key points: Cost reduction strategy & labor productivity improvement. Cost reduction strategy should begin with assigning the highest priority for establishing backward linkage. The establishment of backward linkages will reduce dependence on foreign sources which will reduce the total & average production cost of garments. This strategy will make products more competitive in the world’s RMG market. At the same time, labor productivity must be improved to keep place in the world largest competitive market.

In this case, a systematic technique or approach should be introduced. One of the techniques is line balancing technique. The used of line balancing technique was proved able to increase the productivity for the small medium enterprise. By using the line balancing technique, the production will increase because the arrangement of the line is corrected and the maximum productivity will be archive.
1.3 Problem Statement
In line production system, the product moves one workstation to another after completing individual process. Once it’s get stuck due to accumulation in certain workstation, it exceeds the cycle time in that station. Faster station is limited by slowest station. Thus, decreasing the rate of productivity & unbalance workloads due to starving, the workers need to wait the products to come.
1.4 Objectives with specific aims and possible outcome:
The objectives are expected in the end of the project:
o To minimize the idle time of men and machines.
o To group the tasks and worker in an efficient pattern in order to obtain an optimum line balance efficiency and productivity.

Chapter-2 LITERATURE REVIEW
2.1 Introduction
This chapter is to explore and gathered all information’s in order to understand clearly about line balancing. The information’s is come from reference books, journals and thesis. These sections are mainly concern about related knowledge about Line Balancing what are the efficiency & productivity after balance the line. Ready Made Garments (RMG) industries becoming the selected area then the scope is narrow down from manually assembly line through down until last part is productivity. In the first part of the Literature Reviews, study and analysis of previous work and other part is regarding the explanation of line balancing, productivity & layout. This particular area is discussed to give better understanding on what is purpose of this research.
2.2 Literature Review
Rezaul et al. studied an apparel industry and referenced an effective layout model where to hit upon the bottleneck process through benchmark capacity and led them to use balancing process using two separate concept of manufacturing processes- modular line and Traditional system both together. The research shows that this balanced layout model has increased the efficiency by 21%, and labor productivity by 22% [3]. Daniel et al. developed a simulation model that visualize the existing production process of basic polo-shirt in manual-operations oriented system so as to identify the bottlenecks and enhance system performance and developed different alternatives (scenarios) so as to improve existing labor utilization rate. Therefore, by adding three effective work centers the productivity of the line is increased from 349 to 692 pieces of finished polo-shirts. This means productivity is increased by two folds i.e. the productivity per operator is increased from 12 pieces to 19 pieces per operator per shift.[4] Robert W McClure studied at one Pulse Engineering’s transformer manufacturing facilities in Mexico, the factory was straining to meet its delivery schedule because of large backlog. After line balancing, he achieved a 47 increase with fewer workers.
Nakajima et al. have proposed a simple calculating method to determine the number of workstations and cycle time. This calculating method is simple and intelligible but has not been attended to the said feature of apparel assembly line, i.e. machine type. This also has some disadvantage such as excess time required for moving operator between machines, necessity of multi-skilled operators, requiring more number of machine and thereupon further space. However, beside these disadvantage, developing a new method which could consider the machinery feature in balancing apparel assembly line is strongly required.[6] Latter, F Khosravi et al. have proposed a improve model based on Nakajima model for apparel assembly line

balancing to take into consideration the machine type assigned to each workstation. By this improvement, proposed model was need less workers and less workstation [7]
V. P.Jaganathan worked to solve the assembly line balancing with different labour skill levels to reduce in-process inventory and workload smoothing in the workstations of sewing. After applying the rule of largest candidate heuristic, the Production time of the garment has been reduced from 5.18 to 3.90 minutes. Operators have been reduced to 8 from 16. Assembly line efficiency has been increased from 59.5% to 85.5 %. Productivity per hour has been increased by 25 % through assembly line balancing. [8] In another work, U.C Ubani studied and developed the precedence diagram and determined the balance efficiency, balance lost and other performance measures associated with line balancing in the design of product layout for automobile assembling. The study employed the method of Incremental Utilization Heuristic (IUH) in balancing the assembly line and determining other performance measures. He shows that line balance efficiency can possible to reach up to 96.88 % through the Incremental Utilization Heuristic. [9] 2.2.1 Productivity
Productivity can be defined as “OUTPUT” compared to “INPUT”. It is quantitative relationship between what we produce and what we have spent to produce. Productivity is nothing but reduction in wastage of resources like men, material, machine, time, space, capital etc. It can be expressed as human efforts to produce more and more with less and less inputs of resources so that there will be maximum distribution of benefits among maximum number of people. According to Marsh, Brush (2002) in his article Journal of industrial technology, productivity is a measure of the efficiency and effectiveness to which organizational resources (inputs) are utilized for the creation of products and/or services (outputs). [10] In case of garment manufacturing factory, “output” can be measured the number of products manufactured, whilst “input” is the people, machinery and factory resources required to create those products within a given time frame. The key to cost effective improvements in output – in “productivity” – is to ensure that the relationship between input and output is properly balanced. The proper utilization of line balancing technique can be created a dramatic effect for improving the productivity. For example, there is little to be gained from an increase in output if it comes only as a result of a major increase in input. Indeed, in an ideal situation, “input” should be controlled and minimized whilst “output” is maximized. There have different ways of measuring the productivity but mostly used are labour productivity, Machine Productivity and Value productivity.

2.2.2 Line Balancing
In RMG industry, the most critical section is sewing section where a set of workstations are assigned for a specific task to process according to a specific sequence. Usually, one or more tasks are assigned to a workstations and several consecutive workstations form as sewing line. Therefore, the aim of line balancing in sewing line is to assign tasks to workstations can perform the assigned tasks with a balance loading. [7] Balance loading means to balance the number & sequence of operations and manpower. Line Balancing means balancing the production line, or any assembly line. The main objective of line balancing is to distribute the task evenly over the work station so that idle time of man of machine can be minimized. Lime balancing aims at grouping the facilities or workers in an efficient pattern in order to obtain an optimum or most efficient balance of the capacities and flows of the production or assembly processes. Line balancing is the technique of assigning the operations to workstations in such a way that the assignment be optimal in some sense. Ever since Henry Ford’s introduction of assembly lines, LB has been an optimization problem of significant industrial importance: the efficiency difference between an optimal and a sub-optimal assignment can yield economies (or waste) [11]
Time Study: The processing time exists simply because the process requires tasks and motion. To put it in a different way, the working method and the number of work components are closely related to the net processing time. The time study begins by measuring the number of seconds required to lift, operation and place. It then proceeds to make improvements based on the time values and ends by defining the differences in the time values caused by the individual differences of the workers. The Industrial Engineering Terminology Standard defines time study as "a work measurement technique consisting of careful time measurement of the task with a time measuring instrument, adjusted for any observed variance from normal effort or pace and to allow adequate time for such items as foreign elements, unavoidable or machine delays, rest to overcome fatigue, and personal needs. [12]
Precedence Diagram: PDM is a visual representation technique that depicts the activities involved in a project. Precedence Diagrams are also known as Project Network Diagrams. In this article, both terms are used interchangeably. [13]
PDM using for following help
The visual representation makes it easier to communicate the flow of project execution or the project activity flow
There is a greater chance for team to identify missing activities.
Each activity is dependent on some other activity. When a dependency is not identified, the project will be delayed until such a time that identification occurs

Certain activities have a greater impact on project schedule than others. By using PDMs, can possible to determine the activities critical to the project schedule
Takt Time: Takt time is the average time between the start of production of one unit and the start of production of the next unit, when these production starts are set to match the rate of customer demand. [14] Assuming a product is made one unit at a time at a constant rate during the net available work time, the takt time is the amount of time that must elapse between two consecutive unit completions in order to meet the demand.
2.2.3 Layout
Sewing work is carried out manually, greatly depending on manpower. This means that a difference in motoin levels of operators will directly affect the time value.Work result vary depending of presence/absence of waste time, work speed and degree of consistency. Layout can be improved through maintaing this bellow issues:
The distance by which the goods (Products) move shall be minimized The distance by which the goods worker move shall be minimized The distance by which the information is distributed shall be minimized. Machine shall be laid out so that the progress of work can be visually checked at a glance The layout of machines shall be flexible to accept a slight change in specifications.

CHAPTER-3 METHODOLOGY
3.1 Introduction
In order to achieve the objectives and goal of the project, the methodology flow chart has been planned and designed. The main objective to do the methodology flow chart is to be a guideline and direction to make sure the project run smoothly and successfully. In this project many of method will be used such as calculate the Standard processing time, Line Balance efficiency and productivity also. Latter, will use a PDM diagram or Precedence Diagram Method for showing the precedence of tasks.
3.2 Methodology Flowchart
To make sure the project will run smoothly, the methodology flowchart was created. The following step is the method that will be used in this project. The step was:
Figure 3.1 Methodology Flowchart
Start
Select a company and product to be
Make a little research of the company and
Collect the data of layout, Process and Process time through Time Study
Total Number of manpower involved for production
Analysis the data & Calculate the line balancing Efficiency and productivity
Draw a pitch diagram to find out the bottle neck process
Make a reference model after balancing the line and rearranging the layout according the process
End

3.2.1 Company & product choosing
Make a little research of the product of the company and the process that involve to make a product because in the company that has many assembly line so that this research is to make sure that the choosing of the assembly line is correct place and correct time to apply the line balancing technique.
3.2.2 Data collection
To understand the production capacity, line balance efficiency, total process time, productivity and for design the optimum production system, process time is required. The processing time exists simply because the process requires tasks and motion. To put in a different way, the number of work components is closely related to the net processing time. The time study begins by measuring the number of seconds required to lift, sew and place.
Number of workers also must being identified to know where the place or machine that needed the worker. Total time and time collecting also will be observed and recorded. Total time is the amount of time that the assembly line finishes all task work in all workstation to make one product. Time collecting is the amount of time used to complete the task by one workstation.
3.2.3 Measuring Method
Continuous time Observation: Continue making observations without stopping the hand on the stop watch. Then, read and record the value pointed to by the hand when the work is stopped. Upon completion of all the work components, subtract the value recorded at the start of each work component from the value recorded at the end of each work component so as to obtain the time required for each work component. Measuring procedure can be describe with bellow steps:
i. Calculate the individual time
ii. Don’t calculate the individual time for a work component in which an irregular movement was observed.
iii. Calculate the average individual time value.
iv. Now collect the values of all the process and calculate the total net processing time.
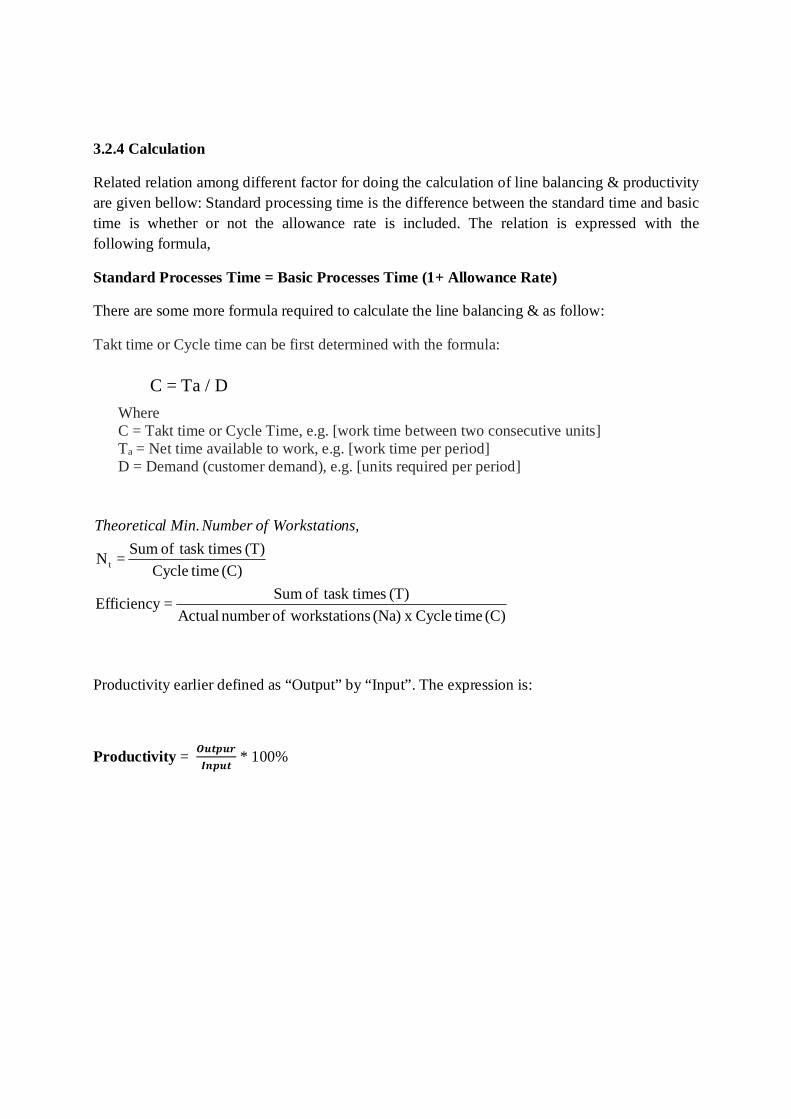
3.2.4 Calculation
Related relation among different factor for doing the calculation of line balancing & productivity are given bellow: Standard processing time is the difference between the standard time and basic time is whether or not the allowance rate is included. The relation is expressed with the following formula,
Standard Processes Time = Basic Processes Time (1+ Allowance Rate)
There are some more formula required to calculate the line balancing & as follow:
Takt time or Cycle time can be first determined with the formula:
C = Ta / D Where C = Takt time or Cycle Time, e.g. [work time between two consecutive units] Ta = Net time available to work, e.g. [work time per period] D = Demand (customer demand), e.g. [units required per period]
(C) timeCycle(T) s task timeof Sum =N t
ns,Workstatio of Number Min.lTheoretica
(C) timeCycle x (Na) ons workstatiofnumber Actual(T) s task timeof Sum=Efficiency
Productivity earlier defined as “Output” by “Input”. The expression is:
Productivity =
* 100%

3.2.5 Create the reference model
For building the reference model, Line balancing and layout improvement is very essential to make the production flow almost smoother compare to previous layout and work allotment. There are several rules for allocation of tasks among workstations as bellows:
o Largest number of following tasks rule
o Longest task time heuristic rule
o Incremental utilization heuristic
Our primary rule is to prioritize task based on the length number of following tasks. If there is a tie, our secondary rules is to prioritize tasks in the order of the longest task time.

CHAPTER-4 DATA ANLAYSIS & RESULT
4.1 Introduction:
The analysis of data and information gathered led to significant improvement carried out in line balancing. Comparison result before and after technique implementation was extensively reviewed. This data analysis chapter is constructed with coordination of some steps as data collection through time study, analysis the data through graphical representation; show the existing layout and their shortcoming. Finally this chapter will show the existing line balance efficiency and productivity and later the increase efficiency & productivity of reference model after balancing the line.
4.2 Data analysis & Calculation
In this project, to analyze the structure of garment assembly processes, kids pant sewing line was considered. The first step performed in this study was to understand kids pant sewing processes’ components and sewing line problems. The objective was to have a clear idea on how a kid pant production-sewing process line flows and then, how the line can be balanced as well as the performance of production line can be increased. In the production of kids pant, there is sequence of phases namely:
1. Bow making
2. Front Part
3. Back Part
4. Waist band panel
5. Waist band
6. Assembly Fig. 4.1 : Product picture
Process Flow
Business dictionary define the process analysis as a step by step breakdown of the phases of a process, used to convey the inputs, outputs and operations that take place during each phase. A process analysis can be used to improve understanding of how the process operates and to determine potential targets for the process improvement through removing waste

Fig. 4.2: Process Flow chart

4.2.1 Before balancing the line:
Therefore to calculate the approximate real process time of a task, 5 measurements were taken for each task and operator working on the line. Time study was performed along the line by chronometer. Each operation was measured in seconds and recorded.
Time study sheet is showing the different types of processes and machine used, number of operators and helpers, basic and standard pitch time and capacity per hour

S/N Operation Name
TYPE
OF
MA
CH
INE
AV
G. O
PEA
RA
TIO
N
TIM
E (s
ec.)
OPE
RA
TIO
N T
IME
(SA
M) I
nclu
de 2
0 %
A
llow
ance CAPACI
TY/OP/HR
Allo
cate
d O
pera
tor
Allocated time for Each
Operator (SAM)
A BowA01 Decorate Bow S/N 14 0.28 214.3 1 0.28A02 Cut Bow extra Edge H/W 10 0.2 300 1 0.2B Front part
B01 Sew Front Rise O/L 12 0.24 250 1 0.24B02 Trim Thread H/W 10 0.2 300 1 0.2B03 Mark Dart on Pocket H/W 15 0.3 200 1 0.3B04 Sew Dart S/N 25 0.5 120 2 0.25B05 Trim Thread H/W 26 0.52 115.4 2 0.26B06 Attach Pocket Bag with Pocket O/L 12 0.24 250 1 0.24B07 Trim Thread H/W 11 0.22 272.8 1 0.22B08 Topstitch pocket Mouth S/N 20.9 0.418333 143.5 2 0.209166667B09 Trim Thread H/W 11.5 0.23 260.9 2 0.115B10 Close Pocket Bag O/L 13 0.26 230.8 1 0.26B11 Trim Thread H/W 12 0.24 250 1 0.24B12 Tack pocket Bag top with Body S/N 8 0.16 375 1 0.16B13 Trim Thread H/W 7 0.14 428.6 1 0.14B14 Tack Pocket Bag side with Body S/N 13 0.26 230.8 1 0.26B15 Trim Thread H/W 8 0.16 375 1 0.16C Back Part
C01 Sew Back Rise O/L 12 0.24 250 1 0.24C02 Trim Thread H/W 10 0.2 300 1 0.2D Waist Band
D01 Tack waist band Panel & Elastic S/N 21 0.42 142.9 1 0.42D02 Trim Thread H/W 9 0.18 333.4 1 0.18D03 Roll Waist Band S/N 23 0.46 130.5 2 0.23D04 Trim Thread H/W 10.5 0.21 285.8 2 0.105D05 Topstitch Waist Band KANSAI 12 0.24 250 1 0.24D06 Trim Thread H/W 11 0.22 272.8 2 0.11D07 Mark Waist Band H/W 13.1 0.263333 227.9 2 0.131666667E Elastic
E01 Cut Waist Elastic H/W 7 0.14 428.6 1 0.14E02 Joint Elastic Corner S/N 9 0.18 333.4 1 0.18E03 Mark Elastic H/W 11 0.22 272.8 1 0.22F Waistband panel
F01 Tack Waist Band Panel Corner S/N 11 0.22 272.8 2 0.11F02 Trim Thread H/W 6.9 0.138333 433.8 2 0.069166667G Assembly
G01 Sew Side O/L 15 0.3 200 1 0.3G02 Trim Thread H/W 11 0.22 272.8 1 0.22G03 Sew Inseam O/L 9 0.18 333.4 1 0.18G04 Trim Thread H/W 7 0.14 428.6 1 0.14G05 Join Waist Band O/L 16 0.32 187.5 1 0.32G06 Trim Thread H/W 13 0.26 230.8 1 0.26G07 Sew label at Waist Band S/N 14 0.28 214.3 1 0.28G08 Trim Thread H/W 12 0.24 250 1 0.24G09 Topstitch Waist Band S/N 15 0.3 200 1 0.3G10 Trim Thread H/W 12 0.24 250 1 0.24G11 Sew Leg Hem F/L 18 0.36 166.7 1 0.36G12 Trim Thread H/W 9 0.18 333.4 1 0.18G13 Attach Bow on Front S/N 19.2 0.385 155.9 2 0.1925G14 Trim Thread H/W 13 0.26 230.8 2 0.13
Table 4.1: Calculation before line balancing
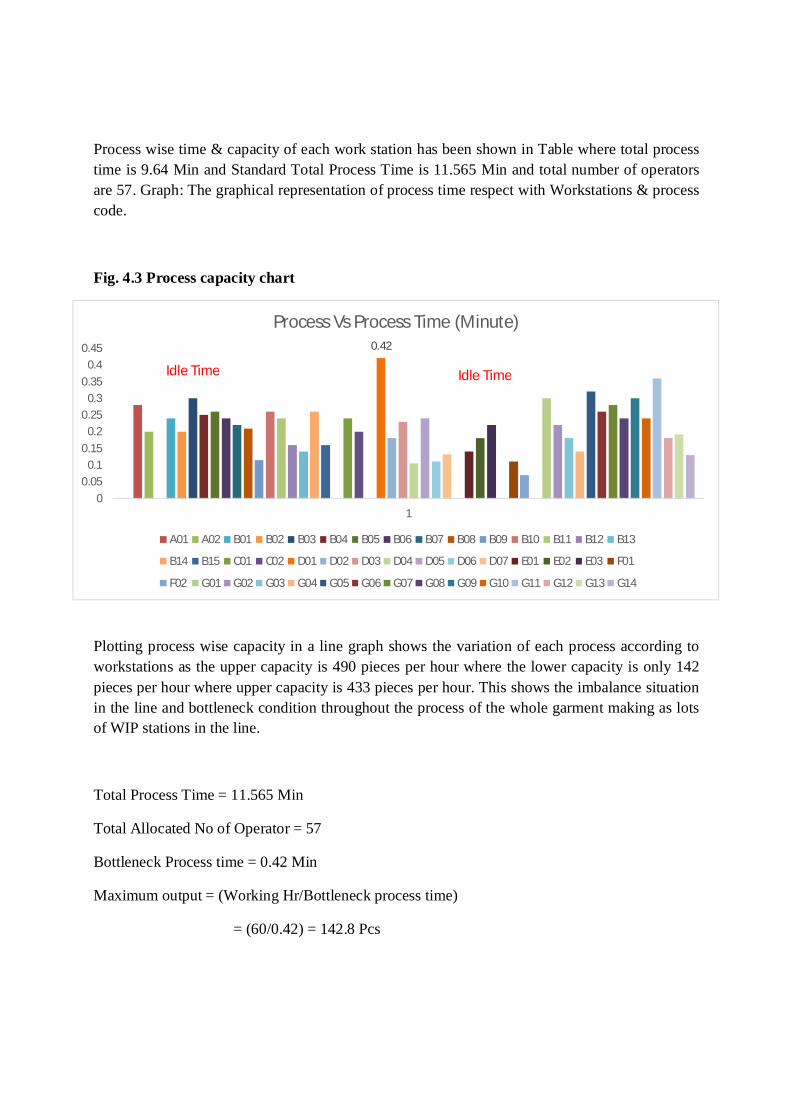
Process wise time & capacity of each work station has been shown in Table where total process time is 9.64 Min and Standard Total Process Time is 11.565 Min and total number of operators are 57. Graph: The graphical representation of process time respect with Workstations & process code.
Fig. 4.3 Process capacity chart
Plotting process wise capacity in a line graph shows the variation of each process according to workstations as the upper capacity is 490 pieces per hour where the lower capacity is only 142 pieces per hour where upper capacity is 433 pieces per hour. This shows the imbalance situation in the line and bottleneck condition throughout the process of the whole garment making as lots of WIP stations in the line.
Total Process Time = 11.565 Min
Total Allocated No of Operator = 57
Bottleneck Process time = 0.42 Min
Maximum output = (Working Hr/Bottleneck process time)
= (60/0.42) = 142.8 Pcs
0.42
00.05
0.10.15
0.20.25
0.30.35
0.40.45
1
Process Vs Process Time (Minute)
A01 A02 B01 B02 B03 B04 B05 B06 B07 B08 B09 B10 B11 B12 B13
B14 B15 C01 C02 D01 D02 D03 D04 D05 D06 D07 E01 E02 E03 F01
F02 G01 G02 G03 G04 G05 G06 G07 G08 G09 G10 G11 G12 G13 G14
Idle Time Idle Time

Line Balance Efficiency = (Standard total Process Time * Output) /( No of Op. * Workhour)
= (1651.5 / 3420) * 100 %
= 48.2 %
Waiting Time = (57 Op * 60 Min) - (142.5 Pcs * 11.565 Min)
= 1772 Min/Hr
= 51.8 %
Productivity/Op = ்௧ ை௨௧௨௧்௧ ெ௪
= ଵସଶ.ହ ௦ହ ை
= 2.5 Pcs/Op
4.2.1.1 Existing Layout:
Layout means the arrangement of sequence of process. Existing layout is showing the garments flow condition where each section is marked with different collar. And it is clear that there have lot of jumping, back flow & long transportation. Waist band process is doing in the back side of the layout where as in assembly line also. This layout will affect badly the parts flow of garments for getting better productivity due to not following the process sequence.
Fig. 4.4: Existing Layout

4.2.2 After balancing the line
To review the actual production status, pay attention particularly of the task and line balance efficiency. If the operator who is in charge of the process just after the bottleneck process carries out his job at a normal speed, he will wait for the delivery of the work piece from the bottleneck process. Like this way, operator will waste resources and finally affect the productivity. For balancing line & productivity, i am going to follow the Precedence diagram with largest number of following task rule:
o Draw the precedence diagram according the operations (Tasks) breakdown
o Represent the task name, time & the precedence with a table
o Calculate the Target/Maximum output, Takt time
o Calculate the required number of workstations theoretically & allocate the task among workstations
o Calculate line efficiency, Waiting time & Productivity/Op.
Fig 4.5: Precedence Diagram
B01 B02 B15
C01 C02 G01
F01 F02
E02 E03 D01
E01 D07
G04
D02
G05
G06 G07
A02
G12 G13 G14
A01
...........
........
...........
...........

The precedence diagram clearly shows that some task cannot proceed without completing the before or precedent work. There have 2 types of work where one is dependent work & others is independent work. Independent works can possible to start any time whereas dependent work need to wait for finishing the previous work. Hear, B01 is independent work & B02 is dependent work. B15 work can possible to start only when the tasks B14 will complete. Same as previous one, B14 will start when only B13 will complete. But G01 will start only when B15 & C02 both are finished. Due to G01 is dependent on previous two tasks B15 & C02. Same like as, we can draw the precedence table until final task G14

S/N Operation Name
TYPE
OF
MAC
HIN
E
AVG
. OPE
ARAT
ION
TIM
E (se
c.)
OPE
RATI
ON
TIM
E (se
c.) In
clude
20
%
Allo
wanc
e
OPE
RATI
ON
TIM
E (S
AM) I
nclu
de 2
0 %
Al
lowa
nce
Prec
eden
ce T
ask
C Back PartC01 Sew Back Rise O/L 12 14.4 0.24C02 Trim Thread H/W 10 12 0.2 C01B Front part
B01 Sew Front Rise O/L 12 14.4 0.24B02 Trim Thread H/W 10 12 0.2 B01B03 Mark Dart on Pocket H/W 15 18 0.3 B02B04 Sew Dart S/N 25 30 0.5 B03B05 Trim Thread H/W 26 31.2 0.52 B04B06 Attach Pocket Bag with Pocket O/L 12 14.4 0.24 B05B07 Trim Thread H/W 11 13.2 0.22 B06B08 Topstitch pocket Mouth S/N 20.9 25.1 0.418333 B07B09 Trim Thread H/W 11.5 13.8 0.23 B08B10 Close Pocket Bag O/L 13 15.6 0.26 B09B11 Trim Thread H/W 12 14.4 0.24 B10B12 Tack pocket Bag top with Body S/N 8 9.6 0.16 B11B13 Trim Thread H/W 7 8.4 0.14 B12B14 Tack Pocket Bag side with Body S/N 13 15.6 0.26 B13B15 Trim Thread H/W 8 9.6 0.16 B14E Elastic
E01 Cut Waist Elastic H/W 7 8.4 0.14E02 Joint Elastic Corner S/N 9 10.8 0.18 E01E03 Mark Elastic H/W 11 13.2 0.22 E02F Waistband panel
F01 Tack Waist Band Panel Corner S/N 11 13.2 0.22F02 Trim Thread H/W 6.9 8.3 0.138333 F01A Bow
A01 Decorate Bow S/N 14 16.8 0.28A02 Cut Bow extra Edge H/W 10 12 0.2 A01D Waist Band
D01 Tack waist band Panel & Elastic S/N 21 25.2 0.42 E03,F02D02 Trim Thread H/W 9 10.8 0.18 D01D03 Roll Waist Band S/N 23 27.6 0.46 D02D04 Trim Thread H/W 10.5 12.6 0.21 D03D05 Topstitch Waist Band KANSAI 12 14.4 0.24 D04D06 Trim Thread H/W 11 13.2 0.22 D05D07 Mark Waist Band H/W 13.1 15.8 0.263333 D06G Assembly
G01 Sew Side O/L 15 18 0.3 C02,B15G02 Trim Thread H/W 11 13.2 0.22 GO1G03 Sew Inseam O/L 9 10.8 0.18 G02G04 Trim Thread H/W 7 8.4 0.14 G03G05 Join Waist Band O/L 16 19.2 0.32 G04,D07G06 Trim Thread H/W 13 15.6 0.26 G05G07 Sew label at Waist Band S/N 14 16.8 0.28 G06G08 Trim Thread H/W 12 14.4 0.24 G07G09 Topstitch Waist Band S/N 15 18 0.3 G08G10 Trim Thread H/W 12 14.4 0.24 G09G11 Sew Leg Hem F/L 18 21.6 0.36 G10G12 Trim Thread H/W 9 10.8 0.18 G11G13 Attach Bow on Front S/N 19.2 23.1 0.385 G11,A02G14 Trim Thread H/W 13 15.6 0.26 G13
Table 4.2: Task precedence Table

Total Process Time = 11.565 Min
Maximum Process time = 0.52 Min
Maximum output = (Working Hr/Maximum process time)
= (60/0.52) = 115.3 Pcs
Takt time = (Available time/Demand)
= (60/115.3) Min
= 0.52 Min
Theoretically Number of work stations required = (Standard total process time / Takt time)
= (11.565 / 0.52)
= 22.24 Workstation
= 23 Workstations
Now, we start out to assign task for work station 1, the eligible task are C01 & C02. Due to after assigning these 2 tasks, remaining time (Takt time –Allocated time, 0.52- 0.44) 0.08 Min cannot possible to assign for any other task which follow the precedence. Now move to B01 task, allocate this task for workstation 2 & remaining 0.28 Min is still remain idle. So as precedent, allocate B02 work for also workstations 2. Finally remaining time, 0.08 Min cannot possible to any other works. Latter, allocate some process like03,B04 & B05 cannot possible to allocate more than one task due to other tasks has limitation for the precedence rule. In the case of, B15, E01 & E02 max 3 tasks allocate for one workstation but remaining 0.04 min is unable to allocate for any other works. So following the rule of largest number of following task, total number of workstations required 30 practically. The difference of number of workstations between theoretical & practical is due to the limitation of equipment use varying on operations. So have to consider the types of operation & the types of machine using for operation.

S/N Operation Name
TYPE
OF
MA
CH
INE
AV
G. O
PEA
RA
TIO
N
TIM
E (s
ec.)
OPE
RA
TIO
N T
IME
(SA
M) I
nclu
de 2
0 %
A
llow
ance
Prec
eden
ce T
ask
Allo
cate
d T
ime
Wai
tting
Tim
e
Wor
ksta
tions
C Back PartC01 Sew Back Rise O/L 12 0.24C02 Trim Thread H/W 10 0.2 C01B Front part
B01 Sew Front Rise O/L 12 0.24B02 Trim Thread H/W 10 0.2 B01B03 Mark Dart on Pocket H/W 15 0.3 B02 0.3 0.32 1B04 Sew Dart S/N 25 0.5 B03 0.5 0.02 1B05 Trim Thread H/W 26 0.52 B04 0.52 0 1B06 Attach Pocket Bag with Pocket O/L 12 0.24 B05B07 Trim Thread H/W 11 0.22 B06B08 Topstitch pocket Mouth S/N 20.9 0.418333 B07 0.4183 0.1 1B09 Trim Thread H/W 11.5 0.23 B08B10 Close Pocket Bag O/L 13 0.26 B09B11 Trim Thread H/W 12 0.24 B10B12 Tack pocket Bag top with Body S/N 8 0.16 B11B13 Trim Thread H/W 7 0.14 B12B14 Tack Pocket Bag side with Body S/N 13 0.26 B13B15 Trim Thread H/W 8 0.16 B14E Elastic
E01 Cut Waist Elastic H/W 7 0.14E02 Joint Elastic Corner S/N 9 0.18 E01E03 Mark Elastic H/W 11 0.22 E02F Waistband panel
F01 Tack Waist Band Panel Corner S/N 11 0.22F02 Trim Thread H/W 6.9 0.138333 F01 0.138 0.382 1A Bow
A01 Decorate Bow S/N 14 0.28A02 Cut Bow extra Edge H/W 10 0.2 A01D Waist Band
D01 Tack waist band Panel & Elastic S/N 21 0.42 E03,F02 0.42 0.1 1D02 Trim Thread H/W 9 0.18 D01 0.18 0.34 1D03 Roll Waist Band S/N 23 0.46 D02 0.46 0.06 1D04 Trim Thread H/W 10.5 0.21 D03D05 Topstitch Waist Band KANSAI 12 0.24 D04D06 Trim Thread H/W 11 0.22 D05D07 Mark Waist Band H/W 13.1 0.263333 D06G Assembly
G01 Sew Side O/L 15 0.3 C02,B15G02 Trim Thread H/W 11 0.22 GO1G03 Sew Inseam O/L 9 0.18 G02G04 Trim Thread H/W 7 0.14 G03G05 Join Waist Band O/L 16 0.32 G04,D07 0.32 0.2 1G06 Trim Thread H/W 13 0.26 G05 0.26 0.26 1G07 Sew label at Waist Band S/N 14 0.28 G06G08 Trim Thread H/W 12 0.24 G07G09 Topstitch Waist Band S/N 15 0.3 G08 0.3 0.32 1G10 Trim Thread H/W 12 0.24 G09 0.24 0.28 1G11 Sew Leg Hem F/L 18 0.36 G10 0.36 0.16 1G12 Trim Thread H/W 9 0.18 G11 0.18 0.34 1G13 Attach Bow on Front S/N 19.2 0.385 G11,A02 0.385 0.135 1G14 Trim Thread H/W 13 0.26 G13 0.26 0.26 1
1
1
0.4
0.4
0.44
0.46
0.49
0.44
0.52
0.32
0.52
0.04
0.08
0.03
0.08
0
0.48
0.48
0.44
0.45
0.483
1
0.08 1
0.06 1
1
0.12
0.12
0.04 1
1
0.07 1
0.037 1
1
1
0.2 1
0 1
Table 4.3: Task allocation Table
Line Balance Efficiency = (Standard total Process Time * Output) /( No of Op. * Workhour)
= (1333.45 /1800) * 100 %
= 74.08 %
Waiting Time = (30 Op * 60 Min) - (115.3 Pcs * 11.565 Min)
= 466.55 Min/Hr
= 25.9 %
Productivity/Op = ்௧ ை௨௧௨௧்௧ ெ௪
= ଵଵହ.ଷ ௦ଷ ை
= 3.84 Pcs/Op
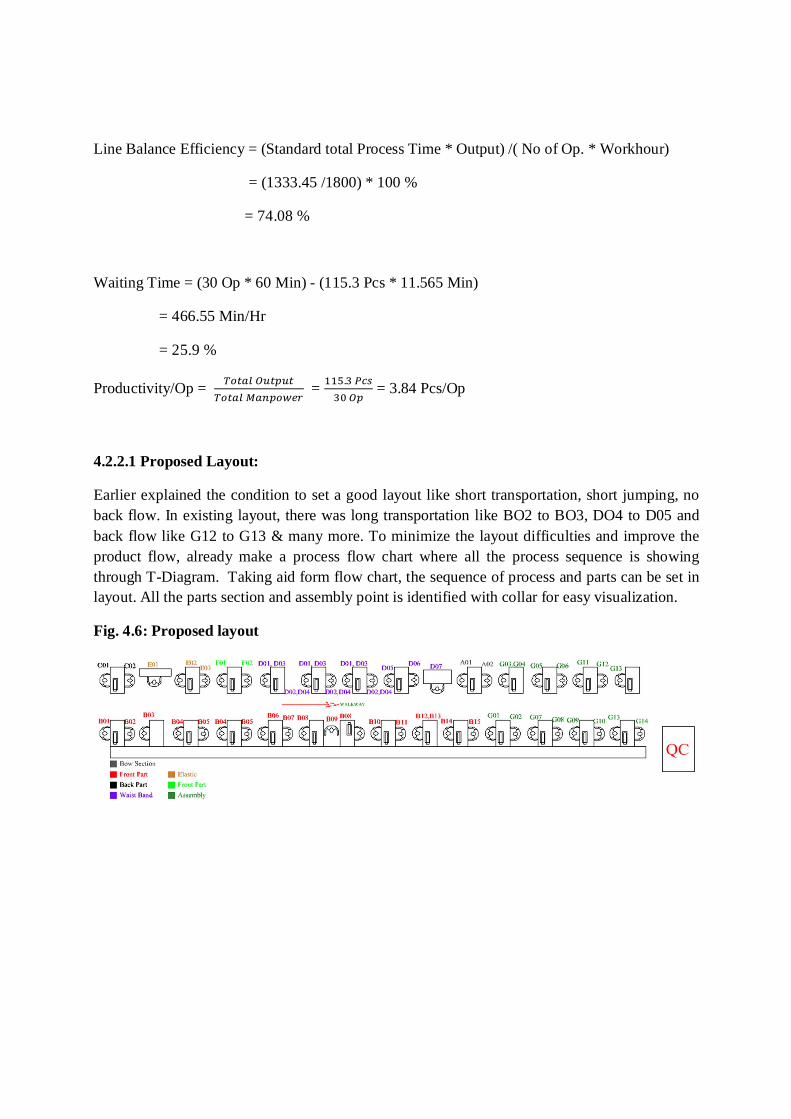
4.2.2.1 Proposed Layout:
Earlier explained the condition to set a good layout like short transportation, short jumping, no back flow. In existing layout, there was long transportation like BO2 to BO3, DO4 to D05 and back flow like G12 to G13 & many more. To minimize the layout difficulties and improve the product flow, already make a process flow chart where all the process sequence is showing through T-Diagram. Taking aid form flow chart, the sequence of process and parts can be set in layout. All the parts section and assembly point is identified with collar for easy visualization.
Fig. 4.6: Proposed layout

4.3 Results based on reference model
Changing from existing line balance to reference model, there are considerable improvements have been observed. Existing condition, total was 57 operators where line balance efficiency & productivity were accordingly 48.2 % & 2.5 pc/Op. Latter, it can be referred a reference model through precedent diagram with largest number of follower rules. Allocated all the operations targeting takt time among the workstations for getting desired output. The line balancing efficiency & productivity will stand accordingly 74.08 % & 3.84pc/hr. So it can be calculate from existing & reference model that the productivity can be increased 53.6 % after taking steps of line balancing & layout technique.
5.1 Limitation:
The research is studied on only one sewing line but have scope other lines also. So the research can be extended to the other lines of the industries also. Beside of these, also have other limitation as like bellow:
o This thesis referred a reference model but still not check, is it practical or not?
o Sewing line is only a part of an industry where have also a vast area for study & productivity improvement.
o The line balancing is made as per manual calculation and assuming allowance rate is 20% but practically it can be varied.
o At the time of balancing, it is not check whether skill level of operator is same or not. If there is a high skill gap between operators of the same cell it is difficult to balance and will reduce the efficiency.
5.2 Conclusion:
The objective of the study is to improve the productivity after balancing the sewing line & build a reference model. This reference model is manually stood up but it would be better to work with simulation software. Beside of this line balancing technique, also have other productivity improvement techniques for improving the productivity. However, this evaluation has given an image that the lack of line balancing is responsible for resources wastage. The observations gained from this research indicate some limitation for future work. Although some meaningful conclusion can be made with respect to the reference model builds in the study.

Reference:
[1] http://en.wikipedia.org/wiki/Bangladeshi_RMG_Sector
[2]http://www.mckinsey.com/insights/consumer_and_retail/bangladesh_the_next_hot_spot_in_apparel_sourcing
[3]Shumon Md. R H, Arif-UZ-Zaman K & Rahman A, Productivity improvement through line balancing in apparel industries, paper presented at the International Conference on International Engineering and Operations Management, Dhaka, Bangladesh, 9-10 January 2010
[4] Daniel Kitaw, Amare Matebu and Solomon Tadesse(Journal of EEA, Vol. 27, 2010)
][5] Chen J C, Hsaio M H, Chen C C & Sun C J, A Grouping Genetic algorithm for the Assembly Line Balancing Problem of Sewing Lines in Garment Industry ( Departement of Industrial and System Engineering, Chung Yuan Christian University, Chung Li, Taiwan), 2009
[6] Nakajima M, Uchiyama S & Miura Y, J Text Mach Soc Jpn, Transactions, 33 (4) (1980)22.
[7] F Khosravi, A H Sadeghi & F Jolai, An improvement in caldulation method for Apparel assembly line balancing, Indian Journal of Fibar & Textile Research, Vo. 38, September 2013, pp 259-264
[8] V. P.Jaganathan, LINE BALANCING USING LARGEST CANDIDATE RULEALGORITHM IN A GARMENT INDUSTRY: A CASE STUDY, International Journal of Lean thinking Volume 5 Issue 1 (December 1) [9] E.C Ubani, Application of assembly line balancing heuristics to designing product layout in motor manufacturing operation, INTERDISCIPLINARY JOURNAL OF CONTEMPORARY RESEARCH IN BUSINESS, Vol 3, No 10 Feb 2012 [10] http://www.onlineclothingstudy.com/2011/02/what-is-productivity.html
[11] http://www.optimaldesign.com/Download/OptiLine/FalkenauerPLM05.pdf
[12] IIE, ANSI 1982
[13] http://www.brighthubpm.com/project-planning/49580-overview-of-the-precedence-diagram-method-pdm/ [14] https://en.wikipedia.org/wiki/Takt_time