Embed Size (px)
Citation preview

The size of the European FM sector Evaluation of the Importance of the FS sector
Prof. Alexander Redlein / Eva Stopajnik IFM – Real Estate and Facility Management
Vienna University of Technology

Size of the FM industry
Facility Services are not presented as a separate industry in the classification of economic activities since 2008 (new structure).
The aim is to estimate the size of the FS industry in comparison to other industries in the European Union.

Methodology
The EN 15221-4:2011 was used to identify the services and industries that are relevant for Facility Services.
For the calculation of the size of the Facility Services industry data from Eurostat (official annual detailed enterprise statistics of the EU) was used.
The size of the industries is expressed as the value added at factor cost in percentage of the total value added at factor cost for the NACE sectors B-N and S95 for 2013.

Value added at factor cost
„Value added at factor cost is the gross income from operating activities after adjusting for operating subsidies and indirect taxes.”
“Alternatively, it can be calculated from the gross operating surplus by adding personnel cost.”
Source: Eurostat: Glossary:Value added at factor cost, online unter http://ec.europa.eu/eurostat/statistics-explained/index.php/Glossary:Value_added_at_factor_cost (17.5.2016)

Relevant industries
Construction and building activities
Facility Services (housing and business buildings) includes General Facility Services
Important industries for the operation of business and residential buildings
Typical Facility Services
Other relevant industries Relevant industries for building operation and also other areas, which cannot be assigned clearly
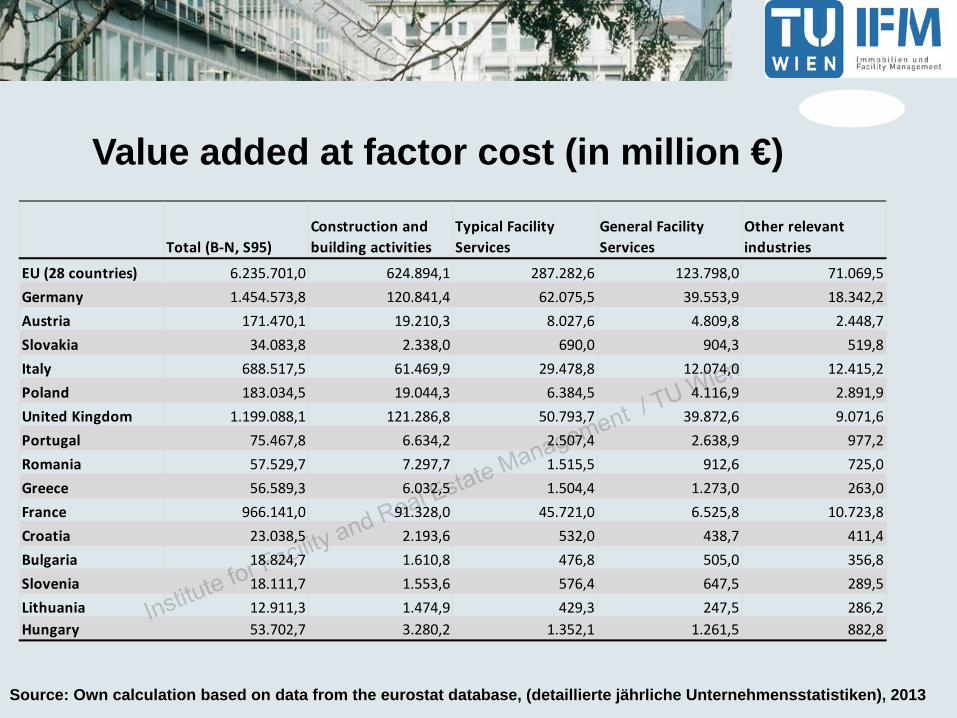
Value added at factor cost (in million €)
Source: Own calculation based on data from the eurostat database, (detaillierte jährliche Unternehmensstatistiken), 2013
Total (B-N, S95)Construction and building activities
Typical Facility Services
General Facility Services
Other relevant industries
EU (28 countries) 6.235.701,0 624.894,1 287.282,6 123.798,0 71.069,5Germany 1.454.573,8 120.841,4 62.075,5 39.553,9 18.342,2Austria 171.470,1 19.210,3 8.027,6 4.809,8 2.448,7Slovakia 34.083,8 2.338,0 690,0 904,3 519,8Italy 688.517,5 61.469,9 29.478,8 12.074,0 12.415,2Poland 183.034,5 19.044,3 6.384,5 4.116,9 2.891,9United Kingdom 1.199.088,1 121.286,8 50.793,7 39.872,6 9.071,6Portugal 75.467,8 6.634,2 2.507,4 2.638,9 977,2Romania 57.529,7 7.297,7 1.515,5 912,6 725,0Greece 56.589,3 6.032,5 1.504,4 1.273,0 263,0France 966.141,0 91.328,0 45.721,0 6.525,8 10.723,8Croatia 23.038,5 2.193,6 532,0 438,7 411,4Bulgaria 18.824,7 1.610,8 476,8 505,0 356,8Slovenia 18.111,7 1.553,6 576,4 647,5 289,5Lithuania 12.911,3 1.474,9 429,3 247,5 286,2Hungary 53.702,7 3.280,2 1.352,1 1.261,5 882,8

Facility Services and Construction
*expressed as a percentage of total value added of the NACE sectors B-N, S95, 2013 Source: Own calculation based on data from the eurostat database (detaillierte jährliche Unternehmensstatistiken)

FS compared to other sectors (1)
Only countries included that didn‘t show more than three missing values *expressed as a percentage of total value added at factor cost for the NACE sectors B-N, S95, 2013 Source: Own calculation based on data from the eurostat database (detaillierte jährliche Unternehmensstatistiken)
EU (2
8 co
untr
ies)
Germ
any
Aust
ria
Slov
akia
Italy
Pola
nd
Manufacturing 26% 34% 28% 29% 29% 30%Wholesale and retail trade; repair of motor vehicles 18% 17% 18% 16% 17% 18%Professional, scientific and technical activities 10% 9% 8% 6% 7% 5%Facility Services (housing and business buildings) 8% 8% 9% 6% 8% 7%Information and communication 8% 7% 5% 7% 7% 6%Transportation and storage 8% 7% 9% 7% 8% 7%Administrative and support service activities 7% 7% 6% 4% 5% 3%Construction 8% 6% 9% 4% 7% 8%Real estate activities 4% 5% 5% 7% 3% 2%Electricity, gas, steam and air conditioning supply 4% 3% 3% 6% 4% 7%Accommodation and food service activities 3% 2% 5% 1% 4% 1% compulsory social security 2% 2% 5%Water supply; sewerage, waste management and 2% 1% 1% 1% 2% 2%Mining and quarrying 1% 0% 1% 1% 1% 4%Central banking 0% 1%Repair of computers and personal and household 0% 0% 0% 0% 0% 0%Other monetary intermediation 5% 7% 6%

FS compared to other sectors (2)
Only countries included that didn‘t show more than three missing values *expressed as a percentage of total value added at factor cost for the NACE sectors B-N, S95, 2013 Source: Own calculation based on data from the eurostat database (detaillierte jährliche Unternehmensstatistiken)
Unite
d Ki
ngdo
m
Port
ugal
Rom
ania
Gree
ce
Fran
ce
Manufacturing 15% 22% 24% 18% 20%Wholesale and retail trade; repair of motor vehicles 14% 18% 16% 25% 18%Professional, scientific and technical activities 12% 6% 5% 8% 10%Facility Services (housing and business buildings) 8% 8% 5% 5% 7%Information and communication 9% 6% 7% 6% 8%Transportation and storage 7% 8% 7% 9% 8%Administrative and support service activities 9% 6% 4% 3% 7%Construction 8% 7% 10% 8% 9%Real estate activities 3% 2% 2% 1% 4%Electricity, gas, steam and air conditioning supply 2% 6% 8% 4% 3%Accommodation and food service activities 4% 4% 1% 5% 4%Insurance, reinsurance and pension funding, no compulsory social security 3% 3% 0% 1%Water supply; sewerage, waste management and remediation activities 2% 2% 2% 1% 1%Mining and quarrying 2% 1% 6% 1% 0%Central banking 0% 1% 3% 1%Repair of computers and personal and household goods 0% 0% 0% 0% 0%Other monetary intermediation 9% 8% 8% 8% 7%

FS compared to other sectors (3)
Only countries included that didn‘t show more than three missing values *expressed as a percentage of total value added at factor cost for the NACE sectors B-N, S95, 2013
Source: Own calculation based on data from the eurostat database (detaillierte jährliche Unternehmensstatistiken)
Croa
tia
Bulg
aria
Slov
enia
Lith
uani
a
Hung
ary
Manufacturing 20% 25% 35% 22% 35%Wholesale and retail trade; repair of motor vehicles 16% 21% 18% 24% 15%Professional, scientific and technical activities 8% 6% 8% 6% 6%Facility Services (housing and business buildings) 6% 7% 8% 7% 7%Information and communication 7% 9% 6% 6% 7%Transportation and storage 7% 9% 9% 14% 8%Administrative and support service activities 2% 3% 2% 4% 4%Construction 7% 6% 6% 8% 4%Real estate activities 2% 3% 1% 3% 3%Electricity, gas, steam and air conditioning supply 5% 9% 4% 5% 4%Accommodation and food service activities 6% 3% 3% 2% 1%Insurance, reinsurance and pension funding, no compulsory social security 7% 1% 1%Water supply; sewerage, waste management and remediation activities 2% 2% 2% 2% 2%Mining and quarrying 5% 4% 1% 1% 0%Central banking 1% 0% 0%Repair of computers and personal and household goods 0% 0% 0% 0% 0%Other monetary intermediation 6% 4% 2% 9%

Conclusio
The FS industry for all buildings is the 4th largest based on Value added at factor cost. The analysis only takes into consideration outsourced services. Large companies have outsourced most services according to demand study of IFM/Vienna University of Technology. SME still execute more services internally. They can be outsourced but not offshored.

Thank you for your attention!