Embed Size (px)
Citation preview

Linear and nonlinear fitting of isotherms and kinetics of adsorption
The misuse of linearization is probably the most common error in data analysis of adsorption studies. It was largely used some decades ago when computers and statistical software were not available. Presently, linearization in data analysis is on the increase because the authors usually employ the simplest tool to analyze their experimental data. One of the reasons for using linear equations is the possibility of performing less experimental points to define a line (that is the major problem of using nonlinear equations, which require more experimental points to define a curve) or alternatively, discard some points to increase the R² values. The main problem is that some points are discarded to increase the R² values, and the authors are not concerned about the values of the parameters of the equilibrium and kinetic of adsorption models.
2
There are problems associated with linearizing an inherently nonlinear
equation using various transformations. The main concern when
transforming data to obtain a linearized equation is the knowledge of
the error-structure of the data and how this structure is affected by the
mathematical manipulation of the data. The linearization is based on
the fact that the variance of all q values (Y variable of the graph;
dependent variable; amount of adsorbate adsorbed by the adsorbent) is
equal for all range of the data. By assuming homoscedasticity of the
data (assuming equal variance for all q values throughout the range of
the data) when it is actually heteroscedastic (the variance of all q
values are not equal in the full range of the data), may result in
overestimating the goodness of fit as measured by the correlation
coefficient (R), which translates into error in the coefficient of
determination and also in the adjusted coefficient of determination.
Therefore, higher R² values do not necessarily means better fit of the
experimental data.3
Linear and nonlinear fitting of isotherms and kinetics of adsorption

4
Low concentration
Higher uncertainty
Higher concentration
Lower standard error

5 5
Therefore for low concentrations of the adsorbate, the variance
of sorption capacity (q, Y axis) is not uniform for all values of
q measured during the experiments of na equilibrium isotherm
as well as an kinetic of adsorption.
Low concentration
High uncertainty( ).o fC C V
qm
-=

6
In practice, authors have to delete some points from
their curves to justify the linearization procedure. This
adjustment decreases the degree of freedom (DOF) of
the fitting model, which consequently decreases the
number of independent ways by which a dynamic
system can move without violating any constraint
imposed on it. The degree of freedom can be defined as
the minimum number of independent coordinates that
can specify the position of a system completely. In
order to make it clear to the readers, some case studies
will be discussed below.
Linear and nonlinear fitting of isotherms and kinetics of adsorption

7
Linear forms of Langmuir isotherm

8
The point qe=0 for Ce = 0 is disregarded in the linearized methods

9
ok
Deleted points
Increase R²

10
Deleted points
Increase R²

11
Deleted points Increase R²

12
Parameter value Parameter valueNonlinear Fig. 4.16 (a) Langmuir-1 Fig. 4.16 (b)Qmax (mg g
-1) 515.8 Qmax (mg g-1) 523.7
KL (L mg-1) 0.9966 KL (L mg
-1) 0.7252
Number of Points 14 Number of Points 13
Degrees of Freedom 12 Degrees of Freedom 11
Reduced Chi-Sqr (mg g-1) 84.13 Reduced Chi-Sqr (g L-1) 1.818.10-6
Res. Sum of Squ. (mg g-1)2 1009 Res. Sum of Squ. (g L-1)2 1.999.10-5
R (COC) 0.9981 R (COC) 0.9999
R² (COD) 0.9962 R² (COD) 0.9999R²Adj 0.9959 R²Adj 0.9999
SD (mg g-1) 9.172 SD (g L-1) 1.348.10-3

13
( )n 2
i, exp i, model
i
RSS= q -qå
( )2 2
adj
n-1R =1- 1-R .
n-p-1
öæ÷ç
è ø
( ) ( )( )
2 2n n
i ii,exp exp i, exp i, model22
n
i i,exp exp
q -q - q -qR =
q -q
öæ÷ç
ç ÷è ø
∑ ∑
∑
( )n 2
i, exp i, model
i
1SD= . q -q
n-p
öæåç ÷
è ø

14
Langmuir-4 Fig. 4.16 (g)
Langmuir-4 Fig. 4.16 (h)
Qmax (mg g-1) 515.4 Qmax (mg g
-1) 490.6
KL (L mg-1) 1.012 KL (L mg
-1) 1.206
Number of Points 13 Number of Points 6
Degrees of Freedom 11 Degrees of Freedom 4
Reduced Chi-Sqr (L g-1) 131.5 Reduced Chi-Sqr (L g-1) 61.17
Residual Sum of Squ. (L g-1)2 1446 Residual Sum of Squ. (L g-1)2 244.7
R (COC) 0.9905 R (COC) 0.9958
R² (COD) 0.9810 R² (COD) 0.9916
R²Adj 0.9793 R²Adj 0.9895
SD (L g-1) 11.47 SD (L g-1) 7.821
( )n 2
i, exp i, model
i
RSS= q -qå
( )2 2
adj
n-1R =1- 1-R .
n-p-1
öæ÷ç
è ø
( ) ( )( )
2 2n n
i ii,exp exp i, exp i, model22
n
i i,exp exp
q -q - q -qR =
q -q
öæ÷ç
ç ÷è ø
∑ ∑
∑
( )n
2
i, exp i, model
i
1SD= . q -q
n-p
öæåç ÷
è ø

15
After deleting some points to increase
The values of R²

16
Considering that KL values are very important equilibrium parameter for estimating equilibrium constants
(determination of thermodynamic parameters) the use of Langmuir-1 linearized isotherms could lead to erroneous
estimation of Gibb’s free energy change (ΔG°), enthalpy change (ΔH°) and entropy change (ΔS°) of adsorption.

17
Thermodynamics of Adsorption

T 25°C,
adsorbent: Avocado seed activated carbon
Adsorbate: 3 aminophenol;
Adsorbent dosage: 1.5 g L-1 18

19
T 25°C,
adsorbent: Avocado seed activated carbon
Adsorbate: 3 aminophenol;
Adsorbent dosage: 1.5 g L-1

20
T 30°C,
adsorbent: Avocado seed activated carbon
Adsorbate: 3 aminophenol;
Adsorbent dosage: 1.5 g L-1

21
T 35°C,
adsorbent: Avocado seed activated carbon
Adsorbate: 3 aminophenol;
Adsorbent dosage: 1.5 g L-1

22
T 40°C,
adsorbent: Avocado seed activated carbon
Adsorbate: 3 aminophenol;
Adsorbent dosage: 1.5 g L-1

23
T 45°C,
adsorbent: Avocado seed activated carbon
Adsorbate: 3 aminophenol;
Adsorbent dosage: 1.5 g L-1

24
T 50°C,
adsorbent: Avocado seed activated carbon
Adsorbate: 3 aminophenol;
Adsorbent dosage: 1.5 g L-1

25
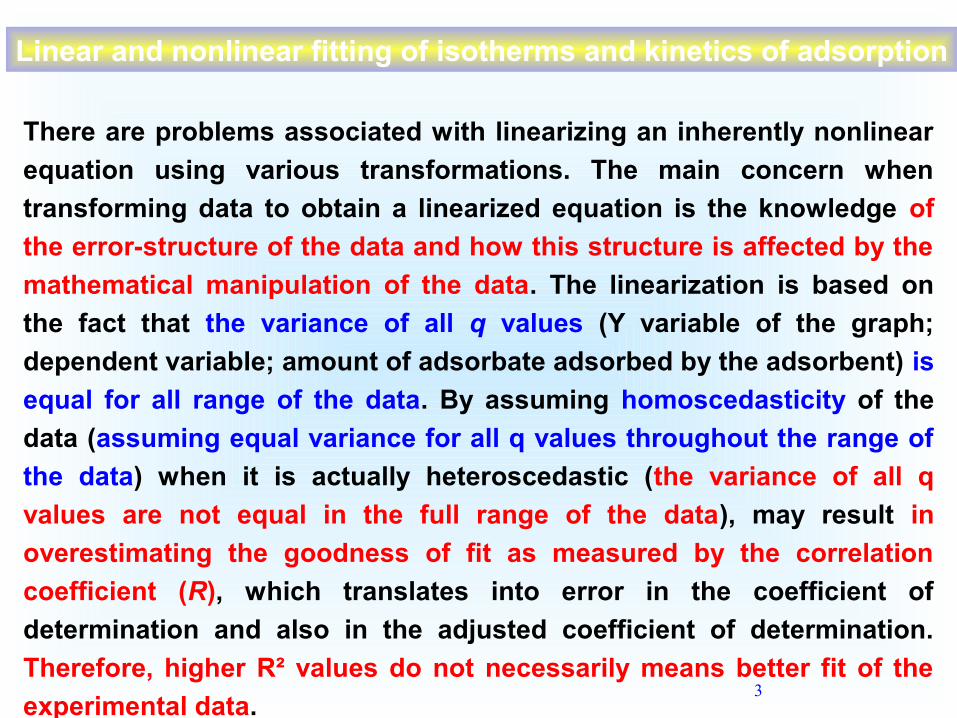
Even applying Ln to the ratio (Co-Ce)/Co this is not linearized
Therefore at low Ce concentrations, it is possible to obtain a
“Supposed” value of Kequilibrium

26
term multiplied by in order to the ratio become
dimensionless
e
e
q mThe was
C V

27The “supposed equilibrium constant” has not a fixed value

28
For Ce=0 it was
Made an interpolation
In the fitted curve

29

30
Kg- is the best equilibrium constant obtained from isotherms (L/mg)
Activity coefficient is assumed to be 1.000
Unitary activity of adsorbate 1 mol/L

31

32

33
Values of changes of enthalpy and changes of
Entropy compatible with Physical adsorption
Values of Ke obtained from
Nonlinear fitting of isotherms
Considering the best isotherm
Model that was fitted by the ex
perimental results
Liu isotherm model
34
Values of changes of enthalpy and changes of
Entropy not compatible with Physical adsorption

35
Values of changes of enthalpy and changes of
Entropy not compatible with Physical adsorption

36
Other Common error found throughout the Adsorption papers
Mathematically RL always will be < 1
Unless KL or Co is negative. However, initial concentration
Could not be negative, as well as the Langmuir equilibrium
Constant also, could not be negative.
1
1 .L
L OR
K C=
+

37
There is no sense of using this equation to affirm that the
Adsorption is favorable
LL O
1R
1 K .C=
+

38
Double arrow for chemical equilibrium
Arrow for resonance
Do not use these arrows
For chemical equilibrium

39
Number of Points 17Degrees of Freedom 15Reduced Chi-Sqr 0.00119286907145Resid. Sum of Sq. 0.0178930360717R Value 0.999371827709R-Square(COD) 0.998744050019Adj. R-Square 0.99866032002SD 0.0345379366993 g min/mg
Number of Points 18Degrees of Freedom 16Reduced Chi-Sqr 0.703173999134Residual Sum of Squares 11.2507839861R Value 0.999747333076R-Square(COD) 0.999494729992Adj. R-Square 0.999463150616SD 0.838554708492 mg/g
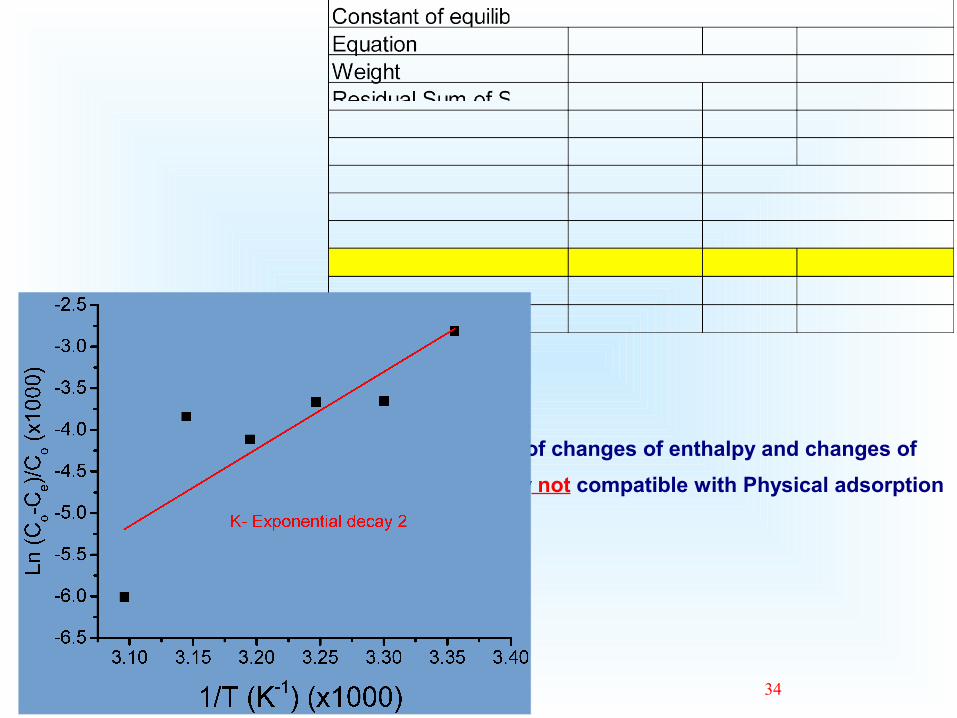
Using linearized kinetic models the kinetics follow pseudo-second order
Using nonlinearized kinetic models, the pseudo-first model is the best choice

40
If one will use linearized kinetic of adsorption; you do not
Need to do it, “All linearized kinetic adsorption models will
Better fit to pseudo-second-order kinetic model”. “You even
do not need to plot your results, because this is the only kinetic
adsorption model that is linearized”.
2
1 1= +
´t e e
tt
q k q q

41
Pseudo-first order and pseudo-second-order kinetic adsorption models

42
Dados de Cinética de adsorçãoDados experimentais Dados manipulados
43

44

45

46
•
•
Table 3.10. Relative differences of qe and k1 or k2 kinetic parameters of
linearized pseudo-first order, linearized pseudo-second order-1, linearized
pseudo-second order-2, pseudo-second order-3 and pseudo-second order-4
in relation to nonlinear pseudo-first order and nonlinear pseudo-second order equations. Values are expressed in percentage.
ln ln= - akinetic
Ek A
RT
•

4747
Number of Points 17Degrees of Freedom 15Reduced Chi-Sqr 0.00119286907145Resid. Sum of Sq. 0.0178930360717R Value 0.999371827709R-Square(COD) 0.998744050019Adj. R-Square 0.99866032002SD 0.0345379366993 g min/mg
Number of Points 18Degrees of Freedom 16Reduced Chi-Sqr 0.703173999134Residual Sum of Squares 11.2507839861R Value 0.999747333076R-Square(COD) 0.999494729992Adj. R-Square 0.999463150616SD 0.838554708492 mg/g
Using linearized kinetic models the kinetics follow pseudo-second order
Using nonlinearized kinetic models, the pseudo-first model is the best choice

48 48
If one will use linearized kinetic of adsorption; you do not
Need to do it, “All linearized kinetic adsorption models will
Better fit to pseudo-second-order kinetic model”. “You even
do not need to plot your results, because this is the only kinetic
adsorption model that is linearized”.
2
1 1= +
´t e e
tt
q k q q

49
If the kinetic data follow the pseudo-second order, the
Mechanism of adsorption will be chemisorption
2
1 1= +
´t e e
tt
q k q q

50
Majority of adsorption process are physio-sorption and not
Chemisorption.
Chemisorpton would the complexation of metallic ions by ligands
Organic molecules will predominate – physical adsorption.
If you do not agree, provide a XPS, proving that an chemical
Bond was formed, after the adsorption of organic molecule
Over the surface of an adsorbent.

51
Kinetic adsorption models are not absolute, the mechanism
of adsorption should be verified by several and different
Analytical techniques.

52

53
E.C. Lima, M.A. Adebayo, F. M. Machado, Chapter 3- Kinetic and Equilibrium Models of Adsorption in Carbon Nanomaterials as Adsorbents for Environmental and Biological Applications, C.P. Bergmann, F.M. Machado editors, ISBN 978-3-319-18874-4, Springer 2015, pp.33-69. DOI 10.1007/978-3-319-18875-1_3.
Link for the Chapter 3 as well as Physical Chemistry Book.
goo.gl/dhYbs3

54

55
Thank you for your special attention