Embed Size (px)
Citation preview
Professionals read graphs 1
(In press)
Journal for Research in Mathematics Education
Professionals Read Graphs: A Semiotic Analysis
Wolff-Michael RothUniversity of Victoria
G. Michael BowenUniversity of Victoria
All correspondence concerning this paper should be addressed to Wolff-Michael Roth,Lansdowne Professor, Applied Cognitive Science, MacLaurin Building A548, University ofVictoria, Victoria, BC, Canada V8W 3N4.
E-mail: [email protected]. Tel: 1-250-721-7885. FAX: 1-250-721-7767
Abstract
Graph-related practices are central to scientific endeavors and graphing has long been hailed asone of the core “general process skills” that set scientists apart. One research question that hasnot received much attention is, “Are scientists generally competent readers of graphs, or aregraphs indissolubly tied to practices and understandings of their everyday workplace?” Thisstudy was designed to better understand the reading and interpretation of familiar and unfamiliargraphs by (mostly) scientists. From an extensive database on graphing involving universitystudents to professionals, we selected two case studies and interpret them within a theoreticalframework grounded in semiotics and hermeneutic phenomenology. The first case study providesa detailed analysis in which a scientist wrestles and in part inappropriately interprets anunfamiliar graph used in undergraduate ecology courses; the difficulties of the scientist includesome of those identified among students in the graphing literature. The second case studyprovides an example of the transparent use of graphs in the work of a water technician who is notonly familiar with her graphs, but who has an intimate, embodied knowledge of the world towhich the graph refers. When it comes to reasoning, scientists are often taken as experts againstwhich the performance of other individuals (“novices”) are judged (as inferior). If scientists’ owngraphing practices are not general but tied to their embodied understanding, then the teaching ofdecontextualized graphing skills loses its legitimacy. Our results therefore have considerableimplications to mathematics education.
Professionals read graphs 2
Introduction
Cartesian graphs are central to the representation of the world in the natural sciences. Arecent analysis showed that there were more than 420 Cartesian graphs in 2,500 pages of fivetop-ranked ecology research journals (Roth, Bowen, & McGinn, 1999). Much of theethnographic work in scientific laboratories conducted over the past two decades suggests thatnot only are graphs used to construct phenomena, but they also serve as an existence proof of thephenomena and, as thus, are employed as rhetorical means in scientific publications (Latour,1987). Graphs are central to the constructive effort of scientists in establishing just what is seenin and evidenced by the unfolding pattern of a graph (Garfinkel, Lynch, & Livingston, 1981;Latour, 1993; Woolgar, 1990). Most importantly, in the natural sciences, graphs (as othermathematical representations) are used in a transparent way such that an isomorphism of thetype “fundamental structure <—> mathematical structure” is presupposed (Lynch, 1991).
It therefore comes as no surprise that graph-related activities take an important place inrecent reform efforts in mathematics and science education. Relative to the interpretation ofexisting graphs for the mathematics classroom in Grades 5 - 8, the Curriculum and EvaluationStandards (NCTM, 1989) state that students should be able to:
• describe and represent relationships with tables, graphs, and rules; (p. 98)
• construct, read, and interpret tables, charts, and graphs; (p. 105)
• analyze tables and graphs to identify properties and relationships. (p. 102)
In the past, most research took a cognitive psychological perspective which identifiedproblems in students’ reading and interpreting graphs, and attributed these problems to“misconceptions” (e.g., Leinhardt, Zaslavsky, & Stein, 1990), “cognitive deficits” (e.g., Berg &Philips, 1994), and other more generic “deficiencies” (e.g., Preece & Janvier, 1992). More recenttheoretical work on graphing, however, suggests that a sociocultural orientation toward graphingas practice avoids the deficit approach to students’ graphing-related actions (Roth, 1996; Roth &McGinn, 1997, 1998). This approach has become even more convincing and necessary as a recentstudy among scientists shows. When scientists are not familiar with a graph, even if this graph isfrom introductory textbooks of their own discipline (ecology), they frequently do not arrive atthe collectively-accepted standard interpretation (Roth, 1998). Some of the breakdowns theyencounter while reading graphs (and captions) are of the same type that have been identifiedamong middle and high school students. However, because of their extensive training (M.Sc.,Ph.D.), experience (minimum of 5 years independent research), and career-related success (manyhave received national and international fellowships, grants, and awards), it would be difficult toaccept that these scientists hold “misconceptions,” have “cognitive deficits,” or suffer from other“deficiencies.” Here, to understand these problems, we take the notion of graphing as practicefurther. By fusing semiotics and hermeneutic phenomenology, we account both for individualaspects of reading graphs and for the social matrix within which each individual operates. That is,our framework allows us to link mathematical (graph-related) experience with experience in theworld.
Professionals read graphs 3
The purpose of the present article is to exemplify two ways in which scientists engaged withgraphs; we present these types of engagement by drawing on two detailed case studies: onefeatures a scientist who struggles with the interpretation of an unfamiliar graph ( produced for usin the somewhat artificial situation associated with such research); the other features a watertechnician who reads familiar graphs in a transparent way as part of her ongoing work whichincluded raising public awareness for water issues. Based on the case studies and the underlyingtheoretical framework, we consider the implications for changing graphing-related activities inschool mathematics (and science).
Prior Research
The activity of reading graphs has traditionally been framed as “interpretation” which istaken to be the “action by which a student makes sense or gains meaning from a graph (or portionof a graph)” (Leinhardt et al., 1990, p. 8). These authors further suggest that depending on thereferent of a graph, interpretation locates meaning in some naturalistic situation or in the samemathematical space. The movement required by an interpretation into a different modality ofrepresentation has been termed a “translation” (Janvier, 1987; Kaput, 1987). While from thephenomenological and semiotic perspectives taken here all reading involves interpretation andtranslation, we are most interested in translations that involve the relationships of graphs andsituations, and, necessitated by the activities we observed, those between graphs and othergraphs. It is important to keep in mind that the situations to which the graphs referforexample, the density dependence of birth rateare themselves embedded in other situations, inthis case the lifeworld of an ecologist or a psychological laboratory. In a study of mathematicalpractices in a grade 8 science class we showed that this second kind of situation codetermines thelevel to which a graph can be considered as “contextual” (Roth, 1996).
In previous research, much attention was focused on situations involving moving objects andtherefore graphs in which position (distance), velocity (speed), and acceleration are plottedversus time (Berg & Philips, 1994; Clement, 1989; Mokros & Tinker, 1987; Nemirovsky,Tierney, & Wright, 1997; Roth, 1993; Roth, Tobin, & Shaw, 1997). Other tasks which havefigured much less prominently include heat and temperature (e.g., Linn, Layman, & Nachmias,1987), interaction of biological and physical variables (Preece & Janvier, 1992; Roth, 1996), andinteraction of biological variables (Bowen, Roth, & McGinn, 1999; Roth & Bowen, 1999a). Inthe present study, we focus on graphs that are used in the domain of ecology and therefore relateto situations (although some scientists related these graphs also to other graphs), and displayrelationships and interactions including biological and physical variables.
Relative to translations between graphs and situations, a review of the literature (Leinhardt etal., 1990) identified two major difficulties students experience: slope/height confusions and iconicinterpretation. The first type of difficulty arises when students are asked about the relative speedof two objects in the context of a graph that displays distance-time information. Rather thanidentifying the relative speed (from the slopes of the curves), most students compare the relativeheights of the two curves (often lines) presented. Iconic interpretations include all those errorswhere students inappropriately relate a topological feature in the situation (e.g., a curve on a race
Professionals read graphs 4
track) and a similar topological feature in the corresponding representation (e.g., a bend in a linegraph). In the context of the theoretical framework underlying the present study, both types ofdifficulties are to be expected and were in fact observed even among scientists when they dealwith graphs that, though from their own domain, were (relatively) unfamiliar.
As a result of previous studies, we suggested that (a) Cartesian graphs establish virtualspaces and traces (Roth, Bowen, & McGinn, 1999) and (b) that to interpret graphs means tobuild rich situational descriptions from reductionist and transformed mathematicalrepresentations (Roth, 1996). Thus, there are two fundamental difficulties presented to theinterpreting individual. First, because graphs, as other sign forms, have arbitrary but conventionalrelations to the things they represent their content cannot be elaborated without knowing theseconventions. (In this article, we remain consistent with the historical development of semioticsand use the word “sign,” although in the mathematics education literature “symbol” has also beenused to denote the same objects [e.g., Kaput, 1987].) Second, because graphs contain littlecircumstantial information (Preece & Janvier, 1992), building a description of a situation fromwhich the graph might have come is a task inherently underdetermined by what information isimmediately available in the graph. As a result of our research among scientists, we developed asemiotic model of reading graphs (Roth, 1998).
Semiotic Model
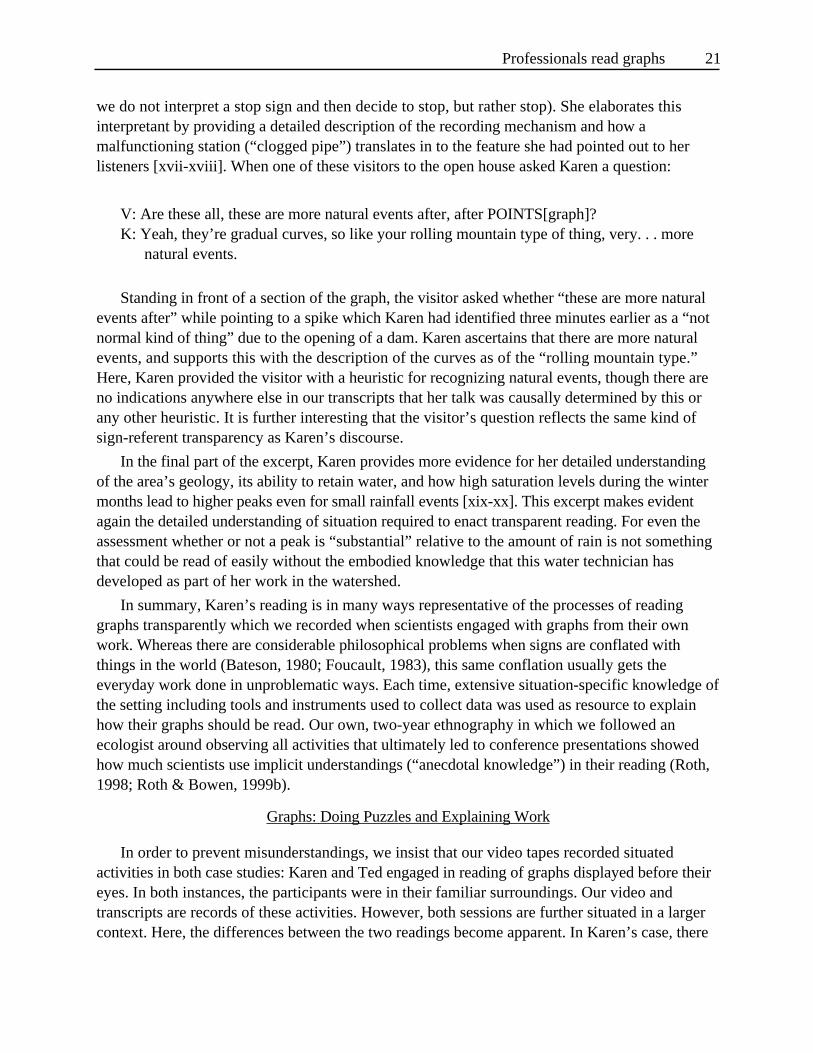
Our research is based on the semiotic premise that graphs and their written or spokensubtexts are multimodal texts (Bertin, 1983; Eco, 1984; Lemke, 1998; Saint-Martin, 1990). Each
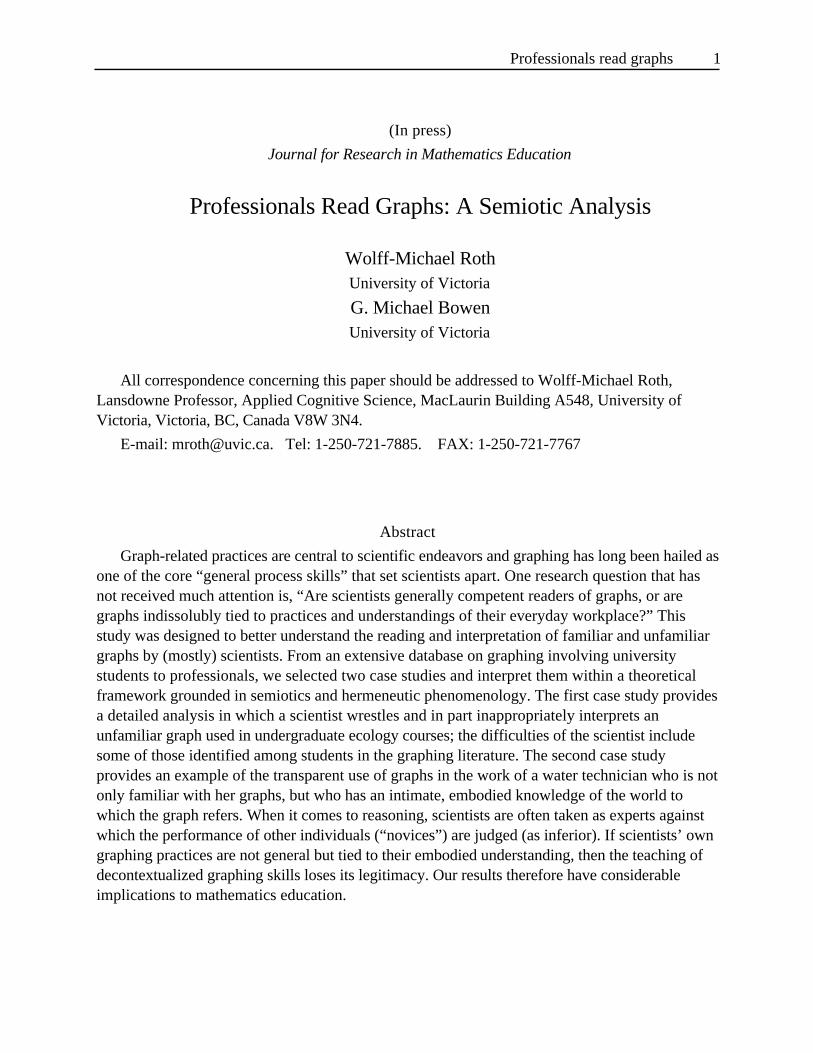
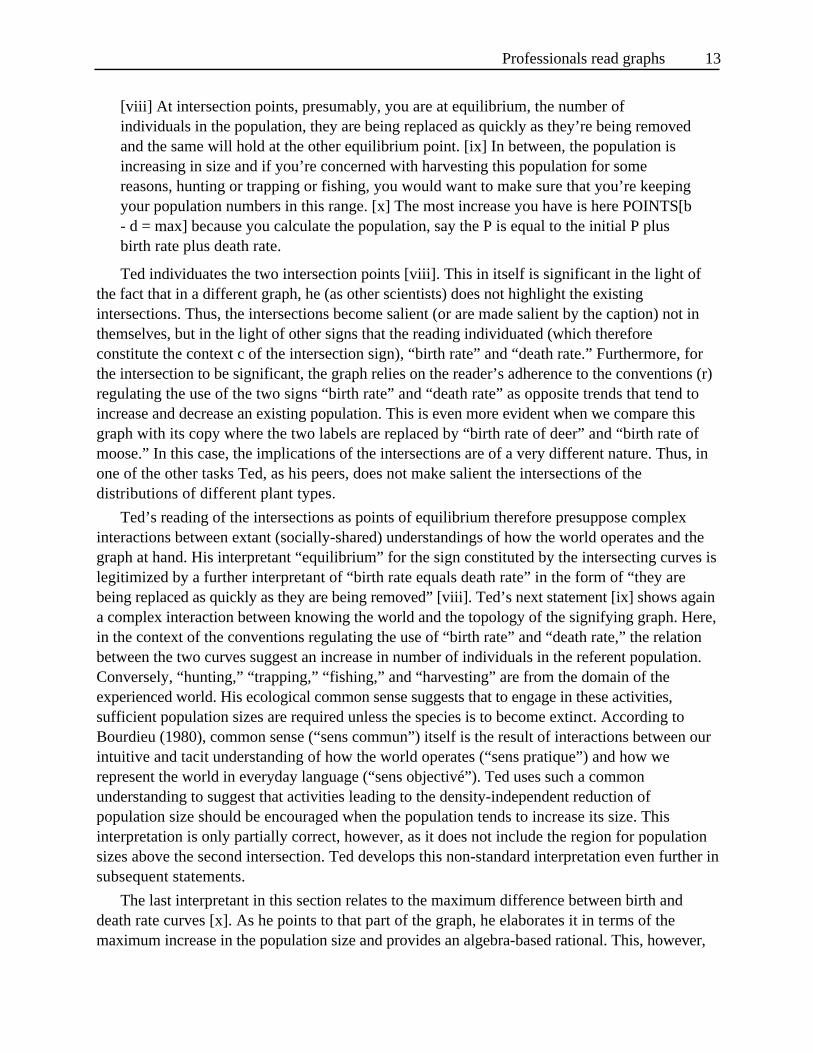
Figure 1. Two stage, semiotic process of graph reading. On the upper left hand side,the perceptual analysis S’ carves possible sign objects I’ from the text R’. The output ofthis process then become the signs S which point to, or are grounded in, a possible worldR as described by the interpretant I (lower right hand side). The interpretants I areconstrained by a sign’s context c and conventional constraints r on sign use.
Professionals read graphs 5
text is constituted by matrix of sign elements; both individual sign elements and entire texts aresubject to the semiotic efforts of those who read them (Eco, 1976; Ricœur, 1991). Our model ofreading graphs contains two component activities of each obtaining a dialectic nature: structuringand grounding (Figure 1). In structuring, the reader carves the graph and subtext to constructrelevant signs; here, readers use known graphs and texts to constrain and elaborate perceptual andattentional processes. In grounding, readers link these (resultant) signs to material objects or othersigns; here, familiar objects and sign systems readers constrain and elaborate the sign itself.Reading itself, and therefore the two component processes, is situated in the sense that it isnormally part and contextualized by other activities in which a person engages. We begin ourdiscussion of the model with the grounding process because it is that part normally considered inthe literature on graphing.
Grounding
Our model of grounding is based on the relationship between a sign S, referent R, andinterpretant I. A sign, is one (material) entity that refers to and stands for another. A referent isan entity or state in the world to which the sign refers to and stands for. An interpretant isanother sign that stands for or elaborates the relation of sign to referent. (According to theHandbook of Semiotics [Nöth, 1990], there are many models of sign use. Our version makes useof a triadic relationship that was developed independently in structurally equivalent form byFrege [1892], Richards and Ogden [1923], and Peirce [1931].) For example, in the population
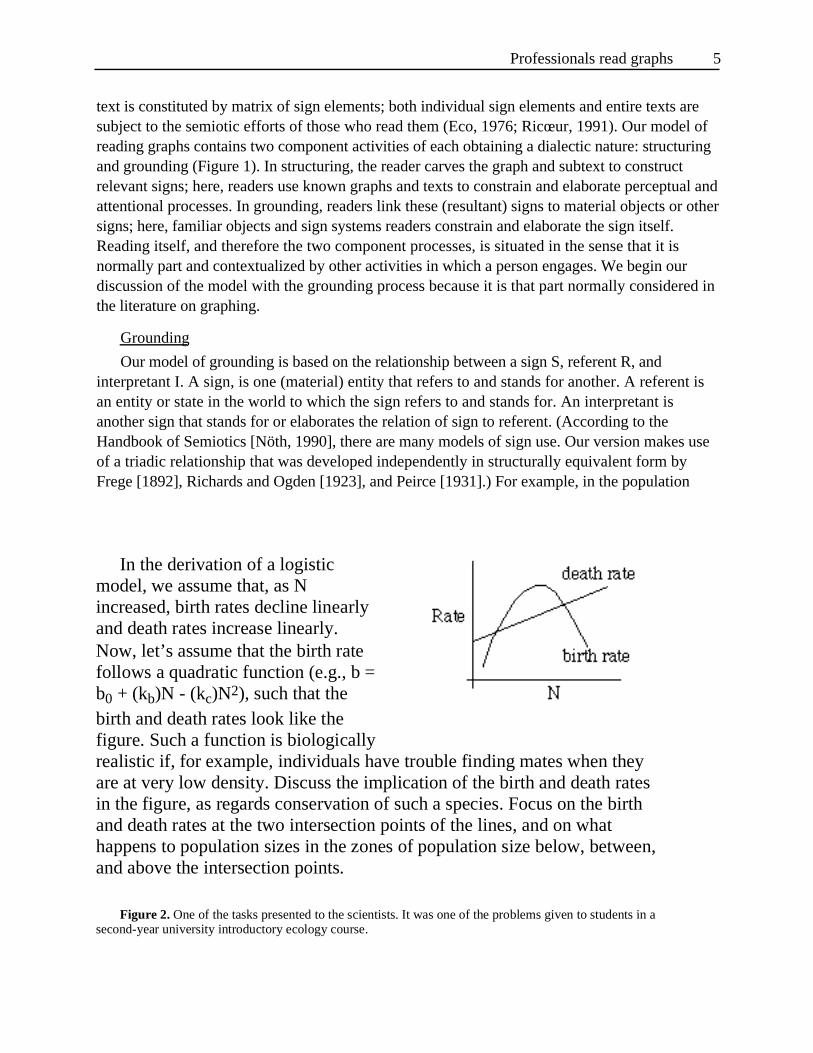
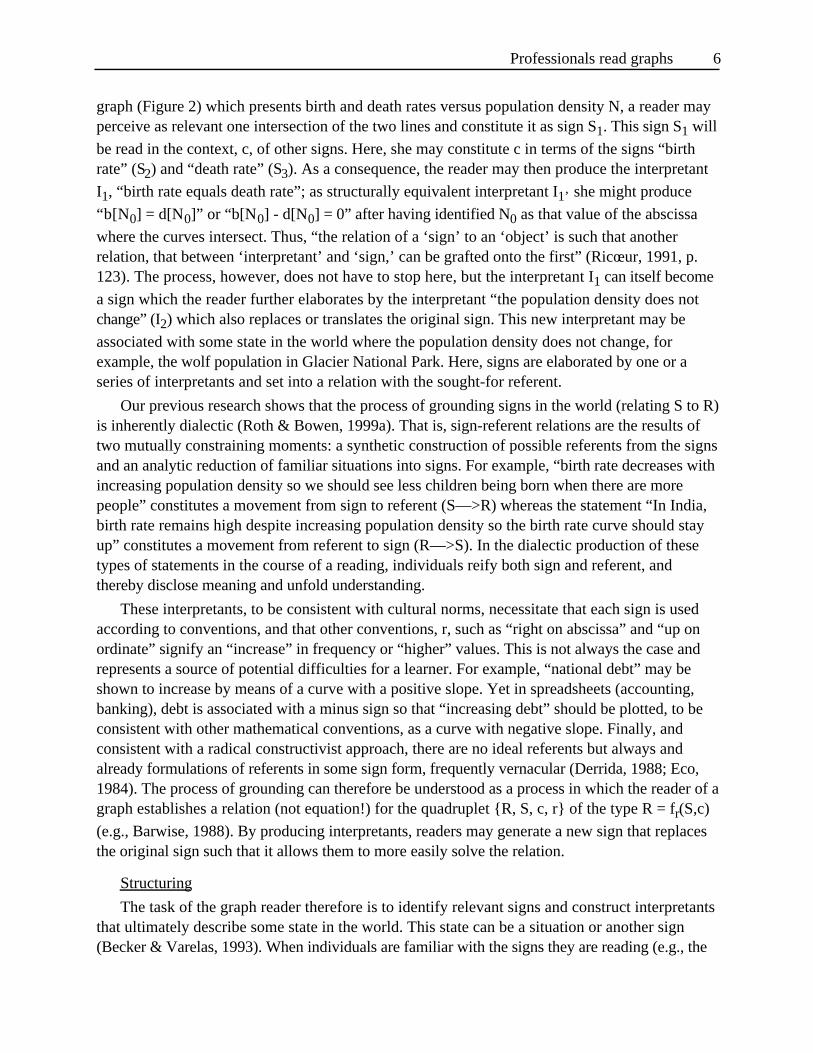
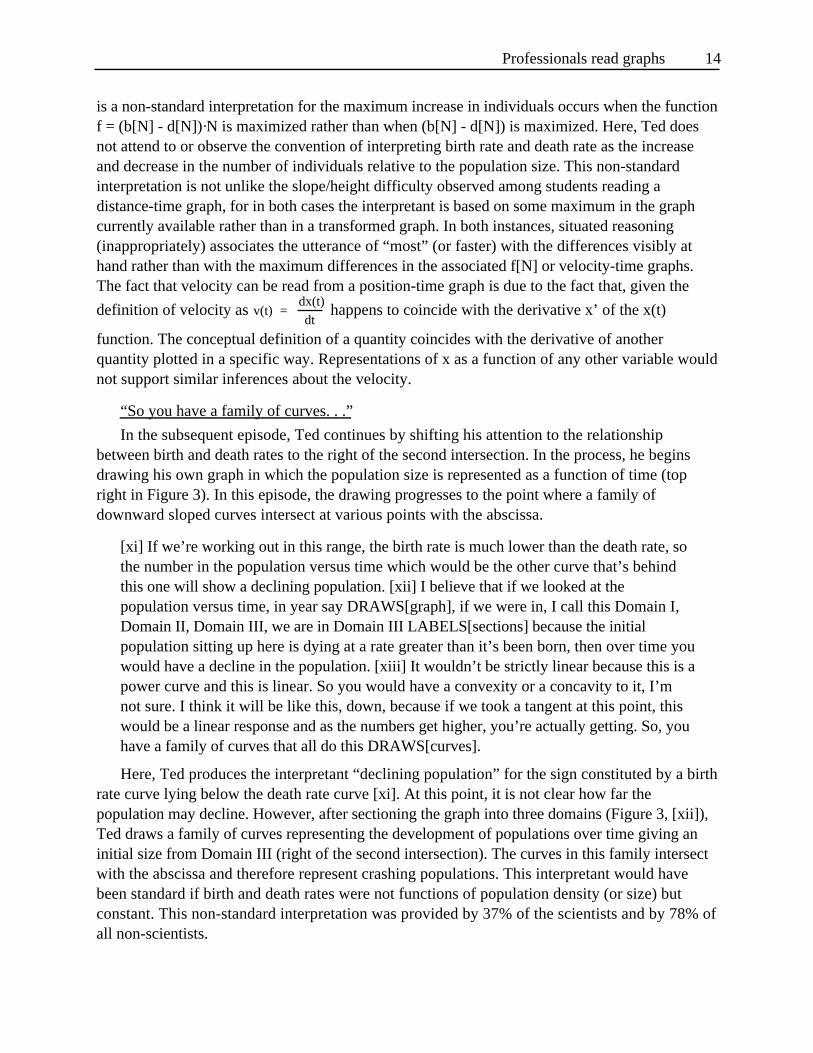
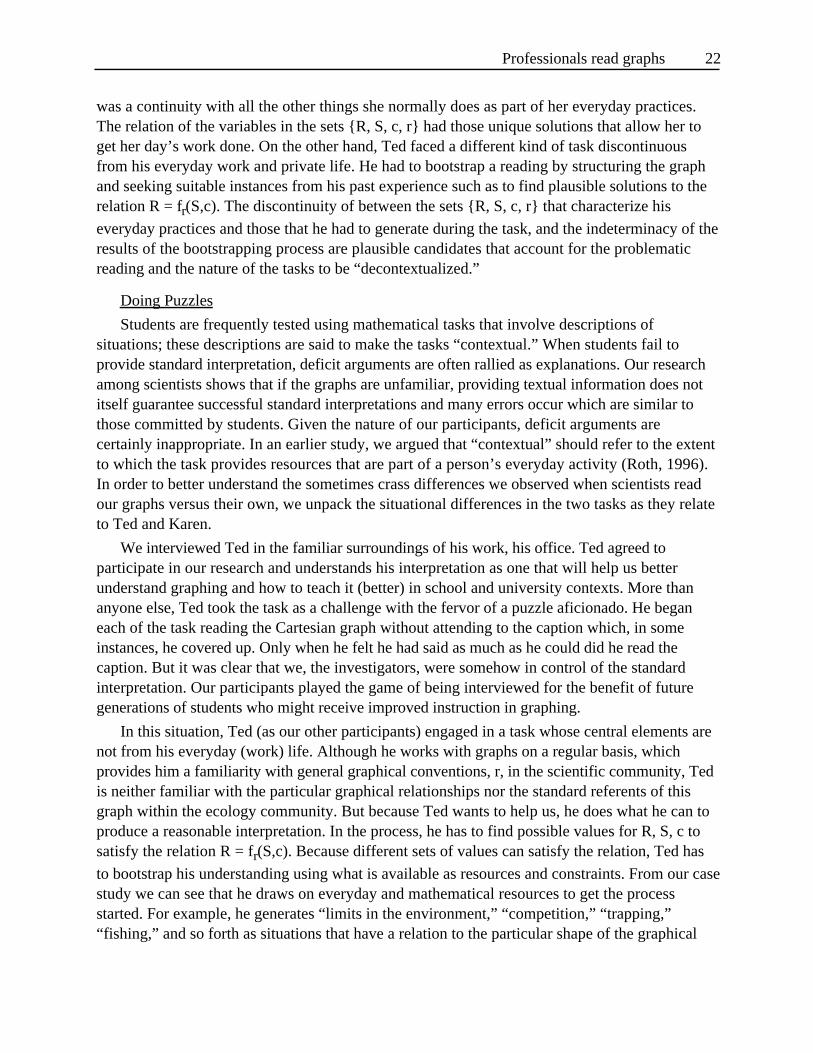
In the derivation of a logisticmodel, we assume that, as Nincreased, birth rates decline linearlyand death rates increase linearly.Now, let’s assume that the birth ratefollows a quadratic function (e.g., b =b0 + (kb)N - (kc)N2), such that thebirth and death rates look like thefigure. Such a function is biologicallyrealistic if, for example, individuals have trouble finding mates when theyare at very low density. Discuss the implication of the birth and death ratesin the figure, as regards conservation of such a species. Focus on the birthand death rates at the two intersection points of the lines, and on whathappens to population sizes in the zones of population size below, between,and above the intersection points.
Figure 2. One of the tasks presented to the scientists. It was one of the problems given to students in asecond-year university introductory ecology course.
Professionals read graphs 6
graph (Figure 2) which presents birth and death rates versus population density N, a reader mayperceive as relevant one intersection of the two lines and constitute it as sign S1. This sign S1 willbe read in the context, c, of other signs. Here, she may constitute c in terms of the signs “birthrate” (S2) and “death rate” (S3). As a consequence, the reader may then produce the interpretantI1, “birth rate equals death rate”; as structurally equivalent interpretant I1’ she might produce“b[N0] = d[N0]” or “b[N0] - d[N0] = 0” after having identified N0 as that value of the abscissawhere the curves intersect. Thus, “the relation of a ‘sign’ to an ‘object’ is such that anotherrelation, that between ‘interpretant’ and ‘sign,’ can be grafted onto the first” (Ricœur, 1991, p.123). The process, however, does not have to stop here, but the interpretant I1 can itself becomea sign which the reader further elaborates by the interpretant “the population density does notchange” (I2) which also replaces or translates the original sign. This new interpretant may beassociated with some state in the world where the population density does not change, forexample, the wolf population in Glacier National Park. Here, signs are elaborated by one or aseries of interpretants and set into a relation with the sought-for referent.
Our previous research shows that the process of grounding signs in the world (relating S to R)is inherently dialectic (Roth & Bowen, 1999a). That is, sign-referent relations are the results oftwo mutually constraining moments: a synthetic construction of possible referents from the signsand an analytic reduction of familiar situations into signs. For example, “birth rate decreases withincreasing population density so we should see less children being born when there are morepeople” constitutes a movement from sign to referent (S—>R) whereas the statement “In India,birth rate remains high despite increasing population density so the birth rate curve should stayup” constitutes a movement from referent to sign (R—>S). In the dialectic production of thesetypes of statements in the course of a reading, individuals reify both sign and referent, andthereby disclose meaning and unfold understanding.
These interpretants, to be consistent with cultural norms, necessitate that each sign is usedaccording to conventions, and that other conventions, r, such as “right on abscissa” and “up onordinate” signify an “increase” in frequency or “higher” values. This is not always the case andrepresents a source of potential difficulties for a learner. For example, “national debt” may beshown to increase by means of a curve with a positive slope. Yet in spreadsheets (accounting,banking), debt is associated with a minus sign so that “increasing debt” should be plotted, to beconsistent with other mathematical conventions, as a curve with negative slope. Finally, andconsistent with a radical constructivist approach, there are no ideal referents but always andalready formulations of referents in some sign form, frequently vernacular (Derrida, 1988; Eco,1984). The process of grounding can therefore be understood as a process in which the reader of agraph establishes a relation (not equation!) for the quadruplet {R, S, c, r} of the type R = fr(S,c)(e.g., Barwise, 1988). By producing interpretants, readers may generate a new sign that replacesthe original sign such that it allows them to more easily solve the relation.
Structuring
The task of the graph reader therefore is to identify relevant signs and construct interpretantsthat ultimately describe some state in the world. This state can be a situation or another sign(Becker & Varelas, 1993). When individuals are familiar with the signs they are reading (e.g., the
Professionals read graphs 7
morning newspaper, a journal article from one’s domain), the signs become transparent andreading leaps beyond the sign to the signs signified. The mathematics educator does not have tointerpret or analyze the sign “graph” but, upon seeing the word, instantly “knows” what itspossible referents are. Without difficulties, she can more or less identify instances which are (not)appropriately designated by the sign “graph.” However, when signs or sign complexes are lessfamiliar, reading requires the engagement in an activity where the structure of the text and text-internal relations have to be disclosed in the process of reading. For example, artistic images,research reports from another domain, or musical scores are sign complexes that do not allowmost people access to their respective referent domains. Often, whether or not some aspect of agraph should be taken as a sign or simply as an incidental feature is unclear; readers are theninvolved in a structuring activity where the very nature of a graph’s signifying aspects is unclear(Roth, 1998). That is, it is not immediately evident whether readers of Figure 2 should constructas a relevant sign the one or more of: relative height of the two graphs, slopes or relative slopes,intercepts, intersections, maxima, and so on. Our transcripts also show that not all of thesefeatures are salient to the readers all of (or at any) time. This process of structuring a graph andits caption is represented on the top part of Figure 1. Here, the outcome of structural analysis ofthe graph/text produce interpretants (Ricœur, 1991). These interpretants, specific features of thegraph, then become the signs for the second process which relate signs to things in the world(bottom right). To reiterate, our data show that when graphs are unfamiliar, even our scientists donot know a priori how to structure a graph so that it can become a sign that points to somethingbeyond itself.
Reading is made difficult by the fact that the structuring processes themselves are a functionof familiar signs and prior understanding, for it is well-known that perception is theory-laden(Feyerabend, 1975) and that the physiological processes regulating attention and perceptions arefunctions of prior experience and understanding (Jarvilehto, 1998). The following analogy may behelpful for understanding the two processes of structuring and grounding. Thus, graph reading isan activity not unlike that in which Sherlock Holmes engages or the protagonist of Eco’s (1984b)The Name of the Rose. Sherlock does not know a priori whether some cigarette butt refers him tothe criminal or not; initially, he may not even notice a cigarette butt such that is does not exist inhis lifeworld. Thus he engages in structural analysis to separate signs (figure) from ground; hethen relates the ensemble of signs to events in the world. (Here, signs and events are entities ofthe same logical type.) In the course of a novel, our protagonist may have to restructure hisperception of a situation such that something that he first constructed as a sign does not fit in hisunfolding understanding of the events that led to the cigarette butt being where it is. He may haveto construct new signs (structuring), or relate already constructed signs to new contexts c (e.g.,brand of the cigarette), understand signs from within different sets of conventions (within atransvestite culture, there are cigarette butts with lip stick that were originated by a male), orconstruct additional interpretants (e.g., the butt as a sign originating from an unrelated event).
Professionals read graphs 8
Research Design
Participants and Data
The present study is part of a larger research agenda designed to understand graphing frommiddle school to professional practice (e.g., Roth & Bowen, 1999c). As part of this researchagenda, we are particularly interested in understanding the competent reading of graphs and thekinds of experiences it requires. Over a two year period, we therefore included information fromthe following sources.
Sixteen practicing scientists who had obtained an M.Sc. or Ph.D. and who had a minimum of5 years of experience in independent research were asked to interpret the same set of threegraphs. In addition, they read one or more graphs which they provided from their ownpublications. The sessions lasted between 1 and 2 hours. To better understand changes in theunderstanding of graphs, we conducted a 2-year ethnography in an ecological field camp. Weaccompanied (and sometimes videotaped) the field work of our primary informant, aherpetologist, and conducted interviews with the field researchers. These data were enhanced by10-hours of videotaped interviews on the main campus during the winterher non-datacollection season. The interview questions related to the transformation of data and production ofher own graphs, and the reading of additional graphs related to her domain but with which shewas not very familiar.
To better understand the reading practices related to familiar graphs, a water technician(Karen) was videotaped on four occasions reading pen chart-recorded graphs from her work (a) inreal time at the work site (twice) and (b) during a public exhibition of her work as part of an openhouse organized by an environmental activist group. Additional information about the context ofKaren’s work was gathered as part of an ethnography covering this activist group. This includedaccompanying Karen on trips through the watershed, building rock structures in the creek thatoxygenate the water (“riffles”), and inspection trips of habitats in and along the creek.
Tasks
For the interpretation tasks, we chose graphs as they appeared in the introductory ecologycourse. Our textbook analysis showed that these graphs are fairly typical: With minor variations,there were 120 graphs of the same three types in a popular 800-page introductory textbook(Ricklefs, 1990). One of these graphs was a population graph (Figure 2) in which birth and deathrates are displayed as a function of population density. Figure 2 constitutes a graphical modelwhich, in the field of ecology, came into use in the 1950s and 60s (Kingsland, 1995). There were60 such graphical models in the introductory textbook. The two other graphs displayed (a) threeelevation and climate-dependent distributions of plants that are distinguished by their differentphotosynthetic mechanisms and (b) three isographs portraying different scenarios of theinteraction of two resources on a third variable (plant growth).
We interviewed the professionals either in their own offices or in the office of the lead author.Although we presented the tasks as ones which were part of our interest in people’s differing
Professionals read graphs 9
interpretations of graphs, our participants often treated the tasks as puzzles to which someone(we or some indefinite author of the graphs) knew the answer. The graphs brought to theinterviews by the scientists usually displayed either data of correlational nature or those whichwere collected from experimental designs. There was a shift in the orientation toward the taskwhen scientists talked about their own work to provide us with a reading of a graph. At thispoint, they entered the familiar worlds of their everyday work and, for some, the objects theyhad studied for several decades. We actually drew our data on the water technician Karen from acontext which is part of her work. (All proper names and details of lifeworld situation have beenchanged sufficiently to protect the identity of the participants.)
As a water technician, Karen produces graphs with a pen chart recorder that monitors thewater levels of a creek running through the farm where she is employed. Three years of thesegraphs also contained information that she had added by handthe amount of rainfall per daythroughout the year. The current year’s graph was directly pulled from the pen chart recorder sothat her reading was produced concurrently with its generation. Karen frequently reads andexplains these graphs to visitors of the farm or to visitors of open houses organized by anenvironmental activist group that also works closely with Karen and her employer. We recordedKaren in four such situations which are therefore circumstances in which her interpretation isprovided in “authentic” settings as part of her everyday activity of using the graphs.
Data Processing and Interpretation
All videotapes were transcribed in an ongoing manner so that the text was available in writtenform during our analysis. We conducted analyses both individually and collectively. Ouranalyses, grounded in semiotics and hermeneutic phenomenology, are based on the assumptionthat reasoning is observable in the form of socially-structured and embodied activity (Garfinkel,1991). In our analyses, videotapes, transcripts, and artifacts produced by the observedindividuals are natural protocols of their efforts in making sense of, and imposing structure on,their activities. (Of course, part of this protocol relates to activities that bear little relation to ourparticipants’ daily work whereas reading their own graphs is similar to other situations in whichthey explain their work to interested lay people.) These protocols constituted our texts that westructured and elaborated in our analyses.
We independently read all transcripts and viewed all videotapes before meeting forcollaborative analysis. We conducted extensive collaborative analyses of lectures and interviewsfollowing the precepts of Interaction Analysis (Jordan & Henderson, 1995). Videotape replaywas stopped whenever one of us thought a significant event had occurred. This person thenstated an assertion before the event was reviewed as often as necessary for a full exploration byboth researchers. We subsequently reviewed other episodes to check the degree to which theyconfirmed or disconfirmed the assertion. On the basis of these checks, we reformulated initialassertions until they were representative of the data. We then discussed personal constructions,subjected them to critique and analysis, and tested them against the entire data set to evaluate fitand plausibility. Our model therefore emerged as a grounded theory from many such iterations.
Professionals read graphs 10
Because we are trained as natural scientists (graduate majors and/or minor in: physics,physical chemistry, statistics, applied mathematics [Roth]; ecology and sociology [Bowen]),there exists a possibility that we misread the data because of our status as “natives.” To dealwith this possibility, we followed the advice of hermeneutic phenomenology to produce alternatereadings of the data and thereby engage in a dialectic of understanding and explanation (Ricœur,1991). The ecologist read the transcripts in the light of his own graph-related learning processduring his undergraduate and graduate training; the other engaged in hermeneutic and mathematicalstructural analyses.
Professionals Read Graphs
When we began our research on scientists’ interpretations of graphs we were mainlyinterested in collecting several interpretations which we could use as a kind of standard in ourwork with middle school to university students. However, we noted very quickly that (a) theinterpretations varied considerably across scientific disciplines (ecologists versus physicists),sub-disciplines (theoretical versus field ecology), and special interests (conservation versusharvesting); (b) there existed a broad range of competencies including a substantial number ofscientists who struggled with and even abandoned the task; and (c) the nature of the task seemedto change when scientists interpreted graphs from their own work.
To better understand how professionals read familiar and unfamiliar graphs, we produced twodetailed case studies because it is through the particulars of unfolding graph interpretations thatwe come to better understand the conditions of expertise (e.g., Moschkovich, 1996, 1998;Schoenfeld, Smith, & Arcavi, 1994). These case studies show how graph reading unfolds in realtime, and therefore have all the “mumbles, stumbles, malapropisms, metaphors, tics, seizures,psychotic symptoms, egregious stupidity, strokes of genius” (Rorty, 1989, p. 14) characteristicof cognition in real time.
We present our materials in three sections. In the first section, we use a case study toillustrate problems in the reading of one scientist, Ted. (Six of the 16 scientists struggled evenmore than Ted in situations where they were not familiar with graphs and which came fromcontexts other than their own work.) In the second, we use the case study of the water technicianKaren to exemplify transparent reading and the kind of knowledge and understanding thataccompanied competent graph reading; this reading is typical for situations where scientists readgraphs that they generated and used as part of their everyday work. In the third section, wecontextualize differences when scientists interpreted our graphs and those from their own work.
Reading an Unfamiliar Graph
Though some graphs may represent standard fare in the undergraduate training of a scientisthe may not be familiar with it or the phenomenon that it is said to be about. The activity ofreading graphs is therefore different from those that characterize everyday work and life. In thissituation, the task of interpretation is clearly twofold: people have to reconstruct the internaldynamics of the multimodal text, and have to restore to the text the ability to project itselfoutside in the representation of a world that we can inhabit. This double task is represented in
Professionals read graphs 11
the two sides of our model (Figure 1). To better understand this task, we present considerablesections from the reading of the population graph (Figure 2) by one scientist, Ted.
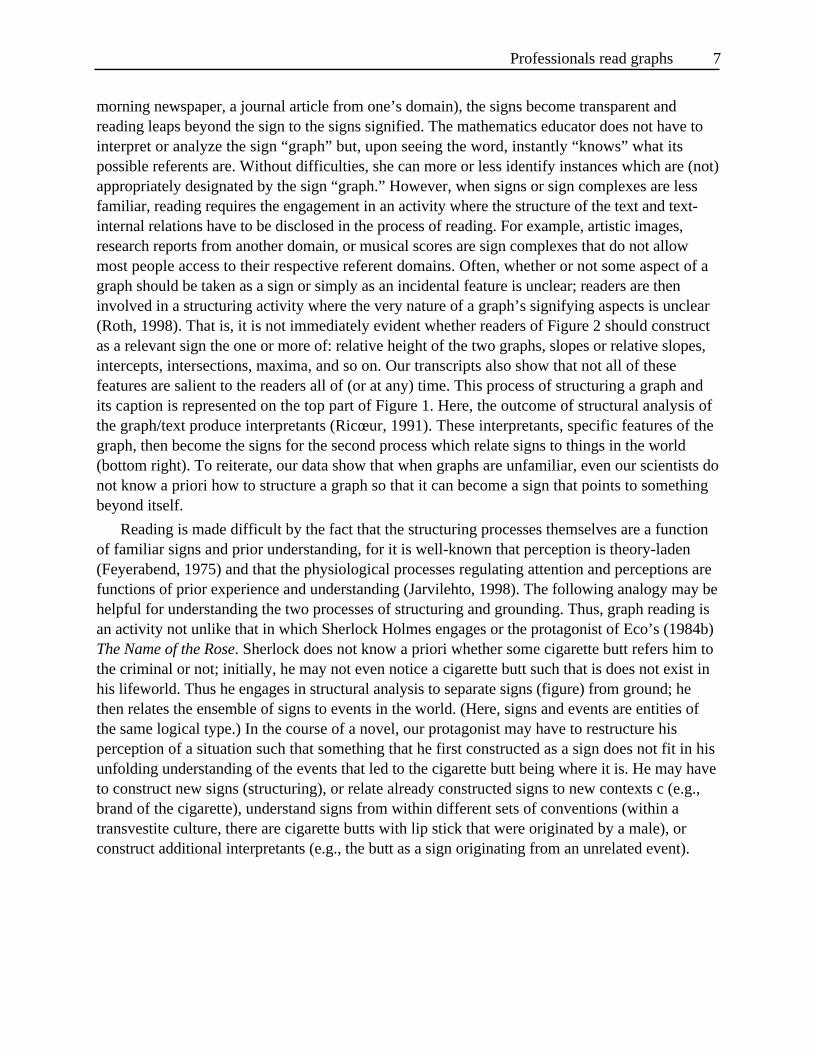
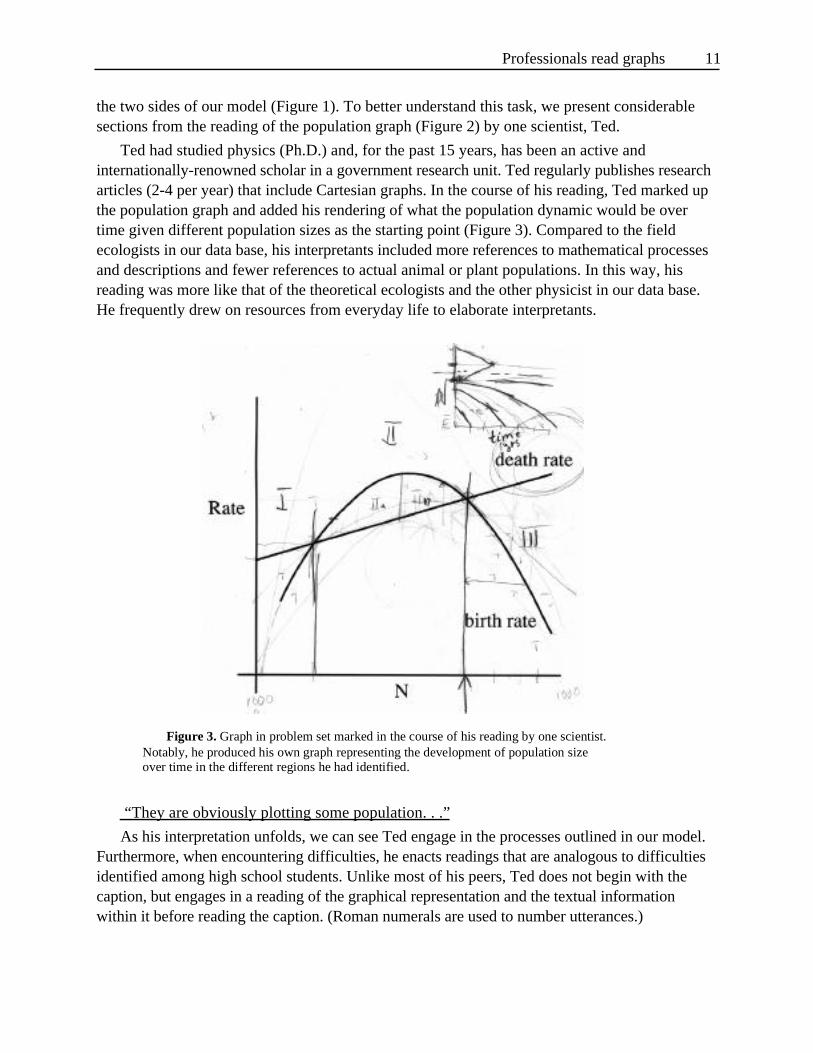
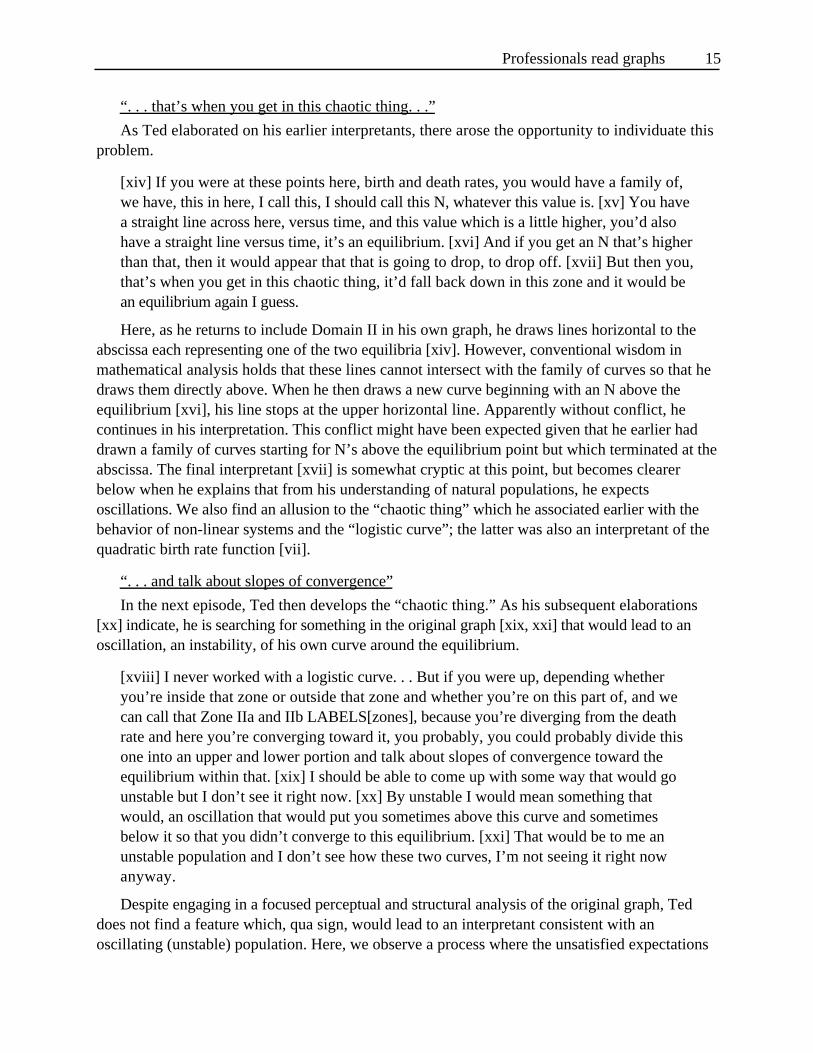
Ted had studied physics (Ph.D.) and, for the past 15 years, has been an active andinternationally-renowned scholar in a government research unit. Ted regularly publishes researcharticles (2-4 per year) that include Cartesian graphs. In the course of his reading, Ted marked upthe population graph and added his rendering of what the population dynamic would be overtime given different population sizes as the starting point (Figure 3). Compared to the fieldecologists in our data base, his interpretants included more references to mathematical processesand descriptions and fewer references to actual animal or plant populations. In this way, hisreading was more like that of the theoretical ecologists and the other physicist in our data base.He frequently drew on resources from everyday life to elaborate interpretants.
“They are obviously plotting some population. . .”
As his interpretation unfolds, we can see Ted engage in the processes outlined in our model.Furthermore, when encountering difficulties, he enacts readings that are analogous to difficultiesidentified among high school students. Unlike most of his peers, Ted does not begin with thecaption, but engages in a reading of the graphical representation and the textual informationwithin it before reading the caption. (Roman numerals are used to number utterances.)
Figure 3. Graph in problem set marked in the course of his reading by one scientist.Notably, he produced his own graph representing the development of population sizeover time in the different regions he had identified.
Professionals read graphs 12
[i] N would be the number like the individual in a population, rate would be a numberdifferentiated by time, so this would be a measure of change. [ii] They are obviouslyplotting some population where we take, find the number of individuals and we see thatas the number of individuals goes up the rate, the death rate increases. . . [iii] There aremore individuals dying per unit time as the number goes up and birth rate increases as the.. . [iv] It probably should go to zero if there are no, well it should go to 2 probably; ifthere are no parents, there will be no births. [v] The birth rate increases to a maximum, atsome optimum number and then the birth rate falls of as the number of individualsincreases, [vi] probably because of limits in the environment or competition or disease orovercrowding or social problems within that population. [vii] Now, the logistic model is amathematical formulation and it’s very common I know in the ecological literature andthis particular curve POINTS[birth rate], logistic curve, has been shown, it has beenshown or has gained a lot of notoriety because it demonstrates chaotic behavior in non-linear. . .
In this opening reading, and without reference to the caption, Ted immediately elaborates thesigns “N” and “rate” with the interpretants “number of individuals in a population” and “numberdifferentiated by time,” respectively [i]. Both interpretants are not immediately available fromthe task, but arise from common conventions (r) with which more theoretically-orientedscientists are familiar. Ted then enacts a literal reading (i.e., describes graph as graph but inwords), and produces an interpretant which translates the trajectory of lines with respect to thecoordinate grid into a verbal representation [ii], which he then further elaborates in [iii] with asecond interpretant. All of a sudden, Ted engages in a reverse movement where he takes everydayunderstandings of reproduction (no organisms no births, it takes two parents to procreate) toproject where the birth rate curve should intersect with the abscissa [iv]. In this, we observe amovement from the referent R to the sign S. Ted continues to provide interpretants that describethe shape of the birth rate curve [v], and then again uses familiar understanding of ecology (R)that legitimize the dropping of the birth rate (S) with increasing N [vi]. Here, the situationdescriptions “limits in the environment,” “competition,” “over crowding,” and “social problem”are not available in the graph or in the caption. Yet here, Ted’s understanding of ecology isconsistent with his interpretant of the birth rate curve for larger N. Therefore, the ecologicalunderstanding (and prior experiences) and his reading of the graph reify each other (double arrowin the bottom right triangle). Ted then turns to the text and reads the term “logistic model,”leading him to relate it to mathematical formulations and chaotic behavior in non-linear systems[vii].
“At intersection points you are at equilibrium. . .”
Up to this point, Ted engaged both in internal process of structuring the graph by producinginterpretants (e.g., birth rate drops) which then became signs that project beyond themselves to apossible world. We also observe the reverse movement where descriptions of the world as it istaken to be (e.g., competition, overcrowding) are used to reify and legitimize the shape of thebirth rate curve.
Professionals read graphs 13
[viii] At intersection points, presumably, you are at equilibrium, the number ofindividuals in the population, they are being replaced as quickly as they’re being removedand the same will hold at the other equilibrium point. [ix] In between, the population isincreasing in size and if you’re concerned with harvesting this population for somereasons, hunting or trapping or fishing, you would want to make sure that you’re keepingyour population numbers in this range. [x] The most increase you have is here POINTS[b- d = max] because you calculate the population, say the P is equal to the initial P plusbirth rate plus death rate.
Ted individuates the two intersection points [viii]. This in itself is significant in the light ofthe fact that in a different graph, he (as other scientists) does not highlight the existingintersections. Thus, the intersections become salient (or are made salient by the caption) not inthemselves, but in the light of other signs that the reading individuated (which thereforeconstitute the context c of the intersection sign), “birth rate” and “death rate.” Furthermore, forthe intersection to be significant, the graph relies on the reader’s adherence to the conventions (r)regulating the use of the two signs “birth rate” and “death rate” as opposite trends that tend toincrease and decrease an existing population. This is even more evident when we compare thisgraph with its copy where the two labels are replaced by “birth rate of deer” and “birth rate ofmoose.” In this case, the implications of the intersections are of a very different nature. Thus, inone of the other tasks Ted, as his peers, does not make salient the intersections of thedistributions of different plant types.
Ted’s reading of the intersections as points of equilibrium therefore presuppose complexinteractions between extant (socially-shared) understandings of how the world operates and thegraph at hand. His interpretant “equilibrium” for the sign constituted by the intersecting curves islegitimized by a further interpretant of “birth rate equals death rate” in the form of “they arebeing replaced as quickly as they are being removed” [viii]. Ted’s next statement [ix] shows againa complex interaction between knowing the world and the topology of the signifying graph. Here,in the context of the conventions regulating the use of “birth rate” and “death rate,” the relationbetween the two curves suggest an increase in number of individuals in the referent population.Conversely, “hunting,” “trapping,” “fishing,” and “harvesting” are from the domain of theexperienced world. His ecological common sense suggests that to engage in these activities,sufficient population sizes are required unless the species is to become extinct. According toBourdieu (1980), common sense (“sens commun”) itself is the result of interactions between ourintuitive and tacit understanding of how the world operates (“sens pratique”) and how werepresent the world in everyday language (“sens objectivé”). Ted uses such a commonunderstanding to suggest that activities leading to the density-independent reduction ofpopulation size should be encouraged when the population tends to increase its size. Thisinterpretation is only partially correct, however, as it does not include the region for populationsizes above the second intersection. Ted develops this non-standard interpretation even further insubsequent statements.
The last interpretant in this section relates to the maximum difference between birth anddeath rate curves [x]. As he points to that part of the graph, he elaborates it in terms of themaximum increase in the population size and provides an algebra-based rational. This, however,
Professionals read graphs 14
is a non-standard interpretation for the maximum increase in individuals occurs when the functionf = (b[N] - d[N])·N is maximized rather than when (b[N] - d[N]) is maximized. Here, Ted doesnot attend to or observe the convention of interpreting birth rate and death rate as the increaseand decrease in the number of individuals relative to the population size. This non-standardinterpretation is not unlike the slope/height difficulty observed among students reading adistance-time graph, for in both cases the interpretant is based on some maximum in the graphcurrently available rather than in a transformed graph. In both instances, situated reasoning(inappropriately) associates the utterance of “most” (or faster) with the differences visibly athand rather than with the maximum differences in the associated f[N] or velocity-time graphs.The fact that velocity can be read from a position-time graph is due to the fact that, given the
definition of velocity as v(t) = dx(t)
dt happens to coincide with the derivative x’ of the x(t)
function. The conceptual definition of a quantity coincides with the derivative of anotherquantity plotted in a specific way. Representations of x as a function of any other variable wouldnot support similar inferences about the velocity.
“So you have a family of curves. . .”
In the subsequent episode, Ted continues by shifting his attention to the relationshipbetween birth and death rates to the right of the second intersection. In the process, he beginsdrawing his own graph in which the population size is represented as a function of time (topright in Figure 3). In this episode, the drawing progresses to the point where a family ofdownward sloped curves intersect at various points with the abscissa.
[xi] If we’re working out in this range, the birth rate is much lower than the death rate, sothe number in the population versus time which would be the other curve that’s behindthis one will show a declining population. [xii] I believe that if we looked at thepopulation versus time, in year say DRAWS[graph], if we were in, I call this Domain I,Domain II, Domain III, we are in Domain III LABELS[sections] because the initialpopulation sitting up here is dying at a rate greater than it’s been born, then over time youwould have a decline in the population. [xiii] It wouldn’t be strictly linear because this is apower curve and this is linear. So you would have a convexity or a concavity to it, I’mnot sure. I think it will be like this, down, because if we took a tangent at this point, thiswould be a linear response and as the numbers get higher, you’re actually getting. So, youhave a family of curves that all do this DRAWS[curves].
Here, Ted produces the interpretant “declining population” for the sign constituted by a birthrate curve lying below the death rate curve [xi]. At this point, it is not clear how far thepopulation may decline. However, after sectioning the graph into three domains (Figure 3, [xii]),Ted draws a family of curves representing the development of populations over time giving aninitial size from Domain III (right of the second intersection). The curves in this family intersectwith the abscissa and therefore represent crashing populations. This interpretant would havebeen standard if birth and death rates were not functions of population density (or size) butconstant. This non-standard interpretation was provided by 37% of the scientists and by 78% ofall non-scientists.
Professionals read graphs 15
“. . . that’s when you get in this chaotic thing. . .”
As Ted elaborated on his earlier interpretants, there arose the opportunity to individuate thisproblem.
[xiv] If you were at these points here, birth and death rates, you would have a family of,we have, this in here, I call this, I should call this N, whatever this value is. [xv] You havea straight line across here, versus time, and this value which is a little higher, you’d alsohave a straight line versus time, it’s an equilibrium. [xvi] And if you get an N that’s higherthan that, then it would appear that that is going to drop, to drop off. [xvii] But then you,that’s when you get in this chaotic thing, it’d fall back down in this zone and it would bean equilibrium again I guess.
Here, as he returns to include Domain II in his own graph, he draws lines horizontal to theabscissa each representing one of the two equilibria [xiv]. However, conventional wisdom inmathematical analysis holds that these lines cannot intersect with the family of curves so that hedraws them directly above. When he then draws a new curve beginning with an N above theequilibrium [xvi], his line stops at the upper horizontal line. Apparently without conflict, hecontinues in his interpretation. This conflict might have been expected given that he earlier haddrawn a family of curves starting for N’s above the equilibrium point but which terminated at theabscissa. The final interpretant [xvii] is somewhat cryptic at this point, but becomes clearerbelow when he explains that from his understanding of natural populations, he expectsoscillations. We also find an allusion to the “chaotic thing” which he associated earlier with thebehavior of non-linear systems and the “logistic curve”; the latter was also an interpretant of thequadratic birth rate function [vii].
“. . . and talk about slopes of convergence”
In the next episode, Ted then develops the “chaotic thing.” As his subsequent elaborations[xx] indicate, he is searching for something in the original graph [xix, xxi] that would lead to anoscillation, an instability, of his own curve around the equilibrium.
[xviii] I never worked with a logistic curve. . . But if you were up, depending whetheryou’re inside that zone or outside that zone and whether you’re on this part of, and wecan call that Zone IIa and IIb LABELS[zones], because you’re diverging from the deathrate and here you’re converging toward it, you probably, you could probably divide thisone into an upper and lower portion and talk about slopes of convergence toward theequilibrium within that. [xix] I should be able to come up with some way that would gounstable but I don’t see it right now. [xx] By unstable I would mean something thatwould, an oscillation that would put you sometimes above this curve and sometimesbelow it so that you didn’t converge to this equilibrium. [xxi] That would be to me anunstable population and I don’t see how these two curves, I’m not seeing it right nowanyway.
Despite engaging in a focused perceptual and structural analysis of the original graph, Teddoes not find a feature which, qua sign, would lead to an interpretant consistent with anoscillating (unstable) population. Here, we observe a process where the unsatisfied expectations
Professionals read graphs 16
of a scientist drive him to question his original reading. That is, from the expectations ofpopulation oscillations based in his understanding of the world, Ted not only returns to the levelof the signs, but to the structural analysis of the graphical text which no longer stands in amutually constitutive relationship with the phenomenon. The activity is not unlike that of aperson looking for the first time at what appears to be a random collection of black spots onwhite ground and finding out only after some time that one can perceive a Dalmatian or a cow(see Churchland, 1995 for a discussion of the neuroscientific explanation of such structuring). Atthis point, the graph is therefore a highly ambiguous text requiring an analysis not unlike those ofesthetic texts (e.g., paintings, music). In fact, his comment “I don’t see it” lies on the reversemovement from text to structural analysis (see arrows in Figure 1) questioning the process ofperception itself which lies at the origin of the graphical text as a structured object.
His analytic process turns up differences in the relative slopes of the two curves in themiddle zone which he sectioned off into two subzones. Thus, the relative slopes heretoforeabsent in his analysis become part of the resources brought to his interpretation. We can say thathis ontology, the ensemble of the signs in the task world, has changed. Without elaborating thepoint, the interpretant [xxviii] raises the possibility that the instability comes from the different“slopes of convergence,” the fact that the two lines converge and diverge in the two subsections,respectively. Of course, this approach is not unlike that described as iconic difficulties studentsface. Convergent and divergent lines in one graph are treated as isomorphs of the expectedconvergence to and divergence from the equilibrium so that it could not be reached. This becomesevident in the final episode discussed here.
“. . . that’s what I mean by looking for some kind of instability.”
Ted seeks a feature in the graph such that the curves in his own graphs never reach the linesrepresenting the equilibrium state, but oscillate about them [xxii].
[xxii] If you use it in a management sense you’re aiming for a particular populationestimate and what you find, certainly what is always there, all of the case examples ofpopulation management by man occurs that there’s always overshoot, undershoot andfeedback loops that prevent that population from ever reaching these theoreticalequilibrium points. [xxiii] And that’s what I mean by looking for some kind of instabilityin this relationship that would. . . and it could be that it has to do with the. . . [xxiv] Ifyou change these coefficients kb and kc you change the shape of this curve. . . death rate islinear, and if it were not, it may be, it’s also, has a logistic model shaped to it, maybeconsider this.
Although he did not pursue the implications of the convergent and divergent slopes, Tedmoves on to individuate other aspects of the graph which heretofore were in the background, ordid not exist at all from his perspective. His ecological common sense provides a strongsuggestion that the representation (sign) should oscillate. As this is not the case, Ted returns tothe issue and explores ways of perceiving the graph. As part of the process of perceptualrestructuring, he turns up new potential signs [xxiv]. In the light of an earlier interpretant, that thelogistic model “has gained a lot of notoriety because it demonstrates chaotic behavior in nonlinear systems” may introduce the instability which Ted’s interpretation attributed to natural
Professionals read graphs 17
systems. He ultimately abandons his efforts without further elaborating on the issues raised sofar.
In summary, the episodes provide glimpses of a scientist attempting to read the graph withthe purpose to leap beyond its material basis and to relate it to the world he knows. The graph isunrelated to what he does in his everyday life: the activity is more akin to completing unfamiliartasks “indoors” (Lave, 1988; Roth & Bowen, 1999c) rather than constituting “cognition in thewild” (Hutchins, 1995). This reading is not effortless and in some instances is non-standardbecause (a) standard conventions were not observed, (b) structural analysis produced individualand ensembles of signs which did not or were not used to constrain their respective interpretants,and (c) visual features of the graph were used to make inappropriate structural arguments. Wealso saw an interaction between structural analysis and understanding of how the world works,and dialectic relations between sign and referent dimensions in each of the two processes at work.The video in our data base show that (a) 6 of 16 experienced scientists experienced even moretrouble than Ted with this graph and (b) much more than do non-scientists, scientists generallyconnected their reading of this graph to their understanding of the world or mathematics. Thedifficulties faced by scientists with these provided graphs starkly contrast with their reading anduse of graphs from their own work.
Reading Transparently
Although most of our videotapes show scientists reading their own graphs, the domain-specific discourse is so highly technical that they would require many explanations about thebiology, biochemistry, physics and so on of the phenomena and theories at work. As our modelpredicts, a lack of this knowledge will make it difficult to impossible for the reader of this paperto understand the graphs themselves. We therefore selected the case study from a domain thatdoes not presuppose a scientific training: A water technician (Karen) reads graphs (Figure 4)produced by a pen chart recorder monitoring the water level of a creek flowing through a forest-rimmed valley, spotted with farms. Karen works for Ocean Side Farm whose owner, as Karen,participates in various environmental action groups interested in securing the health of the localwatershed. Karen produced the graph readings as one part of her work which included publicrelations for the activities of the environmental action group and the farm, who are both engagedin contributing to the ecological health of the watershed. We return to the significance of this innext section.
The graph readings presented here typify those we recorded when scientists read graphs fromtheir own work. In all instances, the graphs were transparent to the act of reading and theinterpretants seemed to leap beyond the material basis of the sign to the things they described.Furthermore, these individuals could produce a sign standing for an actual or hypothetical state intheir familiar worlds.
“In the summer, we’re down here. . .”
Professionals read graphs 18
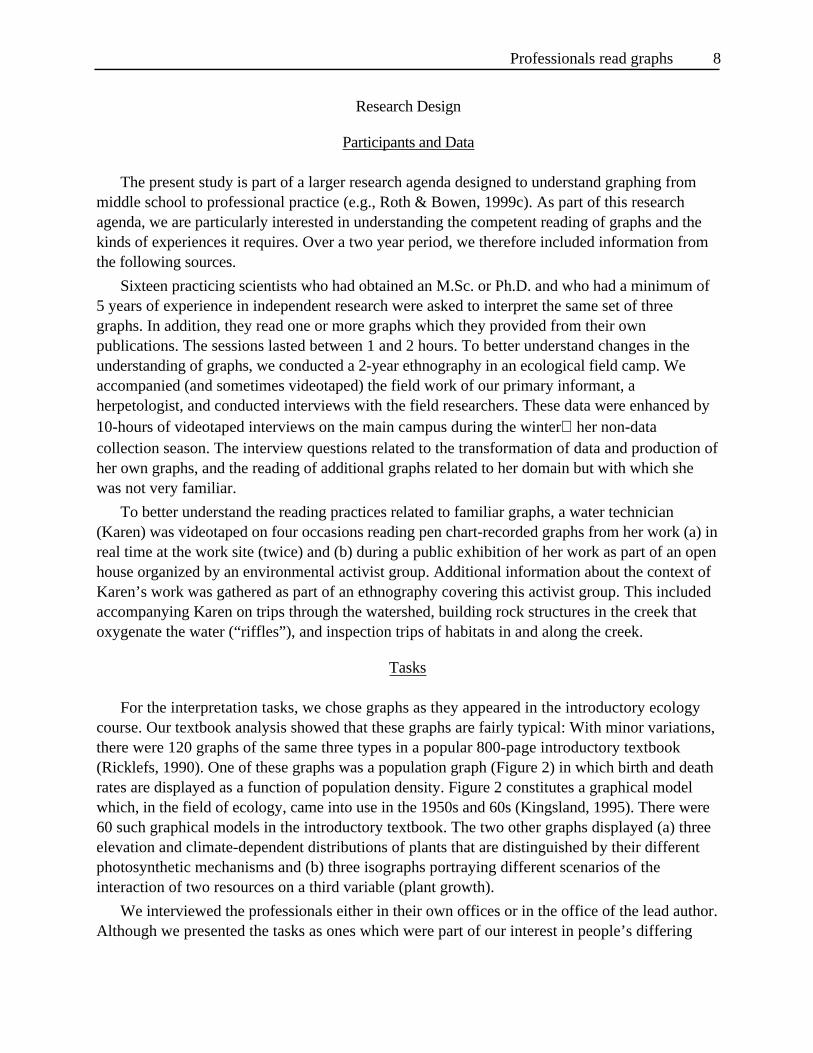
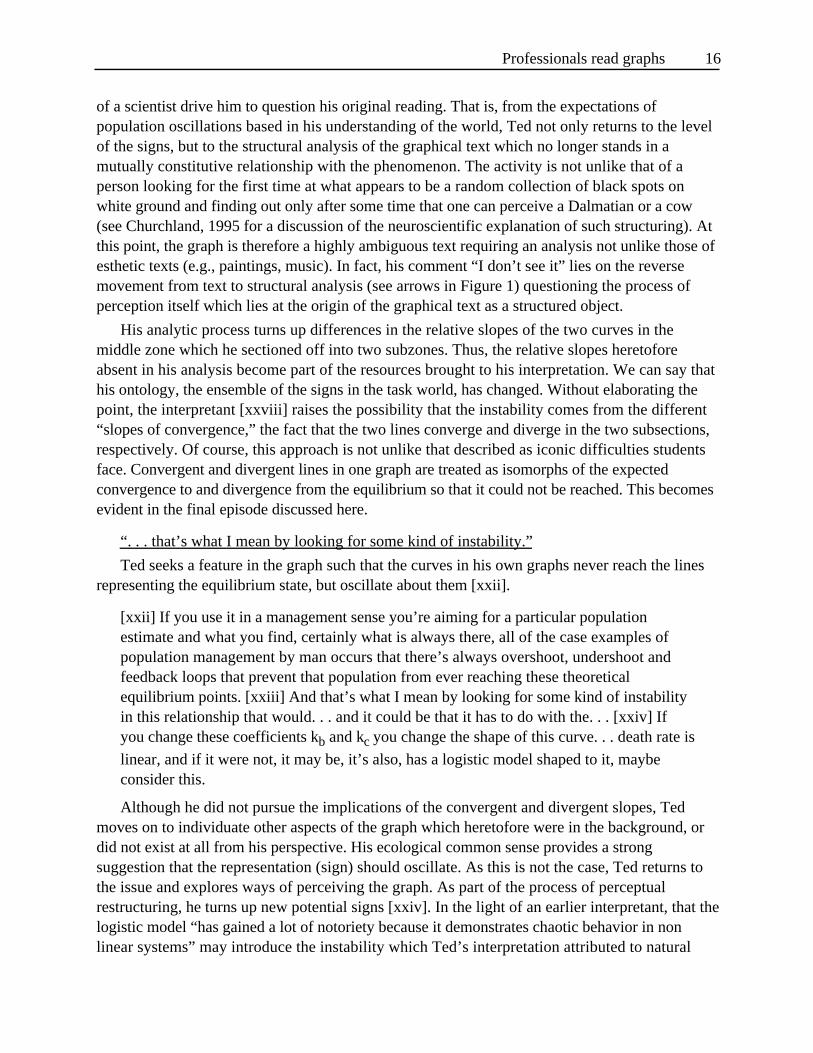
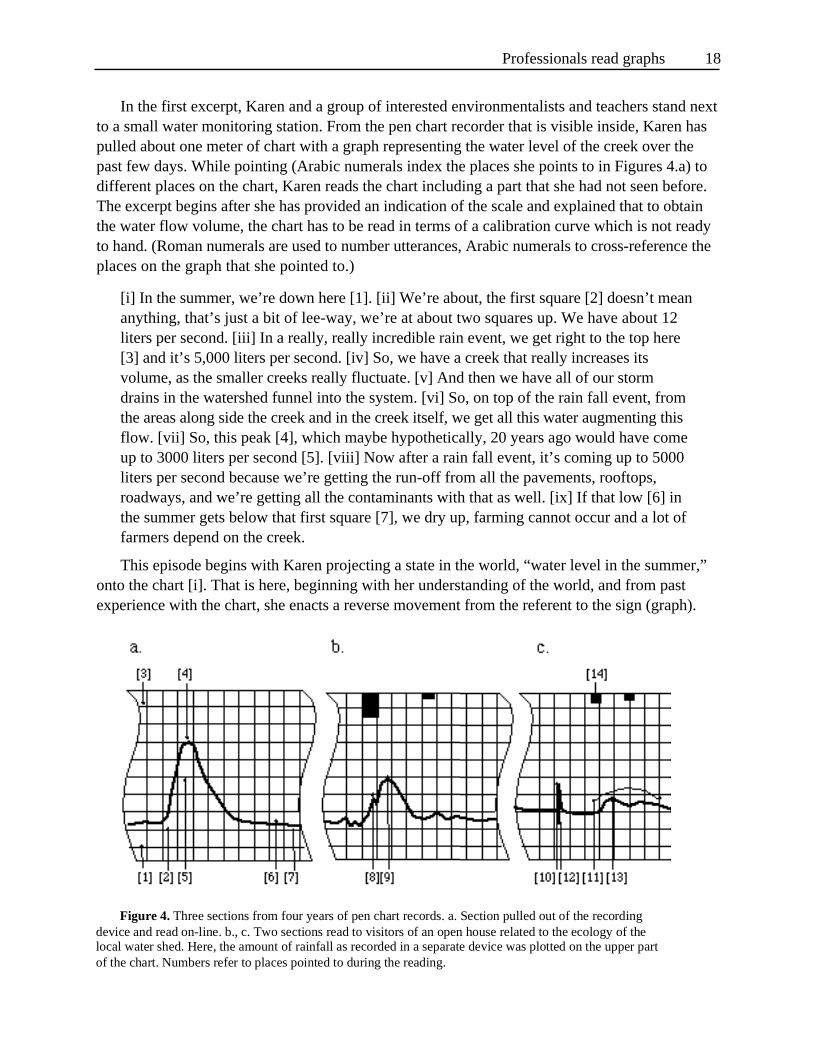
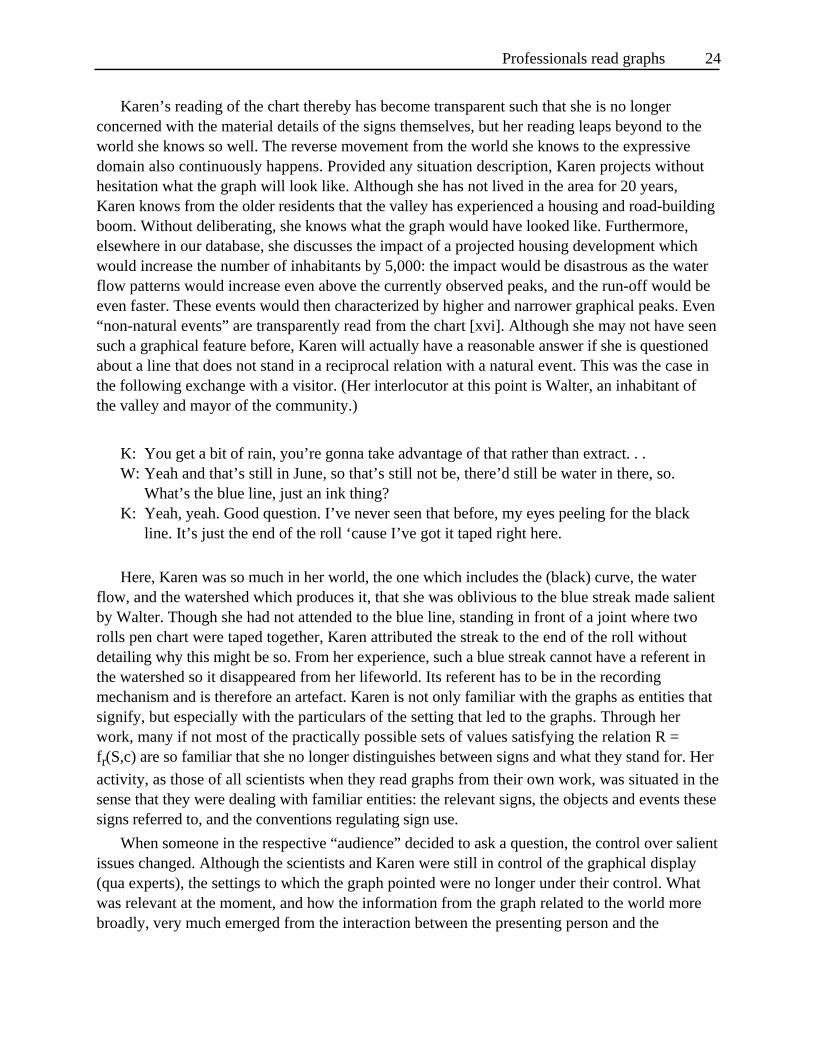
In the first excerpt, Karen and a group of interested environmentalists and teachers stand nextto a small water monitoring station. From the pen chart recorder that is visible inside, Karen haspulled about one meter of chart with a graph representing the water level of the creek over thepast few days. While pointing (Arabic numerals index the places she points to in Figures 4.a) todifferent places on the chart, Karen reads the chart including a part that she had not seen before.The excerpt begins after she has provided an indication of the scale and explained that to obtainthe water flow volume, the chart has to be read in terms of a calibration curve which is not readyto hand. (Roman numerals are used to number utterances, Arabic numerals to cross-reference theplaces on the graph that she pointed to.)
[i] In the summer, we’re down here [1]. [ii] We’re about, the first square [2] doesn’t meananything, that’s just a bit of lee-way, we’re at about two squares up. We have about 12liters per second. [iii] In a really, really incredible rain event, we get right to the top here[3] and it’s 5,000 liters per second. [iv] So, we have a creek that really increases itsvolume, as the smaller creeks really fluctuate. [v] And then we have all of our stormdrains in the watershed funnel into the system. [vi] So, on top of the rain fall event, fromthe areas along side the creek and in the creek itself, we get all this water augmenting thisflow. [vii] So, this peak [4], which maybe hypothetically, 20 years ago would have comeup to 3000 liters per second [5]. [viii] Now after a rain fall event, it’s coming up to 5000liters per second because we’re getting the run-off from all the pavements, rooftops,roadways, and we’re getting all the contaminants with that as well. [ix] If that low [6] inthe summer gets below that first square [7], we dry up, farming cannot occur and a lot offarmers depend on the creek.
This episode begins with Karen projecting a state in the world, “water level in the summer,”onto the chart [i]. That is here, beginning with her understanding of the world, and from pastexperience with the chart, she enacts a reverse movement from the referent to the sign (graph).
Figure 4. Three sections from four years of pen chart records. a. Section pulled out of the recordingdevice and read on-line. b., c. Two sections read to visitors of an open house related to the ecology of thelocal water shed. Here, the amount of rainfall as recorded in a separate device was plotted on the upper partof the chart. Numbers refer to places pointed to during the reading.
Professionals read graphs 19
She then elaborates the previous statements by translating “down here” into a measure of flow(volume/time) [ii]. In the next utterance, we observe again a movement from the referent domain,the experienceable “incredible rain event,” to the sign domain and into another sign domain: byindicating where she would expect the curve to come lie on the paper (S1) and the amount of flowin the creek thereby indicated (S2). In the next three utterances, Karen provides situationdescriptions from the referent domain [iv-vi]. She talks about the creek and its smaller, fluctuatingtributaries, storm drains that funnel into the watershed, and the water from the areas alongsidethe creek all of which increase the water flow to the earlier described levels. That is, she does notmerely read or project a graph, but has an intimate knowledge of the situation and the conditionsthat bring the water to the high levels of 5,000 liters/second. Not only that but Karen is alsofamiliar with the historical situation: the same rain fall event which now produces 5,000liters/second would have produced only 3,000 liters/second some 20 years ago which sheattributed largely to specific characteristics of the landscape (pavement, roof tops, roadways)with which she is very familiar [vii-viii]. She then returns to the summer situation and providesboth situation description (“dry up” “farming cannot occur”) and a corresponding state in thesign domain (“below the first square”) [ix].
In this excerpt, we see Karen effortlessly moving back and forth from the chart, the signdomain, to the local setting, the referent domain. She reads the graph transparently, much like weread the newspaper: a simple glance at the material basis of the text suffices to instigate aninterpretant in which elaborate situation descriptions tell us about the watershed. However, theprocess is even more complex than it first appears. Because the cross-section of the creek is notsquare, the water level curve does not directly indicate the amount of water in the creek. Therelationship between the amount of water running past the station and the height of the curve isstrongly non-linear. Therefore, when Karen reads the graph in terms of a specific quantity, shedoes this based in terms of a calibration curve established by a government agency. Thus, in herreading of the graph, not only the pen chart record, but also the calibration curve is transparent.
“This peak has an earlier tiny peak. . .”
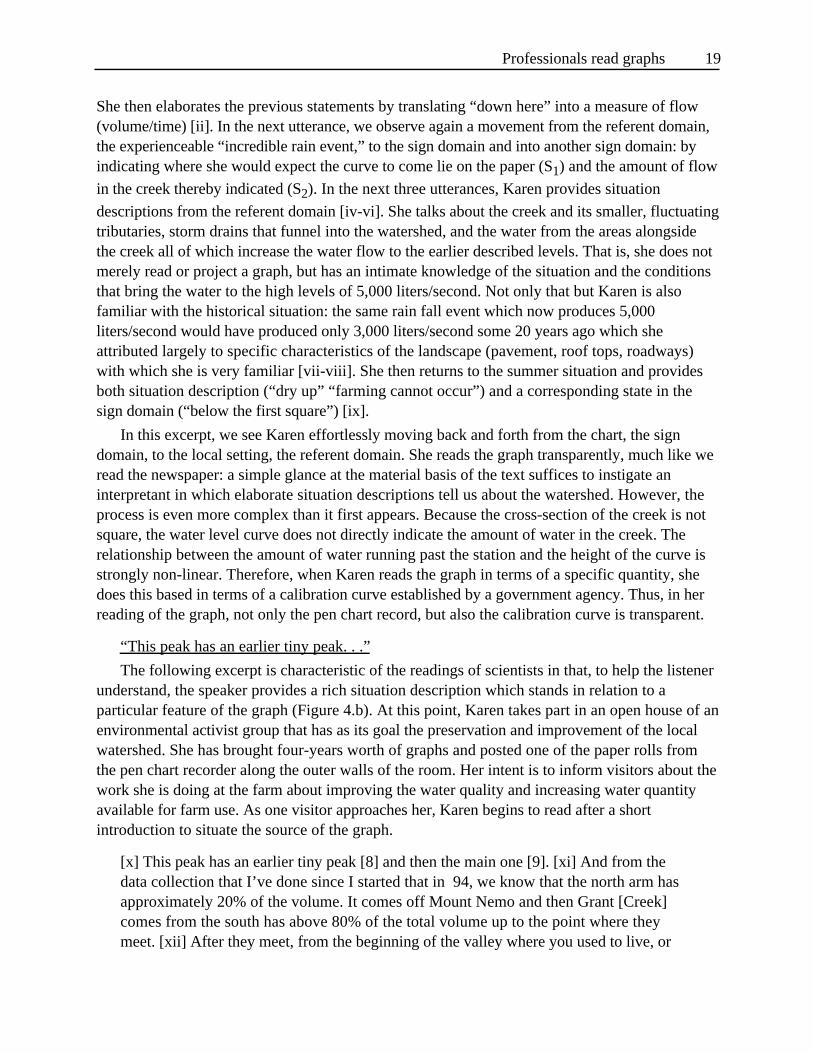
The following excerpt is characteristic of the readings of scientists in that, to help the listenerunderstand, the speaker provides a rich situation description which stands in relation to aparticular feature of the graph (Figure 4.b). At this point, Karen takes part in an open house of anenvironmental activist group that has as its goal the preservation and improvement of the localwatershed. She has brought four-years worth of graphs and posted one of the paper rolls fromthe pen chart recorder along the outer walls of the room. Her intent is to inform visitors about thework she is doing at the farm about improving the water quality and increasing water quantityavailable for farm use. As one visitor approaches her, Karen begins to read after a shortintroduction to situate the source of the graph.
[x] This peak has an earlier tiny peak [8] and then the main one [9]. [xi] And from thedata collection that I’ve done since I started that in 94, we know that the north arm hasapproximately 20% of the volume. It comes off Mount Nemo and then Grant [Creek]comes from the south has above 80% of the total volume up to the point where theymeet. [xii] After they meet, from the beginning of the valley where you used to live, or
Professionals read graphs 20
you still live, to the end of the valley, the flow can increase 6 to 10 times all throughoutthe year. [xiii] That tells us that Mount Nemo and the First Nations forested area areextremely crucial for infiltration, ground water movement in feeding the creek throughoutthe year. [xiv] So, what this blip [8] means then is that when we get a rainfall, we hadquite a bit there, the north arm, the water from the north arm comes off faster. [xv] It’sless volume [8] but we see the peak first, down at Ocean Side Farm at the station. Andthen it takes quite a bit longer [9], 8 hours perhaps, and quite a lot to show that rainfall.[b]
Karen begins the episode [x] by making salient a tiny peak which precedes the main peak(Figure 4.b.). This in itself is significant because the non-initiate reader may not perceive thesmall peak, or may consider it as some random event. Whether such blips are to be read as signal(i.e., sign) or as noise (i.e., non-sign) depends on the situation at hand and is learned as part oflocal practice (Roth & McGinn, 1997, 1998). In Karen’s reading, the blip is a non-random eventand therefore a sign; here, the sign indicates certain geographical and physical characteristics ofthe creek, the sources of the water passing by her station (north arm, south arm, forested areas ofMount Nemo and Reservation), and water movement [xi-xiii]. She then returns to the “blip,”which she reads (based on her 4-year experience in the valley) as the water coming from the northarm that precedes the water of the much longer south arm which also has to traverse a plain. Shereads the relative size of the peaks as differences in the volume. Furthermore, the small size ofthe “blip” is implicitly attributed to the fact that the two tributaries only contribute one-sixth toone-tenth of the overall flow [xii].
“This is a non-natural event. . .”
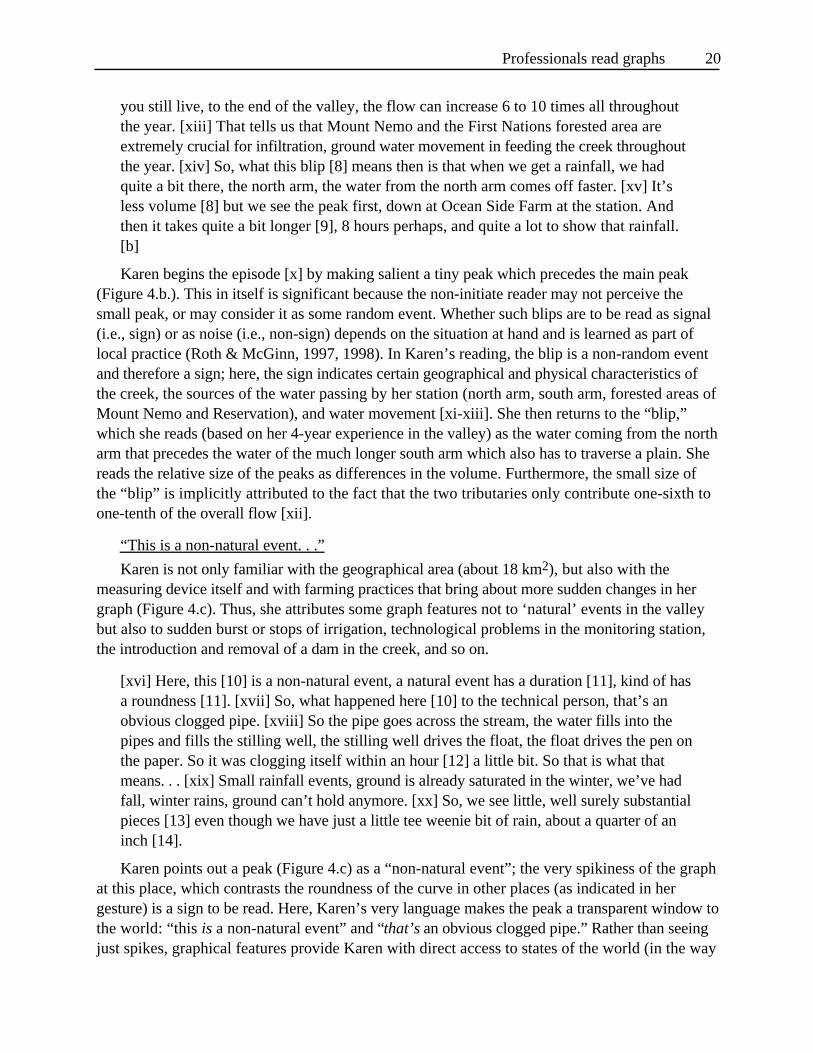
Karen is not only familiar with the geographical area (about 18 km2), but also with themeasuring device itself and with farming practices that bring about more sudden changes in hergraph (Figure 4.c). Thus, she attributes some graph features not to ‘natural’ events in the valleybut also to sudden burst or stops of irrigation, technological problems in the monitoring station,the introduction and removal of a dam in the creek, and so on.
[xvi] Here, this [10] is a non-natural event, a natural event has a duration [11], kind of hasa roundness [11]. [xvii] So, what happened here [10] to the technical person, that’s anobvious clogged pipe. [xviii] So the pipe goes across the stream, the water fills into thepipes and fills the stilling well, the stilling well drives the float, the float drives the pen onthe paper. So it was clogging itself within an hour [12] a little bit. So that is what thatmeans. . . [xix] Small rainfall events, ground is already saturated in the winter, we’ve hadfall, winter rains, ground can’t hold anymore. [xx] So, we see little, well surely substantialpieces [13] even though we have just a little tee weenie bit of rain, about a quarter of aninch [14].
Karen points out a peak (Figure 4.c) as a “non-natural event”; the very spikiness of the graphat this place, which contrasts the roundness of the curve in other places (as indicated in hergesture) is a sign to be read. Here, Karen’s very language makes the peak a transparent window tothe world: “this is a non-natural event” and “that’s an obvious clogged pipe.” Rather than seeingjust spikes, graphical features provide Karen with direct access to states of the world (in the way
Professionals read graphs 21
we do not interpret a stop sign and then decide to stop, but rather stop). She elaborates thisinterpretant by providing a detailed description of the recording mechanism and how amalfunctioning station (“clogged pipe”) translates in to the feature she had pointed out to herlisteners [xvii-xviii]. When one of these visitors to the open house asked Karen a question:
V: Are these all, these are more natural events after, after POINTS[graph]?K: Yeah, they’re gradual curves, so like your rolling mountain type of thing, very. . . more
natural events.
Standing in front of a section of the graph, the visitor asked whether “these are more naturalevents after” while pointing to a spike which Karen had identified three minutes earlier as a “notnormal kind of thing” due to the opening of a dam. Karen ascertains that there are more naturalevents, and supports this with the description of the curves as of the “rolling mountain type.”Here, Karen provided the visitor with a heuristic for recognizing natural events, though there areno indications anywhere else in our transcripts that her talk was causally determined by this orany other heuristic. It is further interesting that the visitor’s question reflects the same kind ofsign-referent transparency as Karen’s discourse.
In the final part of the excerpt, Karen provides more evidence for her detailed understandingof the area’s geology, its ability to retain water, and how high saturation levels during the wintermonths lead to higher peaks even for small rainfall events [xix-xx]. This excerpt makes evidentagain the detailed understanding of situation required to enact transparent reading. For even theassessment whether or not a peak is “substantial” relative to the amount of rain is not somethingthat could be read of easily without the embodied knowledge that this water technician hasdeveloped as part of her work in the watershed.
In summary, Karen’s reading is in many ways representative of the processes of readinggraphs transparently which we recorded when scientists engaged with graphs from their ownwork. Whereas there are considerable philosophical problems when signs are conflated withthings in the world (Bateson, 1980; Foucault, 1983), this same conflation usually gets theeveryday work done in unproblematic ways. Each time, extensive situation-specific knowledge ofthe setting including tools and instruments used to collect data was used as resource to explainhow their graphs should be read. Our own, two-year ethnography in which we followed anecologist around observing all activities that ultimately led to conference presentations showedhow much scientists use implicit understandings (“anecdotal knowledge”) in their reading (Roth,1998; Roth & Bowen, 1999b).
Graphs: Doing Puzzles and Explaining Work
In order to prevent misunderstandings, we insist that our video tapes recorded situatedactivities in both case studies: Karen and Ted engaged in reading of graphs displayed before theireyes. In both instances, the participants were in their familiar surroundings. Our video andtranscripts are records of these activities. However, both sessions are further situated in a largercontext. Here, the differences between the two readings become apparent. In Karen’s case, there
Professionals read graphs 22
was a continuity with all the other things she normally does as part of her everyday practices.The relation of the variables in the sets {R, S, c, r} had those unique solutions that allow her toget her day’s work done. On the other hand, Ted faced a different kind of task discontinuousfrom his everyday work and private life. He had to bootstrap a reading by structuring the graphand seeking suitable instances from his past experience such as to find plausible solutions to therelation R = fr(S,c). The discontinuity of between the sets {R, S, c, r} that characterize hiseveryday practices and those that he had to generate during the task, and the indeterminacy of theresults of the bootstrapping process are plausible candidates that account for the problematicreading and the nature of the tasks to be “decontextualized.”
Doing Puzzles
Students are frequently tested using mathematical tasks that involve descriptions ofsituations; these descriptions are said to make the tasks “contextual.” When students fail toprovide standard interpretation, deficit arguments are often rallied as explanations. Our researchamong scientists shows that if the graphs are unfamiliar, providing textual information does notitself guarantee successful standard interpretations and many errors occur which are similar tothose committed by students. Given the nature of our participants, deficit arguments arecertainly inappropriate. In an earlier study, we argued that “contextual” should refer to the extentto which the task provides resources that are part of a person’s everyday activity (Roth, 1996).In order to better understand the sometimes crass differences we observed when scientists readour graphs versus their own, we unpack the situational differences in the two tasks as they relateto Ted and Karen.
We interviewed Ted in the familiar surroundings of his work, his office. Ted agreed toparticipate in our research and understands his interpretation as one that will help us betterunderstand graphing and how to teach it (better) in school and university contexts. More thananyone else, Ted took the task as a challenge with the fervor of a puzzle aficionado. He beganeach of the task reading the Cartesian graph without attending to the caption which, in someinstances, he covered up. Only when he felt he had said as much as he could did he read thecaption. But it was clear that we, the investigators, were somehow in control of the standardinterpretation. Our participants played the game of being interviewed for the benefit of futuregenerations of students who might receive improved instruction in graphing.
In this situation, Ted (as our other participants) engaged in a task whose central elements arenot from his everyday (work) life. Although he works with graphs on a regular basis, whichprovides him a familiarity with general graphical conventions, r, in the scientific community, Tedis neither familiar with the particular graphical relationships nor the standard referents of thisgraph within the ecology community. But because Ted wants to help us, he does what he can toproduce a reasonable interpretation. In the process, he has to find possible values for R, S, c tosatisfy the relation R = fr(S,c). Because different sets of values can satisfy the relation, Ted hasto bootstrap his understanding using what is available as resources and constraints. From our casestudy we can see that he draws on everyday and mathematical resources to get the processstarted. For example, he generates “limits in the environment,” “competition,” “trapping,”“fishing,” and so forth as situations that have a relation to the particular shape of the graphical

Professionals read graphs 23
sign. He also generates “non-linear systems,” “chaotic behavior,” “family of curves” asinterpretive resources from his work of modeling natural systems. We can then read ourtranscript of Ted’s activity as the protocol of an individual engaged in this bootstrappingprocess. This process involves entities that are assumed to be signs without knowing what theysignify. This bootstrapping process is a tentative and, as we saw in Ted, sometimes hazardous(because of the arbitrary nature of signs) tracing of a system of signification rules by means ofwhich sign-reference relations are established. Our protocol is therefore full of the mumbles andstumbles of real time activity in an unfamiliar environment. (See also Greeno [1991] for anenvironmental metaphor of situated knowing in a conceptual domain.)
In the present study, we used Karen to exemplify transparent reading of graphs. Hertransparent reading makes it seem as if reading graphs from one’s own work was automaticallytransparent. We do not want to suggest this. For example, it is likely (although we do not havedata to support this intuition) that Karen and her employer had to engage in a structuring processthat allowed them to find a correspondence between some state in the world (here “cloggedpipe”) and the sudden peak on the chart.
Explaining Work
When scientists interpreted their own graphs, the situation changed. They now moved onfamiliar terrain, knowing both the referent and sign domains. When the scientists and Karentalked about the graph from their work, they no longer simply provided uninterrupted readings.Although there were still considerable stretches when our participant read the graph, there werealso moments where the other people present (interviewers, visitors to farm and open house)asked for elaborations and explanations. The two types of situation differed as to who controlledwhat was interesting relative to the issues at hand. We discuss the two situations separately.
When the scientists and Karen presented, explained, and elaborated the graphs, much of whatthey said concerned thick descriptions of the contexts to which their graphs referred and thephenomena the graphs stood for. We exemplified this situation in the case of Karen. Working inthe community, knowing the farmers and their farming practices, as well as the physical,geographic, geological, and meteorological characteristics of the valley, provides Karen with a richtapestry of experiential and embodied knowing of the situation. Even if unarticulated, thisexperiential and embodied knowing constitutes a background that is the source of “sense” and“meaning” attributed to such entities as signs, objects, events, and activities. As we found out onmany excursions with her in and along the creek, to places overlooking the watershed, andobserving her at work building riffles, she has an intimate knowledge of the watershed. Throughher work, she is familiar with how particular events and conditions will change the creek (whichshe visibly inspects daily) and therefore the recordings of the pen chart. Each aspect of the graph(sign) has its place in a network of significant events and practices, characteristics of therecording device, how water level translates into the recording and its relation to the total rainfall.Therefore, when Karen reads the graph for the visitors to the farm at the open house ofenvironmental activists, we witness someone operating in her everyday context. Here, signsfunction against a background that the signs presuppose. In such situations, signs cannot beunderstood as mere relations; rather, signs and their signification are an integral part of the contextand they can be a sign only for those who dwell in this context (e.g., Dreyfus, 1991).
Professionals read graphs 24
Karen’s reading of the chart thereby has become transparent such that she is no longerconcerned with the material details of the signs themselves, but her reading leaps beyond to theworld she knows so well. The reverse movement from the world she knows to the expressivedomain also continuously happens. Provided any situation description, Karen projects withouthesitation what the graph will look like. Although she has not lived in the area for 20 years,Karen knows from the older residents that the valley has experienced a housing and road-buildingboom. Without deliberating, she knows what the graph would have looked like. Furthermore,elsewhere in our database, she discusses the impact of a projected housing development whichwould increase the number of inhabitants by 5,000: the impact would be disastrous as the waterflow patterns would increase even above the currently observed peaks, and the run-off would beeven faster. These events would then characterized by higher and narrower graphical peaks. Even“non-natural events” are transparently read from the chart [xvi]. Although she may not have seensuch a graphical feature before, Karen will actually have a reasonable answer if she is questionedabout a line that does not stand in a reciprocal relation with a natural event. This was the case inthe following exchange with a visitor. (Her interlocutor at this point is Walter, an inhabitant ofthe valley and mayor of the community.)
K: You get a bit of rain, you’re gonna take advantage of that rather than extract. . .W: Yeah and that’s still in June, so that’s still not be, there’d still be water in there, so.
What’s the blue line, just an ink thing?K: Yeah, yeah. Good question. I’ve never seen that before, my eyes peeling for the black
line. It’s just the end of the roll ‘cause I’ve got it taped right here.
Here, Karen was so much in her world, the one which includes the (black) curve, the waterflow, and the watershed which produces it, that she was oblivious to the blue streak made salientby Walter. Though she had not attended to the blue line, standing in front of a joint where tworolls pen chart were taped together, Karen attributed the streak to the end of the roll withoutdetailing why this might be so. From her experience, such a blue streak cannot have a referent inthe watershed so it disappeared from her lifeworld. Its referent has to be in the recordingmechanism and is therefore an artefact. Karen is not only familiar with the graphs as entities thatsignify, but especially with the particulars of the setting that led to the graphs. Through herwork, many if not most of the practically possible sets of values satisfying the relation R =fr(S,c) are so familiar that she no longer distinguishes between signs and what they stand for. Heractivity, as those of all scientists when they read graphs from their own work, was situated in thesense that they were dealing with familiar entities: the relevant signs, the objects and events thesesigns referred to, and the conventions regulating sign use.
When someone in the respective “audience” decided to ask a question, the control over salientissues changed. Although the scientists and Karen were still in control of the graphical display(qua experts), the settings to which the graph pointed were no longer under their control. Whatwas relevant at the moment, and how the information from the graph related to the world morebroadly, very much emerged from the interaction between the presenting person and the
Professionals read graphs 25
audience. In the following transcript, Karen had begun to point to a step in the curve explainingthat on this day, the people on her farm began to irrigate the field.
K: June 7th, this is when we began irrigating, full irrigation is starting here and so=W: =How many places in the creek are you pulling it out?K: Just, we only monitor the quantity taken out at Ocean Side Farm, we have no idea
what’s going on upstream. So we have a water meter that shows how much we’reextracting and we keep track, we have the pump on=
W: =That would be interesting in finding out, trying to get a rough idea of what otherpeople are pulling out. There is not much you can, you might not be able to quantifyit but at least just knowing. The dates that people pull out certain amounts, themultiple pumps that are working and the water they push out in an hour.
K: We kind of try to do that, like BC Environment has a list of all the licensed service. . .licenses and people with irrigation ponds and storage ponds and. . . We kind of did anumber and if anyone, if everyone were actually pumping those amounts at the sametime.
W: I used to have a license.
Although Karen wanted to go on and finish explaining the (to her) salient parts of the entirechart, Walter’s questions (as those of other people present) codetermined what was interestingand being talked about. Thus, Walter was interested in finding out about the number of placeswhere water is extracted from the creek and which therefore gives rise to the signal before them.Karen did not have an answer to this question but, in turn, discloses that her farm keeps track ofthe amount of water drawn from the creek. But Walter insisted on stating that it would beinteresting to know the exact number of users, the date and time of use, and the amount of watertaken by each user.
While such questions and elaborations did not elucidate the graphs qua representations, theydid a lot to elaborate the referent domain. They have become—in the words of Heidegger (1977),a philosopher who was, more than anyone else, concerned with everyday activity—pieces ofequipment that are ready-to-hand and which scientists therefore use transparently. Asequipment, the signs point out the context of practical activity which the scientists share withothers. That is, it was here that there was considerable intersection between the scientific expertof the graph and the persons in the audience. It was at this point that general interests inecological questions surfaced and were discussed rather than questions of S-R mapping or thenature of S. It is from these interactions that we actually found out a lot about the understandingsour participants had developed in the respective referent domains.
Discussion
In this study, we take a semiotic perspective on reading graphs which is grounded in theliterature on reading texts and graphics, that is, semiotics and hermeneutic phenomenology. Wetherefore conceptualize graphs and their captions (and other accompanying text) as multimodaltexts which are read by individuals of varying background. Each reader engages in semiotic and
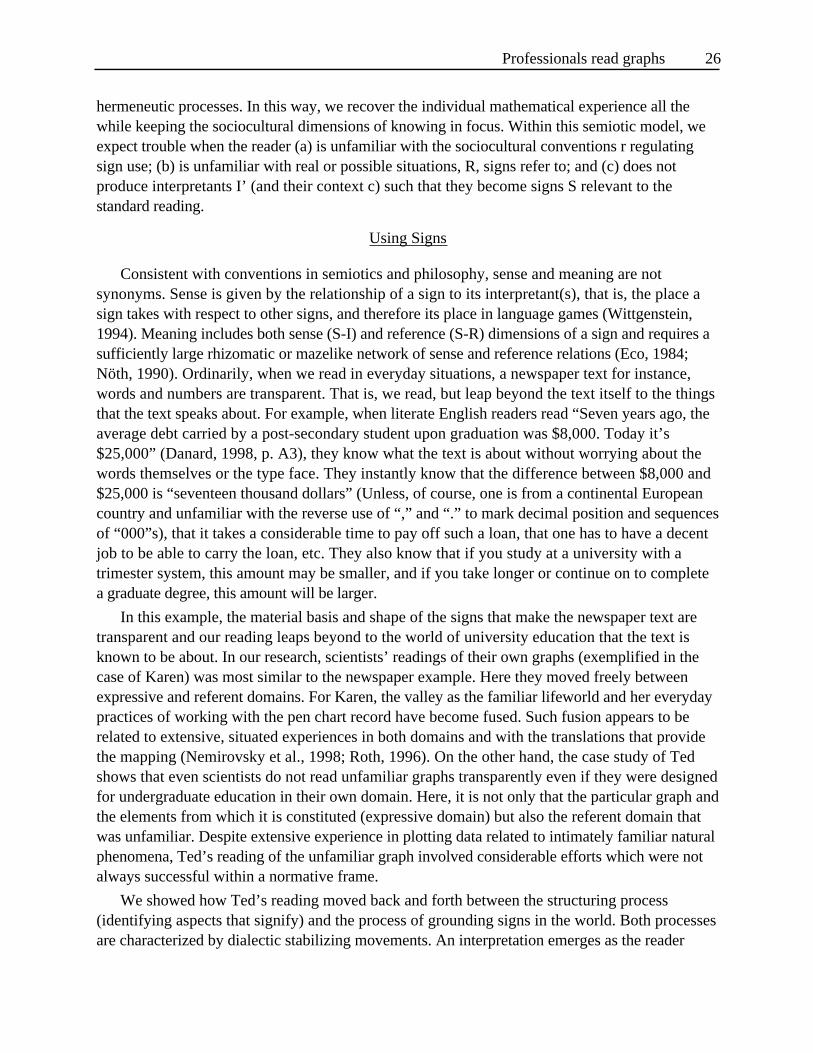
Professionals read graphs 26
hermeneutic processes. In this way, we recover the individual mathematical experience all thewhile keeping the sociocultural dimensions of knowing in focus. Within this semiotic model, weexpect trouble when the reader (a) is unfamiliar with the sociocultural conventions r regulatingsign use; (b) is unfamiliar with real or possible situations, R, signs refer to; and (c) does notproduce interpretants I’ (and their context c) such that they become signs S relevant to thestandard reading.
Using Signs
Consistent with conventions in semiotics and philosophy, sense and meaning are notsynonyms. Sense is given by the relationship of a sign to its interpretant(s), that is, the place asign takes with respect to other signs, and therefore its place in language games (Wittgenstein,1994). Meaning includes both sense (S-I) and reference (S-R) dimensions of a sign and requires asufficiently large rhizomatic or mazelike network of sense and reference relations (Eco, 1984;Nöth, 1990). Ordinarily, when we read in everyday situations, a newspaper text for instance,words and numbers are transparent. That is, we read, but leap beyond the text itself to the thingsthat the text speaks about. For example, when literate English readers read “Seven years ago, theaverage debt carried by a post-secondary student upon graduation was $8,000. Today it’s$25,000” (Danard, 1998, p. A3), they know what the text is about without worrying about thewords themselves or the type face. They instantly know that the difference between $8,000 and$25,000 is “seventeen thousand dollars” (Unless, of course, one is from a continental Europeancountry and unfamiliar with the reverse use of “,” and “.” to mark decimal position and sequencesof “000”s), that it takes a considerable time to pay off such a loan, that one has to have a decentjob to be able to carry the loan, etc. They also know that if you study at a university with atrimester system, this amount may be smaller, and if you take longer or continue on to completea graduate degree, this amount will be larger.
In this example, the material basis and shape of the signs that make the newspaper text aretransparent and our reading leaps beyond to the world of university education that the text isknown to be about. In our research, scientists’ readings of their own graphs (exemplified in thecase of Karen) was most similar to the newspaper example. Here they moved freely betweenexpressive and referent domains. For Karen, the valley as the familiar lifeworld and her everydaypractices of working with the pen chart record have become fused. Such fusion appears to berelated to extensive, situated experiences in both domains and with the translations that providethe mapping (Nemirovsky et al., 1998; Roth, 1996). On the other hand, the case study of Tedshows that even scientists do not read unfamiliar graphs transparently even if they were designedfor undergraduate education in their own domain. Here, it is not only that the particular graph andthe elements from which it is constituted (expressive domain) but also the referent domain thatwas unfamiliar. Despite extensive experience in plotting data related to intimately familiar naturalphenomena, Ted’s reading of the unfamiliar graph involved considerable efforts which were notalways successful within a normative frame.
We showed how Ted’s reading moved back and forth between the structuring process(identifying aspects that signify) and the process of grounding signs in the world. Both processesare characterized by dialectic stabilizing movements. An interpretation emerges as the reader
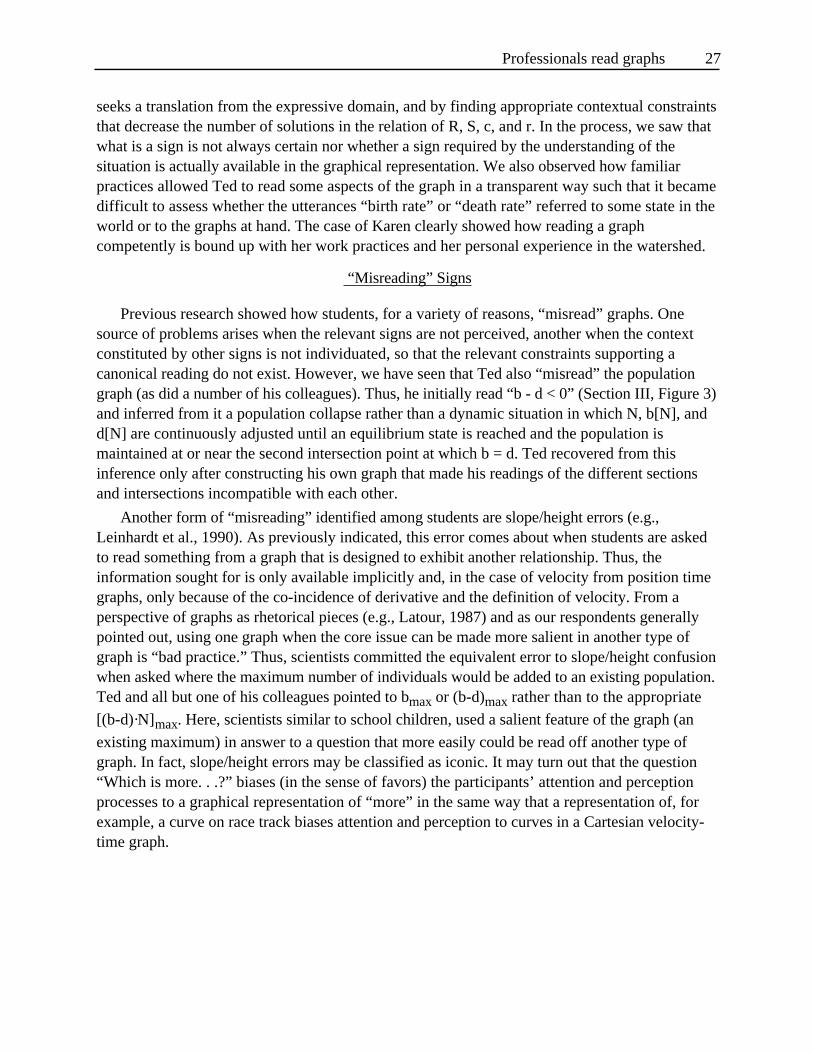
Professionals read graphs 27
seeks a translation from the expressive domain, and by finding appropriate contextual constraintsthat decrease the number of solutions in the relation of R, S, c, and r. In the process, we saw thatwhat is a sign is not always certain nor whether a sign required by the understanding of thesituation is actually available in the graphical representation. We also observed how familiarpractices allowed Ted to read some aspects of the graph in a transparent way such that it becamedifficult to assess whether the utterances “birth rate” or “death rate” referred to some state in theworld or to the graphs at hand. The case of Karen clearly showed how reading a graphcompetently is bound up with her work practices and her personal experience in the watershed.
“Misreading” Signs
Previous research showed how students, for a variety of reasons, “misread” graphs. Onesource of problems arises when the relevant signs are not perceived, another when the contextconstituted by other signs is not individuated, so that the relevant constraints supporting acanonical reading do not exist. However, we have seen that Ted also “misread” the populationgraph (as did a number of his colleagues). Thus, he initially read “b - d < 0” (Section III, Figure 3)and inferred from it a population collapse rather than a dynamic situation in which N, b[N], andd[N] are continuously adjusted until an equilibrium state is reached and the population ismaintained at or near the second intersection point at which b = d. Ted recovered from thisinference only after constructing his own graph that made his readings of the different sectionsand intersections incompatible with each other.
Another form of “misreading” identified among students are slope/height errors (e.g.,Leinhardt et al., 1990). As previously indicated, this error comes about when students are askedto read something from a graph that is designed to exhibit another relationship. Thus, theinformation sought for is only available implicitly and, in the case of velocity from position timegraphs, only because of the co-incidence of derivative and the definition of velocity. From aperspective of graphs as rhetorical pieces (e.g., Latour, 1987) and as our respondents generallypointed out, using one graph when the core issue can be made more salient in another type ofgraph is “bad practice.” Thus, scientists committed the equivalent error to slope/height confusionwhen asked where the maximum number of individuals would be added to an existing population.Ted and all but one of his colleagues pointed to bmax or (b-d)max rather than to the appropriate[(b-d)·N]max. Here, scientists similar to school children, used a salient feature of the graph (anexisting maximum) in answer to a question that more easily could be read off another type ofgraph. In fact, slope/height errors may be classified as iconic. It may turn out that the question“Which is more. . .?” biases (in the sense of favors) the participants’ attention and perceptionprocesses to a graphical representation of “more” in the same way that a representation of, forexample, a curve on race track biases attention and perception to curves in a Cartesian velocity-time graph.
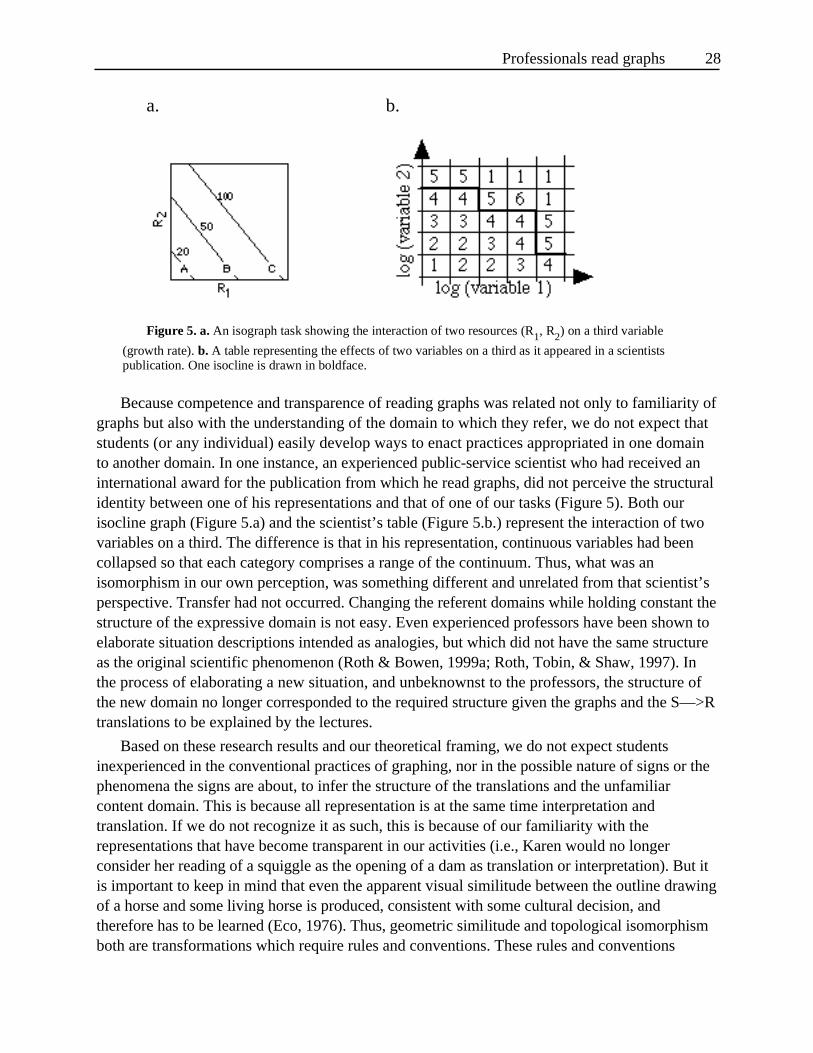
Professionals read graphs 28
Because competence and transparence of reading graphs was related not only to familiarity ofgraphs but also with the understanding of the domain to which they refer, we do not expect thatstudents (or any individual) easily develop ways to enact practices appropriated in one domainto another domain. In one instance, an experienced public-service scientist who had received aninternational award for the publication from which he read graphs, did not perceive the structuralidentity between one of his representations and that of one of our tasks (Figure 5). Both ourisocline graph (Figure 5.a) and the scientist’s table (Figure 5.b.) represent the interaction of twovariables on a third. The difference is that in his representation, continuous variables had beencollapsed so that each category comprises a range of the continuum. Thus, what was anisomorphism in our own perception, was something different and unrelated from that scientist’sperspective. Transfer had not occurred. Changing the referent domains while holding constant thestructure of the expressive domain is not easy. Even experienced professors have been shown toelaborate situation descriptions intended as analogies, but which did not have the same structureas the original scientific phenomenon (Roth & Bowen, 1999a; Roth, Tobin, & Shaw, 1997). Inthe process of elaborating a new situation, and unbeknownst to the professors, the structure ofthe new domain no longer corresponded to the required structure given the graphs and the S—>Rtranslations to be explained by the lectures.
Based on these research results and our theoretical framing, we do not expect studentsinexperienced in the conventional practices of graphing, nor in the possible nature of signs or thephenomena the signs are about, to infer the structure of the translations and the unfamiliarcontent domain. This is because all representation is at the same time interpretation andtranslation. If we do not recognize it as such, this is because of our familiarity with therepresentations that have become transparent in our activities (i.e., Karen would no longerconsider her reading of a squiggle as the opening of a dam as translation or interpretation). But itis important to keep in mind that even the apparent visual similitude between the outline drawingof a horse and some living horse is produced, consistent with some cultural decision, andtherefore has to be learned (Eco, 1976). Thus, geometric similitude and topological isomorphismboth are transformations which require rules and conventions. These rules and conventions
a. b.
Figure 5. a. An isograph task showing the interaction of two resources (R1, R2) on a third variable
(growth rate). b. A table representing the effects of two variables on a third as it appeared in a scientistspublication. One isocline is drawn in boldface.
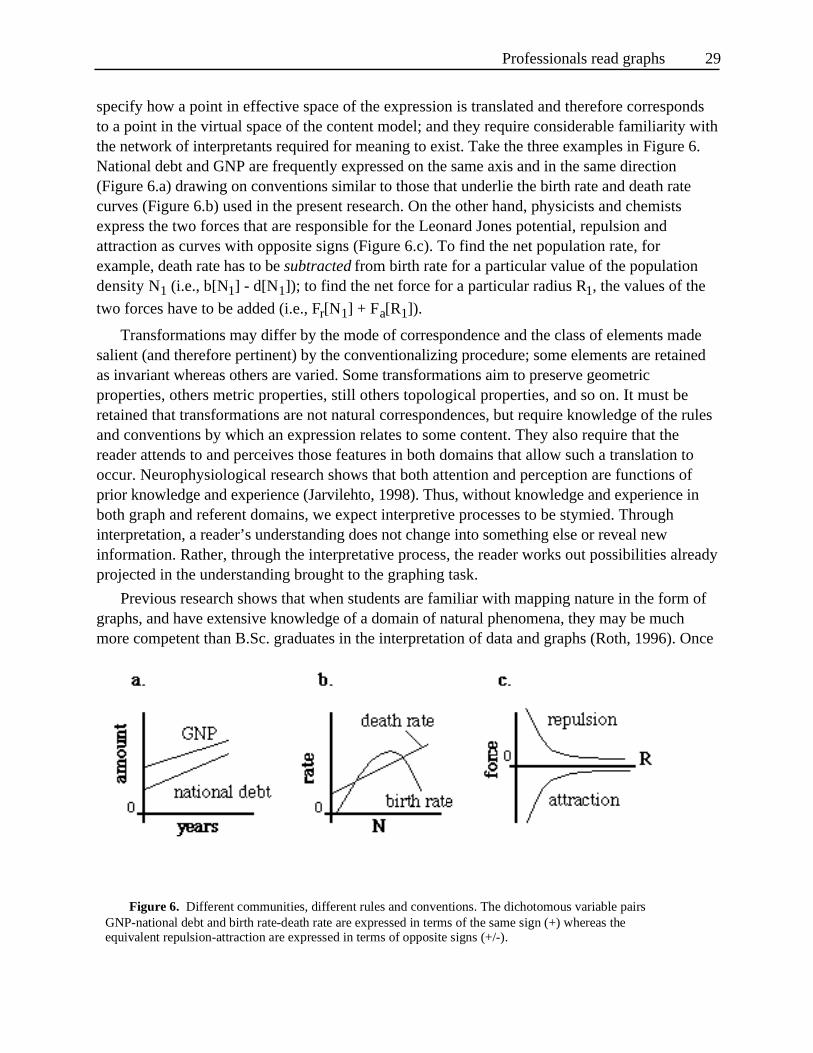
Professionals read graphs 29
specify how a point in effective space of the expression is translated and therefore correspondsto a point in the virtual space of the content model; and they require considerable familiarity withthe network of interpretants required for meaning to exist. Take the three examples in Figure 6.National debt and GNP are frequently expressed on the same axis and in the same direction(Figure 6.a) drawing on conventions similar to those that underlie the birth rate and death ratecurves (Figure 6.b) used in the present research. On the other hand, physicists and chemistsexpress the two forces that are responsible for the Leonard Jones potential, repulsion andattraction as curves with opposite signs (Figure 6.c). To find the net population rate, forexample, death rate has to be subtracted from birth rate for a particular value of the populationdensity N1 (i.e., b[N1] - d[N1]); to find the net force for a particular radius R1, the values of thetwo forces have to be added (i.e., Fr[N1] + Fa[R1]).
Transformations may differ by the mode of correspondence and the class of elements madesalient (and therefore pertinent) by the conventionalizing procedure; some elements are retainedas invariant whereas others are varied. Some transformations aim to preserve geometricproperties, others metric properties, still others topological properties, and so on. It must beretained that transformations are not natural correspondences, but require knowledge of the rulesand conventions by which an expression relates to some content. They also require that thereader attends to and perceives those features in both domains that allow such a translation tooccur. Neurophysiological research shows that both attention and perception are functions ofprior knowledge and experience (Jarvilehto, 1998). Thus, without knowledge and experience inboth graph and referent domains, we expect interpretive processes to be stymied. Throughinterpretation, a reader’s understanding does not change into something else or reveal newinformation. Rather, through the interpretative process, the reader works out possibilities alreadyprojected in the understanding brought to the graphing task.
Previous research shows that when students are familiar with mapping nature in the form ofgraphs, and have extensive knowledge of a domain of natural phenomena, they may be muchmore competent than B.Sc. graduates in the interpretation of data and graphs (Roth, 1996). Once
Figure 6. Different communities, different rules and conventions. The dichotomous variable pairsGNP-national debt and birth rate-death rate are expressed in terms of the same sign (+) whereas theequivalent repulsion-attraction are expressed in terms of opposite signs (+/-).
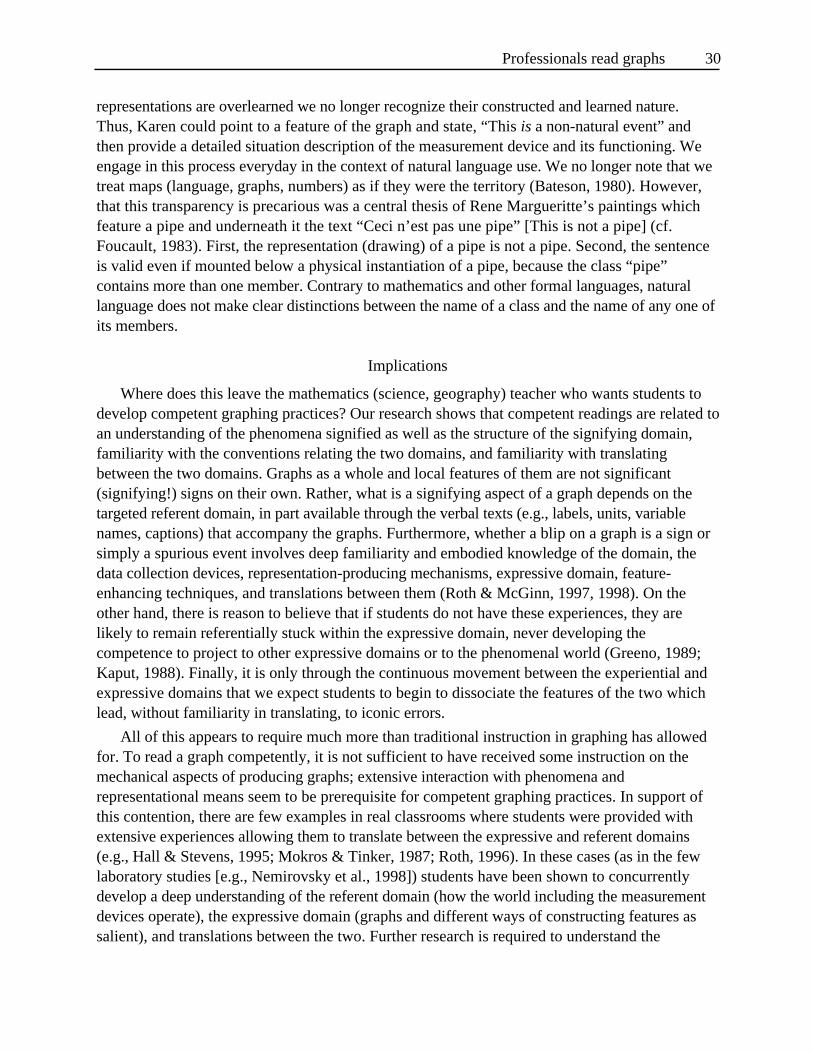
Professionals read graphs 30
representations are overlearned we no longer recognize their constructed and learned nature.Thus, Karen could point to a feature of the graph and state, “This is a non-natural event” andthen provide a detailed situation description of the measurement device and its functioning. Weengage in this process everyday in the context of natural language use. We no longer note that wetreat maps (language, graphs, numbers) as if they were the territory (Bateson, 1980). However,that this transparency is precarious was a central thesis of Rene Margueritte’s paintings whichfeature a pipe and underneath it the text “Ceci n’est pas une pipe” [This is not a pipe] (cf.Foucault, 1983). First, the representation (drawing) of a pipe is not a pipe. Second, the sentenceis valid even if mounted below a physical instantiation of a pipe, because the class “pipe”contains more than one member. Contrary to mathematics and other formal languages, naturallanguage does not make clear distinctions between the name of a class and the name of any one ofits members.
Implications
Where does this leave the mathematics (science, geography) teacher who wants students todevelop competent graphing practices? Our research shows that competent readings are related toan understanding of the phenomena signified as well as the structure of the signifying domain,familiarity with the conventions relating the two domains, and familiarity with translatingbetween the two domains. Graphs as a whole and local features of them are not significant(signifying!) signs on their own. Rather, what is a signifying aspect of a graph depends on thetargeted referent domain, in part available through the verbal texts (e.g., labels, units, variablenames, captions) that accompany the graphs. Furthermore, whether a blip on a graph is a sign orsimply a spurious event involves deep familiarity and embodied knowledge of the domain, thedata collection devices, representation-producing mechanisms, expressive domain, feature-enhancing techniques, and translations between them (Roth & McGinn, 1997, 1998). On theother hand, there is reason to believe that if students do not have these experiences, they arelikely to remain referentially stuck within the expressive domain, never developing thecompetence to project to other expressive domains or to the phenomenal world (Greeno, 1989;Kaput, 1988). Finally, it is only through the continuous movement between the experiential andexpressive domains that we expect students to begin to dissociate the features of the two whichlead, without familiarity in translating, to iconic errors.
All of this appears to require much more than traditional instruction in graphing has allowedfor. To read a graph competently, it is not sufficient to have received some instruction on themechanical aspects of producing graphs; extensive interaction with phenomena andrepresentational means seem to be prerequisite for competent graphing practices. In support ofthis contention, there are few examples in real classrooms where students were provided withextensive experiences allowing them to translate between the expressive and referent domains(e.g., Hall & Stevens, 1995; Mokros & Tinker, 1987; Roth, 1996). In these cases (as in the fewlaboratory studies [e.g., Nemirovsky et al., 1998]) students have been shown to concurrentlydevelop a deep understanding of the referent domain (how the world including the measurementdevices operate), the expressive domain (graphs and different ways of constructing features assalient), and translations between the two. Further research is required to understand the
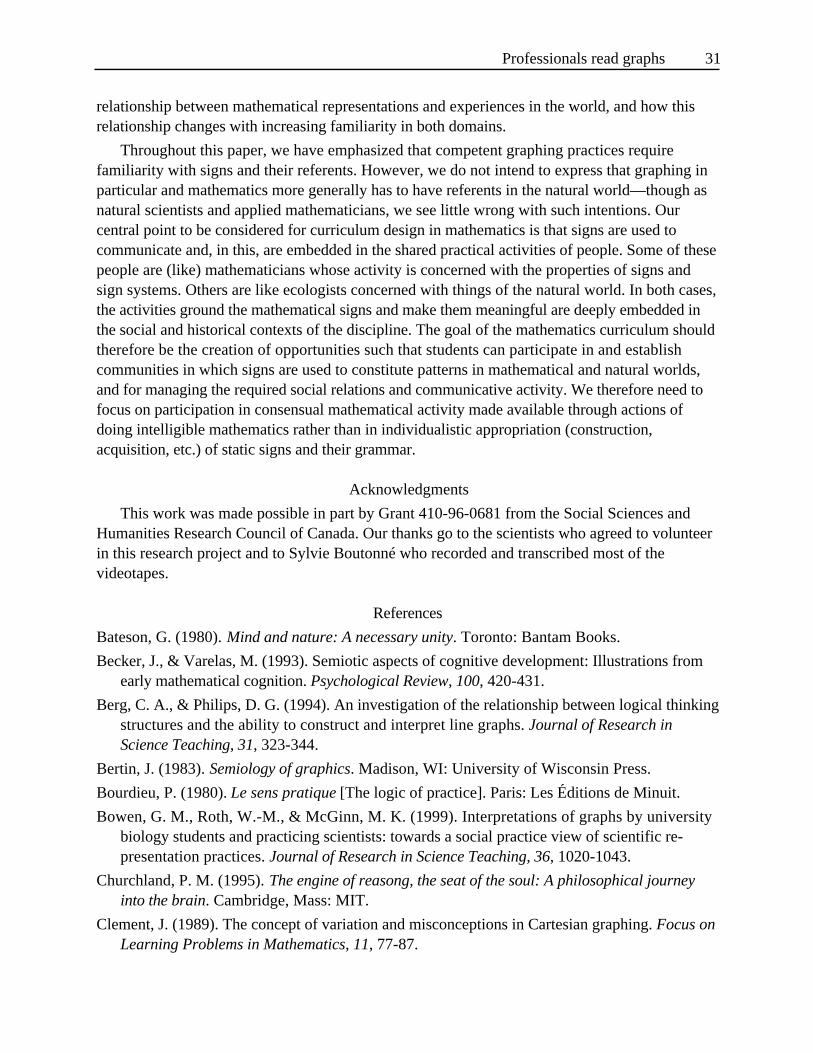
Professionals read graphs 31
relationship between mathematical representations and experiences in the world, and how thisrelationship changes with increasing familiarity in both domains.
Throughout this paper, we have emphasized that competent graphing practices requirefamiliarity with signs and their referents. However, we do not intend to express that graphing inparticular and mathematics more generally has to have referents in the natural world—though asnatural scientists and applied mathematicians, we see little wrong with such intentions. Ourcentral point to be considered for curriculum design in mathematics is that signs are used tocommunicate and, in this, are embedded in the shared practical activities of people. Some of thesepeople are (like) mathematicians whose activity is concerned with the properties of signs andsign systems. Others are like ecologists concerned with things of the natural world. In both cases,the activities ground the mathematical signs and make them meaningful are deeply embedded inthe social and historical contexts of the discipline. The goal of the mathematics curriculum shouldtherefore be the creation of opportunities such that students can participate in and establishcommunities in which signs are used to constitute patterns in mathematical and natural worlds,and for managing the required social relations and communicative activity. We therefore need tofocus on participation in consensual mathematical activity made available through actions ofdoing intelligible mathematics rather than in individualistic appropriation (construction,acquisition, etc.) of static signs and their grammar.
Acknowledgments
This work was made possible in part by Grant 410-96-0681 from the Social Sciences andHumanities Research Council of Canada. Our thanks go to the scientists who agreed to volunteerin this research project and to Sylvie Boutonné who recorded and transcribed most of thevideotapes.
References
Bateson, G. (1980). Mind and nature: A necessary unity. Toronto: Bantam Books.
Becker, J., & Varelas, M. (1993). Semiotic aspects of cognitive development: Illustrations fromearly mathematical cognition. Psychological Review, 100, 420-431.
Berg, C. A., & Philips, D. G. (1994). An investigation of the relationship between logical thinkingstructures and the ability to construct and interpret line graphs. Journal of Research inScience Teaching, 31, 323-344.
Bertin, J. (1983). Semiology of graphics. Madison, WI: University of Wisconsin Press.
Bourdieu, P. (1980). Le sens pratique [The logic of practice]. Paris: Les Éditions de Minuit.
Bowen, G. M., Roth, W.-M., & McGinn, M. K. (1999). Interpretations of graphs by universitybiology students and practicing scientists: towards a social practice view of scientific re-presentation practices. Journal of Research in Science Teaching, 36, 1020-1043.
Churchland, P. M. (1995). The engine of reasong, the seat of the soul: A philosophical journeyinto the brain. Cambridge, Mass: MIT.
Clement, J. (1989). The concept of variation and misconceptions in Cartesian graphing. Focus onLearning Problems in Mathematics, 11, 77-87.
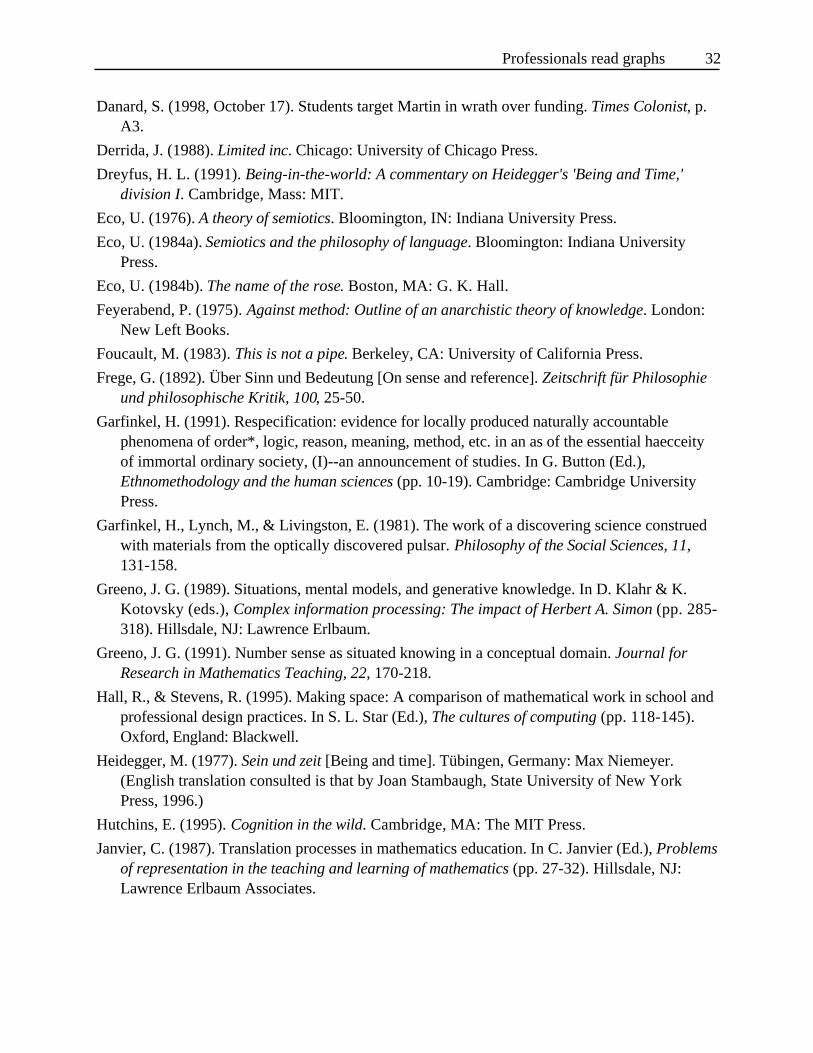
Professionals read graphs 32
Danard, S. (1998, October 17). Students target Martin in wrath over funding. Times Colonist, p.A3.
Derrida, J. (1988). Limited inc. Chicago: University of Chicago Press.
Dreyfus, H. L. (1991). Being-in-the-world: A commentary on Heidegger's 'Being and Time,'division I. Cambridge, Mass: MIT.
Eco, U. (1976). A theory of semiotics. Bloomington, IN: Indiana University Press.
Eco, U. (1984a). Semiotics and the philosophy of language. Bloomington: Indiana UniversityPress.
Eco, U. (1984b). The name of the rose. Boston, MA: G. K. Hall.
Feyerabend, P. (1975). Against method: Outline of an anarchistic theory of knowledge. London:New Left Books.
Foucault, M. (1983). This is not a pipe. Berkeley, CA: University of California Press.
Frege, G. (1892). Über Sinn und Bedeutung [On sense and reference]. Zeitschrift für Philosophieund philosophische Kritik, 100, 25-50.
Garfinkel, H. (1991). Respecification: evidence for locally produced naturally accountablephenomena of order*, logic, reason, meaning, method, etc. in an as of the essential haecceityof immortal ordinary society, (I)--an announcement of studies. In G. Button (Ed.),Ethnomethodology and the human sciences (pp. 10-19). Cambridge: Cambridge UniversityPress.
Garfinkel, H., Lynch, M., & Livingston, E. (1981). The work of a discovering science construedwith materials from the optically discovered pulsar. Philosophy of the Social Sciences, 11,131-158.
Greeno, J. G. (1989). Situations, mental models, and generative knowledge. In D. Klahr & K.Kotovsky (eds.), Complex information processing: The impact of Herbert A. Simon (pp. 285-318). Hillsdale, NJ: Lawrence Erlbaum.
Greeno, J. G. (1991). Number sense as situated knowing in a conceptual domain. Journal forResearch in Mathematics Teaching, 22, 170-218.
Hall, R., & Stevens, R. (1995). Making space: A comparison of mathematical work in school andprofessional design practices. In S. L. Star (Ed.), The cultures of computing (pp. 118-145).Oxford, England: Blackwell.
Heidegger, M. (1977). Sein und zeit [Being and time]. Tübingen, Germany: Max Niemeyer.(English translation consulted is that by Joan Stambaugh, State University of New YorkPress, 1996.)
Hutchins, E. (1995). Cognition in the wild. Cambridge, MA: The MIT Press.
Janvier, C. (1987). Translation processes in mathematics education. In C. Janvier (Ed.), Problemsof representation in the teaching and learning of mathematics (pp. 27-32). Hillsdale, NJ:Lawrence Erlbaum Associates.
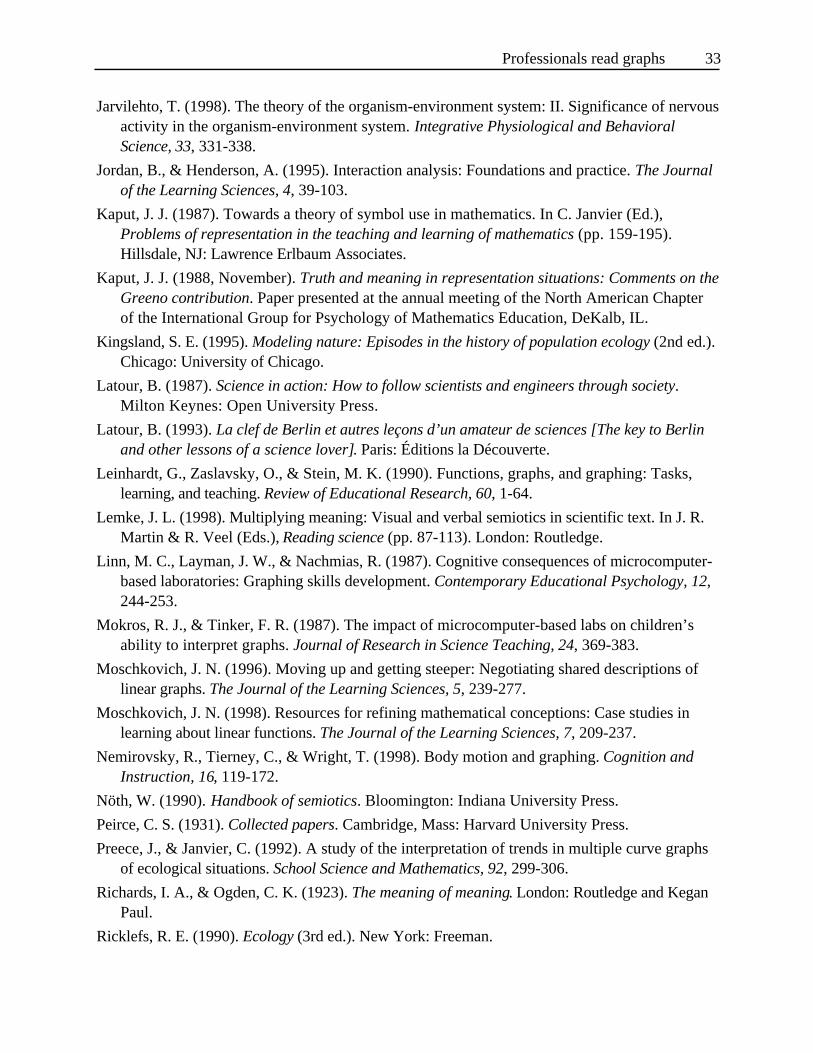
Professionals read graphs 33
Jarvilehto, T. (1998). The theory of the organism-environment system: II. Significance of nervousactivity in the organism-environment system. Integrative Physiological and BehavioralScience, 33, 331-338.
Jordan, B., & Henderson, A. (1995). Interaction analysis: Foundations and practice. The Journalof the Learning Sciences, 4, 39-103.
Kaput, J. J. (1987). Towards a theory of symbol use in mathematics. In C. Janvier (Ed.),Problems of representation in the teaching and learning of mathematics (pp. 159-195).Hillsdale, NJ: Lawrence Erlbaum Associates.
Kaput, J. J. (1988, November). Truth and meaning in representation situations: Comments on theGreeno contribution. Paper presented at the annual meeting of the North American Chapterof the International Group for Psychology of Mathematics Education, DeKalb, IL.
Kingsland, S. E. (1995). Modeling nature: Episodes in the history of population ecology (2nd ed.).Chicago: University of Chicago.
Latour, B. (1987). Science in action: How to follow scientists and engineers through society.Milton Keynes: Open University Press.
Latour, B. (1993). La clef de Berlin et autres leçons d’un amateur de sciences [The key to Berlinand other lessons of a science lover]. Paris: Éditions la Découverte.
Leinhardt, G., Zaslavsky, O., & Stein, M. K. (1990). Functions, graphs, and graphing: Tasks,learning, and teaching. Review of Educational Research, 60, 1-64.
Lemke, J. L. (1998). Multiplying meaning: Visual and verbal semiotics in scientific text. In J. R.Martin & R. Veel (Eds.), Reading science (pp. 87-113). London: Routledge.
Linn, M. C., Layman, J. W., & Nachmias, R. (1987). Cognitive consequences of microcomputer-based laboratories: Graphing skills development. Contemporary Educational Psychology, 12,244-253.
Mokros, R. J., & Tinker, F. R. (1987). The impact of microcomputer-based labs on children’sability to interpret graphs. Journal of Research in Science Teaching, 24, 369-383.
Moschkovich, J. N. (1996). Moving up and getting steeper: Negotiating shared descriptions oflinear graphs. The Journal of the Learning Sciences, 5, 239-277.
Moschkovich, J. N. (1998). Resources for refining mathematical conceptions: Case studies inlearning about linear functions. The Journal of the Learning Sciences, 7, 209-237.
Nemirovsky, R., Tierney, C., & Wright, T. (1998). Body motion and graphing. Cognition andInstruction, 16, 119-172.
Nöth, W. (1990). Handbook of semiotics. Bloomington: Indiana University Press.
Peirce, C. S. (1931). Collected papers. Cambridge, Mass: Harvard University Press.
Preece, J., & Janvier, C. (1992). A study of the interpretation of trends in multiple curve graphsof ecological situations. School Science and Mathematics, 92, 299-306.
Richards, I. A., & Ogden, C. K. (1923). The meaning of meaning. London: Routledge and KeganPaul.
Ricklefs, R. E. (1990). Ecology (3rd ed.). New York: Freeman.
Professionals read graphs 34
Ricœur, P. (1991). From text to action: Essays in hermeneutics, II. Evanston, IL: NorthwesternUniversity Press.
Roth, W.-M. (1993). Problem-centered learning or the integration of mathematics and science in aconstructivist laboratory: A case study. School Science and Mathematics, 93, 113-122.
Roth, W.-M. (1996). Where is the context in contextual word problems?: Mathematical practicesand products in Grade 8 students’ answers to story problems. Cognition and Instruction, 14,487-527.
Roth, W.-M. (1998). Unspecified things, signs, and ‘natural objects’: Towards aphenomenological hermeneutic of graphing. In S. B. Berenson, K. R. Dawson, M. Blanton,W. N. Coulombe, J. Kolb, K. Norwood, & L. Stiff (Eds.), Proceedings of the TwentiethAnnual Meeting of the North American Chapter of the International Group for the Psychologyof Mathematics Education (pp. 291-297). Columbus, OH: ERIC Clearinghouse for Science,Mathematics, and Environmental Education.
Roth, W.-M. , & Bowen, G. M. (1999a). Complexities of graphical representations duringlectures: A phenomenological approach. Learning and Instruction, 9, 235-255.
Roth, W.-M., & Bowen, G. M. (1999b). Digitising lizards or the topology of vision in ecologicalfieldwork. Social Studies of Science, 29, 627-654.
Roth, W.-M., & Bowen, G. M. (1999c). Of cannibals, missionaries, and converts: graphingcompetencies from grade 8 to professional science inside (classrooms) and outside(field/laboratory). Science, Technology, & Human Values, 24, 179-212.
Roth, W.-M., Bowen, G. M., & McGinn, M. K. (1999). Differences in graph-related practicesbetween high school biology textbooks and scientific ecology journals. Journal of Research inScience Teaching, 36, 977-1019.
Roth, W.-M., & McGinn, M. K. (1997). Graphing: A cognitive ability or cultural practice?Science Education, 81, 91-106.
Roth, W.-M., & McGinn, M. K. (1998). Inscriptions: a social practice approach to“representations.” Review of Educational Research, 68, 35-59.
Roth, W.-M., Tobin, K., & Shaw, K. (1997). Cascades of inscriptions and the re-presentation ofnature: How numbers, tables, graphs, and money come to re-present a rolling ball.International Journal of Science Education, 19, 1075-1091.
Saint-Martin, F. (1990). Semiotics of visual language. Bloomington, IN: Indiana UniversityPress.
Schoenfeld, A. H., Smith, J. P., & Arcavi, A. A. (1994). Learning. In R. Glaser (Ed.), Advances ininstructional psychology (Vol. 4, pp. 55-175). Hillsdale, NJ: Lawrence Erlbaum Associates.
Wittgenstein, L. (1994/1958). Philosophical investigations (3rd ed.). New York: Macmillan.
Woolgar, S. (1990). Time and documents in researcher interaction: Some ways of making outwhat is happening in experimental science. In M. Lynch & S. Woolgar (Eds.), Representationin scientific practice (pp. 123-152). Cambridge, MA: MIT Press.