Embed Size (px)
Citation preview
Professor Jean-Yves DuclosUniversité Laval, Canada
&Audrey Verdier-Chouchane
African Development BankTunisia, October 27-29, 2010
Outline
� Framework for Pro-Poor Growth Analysis
� Case studies of Mauritius and South Africa
� Conclusions
2
Framework for Pro-Poor Growth AnalysisDebate on Absolute or Relative Pro-Poor Growth
� Absolute Approach: Growth must reduce poverty i.e. increase the income of the poor by a positive amount. (Ravallion and Chen, 2003)(Ravallion and Chen, 2003)
� Relative Approach: Growth must benefit the poor proportionately more than the non-poor. It should therefore reduce inequality. (Kakwani and Pernia, 2000)
3
Framework for Pro-Poor Growth AnalysisMethodology for Pro-Poor Growth Analysis
� Calculation of Poverty Indices or FGT indices (Foster, Greer and Thorbecke, 1984) -> Poverty incidence and intensity
� Growth Incidence Curves -> Impact of growth in the � Growth Incidence Curves -> Impact of growth in the different quantiles of the population
� Lorentz Curves and Gini Index -> Importance of inequality
� Indices of Pro-Poorness -> Relative or Absolute pro-poorness
� Growth-Redistribution Decompositions -> “Growth” and “inequality” components of poverty change.
4
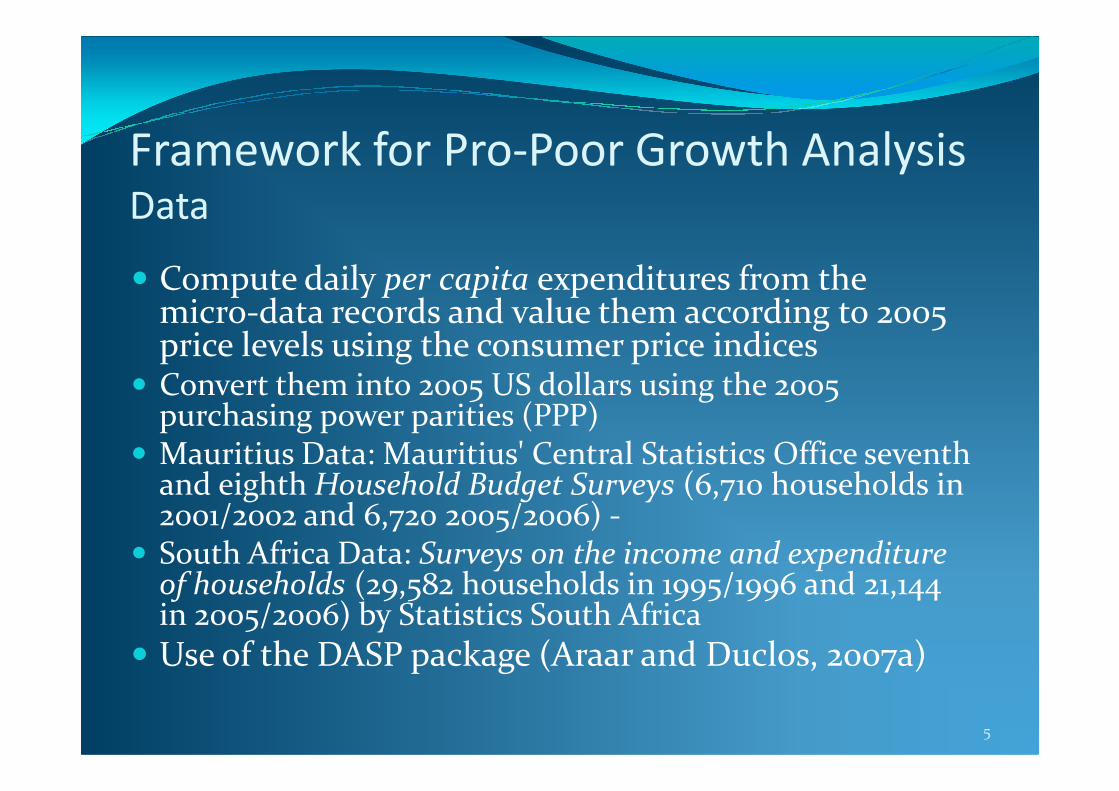
Framework for Pro-Poor Growth AnalysisData
� Compute daily per capita expenditures from the micro-data records and value them according to 2005 price levels using the consumer price indices
� Convert them into 2005 US dollars using the 2005 purchasing power parities (PPP)
� Convert them into 2005 US dollars using the 2005 purchasing power parities (PPP)
� Mauritius Data: Mauritius' Central Statistics Office seventh and eighth Household Budget Surveys (6,710 households in 2001/2002 and 6,720 2005/2006) -
� South Africa Data: Surveys on the income and expenditure of households (29,582 households in 1995/1996 and 21,144 in 2005/2006) by Statistics South Africa
� Use of the DASP package (Araar and Duclos, 2007a)
5
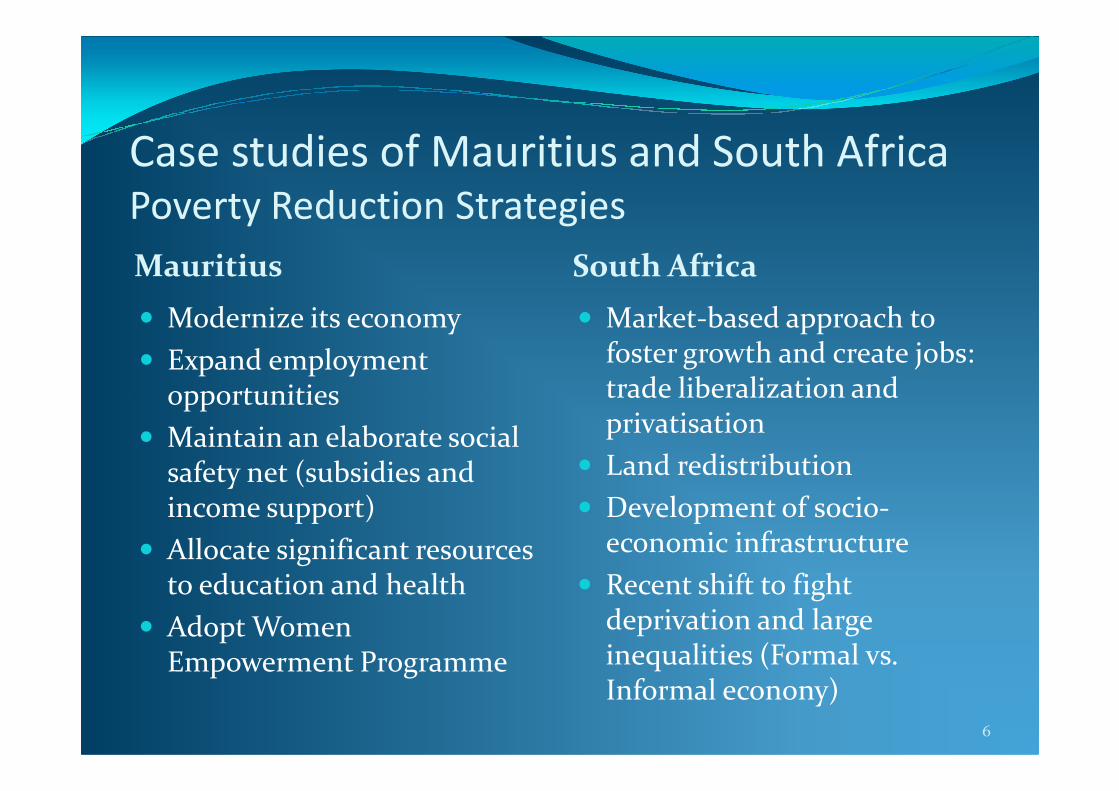
Case studies of Mauritius and South Africa
Poverty Reduction Strategies
Mauritius South Africa
� Modernize its economy
� Expand employment opportunities
� Market-based approach to foster growth and create jobs: trade liberalization and opportunities
� Maintain an elaborate social safety net (subsidies and income support)
� Allocate significant resources to education and health
� Adopt Women Empowerment Programme
trade liberalization and privatisation
� Land redistribution
� Development of socio-economic infrastructure
� Recent shift to fight deprivation and large inequalities (Formal vs. Informal econony)
6
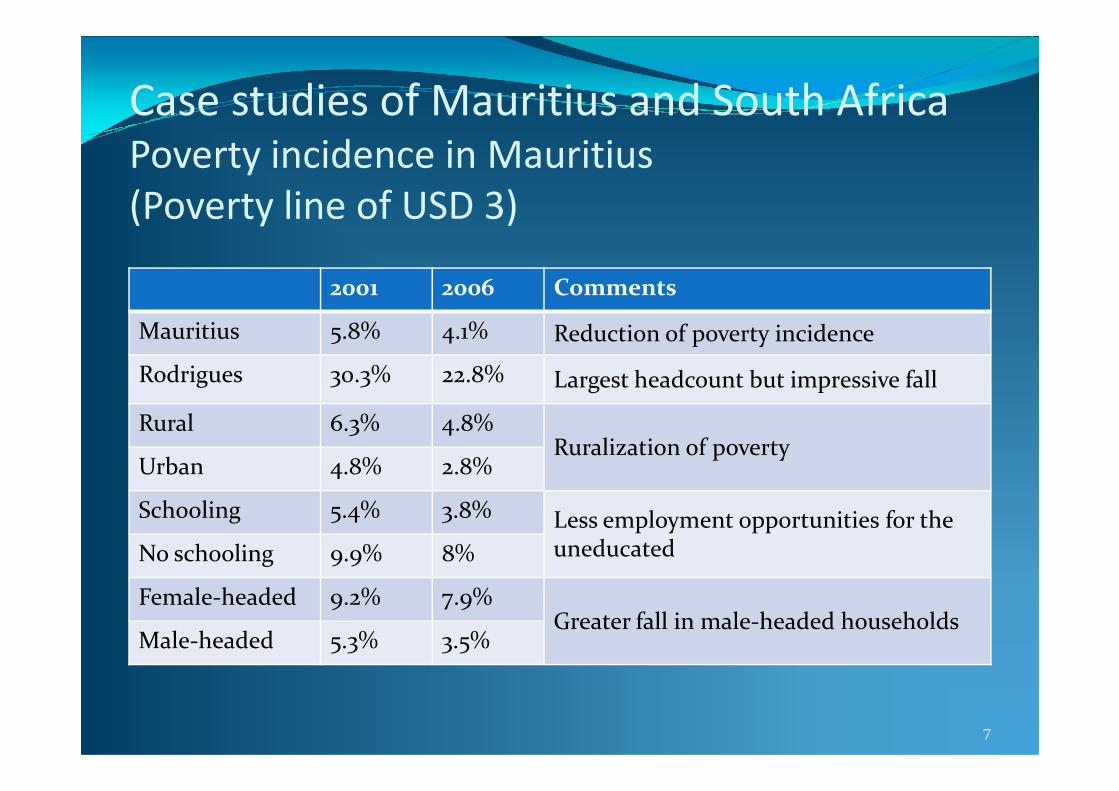
Case studies of Mauritius and South Africa
Poverty incidence in Mauritius
(Poverty line of USD 3)
2001 2006 Comments
Mauritius 5.8% 4.1% Reduction of poverty incidence
Rodrigues 30.3% 22.8% Largest headcount but impressive fall
Rural 6.3% 4.8%Ruralization of poverty
Urban 4.8% 2.8%
Schooling 5.4% 3.8% Less employment opportunities for the uneducatedNo schooling 9.9% 8%
Female-headed 9.2% 7.9%Greater fall in male-headed households
Male-headed 5.3% 3.5%
7
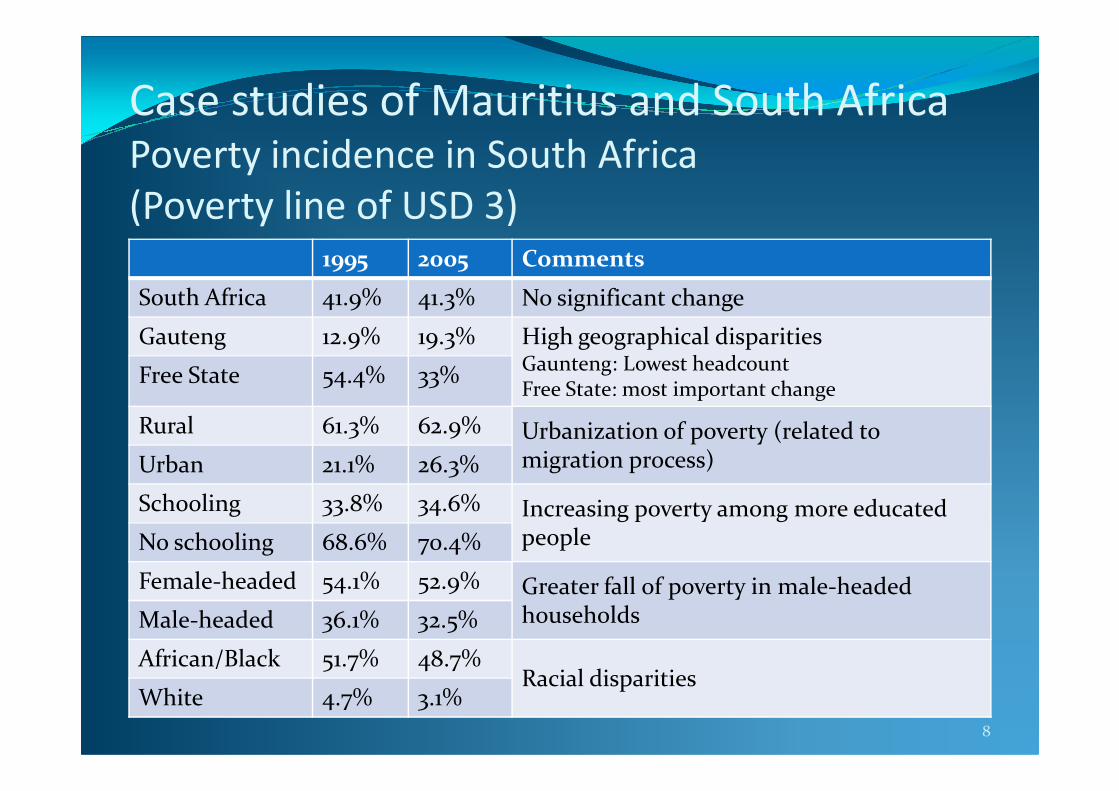
Case studies of Mauritius and South Africa
Poverty incidence in South Africa
(Poverty line of USD 3)
1995 2005 Comments
South Africa 41.9% 41.3% No significant change
Gauteng 12.9% 19.3% High geographical disparitiesGaunteng: Lowest headcountFree State: most important change
Free State 54.4% 33%Free State: most important change
Rural 61.3% 62.9% Urbanization of poverty (related to migration process)Urban 21.1% 26.3%
Schooling 33.8% 34.6% Increasing poverty among more educatedpeopleNo schooling 68.6% 70.4%
Female-headed 54.1% 52.9% Greater fall of poverty in male-headedhouseholdsMale-headed 36.1% 32.5%
African/Black 51.7% 48.7%Racial disparities
White 4.7% 3.1%
8
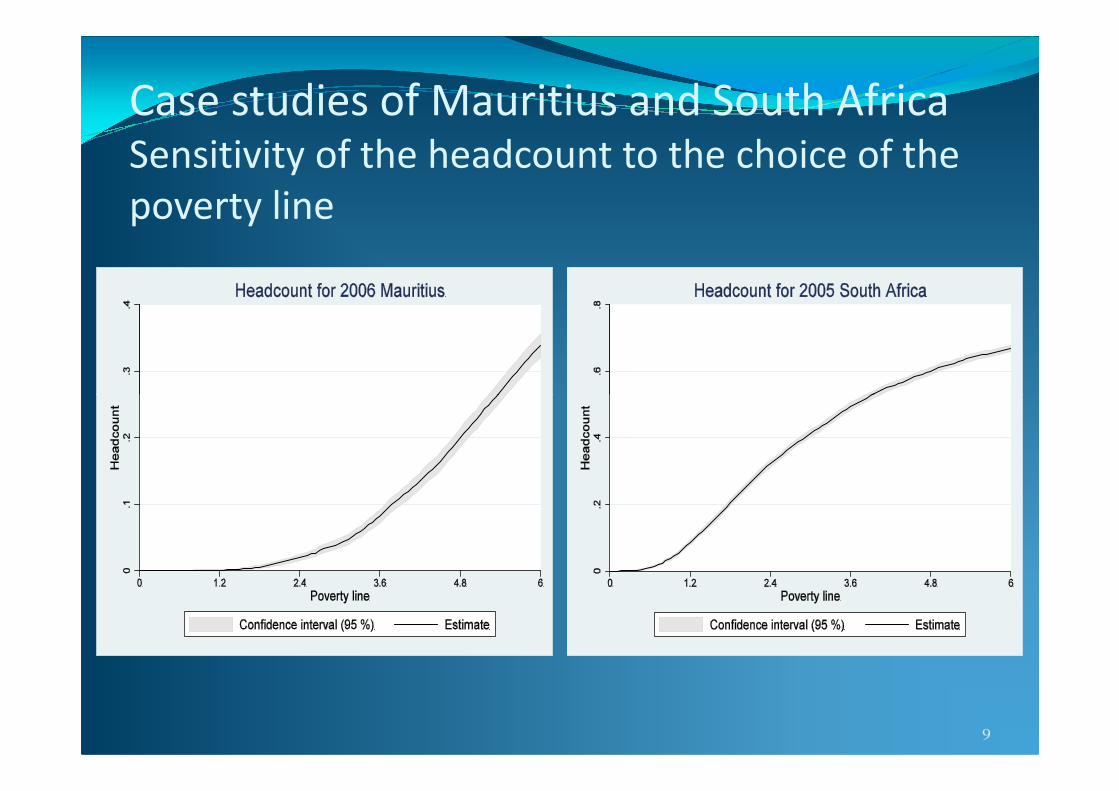
Case studies of Mauritius and South Africa
Sensitivity of the headcount to the choice of the
poverty line
9
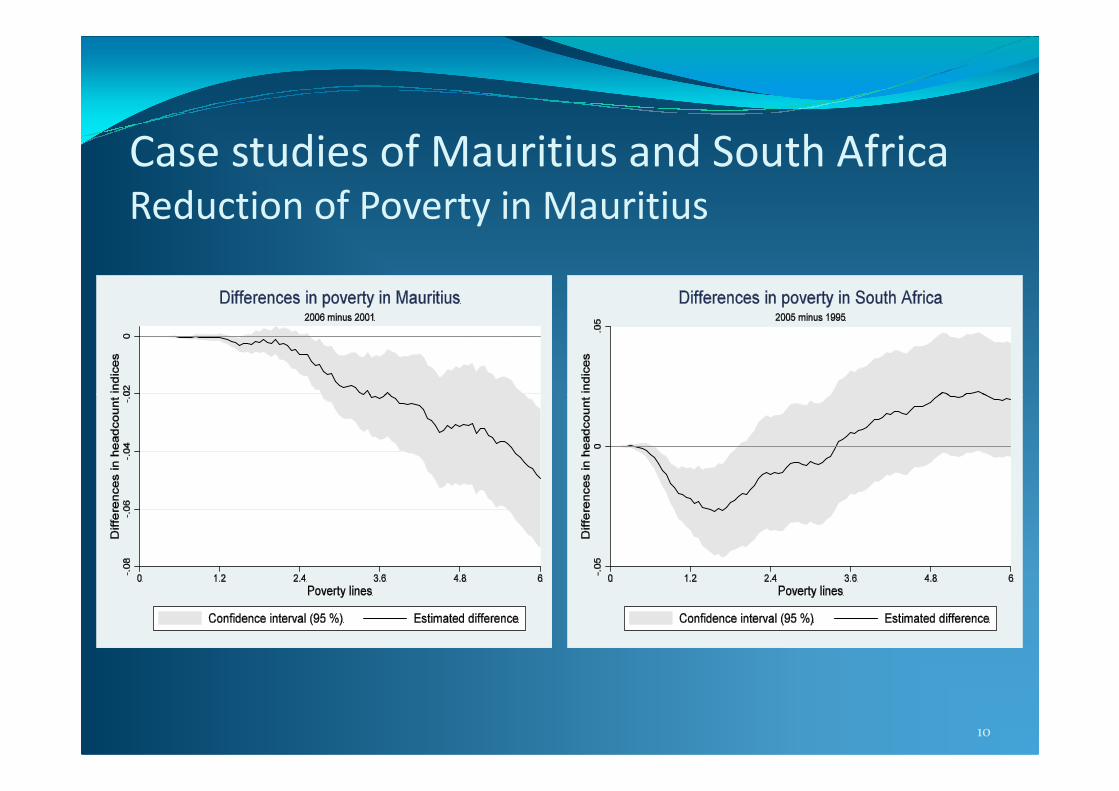
Case studies of Mauritius and South Africa
Reduction of Poverty in Mauritius
10
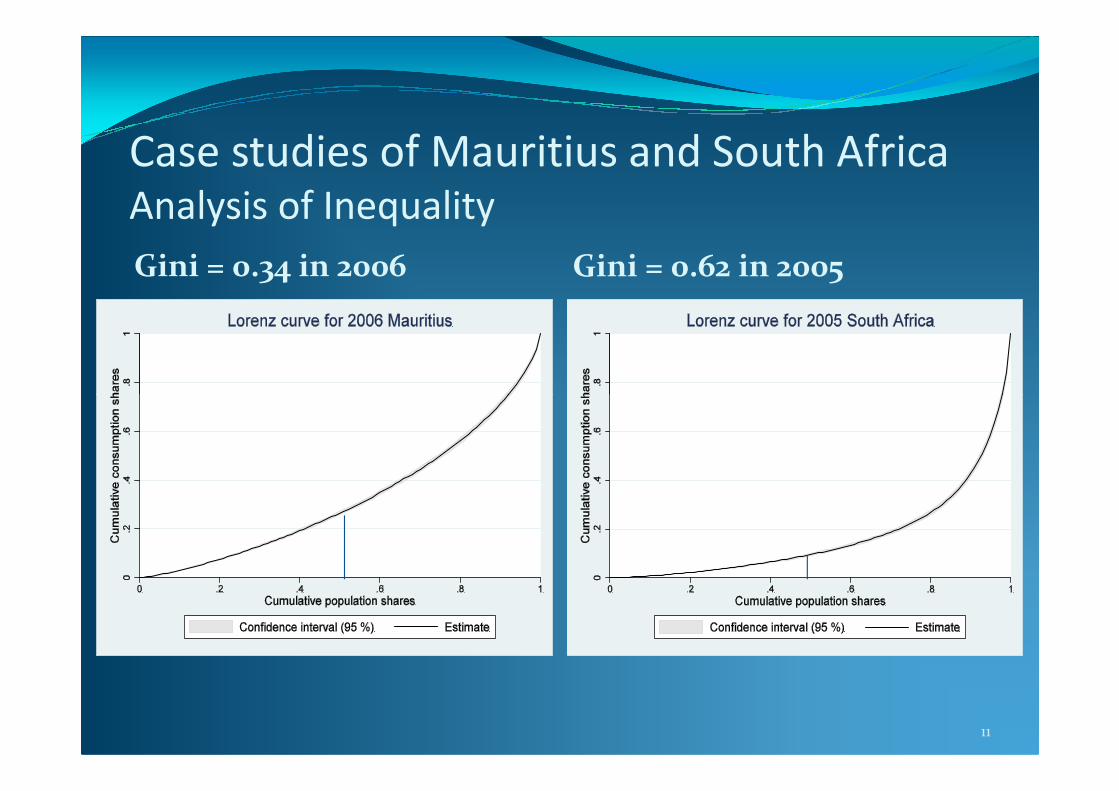
Case studies of Mauritius and South Africa
Analysis of Inequality
Gini = 0.34 in 2006 Gini = 0.62 in 2005
11
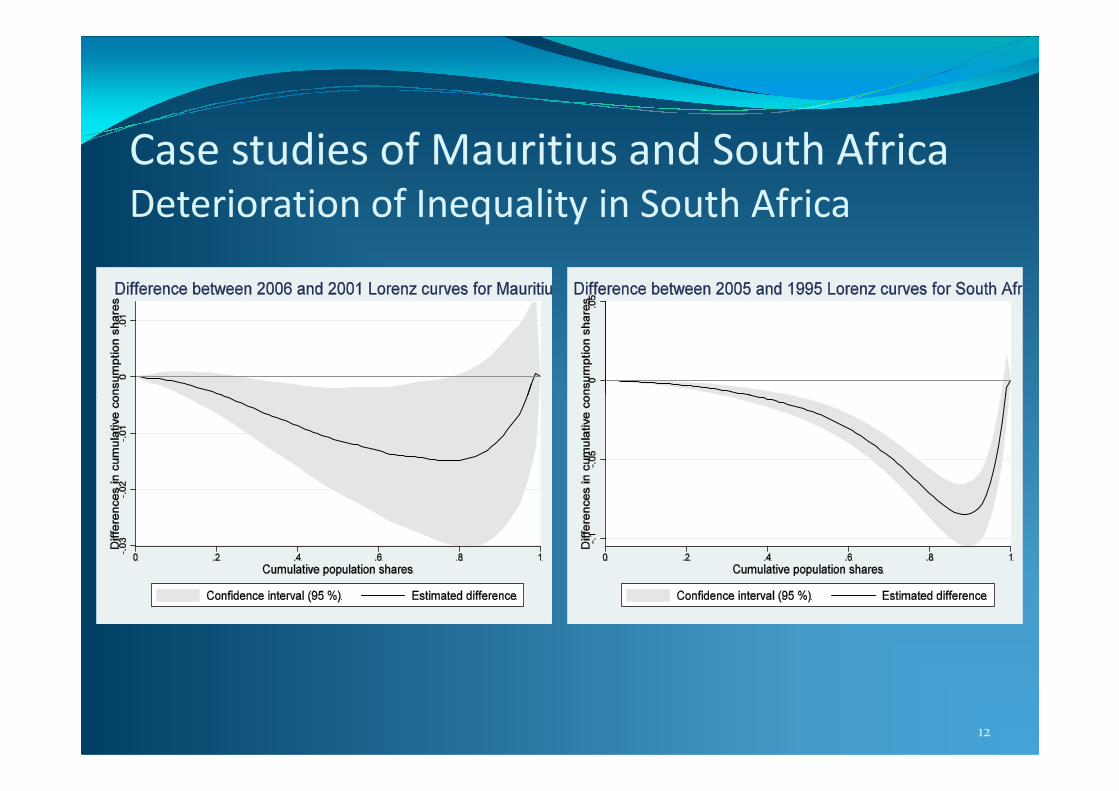
Case studies of Mauritius and South Africa
Deterioration of Inequality in South Africa
12
Case studies of Mauritius and South Africa
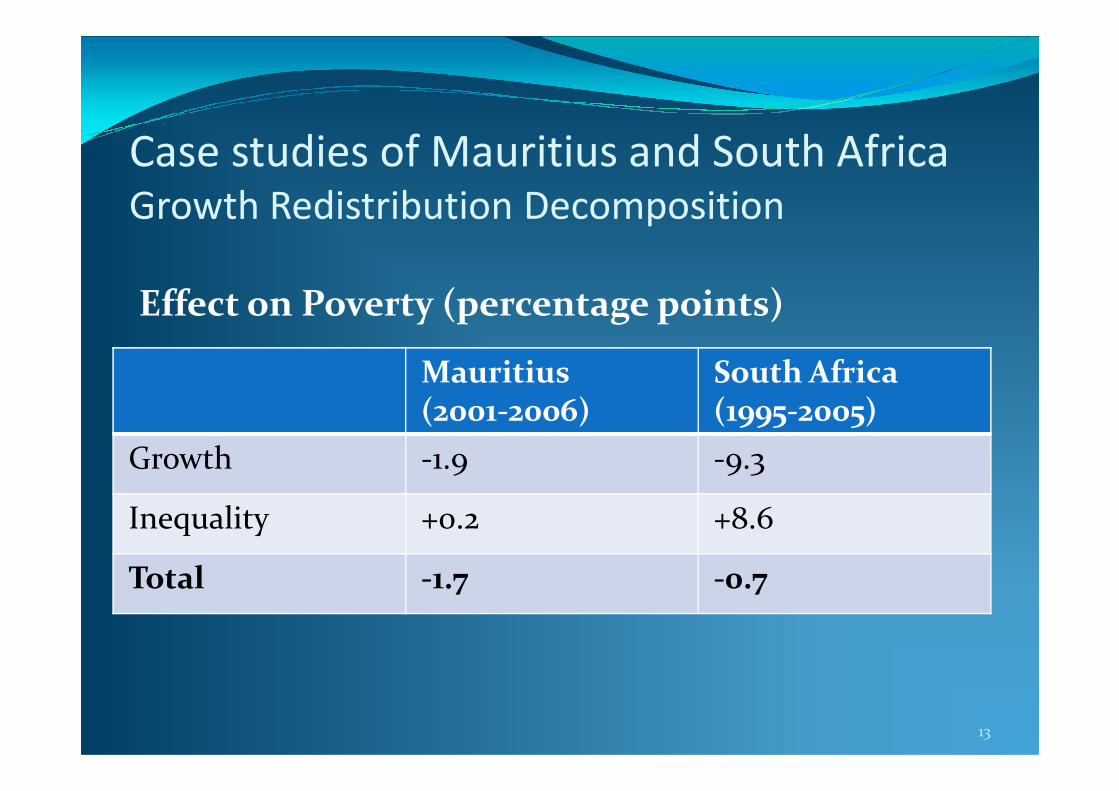
Growth Redistribution Decomposition
Mauritius(2001-2006)
South Africa(1995-2005)
Effect on Poverty (percentage points)
(2001-2006) (1995-2005)
Growth -1.9 -9.3
Inequality +0.2 +8.6
Total -1.7 -0.7
13
Case studies of Mauritius and South Africa
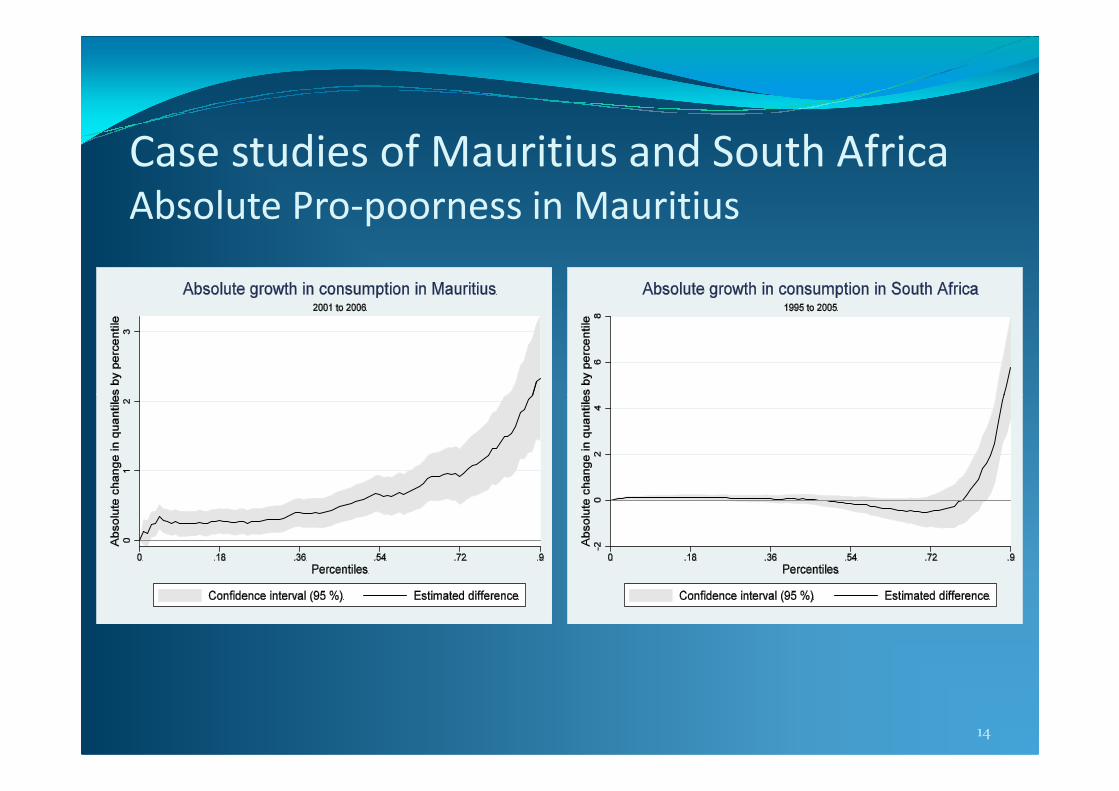
Absolute Pro-poorness in Mauritius
14
Case studies of Mauritius and South Africa
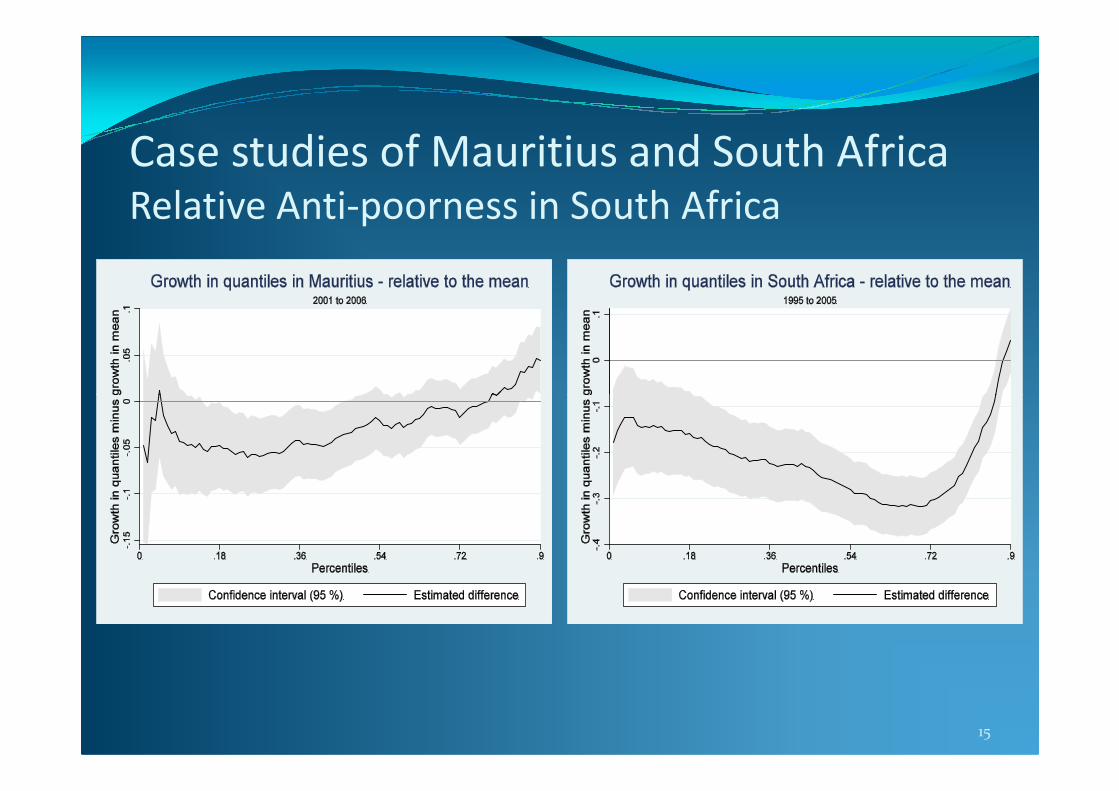
Relative Anti-poorness in South Africa
15
ConclusionsSummary
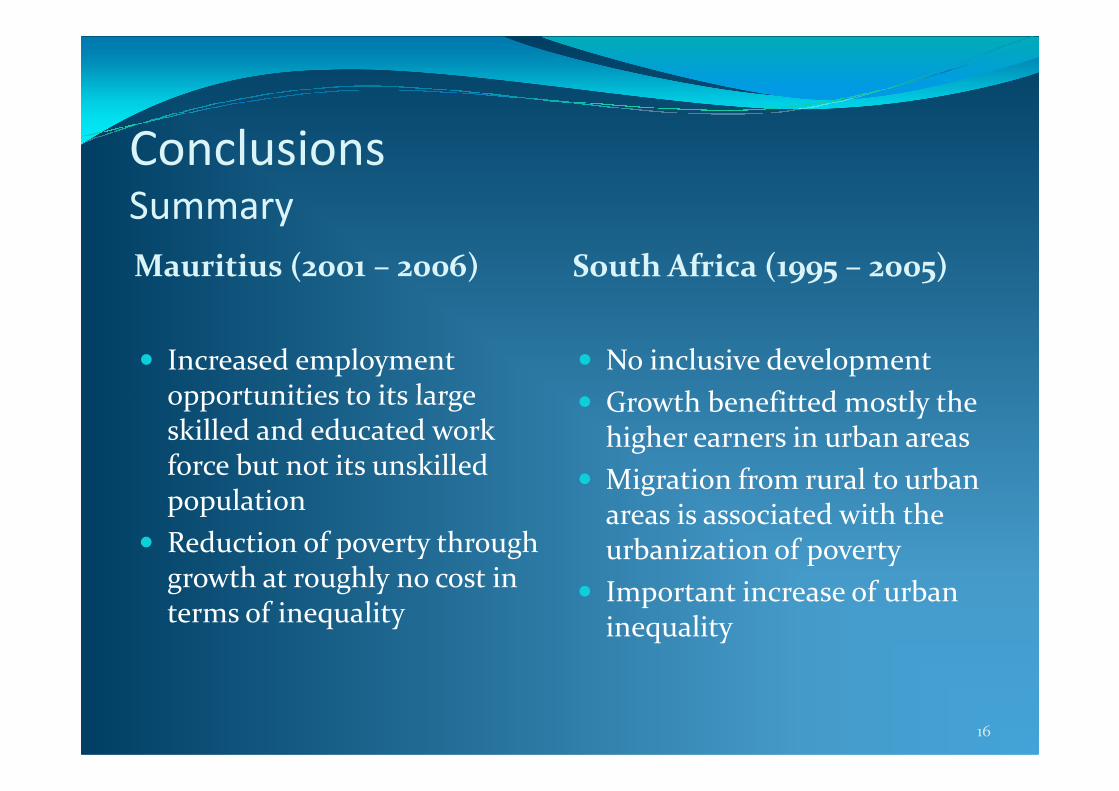
Mauritius (2001 – 2006) South Africa (1995 – 2005)
� Increased employment opportunities to its large
� No inclusive development
� Growth benefitted mostly the opportunities to its large skilled and educated work force but not its unskilled population
� Reduction of poverty through growth at roughly no cost in terms of inequality
� Growth benefitted mostly the higher earners in urban areas
� Migration from rural to urban areas is associated with the urbanization of poverty
� Important increase of urban inequality
16
ConclusionsPolicy Implications
� Alleviate the effect of migration on urban poverty (social integration, training and educational services, etc.)
� Address labor market issues (better functioning, � Address labor market issues (better functioning, integration of informal with formal labor)
� Foster human capital development (particularly for women)
� Empower women (as an effective driver of development and poverty reduction)
� Spur growth but take into account the possible impact of growth on inequality
17
http://www.afdb.org/aechttp://www.afdb.org/aec
“Overcoming poverty is not a gesture of charity. It is an act of justice. It is the protection of a fundamental human right,
the right to dignity and a decent life . . .”
Nelson Mandela