Embed Size (px)
Citation preview
Professor Marilen PIRTEA, PhD
E-mail: [email protected]
Lecturer Cristina NICOLESCU, PhD
E-mail: [email protected]
Teaching assistant Claudiu BOŢOC1, PhD
E-mail: [email protected]
West University of Timişoara, Romania,
Faculty of Economics and Business Administration
DO ROMANIAN COMPANIES FOLLOW PECKING ORDER
FINANCING?
Abstract. Capital structure represents the combination of certain types of
instruments issued by a company in order to support its assets. The main aim of the
paper is to check if there is support for Pecking Order theory of capital structure
for Romanian companies, through the relation between debt ratio and profitability.
Secondary, we need to check if this relationship is linear or non-linear. In order to
test these hypotheses we have employed large database, which contains the first
2000 major and most performing Romanian companies for period 2003-2011. The
results do not reject any of hypotheses. There is a non-linear and negative relation
between debt ratio and profitability, which support the pecking order theory.
Keywords: Capital structure, pecking order theory, profitability, non linear,
taxation.
JEL classification: G32; G30; G31; H32.
1. Introduction
Capital structure represents the combination of certain types of instruments
issued by a company in order to support its assets. The financial policy mosaic is
one of leading decisions that a company can ever fathom, consisting in determining
the optimal capital structure.
Moreover, the capital structure issue has recently gained additional weight
in theoretical and empirical studies since many companies have experienced
financial hardship due to the recently financial crisis.
1 We gratefully acknowledge constructive comments from the participants of the 1st International Conference Current Economic Trends in Emerging and Developing Countries (TIMTED 2013) and the participants of the 8th
International Conference on Economic Cybernetic Analysis: Development and resources (DERS 2013). All
remaining errors are our responsability.
Marilen Pirtea, Cristina Nicolescu, Claudiu Boţoc
_________________________________________________________________
The rich literature on this subject indicates that the modern theory of
capital structure began with the paper of Modigliani and Miller (1958) (Rajan and
Zingales (1995); Harris and Raviv (1991)). Briefly, the MM evidence shows that
the firm value is not dependent of its corporate financing decisions under certain
restrictive conditions. The question is: in which conditions does capital structure
matter?
According to Myers (2001),”there is no general theory of the debt-equity
choice, and no reason to expect one.” The literature suggests that the capital
structure theories can be divided into two groups: the trade-off models (static),
according to whom there is an optimal debt-equity ratio for each organization and
the pecking-order theory, arguing that there is no defined target capital structure.
The pecking order theory (Myers and Majluf (1984)) suggests that firms
prefer internal funds rather than external funds. There are conflicting points of
view concerning the relationship between profitability and financial leverage.
(Rajan and Zingales, 1995); Myers and Majluf (1984) find a negative relationship
according to the pecking order theory while Jensen (1986) finds a positive
relationship between the two variables if the market is strong and a negative
relationship between profitability and leverage if the market is inefficient.
The main aim of the paper is to check if there is support for Pecking Order
theory of capital structure for Romanian companies, through the relation between
debt ratio and profitability. Secondary, we need to check if this relationship is
linear or non-linear, by using both polynomial model and quantile regression
approaches. In order to test these hypotheses we have employed a large database,
which contains the first 2000 major and most performing Romanian companies for
the period 2003-2011. To our knowledge, this is the largest sample used to test
pecking order theory for Romanian companies. The results do not reject any of
hypotheses. There is a non-linear and negative relationship between debt ratio and
profitability, which supports the pecking order theory. Furthermore, we found that
larger firms rather use internal sources and do not benefit from tax advantage of
debt.
The paper is organized as follows. Section 2 highlights theoretical
considerations regarding the main capital structure theories and determinants.
Section 3 briefly describes data collection, variables used in the empirical model
and methodological framework. Summary statistics and empirical results are
reported in section 4 and section 5. Section 6 summarizes the conclusions of the
paper.
2. Literature review
According to Harris and Raviv (1991), the balance is when the financial
leverage increases with fixed assets, tax shields, investment opportunities, and firm
size, and decreases with expenses, volatility, advertising the bankruptcy
probability, profitability, and uniqueness.” Titman and Wessels (1988) investigate
determinants such as asset structure, growth, tax shields, uniqueness, industry
Do Romanian Companies Follow Pecking Order Financing ?
classification, size, earnings volatility and profitability, and they find that these
factors can affect leverage according to the main capital structure theories.
Regarding the small and medium sized enterprises (SMEs), Michaelas et.
al. (1999) state that the investigated determinants of capital structure (size,
profitability, growth etc.) are relevant for both short and long-term debt ratios.
Based on a cross-sectional analysis of leverage in UK companies, Bevan
and Danbolt (2000) find differences in the determinants of different forms of debt,
short and long-term.
Recently, there are a growing number of studies that provide evidence
regarding the capital structure determinants of companies from the emerging
markets. The research being concerned with predicting pecking order theory for
companies` capital structure in Romania, which is considered an emerging market,
we will largely highlight the results of other empirical studies on emerging
economies.
Patrik Bauer (2004) examines some selected determinants of capital
structure of listed companies in the Czech Republic during the period 2000 to
2001: size, profitability, tangibility, growth opportunities, tax, non-debt tax shields,
volatility, and industry classification. Czech listed firms` financial leverage
depends on the valuation method; respectively it has a low value if it is measured
in book value and has a greater value if measured in market value. The author`s
results suggest that the financial leverage is positively correlated with its size and
negatively correlated with its profitability and tangibility. Also, the author finds a
negative correlation between leverage at market value and development
opportunities. On the other hand, leverage is positively correlated with tax and
negatively correlated with tax shields.
Fakher Buferna, Kenbata Bangassa and Lynn Hodgkinson (2008)
investigate the conduct towards the financial policy of Libyan companies. The
authors` intention is to explore the best based capital structure theory for Libyan
companies. This intention is tested by investigating the correlation between
different types of debt and four chosen capital hypotheses, based on comparing the
relationships between long and short term debt and four explanatory variables that
represent profitability, growth, tangibility and size. The methodology was
developed to assess which capital structure theories best explained Libyan
companies’ capital structure. The authors` results show that the relevant theories to
Libyan companies are the static trade-off theory and the agency cost theory.
A. Shahjahanpour, H. Ghalambor, A. Aflatooni (2010) intend to determine
a number of factors that affect the capital structure of companies, using a cross
sectional analysis, also investigating the applicability of two main capital structure
theories for the data set, deriving from the financial statements of Iranian listed
companies. The dependent variables include long and short-term debt while the
independent variables refer to: liquidity, tax rate, payout ratio, tax shield and
uniqueness. The results show that, in the case of the Iranian listed companies, the
capital structure decisions are mostly matching the pecking order theory (60%)
while the other 40% are consistent with the static trade off theory.
Marilen Pirtea, Cristina Nicolescu, Claudiu Boţoc
_________________________________________________________________
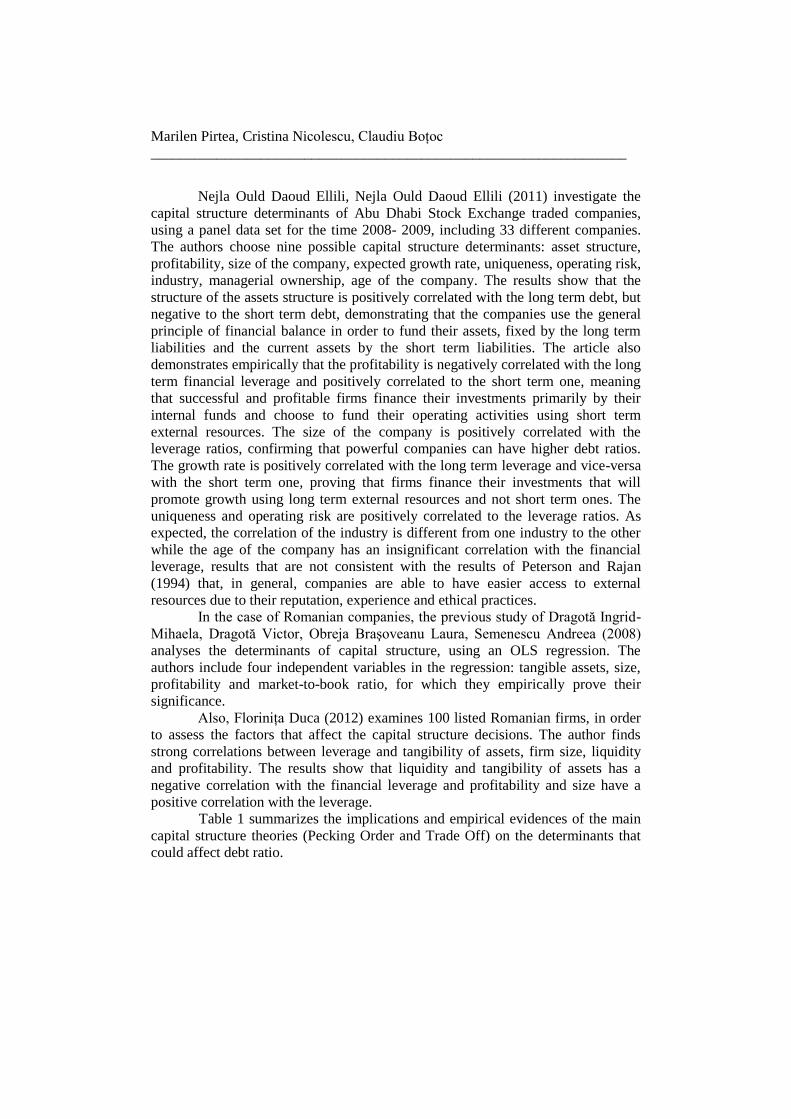
Nejla Ould Daoud Ellili, Nejla Ould Daoud Ellili (2011) investigate the
capital structure determinants of Abu Dhabi Stock Exchange traded companies,
using a panel data set for the time 2008- 2009, including 33 different companies.
The authors choose nine possible capital structure determinants: asset structure,
profitability, size of the company, expected growth rate, uniqueness, operating risk,
industry, managerial ownership, age of the company. The results show that the
structure of the assets structure is positively correlated with the long term debt, but
negative to the short term debt, demonstrating that the companies use the general
principle of financial balance in order to fund their assets, fixed by the long term
liabilities and the current assets by the short term liabilities. The article also
demonstrates empirically that the profitability is negatively correlated with the long
term financial leverage and positively correlated to the short term one, meaning
that successful and profitable firms finance their investments primarily by their
internal funds and choose to fund their operating activities using short term
external resources. The size of the company is positively correlated with the
leverage ratios, confirming that powerful companies can have higher debt ratios.
The growth rate is positively correlated with the long term leverage and vice-versa
with the short term one, proving that firms finance their investments that will
promote growth using long term external resources and not short term ones. The
uniqueness and operating risk are positively correlated to the leverage ratios. As
expected, the correlation of the industry is different from one industry to the other
while the age of the company has an insignificant correlation with the financial
leverage, results that are not consistent with the results of Peterson and Rajan
(1994) that, in general, companies are able to have easier access to external
resources due to their reputation, experience and ethical practices.
In the case of Romanian companies, the previous study of Dragotă Ingrid-
Mihaela, Dragotă Victor, Obreja Braşoveanu Laura, Semenescu Andreea (2008)
analyses the determinants of capital structure, using an OLS regression. The
authors include four independent variables in the regression: tangible assets, size,
profitability and market-to-book ratio, for which they empirically prove their
significance.
Also, Floriniţa Duca (2012) examines 100 listed Romanian firms, in order
to assess the factors that affect the capital structure decisions. The author finds
strong correlations between leverage and tangibility of assets, firm size, liquidity
and profitability. The results show that liquidity and tangibility of assets has a
negative correlation with the financial leverage and profitability and size have a
positive correlation with the leverage.
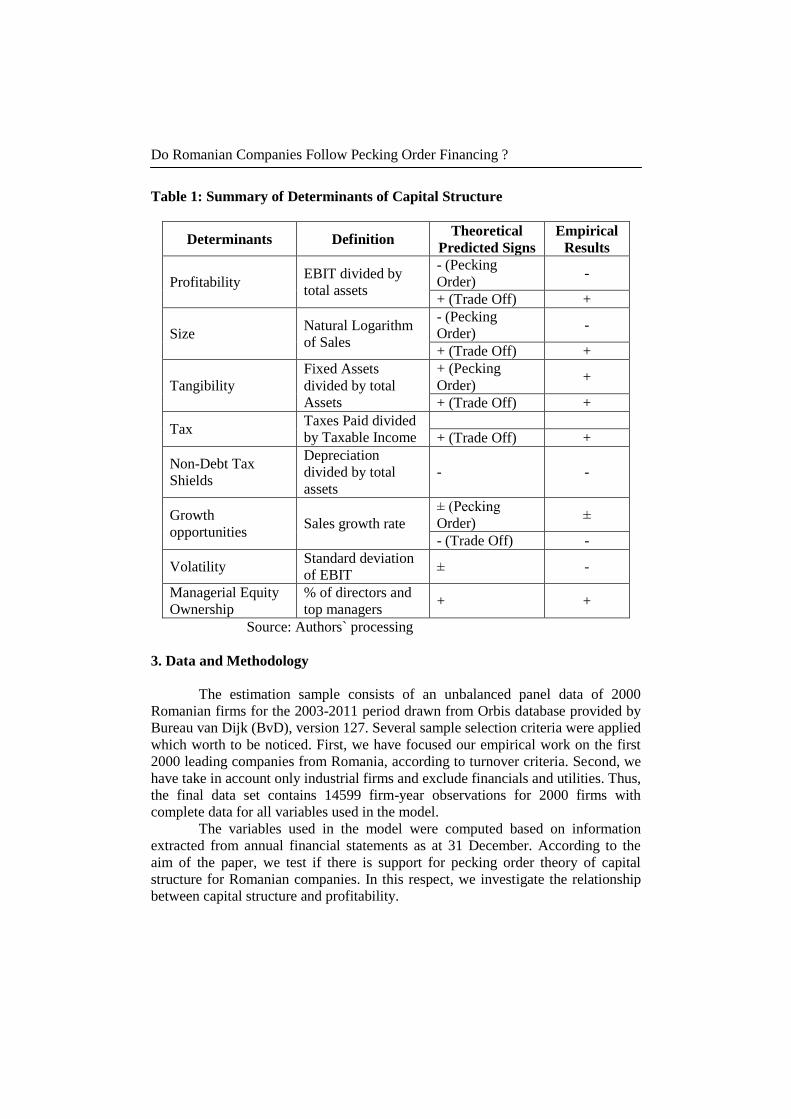
Table 1 summarizes the implications and empirical evidences of the main
capital structure theories (Pecking Order and Trade Off) on the determinants that
could affect debt ratio.
Do Romanian Companies Follow Pecking Order Financing ?
Table 1: Summary of Determinants of Capital Structure
Determinants Definition Theoretical
Predicted Signs
Empirical
Results
Profitability EBIT divided by
total assets
- (Pecking
Order) -
+ (Trade Off) +
Size Natural Logarithm
of Sales
- (Pecking
Order) -
+ (Trade Off) +
Tangibility
Fixed Assets
divided by total
Assets
+ (Pecking
Order) +
+ (Trade Off) +
Tax Taxes Paid divided
by Taxable Income
+ (Trade Off) +
Non-Debt Tax
Shields
Depreciation
divided by total
assets
- -
Growth
opportunities Sales growth rate
± (Pecking
Order) ±
- (Trade Off) -
Volatility Standard deviation
of EBIT ± -
Managerial Equity
Ownership
% of directors and
top managers + +
Source: Authors` processing
3. Data and Methodology
The estimation sample consists of an unbalanced panel data of 2000
Romanian firms for the 2003-2011 period drawn from Orbis database provided by
Bureau van Dijk (BvD), version 127. Several sample selection criteria were applied
which worth to be noticed. First, we have focused our empirical work on the first
2000 leading companies from Romania, according to turnover criteria. Second, we
have take in account only industrial firms and exclude financials and utilities. Thus,
the final data set contains 14599 firm-year observations for 2000 firms with
complete data for all variables used in the model.
The variables used in the model were computed based on information
extracted from annual financial statements as at 31 December. According to the
aim of the paper, we test if there is support for pecking order theory of capital
structure for Romanian companies. In this respect, we investigate the relationship
between capital structure and profitability.
Marilen Pirtea, Cristina Nicolescu, Claudiu Boţoc
_________________________________________________________________
There are two significant measures of capital structure used in empirical
works, financial leverage and debt ratio respectively. Following other researchers,
we have used debt ratio (DR) as a proxy for the capital structure and is expressed
as total debts divided by total assets. Net margin (NM) was used as a proxy for
profitability and is expressed as net income to total sales ratio. Pecking order
theory suggests a negative relation between capital structure and profitability. This
means that more profitable firms tend to use debt only when internal sources are
insufficient.
In order to improve the model and to test if the sign of profitability remains
unchanged, traditional control variables were added. Thus, sales-to-assets ratio was
used as a proxy for size (SIZE) and effective tax rate was used as a proxy for tax
shields (TR). Size is one of the most significant determinants for the capital
structure and at the same time, one of the most tested explanatory variables in
several models. It was found that the relation between size and capital structure
could be either positive or negative, according to capital structure theory. However,
larger firms with less asymmetric information issues are more diversified and
generate more cash flow. This means that larger firms should tend to use more
equity than debt and thus record lower leverage. Therefore, a negative relation
between size and capital structure is expected.
Tax policy objectives influence the effects of taxation on capital structure,
either favorable or unfavorable. For instance, the Romanian tax system favors
retention against payout, encouraging internal sources. Accordingly, firms with
higher level of effective tax rate will have a lower level of debt ratio. To avoid
undue influence of outliers, debt ratio, profitability, size and tax rate are both
winsorized at the 1st and 99th percentile.
Because listed companies want to offer attractive shares and are motivated
to report fair profit in comparison with private companies, the reliability of
financial statements could represent a significant issue in using financial data. In
this respect, we include a dummy in the model (PUBLIC) that takes 1 if the
company is listed at Bucharest Stock Exchange (BSE) and 0 otherwise. Given the
listed requirements at BSE, listed companies use more equity than debt and,
therefore, we expect a negative sign. It is worth to be noticed that both size through
sales-to-assets ratio and public variables are fundamental elements of corporate
governance.
Another factor that affects capital structure is related to the conflict
between shareholders and managers. To deal with this, we introduce a dummy
(INDEP) based on Independence indicator created by BvD, which characterize the
degree of independence of a company with regard to its shareholders. The BvD
Independence Indicators are noted as A, B, C, D and U, with further qualifications,
where A companies are called “Independent companies” (Orbis – user guide). In
this respect, our dummy variable INDEP take value 1 if BvD Independence
Indicator is A and 0 otherwise. An independent company is more flexible in terms
of financing and thus we expect a negative association with capital structure.
Do Romanian Companies Follow Pecking Order Financing ?
Finally, to account for debt financing condition we introduce a time-
invariant variable in the model, i.e. fixed interest rate (RD), for which we collect
data from National Bank of Romania. When fixed interest rate increase companies
are likely to use less debt and a negative association is expected. However, this
relation is influenced by the structure of the financial system.
In terms of methodology, panel data method is employed since the sample
contains data across firms and over time. Panel data has the main advantage that it
accounts for individual heterogeneity, i.e. it allows controlling for variables one
cannot observe or measure like cultural factors or difference in business practices
across companies.
The estimation procedure follows several steps. First, we have started with
an OLS model and include only NM as independent variable. Then, we have
included the controls in order to test if the size remains unchanged. In the
following models we have attempted nonlinearity issue, whether polynomial terms
for profitability are needed, such as second-order or third-order (Arce et al., 2009).
In order to control for an individual firm heterogeneity we have employed both
fixed effects and random models and have tested to select which is more suitable.
According to results for classical hypotheses, two correction methods were
employed, cluster approach with robust standard errors and autoregressive option.
Finally, as a robustness check for nonlinearity relation and since there is high
variation in DR (ranging from 0.057 to 1.857) we perform quantile regressions
from 10% to 90% quantiles (Fattouh et al., 2008).
Based on the methodology aforementioned, the specific empirical model
is:
ti,ti,1ti, νNM*βαDR (1)
and the general empirical model is:
ti,ti,765
ti,4ti,32
ti,2ti,1ti,
νμRD*βINDEP*βPUBLIC*β
TR*βSIZE*βNM*βNM*βαDR (2)
where iμ denotes the unobservable firm effect to allow for unobserved influences
on the profitability for each firm and ti,ν is the idiosyncratic error component.
4. Results
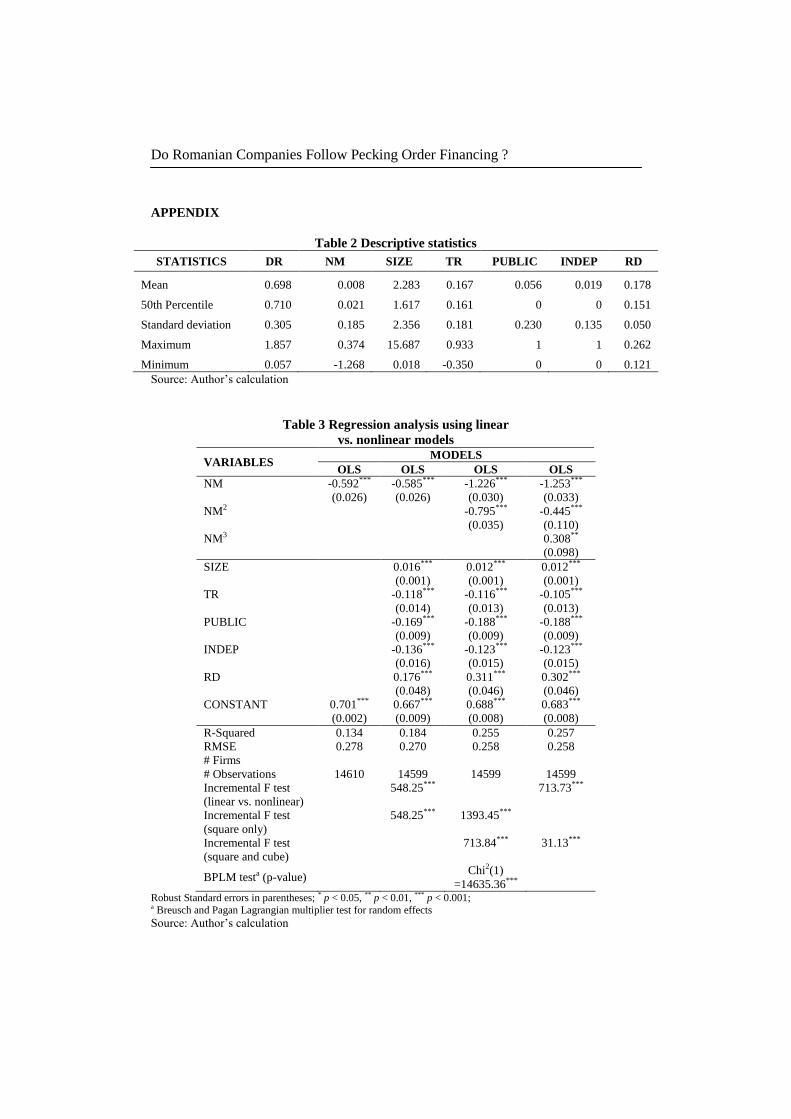
Descriptive statistics for the variables used in the model is presented in
Table 1. One can observe that, for period 2003-2011, Romanian companies use
debt and record a poor performance since the average DR for our sample is about
69.8%, and NM is about 0.8%. Furthermore, except DR, all variables present
volatility. From the correlation matrix, it can be outlined that all independent
variables appears to be negatively correlated with DR and all pairs have a low
correlation, suggesting no multi colinearity issues (see Table 2).
Marilen Pirtea, Cristina Nicolescu, Claudiu Boţoc
_________________________________________________________________
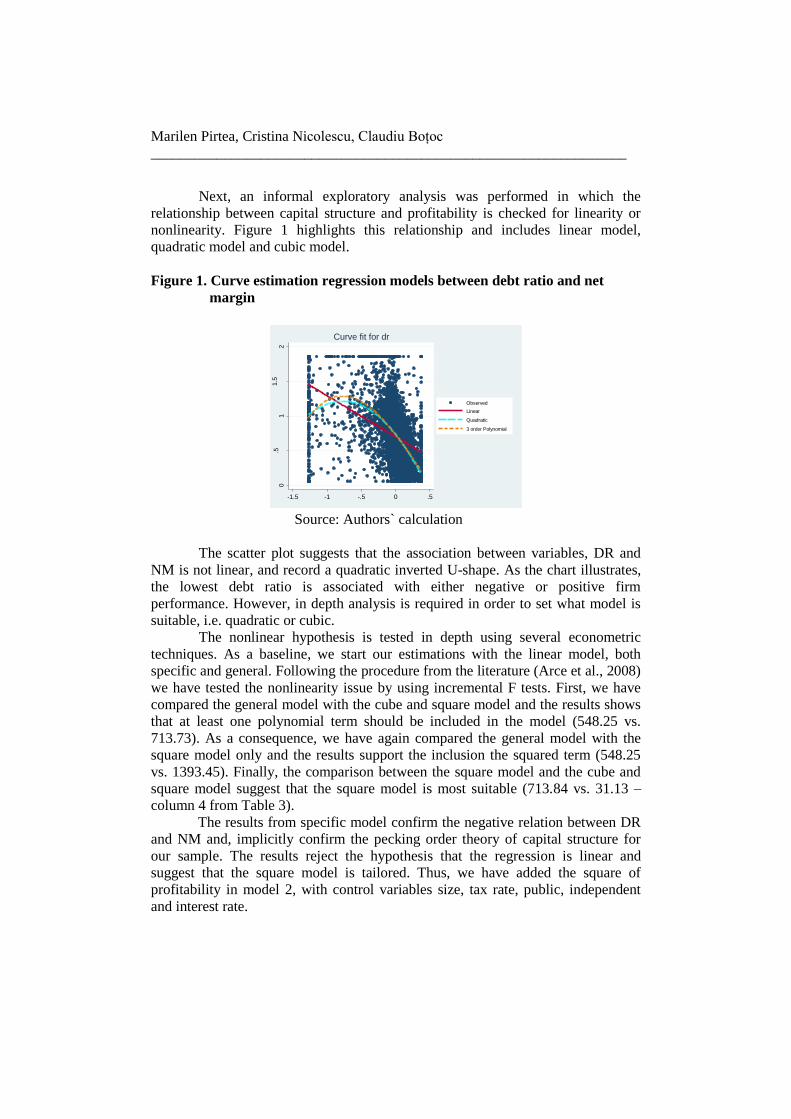
Next, an informal exploratory analysis was performed in which the
relationship between capital structure and profitability is checked for linearity or
nonlinearity. Figure 1 highlights this relationship and includes linear model,
quadratic model and cubic model.
Figure 1. Curve estimation regression models between debt ratio and net
margin
0.5
11.5
2
-1.5 -1 -.5 0 .5
Observed
Linear
Quadratic
3 order Polynomial
Curve fit for dr
Source: Authors` calculation
The scatter plot suggests that the association between variables, DR and
NM is not linear, and record a quadratic inverted U-shape. As the chart illustrates,
the lowest debt ratio is associated with either negative or positive firm
performance. However, in depth analysis is required in order to set what model is
suitable, i.e. quadratic or cubic.
The nonlinear hypothesis is tested in depth using several econometric
techniques. As a baseline, we start our estimations with the linear model, both
specific and general. Following the procedure from the literature (Arce et al., 2008)
we have tested the nonlinearity issue by using incremental F tests. First, we have
compared the general model with the cube and square model and the results shows
that at least one polynomial term should be included in the model (548.25 vs.
713.73). As a consequence, we have again compared the general model with the
square model only and the results support the inclusion the squared term (548.25
vs. 1393.45). Finally, the comparison between the square model and the cube and
square model suggest that the square model is most suitable (713.84 vs. 31.13 –
column 4 from Table 3).
The results from specific model confirm the negative relation between DR
and NM and, implicitly confirm the pecking order theory of capital structure for
our sample. The results reject the hypothesis that the regression is linear and
suggest that the square model is tailored. Thus, we have added the square of
profitability in model 2, with control variables size, tax rate, public, independent
and interest rate.
Do Romanian Companies Follow Pecking Order Financing ?
Results from model 2 suggest that all independent variables are significant
and have the expected sign. Furthermore, NM sign remain unchanged from model
1 to model 2 while the square of NM is still negatively related with DR. These
results suggest that the relation between capital structure and profitability is
negative and concave downward.
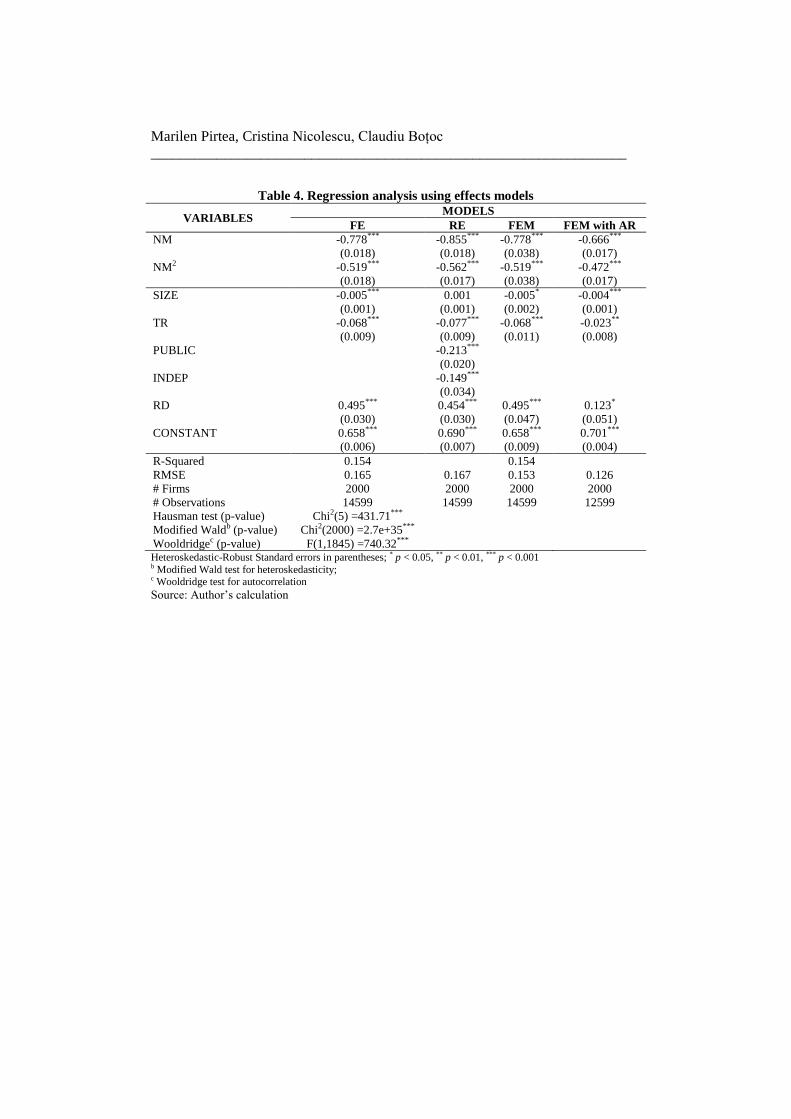
Columns 2 and 3 from table 4 report the results for fixed effects (FE) and
random effects models (RE), since Breusch-Pagan LM test suggests the presence of
unobservable firm effects. The Chi-square statistic is reported in the bottom row of
table 3 and is equal to 14635.36 with 0.000 p-value. In order to select the most
suitable model an additional test was performed. Hausman test suggest that firm
effects are not correlated with regressors, with a Chi-square equal to 431.71 and
0.000 p-value. These results lead to the conclusion that fixed effects model is more
suitable than both OLS and random effects model.
Next, additional tests were performed in order to test if classical
hypotheses are violated or not. The results suggest evidence of heteroskedasticity
and autocorrelation in our models. We have addressed these issues with cluster
approach with robust standard errors (FEM) and autoregressive option (FEM with
AR), the results being reported in table 4.
In terms of coefficient signs, the results from both estimation methods are
consistent with previous models, i.e. except interest rate all independent variables
are negatively related with DR. The difference than FE Model is related to the
magnitude of coefficients and standard errors which seems to be lower in FEM
Model and FEM with AR Model.
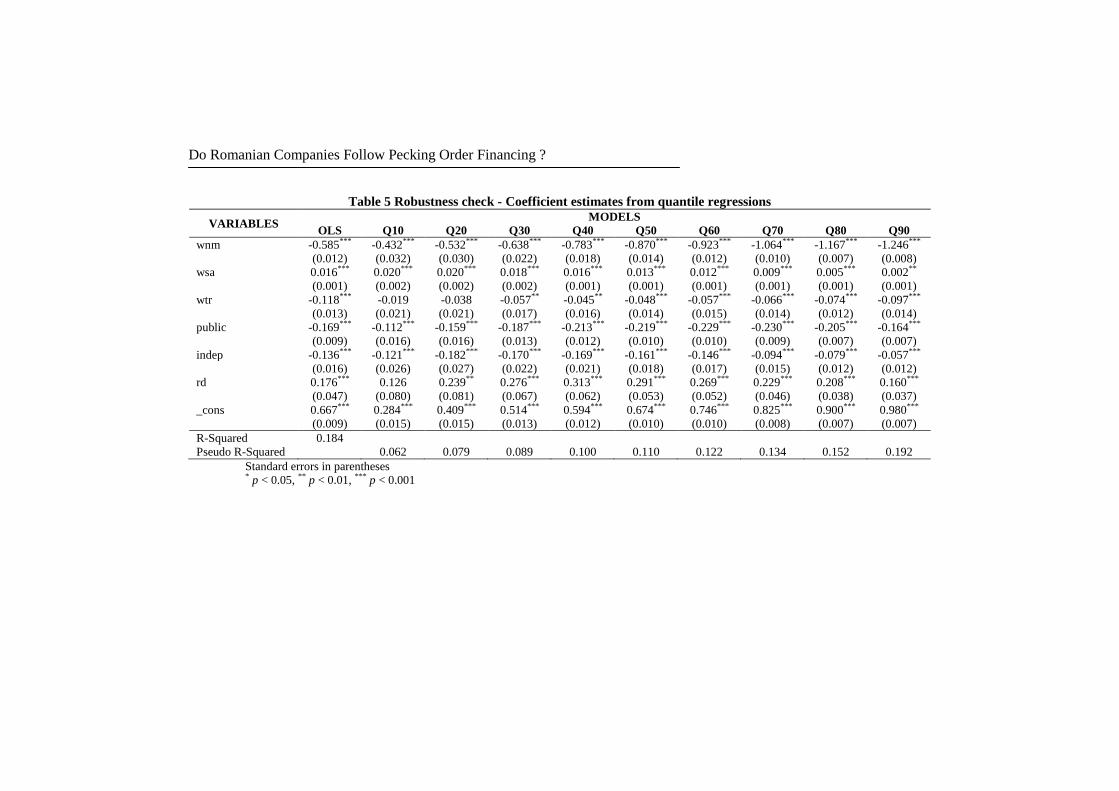
Robustness check
Next, we want to test whether our nonlinear relation is driven by
methodology. In this respect, we employ the second approach from literature, the
use of quantile regressions (Fattouh et al., 2008). In addition, our robustness check
is motivated by the presence of heteroskedasticity in the initial polynomial model,
which justify the use of quantile regressions. Table 5 provides regression results
when the general nonlinear model was estimated.
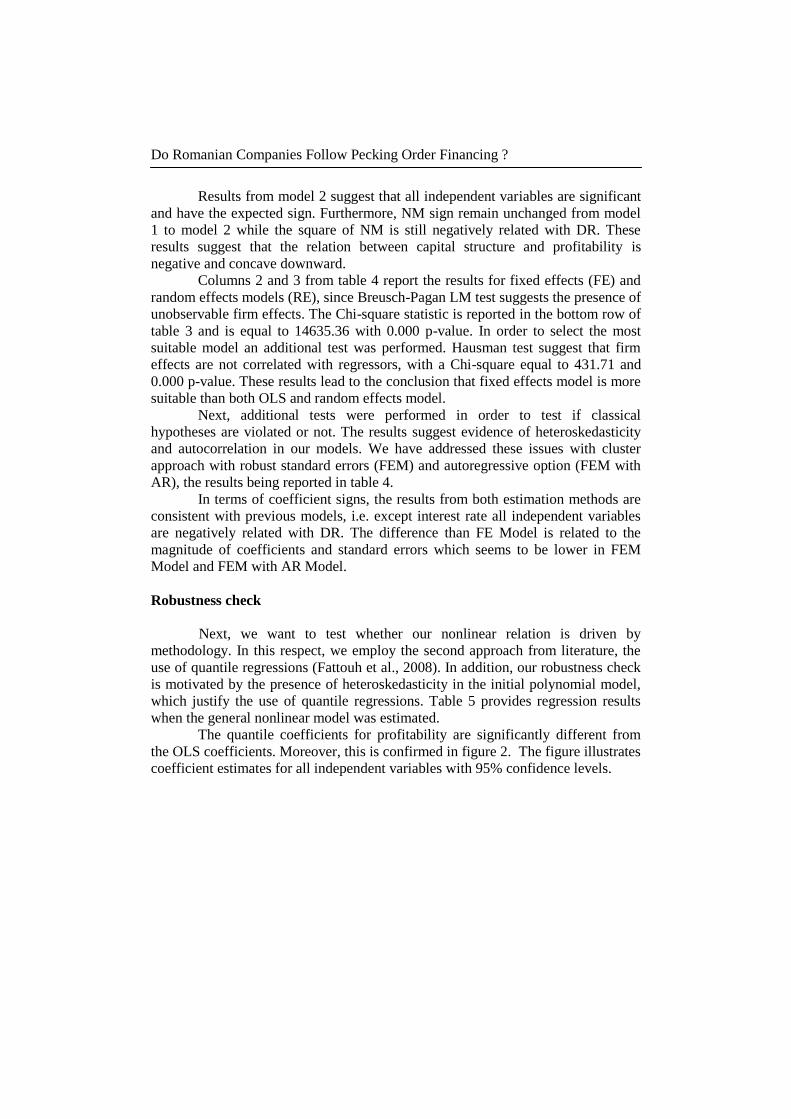
The quantile coefficients for profitability are significantly different from
the OLS coefficients. Moreover, this is confirmed in figure 2. The figure illustrates
coefficient estimates for all independent variables with 95% confidence levels.
Marilen Pirtea, Cristina Nicolescu, Claudiu Boţoc
_________________________________________________________________
Figure 2.Quantile regression estimates
0
.200
.400
.600
.801
.00
Inte
rce
pt
0 .2 .4 .6 .8 1Quantile
-1.5
0-1
.00
-0.5
00
.00
nm
_ W
inso
rize
d f
ract
ion
.0
1
0 .2 .4 .6 .8 1Quantile
0.0
00.0
10.0
10.0
10.0
20.0
3
sa_
Win
soriz
ed
fra
ctio
n .
01
0 .2 .4 .6 .8 1Quantile
-0.3
0-0.2
0-0.1
0 0.0
00.1
0
tr_
Win
soriz
ed
fra
ctio
n .
01
0 .2 .4 .6 .8 1Quantile
-0.2
5-0.2
0 -0.1
5-0.1
0-0.0
5 0.0
0
Pu
blic
0 .2 .4 .6 .8 1Quantile
-0.3
0-0.2
0-0.1
0 0.0
00.1
0
Ind
ep
0 .2 .4 .6 .8 1Quantile
-0.2
00
.00
0.2
00
.40
Rd
0 .2 .4 .6 .8 1Quantile
Source: Authors` calculation
The signs of the profitability variable were compatible with the claims of
the pecking order theory for all selected quantiles. This supports evidence that
more profitable firms tend to depend more on internally generated funds than on
outside financing such as debt. When the changing pattern of estimated coefficients
is examined, the absolute values of negative coefficients increase as the quantile
increases. For instance, as quantiles increase from 0.10 to 0.20, 0.30, 0.40, 0.50,
0.60, 0.70, 0.80, and 0.90, the estimates change from -0.432, to 0.532, -0.638, -
0.783, -0.870, -0.923, -1.064, -1.167 and -1.246, correspondingly, when the general
nonlinear model was estimated. This implies that effect of profitability decreases
for firms with higher debt ratio.
Looking beyond these significant statistical results, the negative relation
between NM and DR support the pecking order theory of capital structure.
Furthermore, for our sample this relation is nonlinear. Larger firms rather use
internal sources and do not benefit from tax advantage of debt.
Overall, our empirical results both are consistent and complement the
findings from capital structure topic. Like Nivorozhkin (2005), capital structure is
negatively related with profitability and like Chen (2004), capital structure is
negatively related with size. The main different result that contradicts other
empirical works are related to negative association between capital structure and
tax rate.
5. Conclusions
The main aim of our paper is to test the relation between debt ratio and
profitability for most performance Romanian companies. Secondary, we want to
check if this relation is linear or nonlinear and if it remains unchanged after adding
size and tax rate as control variables.
Using fixed effects model, the results support pecking order theory of
capital structure. This means that more profitable firms tend to use debt only when
internal sources are insufficient, larger firms rather use internal sources and do not
Do Romanian Companies Follow Pecking Order Financing ?
benefit from tax advantage of debt. Moreover, the effect of profitability decreases
for firms with higher debt ratio.
To sum up, the methodology employed in our empirical work provides
statistical significant results which confirm the hypotheses from Pecking Order
theory for the case of Romanian companies.
REFERENCES
[1] Antoniou A., Guney Y., Paudyal K. (2008), The Determinants of Capital
Structure: Capital Market-Oriented versus Bank-Oriented Institutions ;
Journal of Financial and Quantitative Analysis, vol. 43, no. 1, 59-92.
[2] Arce, D., Cook D., Kieschnick R. (2009), On the Evolution of Capital
Structures ;Available at SSRN id1359313;
[3] Bauer Patrik (2004),Determinants of Capital Structure: Empirical Evidence
from the Czech Republic. Czech Journal of Economics and Finance (Finance a
uver), vol. 54, issue 1-2, 2-21;
[4] Bevan, A. A., Danbolt, J., (2000), Capital Structure and Its Determinants in
the United Kingdom: A Decompositional Analysis ; Applied Financial
Economics, 12, 159-170;
[5] Chen J. (2004), Determinants of Capital Structure of Chinese-listed
Companies. Journal of Business Research, 57, 1341-1351;
[6] Duca Floriniţa (2012), What Determines the Capital Structure of Listed
Firms in Romania . CES Working Papers, vol. 4, issue 3a, 523-531, Available
at: http://www.ceeol.com/aspx/issuedetails.aspx?issueid=a87847b6-64f1-4907-
8875-de120bef2c93&articleId=d20a73ee-5a5f-4344-b457-12867290c3ee;
[7] Dragotă, Ingrid-Mihaela, Dragotă, Victor, Obreja Braşoveanu Laura,
Semenescu Andreea (2008), Capital Structure Determinants: A Sectorial
Analysis For The Romanian Listed Companies ; Economic Computation and
Economic Cybernetics Studies and Research, Vol. 42, No. 1-2, 155-172;
[8] Fakher Buferna, Kenbata Bangassa and Lynn Hodgkinson (2008),
Determinants of Capital Structure Evidence from Libya; University of
Liverpool Research Paper Series, No. 2005, ISSN 1744-0718, Available at:
http://citeseerx.ist.psu.edu/viewdoc/download?doi=10.1.1.136.5311&rep=rep1
&type=pdf;
[9] Fattouh, B, Scaramozzino P, Harris L (2008), Non-linearity in the
Determinants of Capital structure: Evidence from UK Firms ; Empirical
Economics, 34(3), 417-438;
[10] Harris, M., Raviv, A. (1991), The Theory of Capital Structure . Journal of
Finance, 46 (1), 297-355;
[11] Jensen Michael C. (1986), Agency Cost of Free Cash Flow, Corporate
Finance and Takeovers. American Economic Review, Vol. 76, No. 2, 323-
329;

Marilen Pirtea, Cristina Nicolescu, Claudiu Boţoc
_________________________________________________________________
[12] Michaelas, N., Chittenden, F. and Poutziouris, P. (1999), Financial Policy
and Capital Structure Choice in U.K. SMEs: Empirical Evidence from
Company Panel Data . Small Business Economics, 12, 113 – 130;
[13] Modigliani F., Miller M. (1958), The Cost of Capital, Corporation Finance
and the Theory of Investment . The American Economic Review, Vol. 48, No.
3, 261-297;
[14] Myers, S. C. (2001), Capital Structure . Journal of Economic Perspectives,
vol. 15, 81–102;
[15] Myers, S. C., Majluf, N. S. (1984), Corporate Financing and Investment
Decisions when Firms Have Information the Investors Do not Have .
Journal of Financial Economics, vol. 13, 187–221;
[16] Nejla Ould Daoud Ellili, Nejla Ould Daoud Ellili (2011), Examining the
Capital Structure Determinants: Empirical Analysis of Companies Traded
on Abu Dhabi Stock Exchange ; International Research Journal of Finance
and Economics, Issue 67, 82-96;
[17] Nivorozhkin E. (2005), Financing Choices of Firms in EU Accession
Countries . Emerging Markets Review, vol. 6, 138-169;
[18] Rajan, R. G., Zingales L. (1995), What Do We Know about Capital
Structure? Some Evidence from International Data . Journal of Finance, 50,
1421-1460;
[19] Shahjahanpour A., Ghalambor H., Aflatooni A. (2010), The Determinants
of Capital Structure Choice in the Iranian Companies ; International
Research Journal of Finance and Economics, Issue 5, 167-178;
[20] Titman, S., Wessels, R. (1988), The Determinants of Capital Structure
Choice; Journal of Finance, 43, 1, 1-19.
Do Romanian Companies Follow Pecking Order Financing ?
APPENDIX
Table 2 Descriptive statistics
STATISTICS DR NM SIZE TR PUBLIC INDEP RD
Mean 0.698 0.008 2.283 0.167 0.056 0.019 0.178
50th Percentile 0.710 0.021 1.617 0.161 0 0 0.151
Standard deviation 0.305 0.185 2.356 0.181 0.230 0.135 0.050
Maximum 1.857 0.374 15.687 0.933 1 1 0.262
Minimum 0.057 -1.268 0.018 -0.350 0 0 0.121
Source: Author’s calculation
Table 3 Regression analysis using linear
vs. nonlinear models
VARIABLES MODELS
OLS OLS OLS OLS
NM -0.592*** -0.585*** -1.226*** -1.253***
(0.026) (0.026) (0.030) (0.033)
NM2 -0.795*** -0.445***
(0.035) (0.110)
NM3 0.308**
(0.098)
SIZE 0.016*** 0.012*** 0.012***
(0.001) (0.001) (0.001)
TR -0.118*** -0.116*** -0.105***
(0.014) (0.013) (0.013)
PUBLIC -0.169*** -0.188*** -0.188***
(0.009) (0.009) (0.009)
INDEP -0.136*** -0.123*** -0.123***
(0.016) (0.015) (0.015)
RD 0.176*** 0.311*** 0.302***
(0.048) (0.046) (0.046)
CONSTANT 0.701*** 0.667*** 0.688*** 0.683***
(0.002) (0.009) (0.008) (0.008)
R-Squared 0.134 0.184 0.255 0.257
RMSE 0.278 0.270 0.258 0.258
# Firms
# Observations 14610 14599 14599 14599
Incremental F test
(linear vs. nonlinear)
548.25*** 713.73***
Incremental F test
(square only)
548.25*** 1393.45***
Incremental F test
(square and cube)
713.84*** 31.13***
BPLM testa (p-value) Chi2(1)
=14635.36***
Robust Standard errors in parentheses; * p < 0.05, ** p < 0.01, *** p < 0.001; a Breusch and Pagan Lagrangian multiplier test for random effects
Source: Author’s calculation
Marilen Pirtea, Cristina Nicolescu, Claudiu Boţoc
_________________________________________________________________
Table 4. Regression analysis using effects models
VARIABLES MODELS
FE RE FEM FEM with AR
NM -0.778*** -0.855*** -0.778*** -0.666***
(0.018) (0.018) (0.038) (0.017)
NM2 -0.519*** -0.562*** -0.519*** -0.472***
(0.018) (0.017) (0.038) (0.017)
SIZE -0.005*** 0.001 -0.005* -0.004***
(0.001) (0.001) (0.002) (0.001)
TR -0.068*** -0.077*** -0.068*** -0.023**
(0.009) (0.009) (0.011) (0.008)
PUBLIC -0.213***
(0.020)
INDEP -0.149***
(0.034)
RD 0.495*** 0.454*** 0.495*** 0.123*
(0.030) (0.030) (0.047) (0.051)
CONSTANT 0.658*** 0.690*** 0.658*** 0.701***
(0.006) (0.007) (0.009) (0.004)
R-Squared 0.154 0.154
RMSE 0.165 0.167 0.153 0.126
# Firms 2000 2000 2000 2000
# Observations 14599 14599 14599 12599
Hausman test (p-value) Chi2(5) =431.71***
Modified Waldb (p-value) Chi2(2000) =2.7e+35***
Wooldridgec (p-value) F(1,1845) =740.32*** Heteroskedastic-Robust Standard errors in parentheses; * p < 0.05, ** p < 0.01, *** p < 0.001 b Modified Wald test for heteroskedasticity; c Wooldridge test for autocorrelation
Source: Author’s calculation
Do Romanian Companies Follow Pecking Order Financing ?
Table 5 Robustness check - Coefficient estimates from quantile regressions
VARIABLES MODELS
OLS Q10 Q20 Q30 Q40 Q50 Q60 Q70 Q80 Q90
wnm -0.585*** -0.432*** -0.532*** -0.638*** -0.783*** -0.870*** -0.923*** -1.064*** -1.167*** -1.246***
(0.012) (0.032) (0.030) (0.022) (0.018) (0.014) (0.012) (0.010) (0.007) (0.008)
wsa 0.016*** 0.020*** 0.020*** 0.018*** 0.016*** 0.013*** 0.012*** 0.009*** 0.005*** 0.002**
(0.001) (0.002) (0.002) (0.002) (0.001) (0.001) (0.001) (0.001) (0.001) (0.001)
wtr -0.118*** -0.019 -0.038 -0.057** -0.045** -0.048*** -0.057*** -0.066*** -0.074*** -0.097***
(0.013) (0.021) (0.021) (0.017) (0.016) (0.014) (0.015) (0.014) (0.012) (0.014)
public -0.169*** -0.112*** -0.159*** -0.187*** -0.213*** -0.219*** -0.229*** -0.230*** -0.205*** -0.164***
(0.009) (0.016) (0.016) (0.013) (0.012) (0.010) (0.010) (0.009) (0.007) (0.007)
indep -0.136*** -0.121*** -0.182*** -0.170*** -0.169*** -0.161*** -0.146*** -0.094*** -0.079*** -0.057***
(0.016) (0.026) (0.027) (0.022) (0.021) (0.018) (0.017) (0.015) (0.012) (0.012)
rd 0.176*** 0.126 0.239** 0.276*** 0.313*** 0.291*** 0.269*** 0.229*** 0.208*** 0.160***
(0.047) (0.080) (0.081) (0.067) (0.062) (0.053) (0.052) (0.046) (0.038) (0.037)
_cons 0.667*** 0.284*** 0.409*** 0.514*** 0.594*** 0.674*** 0.746*** 0.825*** 0.900*** 0.980***
(0.009) (0.015) (0.015) (0.013) (0.012) (0.010) (0.010) (0.008) (0.007) (0.007)
R-Squared 0.184
Pseudo R-Squared 0.062 0.079 0.089 0.100 0.110 0.122 0.134 0.152 0.192
Standard errors in parentheses * p < 0.05, ** p < 0.01, *** p < 0.001