Embed Size (px)
Citation preview
PROFILE INFORMATION
2016-17
USD 253 Emporia
School Finance Kansas State Department of Education Landon State Office Building 900 SW Jackson Street, Suite 356 Topeka, Kansas 66612-1212 www.ksde.org
i
• Budget General Information (characteristics of district)
• Supplemental Information for Tables in Summary of Expenditures
• KSDE Website Information Available
• Summary of Expenditures (Sumexpen.xlsx)
1
2016-17 Budget General Information USD #: 253
Introduction #GreatPeople
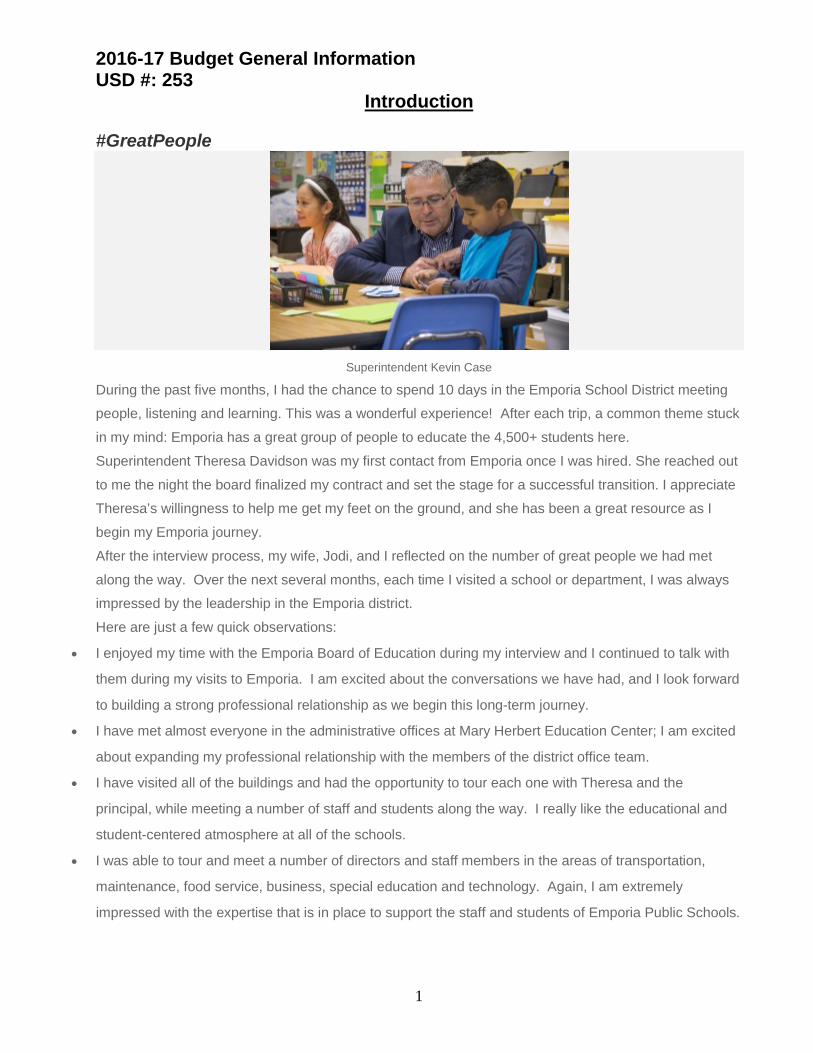
Superintendent Kevin Case
During the past five months, I had the chance to spend 10 days in the Emporia School District meeting people, listening and learning. This was a wonderful experience! After each trip, a common theme stuck in my mind: Emporia has a great group of people to educate the 4,500+ students here. Superintendent Theresa Davidson was my first contact from Emporia once I was hired. She reached out to me the night the board finalized my contract and set the stage for a successful transition. I appreciate Theresa’s willingness to help me get my feet on the ground, and she has been a great resource as I begin my Emporia journey. After the interview process, my wife, Jodi, and I reflected on the number of great people we had met along the way. Over the next several months, each time I visited a school or department, I was always impressed by the leadership in the Emporia district. Here are just a few quick observations:
• I enjoyed my time with the Emporia Board of Education during my interview and I continued to talk with
them during my visits to Emporia. I am excited about the conversations we have had, and I look forward
to building a strong professional relationship as we begin this long-term journey.
• I have met almost everyone in the administrative offices at Mary Herbert Education Center; I am excited
about expanding my professional relationship with the members of the district office team.
• I have visited all of the buildings and had the opportunity to tour each one with Theresa and the
principal, while meeting a number of staff and students along the way. I really like the educational and
student-centered atmosphere at all of the schools.
• I was able to tour and meet a number of directors and staff members in the areas of transportation,
maintenance, food service, business, special education and technology. Again, I am extremely
impressed with the expertise that is in place to support the staff and students of Emporia Public Schools.
2
• Finally, each time I’m in Emporia, I have the opportunity to meet parents, community members and
business leaders. Whether I’m grabbing a quick coffee at a local coffee shop or enjoying a meal in one
of many restaurants, the result is the same – I’m meeting and getting to know #GreatPeople. I’m excited about the opportunities that are available to the students in Emporia. Knowing that #GreatPeople are already in place will make my transition much easier. I know I will continue to expand my growing network of parents, patrons, business partners, and colleagues at Emporia State University and Flint Hills Technical College. I look forward to becoming a valued member of the Emporia team, and I know that this journey we are embarking on will be filled with opportunities, possibilities and even sometimes challenges. My first step in the journey is to reflect on Emporia’s rich past and consider the future possibilities. I challenge everyone to take a moment and look at our schools and our community through a fresh lens. I think you will be excited about the possibilities ahead of us. Let the journey begin!
Board Members Susan Brinkman: 1768 Trowman Way, Emporia, Kansas, 66801 (620-342-2204) [email protected] Michael Crouch: 1908 Flint Road, Emporia, Kansas, 66801 (620-757-8416) [email protected] Doug Epp: 1474 Road E, Emporia, Kansas, 66801 (620-342-2817) [email protected] Art Gutierrez: 914 Henry Street, Emporia, Kansas, 66801 (620-342-9403) [email protected] Michael Helbert: 2816 Lakeridge Road, Emporia, Kansas, 66801 (620-343-2688) [email protected] Colleen Mitchell 1627 Rural Street, Emporia, Kansas, 66801 (620-481-1772) [email protected] Grant Riles: 1515 Williby Avenue, Emporia, Kansas, 66801 (620-794-3662) [email protected]
3
Key Staff Superintendent: Kevin Case Clerk of the Board: Dana Witten Associate Superintendent of Human Resources: Dr. Andy Koenigs Assistant Superintendent of Business: Rob Scheib Assistant Superintendent of Teaching and Learning: Dr. George Abel Executive Director of Elementary Education: Vicki Schweinler Executive Director of Secondary Education: Wade Redeker Executive Director of Special Services: Elena Rettiger-Lincoln, JD Associate Executive Director of Assessments and Accountability: Ryan Karjala Director of Budgets and Accounting: Karen Flood Director of Community Relations: Nancy Horst Director of Food Service: Denise Kater Director of Infrastructure and Security: Chris Harvel Director of Maintenance: Bob Fancher Director of Network Operations: Paul Beadles Director of Transportation: Becky Douglas
The District’s Accomplishments and Challenges Accomplishments:
Much work has been done on curriculum alignment and design. We will continue this work at all grade levels, including use of the ewalkthrough tool.
Sheltered instruction, co-teaching and other research-based instructional tools are common in our classrooms.
We are developing formative assessments to determine if our students are learning the curriculum components as they are being taught at each grade level. The district has access to the 75,000 question ETS item test bank which is aligned to the Kansas College and Career Ready Standards. Tests developed by teachers using this Schoolnet for PowerSchool system and the test generator will merge results to the PowerSchool dashboard.
NWEA’s Measures of Academic Progress (MAP) assessments given multiple times per year provide teachers with valuable student data with which to monitor and adjust instruction.
Literacy First will support instructional practices to span pre-school through 12th grade; all teachers have been trained.
Our teachers have time to meet in Professional Learning Communities (PLC) to understand the core curriculum, implement a continuum of instructional strategies, employ multiple measures of progress and analyze individual student data to make sound educational decisions.
A Tiered System of Supports help teachers prescribe lessons and supports much like doctors use medical test data to make treatment plans for our health care. This system creates opportunities for better alignment and collaboration between regular and special education.
Interventionists who specialize in special education, English language-learning strategies, and instruction for reading and math support our core curriculum.
A K-5 foreign language program provides instruction in both English and Spanish for students whether their first language is Spanish or English is offered at Village Elementary.
Starting at seventh grade, students can apply to be in AVID (Advancement Via Individual Determination) which is a program that prepares them for the rigors of advanced courses and to see college study as a real option.
4
Emporia High School has joined the Jobs for American Graduates (JAG) Kansas program, which provides another vehicle for students to become college and career ready.
Technology Rich Classroom instruction is expanding to more students and grade levels through training and shared expertise of our staff. We have implemented one-to-one technology devices for grades pre-k through twelve.
Career Pathways is coming into greater focus as we define the sequence and content of courses primarily at the middle and high schools.
Turning Point Academy continues to provide options for students to learn through a project-based model that is uniquely different. Turning Point Academy students in grades K-8 attend William Allen White Elementary and students in grades 9-12 attend Emporia High School.
Flint Hills Learning Center is poised to provide instructional services unique to each individual high school and adult student and to assure that each one is college and career ready.
A unique staffing formula supports staffing ratios according to student needs in Emporia schools.
Partnerships with Flint Hills Technical College and Emporia State University provide post-secondary coursework and credit to high school students.
Collaboration with Emporia State University for placing pre-service teachers in the classroom makes possible our contribution to a generation of teachers equipped to meet the challenges ahead and adds instructional support in our classrooms.
Challenges: The Board of Education has set challenging goals for the district that cause us to look at student data in bold new ways that go beyond rising test scores. The School Community: The Emporia School district includes the City of Emporia and adjacent rural areas. We are located in east-central Kansas at the junction of U.S. 50 Highway, the Kansas Turnpike and Interstate 35, mid-way between Wichita and Topeka. Emporia, Kansas, has a population of approximately 25,700 people and a diverse economy supported by manufacturing, retail business, agriculture, and education. The city is home to the National Teacher’s Hall of Fame, Flint Hills Technical College and Emporia State University. The community’s largest employers are Emporia State University, Tyson Fresh Meats, Hostess Bakery, Newman Regional Health and the Emporia Public Schools. The District Profile:
• The district has approximately 1,200 employees in district and federal programs preK-12, including the Flint Hills Special Education Cooperative (FHSEC).
• The district employs highly qualified teachers, administrators and professional support staff to serve the approximately 4,600 students in grades preK-12. Close to half of our teachers have advanced degrees and many have been recognized at the state and national level for their professional achievements and contributions to public education.
5
• The school district consists of ten school buildings: one high school (9-12), one middle school (6-8), six elementary schools (K-5), one early childhood center for three and four-year olds and one alternative high school. All are fully accredited. They are:
• Emporia High School • Emporia Middle School • Logan Avenue Elementary • Timmerman Elementary • Riverside Elementary • Village Elementary • Walnut Elementary • William Allen White Elementary • Maynard Early Childhood Center • Flint Hills Learning Center • Turning Point Academy at William Allen White Elementary and Emporia High School
• The district organization has self-contained classrooms in the elementary schools. • A transitional organization has been established at the middle school with a combination of departmentalization and teaming. • A departmental organization with a block schedule has been established at the high school level. The high school offers over 350 courses annually. • USD 253 serves as the sponsoring district for the Flint Hills Special Education Cooperative, which
provides special services in seven school districts for children birth to age 21. • Six elementary schools offer unique learning environments by which all students can excel. Our schools have neighborhood boundaries, but transfer policies give parents choices. • The Emporia schools offer accelerated and advanced-placement classes, as well as, assistance for
students at risk of failing. Test scores on state and national assessments are consistent with state and national averages and showing improvement. Emporia students continue to score well on the ACT exam and there are more Emporia students taking this challenging exam. More than two-thirds of the graduating seniors go on to post-high school training at universities, colleges and technical schools. (See the Kansas State Department of Education web site for achievement data and demographic information about the district and individual schools.)
• The district’s curricular program offers instruction in the areas of art, business, health, family and consumer science, industrial technology, language arts, mathematics, music, physical education, science, social studies, special education, and technology. Career education, wellness, social/emotional learning and human sexuality are integrated into appropriate curricular programs. Emporia High School and Emporia Middle School are developing career pathways in fields of interest to students.
• The district has a comprehensive vocational education program. Students begin exploring career interests in middle school and are afforded the opportunity for technically advanced courses throughout high school and at the Flint Hills Technical College. • The district has an extensive high school co-curricular program, which provides many opportunities
for social, physical, and intellectual growth. This program includes activities in forensics, debate, music, intramural activities, special interest clubs, interscholastic athletics and organized class and student government.
• The district provides a well-balanced program for students with special needs. With emphasis on inclusion, this program includes classes for the gifted, the mentally and physically handicapped, at-risk students and those requiring homebound instruction, bilingual, remedial reading or educational enhancement.
• The district provides student support programs in addition to the academic program. These include guidance and counseling, standardized testing, field trips, health services, centralized media centers, after-school care/activities and alternative school choices.
6
• The district’s operational services include business, technology, nutrition, maintenance, central supply and transportation services. • The school district consists of approximately 135 square miles. • The district contracts with the Flint Hills Technical College to provide adult basic education classes
and other adult education courses on a demand basis. • The district food service department provides hot breakfasts and lunches at all schools each day with
the food prepared at a central kitchen and delivered to the schools. Approximately 4,200 meals are served each day. The department is an active partner in the District Wellness Policy and Action Plan, which focuses on nutrition and nutrition education. The district also participates in the Federal summer meals program serving breakfast and lunch at five school sites for children age 18 and under.
• The district has an approved state professional development plan which allows for teacher recertification. • The district provides transportation to and from school for all students who live 2.5 miles or more from school in addition to areas identified for safety considerations. • The schools benefit from partnerships with parents, businesses and community groups. Parent
organizations are active from the elementary to the high school level. Businesses, community foundations, just to name a few.
• Emporia teachers support teacher training by supervising teacher education students as observers, student teachers and teacher interns. Emporia teachers also are frequent speakers in university classrooms. University faculty members serve as resources for our teachers as well. • Emporia USD 253 does not discriminate on the basis of race, color, national origin, sex, religion, handicap/disability or age. Persons having inquiries may contact the school district's coordinator, the associate superintendent of Human Resources located at 1700 West 7th Avenue, Emporia, Kansas, 66801 or 620-341-2330.
7
Supplemental Information for the Following Tables 1. Summary of Total Expenditures by Function (All Funds)
2. Summary of General Fund Expenditures by Function 3. Summary of Supplemental General Fund Expenditures by Function 4. Summary of General and Supplemental General Fund Expenditures by Function 5. Summary of Special Education Fund by Function 6. Instruction Expenditures (1000) 7. Student Support Expenditures (2100)
8. Instructional Support Expenditures (2200) 9. General Administration Expenditures (2300) 10. School Administration Expenditures (2400)
11. Central Services Expenditures (2500) 12. Operations and Maintenance Expenditures (2600)
13. Transportation Expenditures (2700) 14. Other Support Services Expenditures (2900)
15. Food Service Expenditures (3100)
16. Community Services Operations (3300) 17. Capital Improvements (4000) 18. Debt Services (5100)
19. Miscellaneous Information – Transfers (5200) 20. Miscellaneous Information Unencumbered Cash Balance by Fund 21. Reserve Funds Unencumbered Cash Balance 22. Other Information – Enrollment Information 23. Miscellaneous Information Mill Rates by Fund 24. Other Information – Assessed Valuation and Bonded Indebtedness Note: The FTE (full time equivalency) used in this report to calculate the “Amount Per Pupil” is defined as follows: Enrollment (FTE) includes the current year enrollment on September 20, February 20, 4 yr old at-risk, and virtual. It does not include non-funded preschool or full-day kindergarten not on an IEP.

8
KSDE Website Information Available K-12 Statistics (Building, District or State Totals) website below: http://svapp15586.ksde.org/k12/k12.aspx
• Attendance / Enrollment Reports • Staff Reports • Graduates / Dropouts Reports • Crime / Violence Reports
School Finance Reports and Publications website below: http://www.ksde.org/Agency/FiscalandAdministrativeServices/SchoolFinance/ReportsandPublications.aspx
• Assessed Valuation • Cash Balances • Headcount Enrollment • Mill Levies • Personnel (Certified/Non-Certified) • Salary Reports
Kansas Building Report Card website below: http://svapp15586.ksde.org/rcard/
• Attendance Rate • Graduation Rate • Dropout Rate • School Violence • Assessments
o Reading o Mathematics o Writing
• Graduates Passing Adv. Science Courses • Graduates Passing Adv. Math Courses
USD# 253
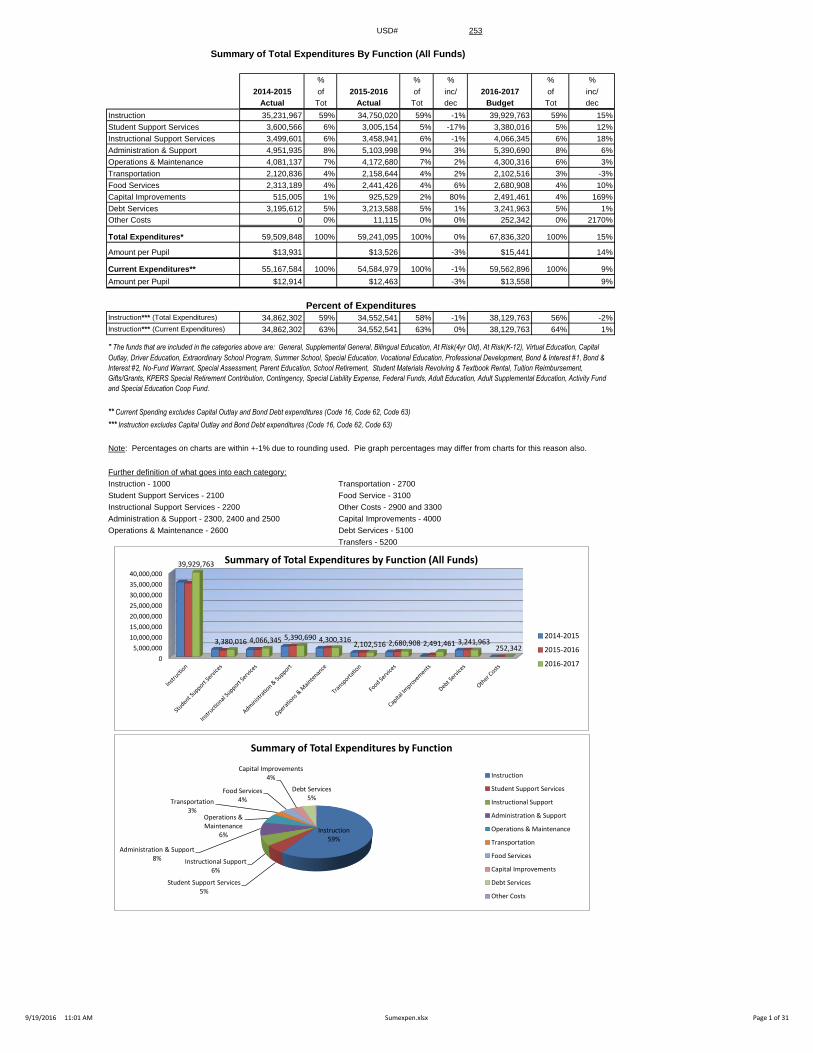
Summary of Total Expenditures By Function (All Funds)
% % % % %2014-2015 of 2015-2016 of inc/ 2016-2017 of inc/
Actual Tot Actual Tot dec Budget Tot decInstruction 35,231,967 59% 34,750,020 59% -1% 39,929,763 59% 15%Student Support Services 3,600,566 6% 3,005,154 5% -17% 3,380,016 5% 12%Instructional Support Services 3,499,601 6% 3,458,941 6% -1% 4,066,345 6% 18%Administration & Support 4,951,935 8% 5,103,998 9% 3% 5,390,690 8% 6%Operations & Maintenance 4,081,137 7% 4,172,680 7% 2% 4,300,316 6% 3%Transportation 2,120,836 4% 2,158,644 4% 2% 2,102,516 3% -3%Food Services 2,313,189 4% 2,441,426 4% 6% 2,680,908 4% 10%Capital Improvements 515,005 1% 925,529 2% 80% 2,491,461 4% 169%Debt Services 3,195,612 5% 3,213,588 5% 1% 3,241,963 5% 1%Other Costs 0 0% 11,115 0% 0% 252,342 0% 2170%
Total Expenditures* 59,509,848 100% 59,241,095 100% 0% 67,836,320 100% 15%
Amount per Pupil $13,931 $13,526 -3% $15,441 14%
Current Expenditures** 55,167,584 100% 54,584,979 100% -1% 59,562,896 100% 9%Amount per Pupil $12,914 $12,463 -3% $13,558 9%
Instruction*** (Total Expenditures) 34,862,302 59% 34,552,541 58% -1% 38,129,763 56% -2%Instruction*** (Current Expenditures) 34,862,302 63% 34,552,541 63% 0% 38,129,763 64% 1%
Note: Percentages on charts are within +-1% due to rounding used. Pie graph percentages may differ from charts for this reason also.
Further definition of what goes into each category:Instruction - 1000 Transportation - 2700Student Support Services - 2100 Food Service - 3100Instructional Support Services - 2200 Other Costs - 2900 and 3300Administration & Support - 2300, 2400 and 2500 Capital Improvements - 4000Operations & Maintenance - 2600 Debt Services - 5100
Transfers - 5200
Percent of Expenditures
* The funds that are included in the categories above are: General, Supplemental General, Bilingual Education, At Risk(4yr Old), At Risk(K-12), Virtual Education, Capital
Outlay, Driver Education, Extraordinary School Program, Summer School, Special Education, Vocational Education, Professional Development, Bond & Interest #1, Bond &
Interest #2, No-Fund Warrant, Special Assessment, Parent Education, School Retirement, Student Materials Revolving & Textbook Rental, Tuition Reimbursement,
Gifts/Grants, KPERS Special Retirement Contribution, Contingency, Special Liability Expense, Federal Funds, Adult Education, Adult Supplemental Education, Activity Fund
and Special Education Coop Fund.
*** Instruction excludes Capital Outlay and Bond Debt expenditures (Code 16, Code 62, Code 63)
** Current Spending excludes Capital Outlay and Bond Debt expenditures (Code 16, Code 62, Code 63)
0
5,000,000
10,000,000
15,000,000
20,000,000
25,000,000
30,000,000
35,000,000
40,000,000
39,929,763
3,380,016 4,066,345 5,390,690 4,300,3162,102,516 2,680,908 2,491,461 3,241,963
252,342
Summary of Total Expenditures by Function (All Funds)
2014-2015
2015-2016
2016-2017
Instruction59%
Student Support Services5%
Instructional Support6%
Administration & Support8%
Operations & Maintenance
6%
Transportation3%
Food Services4%
Capital Improvements4%
Debt Services5%
Summary of Total Expenditures by Function
Instruction
Student Support Services
Instructional Support
Administration & Support
Operations & Maintenance
Transportation
Food Services
Capital Improvements
Debt Services
Other Costs
9/19/2016 11:01 AM Sumexpen.xlsx Page 1 of 31
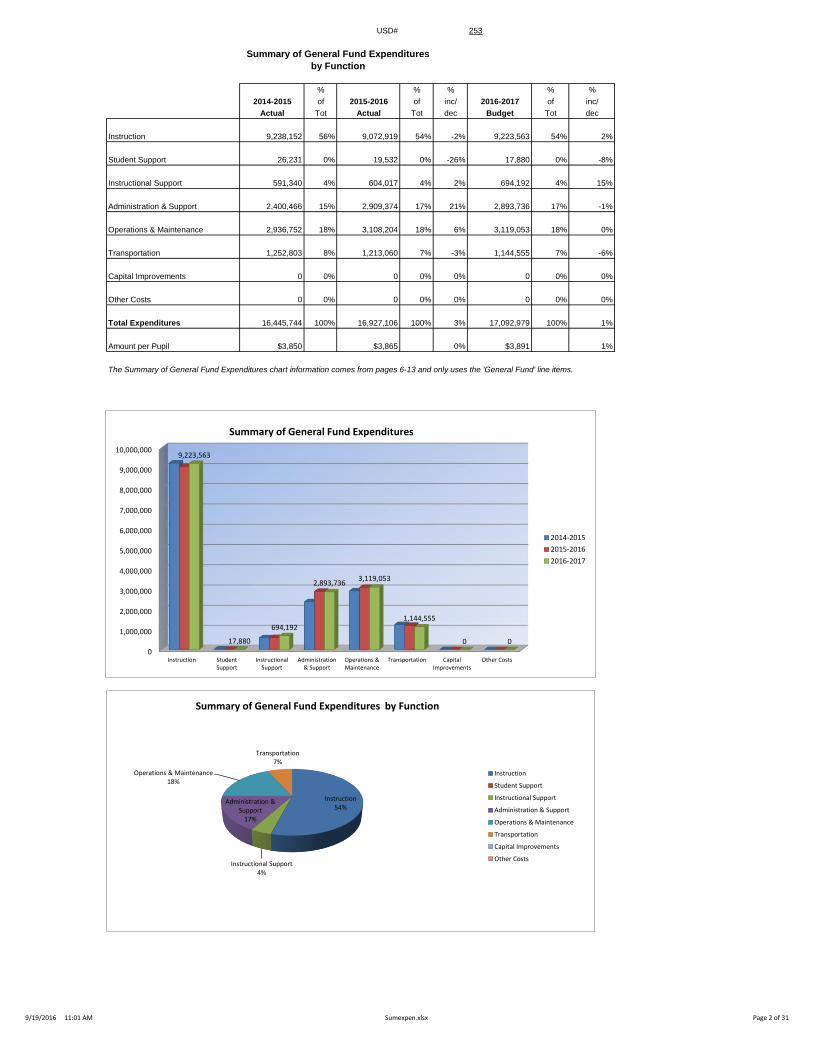
USD# 253
Summary of General Fund Expendituresby Function
% % % % %2014-2015 of 2015-2016 of inc/ 2016-2017 of inc/
Actual Tot Actual Tot dec Budget Tot dec
Instruction 9,238,152 56% 9,072,919 54% -2% 9,223,563 54% 2%
Student Support 26,231 0% 19,532 0% -26% 17,880 0% -8%
Instructional Support 591,340 4% 604,017 4% 2% 694,192 4% 15%
Administration & Support 2,400,466 15% 2,909,374 17% 21% 2,893,736 17% -1%
Operations & Maintenance 2,936,752 18% 3,108,204 18% 6% 3,119,053 18% 0%
Transportation 1,252,803 8% 1,213,060 7% -3% 1,144,555 7% -6%
Capital Improvements 0 0% 0 0% 0% 0 0% 0%
Other Costs 0 0% 0 0% 0% 0 0% 0%
Total Expenditures 16,445,744 100% 16,927,106 100% 3% 17,092,979 100% 1%
Amount per Pupil $3,850 $3,865 0% $3,891 1%
The Summary of General Fund Expenditures chart information comes from pages 6-13 and only uses the 'General Fund' line items.
0
1,000,000
2,000,000
3,000,000
4,000,000
5,000,000
6,000,000
7,000,000
8,000,000
9,000,000
10,000,000
Instruction StudentSupport
InstructionalSupport
Administration& Support
Operations &Maintenance
Transportation CapitalImprovements
Other Costs
9,223,563
17,880
694,192
2,893,7363,119,053
1,144,555
0 0
Summary of General Fund Expenditures
2014-2015
2015-2016
2016-2017
Instruction54%
Instructional Support4%
Administration & Support
17%
Operations & Maintenance18%
Transportation7%
Summary of General Fund Expenditures by Function
Instruction
Student Support
Instructional Support
Administration & Support
Operations & Maintenance
Transportation
Capital Improvements
Other Costs
9/19/2016 11:01 AM Sumexpen.xlsx Page 2 of 31
USD# 253
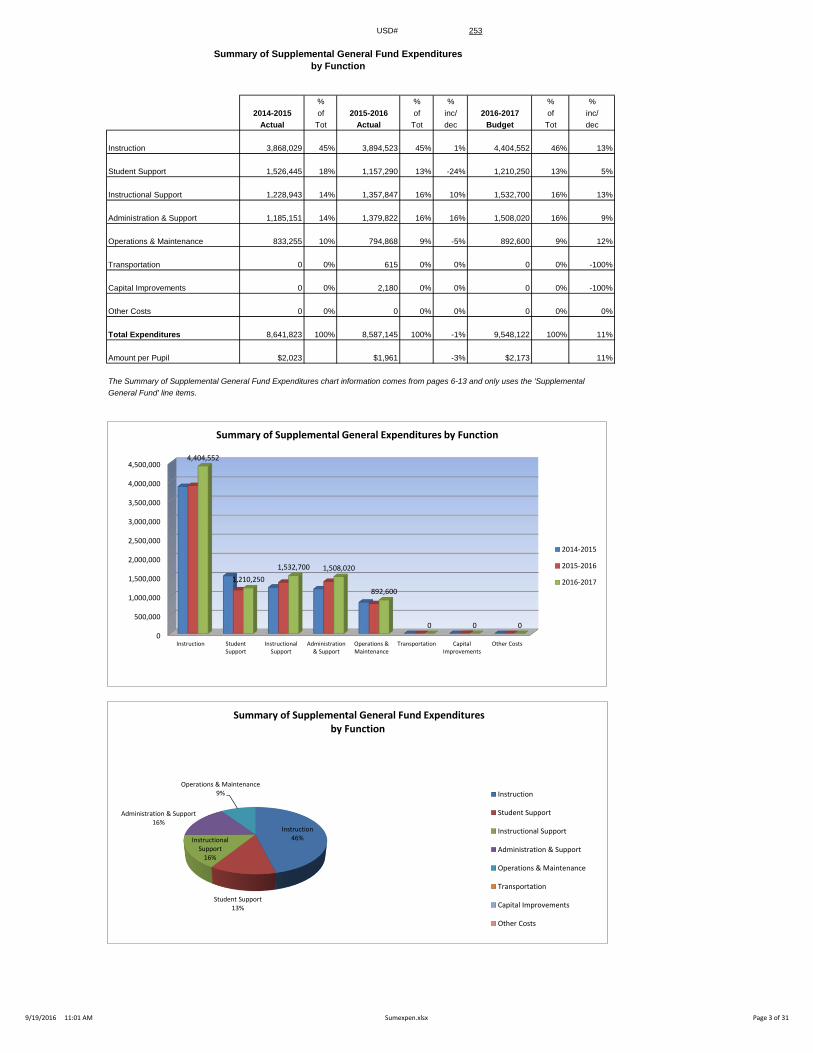
Summary of Supplemental General Fund Expendituresby Function
% % % % %2014-2015 of 2015-2016 of inc/ 2016-2017 of inc/
Actual Tot Actual Tot dec Budget Tot dec
Instruction 3,868,029 45% 3,894,523 45% 1% 4,404,552 46% 13%
Student Support 1,526,445 18% 1,157,290 13% -24% 1,210,250 13% 5%
Instructional Support 1,228,943 14% 1,357,847 16% 10% 1,532,700 16% 13%
Administration & Support 1,185,151 14% 1,379,822 16% 16% 1,508,020 16% 9%
Operations & Maintenance 833,255 10% 794,868 9% -5% 892,600 9% 12%
Transportation 0 0% 615 0% 0% 0 0% -100%
Capital Improvements 0 0% 2,180 0% 0% 0 0% -100%
Other Costs 0 0% 0 0% 0% 0 0% 0%
Total Expenditures 8,641,823 100% 8,587,145 100% -1% 9,548,122 100% 11%
Amount per Pupil $2,023 $1,961 -3% $2,173 11%
The Summary of Supplemental General Fund Expenditures chart information comes from pages 6-13 and only uses the 'Supplemental
General Fund' line items.
0
500,000
1,000,000
1,500,000
2,000,000
2,500,000
3,000,000
3,500,000
4,000,000
4,500,000
Instruction StudentSupport
InstructionalSupport
Administration& Support
Operations &Maintenance
Transportation CapitalImprovements
Other Costs
4,404,552
1,210,250
1,532,700 1,508,020
892,600
0 0 0
Summary of Supplemental General Expenditures by Function
2014-2015
2015-2016
2016-2017
Instruction46%
Student Support13%
Instructional Support
16%
Administration & Support16%
Operations & Maintenance9%
Summary of Supplemental General Fund Expenditures by Function
Instruction
Student Support
Instructional Support
Administration & Support
Operations & Maintenance
Transportation
Capital Improvements
Other Costs
9/19/2016 11:01 AM Sumexpen.xlsx Page 3 of 31
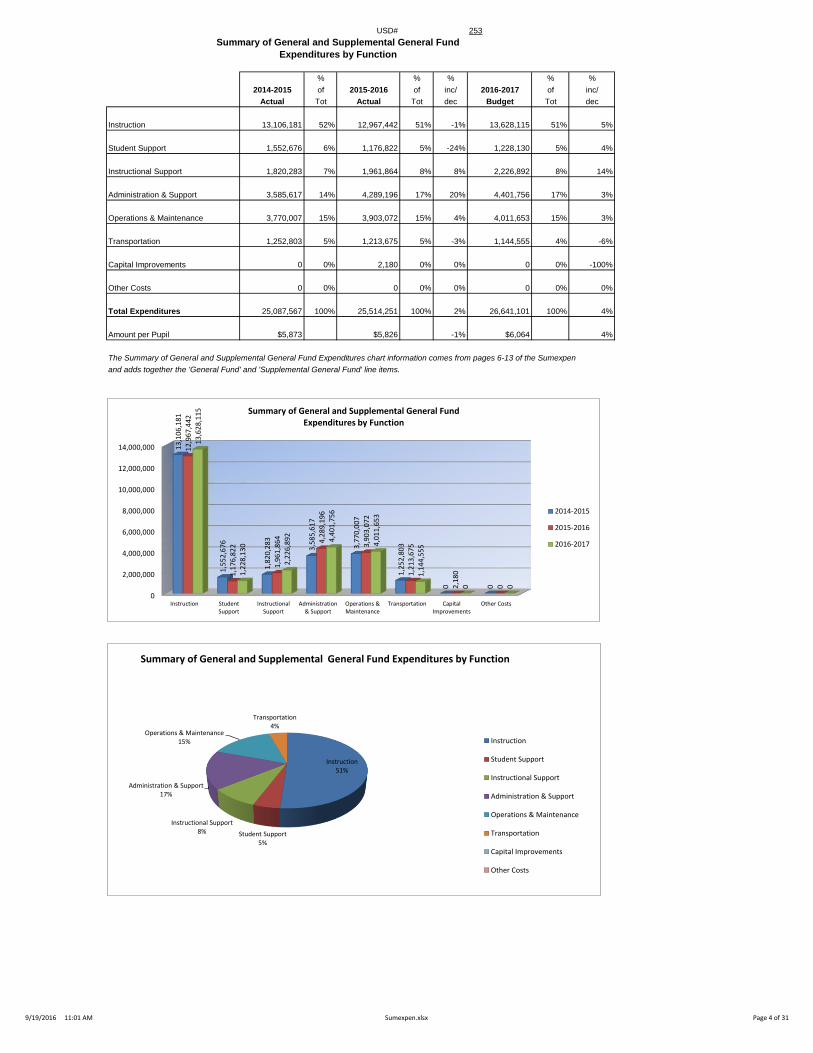
USD# 253Summary of General and Supplemental General Fund
Expenditures by Function
% % % % %2014-2015 of 2015-2016 of inc/ 2016-2017 of inc/
Actual Tot Actual Tot dec Budget Tot dec
Instruction 13,106,181 52% 12,967,442 51% -1% 13,628,115 51% 5%
Student Support 1,552,676 6% 1,176,822 5% -24% 1,228,130 5% 4%
Instructional Support 1,820,283 7% 1,961,864 8% 8% 2,226,892 8% 14%
Administration & Support 3,585,617 14% 4,289,196 17% 20% 4,401,756 17% 3%
Operations & Maintenance 3,770,007 15% 3,903,072 15% 4% 4,011,653 15% 3%
Transportation 1,252,803 5% 1,213,675 5% -3% 1,144,555 4% -6%
Capital Improvements 0 0% 2,180 0% 0% 0 0% -100%
Other Costs 0 0% 0 0% 0% 0 0% 0%
Total Expenditures 25,087,567 100% 25,514,251 100% 2% 26,641,101 100% 4%
Amount per Pupil $5,873 $5,826 -1% $6,064 4%
The Summary of General and Supplemental General Fund Expenditures chart information comes from pages 6-13 of the Sumexpen
and adds together the 'General Fund' and 'Supplemental General Fund' line items.
0
2,000,000
4,000,000
6,000,000
8,000,000
10,000,000
12,000,000
14,000,000
Instruction StudentSupport
InstructionalSupport
Administration& Support
Operations &Maintenance
Transportation CapitalImprovements
Other Costs
13
,10
6,1
81
1,5
52
,67
6
1,8
20
,28
3
3,5
85
,61
7
3,7
70
,00
7
1,2
52
,80
3
0 0
12
,96
7,4
42
1,1
76
,82
2
1,9
61
,86
4 4,2
89
,19
6
3,9
03
,07
2
1,2
13
,67
5
2,1
80
0
13
,62
8,1
15
1,2
28
,13
0
2,2
26
,89
2
4,4
01
,75
6
4,0
11
,65
3
1,1
44
,55
5
0 0
Summary of General and Supplemental General FundExpenditures by Function
2014-2015
2015-2016
2016-2017
Instruction51%
Student Support5%
Instructional Support8%
Administration & Support17%
Operations & Maintenance15%
Transportation4%
Summary of General and Supplemental General Fund Expenditures by Function
Instruction
Student Support
Instructional Support
Administration & Support
Operations & Maintenance
Transportation
Capital Improvements
Other Costs
9/19/2016 11:01 AM Sumexpen.xlsx Page 4 of 31

USD# 253
Summary of Special Education Fundby Function
% % % % %2014-2015 of 2015-2016 of inc/ 2016-2017 of inc/
Actual Tot Actual Tot dec Budget Tot dec
Instruction 4,087,982 92% 4,352,567 93% 6% 4,629,840 91% 6%
Student Support 0 0% 0 0% 0% 61,751 1% 0%
Instructional Support 0 0% 0 0% 0% 0 0% 0%
Administraton & Support 0 0% 0 0% 0% 0 0% 0%
Operations & Maintenance 0 0% 0 0% 0% 0 0% 0%
Transportation 348,248 8% 342,901 7% -2% 383,500 8% 12%
Capital Improvements 0 0% 0 0% 0% 0 0% 0%
Other Costs 0 0% 0 0% 0% 0 0% 0%
Total Expenditures 4,436,230 100% 4,695,468 100% 6% 5,075,091 100% 8%
Amount per Pupil $1,038 $1,072 3% $1,155 8%
The Summary of Special Education Fund Expenditures chart information comes from pages 6-13 and only uses the 'Special Education Fund'
line items. (Total expenditures excludes Special Ed Coop Fund because it would include expenditures for all schools participating in the Coop.)
0
500,000
1,000,000
1,500,000
2,000,000
2,500,000
3,000,000
3,500,000
4,000,000
4,500,000
5,000,000
Instruction StudentSupport
InstructionalSupport
Administraton& Support
Operations &Maintenance
Transportation CapitalImprovements
Other Costs
4,0
87
,98
2
0 0 0 0
34
8,2
48
0 0
4,3
52
,56
7
0 0 0 0
34
2,9
01
0 0
4,6
29
,84
0
61
,75
1
0 0 0
38
3,5
00
0 0
Summary of Special Education Fund Expenditures by Function
2014-2015
2015-2016
2016-2017
Instruction91%
Student Support1%
Transportation8%
Summary of Special Education Fund by Function
Instruction
Student Support
Instructional Support
Administraton & Support
Operations & Maintenance
Transportation
Capital Improvements
Other Costs
9/19/2016 11:01 AM Sumexpen.xlsx Page 5 of 31
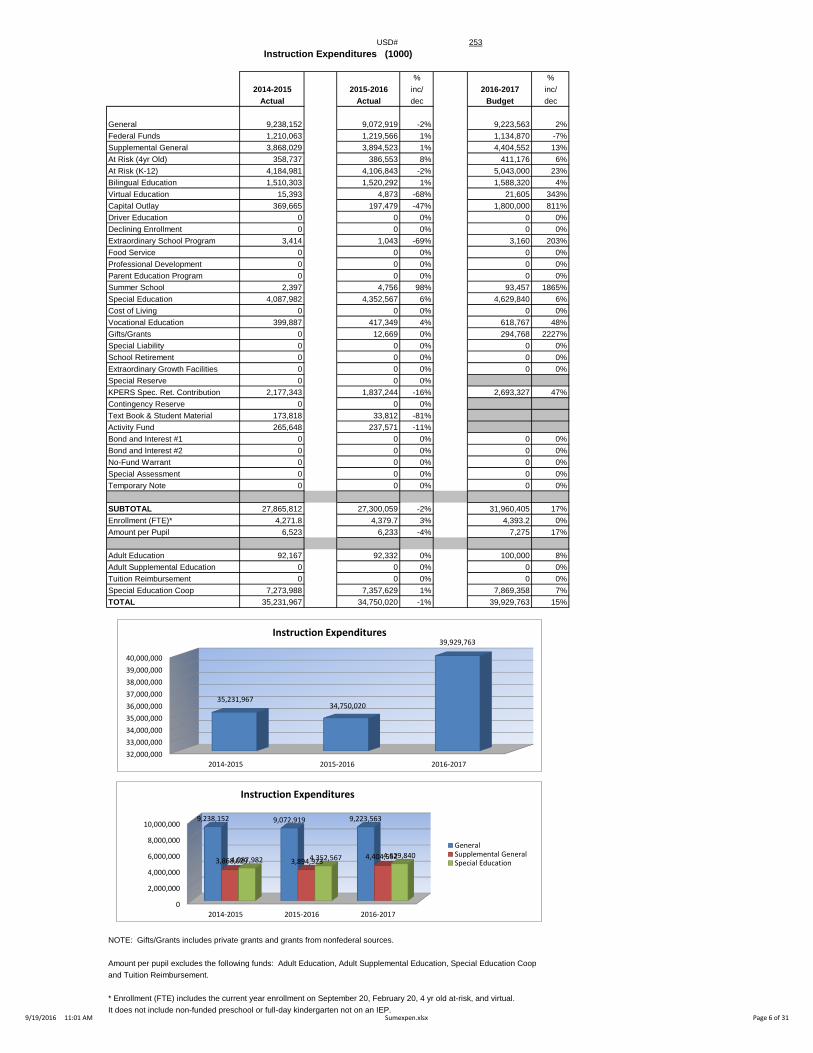
USD# 253Instruction Expenditures (1000)
% %2014-2015 2015-2016 inc/ 2016-2017 inc/
Actual Actual dec Budget dec
General 9,238,152 9,072,919 -2% 9,223,563 2%Federal Funds 1,210,063 1,219,566 1% 1,134,870 -7%Supplemental General 3,868,029 3,894,523 1% 4,404,552 13%At Risk (4yr Old) 358,737 386,553 8% 411,176 6%At Risk (K-12) 4,184,981 4,106,843 -2% 5,043,000 23%Bilingual Education 1,510,303 1,520,292 1% 1,588,320 4%Virtual Education 15,393 4,873 -68% 21,605 343%Capital Outlay 369,665 197,479 -47% 1,800,000 811%Driver Education 0 0 0% 0 0%Declining Enrollment 0 0 0% 0 0%Extraordinary School Program 3,414 1,043 -69% 3,160 203%Food Service 0 0 0% 0 0%Professional Development 0 0 0% 0 0%Parent Education Program 0 0 0% 0 0%Summer School 2,397 4,756 98% 93,457 1865%Special Education 4,087,982 4,352,567 6% 4,629,840 6%Cost of Living 0 0 0% 0 0%Vocational Education 399,887 417,349 4% 618,767 48%Gifts/Grants 0 12,669 0% 294,768 2227%Special Liability 0 0 0% 0 0%School Retirement 0 0 0% 0 0%Extraordinary Growth Facilities 0 0 0% 0 0%Special Reserve 0 0 0%KPERS Spec. Ret. Contribution 2,177,343 1,837,244 -16% 2,693,327 47%Contingency Reserve 0 0 0%Text Book & Student Material 173,818 33,812 -81%Activity Fund 265,648 237,571 -11%Bond and Interest #1 0 0 0% 0 0%Bond and Interest #2 0 0 0% 0 0%No-Fund Warrant 0 0 0% 0 0%Special Assessment 0 0 0% 0 0%Temporary Note 0 0 0% 0 0%
SUBTOTAL 27,865,812 27,300,059 -2% 31,960,405 17%Enrollment (FTE)* 4,271.8 4,379.7 3% 4,393.2 0%Amount per Pupil 6,523 6,233 -4% 7,275 17%
Adult Education 92,167 92,332 0% 100,000 8%Adult Supplemental Education 0 0 0% 0 0%Tuition Reimbursement 0 0 0% 0 0%Special Education Coop 7,273,988 7,357,629 1% 7,869,358 7%TOTAL 35,231,967 34,750,020 -1% 39,929,763 15%
NOTE: Gifts/Grants includes private grants and grants from nonfederal sources.
Amount per pupil excludes the following funds: Adult Education, Adult Supplemental Education, Special Education Coopand Tuition Reimbursement.
* Enrollment (FTE) includes the current year enrollment on September 20, February 20, 4 yr old at-risk, and virtual. It does not include non-funded preschool or full-day kindergarten not on an IEP.
0
2,000,000
4,000,000
6,000,000
8,000,000
10,000,000
2014-2015 2015-2016 2016-2017
9,238,152 9,072,919 9,223,563
3,868,029 3,894,5234,404,5524,087,982 4,352,567 4,629,840
Instruction Expenditures
GeneralSupplemental GeneralSpecial Education
32,000,000
33,000,000
34,000,000
35,000,000
36,000,000
37,000,000
38,000,000
39,000,000
40,000,000
2014-2015 2015-2016 2016-2017
35,231,96734,750,020
39,929,763Instruction Expenditures
9/19/2016 11:01 AM Sumexpen.xlsx Page 6 of 31
USD# 253
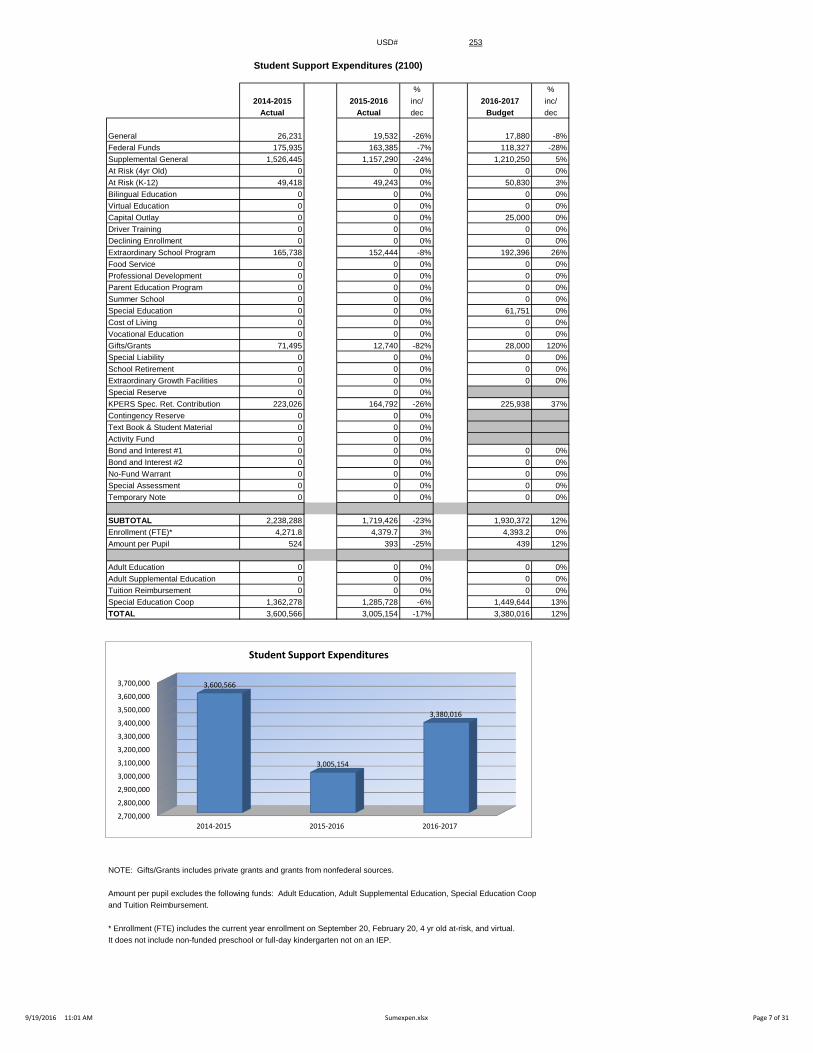
Student Support Expenditures (2100)
% %2014-2015 2015-2016 inc/ 2016-2017 inc/
Actual Actual dec Budget dec
General 26,231 19,532 -26% 17,880 -8%Federal Funds 175,935 163,385 -7% 118,327 -28%Supplemental General 1,526,445 1,157,290 -24% 1,210,250 5%At Risk (4yr Old) 0 0 0% 0 0%At Risk (K-12) 49,418 49,243 0% 50,830 3%Bilingual Education 0 0 0% 0 0%Virtual Education 0 0 0% 0 0%Capital Outlay 0 0 0% 25,000 0%Driver Training 0 0 0% 0 0%Declining Enrollment 0 0 0% 0 0%Extraordinary School Program 165,738 152,444 -8% 192,396 26%Food Service 0 0 0% 0 0%Professional Development 0 0 0% 0 0%Parent Education Program 0 0 0% 0 0%Summer School 0 0 0% 0 0%Special Education 0 0 0% 61,751 0%Cost of Living 0 0 0% 0 0%Vocational Education 0 0 0% 0 0%Gifts/Grants 71,495 12,740 -82% 28,000 120%Special Liability 0 0 0% 0 0%School Retirement 0 0 0% 0 0%Extraordinary Growth Facilities 0 0 0% 0 0%Special Reserve 0 0 0%KPERS Spec. Ret. Contribution 223,026 164,792 -26% 225,938 37%Contingency Reserve 0 0 0%Text Book & Student Material 0 0 0%Activity Fund 0 0 0%Bond and Interest #1 0 0 0% 0 0%Bond and Interest #2 0 0 0% 0 0%No-Fund Warrant 0 0 0% 0 0%Special Assessment 0 0 0% 0 0%Temporary Note 0 0 0% 0 0%
SUBTOTAL 2,238,288 1,719,426 -23% 1,930,372 12%Enrollment (FTE)* 4,271.8 4,379.7 3% 4,393.2 0%Amount per Pupil 524 393 -25% 439 12%
Adult Education 0 0 0% 0 0%Adult Supplemental Education 0 0 0% 0 0%Tuition Reimbursement 0 0 0% 0 0%Special Education Coop 1,362,278 1,285,728 -6% 1,449,644 13%TOTAL 3,600,566 3,005,154 -17% 3,380,016 12%
NOTE: Gifts/Grants includes private grants and grants from nonfederal sources.
Amount per pupil excludes the following funds: Adult Education, Adult Supplemental Education, Special Education Coopand Tuition Reimbursement.
* Enrollment (FTE) includes the current year enrollment on September 20, February 20, 4 yr old at-risk, and virtual. It does not include non-funded preschool or full-day kindergarten not on an IEP.
2,700,000
2,800,000
2,900,000
3,000,000
3,100,000
3,200,000
3,300,000
3,400,000
3,500,000
3,600,000
3,700,000
2014-2015 2015-2016 2016-2017
3,600,566
3,005,154
3,380,016
Student Support Expenditures
9/19/2016 11:01 AM Sumexpen.xlsx Page 7 of 31
USD# 253
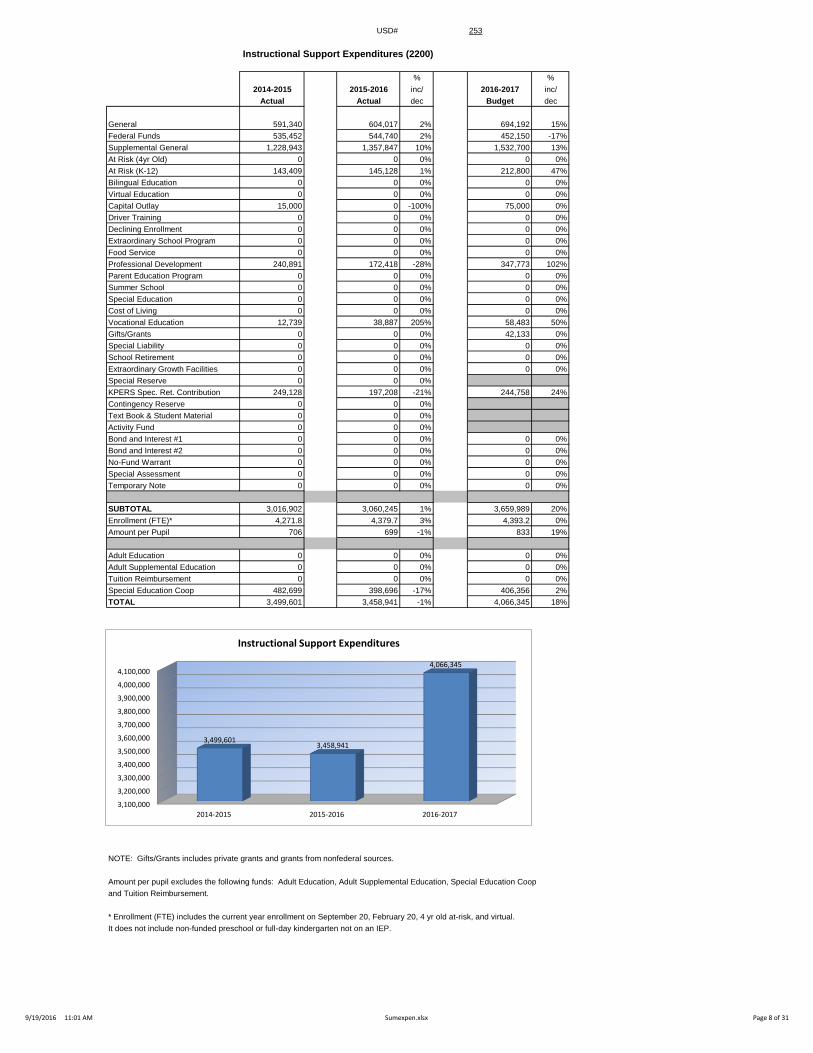
Instructional Support Expenditures (2200)
% %2014-2015 2015-2016 inc/ 2016-2017 inc/
Actual Actual dec Budget dec
General 591,340 604,017 2% 694,192 15%Federal Funds 535,452 544,740 2% 452,150 -17%Supplemental General 1,228,943 1,357,847 10% 1,532,700 13%At Risk (4yr Old) 0 0 0% 0 0%At Risk (K-12) 143,409 145,128 1% 212,800 47%Bilingual Education 0 0 0% 0 0%Virtual Education 0 0 0% 0 0%Capital Outlay 15,000 0 -100% 75,000 0%Driver Training 0 0 0% 0 0%Declining Enrollment 0 0 0% 0 0%Extraordinary School Program 0 0 0% 0 0%Food Service 0 0 0% 0 0%Professional Development 240,891 172,418 -28% 347,773 102%Parent Education Program 0 0 0% 0 0%Summer School 0 0 0% 0 0%Special Education 0 0 0% 0 0%Cost of Living 0 0 0% 0 0%Vocational Education 12,739 38,887 205% 58,483 50%Gifts/Grants 0 0 0% 42,133 0%Special Liability 0 0 0% 0 0%School Retirement 0 0 0% 0 0%Extraordinary Growth Facilities 0 0 0% 0 0%Special Reserve 0 0 0%KPERS Spec. Ret. Contribution 249,128 197,208 -21% 244,758 24%Contingency Reserve 0 0 0%Text Book & Student Material 0 0 0%Activity Fund 0 0 0%Bond and Interest #1 0 0 0% 0 0%Bond and Interest #2 0 0 0% 0 0%No-Fund Warrant 0 0 0% 0 0%Special Assessment 0 0 0% 0 0%Temporary Note 0 0 0% 0 0%
SUBTOTAL 3,016,902 3,060,245 1% 3,659,989 20%Enrollment (FTE)* 4,271.8 4,379.7 3% 4,393.2 0%Amount per Pupil 706 699 -1% 833 19%
Adult Education 0 0 0% 0 0%Adult Supplemental Education 0 0 0% 0 0%Tuition Reimbursement 0 0 0% 0 0%Special Education Coop 482,699 398,696 -17% 406,356 2%TOTAL 3,499,601 3,458,941 -1% 4,066,345 18%
NOTE: Gifts/Grants includes private grants and grants from nonfederal sources.
Amount per pupil excludes the following funds: Adult Education, Adult Supplemental Education, Special Education Coopand Tuition Reimbursement.
* Enrollment (FTE) includes the current year enrollment on September 20, February 20, 4 yr old at-risk, and virtual. It does not include non-funded preschool or full-day kindergarten not on an IEP.
3,100,000
3,200,000
3,300,000
3,400,000
3,500,000
3,600,000
3,700,000
3,800,000
3,900,000
4,000,000
4,100,000
2014-2015 2015-2016 2016-2017
3,499,6013,458,941
4,066,345
Instructional Support Expenditures
9/19/2016 11:01 AM Sumexpen.xlsx Page 8 of 31
USD# 253
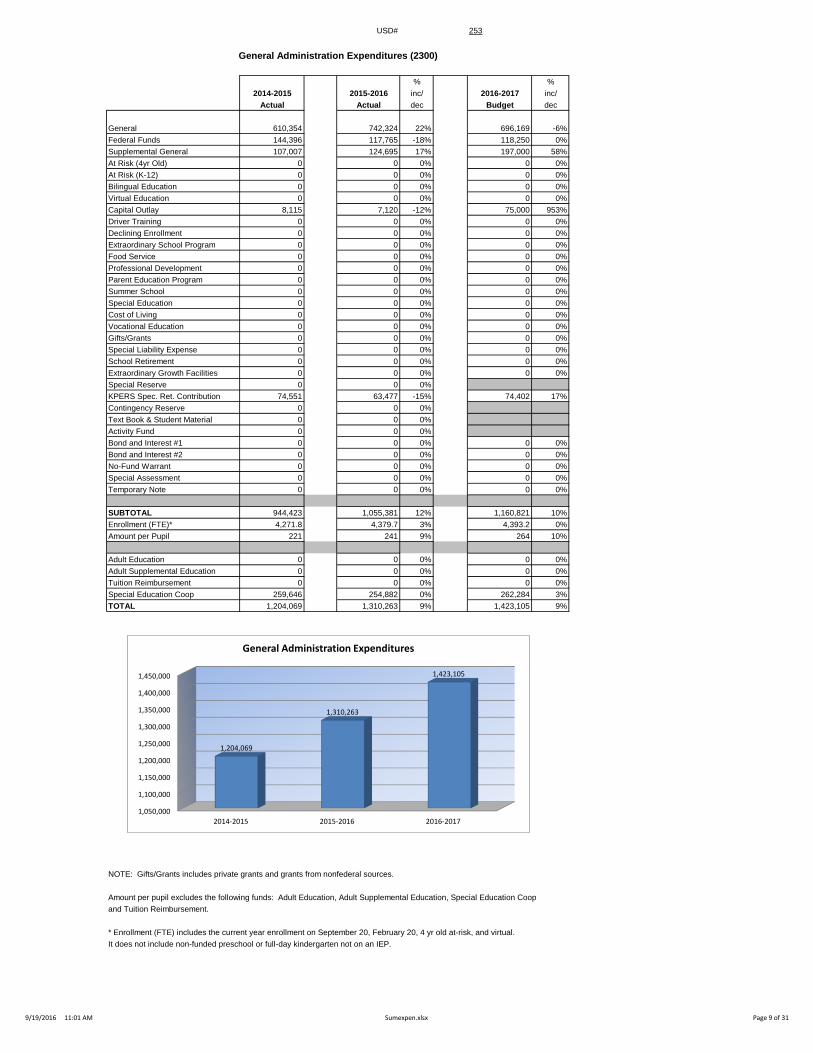
General Administration Expenditures (2300)
% %2014-2015 2015-2016 inc/ 2016-2017 inc/
Actual Actual dec Budget dec
General 610,354 742,324 22% 696,169 -6%Federal Funds 144,396 117,765 -18% 118,250 0%Supplemental General 107,007 124,695 17% 197,000 58%At Risk (4yr Old) 0 0 0% 0 0%At Risk (K-12) 0 0 0% 0 0%Bilingual Education 0 0 0% 0 0%Virtual Education 0 0 0% 0 0%Capital Outlay 8,115 7,120 -12% 75,000 953%Driver Training 0 0 0% 0 0%Declining Enrollment 0 0 0% 0 0%Extraordinary School Program 0 0 0% 0 0%Food Service 0 0 0% 0 0%Professional Development 0 0 0% 0 0%Parent Education Program 0 0 0% 0 0%Summer School 0 0 0% 0 0%Special Education 0 0 0% 0 0%Cost of Living 0 0 0% 0 0%Vocational Education 0 0 0% 0 0%Gifts/Grants 0 0 0% 0 0%Special Liability Expense 0 0 0% 0 0%School Retirement 0 0 0% 0 0%Extraordinary Growth Facilities 0 0 0% 0 0%Special Reserve 0 0 0%KPERS Spec. Ret. Contribution 74,551 63,477 -15% 74,402 17%Contingency Reserve 0 0 0%Text Book & Student Material 0 0 0%Activity Fund 0 0 0%Bond and Interest #1 0 0 0% 0 0%Bond and Interest #2 0 0 0% 0 0%No-Fund Warrant 0 0 0% 0 0%Special Assessment 0 0 0% 0 0%Temporary Note 0 0 0% 0 0%
SUBTOTAL 944,423 1,055,381 12% 1,160,821 10%Enrollment (FTE)* 4,271.8 4,379.7 3% 4,393.2 0%Amount per Pupil 221 241 9% 264 10%
Adult Education 0 0 0% 0 0%Adult Supplemental Education 0 0 0% 0 0%Tuition Reimbursement 0 0 0% 0 0%Special Education Coop 259,646 254,882 0% 262,284 3%TOTAL 1,204,069 1,310,263 9% 1,423,105 9%
NOTE: Gifts/Grants includes private grants and grants from nonfederal sources.
Amount per pupil excludes the following funds: Adult Education, Adult Supplemental Education, Special Education Coopand Tuition Reimbursement.
* Enrollment (FTE) includes the current year enrollment on September 20, February 20, 4 yr old at-risk, and virtual. It does not include non-funded preschool or full-day kindergarten not on an IEP.
1,050,000
1,100,000
1,150,000
1,200,000
1,250,000
1,300,000
1,350,000
1,400,000
1,450,000
2014-2015 2015-2016 2016-2017
1,204,069
1,310,263
1,423,105
General Administration Expenditures
9/19/2016 11:01 AM Sumexpen.xlsx Page 9 of 31
USD# 253
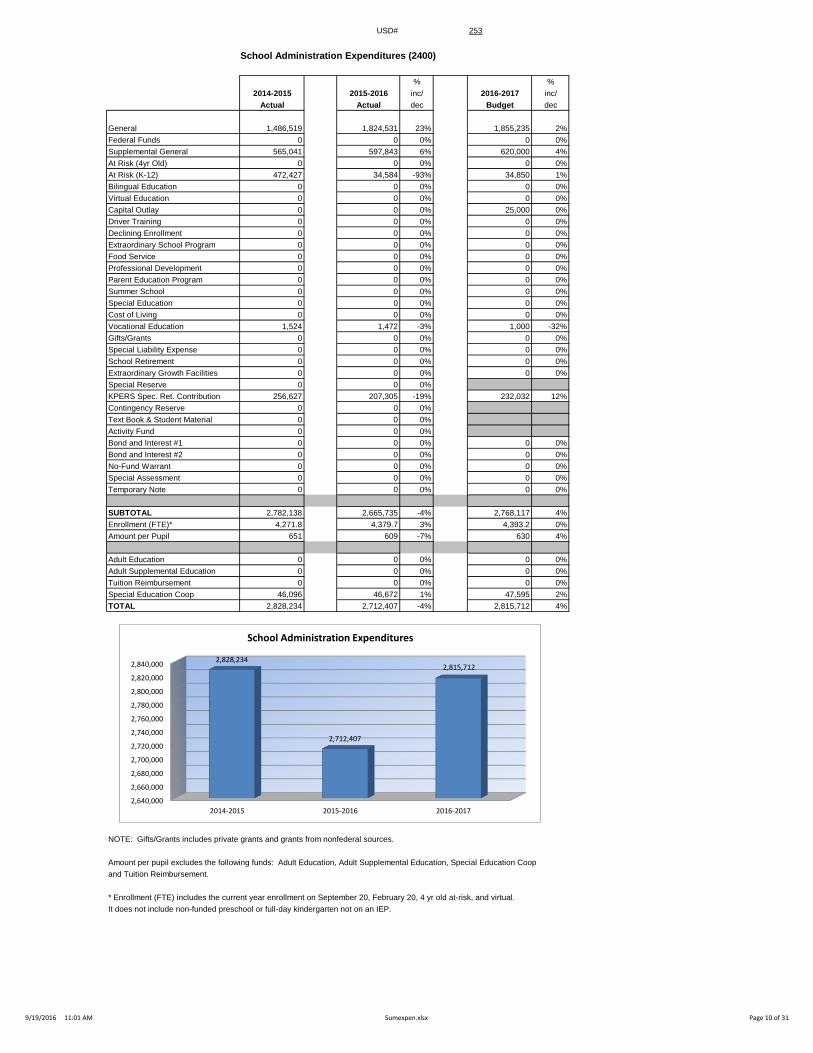
School Administration Expenditures (2400)
% %2014-2015 2015-2016 inc/ 2016-2017 inc/
Actual Actual dec Budget dec
General 1,486,519 1,824,531 23% 1,855,235 2%Federal Funds 0 0 0% 0 0%Supplemental General 565,041 597,843 6% 620,000 4%At Risk (4yr Old) 0 0 0% 0 0%At Risk (K-12) 472,427 34,584 -93% 34,850 1%Bilingual Education 0 0 0% 0 0%Virtual Education 0 0 0% 0 0%Capital Outlay 0 0 0% 25,000 0%Driver Training 0 0 0% 0 0%Declining Enrollment 0 0 0% 0 0%Extraordinary School Program 0 0 0% 0 0%Food Service 0 0 0% 0 0%Professional Development 0 0 0% 0 0%Parent Education Program 0 0 0% 0 0%Summer School 0 0 0% 0 0%Special Education 0 0 0% 0 0%Cost of Living 0 0 0% 0 0%Vocational Education 1,524 1,472 -3% 1,000 -32%Gifts/Grants 0 0 0% 0 0%Special Liability Expense 0 0 0% 0 0%School Retirement 0 0 0% 0 0%Extraordinary Growth Facilities 0 0 0% 0 0%Special Reserve 0 0 0%KPERS Spec. Ret. Contribution 256,627 207,305 -19% 232,032 12%Contingency Reserve 0 0 0%Text Book & Student Material 0 0 0%Activity Fund 0 0 0%Bond and Interest #1 0 0 0% 0 0%Bond and Interest #2 0 0 0% 0 0%No-Fund Warrant 0 0 0% 0 0%Special Assessment 0 0 0% 0 0%Temporary Note 0 0 0% 0 0%
SUBTOTAL 2,782,138 2,665,735 -4% 2,768,117 4%Enrollment (FTE)* 4,271.8 4,379.7 3% 4,393.2 0%Amount per Pupil 651 609 -7% 630 4%
Adult Education 0 0 0% 0 0%Adult Supplemental Education 0 0 0% 0 0%Tuition Reimbursement 0 0 0% 0 0%Special Education Coop 46,096 46,672 1% 47,595 2%TOTAL 2,828,234 2,712,407 -4% 2,815,712 4%
NOTE: Gifts/Grants includes private grants and grants from nonfederal sources.
Amount per pupil excludes the following funds: Adult Education, Adult Supplemental Education, Special Education Coopand Tuition Reimbursement.
* Enrollment (FTE) includes the current year enrollment on September 20, February 20, 4 yr old at-risk, and virtual. It does not include non-funded preschool or full-day kindergarten not on an IEP.
2,640,000
2,660,000
2,680,000
2,700,000
2,720,000
2,740,000
2,760,000
2,780,000
2,800,000
2,820,000
2,840,000
2014-2015 2015-2016 2016-2017
2,828,234
2,712,407
2,815,712
School Administration Expenditures
9/19/2016 11:01 AM Sumexpen.xlsx Page 10 of 31
USD# 253
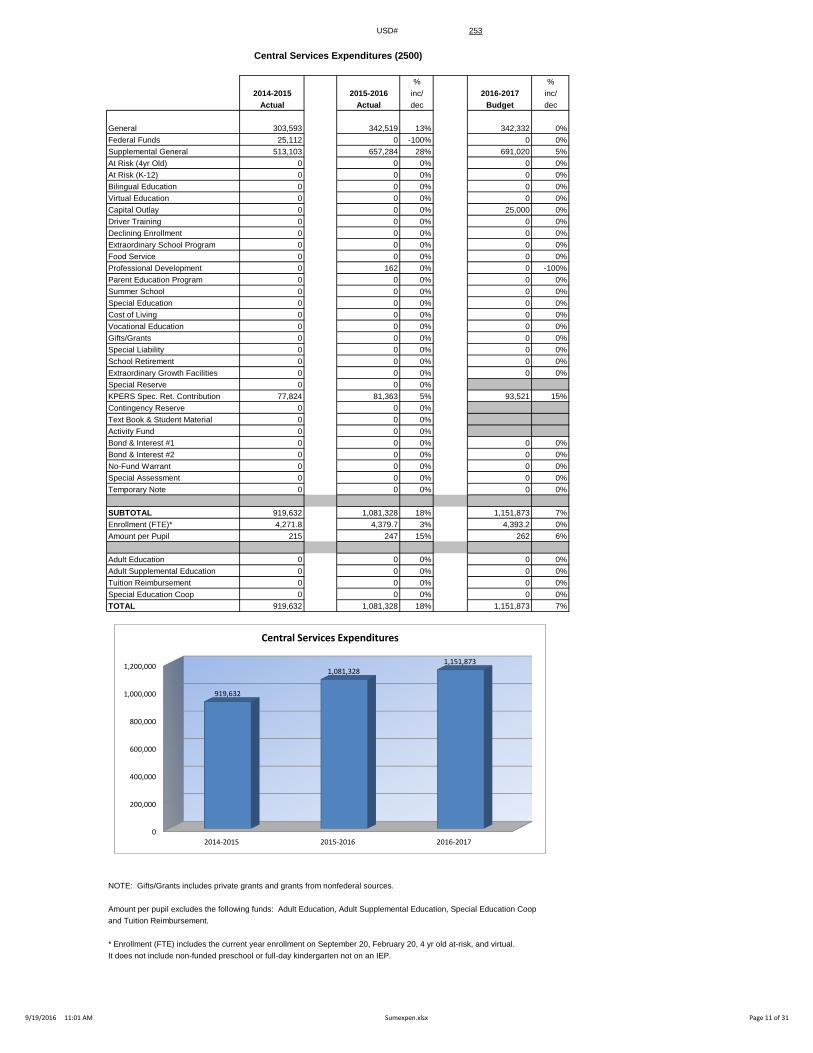
Central Services Expenditures (2500)
% %2014-2015 2015-2016 inc/ 2016-2017 inc/
Actual Actual dec Budget dec
General 303,593 342,519 13% 342,332 0%Federal Funds 25,112 0 -100% 0 0%Supplemental General 513,103 657,284 28% 691,020 5%At Risk (4yr Old) 0 0 0% 0 0%At Risk (K-12) 0 0 0% 0 0%Bilingual Education 0 0 0% 0 0%Virtual Education 0 0 0% 0 0%Capital Outlay 0 0 0% 25,000 0%Driver Training 0 0 0% 0 0%Declining Enrollment 0 0 0% 0 0%Extraordinary School Program 0 0 0% 0 0%Food Service 0 0 0% 0 0%Professional Development 0 162 0% 0 -100%Parent Education Program 0 0 0% 0 0%Summer School 0 0 0% 0 0%Special Education 0 0 0% 0 0%Cost of Living 0 0 0% 0 0%Vocational Education 0 0 0% 0 0%Gifts/Grants 0 0 0% 0 0%Special Liability 0 0 0% 0 0%School Retirement 0 0 0% 0 0%Extraordinary Growth Facilities 0 0 0% 0 0%Special Reserve 0 0 0%KPERS Spec. Ret. Contribution 77,824 81,363 5% 93,521 15%Contingency Reserve 0 0 0%Text Book & Student Material 0 0 0%Activity Fund 0 0 0%Bond & Interest #1 0 0 0% 0 0%Bond & Interest #2 0 0 0% 0 0%No-Fund Warrant 0 0 0% 0 0%Special Assessment 0 0 0% 0 0%Temporary Note 0 0 0% 0 0%
SUBTOTAL 919,632 1,081,328 18% 1,151,873 7%Enrollment (FTE)* 4,271.8 4,379.7 3% 4,393.2 0%Amount per Pupil 215 247 15% 262 6%
Adult Education 0 0 0% 0 0%Adult Supplemental Education 0 0 0% 0 0%Tuition Reimbursement 0 0 0% 0 0%Special Education Coop 0 0 0% 0 0%TOTAL 919,632 1,081,328 18% 1,151,873 7%
NOTE: Gifts/Grants includes private grants and grants from nonfederal sources.
Amount per pupil excludes the following funds: Adult Education, Adult Supplemental Education, Special Education Coopand Tuition Reimbursement.
* Enrollment (FTE) includes the current year enrollment on September 20, February 20, 4 yr old at-risk, and virtual. It does not include non-funded preschool or full-day kindergarten not on an IEP.
0
200,000
400,000
600,000
800,000
1,000,000
1,200,000
2014-2015 2015-2016 2016-2017
919,632
1,081,3281,151,873
Central Services Expenditures
9/19/2016 11:01 AM Sumexpen.xlsx Page 11 of 31
USD# 253
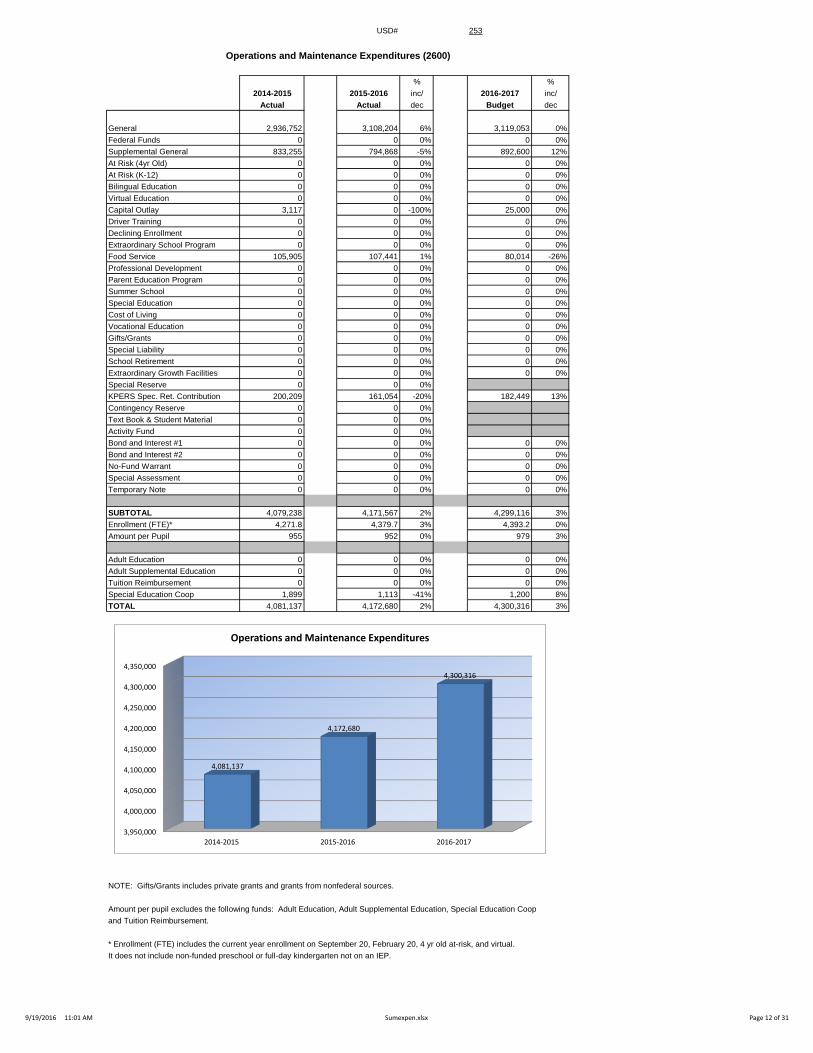
Operations and Maintenance Expenditures (2600)
% %2014-2015 2015-2016 inc/ 2016-2017 inc/
Actual Actual dec Budget dec
General 2,936,752 3,108,204 6% 3,119,053 0%Federal Funds 0 0 0% 0 0%Supplemental General 833,255 794,868 -5% 892,600 12%At Risk (4yr Old) 0 0 0% 0 0%At Risk (K-12) 0 0 0% 0 0%Bilingual Education 0 0 0% 0 0%Virtual Education 0 0 0% 0 0%Capital Outlay 3,117 0 -100% 25,000 0%Driver Training 0 0 0% 0 0%Declining Enrollment 0 0 0% 0 0%Extraordinary School Program 0 0 0% 0 0%Food Service 105,905 107,441 1% 80,014 -26%Professional Development 0 0 0% 0 0%Parent Education Program 0 0 0% 0 0%Summer School 0 0 0% 0 0%Special Education 0 0 0% 0 0%Cost of Living 0 0 0% 0 0%Vocational Education 0 0 0% 0 0%Gifts/Grants 0 0 0% 0 0%Special Liability 0 0 0% 0 0%School Retirement 0 0 0% 0 0%Extraordinary Growth Facilities 0 0 0% 0 0%Special Reserve 0 0 0%KPERS Spec. Ret. Contribution 200,209 161,054 -20% 182,449 13%Contingency Reserve 0 0 0%Text Book & Student Material 0 0 0%Activity Fund 0 0 0%Bond and Interest #1 0 0 0% 0 0%Bond and Interest #2 0 0 0% 0 0%No-Fund Warrant 0 0 0% 0 0%Special Assessment 0 0 0% 0 0%Temporary Note 0 0 0% 0 0%
SUBTOTAL 4,079,238 4,171,567 2% 4,299,116 3%Enrollment (FTE)* 4,271.8 4,379.7 3% 4,393.2 0%Amount per Pupil 955 952 0% 979 3%
Adult Education 0 0 0% 0 0%Adult Supplemental Education 0 0 0% 0 0%Tuition Reimbursement 0 0 0% 0 0%Special Education Coop 1,899 1,113 -41% 1,200 8%TOTAL 4,081,137 4,172,680 2% 4,300,316 3%
NOTE: Gifts/Grants includes private grants and grants from nonfederal sources.
Amount per pupil excludes the following funds: Adult Education, Adult Supplemental Education, Special Education Coopand Tuition Reimbursement.
* Enrollment (FTE) includes the current year enrollment on September 20, February 20, 4 yr old at-risk, and virtual. It does not include non-funded preschool or full-day kindergarten not on an IEP.
3,950,000
4,000,000
4,050,000
4,100,000
4,150,000
4,200,000
4,250,000
4,300,000
4,350,000
2014-2015 2015-2016 2016-2017
4,081,137
4,172,680
4,300,316
Operations and Maintenance Expenditures
9/19/2016 11:01 AM Sumexpen.xlsx Page 12 of 31
USD# 253
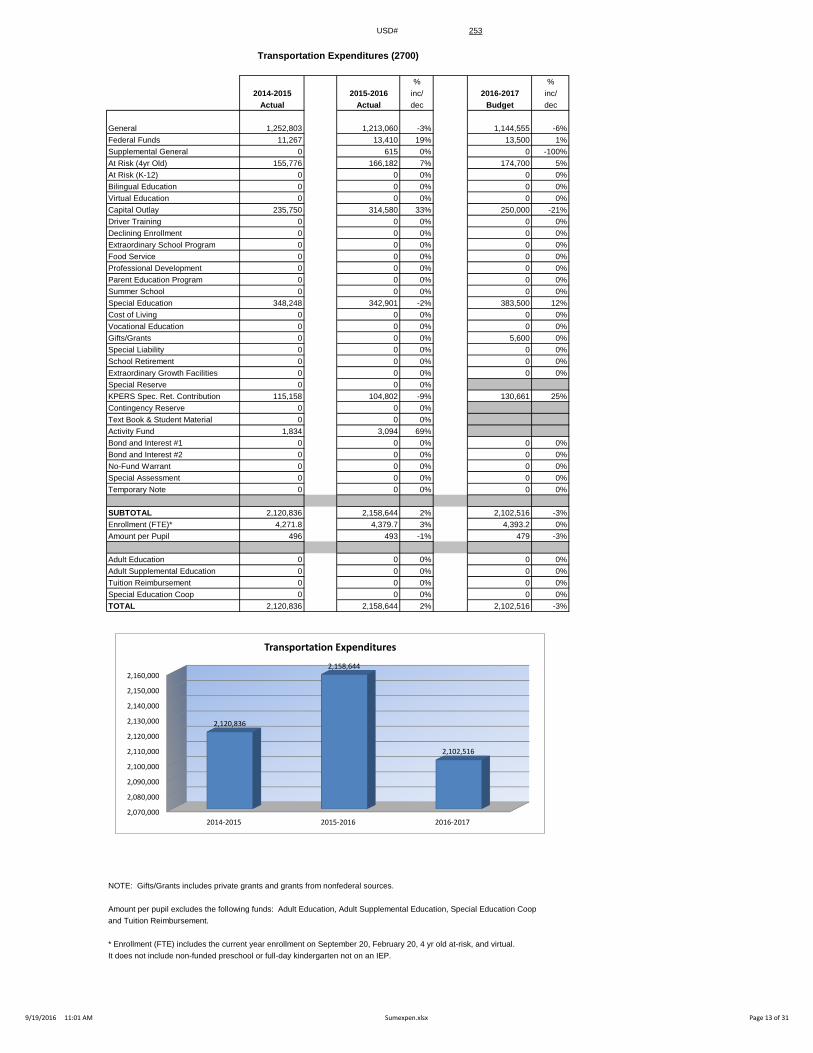
Transportation Expenditures (2700)
% %2014-2015 2015-2016 inc/ 2016-2017 inc/
Actual Actual dec Budget dec
General 1,252,803 1,213,060 -3% 1,144,555 -6%Federal Funds 11,267 13,410 19% 13,500 1%Supplemental General 0 615 0% 0 -100%At Risk (4yr Old) 155,776 166,182 7% 174,700 5%At Risk (K-12) 0 0 0% 0 0%Bilingual Education 0 0 0% 0 0%Virtual Education 0 0 0% 0 0%Capital Outlay 235,750 314,580 33% 250,000 -21%Driver Training 0 0 0% 0 0%Declining Enrollment 0 0 0% 0 0%Extraordinary School Program 0 0 0% 0 0%Food Service 0 0 0% 0 0%Professional Development 0 0 0% 0 0%Parent Education Program 0 0 0% 0 0%Summer School 0 0 0% 0 0%Special Education 348,248 342,901 -2% 383,500 12%Cost of Living 0 0 0% 0 0%Vocational Education 0 0 0% 0 0%Gifts/Grants 0 0 0% 5,600 0%Special Liability 0 0 0% 0 0%School Retirement 0 0 0% 0 0%Extraordinary Growth Facilities 0 0 0% 0 0%Special Reserve 0 0 0%KPERS Spec. Ret. Contribution 115,158 104,802 -9% 130,661 25%Contingency Reserve 0 0 0%Text Book & Student Material 0 0 0%Activity Fund 1,834 3,094 69%Bond and Interest #1 0 0 0% 0 0%Bond and Interest #2 0 0 0% 0 0%No-Fund Warrant 0 0 0% 0 0%Special Assessment 0 0 0% 0 0%Temporary Note 0 0 0% 0 0%
SUBTOTAL 2,120,836 2,158,644 2% 2,102,516 -3%Enrollment (FTE)* 4,271.8 4,379.7 3% 4,393.2 0%Amount per Pupil 496 493 -1% 479 -3%
Adult Education 0 0 0% 0 0%Adult Supplemental Education 0 0 0% 0 0%Tuition Reimbursement 0 0 0% 0 0%Special Education Coop 0 0 0% 0 0%TOTAL 2,120,836 2,158,644 2% 2,102,516 -3%
NOTE: Gifts/Grants includes private grants and grants from nonfederal sources.
Amount per pupil excludes the following funds: Adult Education, Adult Supplemental Education, Special Education Coopand Tuition Reimbursement.
* Enrollment (FTE) includes the current year enrollment on September 20, February 20, 4 yr old at-risk, and virtual. It does not include non-funded preschool or full-day kindergarten not on an IEP.
2,070,000
2,080,000
2,090,000
2,100,000
2,110,000
2,120,000
2,130,000
2,140,000
2,150,000
2,160,000
2014-2015 2015-2016 2016-2017
2,120,836
2,158,644
2,102,516
Transportation Expenditures
9/19/2016 11:01 AM Sumexpen.xlsx Page 13 of 31
USD# 253
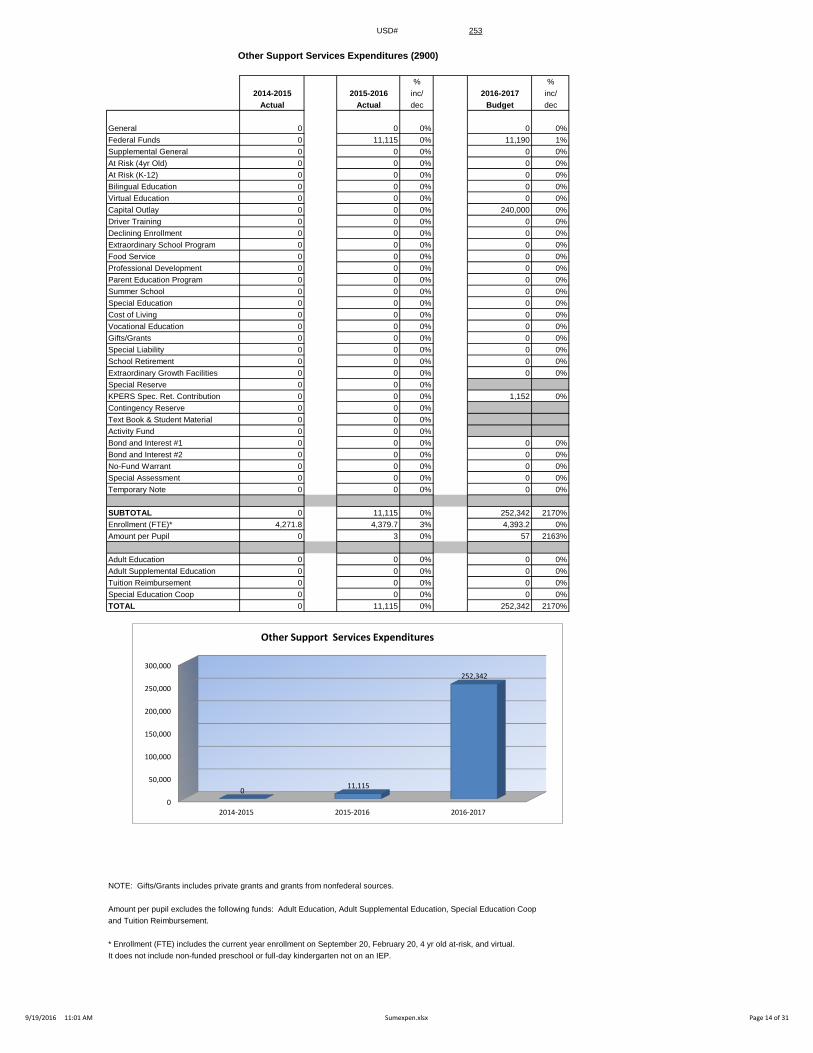
Other Support Services Expenditures (2900)
% %2014-2015 2015-2016 inc/ 2016-2017 inc/
Actual Actual dec Budget dec
General 0 0 0% 0 0%Federal Funds 0 11,115 0% 11,190 1%Supplemental General 0 0 0% 0 0%At Risk (4yr Old) 0 0 0% 0 0%At Risk (K-12) 0 0 0% 0 0%Bilingual Education 0 0 0% 0 0%Virtual Education 0 0 0% 0 0%Capital Outlay 0 0 0% 240,000 0%Driver Training 0 0 0% 0 0%Declining Enrollment 0 0 0% 0 0%Extraordinary School Program 0 0 0% 0 0%Food Service 0 0 0% 0 0%Professional Development 0 0 0% 0 0%Parent Education Program 0 0 0% 0 0%Summer School 0 0 0% 0 0%Special Education 0 0 0% 0 0%Cost of Living 0 0 0% 0 0%Vocational Education 0 0 0% 0 0%Gifts/Grants 0 0 0% 0 0%Special Liability 0 0 0% 0 0%School Retirement 0 0 0% 0 0%Extraordinary Growth Facilities 0 0 0% 0 0%Special Reserve 0 0 0%KPERS Spec. Ret. Contribution 0 0 0% 1,152 0%Contingency Reserve 0 0 0%Text Book & Student Material 0 0 0%Activity Fund 0 0 0%Bond and Interest #1 0 0 0% 0 0%Bond and Interest #2 0 0 0% 0 0%No-Fund Warrant 0 0 0% 0 0%Special Assessment 0 0 0% 0 0%Temporary Note 0 0 0% 0 0%
SUBTOTAL 0 11,115 0% 252,342 2170%Enrollment (FTE)* 4,271.8 4,379.7 3% 4,393.2 0%Amount per Pupil 0 3 0% 57 2163%
Adult Education 0 0 0% 0 0%Adult Supplemental Education 0 0 0% 0 0%Tuition Reimbursement 0 0 0% 0 0%Special Education Coop 0 0 0% 0 0%TOTAL 0 11,115 0% 252,342 2170%
NOTE: Gifts/Grants includes private grants and grants from nonfederal sources.
Amount per pupil excludes the following funds: Adult Education, Adult Supplemental Education, Special Education Coopand Tuition Reimbursement.
* Enrollment (FTE) includes the current year enrollment on September 20, February 20, 4 yr old at-risk, and virtual. It does not include non-funded preschool or full-day kindergarten not on an IEP.
0
50,000
100,000
150,000
200,000
250,000
300,000
2014-2015 2015-2016 2016-2017
011,115
252,342
Other Support Services Expenditures
9/19/2016 11:01 AM Sumexpen.xlsx Page 14 of 31

USD# 253
Food Services Expenditures (3100)
% %2014-2015 2015-2016 inc/ 2016-2017 inc/
Actual Actual dec Budget dec
General 0 0 0% 0 0%Federal Funds 0 11,119 0% 11,180 1%Supplemental General 0 0 0% 0 0%At Risk (4yr Old) 0 0 0% 0 0%At Risk (K-12) 0 0 0% 0 0%Bilingual Education 0 0 0% 0 0%Virtual Education 0 0 0% 0 0%Capital Outlay 0 0 0% 0 0%Driver Training 0 0 0% 0 0%Declining Enrollment 0 0 0% 0 0%Extraordinary School Program 0 0 0% 0 0%Food Service 2,225,701 2,358,148 6% 2,570,225 9%Professional Development 0 0 0% 0 0%Parent Education Program 0 0 0% 0 0%Summer School 0 0 0% 0 0%Special Education 0 0 0% 0 0%Cost of Living 0 0 0% 0 0%Vocational Education 0 0 0% 0 0%Gifts/Grants 0 0 0% 0 0%Special Liability 0 0 0% 0 0%School Retirement 0 0 0% 0 0%Extraordinary Growth Facilities 0 0 0% 0 0%Special Reserve 0 0 0%KPERS Spec. Ret. Contribution 87,488 72,159 -18% 99,503 38%Contingency Reserve 0 0 0%Text Book & Student Material 0 0 0%Activity Fund 0 0 0%Bond and Interest #1 0 0 0% 0 0%Bond and Interest #2 0 0 0% 0 0%No-Fund Warrant 0 0 0% 0 0%Special Assessment 0 0 0% 0 0%Temporary Note 0 0 0% 0 0%
SUBTOTAL 2,313,189 2,441,426 6% 2,680,908 10%Enrollment (FTE)* 4,271.8 4,379.7 3% 4,393.2 0%Amount per Pupil 542 557 3% 610 9%
Adult Education 0 0 0% 0 0%Adult Supplemental Education 0 0 0% 0 0%Tuition Reimbursement 0 0 0% 0 0%Special Education Coop 0 0 0% 0 0%TOTAL 2,313,189 2,441,426 6% 2,680,908 10%
NOTE: Gifts/Grants includes private grants and grants from nonfederal sources.
Amount per pupil excludes the following funds: Adult Education, Adult Supplemental Education, Special Education Coopand Tuition Reimbursement.
* Enrollment (FTE) includes the current year enrollment on September 20, February 20, 4 yr old at-risk, and virtual. It does not include non-funded preschool or full-day kindergarten not on an IEP.
2,100,000
2,200,000
2,300,000
2,400,000
2,500,000
2,600,000
2,700,000
2014-2015 2015-2016 2016-2017
2,313,189
2,441,426
2,680,908
Food Service Expenditures
9/19/2016 11:01 AM Sumexpen.xlsx Page 15 of 31
USD# 253
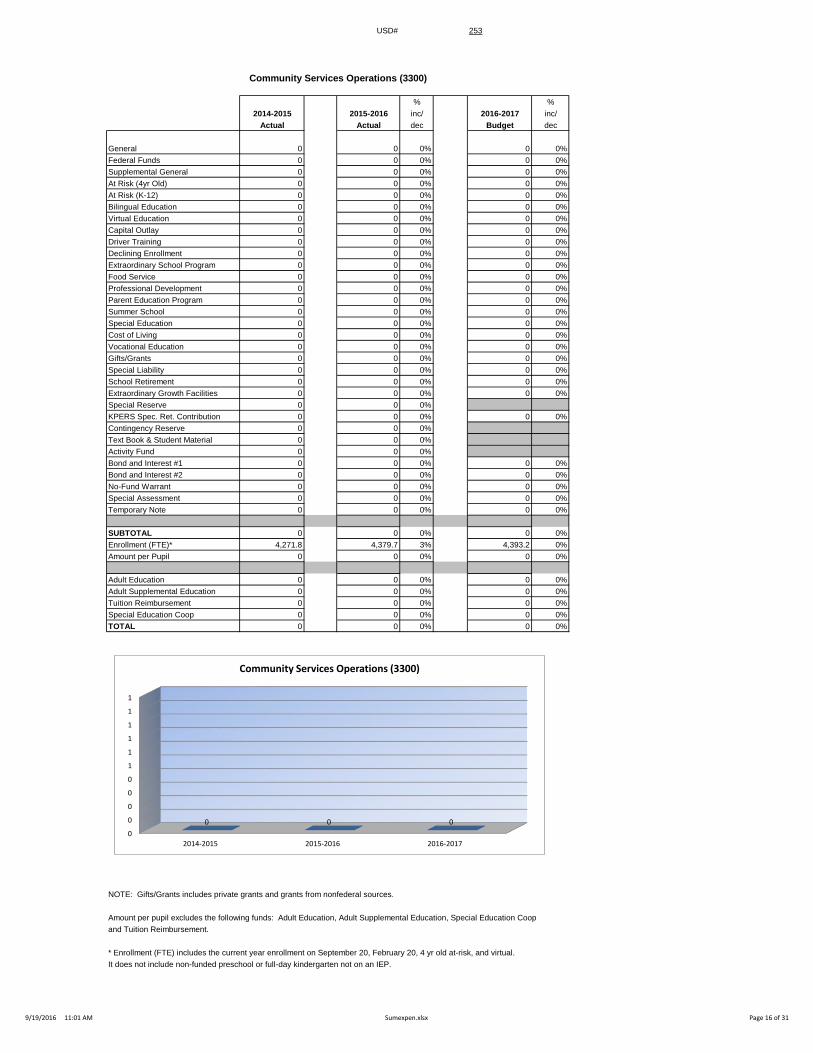
Community Services Operations (3300)
% %2014-2015 2015-2016 inc/ 2016-2017 inc/
Actual Actual dec Budget dec
General 0 0 0% 0 0%Federal Funds 0 0 0% 0 0%Supplemental General 0 0 0% 0 0%At Risk (4yr Old) 0 0 0% 0 0%At Risk (K-12) 0 0 0% 0 0%Bilingual Education 0 0 0% 0 0%Virtual Education 0 0 0% 0 0%Capital Outlay 0 0 0% 0 0%Driver Training 0 0 0% 0 0%Declining Enrollment 0 0 0% 0 0%Extraordinary School Program 0 0 0% 0 0%Food Service 0 0 0% 0 0%Professional Development 0 0 0% 0 0%Parent Education Program 0 0 0% 0 0%Summer School 0 0 0% 0 0%Special Education 0 0 0% 0 0%Cost of Living 0 0 0% 0 0%Vocational Education 0 0 0% 0 0%Gifts/Grants 0 0 0% 0 0%Special Liability 0 0 0% 0 0%School Retirement 0 0 0% 0 0%Extraordinary Growth Facilities 0 0 0% 0 0%Special Reserve 0 0 0%KPERS Spec. Ret. Contribution 0 0 0% 0 0%Contingency Reserve 0 0 0%Text Book & Student Material 0 0 0%Activity Fund 0 0 0%Bond and Interest #1 0 0 0% 0 0%Bond and Interest #2 0 0 0% 0 0%No-Fund Warrant 0 0 0% 0 0%Special Assessment 0 0 0% 0 0%Temporary Note 0 0 0% 0 0%
SUBTOTAL 0 0 0% 0 0%Enrollment (FTE)* 4,271.8 4,379.7 3% 4,393.2 0%Amount per Pupil 0 0 0% 0 0%
Adult Education 0 0 0% 0 0%Adult Supplemental Education 0 0 0% 0 0%Tuition Reimbursement 0 0 0% 0 0%Special Education Coop 0 0 0% 0 0%TOTAL 0 0 0% 0 0%
NOTE: Gifts/Grants includes private grants and grants from nonfederal sources.
Amount per pupil excludes the following funds: Adult Education, Adult Supplemental Education, Special Education Coopand Tuition Reimbursement.
* Enrollment (FTE) includes the current year enrollment on September 20, February 20, 4 yr old at-risk, and virtual. It does not include non-funded preschool or full-day kindergarten not on an IEP.
0
0
0
0
0
1
1
1
1
1
1
2014-2015 2015-2016 2016-2017
0 0 0
Community Services Operations (3300)
9/19/2016 11:01 AM Sumexpen.xlsx Page 16 of 31
USD# 253
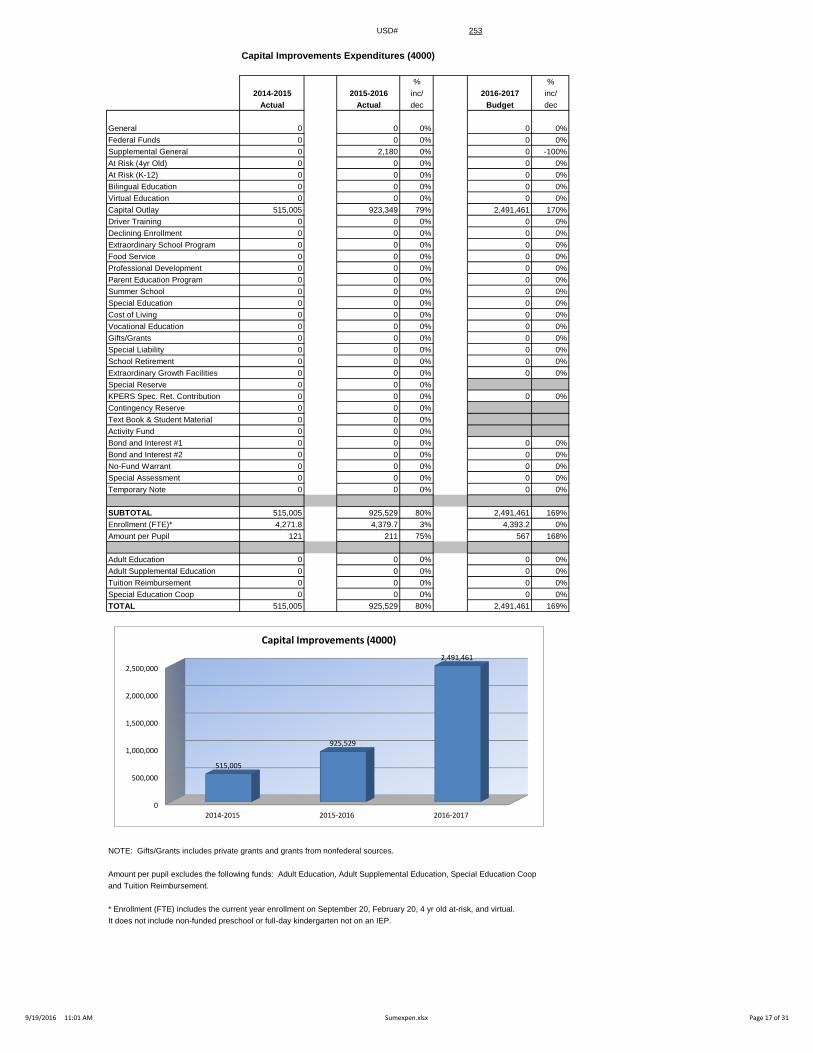
Capital Improvements Expenditures (4000)
% %2014-2015 2015-2016 inc/ 2016-2017 inc/
Actual Actual dec Budget dec
General 0 0 0% 0 0%Federal Funds 0 0 0% 0 0%Supplemental General 0 2,180 0% 0 -100%At Risk (4yr Old) 0 0 0% 0 0%At Risk (K-12) 0 0 0% 0 0%Bilingual Education 0 0 0% 0 0%Virtual Education 0 0 0% 0 0%Capital Outlay 515,005 923,349 79% 2,491,461 170%Driver Training 0 0 0% 0 0%Declining Enrollment 0 0 0% 0 0%Extraordinary School Program 0 0 0% 0 0%Food Service 0 0 0% 0 0%Professional Development 0 0 0% 0 0%Parent Education Program 0 0 0% 0 0%Summer School 0 0 0% 0 0%Special Education 0 0 0% 0 0%Cost of Living 0 0 0% 0 0%Vocational Education 0 0 0% 0 0%Gifts/Grants 0 0 0% 0 0%Special Liability 0 0 0% 0 0%School Retirement 0 0 0% 0 0%Extraordinary Growth Facilities 0 0 0% 0 0%Special Reserve 0 0 0%KPERS Spec. Ret. Contribution 0 0 0% 0 0%Contingency Reserve 0 0 0%Text Book & Student Material 0 0 0%Activity Fund 0 0 0%Bond and Interest #1 0 0 0% 0 0%Bond and Interest #2 0 0 0% 0 0%No-Fund Warrant 0 0 0% 0 0%Special Assessment 0 0 0% 0 0%Temporary Note 0 0 0% 0 0%
SUBTOTAL 515,005 925,529 80% 2,491,461 169%Enrollment (FTE)* 4,271.8 4,379.7 3% 4,393.2 0%Amount per Pupil 121 211 75% 567 168%
Adult Education 0 0 0% 0 0%Adult Supplemental Education 0 0 0% 0 0%Tuition Reimbursement 0 0 0% 0 0%Special Education Coop 0 0 0% 0 0%TOTAL 515,005 925,529 80% 2,491,461 169%
NOTE: Gifts/Grants includes private grants and grants from nonfederal sources.
Amount per pupil excludes the following funds: Adult Education, Adult Supplemental Education, Special Education Coopand Tuition Reimbursement.
* Enrollment (FTE) includes the current year enrollment on September 20, February 20, 4 yr old at-risk, and virtual. It does not include non-funded preschool or full-day kindergarten not on an IEP.
0
500,000
1,000,000
1,500,000
2,000,000
2,500,000
2014-2015 2015-2016 2016-2017
515,005
925,529
2,491,461
Capital Improvements (4000)
9/19/2016 11:01 AM Sumexpen.xlsx Page 17 of 31
USD# 253
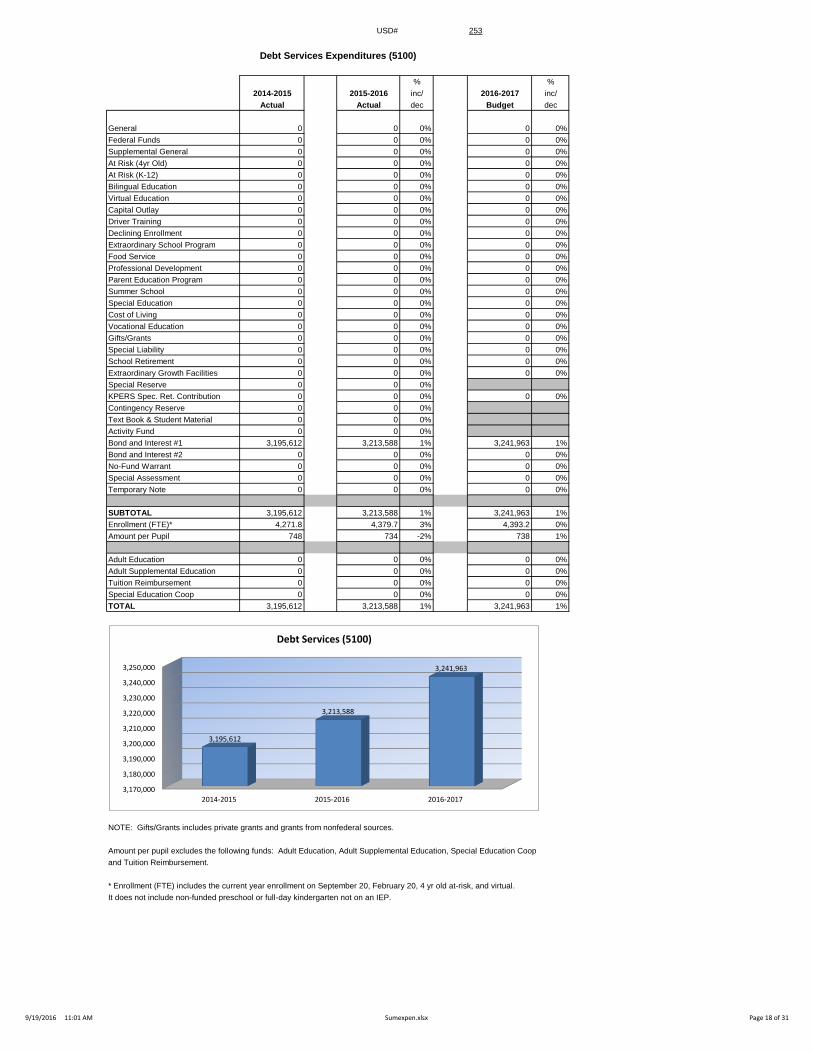
Debt Services Expenditures (5100)
% %2014-2015 2015-2016 inc/ 2016-2017 inc/
Actual Actual dec Budget dec
General 0 0 0% 0 0%Federal Funds 0 0 0% 0 0%Supplemental General 0 0 0% 0 0%At Risk (4yr Old) 0 0 0% 0 0%At Risk (K-12) 0 0 0% 0 0%Bilingual Education 0 0 0% 0 0%Virtual Education 0 0 0% 0 0%Capital Outlay 0 0 0% 0 0%Driver Training 0 0 0% 0 0%Declining Enrollment 0 0 0% 0 0%Extraordinary School Program 0 0 0% 0 0%Food Service 0 0 0% 0 0%Professional Development 0 0 0% 0 0%Parent Education Program 0 0 0% 0 0%Summer School 0 0 0% 0 0%Special Education 0 0 0% 0 0%Cost of Living 0 0 0% 0 0%Vocational Education 0 0 0% 0 0%Gifts/Grants 0 0 0% 0 0%Special Liability 0 0 0% 0 0%School Retirement 0 0 0% 0 0%Extraordinary Growth Facilities 0 0 0% 0 0%Special Reserve 0 0 0%KPERS Spec. Ret. Contribution 0 0 0% 0 0%Contingency Reserve 0 0 0%Text Book & Student Material 0 0 0%Activity Fund 0 0 0%Bond and Interest #1 3,195,612 3,213,588 1% 3,241,963 1%Bond and Interest #2 0 0 0% 0 0%No-Fund Warrant 0 0 0% 0 0%Special Assessment 0 0 0% 0 0%Temporary Note 0 0 0% 0 0%
SUBTOTAL 3,195,612 3,213,588 1% 3,241,963 1%Enrollment (FTE)* 4,271.8 4,379.7 3% 4,393.2 0%Amount per Pupil 748 734 -2% 738 1%
Adult Education 0 0 0% 0 0%Adult Supplemental Education 0 0 0% 0 0%Tuition Reimbursement 0 0 0% 0 0%Special Education Coop 0 0 0% 0 0%TOTAL 3,195,612 3,213,588 1% 3,241,963 1%
NOTE: Gifts/Grants includes private grants and grants from nonfederal sources.
Amount per pupil excludes the following funds: Adult Education, Adult Supplemental Education, Special Education Coopand Tuition Reimbursement.
* Enrollment (FTE) includes the current year enrollment on September 20, February 20, 4 yr old at-risk, and virtual. It does not include non-funded preschool or full-day kindergarten not on an IEP.
3,170,000
3,180,000
3,190,000
3,200,000
3,210,000
3,220,000
3,230,000
3,240,000
3,250,000
2014-2015 2015-2016 2016-2017
3,195,612
3,213,588
3,241,963
Debt Services (5100)
9/19/2016 11:01 AM Sumexpen.xlsx Page 18 of 31
USD# 253
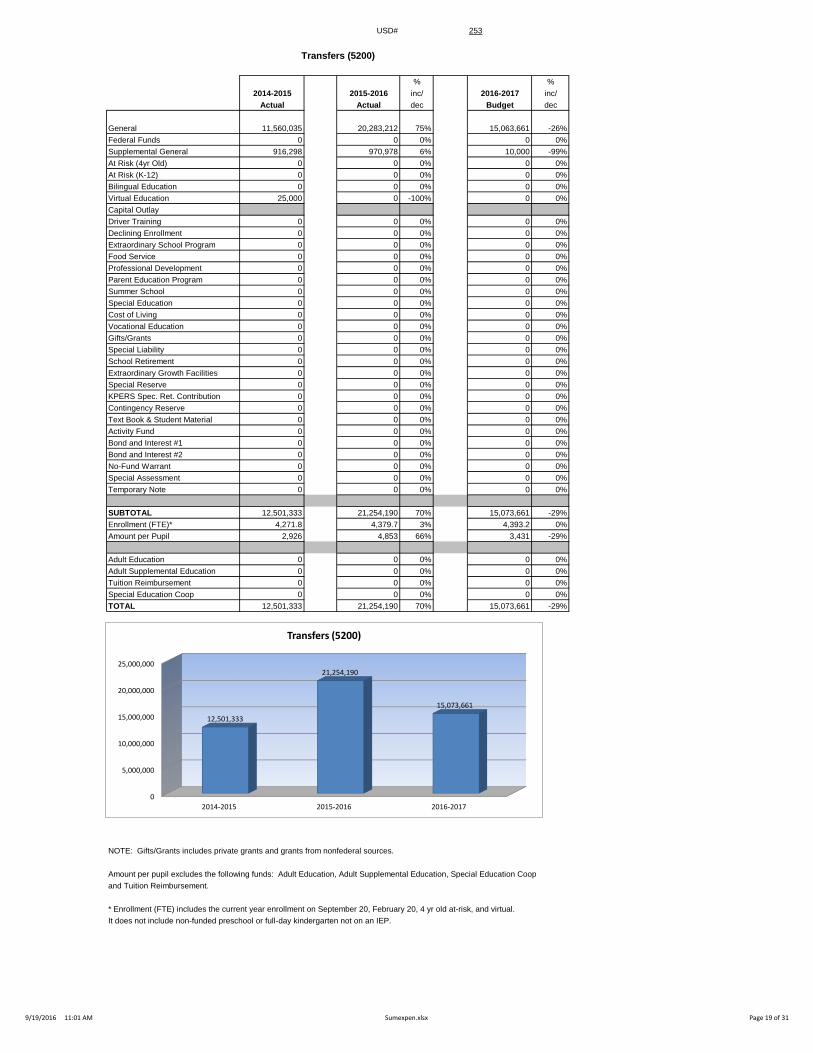
Transfers (5200)
% %2014-2015 2015-2016 inc/ 2016-2017 inc/
Actual Actual dec Budget dec
General 11,560,035 20,283,212 75% 15,063,661 -26%Federal Funds 0 0 0% 0 0%Supplemental General 916,298 970,978 6% 10,000 -99%At Risk (4yr Old) 0 0 0% 0 0%At Risk (K-12) 0 0 0% 0 0%Bilingual Education 0 0 0% 0 0%Virtual Education 25,000 0 -100% 0 0%Capital OutlayDriver Training 0 0 0% 0 0%Declining Enrollment 0 0 0% 0 0%Extraordinary School Program 0 0 0% 0 0%Food Service 0 0 0% 0 0%Professional Development 0 0 0% 0 0%Parent Education Program 0 0 0% 0 0%Summer School 0 0 0% 0 0%Special Education 0 0 0% 0 0%Cost of Living 0 0 0% 0 0%Vocational Education 0 0 0% 0 0%Gifts/Grants 0 0 0% 0 0%Special Liability 0 0 0% 0 0%School Retirement 0 0 0% 0 0%Extraordinary Growth Facilities 0 0 0% 0 0%Special Reserve 0 0 0% 0 0%KPERS Spec. Ret. Contribution 0 0 0% 0 0%Contingency Reserve 0 0 0% 0 0%Text Book & Student Material 0 0 0% 0 0%Activity Fund 0 0 0% 0 0%Bond and Interest #1 0 0 0% 0 0%Bond and Interest #2 0 0 0% 0 0%No-Fund Warrant 0 0 0% 0 0%Special Assessment 0 0 0% 0 0%Temporary Note 0 0 0% 0 0%
SUBTOTAL 12,501,333 21,254,190 70% 15,073,661 -29%Enrollment (FTE)* 4,271.8 4,379.7 3% 4,393.2 0%Amount per Pupil 2,926 4,853 66% 3,431 -29%
Adult Education 0 0 0% 0 0%Adult Supplemental Education 0 0 0% 0 0%Tuition Reimbursement 0 0 0% 0 0%Special Education Coop 0 0 0% 0 0%TOTAL 12,501,333 21,254,190 70% 15,073,661 -29%
NOTE: Gifts/Grants includes private grants and grants from nonfederal sources.
Amount per pupil excludes the following funds: Adult Education, Adult Supplemental Education, Special Education Coopand Tuition Reimbursement.
* Enrollment (FTE) includes the current year enrollment on September 20, February 20, 4 yr old at-risk, and virtual. It does not include non-funded preschool or full-day kindergarten not on an IEP.
0
5,000,000
10,000,000
15,000,000
20,000,000
25,000,000
2014-2015 2015-2016 2016-2017
12,501,333
21,254,190
15,073,661
Transfers (5200)
9/19/2016 11:01 AM Sumexpen.xlsx Page 19 of 31
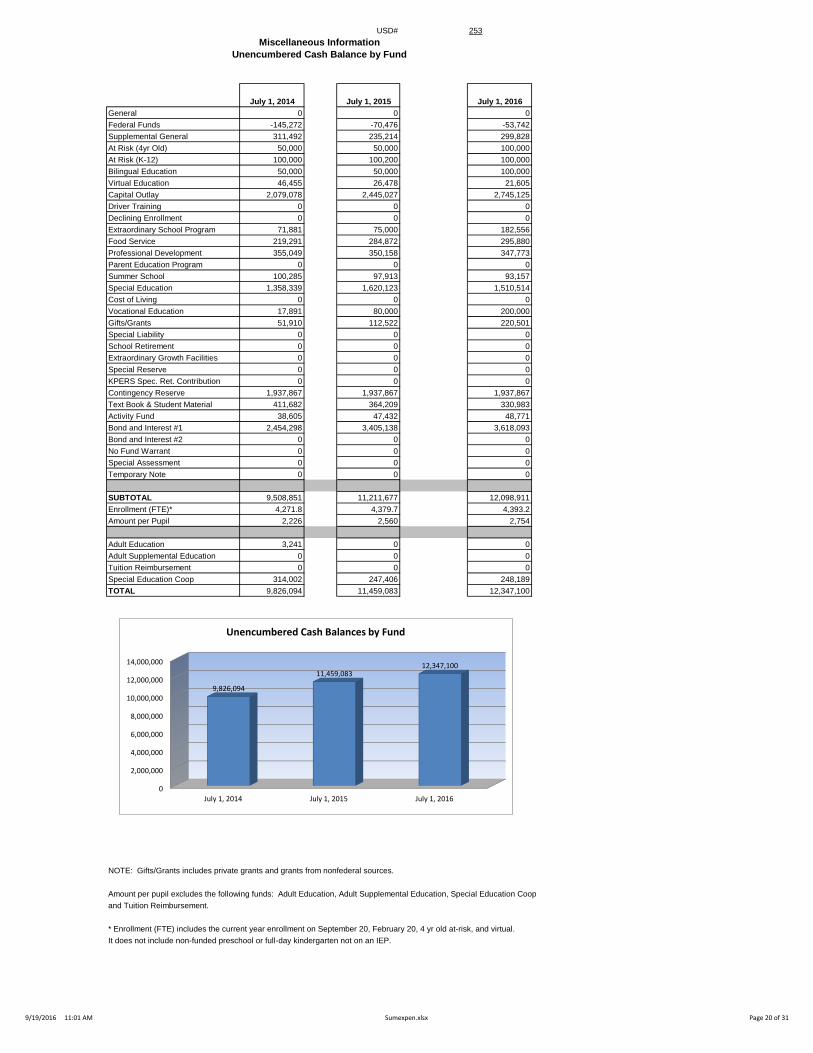
USD# 253Miscellaneous Information
Unencumbered Cash Balance by Fund
July 1, 2014 July 1, 2015 July 1, 2016General 0 0 0Federal Funds -145,272 -70,476 -53,742Supplemental General 311,492 235,214 299,828At Risk (4yr Old) 50,000 50,000 100,000At Risk (K-12) 100,000 100,200 100,000Bilingual Education 50,000 50,000 100,000Virtual Education 46,455 26,478 21,605Capital Outlay 2,079,078 2,445,027 2,745,125Driver Training 0 0 0Declining Enrollment 0 0 0Extraordinary School Program 71,881 75,000 182,556Food Service 219,291 284,872 295,880Professional Development 355,049 350,158 347,773Parent Education Program 0 0 0Summer School 100,285 97,913 93,157Special Education 1,358,339 1,620,123 1,510,514Cost of Living 0 0 0Vocational Education 17,891 80,000 200,000Gifts/Grants 51,910 112,522 220,501Special Liability 0 0 0School Retirement 0 0 0Extraordinary Growth Facilities 0 0 0Special Reserve 0 0 0KPERS Spec. Ret. Contribution 0 0 0Contingency Reserve 1,937,867 1,937,867 1,937,867Text Book & Student Material 411,682 364,209 330,983Activity Fund 38,605 47,432 48,771Bond and Interest #1 2,454,298 3,405,138 3,618,093Bond and Interest #2 0 0 0No Fund Warrant 0 0 0Special Assessment 0 0 0Temporary Note 0 0 0
SUBTOTAL 9,508,851 11,211,677 12,098,911Enrollment (FTE)* 4,271.8 4,379.7 4,393.2Amount per Pupil 2,226 2,560 2,754
Adult Education 3,241 0 0Adult Supplemental Education 0 0 0Tuition Reimbursement 0 0 0Special Education Coop 314,002 247,406 248,189TOTAL 9,826,094 11,459,083 12,347,100
NOTE: Gifts/Grants includes private grants and grants from nonfederal sources.
Amount per pupil excludes the following funds: Adult Education, Adult Supplemental Education, Special Education Coopand Tuition Reimbursement.
* Enrollment (FTE) includes the current year enrollment on September 20, February 20, 4 yr old at-risk, and virtual. It does not include non-funded preschool or full-day kindergarten not on an IEP.
0
2,000,000
4,000,000
6,000,000
8,000,000
10,000,000
12,000,000
14,000,000
July 1, 2014 July 1, 2015 July 1, 2016
9,826,094
11,459,08312,347,100
Unencumbered Cash Balances by Fund
9/19/2016 11:01 AM Sumexpen.xlsx Page 20 of 31
USD# 253
Reserve FundsUnencumbered Cash Balance
July 1, 2014 July 1, 2015 July 1, 2016Special Reserve 0 0 0TOTAL OTHER 0 0 0Amount per Pupil $0 $0 $0
*School districts are authorized by law to self insure rather than purchase insurance for the following categories: Worker's Comp,Health Insurance, Life Insurance, Property and Casualty (Risk Management) and Disability Income Insurance. Monies are placedin the Self Insured Fund to pay for claims which may arise from the categories listed above.
0
0
0
0
0
1
1
1
1
1
1
July 1, 2014 July 1, 2015 July 1, 2016
0 0 0
Unencumbered Cash Balances by Fund (Reserve Funds Only)
9/19/2016 11:01 AM Sumexpen.xlsx Page 21 of 31
USD# 253
2012-2013 2013-2014 % 2014-2015 % 2015-2016 % 2016-2017 %Actual Actual inc/ Actual inc/ Actual inc/ Budget inc/
dec dec dec dec
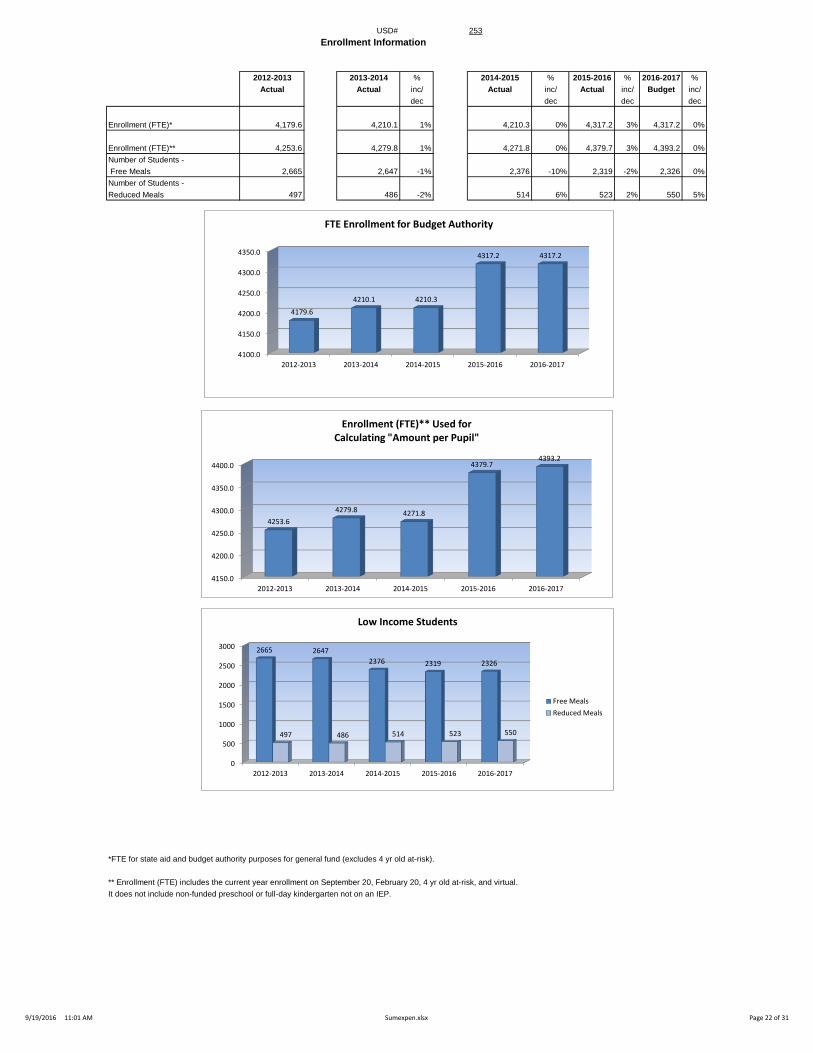
Enrollment (FTE)* 4,179.6 4,210.1 1% 4,210.3 0% 4,317.2 3% 4,317.2 0%
Enrollment (FTE)** 4,253.6 4,279.8 1% 4,271.8 0% 4,379.7 3% 4,393.2 0%Number of Students - Free Meals 2,665 2,647 -1% 2,376 -10% 2,319 -2% 2,326 0%Number of Students - Reduced Meals 497 486 -2% 514 6% 523 2% 550 5%
*FTE for state aid and budget authority purposes for general fund (excludes 4 yr old at-risk).
** Enrollment (FTE) includes the current year enrollment on September 20, February 20, 4 yr old at-risk, and virtual. It does not include non-funded preschool or full-day kindergarten not on an IEP.
Enrollment Information
4150.0
4200.0
4250.0
4300.0
4350.0
4400.0
2012-2013 2013-2014 2014-2015 2015-2016 2016-2017
4253.6
4279.8 4271.8
4379.74393.2
Enrollment (FTE)** Used for Calculating "Amount per Pupil"
0
500
1000
1500
2000
2500
3000
2012-2013 2013-2014 2014-2015 2015-2016 2016-2017
2665 2647
2376 2319 2326
497 486 514 523 550
Low Income Students
Free Meals
Reduced Meals
4100.0
4150.0
4200.0
4250.0
4300.0
4350.0
2012-2013 2013-2014 2014-2015 2015-2016 2016-2017
4179.6
4210.1 4210.3
4317.2 4317.2
FTE Enrollment for Budget Authority
9/19/2016 11:01 AM Sumexpen.xlsx Page 22 of 31
USD# 253
Miscellaneous InformationMill Rates by Fund
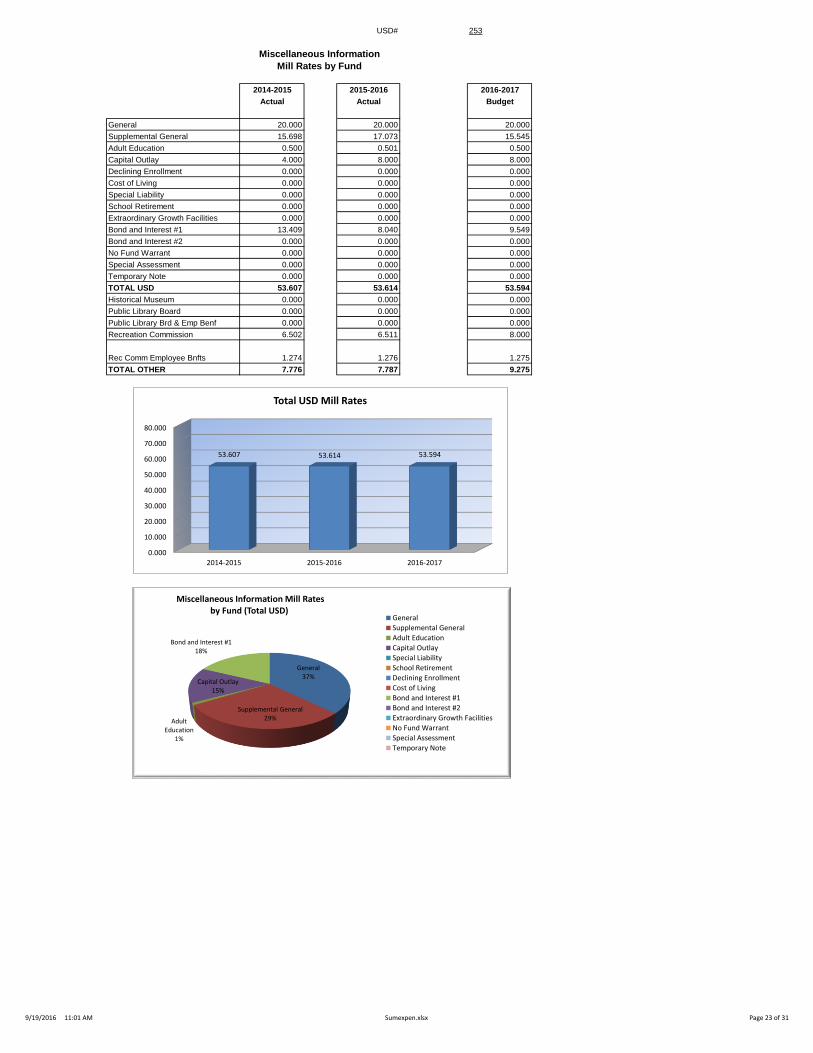
2014-2015 2015-2016 2016-2017Actual Actual Budget
General 20.000 20.000 20.000Supplemental General 15.698 17.073 15.545Adult Education 0.500 0.501 0.500Capital Outlay 4.000 8.000 8.000Declining Enrollment 0.000 0.000 0.000Cost of Living 0.000 0.000 0.000Special Liability 0.000 0.000 0.000School Retirement 0.000 0.000 0.000Extraordinary Growth Facilities 0.000 0.000 0.000Bond and Interest #1 13.409 8.040 9.549Bond and Interest #2 0.000 0.000 0.000No Fund Warrant 0.000 0.000 0.000Special Assessment 0.000 0.000 0.000Temporary Note 0.000 0.000 0.000TOTAL USD 53.607 53.614 53.594Historical Museum 0.000 0.000 0.000Public Library Board 0.000 0.000 0.000Public Library Brd & Emp Benf 0.000 0.000 0.000Recreation Commission 6.502 6.511 8.000
Rec Comm Employee Bnfts 1.274 1.276 1.275TOTAL OTHER 7.776 7.787 9.275
0.000
10.000
20.000
30.000
40.000
50.000
60.000
70.000
80.000
2014-2015 2015-2016 2016-2017
53.607 53.614 53.594
Total USD Mill Rates
General37%
Supplemental General29%Adult
Education1%
Capital Outlay15%
Bond and Interest #118%
Miscellaneous Information Mill Rates by Fund (Total USD)
General
Supplemental General
Adult Education
Capital Outlay
Special Liability
School Retirement
Declining Enrollment
Cost of Living
Bond and Interest #1
Bond and Interest #2
Extraordinary Growth Facilities
No Fund Warrant
Special Assessment
Temporary Note
9/19/2016 11:01 AM Sumexpen.xlsx Page 23 of 31
USD# 253Other Information
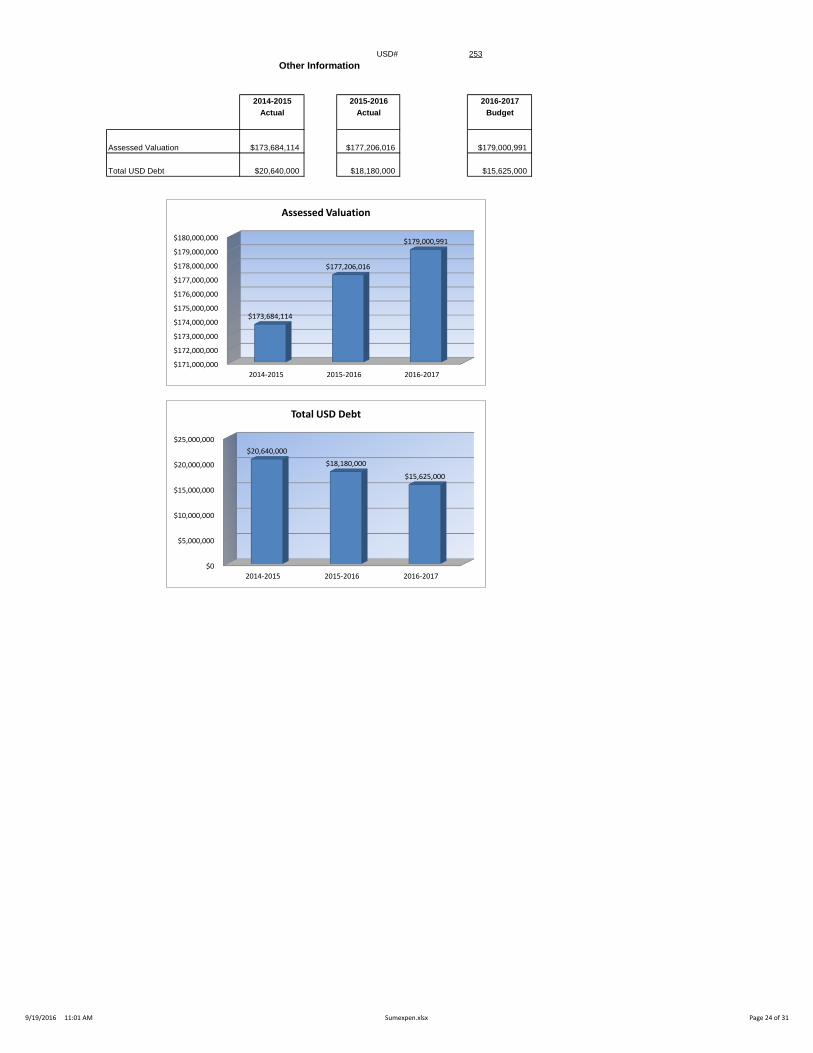
2014-2015 2015-2016 2016-2017Actual Actual Budget
Assessed Valuation $173,684,114 $177,206,016 $179,000,991
Total USD Debt $20,640,000 $18,180,000 $15,625,000
$171,000,000
$172,000,000
$173,000,000
$174,000,000
$175,000,000
$176,000,000
$177,000,000
$178,000,000
$179,000,000
$180,000,000
2014-2015 2015-2016 2016-2017
$173,684,114
$177,206,016
$179,000,991
Assessed Valuation
$0
$5,000,000
$10,000,000
$15,000,000
$20,000,000
$25,000,000
2014-2015 2015-2016 2016-2017
$20,640,000
$18,180,000
$15,625,000
Total USD Debt
9/19/2016 11:01 AM Sumexpen.xlsx Page 24 of 31
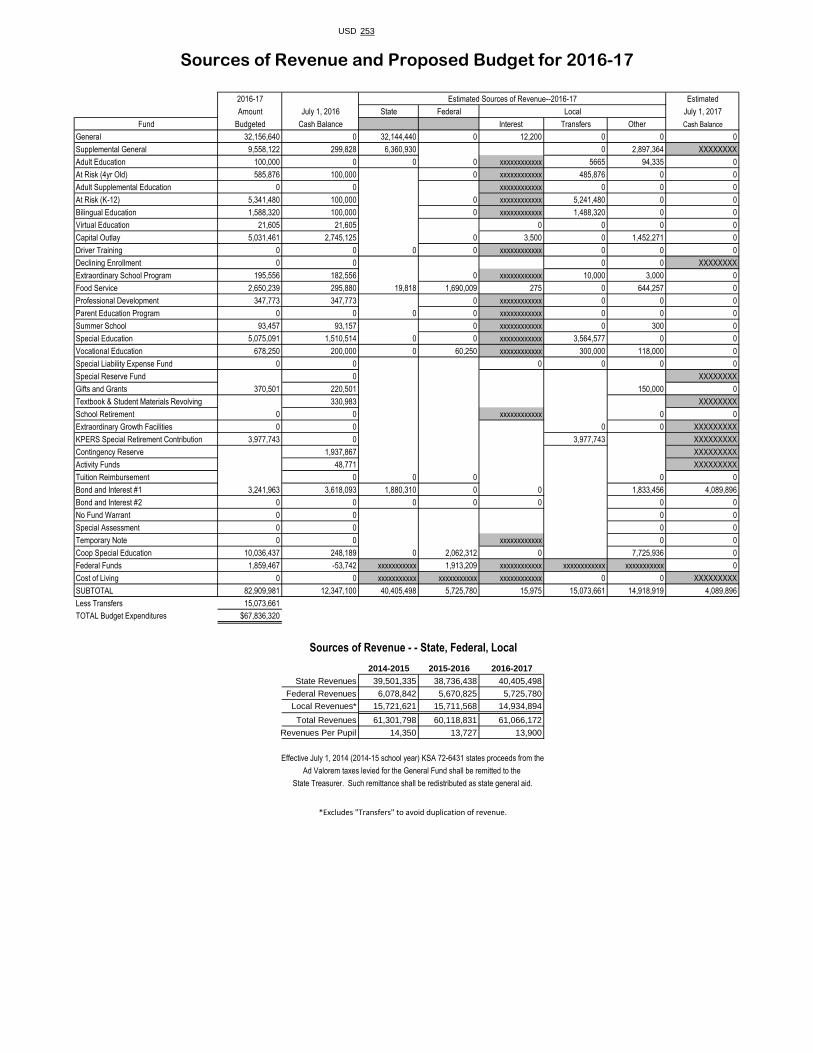
USD 253
2016-17 Estimated Sources of Revenue--2016-17 Estimated
Amount July 1, 2016 State Federal Local July 1, 2017
Fund Budgeted Cash Balance Interest Transfers Other Cash Balance
General 32,156,640 0 32,144,440 0 12,200 0 0 0
Supplemental General 9,558,122 299,828 6,360,930 0 2,897,364 XXXXXXXX
Adult Education 100,000 0 0 0 xxxxxxxxxxxx 5665 94,335 0
At Risk (4yr Old) 585,876 100,000 0 xxxxxxxxxxxx 485,876 0 0
Adult Supplemental Education 0 0 xxxxxxxxxxxx 0 0 0
At Risk (K-12) 5,341,480 100,000 0 xxxxxxxxxxxx 5,241,480 0 0
Bilingual Education 1,588,320 100,000 0 xxxxxxxxxxxx 1,488,320 0 0
Virtual Education 21,605 21,605 0 0 0 0
Capital Outlay 5,031,461 2,745,125 0 3,500 0 1,452,271 0
Driver Training 0 0 0 0 xxxxxxxxxxxx 0 0 0
Declining Enrollment 0 0 0 0 XXXXXXXX
Extraordinary School Program 195,556 182,556 0 xxxxxxxxxxxx 10,000 3,000 0
Food Service 2,650,239 295,880 19,818 1,690,009 275 0 644,257 0
Professional Development 347,773 347,773 0 xxxxxxxxxxxx 0 0 0
Parent Education Program 0 0 0 0 xxxxxxxxxxxx 0 0 0
Summer School 93,457 93,157 0 xxxxxxxxxxxx 0 300 0
Special Education 5,075,091 1,510,514 0 0 xxxxxxxxxxxx 3,564,577 0 0
Vocational Education 678,250 200,000 0 60,250 xxxxxxxxxxxx 300,000 118,000 0
Special Liability Expense Fund 0 0 0 0 0 0
Special Reserve Fund 0 XXXXXXXX
Gifts and Grants 370,501 220,501 150,000 0
Textbook & Student Materials Revolving 330,983 XXXXXXXX
School Retirement 0 0 xxxxxxxxxxxx 0 0
Extraordinary Growth Facilities 0 0 0 0 XXXXXXXXX
KPERS Special Retirement Contribution 3,977,743 0 3,977,743 XXXXXXXXX
Contingency Reserve 1,937,867 XXXXXXXXX
Activity Funds 48,771 XXXXXXXXX
Tuition Reimbursement 0 0 0 0 0
Bond and Interest #1 3,241,963 3,618,093 1,880,310 0 0 1,833,456 4,089,896
Bond and Interest #2 0 0 0 0 0 0 0
No Fund Warrant 0 0 0 0
Special Assessment 0 0 0 0
Temporary Note 0 0 xxxxxxxxxxxx 0 0
Coop Special Education 10,036,437 248,189 0 2,062,312 0 7,725,936 0
Federal Funds 1,859,467 -53,742 xxxxxxxxxxx 1,913,209 xxxxxxxxxxxx xxxxxxxxxxxx xxxxxxxxxxx 0
Cost of Living 0 0 xxxxxxxxxxx xxxxxxxxxxx xxxxxxxxxxxx 0 0 XXXXXXXXX
SUBTOTAL 82,909,981 12,347,100 40,405,498 5,725,780 15,975 15,073,661 14,918,919 4,089,896
Less Transfers 15,073,661
TOTAL Budget Expenditures $67,836,320
2014-2015 2015-2016 2016-2017State Revenues 39,501,335 38,736,438 40,405,498
Federal Revenues 6,078,842 5,670,825 5,725,780Local Revenues* 15,721,621 15,711,568 14,934,894Total Revenues 61,301,798 60,118,831 61,066,172
Revenues Per Pupil 14,350 13,727 13,900
*Excludes "Transfers" to avoid duplication of revenue.
Sources of Revenue and Proposed Budget for 2016-17
Sources of Revenue - - State, Federal, Local
Effective July 1, 2014 (2014-15 school year) KSA 72-6431 states proceeds from the
Ad Valorem taxes levied for the General Fund shall be remitted to the
State Treasurer. Such remittance shall be redistributed as state general aid.
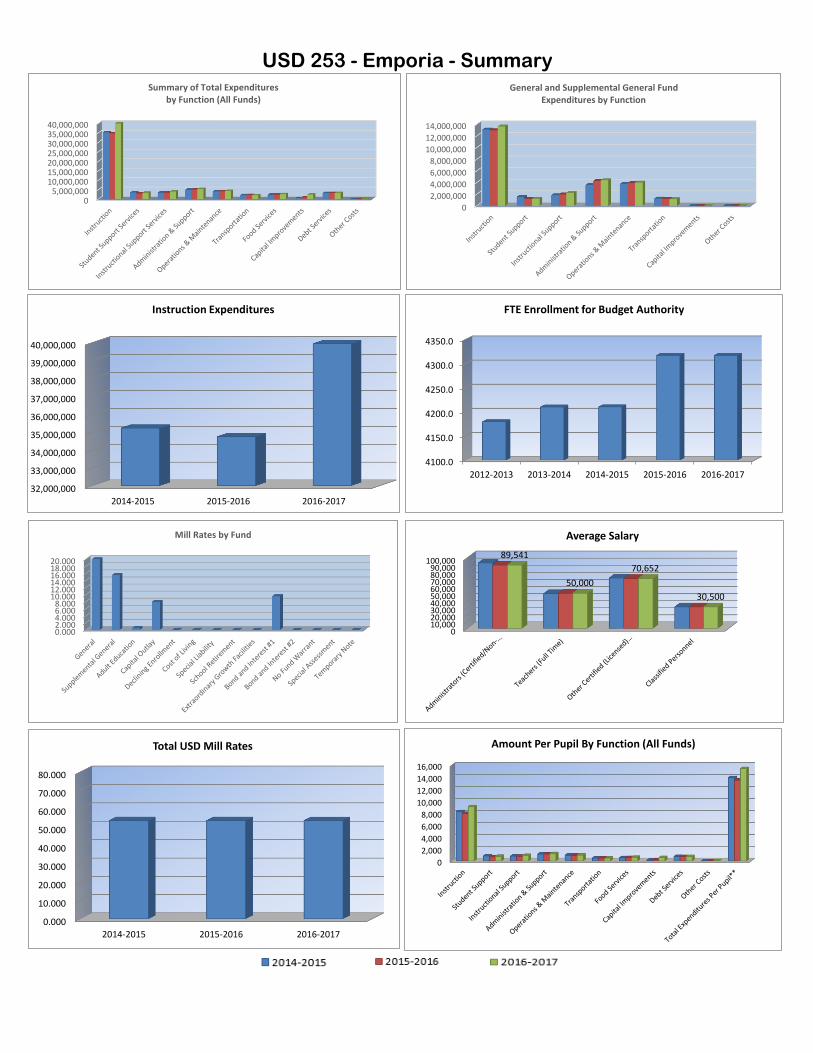
USD 253 - Emporia - Summary
32,000,000
33,000,000
34,000,000
35,000,000
36,000,000
37,000,000
38,000,000
39,000,000
40,000,000
2014-2015 2015-2016 2016-2017
Instruction Expenditures
4100.0
4150.0
4200.0
4250.0
4300.0
4350.0
2012-2013 2013-2014 2014-2015 2015-2016 2016-2017
FTE Enrollment for Budget Authority
0.000
10.000
20.000
30.000
40.000
50.000
60.000
70.000
80.000
2014-2015 2015-2016 2016-2017
Total USD Mill Rates
0
2,000
4,000
6,000
8,000
10,000
12,000
14,000
16,000
Amount Per Pupil By Function (All Funds)
010,00020,00030,00040,00050,00060,00070,00080,00090,000
100,00089,541
50,000
70,652
30,500
Average Salary
05,000,000
10,000,00015,000,00020,000,00025,000,00030,000,00035,000,00040,000,000
Summary of Total Expendituresby Function (All Funds)
0
2,000,000
4,000,000
6,000,000
8,000,000
10,000,000
12,000,000
14,000,000
General and Supplemental General FundExpenditures by Function
0.0002.0004.0006.0008.000
10.00012.00014.00016.00018.00020.000
Mill Rates by Fund

Intentionally left blank

Intentionally left blank

Intentionally left blank

Intentionally left blank

Intentionally left blank