Embed Size (px)
Citation preview
Avalere Health T | 202.207.1300 avalere.com
An Inovalon Company F | 202.467.4455
1350 Connecticut Ave, NW
Washington, DC 20036
Profile of the Medicaid Expansion
Population: Demographics,
Enrollment, and Utilization
Avalere Health – An Inovalon Company | January 2018
Profile of the Medicaid Expansion Population | 2
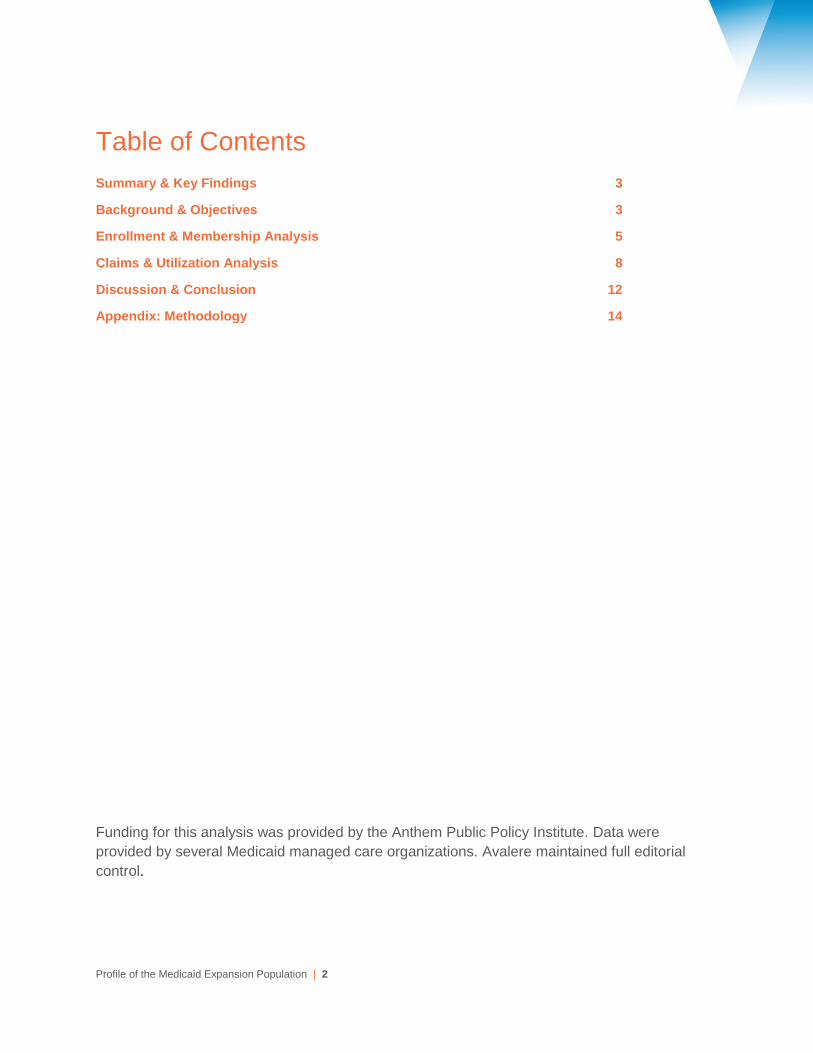
Table of Contents
Summary & Key Findings 3
Background & Objectives 3
Enrollment & Membership Analysis 5
Claims & Utilization Analysis 8
Discussion & Conclusion 12
Appendix: Methodology 14
Funding for this analysis was provided by the Anthem Public Policy Institute. Data were
provided by several Medicaid managed care organizations. Avalere maintained full editorial
control.
Profile of the Medicaid Expansion Population | 3
Summary & Key Findings
States and Medicaid managed care plans have gained valuable experience with the Medicaid
expansion population since many states expanded eligibility under the Affordable Care Act in
2014. While over 11 million individuals have gained coverage since the expansion,1 relatively
little has been shared publicly about the enrollment and utilization experience of expansion
enrollees (i.e. low-income, childless adults). Avalere analyzed membership and claims data
from three Medicaid managed care organizations (MCOs) serving members in plans across
multiple states that expanded eligibility for Medicaid in January 2014. This analysis was
conducted to understand how enrollment, utilization, and cost patterns for newly eligible
enrollees have changed over time and whether spending patterns differed for earlier versus
later expansion enrollees. The data submitted by the three MCOs spanned nine different state
and plan combinations, providing an extensive view of experience with the expansion
population.
Avalere found that:
• Across plans and states, the expansion population experienced high disenrollment
rates, indicating that, as in other Medicaid eligibility groups, there is substantial churn in
this population.
• Even after adjusting for age and gender, claims costs increased steadily over
time, suggesting that expansion enrollees have complex and/or chronic conditions.
o For some enrollment cohorts, average claims costs decreased modestly in the
second half of the first year of enrollment, suggesting some initial pent-up
demand for services, though claims costs increased steadily from that point
forward.
• Across enrollment groups, per member per month spending on prescription drugs
increased with enrollment duration.
o Among enrollees who remained enrolled the longest, inpatient claims initially
made up the largest share of claims costs, but were surpassed by
prescription drug claims by month 8 of enrollment, on average.
Background & Objectives
Prior to the enactment of the Affordable Care Act (ACA), states provided Medicaid coverage for
specified groups of low-income individuals including children, pregnant women, parents,
disabled adults, and adults over the age of 65. While a small number of states extended
Medicaid eligibility to childless adults before 2014, the ACA provided all states the option to
expand eligibility to childless adults aged 19-64 with incomes under 138% of the federal poverty
1 Centers for Medicare & Medicaid Services. July 2017. Quarterly Medicaid Enrollment and Expenditure Report (July-September 2016). Available
here: https://www.medicaid.gov/medicaid/program-information/medicaid-and-chip-enrollment-data/enrollment-mbes/index.html
Profile of the Medicaid Expansion Population | 4
level (FPL) beginning in January 2014. To date, 31 states and the District of Columbia have
chosen to expand Medicaid. Since 2013, enrollment in states that expanded Medicaid eligibility
has increased by nearly 40%.2 While some new Medicaid enrollees were previously eligible for
Medicaid coverage, many enrollees were previously uninsured. Numerous studies have
established the relationship between Medicaid expansion and lower uninsured rates,3 and a
2016 analysis estimated that nearly 5 million previously uninsured individuals enrolled in
Medicaid coverage during the first post-ACA enactment open enrollment period (October 2013 –
March 2014).4
Because the expansion population was new to Medicaid and likely to have been uninsured prior
to gaining Medicaid eligibility, states and Medicaid MCOs initially had relatively little information
on which to base utilization and risk assumptions. The Centers for Medicare & Medicaid
Services (CMS) forecasted that newly eligible expansion adults who enrolled in the initial years
of Medicaid expansion would have high levels of health care utilization due to pent up demand,
with per capita costs about equal to those of traditionally eligible adults in 2014. However, CMS
also anticipated that the newly eligible expansion enrollees would use fewer services over time,
expecting their costs to be about 80% of the per-enrollee costs of traditionally eligible adults in
2015.5 While costs did not drop as quickly as anticipated, CMS now expects per enrollee costs
for the newly eligible enrollee to fall below those of traditionally eligible adults around 2018,
however CMS still notes that data upon which they make such assessments is limited.6
MCOs have found differing results when comparing claims experience for newly eligible
expansion and traditionally eligible Medicaid adults across states. For example, in a 2017
analysis, claims costs for the expansion population exceeded those for traditionally eligible
adults and increased over time, suggesting that initial CMS projections have not matched plan
experience.7 While studies such as this have been conducted to better understand the effect of
Medicaid expansion on utilization and pent-up demand, they are typically focused on a single
state or single MCO's experience and/or they do not include multiple years of claims data.8
Yet, more robust analysis of the utilization patterns of the expansion population would support
policy development at the federal and state levels, and is particularly critical to the rate-setting
process. Since 2014, states and MCOs have gained meaningful experience with the Medicaid
2 Medicaid and CHIP Payment and Access Commission. Available at: https://www.macpac.gov/subtopic/medicaid-enrollment-changes-following-the-
aca/.
3 The Henry J. Kaiser Family Foundation. “The Effects of Medicaid Expansion under the ACA: Updated Findings from a Literature Review.” Available
here: https://www.kff.org/medicaid/issue-brief/the-effects-of-medicaid-expansion-under-the-aca-updated-findings-from-a-literature-review-
september-2017/.
4 The Commonwealth Fund. “How Much of a Factor Is the Affordable Care Act in the Declining Uninsured Rate?” Available here:
http://www.commonwealthfund.org/publications/issue-briefs/2016/dec/aca-declining-uninsured-rate.
5 Centers for Medicare & Medicaid Services. 2013 Actuarial Report on the Financial Outlook for Medicaid. Available here:
https://www.medicaid.gov/medicaid/financing-and-reimbursement/downloads/medicaid-actuarial-report-2013.pdf.
6 Centers for Medicare & Medicaid Services. 2016 Actuarial Report on the Financial Outlook for Medicaid. Available here:
https://www.cms.gov/Research-Statistics-Data-and-Systems/Research/ActuarialStudies/Downloads/MedicaidReport2016.pdf.
7 Marko, Tony. “Expansion Member Study.” Society of Actuaries Health Meeting, June 2017. Hollywood, Florida.
8 Fertig A., et al. March 2017. Pent-Up Health Care Demand Among New Medicaid Enrollees After the ACA. Available here:
http://journals.sagepub.com/eprint/wDsfA74fuA3BIw5ZWyYT/full#_i10
Profile of the Medicaid Expansion Population | 5
expansion population, making such analysis possible. In order to examine enrollment patterns,
demographics, and healthcare needs among Medicaid expansion enrollees, Avalere analyzed
claims and membership data for 2014-2016 from three Medicaid MCOs across nine state-plan
combinations, for states that expanded eligibility in January 2014. A detailed description of the
data sources and analytic approach is included in the Appendix.
Specifically, Avalere analyzed the:
• Enrollment patterns of Medicaid expansion enrollees, including how long newly eligible
enrollees remained covered;
• Differences in enrollment patterns and retention by initial enrollment date (i.e., those who
enrolled in early 2014 versus those who enrolled later), age, and gender;
• Change in normalized per member per month (PMPM) claims by enrollment date; and
• Trends in type of spending over time (e.g., inpatient versus prescription drug).
Enrollment & Membership Analysis
Across Plans, States, and Enrollment Groups, About Half of Enrollees Dropped
Coverage within 18 Months
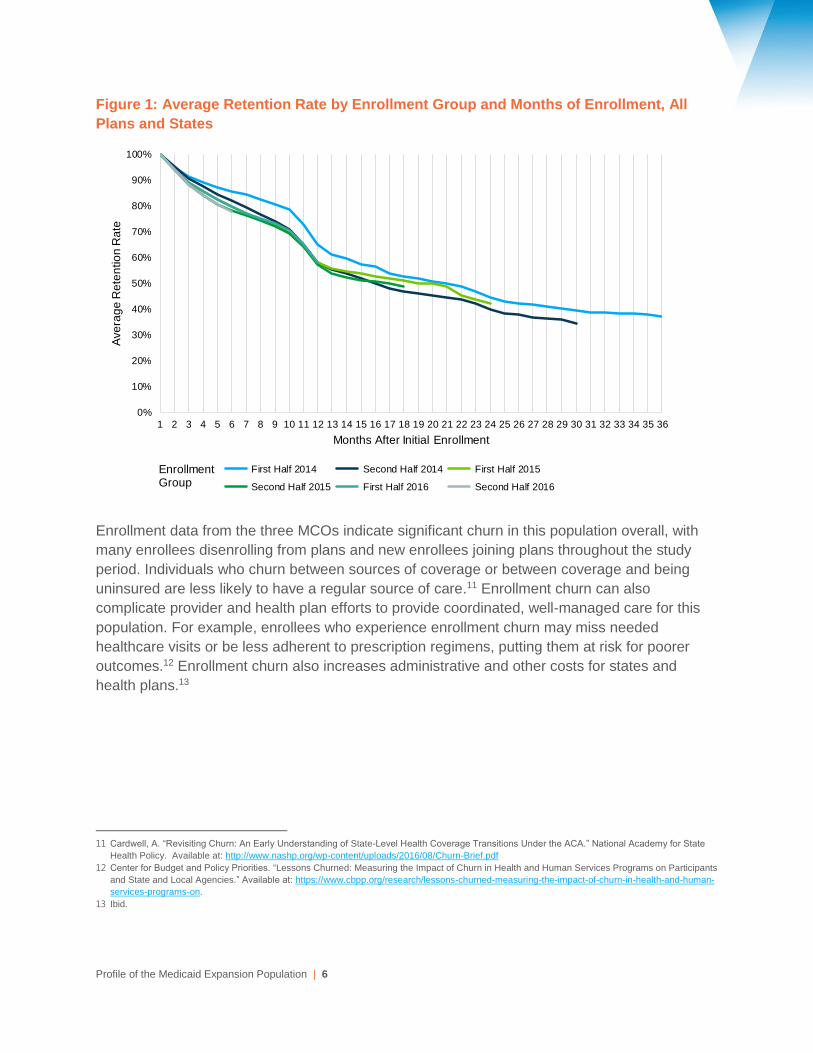
Avalere analyzed enrollee-level retention rates for different enrollment groups based on each
group’s initial date of enrollment. As illustrated below, expansion enrollees were likely to drop
coverage over time (see Figure 1). For example, among enrollees who enrolled in coverage in
2014 and early 2015, only about half of those initially enrolled were still covered after 18
months, irrespective of enrollees’ coverage start date. This finding is consistent with prior
analyses of Medicaid disenrollment, which have noted disenrollment rates of up to 50% after 12
months of coverage in other eligibility groups.9
Many factors could cause an individual to disenroll from a Medicaid managed care plan; for
example, an enrollee could gain access to employer sponsored insurance or an enrollee’s
income could increase, making him or her ineligible for Medicaid and instead eligible for
premium tax credits. Individuals may also disenroll because of failure to meet a state’s
administrative requirements for eligibility redeterminations. Finally, Medicaid enrollees may
choose to change plans—thus dropping out of the study dataset, though not out of Medicaid
coverage entirely—though studies suggest that plan switching is limited.10
9 Swartz, K. et al. Evaluating State Options for Reducing Medicaid Churning. Health Affairs, 2015. Jul; 34(7): 1180-1187.
10 Brandon, William P., et al. Medicaid enrollee switching among managed care plans. J Health Care Poor Underserved. November 2005; 16(4): 760–
779. Available here: https://www.ncbi.nlm.nih.gov/pubmed/16311497
Profile of the Medicaid Expansion Population | 6
Figure 1: Average Retention Rate by Enrollment Group and Months of Enrollment, All
Plans and States
Enrollment data from the three MCOs indicate significant churn in this population overall, with
many enrollees disenrolling from plans and new enrollees joining plans throughout the study
period. Individuals who churn between sources of coverage or between coverage and being
uninsured are less likely to have a regular source of care.11 Enrollment churn can also
complicate provider and health plan efforts to provide coordinated, well-managed care for this
population. For example, enrollees who experience enrollment churn may miss needed
healthcare visits or be less adherent to prescription regimens, putting them at risk for poorer
outcomes.12 Enrollment churn also increases administrative and other costs for states and
health plans.13
11 Cardwell, A. “Revisiting Churn: An Early Understanding of State-Level Health Coverage Transitions Under the ACA.” National Academy for State
Health Policy. Available at: http://www.nashp.org/wp-content/uploads/2016/08/Churn-Brief.pdf
12 Center for Budget and Policy Priorities. “Lessons Churned: Measuring the Impact of Churn in Health and Human Services Programs on Participants
and State and Local Agencies.” Available at: https://www.cbpp.org/research/lessons-churned-measuring-the-impact-of-churn-in-health-and-human-
services-programs-on.
13 Ibid.
Enrollment Group
0%
10%
20%
30%
40%
50%
60%
70%
80%
90%
100%
1 2 3 4 5 6 7 8 9 10 11 12 13 14 15 16 17 18 19 20 21 22 23 24 25 26 27 28 29 30 31 32 33 34 35 36
Ave
rag
e R
ete
ntio
n R
ate
Months After Initial Enrollment
First Half 2014 Second Half 2014 First Half 2015
Second Half 2015 First Half 2016 Second Half 2016
Profile of the Medicaid Expansion Population | 7
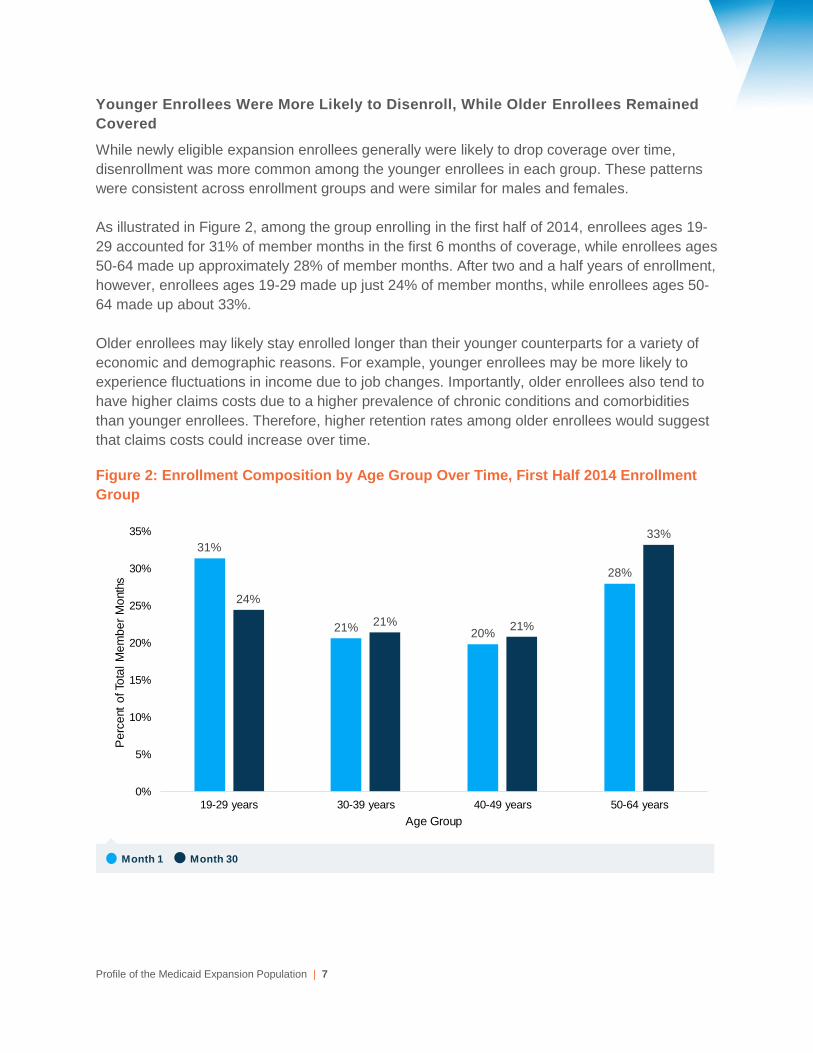
Younger Enrollees Were More Likely to Disenroll, While Older Enrollees Remained
Covered
While newly eligible expansion enrollees generally were likely to drop coverage over time,
disenrollment was more common among the younger enrollees in each group. These patterns
were consistent across enrollment groups and were similar for males and females.
As illustrated in Figure 2, among the group enrolling in the first half of 2014, enrollees ages 19-
29 accounted for 31% of member months in the first 6 months of coverage, while enrollees ages
50-64 made up approximately 28% of member months. After two and a half years of enrollment,
however, enrollees ages 19-29 made up just 24% of member months, while enrollees ages 50-
64 made up about 33%.
Older enrollees may likely stay enrolled longer than their younger counterparts for a variety of
economic and demographic reasons. For example, younger enrollees may be more likely to
experience fluctuations in income due to job changes. Importantly, older enrollees also tend to
have higher claims costs due to a higher prevalence of chronic conditions and comorbidities
than younger enrollees. Therefore, higher retention rates among older enrollees would suggest
that claims costs could increase over time.
Figure 2: Enrollment Composition by Age Group Over Time, First Half 2014 Enrollment
Group
31%
21%20%
28%
24%
21% 21%
33%
0%
5%
10%
15%
20%
25%
30%
35%
19-29 years 30-39 years 40-49 years 50-64 years
Pe
rce
nt
of To
tal
Me
mb
er
Mo
nth
s
Age Group
Month 1 Month 30
Profile of the Medicaid Expansion Population | 8
Claims & Utilization Analysis
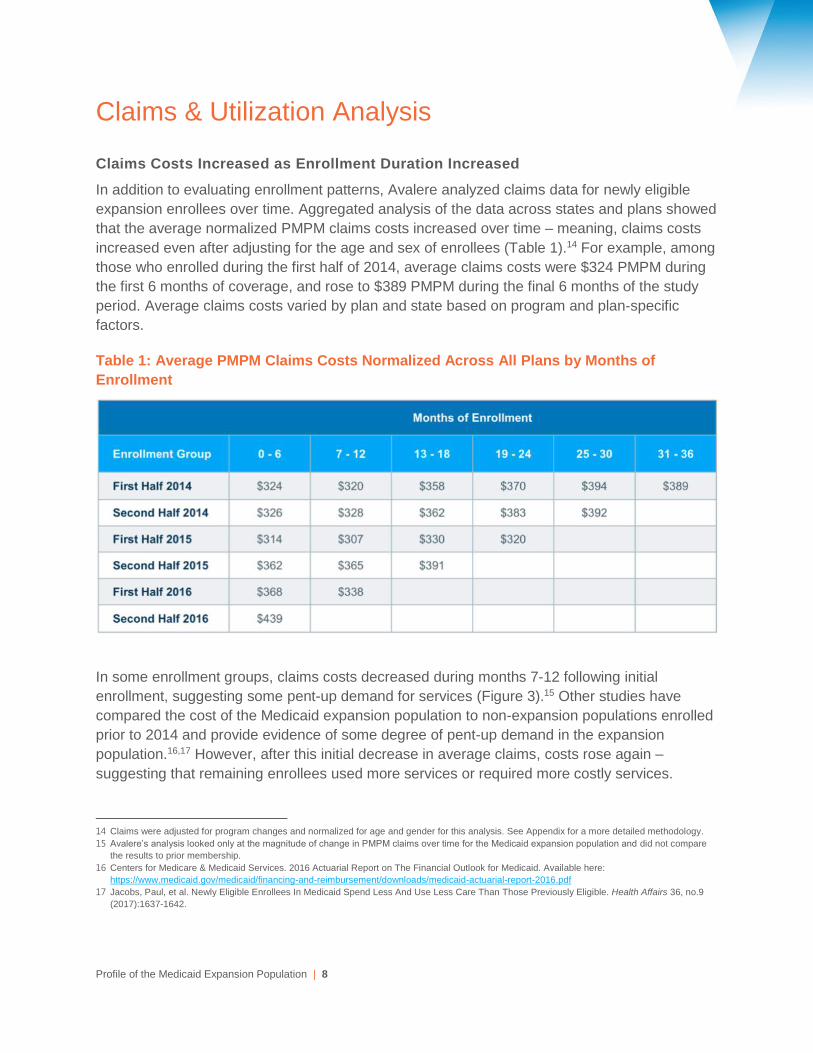
Claims Costs Increased as Enrollment Duration Increased
In addition to evaluating enrollment patterns, Avalere analyzed claims data for newly eligible
expansion enrollees over time. Aggregated analysis of the data across states and plans showed
that the average normalized PMPM claims costs increased over time – meaning, claims costs
increased even after adjusting for the age and sex of enrollees (Table 1).14 For example, among
those who enrolled during the first half of 2014, average claims costs were $324 PMPM during
the first 6 months of coverage, and rose to $389 PMPM during the final 6 months of the study
period. Average claims costs varied by plan and state based on program and plan-specific
factors.
Table 1: Average PMPM Claims Costs Normalized Across All Plans by Months of
Enrollment
In some enrollment groups, claims costs decreased during months 7-12 following initial
enrollment, suggesting some pent-up demand for services (Figure 3).15 Other studies have
compared the cost of the Medicaid expansion population to non-expansion populations enrolled
prior to 2014 and provide evidence of some degree of pent-up demand in the expansion
population.16,17 However, after this initial decrease in average claims, costs rose again –
suggesting that remaining enrollees used more services or required more costly services.
14 Claims were adjusted for program changes and normalized for age and gender for this analysis. See Appendix for a more detailed methodology.
15 Avalere’s analysis looked only at the magnitude of change in PMPM claims over time for the Medicaid expansion population and did not compare
the results to prior membership.
16 Centers for Medicare & Medicaid Services. 2016 Actuarial Report on The Financial Outlook for Medicaid. Available here:
https://www.medicaid.gov/medicaid/financing-and-reimbursement/downloads/medicaid-actuarial-report-2016.pdf
17 Jacobs, Paul, et al. Newly Eligible Enrollees In Medicaid Spend Less And Use Less Care Than Those Previously Eligible. Health Affairs 36, no.9
(2017):1637-1642.
Profile of the Medicaid Expansion Population | 9
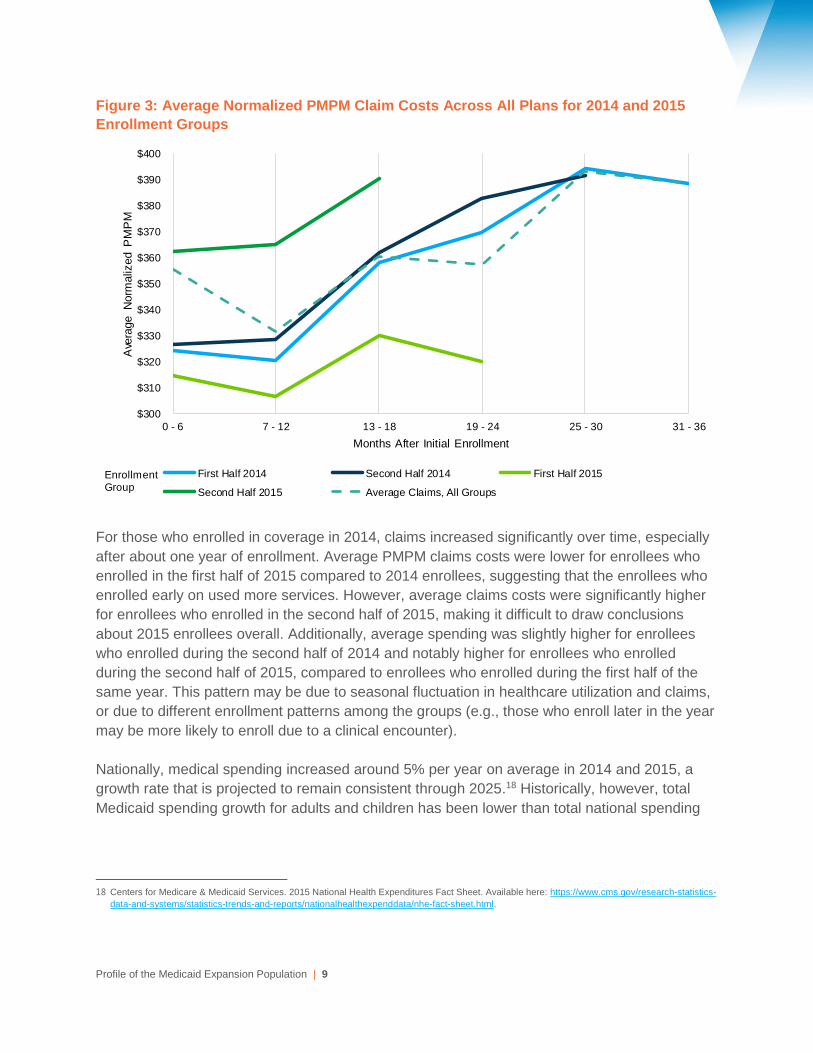
Figure 3: Average Normalized PMPM Claim Costs Across All Plans for 2014 and 2015
Enrollment Groups
For those who enrolled in coverage in 2014, claims increased significantly over time, especially
after about one year of enrollment. Average PMPM claims costs were lower for enrollees who
enrolled in the first half of 2015 compared to 2014 enrollees, suggesting that the enrollees who
enrolled early on used more services. However, average claims costs were significantly higher
for enrollees who enrolled in the second half of 2015, making it difficult to draw conclusions
about 2015 enrollees overall. Additionally, average spending was slightly higher for enrollees
who enrolled during the second half of 2014 and notably higher for enrollees who enrolled
during the second half of 2015, compared to enrollees who enrolled during the first half of the
same year. This pattern may be due to seasonal fluctuation in healthcare utilization and claims,
or due to different enrollment patterns among the groups (e.g., those who enroll later in the year
may be more likely to enroll due to a clinical encounter).
Nationally, medical spending increased around 5% per year on average in 2014 and 2015, a
growth rate that is projected to remain consistent through 2025.18 Historically, however, total
Medicaid spending growth for adults and children has been lower than total national spending
18 Centers for Medicare & Medicaid Services. 2015 National Health Expenditures Fact Sheet. Available here: https://www.cms.gov/research-statistics-
data-and-systems/statistics-trends-and-reports/nationalhealthexpenddata/nhe-fact-sheet.html.
Enrollment Group
$300
$310
$320
$330
$340
$350
$360
$370
$380
$390
$400
0 - 6 7 - 12 13 - 18 19 - 24 25 - 30 31 - 36
Ave
rage N
orm
aliz
ed P
MP
M
Months After Initial Enrollment
First Half 2014 Second Half 2014 First Half 2015
Second Half 2015 Average Claims, All Groups
Profile of the Medicaid Expansion Population | 10
growth.19 By comparison, average age-adjusted PMPM claims costs for the first group of
expansion enrollees (first half of 2014) increased by approximately 10% from early 2014 to early
2015 ($324 to $358), and by another 10% from early 2015 to early 2016 ($358 to $394).
Over Time, Spending on Prescription Drugs Increased Most, Followed by Spending
on Professional Services
To understand trends in the types of services that expansion enrollees are using, we analyzed
spending by type of claim over time. For each category of service, Avalere calculated claims
costs in each month as a percentage of total claims costs and on a PMPM basis.
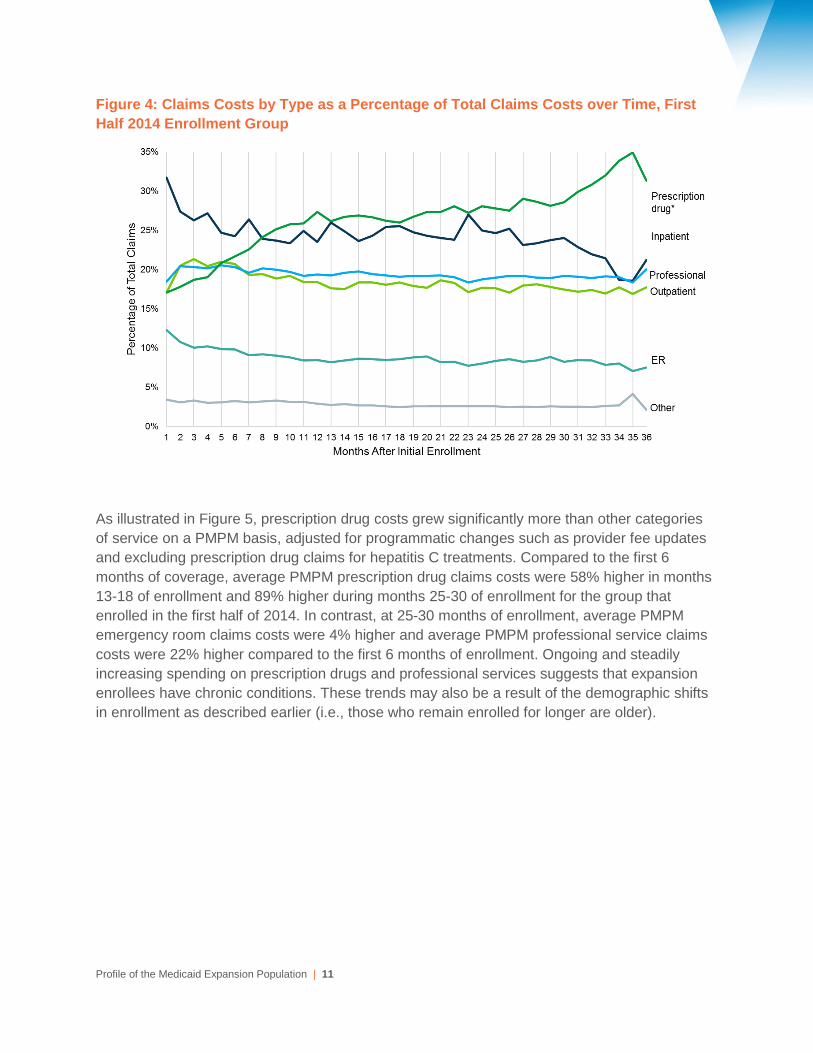
For the group who enrolled in the first half of 2014, Figure 4 shows that inpatient claims initially
accounted for the largest share of claims costs—nearly one third—suggesting that expansion
enrollees had significant medical needs upon enrollment, or that many expansion enrollees
enrolled as a result of an inpatient encounter (hospitals may presumptively determine Medicaid
eligibility).20 Similar trends occur across all enrollment cohorts with inpatient claims accounting
for the largest share of claims costs and then declining, while prescription drug claims increase
as a percentage of total claims over time.
After 8 months of enrollment, prescription drug costs surpassed inpatient costs, growing to just
under 30% of total claims costs by 30 months. Note that in this analysis, claims for hepatitis C
treatments were excluded from the prescription drug claims costs. As prescription drug claims
grew as a share of total claims costs, claims costs for other categories of services – in
particular, for acute care services such as inpatient hospitalization and emergency room use –
decreased as a share of the total costs. There are a number of possible reasons for this pattern;
for example, enrollees may have received more outpatient and chronic care management as
they established relationships with healthcare providers, thus increasing medication use but
reducing complications requiring an ER visit or inpatient admission. Alternatively, the trend may
reflect higher underlying cost trends in pharmacy, as compared to other medical services.
19 KFF. Average Growth in Annual Medicaid Spending from FY2000 to FY2011 for Full-Benefit Enrollees. Available here:
https://www.kff.org/medicaid/state-indicator/average-growth-in-annual-medicaid-spending-from-fy2000-to-fy2011-for-full-benefit-
enrollees/?currentTimeframe=0&sortModel=%7B%22colId%22:%22Location%22,%22sort%22:%22asc%22%7D.
20 This analysis is not adjusted for enrollee age and gender.
Profile of the Medicaid Expansion Population | 11
Figure 4: Claims Costs by Type as a Percentage of Total Claims Costs over Time, First
Half 2014 Enrollment Group
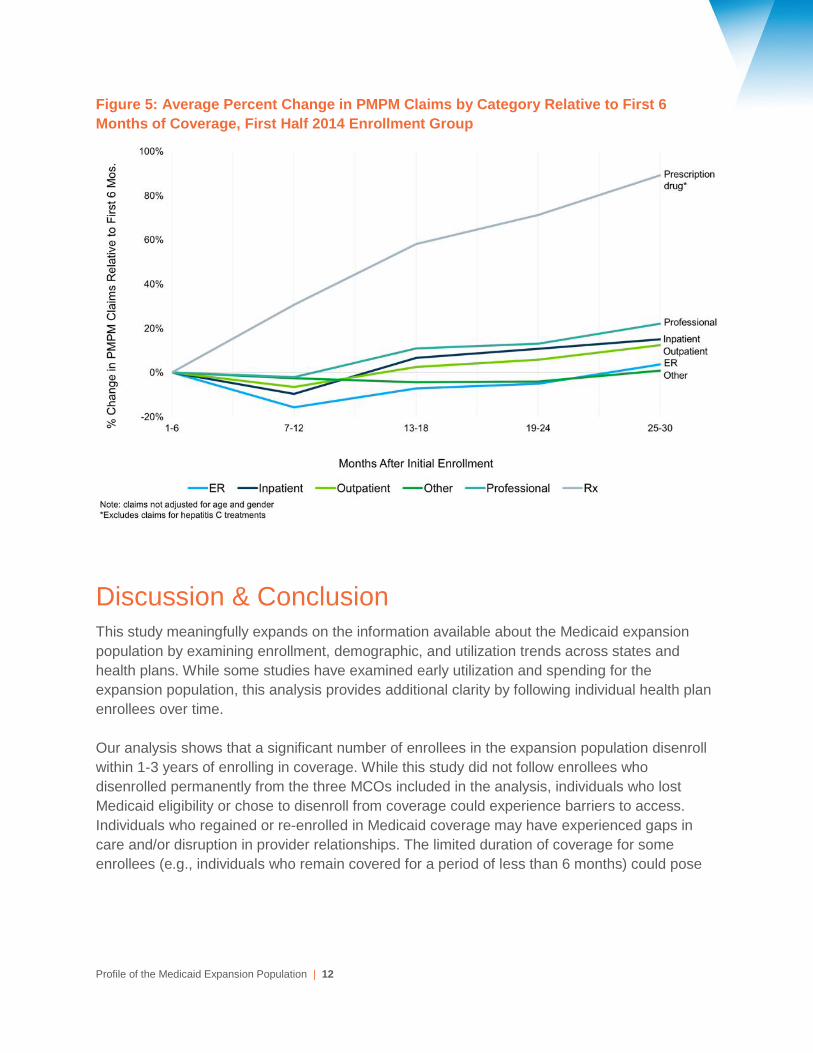
As illustrated in Figure 5, prescription drug costs grew significantly more than other categories
of service on a PMPM basis, adjusted for programmatic changes such as provider fee updates
and excluding prescription drug claims for hepatitis C treatments. Compared to the first 6
months of coverage, average PMPM prescription drug claims costs were 58% higher in months
13-18 of enrollment and 89% higher during months 25-30 of enrollment for the group that
enrolled in the first half of 2014. In contrast, at 25-30 months of enrollment, average PMPM
emergency room claims costs were 4% higher and average PMPM professional service claims
costs were 22% higher compared to the first 6 months of enrollment. Ongoing and steadily
increasing spending on prescription drugs and professional services suggests that expansion
enrollees have chronic conditions. These trends may also be a result of the demographic shifts
in enrollment as described earlier (i.e., those who remain enrolled for longer are older).
Profile of the Medicaid Expansion Population | 12
Figure 5: Average Percent Change in PMPM Claims by Category Relative to First 6
Months of Coverage, First Half 2014 Enrollment Group
Discussion & Conclusion This study meaningfully expands on the information available about the Medicaid expansion
population by examining enrollment, demographic, and utilization trends across states and
health plans. While some studies have examined early utilization and spending for the
expansion population, this analysis provides additional clarity by following individual health plan
enrollees over time.
Our analysis shows that a significant number of enrollees in the expansion population disenroll
within 1-3 years of enrolling in coverage. While this study did not follow enrollees who
disenrolled permanently from the three MCOs included in the analysis, individuals who lost
Medicaid eligibility or chose to disenroll from coverage could experience barriers to access.
Individuals who regained or re-enrolled in Medicaid coverage may have experienced gaps in
care and/or disruption in provider relationships. The limited duration of coverage for some
enrollees (e.g., individuals who remain covered for a period of less than 6 months) could pose
Profile of the Medicaid Expansion Population | 13
challenges for providers and health plans seeking to implement care management strategies for
chronic conditions.
Retention rates varied substantially by age, with younger enrollees dropping coverage at a
higher rate than older enrollees. Ultimately, this resulted in enrollment groups that were older,
on average, during the most recent 6 months of enrollment than during the first 6 months of
coverage. Because medical needs tend to increase with age, retention of older enrollees
suggests that claims per person would increase over time.
Avalere’s analysis found that claims costs did increase over time – even after adjusting or
normalizing for age and sex. While some enrollment groups experienced a dip in claims costs
during the second 6 months of enrollment, suggesting some pent-up demand, the overall trend
was toward higher claims costs over time. Relative spending by claims type also suggested that
expansion enrollees have chronic healthcare needs; while inpatient claims declined fairly quickly
as a share of total claims costs, the share of professional and outpatient claims was consistent
over time and prescription drug spending as a share of total claims costs increased significantly.
The results of this study provide valuable insights into the Medicaid expansion population and
MCOs’ experience across multiple states and enrollment cohorts, which can inform policy and
program changes and assist state regulators in establishing payment rates and program
standards. Overall, our analysis suggests that utilization and costs among expansion enrollees
continues to increase – particularly for non-acute care services – the longer members remain
covered.
Profile of the Medicaid Expansion Population | 14
Appendix: Methodology
Avalere received claims data from January 2014 through December 2016 from three Medicaid
MCOs offering coverage in states that expanded Medicaid on January 1, 2014. In total, their
data represented nine unique state-plan combinations. Avalere excluded one state-plan
combination in the first half 2014 enrollment group due to low enrollment.
The participating MCOs used a standardized format and criteria for submitting data
to Avalere. All Medicaid expansion enrollees, defined as individuals who gained eligibility due to
the state’s decision to expand coverage under the ACA, in these states were included and
assigned to an enrollment group based on the initial date of enrollment. Membership in each
plan was categorized into 6-month period enrollment groups based on the initial enrollment date
(e.g., an individual that enrolled between January and June 2014 was included in the “first half
2014” enrollment group). If an enrollee experienced a break in enrollment, he or she was
returned to the original enrollment group for purposes of the analysis (e.g., if a member enrolled
in May 2014, lapsed for two months, and re-enrolled in August 2014, the member was included
in the first half 2014 group).
Claims data included both medical and pharmacy claims, excluding prescription drug claims for
Hepatitis C treatments. Claims data were broken out into 6 categories of service: ER, inpatient,
outpatient, professional, pharmacy, and other (e.g., home health, durable medical equipment,
private duty nursing, and other miscellaneous services). Services paid for on a sub-capitated
basis were excluded from the analysis. Except where noted in the category of service analyses,
claims data were normalized by both age and gender to negate the effect of age or gender
influences on the change in claims over time (i.e., duration or incurred period). The age/gender
normalization factors were derived from a state’s most recently available state pricing or
expected claims costs for the expansion population. The claims were also adjusted for any
material program changes (e.g., benefit changes, fee schedule changes) through 2016. Claims
data were categorized by incurred date in 6-month increments, so that, for example, a claim
incurred between January and June 2015 would be listed as incurred in early 2015.
Averages presented represent “straight averages” across the state-plan combinations,
unweighted for enrollment or claims costs. For purposes of this report, all enrollment and claims
data were aggregated to ensure the strict confidentiality of each plan's data; only Avalere had
access to the underlying datasets. Because plan data were blinded in this study, there are
limitations in the conclusions that we can draw from our results. MCO experience could also
differ across states and plans due to covered benefits, plan capitation rates, negotiated rates
with providers, and if a state has a unified formulary. Finally, states have different processes for
eligibility applications and redeterminations with some states allowing enrollees to stay enrolled
until eligibility is re-determined, while others disenroll enrollees until they are redetermined
eligible.

Avalere is a vibrant community of innovative thinkers
dedicated to solving the challenges of the healthcare
system. We deliver a comprehensive perspective,
compelling substance, and creative solutions to help
you make better business decisions. As an Inovalon
company, we prize insights and strategies driven by
robust data to achieve meaningful results. For more
information, please contact [email protected]. You
can also visit us at avalere.com.
Avalere Health
An Inovalon Company
1350 Connecticut Ave, NW
Washington, DC 20036
202.207.1300 | Fax 202.467.4455
avalere.com
About Us
Contact Us
Copyright 2018. Avalere Health. All Rights Reserved.