Embed Size (px)
Citation preview


PROFILE: ZULULAND
2
CONTENT
1. Executive Summary ........................................................................................... 4
2. Introduction: Brief Overview............................................................................. 5
2.1 Location ................................................................................................................... 5
2.2 Historical Perspective ............................................................................................... 6
2.3 Spatial Integration .................................................................................................... 6
3. Social Development Profile............................................................................... 7
3.1 Key Social Demographics ........................................................................................ 7
3.2 Health Profile ............................................................................................................ 8
3.3 COVID-19 .............................................................................................................. 10
3.4 Poverty Dimensions ............................................................................................... 10
3.4.1 Distribution .......................................................................................................... 10
3.4.2 Inequality ............................................................................................................. 10
3.4.3 Employment/Unemployment ............................................................................... 11
3.4.4 Crime .................................................................................................................. 12
3.5 Education and Skills Profile .................................................................................... 12
4. Drivers of the Economy .................................................................................. 14
4.1. Structure of the Economy .................................................................................... 14
4.2. Primary sector ..................................................................................................... 14
4.3. Secondary sector ................................................................................................ 15
4.4. Tertiary sector ..................................................................................................... 16
4.5. Informal Economy ............................................................................................... 17
4.6. Economic Growth Forecast ................................................................................. 17
5. Service Delivery ............................................................................................... 17
5.1. Water and Sanitation .......................................................................................... 17
5.2. Human Settlements ............................................................................................ 18
5.3. Electricity ............................................................................................................ 19
5.4. Waste Management ............................................................................................ 19
5.5. Transport ............................................................................................................ 20
6. Governance and Management ........................................................................ 20
6.1 Municipal Performance ........................................................................................... 20
6.2 Municipal Capacity ................................................................................................. 20
7. PROJECTS TO DIVERSIFY AND GROW PEOPLE AND THE ECONOMY .... 22
7.1 Spatial Development .............................................................................................. 22
7.2 Ecological Potential and Biodiversity ...................................................................... 23
7.3 Social Development Projects .................................................................................. 23
7.4 Economic and Infrastructure Projects ..................................................................... 23
8. KEY RECOMMENDATIONS ............................................................................. 25

PROFILE: ZULULAND 3

PROFILE: ZULULAND
4
CO
VID
-19 V
uln
era
bility
Index
Zu
lula
nd
Sourc
e: C
SIR
/NC
DM
`

PROFILE: ZULULAND 5
1. Executive Summary Zululand district municipality is situated in the north-eastern part of
KwaZulu-Natal. The district shares its boundary with Umkhanyakude
district municipality to its west, King Cetshwayo to its south,
Umzinyathi to its south west and Amajuba district municipality to its
west. To its north west, Zululand shares a boundary with Mpumalanga
province and a border with the Kingdom of Eswatini to the north.
The district is approximately 14 810 km², and consists of five local municipalities
namely, Abaqulusi local municipality, eDumbe local municipality, Nongoma local
municipality, Ulundi local municipality, and uPhongolo local municipality. The main
access to the district is via the N2 from Gauteng in the north-west, which connects to
Durban in the south.
The Zululand district municipality has a population of 868 031 amounting to 7.8% of
the total KZN population after uMgungundlovu and King Cetshwayo. Zululand’s total
population contributes 22% to the provincial population.
The district has a total number of 178 516 households with an average of 5 person
per household. The average largely reflects those in rural areas, since a majority of
the households are located within the rural areas of the municipality. 53.8% of the
households are headed by women. There are 2 034 child headed households and
33.4% of the child-headed households have women as their head.
As at 17 June 2020 there were 4 238 confirmed cases as well as 73 deaths and 2 133
recoveries in KZN. There are seven quarantine facilities in Zululand with 194 beds
combined. Four of the facilities have been activated as at 29 May 2020.
The economy of Zululand district is driven by the tertiary sector, with community
services having the highest contribution at 31%, followed by finance at 18% and trade
at 12%. This can be attributed to the presence of government departments in Zululand
district.
The draft National Spatial Development Framework, identifies Ulundi in the Zululand
district as a national network of regional development anchors, seeks to prioritise and
strengthen strategically located regional development anchor towns in productive rural
regions and priority national development, trade and transport corridors to provide a
range of services within the specific towns/cities and surrounding network of
settlements and productive rural regions.

PROFILE: ZULULAND
6
2. Introduction: Brief Overview 2.1. Location
Zululand district municipality DC26 is a category C municipality
situated in the north-eastern part of KwaZulu-Natal. The district shares
its boundary with Umkhanyakude district municipality to its west, King
Cetshwayo to its south, Umzinyathi to its south west and Amajuba
district municipality to its west. To its north west, Zululand shares a
boundary with Mpumalanga province and a border with the Kingdom
of Eswatini to the north.
The Zululand District Municipality is one of 10 district authorities within the KwaZulu-
Natal Province, which is situated on the northern boundary of the KwaZulu-Natal
Province. The district is the biggest in the province, making up 16% of the provincial
geographical area.
Zululand has a rich history that is woven into the surrounding landscape. The district
contains the most diverse concentration of wildlife sanctuaries in South Africa and has
a diversity among the animal, bird and plant life. The sacred mountain of Magudu is
the site of a historical village that was once the home to Magudu, the Zulu rain queen.

PROFILE: ZULULAND 7
2.2 Historical Perspective
The district is part of a larger historical area also known as Zululand. The area received
prominence during the 19th century and built its homestead in the areas surrounding
the district, and beyond. This extended from the Tugela River in the south to the
Pongola River in the north. The Zulu are Nguni-speaking people and originally settled
near the White Umfolozi River.
Under the rule of King Shaka, the nation rose to power through militaristic strategies.
Shaka’s successors clashed with the Afrikaner boers in 1838, and around 3000 Zulus
were killed at the Battle of Blood River.
In 1879, the British Empire invaded and started the Anglo-Zulu war. The Zulu were
victorious at the battle of Isandlwana, but the British eventually won and defeated
the Zulu at the battle of Ulundi. The Zulu's were annexed in 1887 and became part
of Natal in 1897.
The Battlefields Route has a number of significant battle sites in the immediate vicinity.
KwaZulu became a province of the Union of South Africa in 1910. The South African
government made Native Reserves independent areas through the Promotion of
Bantu Self-Government Act of 1959, and the area in which the Zulu resided was
made the ‘Zulu homeland’. It was soon renamed KwaZulu [land of the Zulus] after it
was established in 1970. KwaZulu was made up of isolated tracts of land, forming only
a part of historical Zululand, and was neither geographically unified nor territorially
homogeneous. The area north of the Tugela River, where the largest tracts of Zulu
territory lie, formed the hub of KwaZulu. KwaZulu was nominally self-governing from
1977 and Ulundi became its capital in 1980.
2.3. Spatial Pattern
The district is approximately 14 810 km², and consists of five local municipalities
namely, Abaqulusi local municipality, eDumbe local municipality, Nongoma local
municipality, Ulundi local municipality, and uPhongolo local municipality. Zululand
district is predominantly rural with commercial farmland surrounded by protected
areas, towns, and scattered rural settlements within Traditional Authority Areas. The
majority of these rural settlements are dense and small, making service delivery to
these remote areas extremely costly. This poses a challenge since it becomes very
difficult for the various municipalities to build a proper tax base, which can be utilised
for the provision and maintenance of services.

PROFILE: ZULULAND
8
Abaqulusi Local Municipality derives its name from the brave AbaQulisi
Impi/barrack which under King Shaka was led by his aunt uMkabayi ka Jama.
Historically, they were not drafted into ordinary ‘amabutho' regiments but rather into a
royal section. The town of Vryheid which is situated in the centre of the AbaQulusi
region has its origin in an agreement entered into by the Boers and the Zulus. The
municipality occupies the central and western parts of the district, extending 4 314km².
It is the largest of the five municipalities in the district, making up a third of its
geographical area. Key towns are Louwsburg and Vryheid. The main economic
activities are wholesale and retail trade (18-20%), manufacturing (14-16%), finance
(14%), general government (12-14%), agriculture and forestry (12%), transport,
storage and communication (10-12%), and community and social services (4-6%).
eDumbe Local Municipality derives its name from the mountain range of the same
name which is in the area. The mountain is named after amadumbe which is a type of
potato found there. The municipality is situated in the northwest part of the district and
shares boundaries with the Mpumalanga Province in the north. It is the smallest of the
five municipalities at 1 943 km2, accounting for 13% of its geographical area of the
district. The location of the head office is in Paulpietersburg, which is 50km north of
Vryheid and 59km south of Mkhondo (previously Piet Retief). The municipal area of
jurisdiction is demarcated into eight wards that are predominantly rural in nature. Key
drivers of the economy are agriculture, forestry and fishing (22.42%), wholesale and
retail trade, catering and accommodation (15.38%), mining (14.76%), general
government services (13.30%), finance and business services (9.93%), manufacturing
(8.07%), community, social and personal services (7.39%), and construction (6.44%).

PROFILE: ZULULAND 9
The Nongoma Local Municipality is named after the original name of Inkosi Zwide’s
kraal who reigned over the Ndwandwe tribe during King Shaka’s era. Inkosi Zwide's
grave is in the CBD of Nongoma. Located in the east of the district, the municipality
has two secondary corridors, which run from Ulundi to Pongola and from Hlabisa to
Vryheid. It shares boundaries with uPhongolo in the north, Ulundi in the south, the
uMkhanyakude District in the south and east, and Abaqulusi in the west. It is one of
the five municipalities in the district and has three tribal authorities, namely
Mandlakazi, Usuthu and Matheni. It is the most populated municipality in Zululand
spanning over 2 182km². Its main town is Nongoma where his Majesty King Goodwill
Zwelithini also resides. The main economic activity is agriculture.
“THE NONGOMA LOCAL MUNICIPALITY IS
NAMED AFTER THE ORIGINAL NAME OF INKOSI
ZWIDE’S KRAAL WHO REIGNED OVER THE NDWANDWE
TRIBE DURING KING SHAKA’S ERA.”
Ulundi Local Municipality derives its name from isiZulu which meant ‘the high place’
on account of King Cetshwayo choosing it as his capital in 1873, following the death
of his father King Mpande ka Senzangakhona in 1872. Ulundi is situated in the heart
of the province, lying amidst the rolling hills and meandering valleys of Emakhosini,
where many of the Zulu Kings lived and are buried. Ulundi is a place steeped in
tradition and it also a place of superb natural splendour. Ulundi takes up almost a
quarter of the extent of the district at 3 250km². Ulundi is the power hub of central
Zululand. It is rich in cultural, historical and wildlife experiences. The Ulundi Museum
is just a few minutes from the centre of town, and the R700 leads to the Ondini Cultural
Reserve. In addition, the eMakhosini Ophathe Park lies only 10km out of town, and
the Hluhluwe/Mfolozi Game Park is accessible through the new Cengeni Gate a mere
35km away. The main economic activities are agriculture, commercial and retail.
The uPhongolo Local Municipality is named after the river that flows through the
municipality carrying the same name. The name means ‘the trough’ because of its
long, deep pools with steep sides. The municipality is located in the north of the
Zululand District. It lies adjacent to the eSwatini Border and the Mpumalanga provincial
boundary. It is one of five municipalities in the district. Main access to the municipality
is via the N2 from Gauteng in the north-west and Durban in the south. The municipality
provides regional access to a wide range of tourist activities outside its own
boundaries. Main rivers in the municipality are the Mkuze River in the south and the
Pongola River in the north, the latter feeds into the Pongolapoort Dam located on the
eastern boundary of the municipality. Together with the fragmented and sometimes
PROFILE: ZULULAND
10
dramatic topography of the area, the municipality contains, in overall terms, very low
settlement densities. It also has substantial recreational and tourism opportunities.
The overall aim in terms of integrated development planning and land use
management is to provide a secure environment for investment within the uPhongolo
Municipality. The focus is on the investment in social and economic infrastructure and
services, which will enable all the people of uPhongolo to make a contribution to the
future sustainable development of the area. The main economic activities are
agriculture and tourism.
2.4. Land Ownership
Ulundi and Nongoma municipalities consist almost entirely of Traditional Areas, with
scattered settlements and villages. The uPhongolo and eDumbe municipalities houses
a number of traditional councils. The Nongoma municipal area includes vast tracts of
land registered in the name of the Ingonyama Trust and falling under the jurisdiction
of Traditional Councils. About 99% of the land is owned by Ingonyama Trust Board
and 99% of the land is under Traditional Councils.
About 80% of the land within AbaQulusi Municipality belongs to the white population
group. The national government has a target of 30% of the land must be transferred
to Black communities by 2014. This makes AbaQulusi area to be considered under
huge land claims by the Department of Land Affairs (DLA). This poses huge
challenges to AbaQulusi Municipality due to lack of internal capacity, skills and
adequate financial resources to deal with new infrastructure in the areas under land
redistribution by Department of Land Affairs (IDP 2019/20).
“ZULULAND IS HOME TO KING GOODWILL
ZWELETHINI, ONE OF THE MONARCHIES IN
SOUTH AFRICA AND HIS ROYAL PALACES ARE AMONG THE MAIN TOURIST ATTRACTIONS IN THE REGION”

PROFILE: ZULULAND 11
3. Social Development Profile 3.1. Key Social Demographics
3.1.1. Population
In 2019, Zululand district municipality had a population of 868 031
amounting to 7.8% of the total KZN population after uMgungundlovu
and King Cetshwayo. Zululand’s total population contributes 22% to
the provincial population.
The population growth rate is similar to that of its neighbouring districts ranging
between 1.4% and 1.6%. The population growth between 1996 and 2001 was 2.4%,
declining to 0.3% between the period 2001 and 2011. This followed the rise between
2011 to 2019 from 0,6% to 1%. The latter growth rate is likely to maintained at least
up to 2024.
Abaqulusi local municipality has the highest population in the district at 28.0%,
followed by Ulundi at 23.7%. eDumbe local municipality has the lowest at 10.32%.
“THE POPULATION GROWTH RATE IS SIMILAR TO THAT OF ITS NEIGHBOURING DISTRICTS
RANGING BETWEEN 1.4% AND 1.6%.”
3.1.2. Gender, Age and Race
Gender proportions indicate that there is a higher proportion of females 462 625
(53.3%) compared to males 405 406 (46.7%). Women are heads of household in the
absence of partners due to migration to seek employment in other urban centres. The

PROFILE: ZULULAND
12
district has a median age of 18 years, with over 51% of the people being under the
age of 18 years.
The share of children between the ages of 0 to 14 years is larger (38.83%) in Zululand
compared to South Africa (29.1%). Demand for expenditure on schooling as
percentage of total budget within Zululand district municipality will therefore be higher
than that of South Africa. There is a significant smaller share of young working age
people aged 20-34 (23.6%) in Zululand, compared to the national picture (28.0%).
This picture persists even for both males and females up to the age of 70.
The African population had the largest group at 99%, followed by the White (1%) and
Coloured (0.3%) population group. 95% of the population speak the isiZulu language
at home, followed by Afrikaans and English at 1% each.
8,0% 6,0% 4,0% 2,0% 0,0% 2,0% 4,0% 6,0% 8,0%
00-04
05-09
10-14
15-19
20-24
25-29
30-34
35-39
40-44
45-49
50-54
55-59
60-64
65-69
70-74
75+
Population structure 2019DC26 Zululand vs. National
DC26 Zululand
South Africa
Male Female
Source: IHS Markit Regional eXplorer version 1946

PROFILE: ZULULAND 13
3.1.3. Households
The district has a total number of 178 516 households with an average of 5 person
per household. The average largely reflects those in rural areas, since a majority of
the households are located within the rural areas of the municipality. 51% of these
households are in formal structures, 32% are in traditional dwellings and 5% live in a
backyard dwelling.
53.8% of the households are headed by women. There are 2 034 child headed
households and 33.4% of the child-headed households have females as their head.
3.2. Health Profile
The top two leading causes of death for children below the age of 5 is diarrhoeal
diseases (24.3%) and lower respiratory infections (15.8%). For the elderly,
cerebrovascular disease, such as strokes (18.9%) followed by Tuberculosis and lower
respiratory infections both at 9.6% were the leading causes of death.
In terms of maternal conditions, indirect maternal conditions (28.9%) and hypertension
(19.9%) account for the leading causes of death for women in the 15-49 age category.
Maternal Mortality Ratio (per 100 000 live births) is 75, Ulundi had the highest at 129.4
and Nongoma lowest at 19.8.
The HSRC South African National HIV Prevalence, Incidence, Behaviour and
Communication Survey 2019, states that there were 7.9 million people living with HIV
in South Africa and over 2.1 million were in KZN. HIV prevalence varies geographically
PROFILE: ZULULAND
14
across South Africa, ranging from 12.6% in Western Cape to 27.0% in KwaZulu-Natal.
The Zululand districts recorded the highest HIV prevalence at 48.4%. Tuberculosis
(23.4%) and HIV/AIDS (16.8%) are the leading causes of death in the 15-24 age
group.
Zululand district is rural and poor with high HIV/AIDS infections rates. With 2 034 child
headed households, a number of the children in the district come from indigent homes
or have been orphaned as a result of HIV/AIDS. In eDumbe municipality, at least 17%
of the population is already infected with HIV.
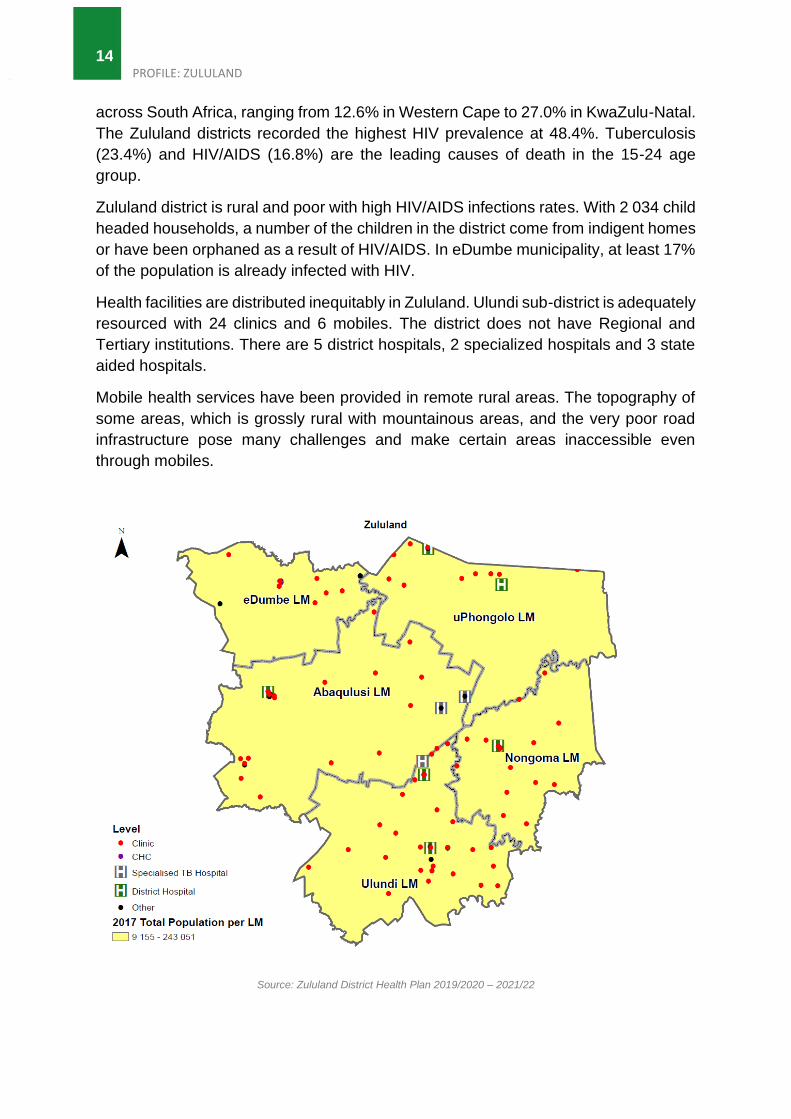
Health facilities are distributed inequitably in Zululand. Ulundi sub-district is adequately
resourced with 24 clinics and 6 mobiles. The district does not have Regional and
Tertiary institutions. There are 5 district hospitals, 2 specialized hospitals and 3 state
aided hospitals.
Mobile health services have been provided in remote rural areas. The topography of
some areas, which is grossly rural with mountainous areas, and the very poor road
infrastructure pose many challenges and make certain areas inaccessible even
through mobiles.
Source: Zululand District Health Plan 2019/2020 – 2021/22
PROFILE: ZULULAND 15
3.3. Covid-19
As at 17 June 2020 there were 4 238 confirmed cases as well as 73 deaths and 2 133
recoveries in KZN. 25 confirmed cases were in Zululand with no deaths. The Council
for Scientific and Industrial Research (CSIR) in collaboration with Albert Luthuli Centre
for Responsible leadership have developed a set of COVID-19 Vulnerability Indicators
using available data and knowledge. It identifies vulnerabilities present in communities
and identifying areas in need of targeted coordinated interventions and early
response. The purpose of the indicators is intended to support the early
prevention/mitigation and preparedness phase of the disaster management cycle and
informing disaster management decision making. It is not based on epidemiological
modelling but a response to highlighting intervention areas due to underlying situation.
The composition of the index follows two main factors, namely: transmission potential
and health susceptibility.
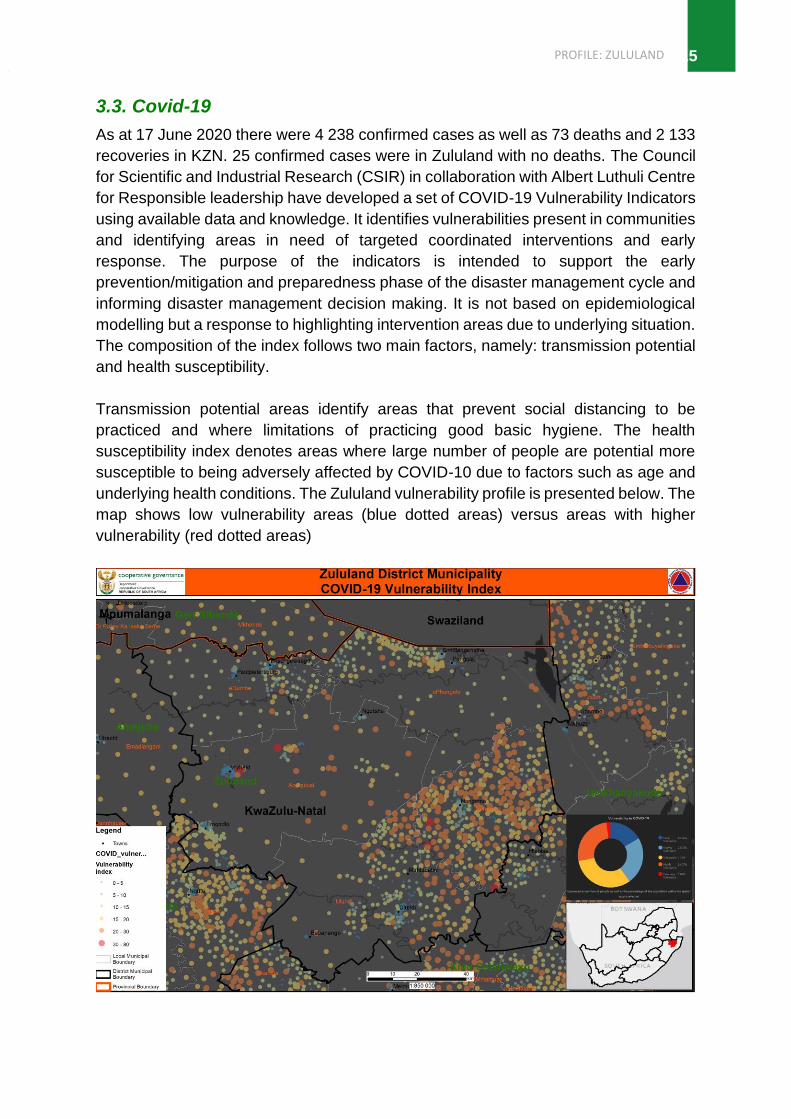
Transmission potential areas identify areas that prevent social distancing to be
practiced and where limitations of practicing good basic hygiene. The health
susceptibility index denotes areas where large number of people are potential more
susceptible to being adversely affected by COVID-10 due to factors such as age and
underlying health conditions. The Zululand vulnerability profile is presented below. The
map shows low vulnerability areas (blue dotted areas) versus areas with higher
vulnerability (red dotted areas)
PROFILE: ZULULAND
16
The area generaly has moderate vulnerability however areas of high deprivation and
density show extreme vulnerability. In the case of Abaqulisi this is Boomlaer and
Sikame. Area specific live GIS vunerability maps are available curtosy of CSIR at:
https://pta-gis-2-web1.csir.co.za/portal2/apps/opsdashboard/#/390a74fb10844c7a85396e60555a866d
There are fifteen quarantine facilities in Zululand with 184 beds combined. Four of the
facilities have been activated as at 29 May 2020.
3.4. Poverty Dimensions
3.4.1 Distribution
In 2019 there were 722 000 people living below the upper bound poverty line of R1 227
per person per month, this is just above 83% of the population and 70 000 more people
than in 2009, showing an 1,82% increase. Using the lower poverty line of R810 per
person per month 69.6% of the population are living in poverty. This is the third highest
nationally, following Alfred Nzo district municipality (71.5%) and uMkhanyakude
district municipality at 70.3%. Zululand’s poverty rate is higher than the provincial rate
which is at 53.4%.
In terms of its municipalities, eDumbe poverty rate was at 74.8%, Nongoma at 72.2%,
uPhongolo at 71.8%, AbaQulusi at 64.4% and Ulundi recording the lowest at 69.7%.
The traditional and rural areas are the most poverty stricken.
3.4.2 Inequality
The Gini-co-efficient for the district sits at 0.57, indicating a comparatively more equal
distribution. This is lower than the national and provincial total which both sit at 0.63.
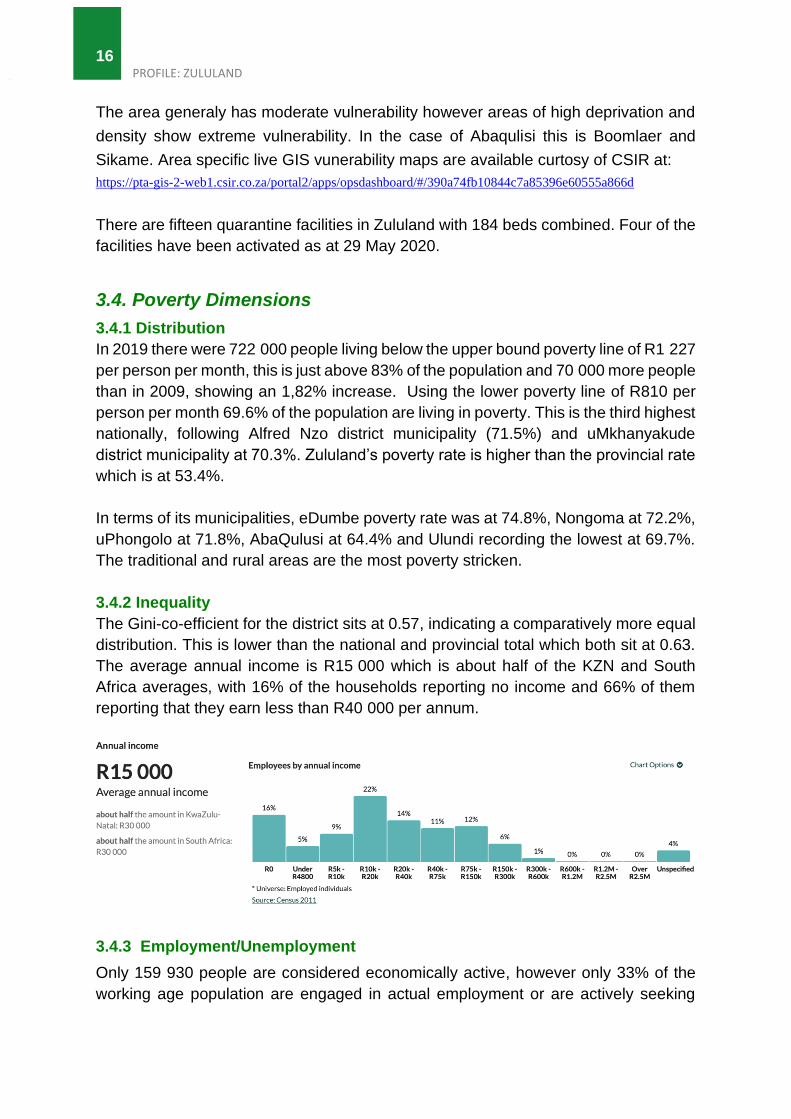
The average annual income is R15 000 which is about half of the KZN and South
Africa averages, with 16% of the households reporting no income and 66% of them
reporting that they earn less than R40 000 per annum.
3.4.3 Employment/Unemployment
Only 159 930 people are considered economically active, however only 33% of the
working age population are engaged in actual employment or are actively seeking

PROFILE: ZULULAND 17
work. This level of labour force participation is very low. The implication of this finding
is that there are probably a large number of discouraged work-seekers in the economy.
This is typical of an economy in which there are high and persistent rates of
unemployment. Of those employed 71% are in the formal sector and 19% are in the
informal sector. The biggest employer is the community services sector which
employed 27% of the employed. The trade sector employed 20,5%, the electricity
sector 0,4%, and mining sector 0,6%.
The unemployment in the district was 28.2% in 2019; this is similar to the national rate
at 28.2%. The district experienced an average 3,42% increase in the number of
unemployed people between 2016 and 2019.
Unemployment in Zululand is unsustainably high and is having the negatively impact
of discouraging people from spending the time and money to actively search for jobs.
Nongoma recorded the smallest labour force participation rate (24.7%), indicating that
there are few people involved in the labour force within the municipality which may be
due to scarce economic opportunities.
AbaQulusi has the largest number of unemployed people in Zululand, with 13 316.
However, the municipality has the second smallest unemployment rate at 26.4% after
uPhongolo at 26.1%. Nongoma (38.6%) and Ulundi (38.7%) have the highest
unemployment rate, higher than the district average (31.4%).
1 Agriculture6%
2 Mining1%
3 Manufacturing8%
4 Electricity0%
5 Construction8%
6 Trade20%
7 Transport6%
8 Finance17%
9 Community services27%
Households7%
Total Employment Composition Zululand, 2019
Source: IHS Markit Regional eXplorer version 1946

PROFILE: ZULULAND
18
3.4.4 Crime
For the period 2008/2009 to 2018/2019 overall crime has decrease at an average
annual rate of 0.81% within the Zululand District Municipality. Violent crime decreased
by 1.03% since 2008/2009, while property crimes increased by 0.78% between the
2008/2009 and 2018/2019 financial years.
According to the Growth and Development Plan for the district, there are 14 police
stations within the Zululand District, with a further 149 required. With the district being
predominantly rural, access to the police stations becomes a challenge.
The Ncome Prison is the main medium/maximum security prison located in Vryheid.
The prison has an official capacity of 1 359.
“ACCORDING TO THE COMMUNITY SURVEY 2016,
IN KWAZULU-NATAL, ABOUT 16,8% CITIZENS
HAVE NO FORMAL EDUCATION”
0
10
20
30
40
50
60
70
80
90
100
Overall, Violent and Property Crime Index Zululand, 2008/2009-2018/2019
OverallCrime Index Violent Crime Index Property Crime Index
Source: IHS Markit Regional eXplorer version 1946

PROFILE: ZULULAND 19
3.5 Educational Skills Profile
According to the Community Survey 2016, in KwaZulu-Natal, about 16,8% citizens
have no formal education, while only 5,8% attained a higher education qualification.
In 2016, 12% of the population of Zululand (aged 20 years and older) has no
education, while 4% of the population has completed primary schooling. 67.4% has
completed grade 9 of higher and 39.8% of the population have Matric or higher. In
2019, Zululand district municipality obtained a 79.1% Matric pass rate.
According to the Education Management System (EMIS) 2016, reflects that there are
292 628 learners and a total of 9 244 educators. 6 424 of the total educators are
female. There are 759 schools in Zululand with 744 schools being public whilst 15 are
private/independent. Most of the learners in the rural areas of the district travel long
distances to access educational facilities. The inaccessibility of schools results in low
attendance that contribute to the poor educational standards in the rural areas.
Most of the local municipalities not only face the problem of a lack of educational
facilities, but also shortages of teachers, limited career guidance, and/or poor quality
of facilities e.g. libraries, laboratories, sports fields etc. – which is more pronounced
in the rural areas of the district.
In terms of higher education, there are limited tertiary education facilities that exist
within the district, which hinders the progress of school leavers within some of the
localities as they have to leave the local areas for tertiary education.
The Mthashana TVET College, is the only tertiary education facility in the district.
Located in Vryheid, Mthashana TVET College offers tertiary courses on a part-time or
full-time basis to about 650 students. Vryheid plays an important regional educational
function and draws pupils from the whole sub-region.
Mthashana TVET College has a total of 9 campuses with one located in
uMkhanyakude district municipality and another uMzinyathi district municipality. The
PROFILE: ZULULAND
20
college offers NCV courses in Utility and Business studies and Engineering studies as
well as National N Diploma courses in Engineering and Business studies.
The District Skills Audit reveals that there is a low rate of start-up of small enterprises
and a low rate of success for start-ups. This is due to factors such as a lack of business
management, financial and technical skills; incorrect targeting of markets; strict
lending criteria by formal financial institutions and a general lack of economic
opportunities. There is insufficient growth and stability of small and medium-sized
business entities. These are the entities that provide significant job creation in
developing countries and form crucial parts of supply chains in all industries.
4. Drivers of Economy 4.1. Economic Drivers
The economy of Zululand district is driven by the tertiary sector, with
community services having the highest contribution at 31%. This is attributed
to the poor and rural nature of the district, and the need for social interventions.
eThekwini metro’s contribution to KwaZulu-Natal’s GVA output is approximately
25 times more than the contribution made by Zululand.
Zululand makes a contribution of about 3% to KwaZulu Natal’s Gross Value Added
and has the slowest growing GVA of all district municipalities. The most significant
challenges in the economy of Zululand are:
• the region is somewhat isolated from the national economy due to its location, in
relation to transportation routes and its distance from the major centres of Durban,
Johannesburg, and Richards Bay.
• No economic benefit to local and regional community, because of low investment
• GVA growth is in decline in the district,
• Out of 11 districts, Zululand is number 7 in terms of its contribution to the provincial
economy.

PROFILE: ZULULAND 21
Primary sector
Secondary sector
Tertiary sector
Gross Value Added (GVA) by aggregate sector Zululand District Municipality, 2019
Source: IHS Markit Regional eXplorer version 1946

PROFILE: ZULULAND
22

PROFILE: ZULULAND 23
AbaQulusi local municipality is the main economic hub of the Zululand district which
contributes over 40% to the district’s Gross Value Added. Ulundi local municipality is
the second largest economy, which can be attributed to the presence of government
departments and the fact that Ulundi is the administrative seat of the Zululand district.
The level of economic growth in Zululand is not equally distributed amongst its local
municipalities. AbaQulusi, the biggest municipality in terms of economic contribution,
recorded a growth rate of 0.1% in 2015. Of note, growth in 2015 was very poor across
all municipalities, in line with both national and provincial weak growth of 1.3 % and
0.6% respectively.
The spatial economic imbalance is not only unique to this district but rather a prevalent
phenomenon across districts in the province. The stark disparities in economic output
contribution can also be noted between the provincial districts.
4.2. Primary Sector
The agriculture sector contributed 6% in 2019. The agricultural sector’s share in the
district dropped from 8.8% in 2008 to 7.9% in 2014. The agricultural sector
performance is in decline in terms of production, imports and exports.
According to the District Rural Development Plan (DRDP) the main agricultural
activities in the district include livestock (red meat and poultry), forestry (timber),
sugarcane, citrus farming, and vegetables. Products produced include timber, field
crops, and livestock. Current field crops farmed include maize, groundnuts, soya
beans, sunflowers, fruits, and sorghum.
The mountainous feature of the central and north-western parts of the municipal area
make it more difficult and expensive to conduct agriculture activity.
The potential for economic growth in Zululand lies in the tourism and agriculture
sectors. The highest agricultural potential are in Abaqulusi, eDumbe, uPhongolo, local
municipality. eDumbe and AbaQulusi local municipality also has high potential for
potato growing. Dry bean production can also be done in Abaqulusi and eDumbe local
municipality in the same geographies as potato production.
The mining sector contributed 7% to the GVA of the district. Zululand’s provincial
comparative advantage lies in the mining sector. Zululand has coal mines and
the only gold mine in KZN (Klipwal). Coal is exported to countries including the
United States, Brazil, Spain and Ireland. Zululand lies on the Coal Line corridor which
runs from Richards Bay, through Ulundi, AbaQulusi and eDumbe to the mining areas
of Mpumalanga. This is an important route in the national rail and road network, and
provides an opportunity for the transport of minerals, metals and timber.
Mining activities in the district have decreased in the mid 1990’s, leaving a gap in the
economy. The AbaQulusi area is facing the challenge of economic development after

PROFILE: ZULULAND
24
the close down of the mining sector, which was a major boost for the regional
economy. This challenge left many ghost towns and hostels in the area, which also
require infrastructure development and maintenance.
Opportunities still exist for small scale mining, which include: mine rehabilitation,
engineering support, equipment maintenance and support, and preparing
Environmental Management Plans.
4.3. Secondary Sector
Manufacturing activity within the District is low. The GVA contribution of the
manufacturing sector dropped from 6.5% in 2014 to 6% in 2019. The only agri-
processing in the District is the Illovo sugar mill in uPhongola municipality.
Moreover, raw materials required for manufacturing purposes are scarce and raw
materials found with the district relate directly to coal and the mining thereof.
Despite the lack of large scale manufacturing in the District a number of interesting
ventures have been established and relate to the raw materials and skills available in
the District. The ventures include (1) arts and crafts production and marketing, (2)
taxidermy, (3) mineral water and (4) charcoal manufacturing for export.
Manufacturing of food, beverages, clothing, textiles, leather products, paper and paper
products, printing, and publishing, metal products, machinery, and equipment also
occur within the municipal area.
“MANUFACTURING ACTIVITY WITHIN THE
DISTRICT IS LOW. THE GVA CONTRIBUTION OF
THE MANUFACTURING SECTOR DROPPED
FROM 6.5% IN 2014 TO 6% IN 2019”
4.4. Tertiary Sector
The economy of Zululand district is driven by the tertiary sector, with community
services having the highest contribution at 31%, followed by finance at 18% and trade
at 12%. This can be attributed to the presence of government departments in Zululand
district.
The commercial sector is well established in the towns of the District however, it is not
easily accessible for the majority of the rural population that currently account for 75%
of the district population.
PROFILE: ZULULAND 25
The lack of business support services will, however, limit entry of emerging
entrepreneurs into these markets. Some of the opportunities that in this sector include
developing the commercial sector in the Rural Services Centres and commercial
enterprises focused on tourism market.
The Zululand area is home to a wide range of historical, cultural and natural assets
being uniquely located in the “heart of the Zulu Kingdom”. These assets provide the
district with good tourism potential. The Natal Spa in eDumbe Municipality is also
identified in the district SDF, and is considered as one of the best known attractions in
the municipality with facilities comprising a resort and conference centre nine hot and
cold mineral water pools.
Qualities of its hot sulphur springs mineral water are well documented. It boasts "triple
waters" which means they contain carbonates, chlorides and sulphates. The resort
also offers a range of activities including horse riding, tennis and bird tours.
In certain areas of the district substantial work has been done to develop the tourism
sector and its assets, however, much still remains to be done for the benefits of the
sector to impact significantly on the socio-economic conditions of the communities of
Zululand. Some of the key challenges in the tourism sector include:
• the distance of Zululand from major urban centres and routes,
• the ceasing of regular flights to the Ulundi airport,
• the quality of road infrastructure in the district, and
• the lack of coordination in tourism marketing.
It has long been contended that the development of key anchor projects and access
routes will open up opportunities in an underdeveloped tourism sector. This includes
finalising the construction of the Nongoma – Pongola link road, the large scale
development of the Pongola Port Dam area and the eMakhosini Heritage Park.
The Local Economic Development Strategy (revised 2015) proposed some
development strategies which are outlined below:
• the development and upgrading of game reserves, dams and nature reserves,
• the establishment and marketing of arts and craft centres,
• the development of the Emakhosini Valley,
• tourism development options that could be pursued with the annual Zulu Reed
Dance celebration celebrated at Nsibaya/Enyokeni, and
• providing tourists with a better understanding of the Zulu Royal Family is only
one of the opportunities presented.
4.5 Informal sector
In the Zululand district the informal economy employed 28 781 people in 2019. This
figure is broken down per sector as follows:

PROFILE: ZULULAND
26
Manufacturing Construction Trade Transport Finance Community
Services
1772 4362 11448 3428 1024 3837
4.6 Economic growth forecast
Agriculture is a major sector within the Municipality and has the potential to contribute
to the development of employment opportunities as well as addressing matters related
to food security.
5. Service Delivery 5.1 Water and Sanitation
The 2016 Community Survey, reveals that 54.7% of households were
reported to have access to safe drinking water. Only 38% were getting
water from a regional or local service provider.
Zululand District Municipality has a total number of 92 233 (10%) households with
piped water inside the dwelling, a total of 323 751 (36%) households had piped water
inside the yard, 92 233 (25%) from a river and a total number of 71 363 (8%) from a
communal stand.
Most of the urban communities have access to clean water with severe shortcomings
as far as the rural communities are concerned. Rural communities have access to less
than 5 litres of water per day. People rely on natural resources for water and are
considered to live at survival levels. The quality of the ground water is poor.
In terms of sanitation in Zululand district municipality, a total number population of 391
329 people use a pit toilet (44%), 219 596 (25%) use a chemical toilets and 130 893
(14.7%%) use flush toilets.
PROFILE: ZULULAND 27
The urban areas have sanitation systems, but the rural areas rely on septic tanks, pit
latrines or no system at all. This places tremendous strain on the environment. The
biggest concentration of backlogs for water and sanitation services is located in the
Ulundi (36, 8%), Nongoma (58,4%) and uPhongolo (30,2%) local municipalities.
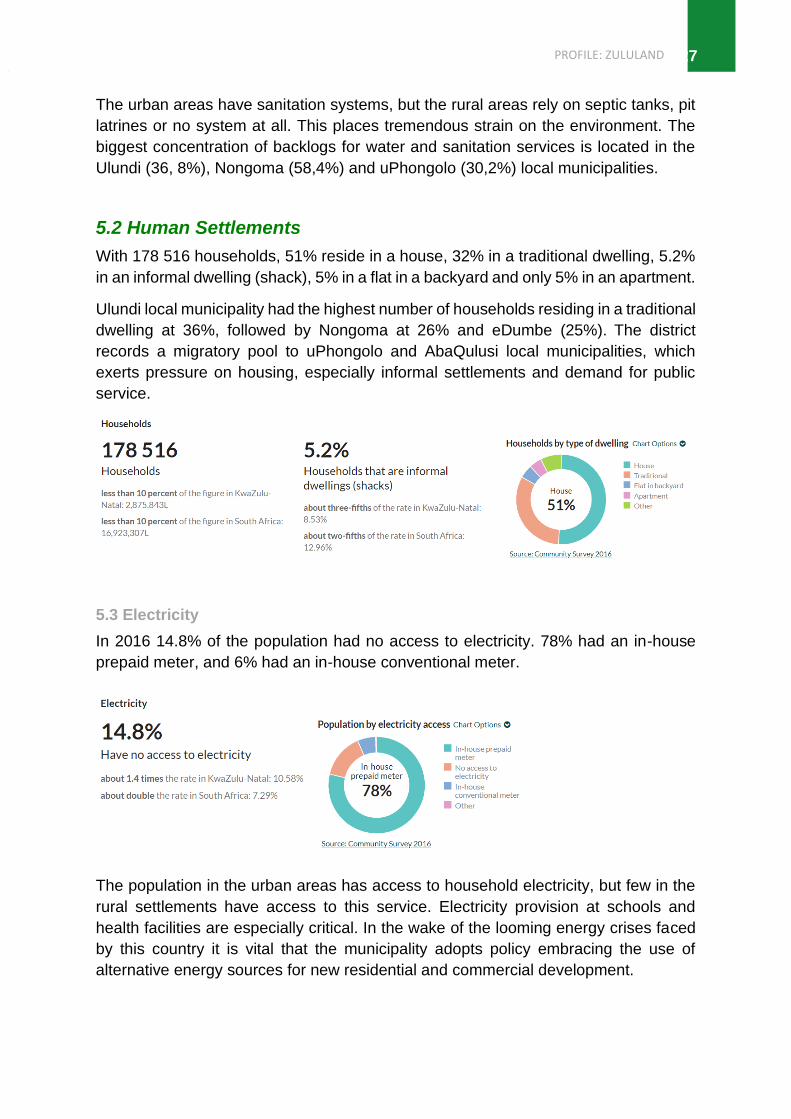
5.2 Human Settlements
With 178 516 households, 51% reside in a house, 32% in a traditional dwelling, 5.2%
in an informal dwelling (shack), 5% in a flat in a backyard and only 5% in an apartment.
Ulundi local municipality had the highest number of households residing in a traditional
dwelling at 36%, followed by Nongoma at 26% and eDumbe (25%). The district
records a migratory pool to uPhongolo and AbaQulusi local municipalities, which
exerts pressure on housing, especially informal settlements and demand for public
service.
5.3 Electricity
In 2016 14.8% of the population had no access to electricity. 78% had an in-house
prepaid meter, and 6% had an in-house conventional meter.
The population in the urban areas has access to household electricity, but few in the
rural settlements have access to this service. Electricity provision at schools and
health facilities are especially critical. In the wake of the looming energy crises faced
by this country it is vital that the municipality adopts policy embracing the use of
alternative energy sources for new residential and commercial development.

PROFILE: ZULULAND
28
15% of households in the district have no access to electricity. AbaQulusi and Ulundi
local municipalities have the highest backlog.
5.4 Waste Management
In 2016, 66% (587 370) of the population remove their refuse personally (own dump)
17% while (147 450) of the population in Zululand district municipality are getting
refuse disposal from a local authority, private company or community members.
Nongoma Municipality has the largest backlog of household refuse removal at 95%
whilst AbaQulusi has the least backlog at 59.3%. It is clear that all the municipalities
in Zululand still have a lot of work to do in dealing with the solid waste removal.
5.5 Transport
The national road, N2 passes through uPhongolo and connects the district to the
coastal regions of KwaZulu-Natal e.g. Richards Bay, Durban, Port Shepstone, as well
as connect the district with Mpumalanga province to the North.
The N207, connects the N2 via Golela border post to the Kingdom of Eswatini. Border
posts with the Kingdom of Eswatini are an important part of the infrastructure available
in Zululand district. Road freight on this route includes fuel transported by road from
South Africa, as well as Eswatini export traffic comprising of paper, fruit, sugar, and
general cargo. The rail traffic crossing the border includes manganese ore which
originates in Phalaborwa and transits the Eswatini railway system via Komatipoort,
Mananga and Golela. Rail traffic also includes a large amount of Eswatini export traffic
and imports from South Africa.
Other railway line include the main railway line from Gauteng to Richards Bay,
traversing the district in the west in a north-south direction. This is a coal line which is
part of the national network that is used for exporting at the Richards Bay Coal
Terminal. Goods transported along this line includes ferro-chrome, granite, chrome,
steel and timber. Timber products are loaded in Zululand.
There are two airports in Zululand, namely Ulundi Airport and Vryheid Airport. Ulundi
airport could be used to boost economic growth and development in this region.

PROFILE: ZULULAND 29
6. Governance 6.1. Municipal Performance
For 2017/18 financial year, Zululand received qualified audit
outcomes. eDumbe and Ulundi local municipality are the only
municipalities that have maintained an unqualified audit throughout
the three-year period.
Auditee Audit Outcomes
2015/16 2016/17 2017/18
Zululand district
municipality
Unqualified audit Unqualified audit Qualified audit
AbaQulusi local
municipality
Unqualified audit Qualified audit Qualified audit
eDumbe local
municipality
Unqualified audit Unqualified audit Unqualified audit
Nongoma local
municipality
Unqualified audit Unqualified audit Adverse opinion
Ulundi local
municipality
Unqualified audit Unqualified audit Unqualified audit
uPhongolo local
municipality
Qualified audit Qualified audit Unqualified audit
Audit outcomes Source: municipalmoney.gov.za
For the 2017/18 financial year, the Auditor General noted that the leadership of the
municipality did not exercise adequate oversight responsibility regarding financial and
performance reporting and compliance with legislation. In this regard, the accounting
officer did not design appropriate policies and procedures to support the achievement
of credible reporting and compliance with legislative requirements.
Furthermore, management did not diligently undertake routine monthly reconciliations
and reviews, to support amounts reported in the financial statements and the annual
performance report. This was due to management not fully understanding the
requirements of the financial and performance reporting frameworks as well as poor
records management.
6.2. Municipal Capacity
The Council of the Zululand District Municipality consists of 36 Councillors, 40% of
which are proportionally elected and 60% elected to the district municipality from
respective local municipalities.
PROFILE: ZULULAND
30
Strengthening relations between local municipalities and traditional councils in their
respective areas is important, given that such a large proportion of the land under rural
municipalities is under the custodianship of the Ingonyama Trust.
It is imperative that more effective systems and processes for integrating municipal
planning and service delivery in Ingonyama Trust areas be developed. In turn there is
a need for enhancement of the participation of members of traditional councils in the
processes of municipalities.
“STRENGTHENING RELATIONS BETWEEN
LOCAL MUNICIPALITIES AND TRADITIONAL
COUNCILS IS IMPORTANT, GIVEN THAT SUCH
A LARGE PROPORTION OF THE LAND UNDER
RURAL MUNICIPALITIES IS UNDER THE
CUSTODIANSHIP OF THE INGONYAMA TRUST.”
7. Project to Diversify and Grow the Economy The draft National Spatial Development Framework, identifies Ulundi in
the Zululand district as a national network of regional development
anchors, seeks to prioritise and strengthen strategically located
regional development anchor towns in productive rural regions and
priority national development, trade and transport corridors to provide
a range of services within the specific towns/cities and surrounding
network of settlements and productive rural regions.
Amongst many proposals, the draft NSDF seeks to strengthen the connectivity of
traditional areas and rural settlements, by making use of the road and rail network and
regional corridor development.
Social infrastructure provision within a regional-rural setting should be planned using
the ‘social services wheel’, and use such investment to establish and create well-
functioning, compact, lively, rural settlements and regional rural systems.
PROFILE: ZULULAND 31
7.1. Spatial Development
Zululand District Municipality’s Spatial Development Framework (2018 Review)
provides the overall district wide spatial guidance and key interventions towards the
attainment of the spatial goals for the Zululand District family of Municipalities.
The District Spatial Development Framework identifies the following key
spatial/economic factors:
Paul Pietersburg in eDumbe local municipality, is identified as a node which can be
generally described as a town that provides municipal wide services and goods. The
town also serve as nodes of transportation and distribution linked to other centres
within the district.
The node serves as the main activity node for commercial and administrative activities.
In order to service the large population concentration, development efforts are focused
on economic development & service provision, job creation, government services and
provision of basic services.
Nongoma is the second town which is considered Secondary nodes in the district SDF
whilst the towns on Vryheid, uPhongola and Ulundi are considered Primary Nodes.
These are generally settlements, mostly rural in nature and would include lower order
services mostly for the immediate communities.
7.2 Ecological Potential and Biodiversity
The District plans to be in step with the Sustainable Development Goals. Whereby
there will be the protection and restoration and promotion of the sustainable use of
terrestrial ecosystems, sustainably manage forests, combat desertification, and halt
and reverse land degradation and halt biodiversity loss. This will be done by
encouraging sustainable practices within the District. As well as, implementation of
biodiversity management projects.
Freshwater resources need to be properly managed – including the river catchments.
Improving the management of river catchments will help reduce potable water losses.
This has to be done in alignment and in conjunction with the relevant authority the
Department of Water Affairs.
There are a lot of pressures on the land in the District. People who keep cattle need it
for grazing, there are development pressures and the changing climate means there
is a need to be vigilant to maintain the biodiversity in the District.
These pressures and issues should be utilised as motivating factors, for officials and
for communities to work together to better manage land and protect areas of significant
biodiversity.

PROFILE: ZULULAND
32
7.3 Social Development Projects
Social Development of the community sectors, namely women, senior citizens, men,
people with disabilities, and children is the core priorities of Zululand District
Municipality. One of the community development objectives in the District’s IDP states
that Zululand District Municipality is to initiate and implement social upliftment
programmes/projects. Over and above the municipal projects and services rendered
to ensure that communities of Zululand have an enabling and safe environment to live
in, there are currently four major social programmes that the Department of
Community Development is implementing to ensure that the quality of life in Zululand
is improved.
7.4. Economic and Infrastructure Projects
Involves the cultivation of abundant aloe ferox and processing that in an Aloe
Processing Facility to promote social upliftment while preserving this natural resource
for the use of medicine, and other products. The project will stimulate small businesses
and much needed job creation.
• Employment Potential: Approximately 1 000 jobs
• Capital Investment Required: R25 000 000.00
• Status: Business Plan has been completed. Land has been made available by
tribal authority. ZDM is seeking an investor.
• Challenges: Funding constraints and attracting investment
The R33 has been identified as a tourism corridor; provide the primary access to the
tourism opportunities within eDumbe Municipality, which are mainly based on the
natural environment. The R33 provides access to the Bivane Dam, the uPhongola
Bush Reserve and Cultural tourism opportunities within eDumbe Municipality.
The R33 connects Vryheid (AbaQulusi LM) to the Paulpietersburg (eDumbe LM) in
the north and also to the province of Mpumalanga to the north of Zululand district. This
road is the main trade and transportation route which links up with the R34 and the
National Route (N2).
The town of Paulpietersburg is constantly growing and the proposed development of
a Shopping Centre and Middle Income Housing (both have currently started) will place
additional pressure on the current sanitation system and with the absence of water
borne sanitation system in the town, the need and demand for one is forever growing.
The water borne sanitation system will also be environmentally friendly and promotes
the concept of COP 17.
The town is currently using a septic tank which in return has a negative impact on
investment within the town.

PROFILE: ZULULAND 33
The eDumbe Waterborne Sewerage Infrastructure will prove:
• Employment Potential: 300
• Capital Investment Required: R350,000,000.00
• Status: Grant conditions for water do not allow for implementation of this project
• Challenges: Funding constraints
Pongolapoort Dam Development Node is a PPP project which will see contribution
across all sectors. The potential development lies in the trans frontier conservation
area (TFCA) between Zululand, Mozambique and Eswatini and could serve as
major tourist drawcard. The dam and surrounding scenic landscape is the key
element. Approximately 10000 temporal jobs and 1500 permanent jobs could be
created.
• Employment Potential: Approximately 1 500 jobs
• Capital Investment Required: R3 2000 000.00
• Status: Project was taken over by the KZN Economic Development Tourism
and Environmental Affairs (EDTEA). Business Plan had been done by Zululand
district municipality and registered as a PP with National Treasury
• Challenges: Funding constraints
8. Key Recommendations • The need to strengthening relations between local municipalities and
traditional councils in their respective areas, given that such a large
proportion of the land under rural municipalities is under the
custodianship of the Ingonyama Trust.
• There is a need to commit adequate financial and human resources to
maintain the municipal planning function and engineering services.
• Issues raised by the Auditor General require urgent attention.
• The Shared Services model offers a key mechanism to ensure access to
services to rural communities.
• Unlock the potential existing in the national road, N2, coal corridor and
the cross border traffic that links to the Kingdom of Eswatini.
• Stimulate economic and tourism opportunities afforded by Ulundi 19
(Intersection of R34 to Vryheid/Newcastle and R66 towards Nongoma and
oPhongolo)
• The two airports in Zululand, namely Ulundi Airport and Vryheid Airport
could be used to boost economic development in this region.

PROFILE: ZULULAND
34