Embed Size (px)
Citation preview

E ZE M V E LO K ZN W I L D L I F E
BI O D I V E RS I T Y S EC TO R P L A N
i
+
Version: Version 2.0
Date: October 2015
Zululand District Municipality: Biodiversity Sector Plan
Biodiversity Sector Plan - Zululand District Municipality 2015
Octob e r 2 015 - Ve rs io n 2 .0 I I
Document Details
Authored by: Felicity Elliott and Dr Boyd Escott of Ezemvelo KZN Wildlife Document Version Version 2 Version 1 of the Biodiversity Sector Plan report for the Zululand District Municipality was compiled by Thorn-Ex cc and Afzelia Environmental Consultants (Thorn-Ex cc and Afzelia Environmental Consulting 2011) in 2010 and approved by Ezemvelo KZN Wildlife’s Board in 2011. Subsequent to this approval significant changes have been made by SANBI in conjunction with the provinces, in the terminology used in Sector Plans and the manner in which priority biodiversity areas are identified and mapped. Version 2 has been updated to incorporate these changes in terminology and mapping. Document is available from: Ezemvelo KZN Wildlife website, www.kznwildlife.com This guideline should be cited as: Ezemvelo KZN Wildlife (2015), Zululand Biodiversity Sector Plan, V2.0, Unpublished Report of Ezemvelo KZN Wildlife, Biodiversity Conservation Planning Division, Ezemvelo KZN Wildlife, P. O. Box 13053, Cascades, Pietermaritzburg.
RECOMMENDED Title Name Signature Date
Chairperson: EKZNW,
SOCC
Chairperson: EKZNW,
Operations Committee
Chief Executive Officer
EKZNW
APPROVED Chairperson: KZN Nature
Conservation Board

Biodiversity Sector Plan - Zululand District Municipality 2015
Octob e r 2 015 - Ve rs io n 2 .0 I I I
Acknowledgements
Specialists involved in the development, consulting or review during production of the Zululand
District Biodiversity Sector Plan include the following key persons.
Name Position Affiliation
Dr Boyd Escott Manager Biodiversity Spatial Planning
and Information & GIS Analysis
Terrestrial
Ezemvelo KZN Wildlife
Felicity Elliott Biodiversity Spatial Planning &
Information (Bioregional Planner)
Heidi Snyman Biodiversity Spatial Planning &
Information (Cartography)
Bimal Naidoo GIS Technician Terrestrial
Marita Thornhill Thorn-Ex cc
Wolfgang Kanz Afzelia Environmental Consultants cc
John Richardson Afzelia Environmental Consultants cc
Monde Nembula Afzelia Environmental Consultants cc
Tim O’Connor & Associates
Tim O’Connor & Associates

Biodiversity Sector Plan - Zululand District Municipality 2015
Octob e r 2 015 - Ve rs io n 2 .0 I V
Executive Summary
The Biodiversity Sector Plan (BSP) has been developed for the Zululand District Municipality as a
precursor to a bioregional plan. The purpose of a bioregional plan is to provide a map of biodiversity
priorities (identified as Critical Biodiversity Areas1 and Ecological Support Areas2) with accompanying
land use planning and decision making guidelines, to inform land use planning, environmental
assessment and authorisations as well as natural resource management by a range of sectors whose
policies and decision impact on biodiversity.
In the province of KZN, a conscious decision was taken that a Biodiversity Sector Plan (BSP) must be
developed as a precursor to a Bioregional Plan (BRP). The reason behind this was the identified need
for KZN to clearly set out the baseline for the conservation priorities in each of the Districts, before
interacting with the various other sector plans, IDPs and SDFs as required by S48 of National
Environmental Management Biodiversity Act, 2004 and the Bioregional Guidelines (DEAT 2009). As
such, the BSP for the Zululand District Municipality complies with SANBI’s Bioregional Planning
terminology and requirements as well as the guidelines for the development of Bioregional Plans
(DEAT 2009). As an intermediate product the BSP does not however reflect the interaction with
other sector planning tools and the gazetting of the document.
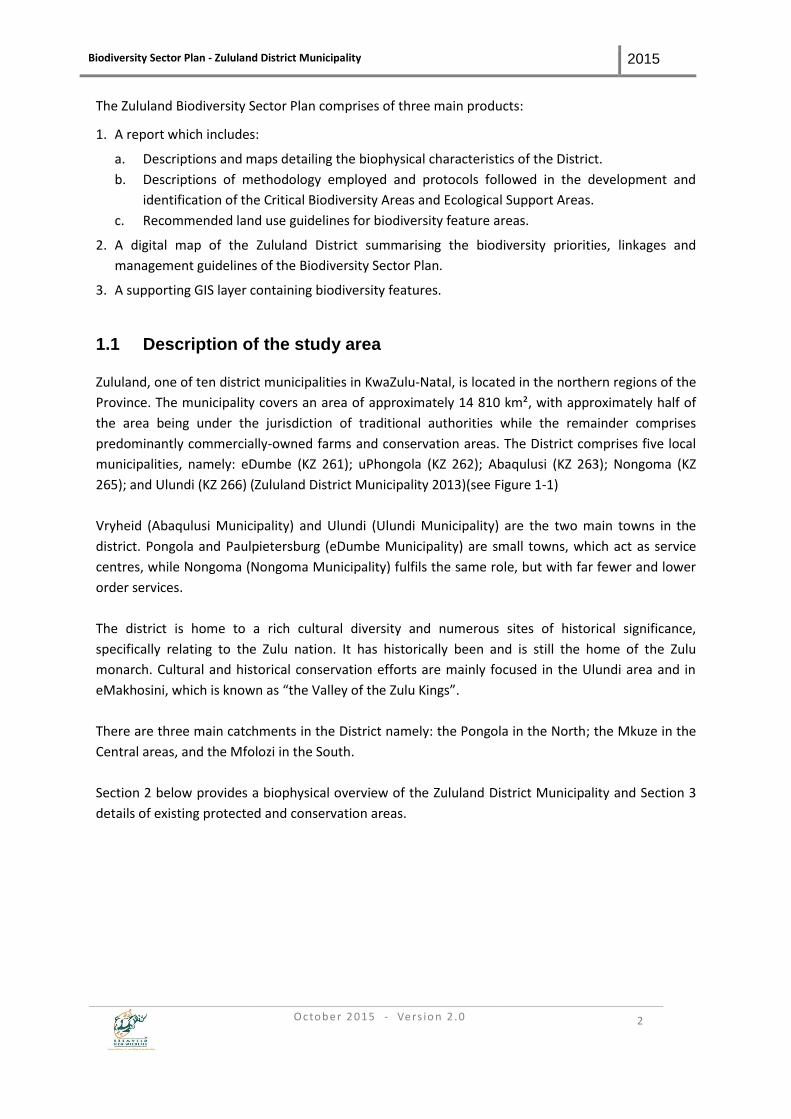
The Zululand Biodiversity Sector Plan comprises of three main products:
A report which includes: Descriptions and maps detailing the biophysical characteristics of the
District; Descriptions of methodology employed and protocols followed in the development
and identification of the Critical Biodiversity Areas and Ecological Support Areas; and
recommended land use guidelines for biodiversity feature areas.
A digital map of the Zululand District summarising the biodiversity priorities, linkages and
management guidelines of the Biodiversity Sector Plan.
A supporting GIS layer containing biodiversity features.
The Zululand Biodiversity Sector Plan should be used by all sectors that are involved in land use
planning and decision making and multi sectoral spatial planning. Users should include reactive
decision-making such as Environmental Impact Assessment and land Use applications; Proactive
users such as spatial planners, IDPs, SDFs and zoning schemes; and Proactive conservation such as
stewardship and protected area expansion, as well as alien clearing, monitoring and research
programmes.
1 Critical Biodiversity Areas, are those areas of natural or near-natural features, habitats or landscapes that include terrestrial, aquatic and
marine areas that are considered critical for (i) meeting national and provincial biodiversity targets and thresholds (ii) safeguarding areas required to ensure the persistence and functioning of species and ecosystems, including the delivery of ecosystem services; and/or (iii) conserving important locations for biodiversity features or rare species. Conservation of these areas is crucial, in that if these areas are not maintained in a natural or near-natural state, biodiversity conservation targets cannot be met.
2 Ecological Support Areas, are those area required to support and sustain the ecological functioning of the critical biodiversity areas
Biodiversity Sector Plan - Zululand District Municipality 2015
Octob e r 2 015 - Ve rs io n 2 .0 V
The following tasks are essential within the Zululand District to achieving biodiversity targets in the
long term:
All planners, environmental consultants and developers must consult the BSP map to
determine the biodiversity conservation status of land which is under application for
development or land use change.
The land use guidelines within this document must be consulted to determine which land uses
and land management types are compatible based on the biodiversity status of the land.
When decision-making covers land within proximity of municipal boundaries, district and local
municipal level planners must ensure collaboration with planners from adjacent municipalities
regarding alignment of biodiversity conservation planning, and land use change applications
Protected Areas and areas identified as critical for biodiversity or ecosystem maintenance, by
the BSP, must be appropriately buffered from development and land use change impacts.
Best practise land management to be put in place.
Alien clearing programs put in place.
Biodiversity Sector Plan - Zululand District Municipality 2015
Octob e r 2 015 - Ve rs io n 2 .0 V I
Table of contents
Document Details ......................................................................................................................... ii
Acknowledgements...................................................................................................................... iii
Executive Summary ...................................................................................................................... iv
Table of contents....................................................................................................................... vi
List of appendices ....................................................................................................................... vii
List of figures ............................................................................................................................. viii
List of tables .............................................................................................................................. viii
List of boxes ................................................................................................................................. ix
List of Abbreviations ..................................................................................................................... x
Definition of Terms ...................................................................................................................... xi
1. Introduction ................................................................................................................... 1
1.1 Description of the study area ................................................................................................... 2
1.2 Aim and Objectives of the Biodiversity Sector Plan ................................................................. 4
1.3 Purpose of a Biodiversity Sector Plan ....................................................................................... 4
1.4 Legal Background...................................................................................................................... 6
1.5 Intended Users of the Biodiversity Sector Plan ........................................................................ 7
2 Biophysical overview of the Zululand District Municipality ............................................... 8
2.1 Physical characteristics ............................................................................................................. 8
2.1.1 Climate ...................................................................................................................................... 8
2.1.2 Topography ............................................................................................................................. 11
2.1.3 Geology and Soils ................................................................................................................... 12
2.1.4 Hydrology ............................................................................................................................... 15
2.2 Land Use and Modification within the Landscape ................................................................. 19
2.3 Biological characteristics ........................................................................................................ 25
2.3.1 Description of habitats and vegetation communities ............................................................ 25
2.3.2 Threatened Ecosystems (Terrestrial)...................................................................................... 26
2.3.3 Threatened and Endemic Flora and Fauna ............................................................................. 28
2.3.3.1 Flora ...................................................................................................................................... 28
2.3.3.2 Fauna ...................................................................................................................................... 29
3 Protected Areas and other Conservation Mechanisms ................................................... 30
3.1 Conservation Category ........................................................................................................... 30
3.1.1 Protected Areas ...................................................................................................................... 30
3.1.2 World Heritage Sites ............................................................................................................... 30
3.1.3 Conservation Areas ................................................................................................................. 30
3.1.4 Protected Area and World Heritage Site Buffers ................................................................... 30
3.1.5 Ramsar Sites ........................................................................................................................... 31
3.1.6 Transfrontier Conservation Areas .......................................................................................... 31
3.2 KZN Conservation Strategies .................................................................................................. 32
3.2.1 KZN Protected Area Expansion ............................................................................................... 32
3.2.2 KZN Stewardship Programme ................................................................................................. 32
3.2.3 Identification and Mapping of Important Biodiversity Areas ................................................. 32
3.3 Zululand District Protected Areas and Conservation Mechanisms ........................................ 34

Biodiversity Sector Plan - Zululand District Municipality 2015
Octob e r 2 015 - Ve rs io n 2 .0 V I I
3.3.1 Protected Areas and Conservation Areas ............................................................................... 34
3.3.2 Transfrontier Conservation Areas .......................................................................................... 35
4 Biodiversity Mapping of the Region ............................................................................... 37
4.1 Purpose and Terminology....................................................................................................... 37
4.1.1 Difference between CBA/ESA categories in the KZN Biodiversity Plan, Biodiversity Sector
Plans and Systematic Conservation ..................................................................................... 39
4.2 Methodology .......................................................................................................................... 39
4.2.1 Guiding principles utilised in the mapping of key biodiversity areas ..................................... 39
4.2.2 Systematic Conservation Assessment .................................................................................... 40
4.2.3 KZN Biodiversity Plan .............................................................................................................. 40
4.2.4 District Level Biodiversity Sector Plan .................................................................................... 43
4.2.5 Local scale input into the Zululand District map .................................................................... 43
4.3 Critical Biodiversity Areas ....................................................................................................... 45
4.3.1 Terrestrial CBAs ...................................................................................................................... 45
4.3.2 Aquatic CBAs ........................................................................................................................... 45
4.4 Landscape and local corridors ................................................................................................ 48
4.4.1 Terrestrial Corridors ............................................................................................................... 48
4.4.2 Aquatic Corridors .................................................................................................................... 49
4.5 Ecological Support Areas ........................................................................................................ 50
4.5.1 Terrestrial ESAs ....................................................................................................................... 50
4.5.2 Aquatic ESAs ........................................................................................................................... 50
4.6 Ecological Infrastructure ......................................................................................................... 51
4.7 Zululand District Biodiversity Sector Plan Map ...................................................................... 53
4.8 Cross Links with Adjacent Municipalities ............................................................................... 53
5 Biodiversity Land Management Guidelines .................................................................... 55
6 Competing land uses and activities that threaten CBAs and ESAs within the Zululand
District ......................................................................................................................... 63
6.1 Land uses ................................................................................................................................ 64
6.2 Invasive alien species.............................................................................................................. 68
6.3 Soil erosion potential .............................................................................................................. 68
6.4 Climate change ....................................................................................................................... 70
6.4.1 Impacts of climate change on biodiversity and ecosystem services ...................................... 71
6.4.2 Mitigation of climate change impacts on biodiversity and ecosystem services .................... 72
7 Conclusions and recommendations ............................................................................... 73
8 References ................................................................................................................... 74
List of appendices
Appendix 1: Buffers used in the formation of CBAs and ESAs ........................................................................... 77
Appendix 2: Metadata list for spatial information used in the mapping procedures for development of the
Zululand District Municipality Biodiversity Sector Plan ................................................................. 79
Appendix 3: Local Stakeholder and Expert input ............................................................................................... 80

Biodiversity Sector Plan - Zululand District Municipality 2015
Octob e r 2 015 - Ve rs io n 2 .0 V I I I
List of figures
Figure 1-1: Zululand District Regional Map ........................................................................................................ 3
Figure 1-2: Flow chart summarising the position and role of a Biodiversity Sector Plan ................................... 5
Figure 2-1: Mean Annual Precipitation (MAP) for the Zululand District Municipality ....................................... 9
Figure 2-2: Digital elevation model of the Zululand District (derived from a 20m DEM) ................................. 10
Figure 2-3: Geology of Zululand District .......................................................................................................... 13
Figure 2-4: Hydrology of the Zululand District ................................................................................................. 14
Figure 2-5: Land cover of the Zululand District ................................................................................................ 20
Figure 2-6 Transformation of natural areas within the Zululand District........................................................ 21
Figure 2-7: Agricultural Potential Map ............................................................................................................. 23
Figure 2-8: Spatial extent and distribution of vegetation types in the Zululand District ................................. 24
Figure 2-9: Threatened Ecosystems within Zululand District ........................................................................... 27
Figure 3-1: Protected areas and other conservation areas within the Zululand District ................................. 33
Figure 3-2 Proposed Transfrontier Parks affecting the Zululand District ........................................................ 36
Figure 4-1: Flow diagram of CBA Categories in the SCA, BSP and KZN BP Mapping Process ........................... 38
Figure 4-2 Flow diagram for Development of KZN Biodiversity Plans ............................................................. 41
Figure 4-3 Terrestrial Critical Biodiversity Areas (CBAs) and Ecological Support Areas (ESAs) of the
Zululand District ............................................................................................................................. 44
Figure 4-4 Aquatic Critical Biodiversity Areas (CBAs) and Ecological Support Areas (ESAs) of the Zululand
District ............................................................................................................................................ 46
Figure 4-5 Landscape and Local Corridors of the Zululand District ................................................................. 47
Figure 4-6 Ecological Infrastructure in Zululand District ................................................................................. 52
Figure 4-7 Zululand Biodiversity Sector Plan Map .......................................................................................... 54
Figure 5-1: Tiered Lands Use Categories .......................................................................................................... 57
Figure 6-1 Soil erosion potential for Zululand District .................................................................................... 69
List of tables
Table 2-1 Conservation status and extent of vegetation types in the Zululand District ................................ 25
Table 2-2: Threatened terrestrial ecosystems within the Zululand District. ................................................... 26
Table 3-1: Protected areas and other conservation areas within the Zululand District ................................. 34
Table 4-1: Spatial data allocation in the development of the Critical Biodiversity Area and Ecological
Support Area Maps ........................................................................................................................ 42
Table 5-1: Land Use Management Objectives for the Terrestrial and Aquatic Conservation Categories ....... 56
Table 5-2: Land Use Management Practices and Controls ............................................................................. 58
Table 5-3: Terrestrial and Aquatic Land Use Management Guidelines ........................................................... 62

Biodiversity Sector Plan - Zululand District Municipality 2015
Octob e r 2 015 - Ve rs io n 2 .0 I X
List of boxes
Box 1 What is a bioregional plan? .......................................................................................................................... 1
Box 2 What is biodiversity and why is it important? .............................................................................................. 4
Box 3 Key biodiversity management priorities at municipal level ........................................................................ 63
Biodiversity Sector Plan - Zululand District Municipality 2015
Octob e r 2 015 - Ve rs io n 2 .0 X
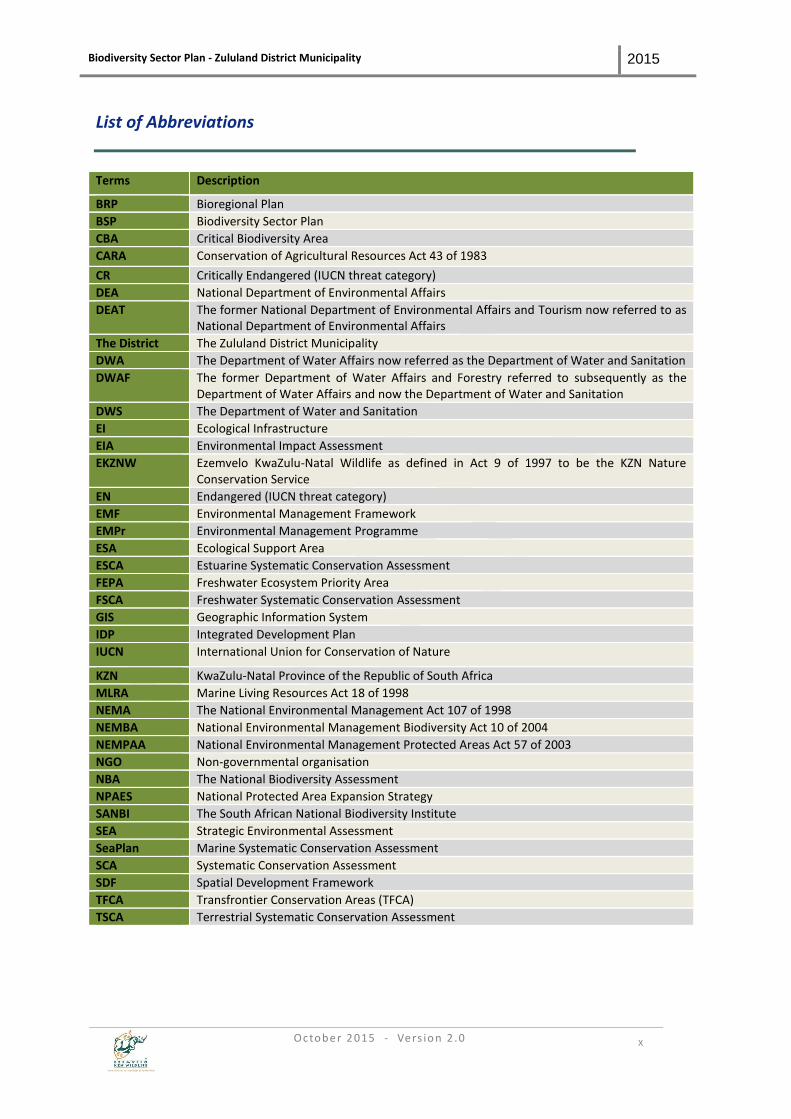
List of Abbreviations
Terms Description
BRP Bioregional Plan
BSP Biodiversity Sector Plan
CBA Critical Biodiversity Area
CARA Conservation of Agricultural Resources Act 43 of 1983
CR Critically Endangered (IUCN threat category)
DEA National Department of Environmental Affairs
DEAT The former National Department of Environmental Affairs and Tourism now referred to as National Department of Environmental Affairs
The District The Zululand District Municipality
DWA The Department of Water Affairs now referred as the Department of Water and Sanitation
DWAF The former Department of Water Affairs and Forestry referred to subsequently as the Department of Water Affairs and now the Department of Water and Sanitation
DWS The Department of Water and Sanitation
EI Ecological Infrastructure
EIA Environmental Impact Assessment
EKZNW Ezemvelo KwaZulu-Natal Wildlife as defined in Act 9 of 1997 to be the KZN Nature Conservation Service
EN Endangered (IUCN threat category)
EMF Environmental Management Framework
EMPr Environmental Management Programme
ESA Ecological Support Area
ESCA Estuarine Systematic Conservation Assessment
FEPA Freshwater Ecosystem Priority Area
FSCA Freshwater Systematic Conservation Assessment
GIS Geographic Information System
IDP Integrated Development Plan
IUCN International Union for Conservation of Nature
KZN KwaZulu-Natal Province of the Republic of South Africa
MLRA Marine Living Resources Act 18 of 1998
NEMA The National Environmental Management Act 107 of 1998
NEMBA National Environmental Management Biodiversity Act 10 of 2004
NEMPAA National Environmental Management Protected Areas Act 57 of 2003
NGO Non-governmental organisation
NBA The National Biodiversity Assessment
NPAES National Protected Area Expansion Strategy
SANBI The South African National Biodiversity Institute
SEA Strategic Environmental Assessment
SeaPlan Marine Systematic Conservation Assessment
SCA Systematic Conservation Assessment
SDF Spatial Development Framework
TFCA Transfrontier Conservation Areas (TFCA)
TSCA Terrestrial Systematic Conservation Assessment

Biodiversity Sector Plan - Zululand District Municipality 2015
Octob e r 2 015 - Ve rs io n 2 .0 X I
Definition of Terms
The definition of terms below is adapted from the KZN Biodiversity Spatial Planning Terms &
Processes (EKZNW 2014).
Term Description
Bioregional Plan (BRP)
A district based plan which identifies priority biodiversity areas (CBAs and ESAs) and provides associated planning and decision-making guidelines for a range of sectors whose actions, policies and decisions impact on biodiversity. Once adopted, the BRP has to be considered in all the planning and assessment tools used within a bioregion. Bioregions have been identified as a District Municipality.
Biodiversity Sector Plan (BSP)
A precursor to the BRP which includes a biodiversity priorities area map and associated management guidelines. BSPs incorporate provincial biodiversity conservation priorities and other available information to determine the Critical Biodiversity Areas (CBA) and Ecological Support Areas (ESA) within a bioregion which is then used for the development of a Bioregional Plan.
Buffers There are three main forms of buffer which are considered in the creation of the KZN Biodiversity Planning process; namely those that reflect land-use management guideline principals associated with agreements and/or conventions, those that must be considered in order to better reflect a mapped feature (e.g., buffer a river line to more accurately reflect the width aspect associated with the feature in question), and those that are associated with geographical feature and/or a specific species that are required to ensure the persistence of that feature or specific species.
Critical Biodiversity Area (CBA)
Natural or near-natural features, habitats or landscapes that include terrestrial, aquatic and marine areas that are considered critical for (i) meeting national and provincial biodiversity targets and thresholds (ii) safeguarding areas required to ensure the persistence and functioning of species and ecosystems, including the delivery of ecosystem services; and/or (iii) conserving important locations for biodiversity features or rare species. Conservation of these areas is crucial, in that if these areas are not maintained in a natural or near-natural state, biodiversity conservation targets cannot be met.
CBA: Expert Input Areas of natural or near natural state which are identified by local experts as being of high biodiversity importance based on the feature’s uniqueness, rarity and/ or critical endangered threat status, and where the suitability and condition has been verified or there is high confidence in the data.
CBA Irreplaceable Areas considered critical for meeting biodiversity targets and thresholds, and which are required to ensure the persistence of viable populations of species and the functionality of ecosystems. This category is a combination of three subcategories, namely CBA: Irreplaceable (SCA), CBA: Irreplaceable linkage and CBA: Expert Input (refer to Figure 4-1).
CBA Irreplaceable (SCA)
Areas which are required to meet biodiversity conservation targets, and where there are no alternative sites available. (Category driven by species and feature presence). Derived from the Systematic Conservation Assessment and is a combination of the SCA subcategories, CBA Irreplaceable and CBA High Irreplacabillty (refer to Figure 4-1)
CBA Irreplaceable: SCA-Subcategory Irreplaceable
Areas identified as having an Irreplaceability value of 1, these planning units represent the only localities for which the conservation targets for one or more of the biodiversity features contained within can be achieved i.e. there are no alternative sites available (refer to Figure 4-1)..
CBA Irreplaceable: SCA Subcategory High Irreplaceable
Areas of significantly high biodiversity value. In C-Plan analyses, these areas are identifiable as having an Irreplaceability scores of >= 0.8 and <1.0 whilst the MARXAN equivalent is reflected in PU’s displaying a selection frequency value of between 80 – 100% (refer to Figure 4-1).
Biodiversity Sector Plan - Zululand District Municipality 2015
Octob e r 2 015 - Ve rs io n 2 .0 X I I
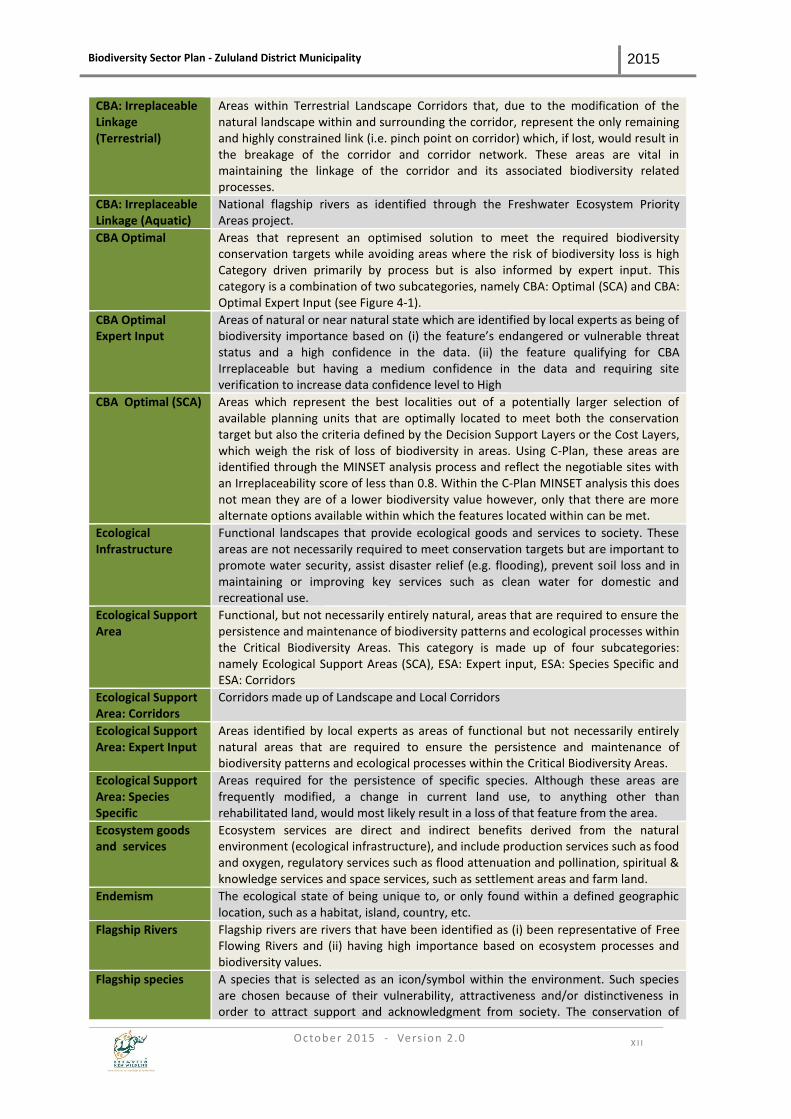
CBA: Irreplaceable Linkage (Terrestrial)
Areas within Terrestrial Landscape Corridors that, due to the modification of the natural landscape within and surrounding the corridor, represent the only remaining and highly constrained link (i.e. pinch point on corridor) which, if lost, would result in the breakage of the corridor and corridor network. These areas are vital in maintaining the linkage of the corridor and its associated biodiversity related processes.
CBA: Irreplaceable Linkage (Aquatic)
National flagship rivers as identified through the Freshwater Ecosystem Priority Areas project.
CBA Optimal Areas that represent an optimised solution to meet the required biodiversity conservation targets while avoiding areas where the risk of biodiversity loss is high Category driven primarily by process but is also informed by expert input. This category is a combination of two subcategories, namely CBA: Optimal (SCA) and CBA: Optimal Expert Input (see Figure 4-1).
CBA Optimal Expert Input
Areas of natural or near natural state which are identified by local experts as being of biodiversity importance based on (i) the feature’s endangered or vulnerable threat status and a high confidence in the data. (ii) the feature qualifying for CBA Irreplaceable but having a medium confidence in the data and requiring site verification to increase data confidence level to High
CBA Optimal (SCA) Areas which represent the best localities out of a potentially larger selection of available planning units that are optimally located to meet both the conservation target but also the criteria defined by the Decision Support Layers or the Cost Layers, which weigh the risk of loss of biodiversity in areas. Using C-Plan, these areas are identified through the MINSET analysis process and reflect the negotiable sites with an Irreplaceability score of less than 0.8. Within the C-Plan MINSET analysis this does not mean they are of a lower biodiversity value however, only that there are more alternate options available within which the features located within can be met.
Ecological Infrastructure
Functional landscapes that provide ecological goods and services to society. These areas are not necessarily required to meet conservation targets but are important to promote water security, assist disaster relief (e.g. flooding), prevent soil loss and in maintaining or improving key services such as clean water for domestic and recreational use.
Ecological Support Area
Functional, but not necessarily entirely natural, areas that are required to ensure the persistence and maintenance of biodiversity patterns and ecological processes within the Critical Biodiversity Areas. This category is made up of four subcategories: namely Ecological Support Areas (SCA), ESA: Expert input, ESA: Species Specific and ESA: Corridors
Ecological Support Area: Corridors
Corridors made up of Landscape and Local Corridors
Ecological Support Area: Expert Input
Areas identified by local experts as areas of functional but not necessarily entirely natural areas that are required to ensure the persistence and maintenance of biodiversity patterns and ecological processes within the Critical Biodiversity Areas.
Ecological Support Area: Species Specific
Areas required for the persistence of specific species. Although these areas are frequently modified, a change in current land use, to anything other than rehabilitated land, would most likely result in a loss of that feature from the area.
Ecosystem goods and services
Ecosystem services are direct and indirect benefits derived from the natural environment (ecological infrastructure), and include production services such as food and oxygen, regulatory services such as flood attenuation and pollination, spiritual & knowledge services and space services, such as settlement areas and farm land.
Endemism The ecological state of being unique to, or only found within a defined geographic location, such as a habitat, island, country, etc.
Flagship Rivers Flagship rivers are rivers that have been identified as (i) been representative of Free Flowing Rivers and (ii) having high importance based on ecosystem processes and biodiversity values.
Flagship species A species that is selected as an icon/symbol within the environment. Such species are chosen because of their vulnerability, attractiveness and/or distinctiveness in order to attract support and acknowledgment from society. The conservation of

Biodiversity Sector Plan - Zululand District Municipality 2015
Octob e r 2 015 - Ve rs io n 2 .0 X I I I
specific habitats and ecosystems to support such species provides for the protection of the other less charismatic species within the area.
Free Flowing Rivers Free flowing rivers are rivers that flow undisturbed (not dammed/impounded) from its source to the confluence with another large river or to the sea. Where such a river must be permanent or seasonal flowing and have an ‘A or B’ ecological category (good condition), with inland rivers have a minimum length of 50km (Driver, A et al 2011)
Freshwater Ecosystem Priority Areas
Freshwater Ecosystem Priority Areas (FEPAs) are strategic spatial priorities for conserving freshwater ecosystems and supporting sustainable use of water resources. The National Freshwater Ecosystem Priority Areas Project determined the FEPAs through a process of systematic biodiversity planning and expert input, using a range of criteria dealing with maintenance of key ecological processes and the conservation of ecosystem types and species associated with rivers, wetlands and estuaries.
High Potential Agricultural land
Land having the soil and terrain quality, growing season and available moisture supply needed to produce sustained high yields of crops (cash crops or planted pastures) economically when treated and managed according to best possible farming practices (Collett & Mitchell, 2012).
Landscape Corridors
A series of bio-geographic corridors created in KZN to facilitate ecological and climate change processes to create a linked landscape for the conservation of species in a fragmented landscape.
Landscape Corridors: Aquatic
Aquatic landscape corridors are to facilitate movement of aquatic species and are
the KZN Flagship Rivers.
Landscape Corridors: Terrestrial
A series of altitudinal and biogeographic corridors to facilitate, ecological and climate change processes and to create a linked landscape for the conservation of species in a fragmented landscape.
Local Corridors Terrestrial and Aquatic corridors developed at a District scale to create fine scale links within the landscape that facilitates ecological processes and ensure persistence of critical biodiversity features.
MinSet Produced using C-Plan software, this product represents the optimised solution (or minimal reserve configuration) required to meet the conservation targets of the features included within the plan.
National Threatened Ecosystems
National Threatened Ecosystems are provided for in the National Environmental Management: Biodiversity Act (Act 10 of 2004), these areas represent threatened and protected ecosystems categorised according to one of four categories (Critically Endangered, Endangered, Vulnerable and Protected Ecosystems). Within this Act, it is stated that both Critically Endangered and Endangered Ecosystems must be considered as part of Critical Biodiversity Areas.
Protected Area Formally Protected Areas declared under NEMPAA. Such areas form the backbone of the conservation network and are critical in their contribution to the achievement of conservation objectives in the Province.
Red List Identifies the status of threatened species in terms of threat categories, namely: Critically Endangered, Endangered, Vulnerable, Near Threatened and Data Deficient.
Systematic Conservation Assessment
An approach to conservation that prioritises actions by setting quantitative targets for biodiversity features such as broad habitat units or vegetation types. It is premised on conserving a representative sample of biodiversity pattern, including species and habitats (the principle of representation), as well as the ecological and evolutionary processes that maintain biodiversity over time (the principle of persistence).

Biodiversity Sector Plan - Zululand District Municipality 2015
Octob e r 2 015 - Ve rs io n 2 .0 1
1. Introduction
The KwaZulu-Natal Nature Conservation Board, trading as
Ezemvelo KZN Wildlife, is the Nature Conservation Agency in the
province of KwaZulu-Natal. Its core disciplines are biodiversity
conservation, wise and sustainable use of natural resources, the
creation and management of partnerships with stakeholders and
communities and the provision of affordable eco-tourism
destinations within the Province.
The National Environmental Management Biodiversity Act, 2004
(Act 10 of 2004, ‘NEMBA’) introduced several planning tools
which will assist Ezemvelo KZN Wildlife to give effect to this core
mandate, including the publication of bioregional plans (see Box
1). These bioregional plans are required to be undertaken for each
of the geographically determined bioregions, which have been
defined by the National Department of Environmental Affairs as
the ‘District Municipality’. KwaZulu-Natal (KZN) has 11 District
Municipalities and plans are to be developed for each of these
districts.
In the province of KZN, a conscious decision was taken that a
Biodiversity Sector Plan (BSP) must be developed as a precursor to
a Bioregional Plan (BRP). The reason behind this was the identified
need for KZN to clearly set out the baseline for the conservation
priorities in each of the Districts, before interacting with the
various other sector plans, IDPs and SDFs as required by S48 of
NEMBA and the Bioregional Guidelines (DEAT 2009). As such, the
BSP for the Zululand District Municipality complies with SANBI’s
Bioregional Planning terminology and requirements as well as the
guidelines for the development of Bioregional Plans (DEAT 2009).
As an intermediate product the BSP does not however reflect the
interaction with other sector planning tools and the gazetting of
the document.
Box 1 What is a bioregional plan? A bioregional plan is required in terms of Section
40 of the National Environmental Management
Biodiversity Act, 2004.
The purpose of a bioregional plan is to provide
a map of biodiversity priorities with
accompanying land use planning and decision
making guidelines, to inform land use planning,
environmental assessment and decisions, as well
as natural resource management by a range of
sectors whose policies and decision impact on
biodiversity
To be noted that a bioregional plan is NOT in
itself a multi-sectoral planning or assessment
tool, but rather is the biodiversity sector’s input
into other planning and assessment processes.
The legal force and effect of publishing a
bioregional plan is found in its impact on other
plans which are prepared after the bioregional
plan is in force, as other plans are required to be
co-ordinated and aligned with a published
bioregional plan. (DEAT, 2009)
Biodiversity Sector Plan - Zululand District Municipality 2015
Octob e r 2 015 - Ve rs io n 2 .0 2
The Zululand Biodiversity Sector Plan comprises of three main products:
1. A report which includes:
a. Descriptions and maps detailing the biophysical characteristics of the District.
b. Descriptions of methodology employed and protocols followed in the development and
identification of the Critical Biodiversity Areas and Ecological Support Areas.
c. Recommended land use guidelines for biodiversity feature areas.
2. A digital map of the Zululand District summarising the biodiversity priorities, linkages and
management guidelines of the Biodiversity Sector Plan.
3. A supporting GIS layer containing biodiversity features.
1.1 Description of the study area
Zululand, one of ten district municipalities in KwaZulu-Natal, is located in the northern regions of the
Province. The municipality covers an area of approximately 14 810 km², with approximately half of
the area being under the jurisdiction of traditional authorities while the remainder comprises
predominantly commercially-owned farms and conservation areas. The District comprises five local
municipalities, namely: eDumbe (KZ 261); uPhongola (KZ 262); Abaqulusi (KZ 263); Nongoma (KZ
265); and Ulundi (KZ 266) (Zululand District Municipality 2013)(see Figure 1-1)
Vryheid (Abaqulusi Municipality) and Ulundi (Ulundi Municipality) are the two main towns in the
district. Pongola and Paulpietersburg (eDumbe Municipality) are small towns, which act as service
centres, while Nongoma (Nongoma Municipality) fulfils the same role, but with far fewer and lower
order services.
The district is home to a rich cultural diversity and numerous sites of historical significance,
specifically relating to the Zulu nation. It has historically been and is still the home of the Zulu
monarch. Cultural and historical conservation efforts are mainly focused in the Ulundi area and in
eMakhosini, which is known as “the Valley of the Zulu Kings”.
There are three main catchments in the District namely: the Pongola in the North; the Mkuze in the
Central areas, and the Mfolozi in the South.
Section 2 below provides a biophysical overview of the Zululand District Municipality and Section 3
details of existing protected and conservation areas.
Biodiversity Sector Plan - Zululand District Municipality 2015
Octob e r 2 015 - Ve rs io n 2 .0 3
Figure 1-1: Zululand District Regional Map

Biodiversity Sector Plan - Zululand District Municipality 2015
Octob e r 2 015 - Ve rs io n 2 .0 4
1.2 Aim and Objectives of the Biodiversity
Sector Plan
The aim of the Biodiversity Sector Plan for the Zululand District
Municipality is to:
Identify and map critical biodiversity assets in the District.
Provide associated management guidelines which aim
to maintain the integrity of these biodiversity features.
The objectives of the Zululand Biodiversity Sector Plan are to:
Ensure aquatic and terrestrial biodiversity targets are met at
the District level.
Conserve representative samples of biodiversity pattern.
Conserve the ecological and evolutionary processes that
allow biodiversity to persist over time; and
Serve as a first step towards the development of a
Bioregional Plan.
1.3 Purpose of a Biodiversity Sector Plan
The key purpose of this BSP is to assist and guide land use
planners and managers within the Zululand District and its
respective local municipalities, to account for biodiversity
conservation priorities in all land use planning and
management decisions, thereby promoting sustainable
development and the protection of biodiversity, and in turn the
protection of ecological infrastructure and associated
ecosystem services (see Box 2 for further details on biodiversity
and its importance).
Figure 1-2 forms a flow chart illustrating the position and role
of the BSP within biodiversity conservation and municipal
structures. The figure illustrates the sequential development,
with the Systematic Conservation Assessment products feeding
into the development of the KZN Biodiversity Plan. The BSP in
turn is informed by the KZN Biodiversity, with the provincial
Critical Biodiversity Areas (CBAs) and Ecological Support Areas
being further tailored to the District through additional
information sources to develop district CBAs and ESAs and
associated land use guidelines. The BSP then feeds into the
development of a BRP for the bioregion, as legislated by the
NEMBA, which in turn feeds into all land use planning and
management decisions and tools within the district and its local municipal areas (DEAT 2009).
Box 2 What is biodiversity and why
is it important? The National Environmental Management: Biodiversity Act (Act 10 of 2004) defines biodiversity as: “the variability among living organisms from all sources including, terrestrial, marine and other aquatic ecosystems and the ecological complexes of which they are part and also includes diversity within species, between species, and of ecosystems.” Thus the term biodiversity covers everything from the smallest organisms to biophysical landscapes, encompassing all species of plants and animals, ecosystems, landscapes, water and soil and the networks, links and ecological and evolutionary processes that makes life possible and sustainable.
Ecosystem Services
Maintaining intact and functioning biodiversity features is essential for the maintenance of the ecological infrastructure, which supply the ecosystem services upon which all life and industry depend. Ecosystem services are direct and indirect benefits, and include: maintenance of clean water and air. regulation and control of climate,
streamflow, erosion, disease, floodwaters and carbon storage (limiting global warming).
food, fuel and fibre and genetic resources.
spiritual, recreational, aesthetic, inspirational, educational, and community.
Biodiversity also provides an important basis for social and economic growth and development by providing the biophysical landscape and ecological processes essential for human socio-economic well being, such as commercial and subsistence agriculture (food security), industrial materials, fishing, tourism, recreation and both commercial and indigenous medicinal use and development. Loss of biodiversity therefore places the economy and our quality of life at risk, particularly for those who are already living under adverse socio-economic conditions, and relying heavily on the environment for daily subsistence. The loss of biodiversity also reduces the scope of possibilities for future generations to overcome socio-economic challenges.

Biodiversity Sector Plan - Zululand District Municipality 2015
Octob e r 2 015 - Ve rs io n 2 .0 5
Figure 1-2: Flow chart summarising the position and role of a Biodiversity Sector Plan
The Zululand District does not however have to delay the incorporation of biodiversity information
into its planning tools and decision until the development of a BRP, as this BSP incorporates much of
the information that will form the BRP. The BSP should thus be utilised to inform the environmental
planning section of the Spatial Development Framework (SDF) for the District and any SDFs
developed for each of the four Local Municipalities in the District. The maps and land use guidelines
of the BSP should also be consulted during formulation of the Integrated Development Plans (IDPs)
of the respective municipalities thus ensuring that environmental considerations are fully accounted
for within land use planning processes, especially within the identified CBAs and ESAs. The BSP
should also feed into the development of wall-to-wall schemes required under the KZN Planning and
Development Act, 2008 (Act 6 of 2008).
Local governments are well positioned in terms of contributing positively to biodiversity
conservation through implementing effective biodiversity management, particularly since
municipalities provide the platform for regulating the interface between people and demand
management for ecosystem goods and services. It is at this level of governance, which is closest to
local communities that community-municipal partnerships can act as key agents for change toward
sustainable development (Laros and Jones 2010). As a result of the challenges related to service
Ezemvelo KZN Wildlife
Systematic Conservation
Planning
•Provincial scale mapping of priority conservation areas
•Marine SCP
•Estuarine SCP
•Freshwater SCP
•Terrestrial SCP
KZN Biodiversity
Plan
•Provincial scale plan
•Critical Biodiversity Areas
•Ecological Support Areas
Biodiversity Sector Plan
•District Scale
•Critical Biodiversity Areas
•Ecological Support Areas
•Land use guidelines
Bioregional Plan
•A legislated requirement of the
Biodiversity Act
•Developed per district municipality
Municipal Planning
•Decision making
•State of Environment reports
•Land use zoning
•Integrated Development Plans (IDP)
•Spatial Development Frameworks (SDF)
•Environmental Management
Frameworks (EMF)
•Strategic Environmental Assessments (SEA)
•Coastal Management Plans
•Estuarine Management Plans
•Environmental Impact Assessments (EIA)
Copyright

Biodiversity Sector Plan - Zululand District Municipality 2015
Octob e r 2 015 - Ve rs io n 2 .0 6
delivery and resources management at this level, local communities and municipalities also stand to
be the key beneficiaries of sustainable development initiatives.
The Zululand BSP therefore serves to fulfil the following purposes:
Provide a spatial dataset to inform municipal planning regarding land use and biodiversity
management, land use change decision making and the development of planning frameworks,
such as IDPs, SDFs, EMFs, SEAs and also EIAs.
Provide biodiversity information which is easily accessible for utilisation by Local
Municipalities within the Zululand District Municipality, other government departments that
have jurisdiction within the district, NGOs, environmental practioners and other stakeholders.
Provide land use and management guidelines for relevant stakeholders to best maintain and
protect critical biodiversity areas.
Create awareness of the unique biodiversity in the area, the value this biodiversity represents
to people as well as the management mechanisms that should ensure its protection and
sustainable utilisation.
Provide a reference tool for guiding stakeholders and Ezemvelo staff regarding focus areas for
biodiversity management programmes, plans and projects within the District.
Provide a platform for further biodiversity investigation and understanding within the District.
1.4 Legal Background
The Bill of Rights in the South African Constitution applies to all law and is binding on all organs of
state. The Environmental Rights set out in Section 24 of the Bill of Rights guarantees that everyone
has the right to:
(a) An environment that is not harmful to their health or well-being; and
(b) Have the environment protected, for the benefit of present and future generations, through
reasonable legislative and other measures that;
(i) prevent pollution and ecological degrading;
(ii) promote conservation; and
(iii) secure ecologically sustainable development and use of natural resources while
promoting justifiable economic and social development.
The National Environment Management Act, 1998 (Act 107 of 1998, ‘NEMA’) legislates that all
organs of state are obliged to take biological diversity into account during management and planning
decisions, which must be informed by current information. Under NEMA all organs of state must co-
operate with, consult and support one another, and principles which must be adopted by organs of
state include sustainable development approaches which avoid disturbance to ecosystems and loss
of biological diversity and that negative impacts to the environment are anticipated and prevented.
NEMA also requires intergovernmental co-ordination and harmonisation of policies, legislation and
actions relating to the environment. BSPs and BRPs enable and support municipal and other organs
of state by providing an outline of Critical Biodiversity Areas and associated land use guidelines
which can be used by all sectors as a common reference, aiding multi-sectoral planning processes.
Copyright

Biodiversity Sector Plan - Zululand District Municipality 2015
Octob e r 2 015 - Ve rs io n 2 .0 7
The publication of BRPs, of which the BSPs are a precursor, forms a legislated requirement of the
National Environmental Management: Biodiversity Act, 2004 (Act 10 of 2004, S40) (NEMBA). The
Act also legislates the declaration of “bioregions”, which have been designated as District
Municipalities, each of which require a BRP aiming to provide for:
integrated and coordinated biodiversity planning;
monitoring of the conservation status of various components of biodiversity; and
the promotion of biodiversity research (DEAT 2009).
To facilitate co-operative governance NEMBA requires that such plans are coordinated with the
municipal and district IDPs and SDFs and other planning tools within the province. NEMBA, in line
with S24 of the Municipal Systems Act, 2000 (Act 32 of 2000), further requires that all IDPs and SDFs
developed by municipalities and districts must be aligned with and compliment the biodiversity
planning tools.
1.5 Intended Users of the Biodiversity Sector Plan
Intended users include municipal officials, spatial planning and environmental professionals,
Catchment Management Agencies, national and KZN provincial departments covering the
environment, agriculture, water, housing, public works, rural development, land reform, energy,
mineral resources and all other organs of state preparing departmental policies, environmental
management instruments and guidelines relevant to environmental management or Environmental
Impact Assessment regulations. The scope of users can also include private landowners, real estate
developers, the general public, conservation NGOs and programmes such as Working for Water,
Working for Wetlands, Land Care, etc.
In summary intended users include:
Local and District Municipality officials
An organ of state that must prepare an environmental implementation plan (EIP) or
environmental management plan (EMP) in terms of Chapter 3 of NEMA
Environmental decision-makers who are required by section 2(1) (c) of NEMA to apply the
NEMA section 2 principles in their decision-making.
Government departments and authorities whose programs, decisions and actions impact on
biodiversity and the natural environment
Environmental Assessment Practitioners and Town Planners
Property developers
Mining and Agricultural Sector
Private Landowners
Conservation NGOs
KZN Conservation Agency, Ezemvelo KZN Wildlife

Biodiversity Sector Plan - Zululand District Municipality 2015
Octob e r 2 015 - Ve rs io n 2 .0 8
2 Biophysical overview of the Zululand District
Municipality
2.1 Physical characteristics
2.1.1 Climate
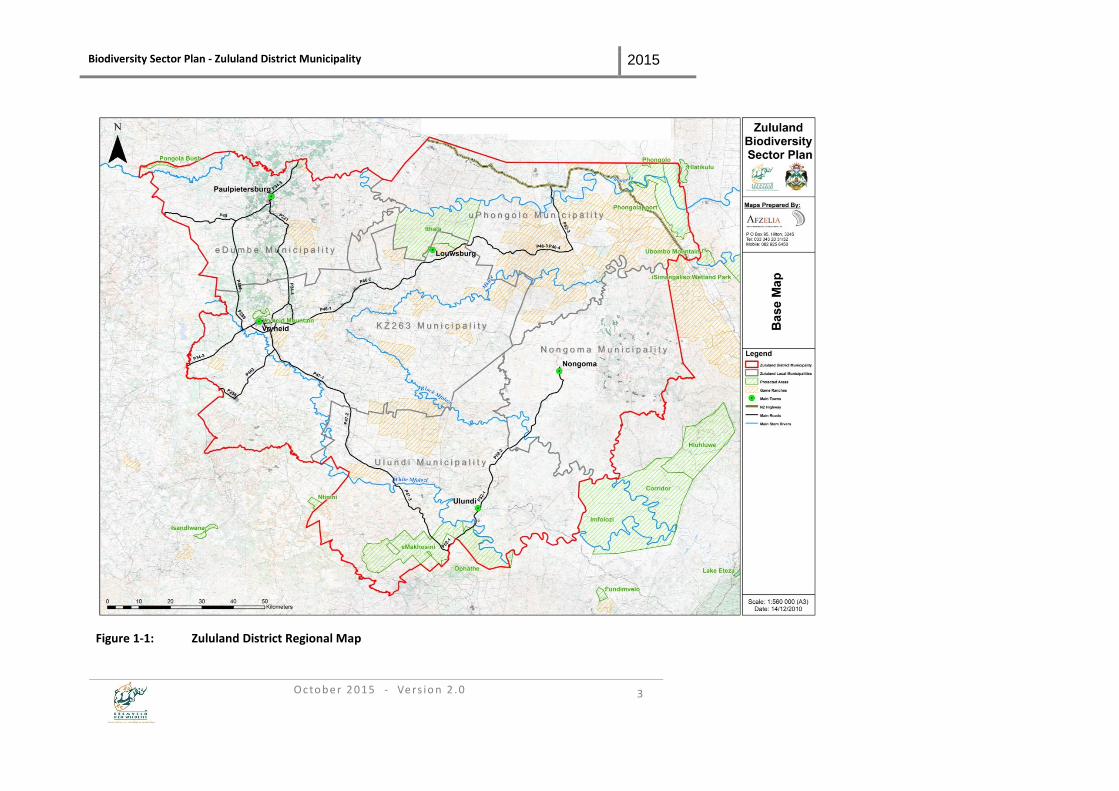
Varying climatic conditions prevail across the District. With the exception of some precipitation in
the south from cold fronts in winter (in the Zululand Lowveld and Mistbelt areas), the region is
subject to summer rainfall with dry winters, with rain predominantly falling in early summer, apart
from Ithala Quartzite Sourveld (peak rains in midsummer). Mean Annual Precipitation (MAP) ranges
from 493mm to 1682mm in the District (predominantly below 900mm in the District)(Figure 2-1),
with large scale variations over relatively short distances in certain areas (on account of
topographical influences). Rainfall in form of thunderstorms is the prevalent form of precipitation.
Mist is generally an uncommon feature and hail is almost absent across the majority of the in the
District. Summers are generally warm to hot, and winters are cool. Mean Annual Temperature
ranges generally from approximately 4oC to 20°C, temperatures generally become cooler moving
towards the west. Mean annual evaporation varies considerably in the District depending on the
relationship of rainfall and temperature.
Biodiversity Sector Plan - Zululand District Municipality 2015
Octob e r 2 015 - Ve rs io n 2 .0 9
Figure 2-1: Mean Annual Precipitation (MAP) for the Zululand District Municipality

Biodiversity Sector Plan - Zululand District Municipality 2015
Octob e r 2 015 - Ve rs io n 2 .0 10
Figure 2-2: Digital elevation model of the Zululand District (derived from a 20m DEM)

Biodiversity Sector Plan - Zululand District Municipality 2015
Octob e r 2 015 - Ve rs io n 2 .0 11
2.1.2 Topography
The Zululand District Municipality has significant diversity of relief that is determined by altitude,
slope position, aspect, climate, topography and geology, which translates into exceptional terrestrial
and aquatic biodiversity, species richness and endemicity. Geological formations in the District have
given rise to predominantly rugged terrain with high habitat heterogeneity across altitudinal
gradients. Conservation planning must incorporate the range of biophysical factors in order to retain
this high biodiversity.
On a provincial scale, the biophysical gradient is relatively pronounced in the Zululand District
Municipality, particularly as compared to coastal and southern municipalities in KwaZulu-Natal. The
highest areas comprise the western boundary of the District, with height generally increasing from
south to north along this boundary, the highest point comprising the extreme north-west corner of
the District (2068m). The lowest areas comprise the eastern of the District, with height generally
decreasing northwards and southwards from the centre of the eastern boundary. The lowest point
comprises the Jozini Dam and areas below the dam (approximately 480m a.s.l.), followed by a point
on the Black Mfolozi where it exits the District (see Figure 2-2).
The District is special in that it includes a central highland areas extending from the highland areas in
the west (predominantly a component of the Vryheid Formation), stretching towards Louwsburg in
the north and Nongoma to the east. The area between Vryheid, Paulpietersburg and Hlobane is
dotted with massive free standing sandstone hills like Ngcaka outside Luneburg where Pongola Bush
Nature Reserve is situated (2068m.a.s.l), Makateeskop (1736m a.s.l.), Dumbe Mountain (1535m
a.s.l.) and Hlobane (1627m a.s.l.). These highland areas extend into the central part of the District,
comprising altitudes generally between 1750m and 850m. The overall gradient is in a west to east
direction (see Figure 2-2). The District boundary ends just short of the Lebombo Mountains, but
includes critically important rivers that cut through this mountain range.
The landscape varies from very flat extensive plains, undulating and rolling landscapes, broad
valleys, wide and flat valley basins, rocky lowlands, low mountain ranges, steep to gentle slopes,
mountainous areas much incised by river gorges, ridges, scarps and plateaus. Topographical
variation includes diversity of aspect associated with the valleys and ridgelines crossing the District,
in places providing localised climate variability in cooler sheltered areas, offering fire refugia and
suitable habitat for forests (subridge scarps and moist sheltered kloofs). The central highland area
extending from the west has resulted in aspect and altitudinal variations across an exceptional
diversity of landforms (as described above).
Biophysical gradients extend in all directions, which have resulted in complex hydrological flow
patterns within the District. On a local scale hydrological flows are both towards and away from the
sea; however, the District includes a number of stem-rivers that generally flow eastwards towards
the sea. These rivers originate from the western watershed and the central highland area, flowing
through predominantly steep mountainous terrain and river valleys. Hydrological processes have
given rise to a number of koppies and ridgelines within flatter areas found in the western and to a
lesser extent the eastern parts of the District
Biodiversity Sector Plan - Zululand District Municipality 2015
Octob e r 2 015 - Ve rs io n 2 .0 12
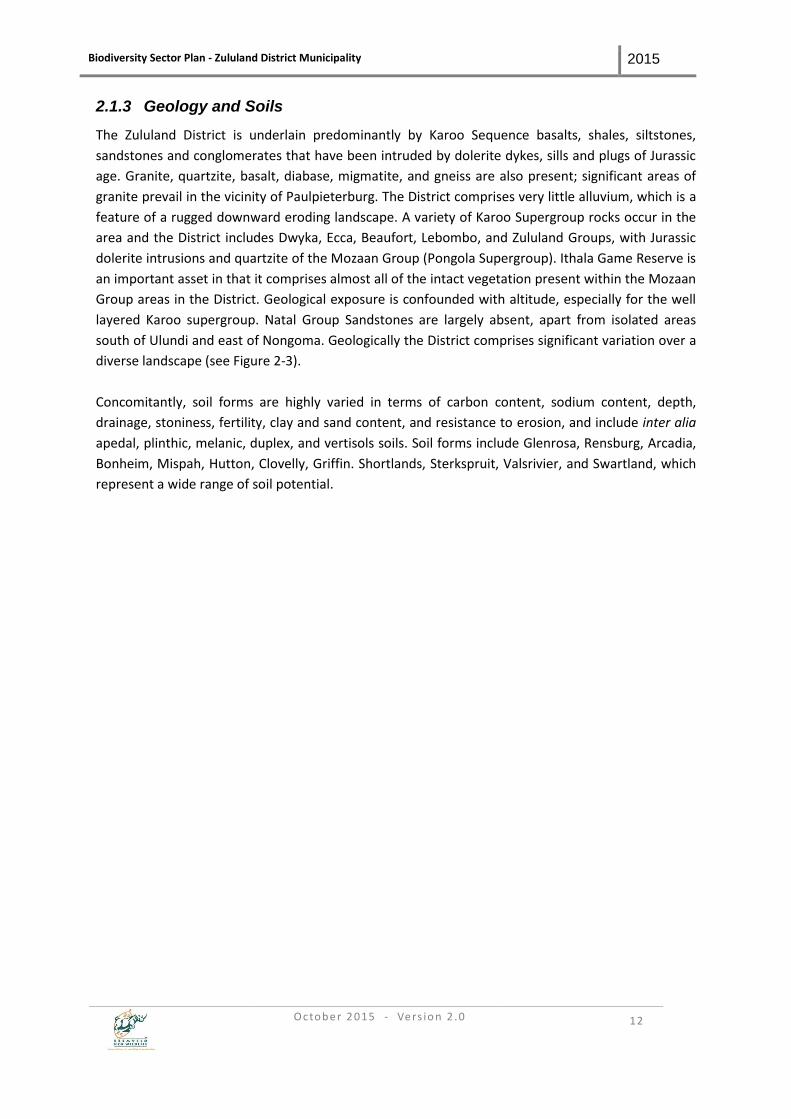
2.1.3 Geology and Soils
The Zululand District is underlain predominantly by Karoo Sequence basalts, shales, siltstones,
sandstones and conglomerates that have been intruded by dolerite dykes, sills and plugs of Jurassic
age. Granite, quartzite, basalt, diabase, migmatite, and gneiss are also present; significant areas of
granite prevail in the vicinity of Paulpieterburg. The District comprises very little alluvium, which is a
feature of a rugged downward eroding landscape. A variety of Karoo Supergroup rocks occur in the
area and the District includes Dwyka, Ecca, Beaufort, Lebombo, and Zululand Groups, with Jurassic
dolerite intrusions and quartzite of the Mozaan Group (Pongola Supergroup). Ithala Game Reserve is
an important asset in that it comprises almost all of the intact vegetation present within the Mozaan
Group areas in the District. Geological exposure is confounded with altitude, especially for the well
layered Karoo supergroup. Natal Group Sandstones are largely absent, apart from isolated areas
south of Ulundi and east of Nongoma. Geologically the District comprises significant variation over a
diverse landscape (see Figure 2-3).
Concomitantly, soil forms are highly varied in terms of carbon content, sodium content, depth,
drainage, stoniness, fertility, clay and sand content, and resistance to erosion, and include inter alia
apedal, plinthic, melanic, duplex, and vertisols soils. Soil forms include Glenrosa, Rensburg, Arcadia,
Bonheim, Mispah, Hutton, Clovelly, Griffin. Shortlands, Sterkspruit, Valsrivier, and Swartland, which
represent a wide range of soil potential.

Biodiversity Sector Plan - Zululand District Municipality 2015
Octob e r 2 015 - Ve rs io n 2 .0 13
Figure 2-3: Geology of Zululand District

Biodiversity Sector Plan - Zululand District Municipality 2015
Octob e r 2 015 - Ve rs io n 2 .0 14
Figure 2-4: Hydrology of the Zululand District

Biodiversity Sector Plan - Zululand District Municipality 2015
Octob e r 2 015 - Ve rs io n 2 .0 15
2.1.4 Hydrology
2.1.4.1 Wetlands
The wetland systems in the District are distributed in a complex mosaic, occupying a variety of
positions in the landscape across altitudinal gradients, ranging from open water bodies, vleis and
marshes, down to extensive wetlands associated with stream and river courses. (see Figure 2-4 ).
The wetlands in the District are critical for ensuring sustained water quality and quantity from the
major water catchments. Upper catchment wetlands, which play a key role in the hydrological cycle
of the catchment in the District, are of particular significance for the maintenance of regular
streamflow patterns, and acceptable water quality levels. The rivers and associated wetlands within
this District, particularly upper catchment wetlands, are of international, national, and provincial
importance, in providing water to Mozambique, Swaziland, KwaZulu-Natal and other provinces.
Apart from providing critical ecosystem goods and services, wetlands are also of major importance
for biodiversity, because of the variety of natural communities associated with them. The role of
wetlands is amplified in this District on account of widespread rural settlement and coal mining
activities.
Important wetlands in the District include the Blood River Vlei Wetland and Lenjane Wetland
System; the former is a recommended RAMSAR Site which is nationally listed as an Important
Birding Area and recognized as a unique birding area with all three Crane species recorded.
2.1.4.2 Rivers
The main rivers in the District are the Pongola, Mkuze and the Black and White Mfolozi. The Pongola
River flows from the Zululand District Municipality (with a portion of this catchment occurring within
Swaziland) through uMkhanyakude District Municipality and into Mozambique, where it becomes
the Maputo River. At the boundary between Zululand and uMkhanyakude, where the Pongola River
passes through the Lebombo Mountains, it has been dammed to form the Jozini Dam. The Mkuze
River flows into the St Lucia wetlands, whilst the Black and White Mfolozi confluence in uThungulu
District Municipality and flows into the St Lucia estuary just north of Richards Bay.
The District is therefore critical for the provision of good quality water to the Pongolapoort Nature
Reserve, Pongola Bush Nature Reserve, Ithala Game Reserve, Lake St Lucia, False Bay, eMakhosini-
Ophathe Heritage Park, Hluhluwe-iMfolozi Park, Mkhuze Game Reserve, and other smaller protected
areas, sustaining water resources within provincially and nationally important ecotourism
destinations. Water supply to some of the country’s best and arguably KZN’s best protected areas is
under significant threat. The water catchments within the District are also the key lifelines for
regional development, and are also of major significance for the industrial economy of KwaZulu-
Natal, specifically Richards Bay. Local water resource developments within the District are generally
small and relate primarily to the needs of farming communities, villages, and a number of towns.
The main surface water resources include the Bivane and Pongolapoort Dams that account for 88%
of the available water resources. In the natural state, the water quality is of a high standard.
However, localised water quality problems and health risks associated with the proximity of
settlements to resources and the lack of sanitation facilities occur within the region. Significant coal

Biodiversity Sector Plan - Zululand District Municipality 2015
Octob e r 2 015 - Ve rs io n 2 .0 16
mining areas also pose a significant threat. All the major catchment systems are stressed
catchments, with winter deficits posing significant threats to the ecological reserve.
The following is a breakdown of the most important catchments in the District.
The Mfolozi Catchments
The White Mfolozi catchment consists mostly of commercial farming in the northwest and
Traditional Council land in the southeast, with the main activity being cattle farming. Approximately
120 km2 of commercial forestry (or 2.5% of the land cover) and 30km2 of alien vegetation (less than
1% of the land cover) are situated in the upper reaches of the catchment. Only a small portion of the
catchment area is irrigated, estimated at about 8km2, downstream of Klipfontein Dam. Some
farmers have reduced their irrigation requirements because of the high cost of water. The Hluhluwe-
iMfolozi Park lies at the outlet of the catchments from the Zululand District Municipality. Significant
towns include Vryheid, Ulundi and Emondlo.
Water resources within the catchments are mostly undeveloped with the most significant being the
Klipfontein Dam in the upper reaches. This dam has a capacity of 19 million m3 and was constructed
to augment water supply to the towns of Vryheid and Ulundi. Provision was also made for irrigation
requirements. Vryheid receives water from Bloemveld and Grootwaagd Dams upstream from the
town, and to a lesser extent Klipfontein Dam. Ulundi receives water from an abstraction weir on the
White Mfolozi River. River yields are supplemented during low flows with releases from the
Klipfontein Dam, which is underutilized and has capacity. However, losses between Klipfontein Dam
and the Ulundi weir are large and this method of operation is not efficient.
A significant amount of water is transferred out of the lower White Mfolozi, just before it flows into
the sea, to the Mhlathuze catchments for mining use by Richards Bay Minerals. There is a deficit in
the lower White Mfolozi during the winter months. This deficit can possibly be overcome by releases
from Klipfontein Dam. However the analyses indicates that when the rural water demand increases
to 60lcd then there is a shortfall in supply from Klipfontein Dam. This may be resolved by either
provision of off channel storage at Ulundi or the reallocation of irrigation water use.
The Black Mfolozi catchments consist mostly of Traditional Authority land, with the main activity
being cattle farming. There is approximately 100km2 of commercial forestry (or 3% the land cover)
and 20km2 of alien vegetation (or less than 1% of the land cover) situated in the upper reaches of
the catchment. Only a small portion of the catchment area is irrigated, estimated at about 15 km2.
The Hluhluwe-iMfolozi Park lies at the outlet of the catchment from the Zululand District
Municipality.
The water resources of the Black Mfolozi catchments are mostly undeveloped and underutilized. The
major water users in these catchments are irrigation and domestic rural water supply. Nongoma
receives water from the Vuna River (W22G).
A reconciliation that includes the Usuthu RWSS, with estimated water requirements of
2.5x10⁶m3/annum, indicates that there is a deficit in the lower Black Mfolozi during the winter

Biodiversity Sector Plan - Zululand District Municipality 2015
Octob e r 2 015 - Ve rs io n 2 .0 17
months owing to large scale irrigation development near the mouth of the Mfolozi River and
abstractions for transfer to the Mhlathuze catchments. The confluence of the Black and White
Mfolozi Rivers occurs in the Hluhluwe-iMfolozi Park.
The Mkuze Catchments
The Mkuze catchments consist mostly of commercial cattle or game farming, with a small area of
Traditional Council land located in the southeast. There is a significant amount of afforestation,
estimated to be nearly 114km2 (or 4% of the land cover), and an estimated 49km2 of alien vegetation
(or 2% of the land cover). Irrigation of sugarcane is another significant land use covering area of
approximately 68km2 (2.6% of the land cover). The only significant town in the area is Hlobane that
is situated river’s headwaters. This system is impacted on by the rain shadow of the Lebombo
Mountains.
The water resources are mostly undeveloped, with only a number of farm dams for irrigation
purposes. The major water users in these catchments are irrigation and commercial forestry.
Irrigators abstract water from run-of-river flows or from farm dams, with the exception of Senekal
Estates who receive water from the Pongolapoort Dam.
The town of Hlobane obtains its water from the Hlobane and Boulder Dams. There is a deficit in the
Mkuze River during both the winter and summer months owing to irrigation utilizing the entire
available yield without maintaining water for the Mkhuze Game Reserve.
The Pongola Catchments
The Pongola catchments form part of an International River Basin shared with both Swaziland and
Mozambique. Although neither of these countries currently have high demands on these water
resources, it may be easier to supply Maputo’s future requirements from the Pongola River where
there is a surplus (sourced from the Pongolapoort Dam) than from the Inkomati River that is
stressed.
The Pongola catchments are characterised by large-scale afforestation estimated at 480km2 (or 6%
of the land cover) in the upper Pongola and Bivane tributaries, and large scale irrigation of
approximately 200km2 (or 2,5% of the land cover) in the W44 catchments upstream of the
Pongolapoort Dam. The main irrigated crop is sugarcane. There is approximately 150km2 of alien
vegetation (or 2% of the land cover). The significant towns in the area include, Pongola,
Paulpietersburg, Louwsburg, and Frischgewaagd.
The source of the Pongola River is on the eastern escarpment at the border of Mpumalanga and
KwaZulu-Natal near Wakkerstroom, from where it flows eastwards carving a gorge through the
Lebombo Mountains before joining the Usuthu River just before the Mozambique border and
flowing into the Maputo Basin.
The water resources of the Pongola catchments are fully developed through the Pongolapoort Dam
and there is no further scope for increasing the yield as a whole. Recently the Bivane Dam has been
constructed in the Bivane catchments to increase the assurance of supply to irrigators upstream of
Biodiversity Sector Plan - Zululand District Municipality 2015
Octob e r 2 015 - Ve rs io n 2 .0 18
the Pongolapoort Dam. A rapid assessment of the ecological reserve has been carried out for the
Pongolapoort and Bivane Dams. There is an existing operating rule that determines the frequency
and magnitude of flood releases from the Pongolapoort Dam to meet social and environmental
requirements on the flood plains downstream of the dam. These releases reduce the yield of the
Pongolapoort Dam substantially (by about 250 million m3/annum). However, the downstream
parties do not always welcome these releases and Mozambique has recently objected, as have
riparian farmers along the lower Pongola River. The possible dam sites on the upper Pongola River
that have been investigated for the possible transfer of water to the Vaal System will not increase
the system yield significantly; only move the yield of the Pongolapoort Dam upstream.
The major water user in these catchments is irrigation. The other significant water user is
afforestation (38% of the irrigation requirement). Competition between forestry and irrigation in the
Upper Pongola and Bivane catchments resulted in the Impala Water User Association (previously the
Impala Irrigation Board) to commission the Bivane Dam to increase the assurance of supply to
irrigators. Illegal expansion of irrigation is prevalent.
The town of Pongola receives water from irrigation canals in the lower Pongola catchments, but
more recently has also been supplied from the Bivane Dam. Simdlangenstha Phase 1 RWSS receives
90% of its water from Pongola town, which is approximately 10% of the town’s own requirements.
Simdlangenstha Phase 2 RWSS is planning to get 66% of its water from the Frischgewaagd weir on
the Pongola River (W42E 50%), and the remaining 34% from the Monzana River (W42L 15%).
The shortfall in the winter months is due to a combination of the large irrigation requirements and
the ecological reserve. Upstream of Bivane Dam there are a few deficits, however below the dam
these deficits can be resolved through releases. After supplying the existing downstream
requirements from the dam there is no significant spare yield. Another important factor is that the
National Water Resource Strategy (NWRS) recommends that water in the upper Pongola be reserved
for possible transfer to the Vaal system in the future. This will definitely reduce the existing available
surplus.
Currently many communities within the District rely on groundwater; this includes both formal rural
water schemes as well as rudimentary project communities. The rudimentary (survival) service level
consists of boreholes equipped with hand-pumps or protected springs supplying at least 5 ℓ/c/d.
Owing to the fact that groundwater is utilised extensively in the supply of water services to the rural
communities of the District, it is important from a social perspective that groundwater levels and
quality are maintained to ensure sustainability and SABS drinking water standards.
Within most of the rural areas the water supply is at the basic national standard (or below),
therefore no large volumes of wastewater are produced and no formal wastewater treatment
processes are in place. No less than 82% of the population depends on natural sources (rivers,
streams, boreholes, and springs) for their water supply. In these areas the wastewater flows directly
into the ground via French drains or the like. In addition, there is no current requirement for bulk
sanitation disposal as the rural areas are predominantly supplied through Ventilated Improved Pit

Biodiversity Sector Plan - Zululand District Municipality 2015
Octob e r 2 015 - Ve rs io n 2 .0 19
Latrines and not waterborne sewerage systems. However, no formal contingency plan currently
exists for major pollution events.
This particular municipality is therefore at the centre of water supply assurance, and performs a
critical function for present and future water supply within its catchment, neighbouring
municipalities, neighbouring provinces, and countries. The wetlands, rivers, and grasslands in the
District, on which sustained provision of clean water is dependent, are therefore critically important.
2.2 Land Use and Modification within the Landscape
Land use in the Zululand District comprises of plantations and commercial agricultural activities,
predominantly within the eDumbe and Abaqulusi Municipal areas, sugarcane around Phongola, high
levels of subsistence farming, particularly in Ulundi, Nongoma and North Eastern eDumbe Municipal
areas, and limited areas of high density settlement, as well as game farming, ecotourism and
conservation areas (refer to Figure 2-5; which reflects the 2008 KZN land cover data for the District
(EKZNW 2010)). The Zululand District have been modified through these land uses, although there
are still natural areas which can facilitate movement corridors and the management of biodiversity,
(refer to Figure 2-6; (EKZNW 2011)) and these areas as identified in Section 4 need to be protected
for the benefit of biodiversity and the large ecotourism industry in the Zululand District.
While modified areas cannot provide the same level of biodiversity value as natural areas, they can
still play a role in providing for biodiversity and ecosystem services. The modified areas defining the
district can be defined as either “soft” or “hard” Modifications, with “soft” Modifications having a
less defined impact on ecological processes and biodiversity than “hard” Modifications. “Soft”
modified areas include all forms of agriculture (e.g. plantations, sugarcane, orchards, etc.) whereas
“hard” modified areas refer to various types of built-up land uses (e.g. urban areas, rural dwellings,
roads, mines, etc.), which are considered irreversible loss areas from the biodiversity conservation
perspective. Certain “soft” modifications are known to provide more biodiversity value than others
do. As an example areas under annual cultivation, (“soft” modifications but high intensity
agriculture), may provide higher value to biodiversity and ecosystem services provision than “hard”
modified areas, but less than other low intensity agricultural activities such as livestock farming or
plantations.

Biodiversity Sector Plan - Zululand District Municipality 2015
Octob e r 2 015 - Ve rs io n 2 .0 20
Figure 2-5: Land cover of the Zululand District

Biodiversity Sector Plan - Zululand District Municipality 2015
Octob e r 2 015 - Ve rs io n 2 .0 21
Figure 2-6 Modification of natural areas within the Zululand District

Biodiversity Sector Plan - Zululand District Municipality 2015
Octob e r 2 015 - Ve rs io n 2 .0 22
The potential compatibility of grazing land with biodiversity conservation aims, is of importance in
the conservation of biodiversity in the District and can be seen as achieving two goals, for
agricultural and conservation. In the determination of priority biodiversity areas through the
Systematic Conservation Assessment Process, high potential agricultural lands has also been avoided
where at all possible to avoid conflicts with this land use. Refer to Figure 2-7 which sets out the
agricultural potential of the District based on the following categories (Collett and Mitchell 2012):
Agric Category Details
Category A Very high potential agricultural land that should be retained exclusively for agricultural use
so as to ensure national food security. Included within this Category is also identified
grazing land that has a very high production value for sustained livestock production
Category B High potential agricultural land. Due to the limited amount of Category B land in the
province (and in the country), all efforts should be focussed on retaining land within this
Category for predominantly agricultural use. Every effort should be made to limit
degradation of the natural agricultural resources in accordance with Conservation of
Agricultural Resources Act, 1983 (Act 43 of 1983, CARA).
Category C Land with moderate agricultural potential, on which significant interventions would be
required to achieve viable and sustainable food production, although agriculture is still the
majority land use in the rural landscape.
Category D Land with low agricultural potential. This land requires significant interventions to enable
sustainable agricultural production which could include terracing, contours, high levels of
fertility correction, lower stocking rate, supplementary feed, etc.
Category E Land with limited to very low potential for agricultural production. Cultivation within this
land category is severely limited in both extent and in terms of the natural resources
available, and grazing value will be poor with a very low carrying capacity. Land within this
Category however may have a high conservation or tourism status, depending on the
locality, or may act as a buffer for as higher Category of adjacent land. In addition, these
land parcels may be required to support the economic viability of an extensive grazing
system on adjoining land parcels e.g. large dairy farming system. Every effort should be
made to limit degradation of the natural agricultural resources in accordance with CARA.
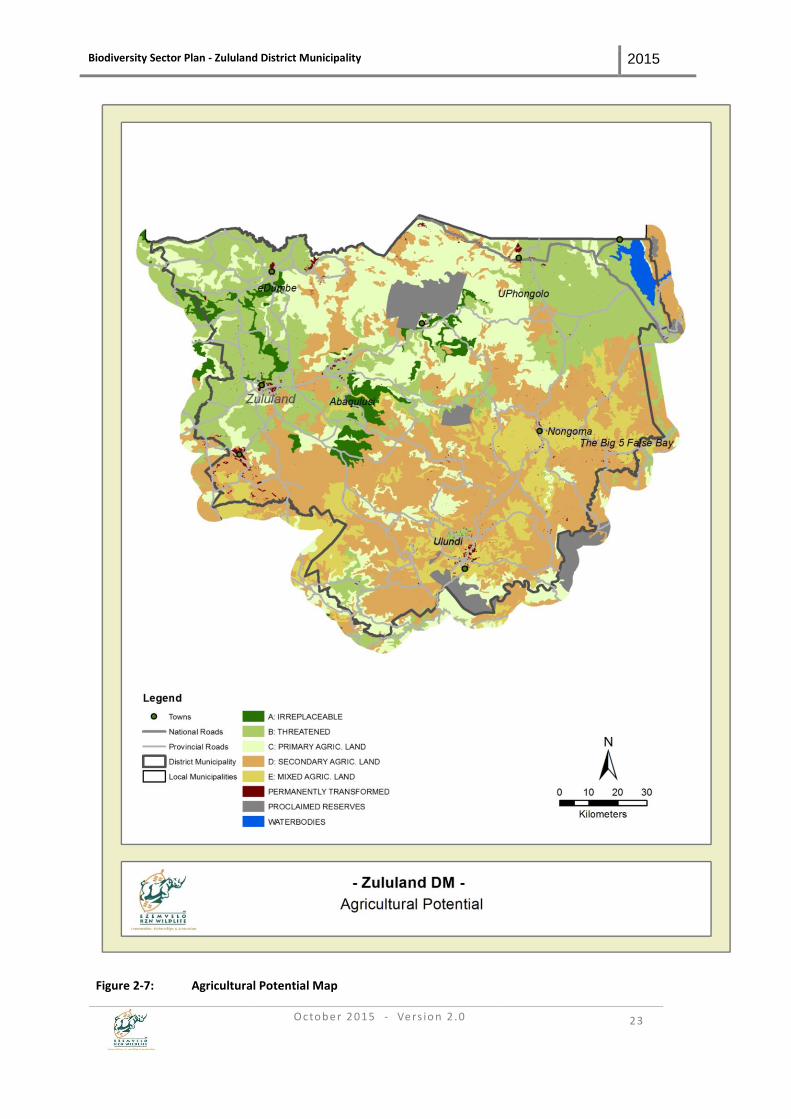
Biodiversity Sector Plan - Zululand District Municipality 2015
Octob e r 2 015 - Ve rs io n 2 .0 23
Figure 2-7: Agricultural Potential Map

Biodiversity Sector Plan - Zululand District Municipality 2015
Octob e r 2 015 - Ve rs io n 2 .0 24
Figure 2-8: Spatial extent and distribution of vegetation types in the Zululand District

Biodiversity Sector Plan - Zululand District Municipality 2015
Octob e r 2 015 - Ve rs io n 2 .0 25
2.3 Biological characteristics
2.3.1 Description of habitats and vegetation communities
The District has exceptional heterogeneity in habitat, which translates into rich vegetation diversity, comprising lower altitude dense bushveld, savanna and grasslands, extending up to higher altitude mistbelt grasslands, including significant areas of mistbelt and forests. Five biomes and 29 vegetation types occur within the District. A number of these vegetation types are classed as threatened and several have experienced over 50% loss of area through modification of the landscape. See Table 2-1 for details on the conservation status of the vegetation types and the extent of area lost, calculated from the 2008 landcover data, and Figure 2-8 for the historical spatial extent of this vegetation.
Table 2-1 Conservation status and extent of vegetation types in the Zululand District
Vegetation Name Status Historical extent (ha)
2008 Extent (ha)
% loss
Wetlands Biome
Alluvial Wetlands : Subtropical Alluvial Vegetation Endangered 7619.57 5774.82 24.21%
Alluvial Wetlands : Temperate Alluvial Vegetation Vulnerable 15222.80 10691.45 29.77%
Alluvial Wetlands : Temperate Alluvial Vegetation : Midland Floodplain Grasslands Least Threatened 61.99 23.91 61.42%
Freshwater Wetlands : Eastern Temperate Wetlands Vulnerable 2518.99 1690.03 32.91%
Freshwater Wetlands : Subtropical Freshwater Wetlands Vulnerable 188.05 125.54 33.24%
Freshwater Wetlands : Subtropical Freshwater Wetlands : Short Grass/ Sedge Wetlands Least Threatened 1234.24 802.19 35.01%
Forest Biome
Eastern Mistbelt Forests Endangered 1999.58 1836.32 8.16%
Eastern Scarp Forests : Ngome-Nkandla Scarp Forest Critically Endangered 4804.10 4456.28 7.24%
Eastern Scarp Forests : Northern Zululand Lebombo Scarp Forest Least Threatened 540.57 522.32 3.38%
Grassland Biome
Dry Coast Hinterland Grassland Vulnerable 1881.81 1878.95 0.15%
Income Sandy Grassland Vulnerable 89495.95 62914.39 29.70%
Ithala Quartzite Sourveld Least Threatened 82024.15 72398.72 11.73%
KaNgwane Montane Grassland Endangered 8260.62 3351.69 59.43%
Lebombo Summit Sourveld Endangered 271.60 208.54 23.22%
Midlands Mistbelt Grassland Endangered 26781.04 17845.77 33.36%
Northern KwaZulu-Natal Moist Grassland Vulnerable 74380.71 51046.01 31.37%
Northern Zululand Mistbelt Grassland Vulnerable 45887.94 24426.40 46.77%
Paulpietersburg Moist Grassland Vulnerable 248509.92 135502.77 45.47%
Wakkerstroom Montane Grassland Least Threatened 3138.92 3054.13 2.70%
Savanna Biome
Delagoa Lowveld Critically Endangered 8769.85 2360.66 73.08%
Granite Lowveld Endangered 3655.96 1624.92 55.55%
KwaZulu-Natal Highland Thornveld Least Threatened 62594.69 51102.46 18.36%
Makatini Clay Thicket Least Threatened 784.46 771.67 1.63%
Northern Zululand Sourveld Least Threatened 371154.74 300651.79 19.00%

Biodiversity Sector Plan - Zululand District Municipality 2015
Octob e r 2 015 - Ve rs io n 2 .0 26
Vegetation Name Status Historical extent (ha)
2008 Extent (ha)
% loss
Southern Lebombo Bushveld Least Threatened 3575.67 3439.61 3.81%
Swaziland Sour Bushveld Least Threatened 50516.38 45189.71 10.54%
Western Maputaland Clay Bushveld Vulnerable 30688.67 17410.44 43.27%
Zululand Lowveld Vulnerable 333243.50 255037.51 23.47%
Indian Ocean Coastal Belt
Maputaland Wooded Grassland Endangered 131.87 43.60 66.93%
2.3.2 Threatened Ecosystems (Terrestrial)
The National Department of Environmental Affairs (DEA) has published a list of threatened
terrestrial ecosystems (DEA 2011a), which classifies all threatened or protected ecosystems in South
Africa in terms of four categories: Critically Endangered (CR), Endangered (EN), Vulnerable (VU), or
Protected. The purpose of categorising these ecosystems was to prioritise conservation areas, to
reduce the rates of ecosystem and species extinction, as well as to prevent further degradation and
loss of structure, function and composition of these ecosystems (BGIS n.d.).
The threatened ecosystems identified in the Zululand District include Endangered and Vulnerable
ecosystems, refer to Table 2-2 and Figure 2-9 for more details.
Table 2-2: Threatened terrestrial ecosystems within the Zululand District.
Ecosystem Biome Province
Endangered
Wakkerstroom/Luneburg Grasslands - MP 11 Grassland and forest KZN
Ngome Mistbelt Grassland and Forest - KZN31 Savanna, Grassland and Forest
KZN
Qudeni Mountain Mistbelt Forest and Grassland - KZN 35
Savanna, Grassland and Forest
KZN
Vulnerable
Bivane Sour Grassveld and Bushveld - KZN 40 Savanna and Grassland KZN
Black Rhino Range - KZN 41 Indian Ocean Coastal Belt, Savanna and Forest
KZN
Eastern Scarp Forest - FOz V1 Forest KZN
Eastern Temperate Freshwater Wetlands - Azf 3 Azonal KZN, Northern Cape, Eastern Cape, Free
State, North West, Gauteng, Mpumalanga
eMondlo Sandy Moist Grassland - KZN 51 Grassland KZN
Imfolosi Savanna and Sourveld - KZN 59 Savanna and Grassland KZN
KaNgwane Montane Grassland - Gm 16 Grassland KZN, Mpumalanga
Lebombo Summit Sourveld - SVl 17 Savanna KZN, Mpumalanga
Louwsberg Mistbelt Grassland - KZN 65 Grassland and Forest KZN
Low Escarpment Mistbelt Forest - FOz II4 Forest KZN, Mpumalanga
Midlands Mistbelt Grassland - Gs 9 Grassland KZN, Eastern Cape
Ngongoni Veld - SVs 4 Savanna KZN, Eastern Cape

Biodiversity Sector Plan - Zululand District Municipality 2015
Octob e r 2 015 - Ve rs io n 2 .0 27
Ecosystem Biome Province
Nkandla Forests and Grasslands - KZN 73 Grassland and Forest KZN
Northern Qudeni Mistbelt Grasslands - KZN 75 Grassland KZN
Paulpietersburg Moist Grassland - Gm 15 Grassland KZN, Mpumalanga
Figure 2-9: Threatened Ecosystems within Zululand District
Biodiversity Sector Plan - Zululand District Municipality 2015
Octob e r 2 015 - Ve rs io n 2 .0 28
2.3.3 Threatened and Endemic Flora and Fauna
The conservation status of species for all taxa groups is based on categories determined by the
International Union for Conservation of Nature (IUCN) (IUCN 2011), namely:
Critically Endangered (CR) – the species is considered to be facing an extremely high risk of extinction in the wild, based on IUCN criteria. Endangered (EN) – the species is considered to be facing a very high risk of extinction in the wild, based on IUCN criteria. Vulnerable (VU) – the species is considered to be facing a high risk of extinction in the wild, based on IUCN criteria. Near Threatened (NT) – when evaluated against IUCN criteria, does not qualify for a Threatened category but is close to qualifying for or is likely to qualify in one of those categories in the near future. Data Deficient (DD) – there is inadequate information regarding the species’ population
size, distribution or threats for an assessment to be made.
This system is designed to determine the relative risk of extinction, with the main purpose being to
catalogue and highlight those taxa that are facing a high risk of global extinction. Species listed as
Critically Endangered (CR), Endangered (EN) and Vulnerable (VU) collectively are considered as
Threatened.
These threatened species are published in ‘Red Lists’ reports, with the aim of identifying and
highlighting those species most in need of conservation attention as well as to provide an index of
the state of degeneration of biodiversity.
Whilst the majority of conservation important species as identified in the BSP are not well conserved
within existing Protected Areas, the majority of Red Data plant and animal species recordings in the
District have been within Protected Areas, special interest areas, and to a lesser extent in private
game ranches or private nature reserves; this almost certainly reflects a sampling bias. Few species
have been recorded in Traditional Authority Areas, which is most likely indicative that these areas
have been subject to the lowest levels of sampling. It may be argued that topographical constraints
on settlement expansion, coupled with a dependency on the natural resource base to sustain rural
livelihoods, may infer a level of protection and biodiversity resilience that is likely to ensure
biodiversity persistence in such areas; the exception would be larger mammals and birds, which
would be subject to hunting pressures. The same applies to other inaccessible areas, such as the
Pongola River valleys. A significant number of additional faunal and floral species are likely to be
present; one therefore needs to adopt the precautionary principle in such areas.
2.3.3.1 Flora
A number of plant species protected in terms of the KwaZulu-Natal Conservation Ordinance and
other Red Data species occur within the District, including at minimum 11 Endangered, 28
Vulnerable, and 95 Lower Risk and Data Deficient species. The majority of these species are
grassland and open savanna species, which are vegetation types at most risk of degradation.

Biodiversity Sector Plan - Zululand District Municipality 2015
Octob e r 2 015 - Ve rs io n 2 .0 29
2.3.3.2 Fauna
The District is vital to a number of Red Data faunal species. The area includes species of national
importance, inter alia African Wild Dog, Black Rhino, a number of vulture species, and a number of
less charismatic yet equally important smaller fauna. Threatened Cape Vulture (Gyps coprotheres),
as well as other raptors including Verreaux’s Eagles (Aquila verreauxii), forage throughout the
District. White-backed, Lappet-faced, and White-headed Vultures breed in the Pongola Nature
Reserve. Whilst Lappet-faced vultures also breed in Ithala Game Reserve, this reserve together with
the eMakhosini-Ophathe Heritage Park are also critical foraging areas for vultures. The area in and
around Ithala Game Reserve comprises one of the few areas where African Hawk Eagle breed.
Many of the animal species require a large area for foraging of an individual animal, which
emphasizes the importance of maintaining large connected areas of natural habitat for ensuring
their viability. The protection and appropriate management of the remaining intact habitat within
the municipality is critical to ensuring the viability of conservation important faunal species listed
above. This pertains particularly to (i) the corridor from the Lebombo Mountains through to Ithala
Game Reserve, which includes vast areas of intact natural vegetation and land uses compatible with
conservation, and (ii) the corridor from the Babanango area through the eMakhosini-Ophathe
Heritage Park, along the Mfolozi River, Hluhluwe-iMfolozi Park, and northwards.
The District is further an avifaunal hotspot, comprising in excess of 400 birds. The area is home to at
least 2 Critically Endangered species, 4 Endangered species, 35 Vulnerable species, and 50 Near
Threatened species. The African Skimmer (Rynchops flavirostris) is classified as Regionally Extinct.
Five important fish species, 19 mammals, 3 reptiles, and 6 invertebrates have been identified as
important.
Grasslands are known in general to support high invertebrate diversity across a wide range on
invertebrate taxa, but little is known about overall invertebrate distribution within the Zululand
District Municipality. It is assumed that invertebrate diversity is related to diversity of vegetation
types and plant species. Conserving these should therefore ensure conservation of invertebrate
species. Similarly, it is assumed that protection of water resources would ensure the persistence of
fish species. Only one conservation-important amphibian species has been identified, namely
Strongylopus wageri (Plain stream frog).
Biodiversity Sector Plan - Zululand District Municipality 2015
Octob e r 2 015 - Ve rs io n 2 .0 30
3 Protected Areas and other Conservation Mechanisms
3.1 Conservation Category
3.1.1 Protected Areas
Protected Areas are terrestrial, aquatic or marine areas that are formally protected by law and
managed for the purpose of biodiversity conservation. Formal Protected Areas are gazetted in terms
of the National Environmental Management: Protected Areas Act, 2003. NEMPAA distinguishes
between several categories of Protected Areas: Special Nature Reserves, National Parks, Nature
Reserves, and Protected Environments. It also recognises World Heritage Sites declared in terms of
the World Heritage Convention Act, 1999 (Act No. 49 of 1999); specially protected Forest Areas
declared in terms of the National Forests Act, 1998; Mountain Catchment Areas declared in terms of
the Mountain Catchment Areas Act, 1970; and Marine Protected Areas declared by the Marine
Living Resources Act, 1998 (Act 18 of 1998, MLRA).
3.1.2 World Heritage Sites
World Heritage Sites are cultural and or natural sites of outstanding universal value that are of
international importance. Such sites are nominated and listed in terms of the Convention Concerning
the Protection of the World Cultural and Natural Heritage which is managed by UNESCO (United
Nations Educational, Scientific and Cultural Organisation) (About World Heritage n.d.).
South Africa is a signatory of the Convention and has currently registered eight (8) World Heritage
Sites.
3.1.3 Conservation Areas
Conservation Areas are those areas of land not formally protected by law, but where primary land
use is conservation. These areas are typically informally protected by the current owners and users,
and managed at least partly for biodiversity conservation. As Conservation Areas are not gazetted in
terms of NEMPAA, they are not considered to be Protected Areas. They could include areas covered
by the Biodiversity Agreements in terms of the National Environmental Management: Biodiversity
Act, 2004 (Act No.10 of 2004) (NEMBA), Community Conservation Areas, Municipal Reserves,
Commercial Game Parks, as well as non-declared Private Nature Reserves and conservancies
(agreements for co-operation among neighbouring landowners and require no legal long-term
commitment).
3.1.4 Protected Area and World Heritage Site Buffers
Protected Areas are required to ensure the persistence of species, habitats and the functionality of
ecosystems, in short biodiversity, within their borders; however edge effects impact on the integrity
of the Protected Area reducing its ability to maintain a functioning system. Edge effects result to a
large extent from human modification and include such impacts as: light, noise, alien plants and

Biodiversity Sector Plan - Zululand District Municipality 2015
Octob e r 2 015 - Ve rs io n 2 .0 31
animals, unseasonal fires, diseases, herbicides and pesticides, pollution, soil erosion, and domestic
and agricultural animals acting as competitors and or predators.
Buffers reduce and to some extent eliminate these edge impacts ensuring that the value and or
biodiversity functionality of the site is maintained. The size and extent of a buffer depends on the
biodiversity within and how sensitive the ecosystems are to external impacts. KZN does not, at this
time, have defined buffers on the various Protected Areas and thus currently generic buffers of five
(5) kilometres, based on the identification of this buffer through the Environmental Impact
Assessment Regulations, 2010, is used. In utilising such buffers it must be noted that such is
generically derived and is not specific to the Protected Areas, and must be used as a mechanisms to
highlight the need to protect the values of the Protected Areas and assess the impacts of land use
changes or extension of land use changes on these sensitive areas.
World Heritage Sites (WHS) are required, in terms of UNESCO and registering of WHS, to have
defined buffers or areas of influence that ensure the protection of the outstanding universal value of
the WHS. A WHS buffer may consist of one or several different zones, each ensuring the protection
of different values, with associated land use guidelines (UNECSO 2009).
3.1.5 Ramsar Sites
The Convention on Wetlands (Ramsar Convention) which was signed in Ramsar, Iran, in 1971, is an
international treaty which provides the framework for national action and international cooperation
for the conservation and wise use of wetlands and their resources. Parties of this convention register
wetlands occurring within their countries which are termed Ramsar sites. These wetlands are of
international importance and must fulfil one or more of the following criteria: Contain rare or unique
wetland types; Support threatened ecological communities; Support threatened migratory species;
Maintain the biological diversity of a region; Contributes to global diversity (About the Ramsar
Convention n.d.).
South Africa is a signatory of the Convention and has currently registered 21 Ramsar Wetland Sites.
3.1.6 Transfrontier Conservation Areas
Transfrontier Conservation Areas (TFCA) are Protected Areas and or Conservation Areas that extend
over the border of one or more country. The Transfrontier Conservation Area is based on the
concept that ecosystems and animals do not recognise national borders, and that conservation areas
which extent over borders allow for implementation of more appropriate conservation management
measures, the re-establishment of migratory routes and implementation of community based
resource management programmes and tourism ventures (Peace Parks Foundation n.d.).

Biodiversity Sector Plan - Zululand District Municipality 2015
Octob e r 2 015 - Ve rs io n 2 .0 32
3.2 KZN Conservation Strategies
KZN utilises three main strategies to identify and promote the conservation of important
biodiversity. These three strategies are briefly set out below.
3.2.1 KZN Protected Area Expansion
The KZN Systematic Conservation Assessment process has determined that more than half of the
province's high priority and conservation-worthy biodiversity is located on private and communal
land. In order to conserve representative samples of such important and vulnerable biodiversity, it
must be incorporated into a Protected Area network. KwaZulu-Natal, in support of the National
Protected Area Expansion Strategy (NPAES), is mandated to expand its formal protected area
network, and using nationally developed guidelines an acquisition target of 9% of the province is to
be formally conserved by 2028 (Government of South Africa 2008). Ezemvelo KZN Wildlife has
developed a 20 year Protected Areas Expansion Plan to guide this process within the KZN Province
(EKZNW 2009a).
3.2.2 KZN Stewardship Programme
The KZN Stewardship Programme is a voluntary programme that aims to increase conservation areas
in KZN through private and communal land. The KZN Stewardship Programme vision is:
To ensure that private and communally-owned areas with high biodiversity value receive secure
conservation status and are linked to a network of other conservation areas in the landscape.
To ensure that landowners/users who commit their property to a stewardship option, will enjoy
tangible benefits for their conservation actions.
To expand biodiversity conservation outside of formally protected areas by encouraging
commitment to, and implementation of, good biodiversity management practice, on private
and communally-owned land.
The KZN Stewardship Programme in order to facilitate this vision offers four levels of stewardship
options (Conservation Areas, Biodiversity Agreement, Protected Environments and Nature Reserves)
that has an increasing level of commitment required from the landowner and a corresponding
increasing level of incentives, which includes amongst others tax and rates exemptions and rebates,
and technical support and equipment (EKZNW 2008).
3.2.3 Identification and Mapping of Important Biodiversity Areas
The provincial scale KZN Biodiversity Plan and the district scale bioregional plans and biodiversity
sector plans, a precursor to the bioregional plan, identify and map critical biodiversity areas and
ecological supports and are a mechanism to mainstream this biodiversity information into the
planning arena. The main purpose of this BSP document is to provide such priority biodiversity
information to the planning arena within the KZN Districts.

Biodiversity Sector Plan - Zululand District Municipality 2015
Octob e r 2 015 - Ve rs io n 2 .0 33
Figure 3-1: Protected areas and other conservation areas within the Zululand District

Biodiversity Sector Plan - Zululand District Municipality 2015
Octob e r 2 015 - Ve rs io n 2 .0 34
3.3 Zululand District Protected Areas and Conservation Mechanisms
3.3.1 Protected Areas and Conservation Areas
Zululand district has six provincial nature reserves, see Table 3-1 and Error! Reference source not found.
below for more details. The District also contains the Ntendeka Wilderness Area within the indigenous Ngome
Forest System, which comprises of 5 250ha of grasslands and forests, which although small forest area includes
significant rare and endemic plants and animals and has a high genetic diversity.
Table 3-1: Protected areas and other conservation areas within the Zululand District
Name Area (Ha)
Provincial Nature Reserves
Ithala Nature Reserve 29271
Phongolo Bush Nature Reserve 858
Phongolo Nature Reserve 21577
eMakhosini-Ophathe Heritage Park 29634.08
Vryheid Mountain Nature Reserve 720
Hluhluwe-iMfolozi Park 89673
Other State Nature Reserves
Ntendeka Wilderness Area (Ngoma State Forest) 5250
Community Conservation Area
SICCP (proposed CCA) 1565
Matshitsholo 493
Stewardship Sites
Zululand Rhino Reserve 18428.67
Somkhande Nature Reserve 11603.16
Gelikwater Mistbelt Nature Reserve 829.23
Stewardship Focus Areas
Phongola Bush Expansion
Tygerskloof
Itala Expansion
Natural Heritage Sites
Lenjane/Waterval 51
Rendsburg Cycad Colony 75
Lebombo Cliffs 623
Scheepershoek 1920
Kersalwyn 1178
Non-Pareil 136
Fairview 1152
Goudhoek Farm 2578
Tafelberg 792
Madaka Game Ranch 1438
Umhlume 647
Leeukop 4383
Strathcona 1002

Biodiversity Sector Plan - Zululand District Municipality 2015
Octob e r 2 015 - Ve rs io n 2 .0 35
Name Area (Ha)
Chamanzi 2055
Lenjane Wetland 240
Gwala-Gwala Aloe vryheidensis Colony 27
Hlomo Hlomo Cycad Colony 25
Senqeni Cycad Colony 465
Mkuze Falls 6000
Tygerskloof 569
Sites of Conservation Significance
Carslogie Bush (SOC No 209)
Phugashes Spring Hilton Daisy (SOC No. 202)
De Waal Hilton Daisy Site (SOC No 203)
Bald Ibis Valley (SOC No. 136)
Black Eagle Valley (SOC No. 135)
Lesser Kestrel Roost (SOC No.178)
Swanepoel se Nes (SOC No. 189)
Esikhuma Cliffs (SOC No. 188)
Msihlengeni Waterfall (SOC No. 187)
3.3.2 Transfrontier Conservation Areas
The Zululand District has one current Transfrontier Conservation area, namely the Nsubane-Pongola
TFCA which is between South Africa and Swaziland. The South African component includes
community, public and private land surrounding the Pongola Nature Reserve which forms the core
conservation component. In Swaziland the area consists of private land, government-owned land
and community areas, all of which are relatively undeveloped with regard to tourism infrastructure.
See Figure 3-2, for the map of the TFCA downloaded from the Peace Parks Foundation website
(Peace Parks Foundation n.d.)
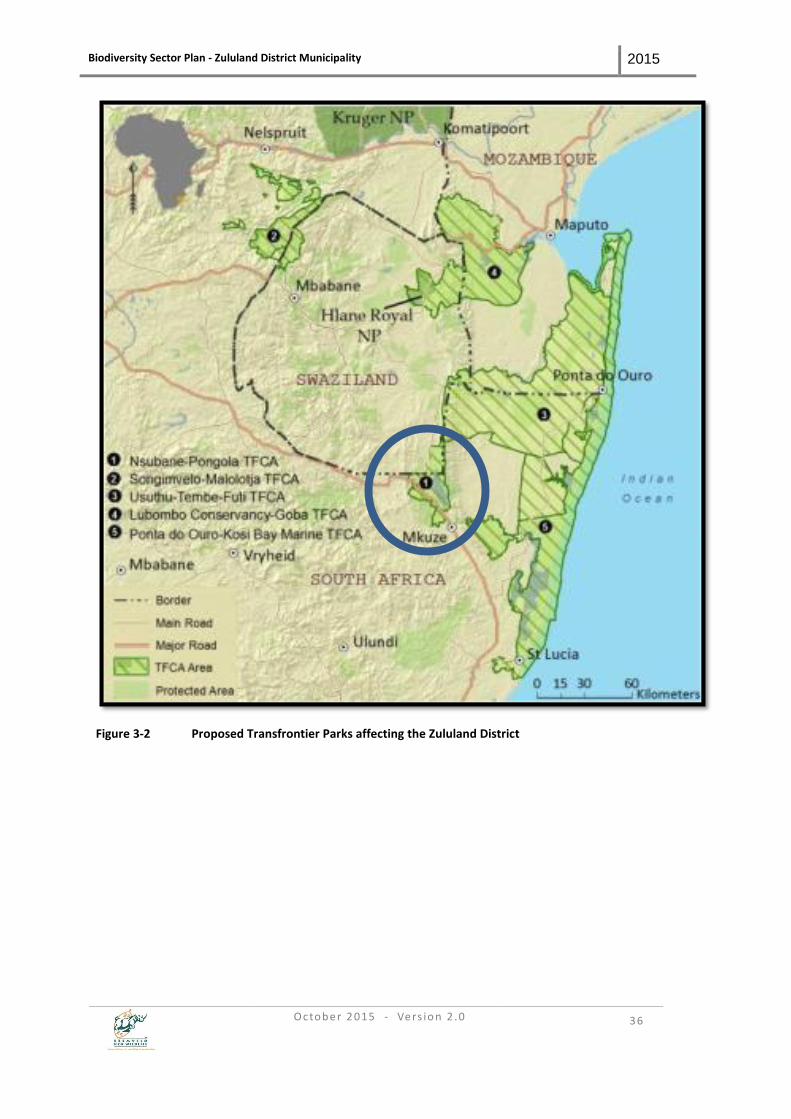
Biodiversity Sector Plan - Zululand District Municipality 2015
Octob e r 2 015 - Ve rs io n 2 .0 36
Figure 3-2 Proposed Transfrontier Parks affecting the Zululand District

Biodiversity Sector Plan - Zululand District Municipality 2015
Octob e r 2 015 - Ve rs io n 2 .0 37
4 Biodiversity Mapping of the Region
4.1 Purpose and Terminology
The primary purpose of mapping the Zululand District’s biodiversity is to determine important areas
for the conservation of biodiversity, in order to guide sustainable development as well as focus
conservation efforts within the District. The biodiversity mapping profile covers the terrestrial and
aquatic environs of the district and is reflected as a biodiversity sector map consisting of two main
layers namely Critical Biodiversity Areas (CBAs) and Ecological Support Areas (ESAs). Legislated
Protected Areas, modified areas, and other natural areas are included as contextual information.
The two main layers, CBAs and ESAs, are divided into further subcategories as set out below:
Critical Biodiversity Areas (CBAs) - Crucial for supporting biodiversity features and ecosystem functioning and are required to meet conservation targets
Critical Biodiversity
Areas: Irreplaceable
Areas considered critical for meeting biodiversity targets and thresholds, and
which are required to ensure the persistence of viable populations of species
and the functionality of ecosystems.
Critical Biodiversity
Areas: Optimal
Areas that represent an optimised solution to meet the required biodiversity
conservation targets while avoiding areas where the risk of biodiversity loss is
high Category driven primarily by process but is also informed by expert input.
Ecological Support Areas (ESAs) - Functional but not necessarily entirely natural areas that are required to ensure the persistence and maintenance of biodiversity patterns and ecological processes within the critical biodiversity areas
Ecological Support
Areas (ESAs)
Functional but not necessarily entirely natural areas that are required to ensure
the persistence and maintenance of biodiversity patterns and ecological processes
within the critical biodiversity areas. The area also contributes significantly to the
maintenance of ecological infrastructure.
Ecological Support
Areas: Species Specific
Terrestrial modified areas that provide a support function to a threatened or
protected species, for example agricultural land.
An additional category, termed “Ecological Infrastructure” or EI (also referred to as “Ecosystem
Goods and Services Areas” or EGSAs) forms a subset of the larger matrix identified on the map as
“Other Natural Areas”. Ecological Infrastructure is however expressed as a stand-alone map
highlighting these areas of ecosystem service priority refer to Section 4.6
The category “Other Natural Areas” are natural, near-natural vegetation and functional habitats or
landscapes not yet classified as one of the above categories (i.e. CBAs, ESAs, or EI), but that should
be recognised as being important in maintaining ecological processes and ecosystem service
delivery, and should also be safe-guarded where possible. Whilst these Other Natural Areas are
sufficiently extensive at this stage that they may withstand some loss through conversion of their
natural state and undergo development, it is possible however that these areas could eventually be
reclassified as Critical Biodiversity Areas in the future as development pressures increase.

Biodiversity Sector Plan - Zululand District Municipality 2015
Octob e r 2 015 - Ve rs io n 2 .0 38
Figure 4-1: Flow diagram of CBA Categories in the SCA, BSP and KZN BP Mapping Process
SCA Process
Desktop review
and expert
input Expert Input
with verification
KE
Y
Bio
div
ers
ity
Se
cto
r P
lan
(B
SP
)
Inp
ut
Co
ve
rag
e’s
M
ap
Cate
go
rie
s
WORKSHOP / GROUND TRUTH / EXPERT INPUT
KZ
N B
P
Ma
p
Ca
teg
ori
es
Sy
ste
ma
tic
Co
ns
erv
ati
on
Ass
es
sm
en
ts
(SC
A)
Su
bc
ate
go
ry
M
ap
Cate
go
rie
s
Eco
log
ica
l S
up
po
rt A
rea
(SC
A)
ES
A: E
xp
ert In
pu
t
ES
A: S
pe
cie
s S
pecific
Critical Biodiversity Areas Ecological Support Areas
ES
A: L
an
dsca
pe
Co
rrido
r
Eco
log
ica
l S
up
po
rt A
rea
(SC
A)
CBA: Irreplaceable CBA: Optimal
CB
A: O
ptim
al E
xp
ert In
pu
t
ES
A: L
oca
l Co
rrido
r
ESA:
Corridors
ES
A: L
an
dsca
pe
Co
rrido
r
CB
A: Irre
pla
cea
ble
Lin
kag
e
CB
A: Irre
pla
cea
ble
(SC
A)
CB
A: E
xp
ert In
put
CBA Optimal
Low
Degradatio
n (optional
category)
High
Degradatio
n (optional
category)
CBA: Optimal (SCA)
CBA Optimal
Low
Degradatio
n (optional
category)
High
Degradatio
n (optional
category)
CBA: High
Irreplaceability for
pattern and species
C-Plan (0.8 to < 1.0 Irreplaceability)
MARXAN (75 – 80% to <100% Selection)
CBA: Irreplaceable for
pattern and species
C-Plan (1.0 Irreplaceability)
MARXAN (100% Selection)
CBA: Irreplaceable
(SCA)

Biodiversity Sector Plan - Zululand District Municipality 2015
Octob e r 2 015 - Ve rs io n 2 .0 39
4.1.1 Difference between CBA/ESA categories in the KZN Biodiversity Plan,
Biodiversity Sector Plans and Systematic Conservation
It is important to note that categorical classes of CBA and ESA are reflected differently in the SCA
and Biodiversity Planning and BSP planning products respectively, their choice being directed by the
purpose of the planning tool in question (see Figure 4-1).
The SCA planning product highlights the key priority areas of biodiversity conservation as
reflected against a uniform biome i.e. the marine, estuarine, freshwater and terrestrial biomes
analysed separately.
The Biodiversity Sector Plan is a higher order spatial planning tool which surmises the high
level of detail reflected in the SCA products in a simplified manner so that the core essence of
the SCA process, the identification of priority biodiversity areas (from all SCA products), can be
easily translated into other spatial planning tools e.g. IDPs, SDFs, etc. What also distinguishes
the BSP product from the above described SCA assessments is that they also take into account
other locally identified CBA and ESA localities, as well as incorporates priorities identified at a
national level.
4.2 Methodology
In summary the process followed in identifying the priority biodiversity areas in the District is a top
down hierarchical approach, with the provincial process taken into account and then refined by local
district scale information. The provincial process starts with the development of the four Systematic
Conservation Assessments (namely: Marine, Estuarine, Freshwater and Terrestrial) (see Section
4.2.2) which are combined with other datasets to form the KZN Biodiversity Plan (see Section 4.2.3).
The Biodiversity Sector Plan then utilises the KZN Biodiversity Plan information cut to District Scale
and refined by input of local knowledge (see Section 4.2.4 and 4.2.5).
The strengths of this top down approach are that:
Species distribution information is taken into account.
Provincial ecological processes are taken into account.
Allows for the seamless edge mapping with neighbouring District Municipalities and
provinces.
4.2.1 Guiding principles utilised in the mapping of key biodiversity areas
The guiding principles utilised in the mapping of the key biodiversity assets are the following:
Protected areas are formally protected. As such their contribution to meeting conservation
targets is automatically included within the minimum required CBA network. Areas of
conservation importance represent the optimal minimal reserve design required (excluding
protected areas) to meet conservation targets. National and provincial legislation enforces that
these areas are managed in a sustainable manner.
Flagship species provides the rationale for not only protecting individual species but also entire
ecosystems that support multi-species complexes.

Biodiversity Sector Plan - Zululand District Municipality 2015
Octob e r 2 015 - Ve rs io n 2 .0 40
Terrestrial and aquatic ecosystems are interdependent and hence naturally linked within the
landscape context.
Managing important habitats types within a matrix of other habitats (e.g. forest within a matrix
of grasslands, wetlands, etc.) is an important component of biodiversity conservation.
Conserving matrix habitats provides additional resilience through improving metapopulation
processes, connectivity and species persistence.
Corridors linking CBAs across the landscape and buffers adjacent to CBAs promote healthy
ecosystems and ensure the continued existence of biodiversity within the Zululand District. In
addition to connecting CBAs, mapping should highlight natural areas providing connectivity
within the district and across into neighbouring districts. Altitudinal connectivity via ESAs is
paramount in the context of climate change enabling species patterns to respond freely to a
changing climate.
Consideration of the “flow” of impacts due to catchment processes – terrestrial and aquatic
areas located upstream of important aquatic systems can have negative impacts on biodiversity
and ecological processes.
Fragmentation of both terrestrial and aquatic habitats can have profound effects on biodiversity
mainly through the isolation of species populations preventing/limiting gene flow, consequently
compromising the viability of a species existence.
Large natural areas are more likely to remain intact with lower influences of “edge-effects”
from adjacent land uses. Intact areas will support ecosystem processes and functionality, which
in turn improves biodiversity conservation. Conversely, land use Modification and impacts from
anthropogenic influences increase the probability of “edge-effects” on important biodiversity
areas.
4.2.2 Systematic Conservation Assessment
A Systematic Conservation Assessment aims to efficiently identify an effective network of persistent
and sustainable high priority biodiversity areas, whilst simultaneously, supporting local ecosystems
and ecological infrastructure. As a principle, this process is achieved using a combination of species
distribution data, associated with minimum viable persistence thresholds and decision support
surfaces (also known as 'cost' or 'discount' layers) to identify a theoretical minimum area required
that will maximise species/habitat target achievement whilst also addressing some of the
biodiversity concerns originally reflected in the decision support layers. A number of software
platforms are available that facilitate this process, two of which (MARXAN and CPLAN) are utilised in
the development of the KZN Biodiversity Plan (EKZNW 2014).
4.2.3 KZN Biodiversity Plan
The KZN Biodiversity Plan reflects the Critical Biodiversity Areas and Ecological Support Areas for the
KZN Province. The plan is developed through the combination of the four KZN Systematic
Conservation Assessments (namely the marine, estuarine, freshwater and terrestrial plans) with
other datasets to form the final combined terrestrial and aquatic CBA and ESA layers reflected in the
KZN Biodiversity Plan. Table 4-1 sets out how the SCAs and the various datasets are combined to

Biodiversity Sector Plan - Zululand District Municipality 2015
Octob e r 2 015 - Ve rs io n 2 .0 41
form these layers in the KZN Biodiversity Plan (EKZNW 2014). Appendix 1 can be referred to for
details on the buffers utilised in the formation of these layers as reflected in Table 4-1.
Site verified or expert verified information obtained through the Biodiversity Sector Planning(BSP)
and Bioregional Planning (BRP) process are also used to refine and update the KZN Biodiversity Plans
and the SCA data, in the form of a feedback loop (see Figure 4-2).
Figure 4-2 Flow diagram for Development of KZN Biodiversity Plans
KZN Biodiversity Plan (CBAs and ESAs)
KZN Systematic Conservation Assessments: (i) Marine, (ii) Estuarine, (iii) Freshwater, and (iv) Terrestrial
Draft KZN Biodiversity Plan (CBAs and ESAs)
11 District Biodiversity
Sector Plans
11 District Bioregional Plans

Biodiversity Sector Plan - Zululand District Municipality 2015
Octob e r 2 015 - Ve rs io n 2 .0 42
Table 4-1: Spatial data allocation in the development of the Critical Biodiversity Area and Ecological Support Area Maps The information highlighted in orange are those datasets which are determined through the BSP process and the input of local knowledge and are used to retrospectively refine the KZN Biodiversity Plan output (EKZNW 2014).
Critical Biodiversity Area Ecological Support Area Ecological
Infrastructure CBA: Irreplaceable CBA: Optimal CBA: Irreplaceable linkage
Terr
est
rial
o TSCA CBA: Irreplaceable (SCA) areas o National Threatened Ecosystems (only CR) o KZN Threatened Ecosystems (CR and EN) o Expert input
o TSCA CBA: Optimal (SCA) areas o Expert input
o Landscape Corridor pinch points (Provincial scale)
o Local Corridor pinch points (District scale)
o Landscape Corridors (Provincial scale) o Local Corridors (District scale)
Aq
uat
ic
Fre
shw
ate
r
o All perennial rivers associated with FSCA CBA: Irreplaceable (SCA) areas
o 30m buffer on identified FSCA CBA: Irreplaceable (SCA) perennial rivers
o All perennial rivers associated with priority FEPA rivers
o 30m buffer on identified FEPA perennial rivers o All perennial rivers associated with FEPA fish
sanctuary areas (CR and EN) o 30m buffer on all perennial rivers associated with
FEPA fish sanctuary areas (CR and EN) o All wetlands within FSCA areas o All Beggs’ 24 Priority KZN wetlands (Begg 1989) o Expert Input
o All perennial rivers in FSCA CBA: Optimal (SCA) areas
o 30m buffer on identified FSCA CBA: Optimal (SCA) perennial rivers
o All perennial rivers associated with FEPA fish sanctuary areas (Vu and NT)
o 30m buffer on identified FEPA fish sanctuary perennial rivers (Vu and NT)
o Expert input
o All perennial rivers associated with the National Flagship free flowing rivers
o 30m buffer on all perennial rivers associated with the National Flagship free flowing rivers
o Non perennial rivers in FSCA CBA: Irreplaceable (SCA) areas
o 70m buffer on non-perennial rivers in FSCA CBA: Irreplaceable (SCA) and CBA: Optimal (SCA) areas
o FEPA rivers, wetlands & wetland clusters (subject to improved local coverage data)
o 70m buffer on 30m CBA buffers on perennial rivers (National Flagship, FEPA, FSCA CBA: Irreplaceable (SCA) and FSCA CBA: Optimal (SCA) rivers)
o 100m buffer on CBA wetlands o 500m buffer on FEPA priority wetland clusters* o 500m buffer on Beggs’ 24 Priority wetland (Begg 1989) o Aquatic Corridor -Top 10 Free flowing rivers, excl. 4 CBA
Flagship rivers o 70m buffers on non-perennial rivers identified as Top 10
Free flowing rivers, excl. 4 CBA Flagship rivers o Expert input
o All remaining wetlands o High Water Production
Areas o National Strategic
Water Production Areas
Estu
arin
e
o ESCA CBA Irreplaceability and CBA High Irreplaceability estuaries
o Nationally identified Priority Estuaries (Turpie and Van Niekerk 2012)
o Provincially identified Priority Estuaries (EKZNW 2013)
o Expert input
o ESCA CBA: Optimal areas o Expert input
o All remaining estuaries
Mar
ine
o MSCA, or SEA-Plan CBA Irreplaceability and CBA High Irreplaceability areas
o National EN and CR habitat (Driver, et al. 2012) o Expert input
o MSCA, or SEA-Plan CBA: Optimal areas
o Expert input
o Expert Input

Biodiversity Sector Plan - Zululand District Municipality 2015
Octob e r 2 015 - Ve rs io n 2 .0 43
4.2.4 District Level Biodiversity Sector Plan
The mapping exercise used in the development of the BSP built upon the KZN Biodiversity Plan, by
cataloguing and capturing additional areas of biodiversity concern not originally accounted for in the
provincial development plan, as well as interrogating the KZN identified CBAs and ESAs. The process
used a combination of specialist and local knowledge and field verification, with the aim to:
(i) evaluate the accuracy of the areas identified via the KZN Biodiversity Plan;
(ii) ensure that all known areas of biodiversity importance within the district are identified;
(iii) verify the veracity of the identified landscape corridors and refine where necessary;
(iv) determine a system of local corridors; and
(v) to identify areas where functionality of identified landscape and local corridors are
significantly impacted by modified landscapes (i.e. pinch points) thereby creating CBA
irreplaceable linkage areas.
4.2.5 Local scale input into the Zululand District map
While there is a great deal of information on conservation priorities at a provincial level, it is
recognised that this is undertaken at a provincial scale and that there is a need to ensure that local
biodiversity priorities are identified and provincial scale information verified. The following was
undertaken
Interrogation and verification of the province scale biodiversity priority information;
Identification of additional critical areas at a local scale that are important:
For habitat conservation (e.g. threatened grasslands / forests in good condition);
For the conservation of unique or threatened species of plants and animals;
As breeding, roosting or feeding habitat for important species / species assemblages;
For maintaining ecological processes of CBA areas.
Identification of critical local corridors for species movement;
Identification of additional data sources that can inform the assessment;
Review of information on current key recognized sites of Conservation Significance and
Natural Heritage Sites and assess their importance to regional conservation efforts.

Biodiversity Sector Plan - Zululand District Municipality 2015
Octob e r 2 015 - Ve rs io n 2 .0 44
Figure 4-3 Terrestrial Critical Biodiversity Areas (CBAs) and Ecological Support Areas (ESAs) of the Zululand District

Biodiversity Sector Plan - Zululand District Municipality 2015
Octob e r 2 015 - Ve rs io n 2 .0 45
4.3 Critical Biodiversity Areas
Critical Biodiversity Areas are natural or near natural landscapes that are considered critical for
meeting biodiversity targets and thresholds, and which safeguard areas required for the persistence
of viable populations of species and the functionality of ecosystems.
The CBA areas are described below in terms of terrestrial and aquatic (which includes freshwater
and marine) environs of the Zululand District. Detailed information of features found within the
identified CBA areas (terrestrial and aquatic) can be obtained from EKZNW via the email address
4.3.1 Terrestrial CBAs
Terrestrial CBAs within the Zululand District were mapped and defined according to the following
data (see also Table 4-1):
Critical Biodiversity Area Irreplaceable (TSCA).
Critical Biodiversity Area Optimal (TSCA).
Critical Biodiversity Area Irreplaceable Linkages.
Critically Endangered category from the National threatened Ecosystems.
Critically Endangered and Endangered category from KZN Threatened Ecosystems.
CBA Irreplaceable and CBA Optimal derived from local and specialist knowledge.
The spatial distribution and extent of the terrestrial CBAs are shown in Figure 4-3, and the details of
the spatial data used to derive the terrestrial CBAs are listed in Appendix 2.
4.3.2 Aquatic CBAs
Aquatic CBAs (which include both freshwater and marine areas) within the Zululand District were
mapped and defined according to the following data (see also Table 4-1 and Appendix 1):
Critical Biodiversity Area Irreplaceable (FSCA, ESCA & SEAPlan).
Critical Biodiversity Area Optimal (FSCA, ESCA & SEAPlan).
CBA Irreplaceable and CBA Optimal derived from local and specialist knowledge.
Critical Biodiversity Area Irreplaceable Linkages (National Flagship Rivers & 30m buffer).
All wetlands within FSCA and the 24 KZN priority wetlands.
Perennial rivers in FSCA and all priority FEPA rivers.
All perennial rivers associated with FEPA fish sanctuary areas.
30m buffer on identified CBA Irreplaceable & Optimal perennial rivers, perennial rivers associated with FEPA fish sanctuary areas, and priority FEPA Rivers.
The spatial distribution and extent of the Aquatic CBA areas are shown in Figure 4-4. Details of the
spatial data used to derive the aquatic CBA areas are listed in Appendix 2.

Biodiversity Sector Plan - Zululand District Municipality 2015
Octob e r 2 015 - Ve rs io n 2 .0 46
Figure 4-4 Aquatic Critical Biodiversity Areas (CBAs) and Ecological Support Areas (ESAs) of the Zululand District

Biodiversity Sector Plan - Zululand District Municipality 2015
Octob e r 2 015 - Ve rs io n 2 .0 47
Figure 4-5 Landscape and Local Corridors of the Zululand District
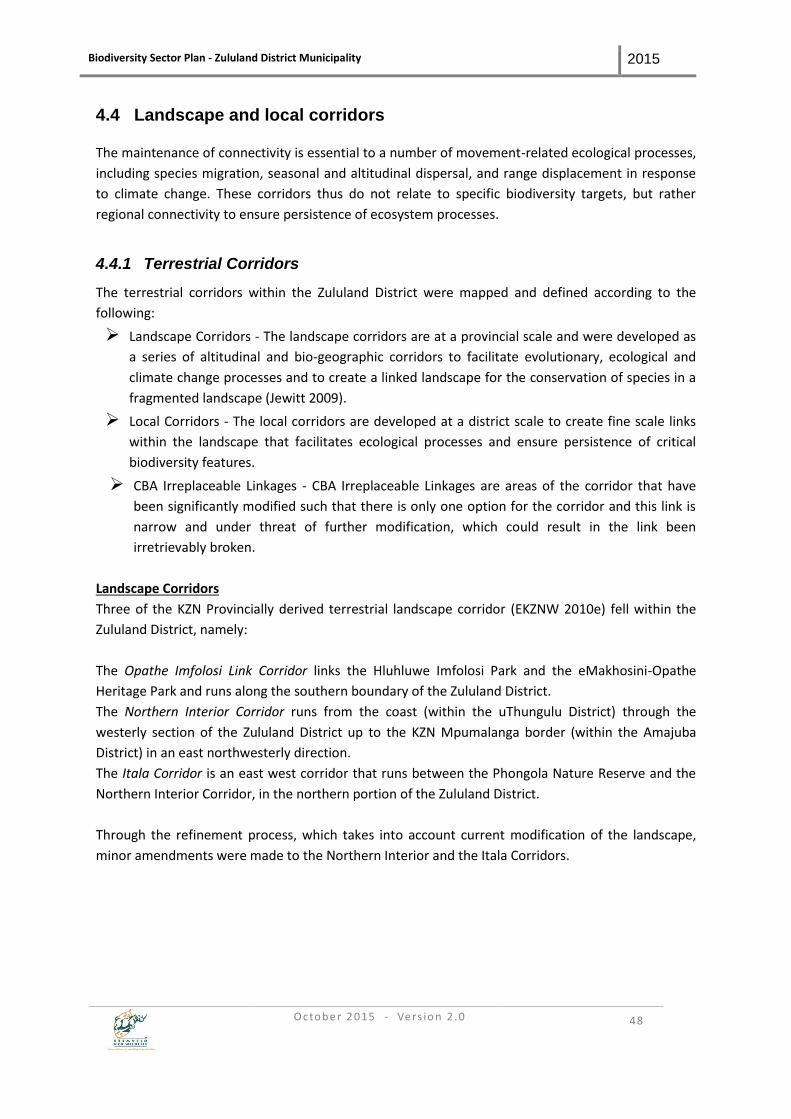
Biodiversity Sector Plan - Zululand District Municipality 2015
Octob e r 2 015 - Ve rs io n 2 .0 48
4.4 Landscape and local corridors
The maintenance of connectivity is essential to a number of movement-related ecological processes,
including species migration, seasonal and altitudinal dispersal, and range displacement in response
to climate change. These corridors thus do not relate to specific biodiversity targets, but rather
regional connectivity to ensure persistence of ecosystem processes.
4.4.1 Terrestrial Corridors
The terrestrial corridors within the Zululand District were mapped and defined according to the
following:
Landscape Corridors - The landscape corridors are at a provincial scale and were developed as
a series of altitudinal and bio-geographic corridors to facilitate evolutionary, ecological and
climate change processes and to create a linked landscape for the conservation of species in a
fragmented landscape (Jewitt 2009).
Local Corridors - The local corridors are developed at a district scale to create fine scale links
within the landscape that facilitates ecological processes and ensure persistence of critical
biodiversity features.
CBA Irreplaceable Linkages - CBA Irreplaceable Linkages are areas of the corridor that have
been significantly modified such that there is only one option for the corridor and this link is
narrow and under threat of further modification, which could result in the link been
irretrievably broken.
Landscape Corridors
Three of the KZN Provincially derived terrestrial landscape corridor (EKZNW 2010e) fell within the
Zululand District, namely:
The Opathe Imfolosi Link Corridor links the Hluhluwe Imfolosi Park and the eMakhosini-Opathe
Heritage Park and runs along the southern boundary of the Zululand District.
The Northern Interior Corridor runs from the coast (within the uThungulu District) through the
westerly section of the Zululand District up to the KZN Mpumalanga border (within the Amajuba
District) in an east northwesterly direction.
The Itala Corridor is an east west corridor that runs between the Phongola Nature Reserve and the
Northern Interior Corridor, in the northern portion of the Zululand District.
Through the refinement process, which takes into account current modification of the landscape,
minor amendments were made to the Northern Interior and the Itala Corridors.

Biodiversity Sector Plan - Zululand District Municipality 2015
Octob e r 2 015 - Ve rs io n 2 .0 49
Local Corridors
Several local corridors were identified in the Zululand district based on the requirement to link
Protected Areas, stewardship sites and CBAs to landscape corridors while avoiding modified land
(refer to Figure 4-5).
Critical Linkages
Sections of the Northern Interior and Ithala corridors were designated as critical linkages.
4.4.2 Aquatic Corridors
The aquatic corridors within the Zululand District were mapped and defined according to the
following (see also Table 4-1 and Appendix 1):
Landscape Corridors – are delineated from the KZN Priority/flagship free flowing rivers
identified in the KZN province.
Local Corridors - The local corridors are developed at a district scale to create fine scale links
within the landscape that facilitates ecological processes and ensure persistence of critical
biodiversity features.
CBA Irreplaceable Linkages – are delineated from the National Flagship Rivers identified
through the national Freshwater Ecological Priority Areas project.
Landscape Corridors
No aquatic landscape corridors were identified within the Zululand District.
Critical Linkages
The Mkuze and Black Mfolozi are National Flagship Rivers and were thus designated as Critical
Linkages within the Zululand District.
Refer to Figure 4-5 for the spatial representation of this corridor.
Criteria for refinement of landscape corridors
Corridor width of between 100m and 1km were designated as critical linkages.
Corridor width less than 100m were considered to be non-viable for landscape
corridors.
Where modification of the landscape allowed, corridors widths of less than 1km
were increased to a maximum of 1km.
Alternative delineations for sections of corridors that have breaks or non-viable
sections were investigated, and delineation width based on Freshwater SCA
catchments.
The sections of corridor that have no viable alternative delineations were removed
from the landscape corridor.

Biodiversity Sector Plan - Zululand District Municipality 2015
Octob e r 2 015 - Ve rs io n 2 .0 50
4.5 Ecological Support Areas
Ecological Support Areas are functional but not necessarily entirely natural landscapes that are
largely required to ensure the persistence and maintenance of biodiversity patterns and ecological
processes within the critical biodiversity areas.
The ESAs are described below in terms of the terrestrial and aquatic (freshwater and marine)
environs of the Zululand District. Detailed information of features found within the identified CBA
areas (terrestrial and aquatic) can be obtained from EKZNW via the email address
4.5.1 Terrestrial ESAs
The terrestrial ESAs within the Zululand District were mapped and defined according to the following
data (see also Table 4-1 and Appendix 1):
Landscape and local corridors.
Specialist or expert input data.
Species specific habitat requirements.
The spatial distribution and extent of terrestrial ESAs are shown in Figure 4-3. Details of spatial data
used to derive the terrestrial ESAs are listed in Appendix 2.
4.5.2 Aquatic ESAs
The aquatic ESAs (which include freshwater and marine areas) within the Zululand District were
mapped and defined according to the following data:
Non perennial rivers in FSCA
FEPA rivers, wetlands & wetland clusters
Aquatic corridors – KZN priority/ flagship rivers.
All remaining estuaries
Specialist or expert input data
Species specific habitat requirements
100m buffer on FSCA wetlands.
70m buffer on CBA perennial rivers , KZN Flagship Rivers & national Flagship Rivers
70m buffer on non-perennial rivers.
500m buffer on FEPA priority wetland clusters & KZN priority wetlands.
The spatial distribution and extent of aquatic ESAs areas are shown in Figure 4-4. Details of spatial
data used to derive the terrestrial CBA area are listed in Appendix 2.

Biodiversity Sector Plan - Zululand District Municipality 2015
Octob e r 2 015 - Ve rs io n 2 .0 51
4.6 Ecological Infrastructure
Ecological Infrastructure (EI) is the functioning ecosystems, within landscapes, that provide
environmental services which contribute positively to the economy and human welfare. Services
provided include the promotion of water security through for example the provision of clean water
and increased lifespan of dams; reduction in disaster risk through for example the control of flood
intensities & coastal erosion; the prevention of soil loss, and climate regulation. The ecological
infrastructure that provides such services includes healthy and well maintained wetlands, rivers,
catchments, coastal dunes, grasslands and forests.
Ecological infrastructure is further described as the nature–based equivalent of hard infrastructure,
which has an comparable importance for the underpinning of socio-economic development and
which must be considered as a public good to be conserved for the benefit of future generations
(SANBI's Grassland Programme 2012).
The identification and mapping of ecological infrastructure within the KZN province is currently in its
infancy and requires input from a number of sectors and levels of government. There are a range of
ecological infrastructure categories that need to be considered, but initial focus has been placed on
water production areas due to its importance within the biodiversity social and economic sectors,
and the fact that South Africa is a water scarce country.
The water production EI areas determined within the biodiversity sector plans is based on work
produced for KZN as a whole (EKZNW 2007b). The areas mapped represent (i) areas of high water
production which are defined as areas receiving a net runoff,3 National Strategic Water Production
Areas, and all wetlands not identified as a CBA or ESA (refer to Figure 4-6). It is proposed that
further ecological infrastructure would be identified and mapped during the development of District
Bioregional Plans, which are planned to commence within the next five year strategy plan period.
3 Net runoff was calculated for the summer rainfall period wherein crop evaporation was subtracted from the monthly median rainfall. All
areas with runoff greater than 0mm were classified as high water production areas. All calculations were based on data obtained from
Schutlze’s 2006 South African Atlas of Climatology and Agrohydrology.
Biodiversity Sector Plan - Zululand District Municipality 2015
Octob e r 2 015 - Ve rs io n 2 .0 52
Figure 4-6 Ecological Infrastructure in Zululand District

Biodiversity Sector Plan - Zululand District Municipality 2015
Octob e r 2 015 - Ve rs io n 2 .0 53
4.7 Zululand District Biodiversity Sector Plan Map
The terrestrial and aquatic CBAs and ESAs have been incorporated into a single map, producing one
output reference map for the Zululand BSP. The map covering the Biodiversity Sector Plan for the
Zululand District Municipality is illustrated within Figure 4-7. The associated land use guidelines of
the categories reflected in this map are detailed within Section 5 and in particular Table 5-2 and
Table 5-3.
4.8 Cross Links with Adjacent Municipalities
It is an essential and legislated requirement (NEMA, Act 107 of 1998) that collaborative management
between adjacent district municipalities ensures the sustainable protection and on-going
consideration and management of CBAs, ESAs and biodiversity corridors that traverse municipal
boundaries. When making land use planning decisions covering land in proximity to municipal
boundaries, the adjacent municipality must be engaged, and their relevant biodiversity plan
consulted, to ensure that biodiversity planning priorities within adjacent municipal areas are not
compromised.
In the development of the Zululand BSP, existing available BSPs covering adjacent districts were
accounted for in the determination of CBAs, ESAs and biodiversity corridors that traversed municipal
boundaries. Any subsequent BSPs developed for districts adjacent to Zululand must take account of
the CBAs, ESAs and biodiversity corridors of the Zululand District BSP.

Biodiversity Sector Plan - Zululand District Municipality 2015
Octob e r 2 015 - Ve rs io n 2 .0 54
Figure 4-7 Zululand Biodiversity Sector Plan Map
Biodiversity Sector Plan - Zululand District Municipality 2015
Octob e r 2 015 - Ve rs io n 2 .0 55
5 Biodiversity Land Management Guidelines
Land use, resource usage and/ or activities in the Critical Biodiversity and Ecological Support Areas,
may depending on the use or activity type, have a significant negative effect or alternatively
positively enhance the conservation of this biodiversity. To guide planning and sustainable activities
and/or resource usage within these biodiversity sensitive areas, a Planning and Management
Guideline has been compiled for terrestrial and freshwater environs, where freshwater includes
watercourses, wetlands and estuaries.
The guideline identifies broad land use categories within the terrestrial and freshwater environs and
whether such will be compatible, potentially compatible,4 or incompatible within the conservation
categories of:
Protected Area
Protected Area Buffers
World Heritage Site Buffers
Critical Biodiversity Area: Irreplaceable
Critical Biodiversity Area: Optimal
Ecological Support Area
Ecological Support Area: Species Specific
Natural Area
Modified and or Degraded Area
The Protected Area Buffers and World Heritage Site (WHS) Buffers fall within one of three types,
namely: a buffer that has been specifically delineated for the PA or WHS with associated land use
management guidelines; a buffer that has been specifically delineated for the PA with no associated
land use management guideline, and; a generic buffer of 5km for PA and 10km for WHS.
Generic buffers are only utilised where there are as yet no delineated buffers for the PA/WHS, and
when utilised it is noted that such is generically derived and is not specific to the PA/WHS. The
function of this generically derived buffer is to however highlight the need to protect the values of
the PA/WHS and assess the impacts of land use changes or extension of land use changes on these
sensitive areas.
The compatibility status of the land use categories has been determined based on the desired
management objectives of the conservation categories (Ezemvelo KZN Wildlife 2013) (see Table 5-1),
the likely impact on the biodiversity, and the assumption of best practise land management been
implemented.
4 Land use activities may be compatible with the aims of the land use objective, but this depends on the existing land use and the exact nature and scale of the land use activity.

Biodiversity Sector Plan - Zululand District Municipality 2015
Octob e r 2 015 - Ve rs io n 2 .0 56
Table 5-1: Land Use Management Objectives for the Terrestrial and Aquatic Conservation Categories
Map Category Guiding description of categories Land-Use Management Objective
Protected Areas (PAs) Protected areas as declaration under NEMPA Maintain in a natural state with limited to no biodiversity loss
Critical Biodiversity Areas (CBAs)
Natural or near-natural landscapes that include terrestrial and aquatic areas that are considered critical for meeting biodiversity targets and thresholds, and which safeguard areas required to ensure the persistence of viable populations of species, and the functionality of ecosystems and Ecological Infrastructure (EI)*
Maintain in a natural state with limited to no biodiversity loss
Critical Biodiversity Areas: Irreplaceable
Areas which are required to meet biodiversity conservation targets, and where there are no alternative sites available. (Category driven by species and feature presence)
Maintain in a natural state with limited to no biodiversity loss
Critical Biodiversity Areas: Optimal
Areas that are the most optimal solution to meet the required biodiversity conservation targets while avoiding high cost areas as much as possible (Category driven primarily by process)
Maintain in a natural state with limited to no biodiversity loss
ESA: Buffers Areas identified as influencing land-use management that are not derived based on biodiversity priorities alone, but also address other legislation / agreements which the biodiversity sector is mandated to address, e.g. WHS Convention, triggers for EIA Regulations, etc.
Maintain or improve ecological and tourism functionality of a PA or WHS
ESA: Protected Area Buffer
Unless otherwise stated, this represents an area extending 5km from the PAs or where applicable PA specific delineated buffers
Maintain or improve ecological and tourism functionality of a PA
ESA: World Heritage Site Buffer
Unless otherwise stated, this represents an area extending 10km from the WHS or where applicable area specifically defined for WHS
Maintain or improve ecological and tourism functionality of WHS
Terrestrial Ecological Support Areas (ESAs)
Functional but not necessarily entirely natural terrestrial that are largely required to ensure the persistence and maintenance of biodiversity patterns and ecological processes within the Critical Biodiversity Areas. The area also contributes significantly to the maintenance of Ecological Infrastructure (EI)*
Maintain ecosystem functionality and connectivity allowing for some loss of biodiversity
Terrestrial Ecological Support Areas: Species specific **
Modified but area is providing a support function to a threatened or protected species
Maintain current land use or rehabilitate back to functional natural area
Aquatic Ecological Support Areas
Functional but not necessarily entirely natural aquatic landscapes that are largely required to ensure the persistence and maintenance of biodiversity patterns and ecological processes within the Critical Biodiversity Areas. The area also contributes significantly to the maintenance of Ecological Infrastructure (EI)*
Maintain ecosystem functionality allowing for some loss of biodiversity but without degrading Present Ecological State (PES) category
Natural Biodiversity Areas All natural areas not already included in the above categories
Maintain basic ecosystem functionality
Modified Areas with no significant natural vegetation remaining and therefore regarded as having a low biodiversity value (e.g. areas under cultivation)
Sustainable management
* EI refers to functioning ecosystems that deliver valuable services to people and the environment. These areas were previously referred to as Ecosystem Goods and Service Areas. The areas highlighted in the maps represent the EI of highest importance, i.e. modification within these areas will result in significant losses of the service being represented by the area(s) in question. **The ESA: species specific category only requires that the current land use is maintained and thus has not been assessed in terms of compatibility against the various land uses within.
It is proposed that the guideline be utilised by planners, consultants and developers to make
informed land planning decisions which actively take areas of high biodiversity importance into

Biodiversity Sector Plan - Zululand District Municipality 2015
Octob e r 2 015 - Ve rs io n 2 .0 57
account. In order to facilitate the integration of the identified biodiversity criteria/information into
the more general town planning processes, a guideline matrix has been developed to enable the
cross-walking of the terminology from the different spatial planning sectors (Figure 5-1). In addition,
the matrix also provides guidelines as to the suitability/compatibility of different potential land use
categories5 relative to the various conservation categories. The land use categories have been
further refined into a three tiered system, with the first tier categories (Urban development, Non-
Urban Development, Mixed Urban and Non-Urban) categorising the lower tiers according to degrees
of developmental pressure. It is envisioned that in future, these will be further refined to reflect
much finer scale mapping units typically utilised in metropolitan open space systems (MOSS). The
second (Agriculture, Conservation, Residential etc.) and third tiers (irrigated crops, low impact
tourism, airstrips, etc.) reflect categories directly linked to and defined by the KwaZulu-Natal Land
Use Management System Guidelines for scheme development (Briginshaw, Kahn and Ferguson
2011).
Figure 5-1: Tiered Lands Use Categories
It is to be noted that the guideline cannot grant or take away existing land-use rights or the statutory
requirement for permits and environmental authorisations. It is however recommended that any
planned activity within the identified sensitive conservation areas, even those not requiring specified
permits or authorisations, comply with the Duty of Care obligations of Section 28 of the National
Environmental Management Act, 1998. At a minimum such activities should undergo an
environmental impact scoping process and the development of an Environmental Management
Programme (EMPr) to ensure mitigation and management of identified impacts.
5This table is based in large part upon work originally produced by Dave Cox of the Institute of Natural Resources and links to the KZN Land Use Scheme Zones as defined in the KwaZulu-Natal Land Use Management System Guidelines for the Preparation of Schemes for Municipalities – update 2011 (Briginshaw, Kahn, & Ferguson, 2011)
Tier 1
Tier 2
Tier 3

Biodiversity Sector Plan - Zululand District Municipality 2015
Octob e r 2 015 - Ve rs io n 2 .0 58
The compatibility of the various land use activities with the conservation categories, as noted above,
is partly based on the assumption that best practise land management and land use controls would
be in place. Key best management practises and controls that should to be in place for the various
land use categories have been set out below (EKZNW 2014) (see Table 5-2).
Table 5-2: Land Use Management Practices and Controls
LAND USE CATEGORY LAND USE MANAGEMENT PRACTICES/CONTROLS IN PLACE
AGRICULTURE
IRRIGATED CROP PRODUCTION
Intensive and extensive crop production under irrigation
Activities have the legislated environmental permissions Limit usage of herbicides, pesticides, and fertilizers Control of alien invasive species Setbacks from wetland and riparian areas Activities are managed by an Environmental Management
Programme (EMPr) Soil conservation and run-off control measures are in place
EXTENSIVE CROP PRODUCTION
Extensive areas of monoculture, such as sugar cane, maize, soya, wheat and vegetables
Activities have the legislated environmental permissions Limit usage of herbicides, pesticides, and fertilizers Control of alien invasive species Setbacks from wetland and riparian areas Activities are managed by an Environmental Management
Programme (EMPr) Soil conservation and run-off control measures are in place
INTENSIVE CROP PRODUCTION
Examples: Vegetables, avos/fruit orchards, nurseries, etc.
Within an ESA area
Activities have the legislated environmental permissions Limited modification levels and preferably located on existing
modified areas Low to no usage of herbicides, pesticides, and fertilizers Activities are managed by an Environmental Management
Programme (EMPr) Control of alien invasive species Soil conservation and run-off control measures are in place
AGRI-INDUSTRY
Beneficiation processes, examples include saw mills, sugar mills, abattoirs, factories for the processing of dairy products, tanneries, charcoal making, composting
Activities have the legislated environmental permissions Management of solid and liquid waste Limited modification levels and preferably located on existing
modified area Control of alien invasive species Activities are managed by an Environmental Management
Programme (EMPr)
EXTENSIVE ANIMAL PRODUCTION
Livestock and game production on natural veld
Game production adheres to stocking rates and species as per the conservation permits. If no such permit is required a faunal/floral specialist must undertake a carrying capacity assessment, and provide a management plan for off-takes and species composition
Strict adherence to livestock stocking rates Sustainable manage of the land, which should include alien
clearing and a burn programme which enhance the ecological functioning of the grassland, and protection of wetlands and riparian areas
Activities are managed by an Environmental Management Programme (EMPr)
INTENSIVE ANIMAL PRODUCTION
Intensive commercial production
Activities have the legislated environmental permissions Management of solid and liquid waste Control of alien invasive species

Biodiversity Sector Plan - Zululand District Municipality 2015
Octob e r 2 015 - Ve rs io n 2 .0 59
LAND USE CATEGORY LAND USE MANAGEMENT PRACTICES/CONTROLS IN PLACE
examples include: feedlots, poultry houses, piggeries, crocodile farms, rabbits and dairies
Activities are managed by an Environmental Management Programme (EMPr)
FORESTRY
Commercial plantation: Pine, Wattle and Eucalypts
Activities have the legislated environmental permissions, include water use license in terms of National Water Act 36 of 1998
Control of alien invasive species Setbacks from wetland and riparian areas Adhere to Sustainable Forestry certification requirements
ENVIRONMENTAL SERVICES & CONSERVATION AREAS
ECOLOGICAL INFRASTRUCTURE
Functioning ecosystems that deliver services to people and the environment. Also referred to as ecosystem goods and services
Control of alien invasive species Manage for the improvement and maintenance of ecosystem
services
CONSERVATION & STEWARDSHIP
Base activities: Wildlife production, alien clearing, land management
Additional activities: Environmental education and low impact ecotourism such as hiking,, bird and game watching, as well as the sustainable harvesting of natural resources including fish, thatching grass, reeds and wildflowers
The main aim would be to manage for the improvement and maintenance of biodiversity conservation values, environmental integrity and ecosystem services
The property is management in terms of a conservation agreement or mechanism, such as a Protected Area in terms of the Protected Areas Act 15 of 2009, a stewardship type agreement, an appropriate land use zoning, or conservation servitude
Activities limited to very low modification levels and preferably located on existing modified areas
Activities have the legislated environmental and conservation permissions
Activities are managed by an Environmental Management Programme (EMPr).
MODIFIED OPEN SPACE
Modified passive and active open space which is managed as a public amenity. e.g. parks, sports fields and golf courses, country clubs, equestrian centres/race courses, polo fields
Control of alien invasive species Maintenance of ecological infrastructure
TOURISM
LOW IMPACT/ECOTOURISM
Infrastructure related to hiking trails, bird and game watching and limit tourism accommodation
Activities limited to very low modification levels and preferably located on existing modified areas
Activities have the legislated environmental permissions. An environmental impact scoping process is undertaken to assess
the sustainablity of the project and determine if the project will not result in the loss of biodiversity
Activities are managed by an Environmental Management Programme (EMPr)
Control of alien invasive species Green Building design utilised

Biodiversity Sector Plan - Zululand District Municipality 2015
Octob e r 2 015 - Ve rs io n 2 .0 60
LAND USE CATEGORY LAND USE MANAGEMENT PRACTICES/CONTROLS IN PLACE
MEDIUM IMPACT TOURISM
Backpackers accommodation, guesthouses, B&Bs, lodges, small hotels, camping sites
Activities to be located outside of sensitive ecosystems, such as river beds, riparian zones and wetland buffers and preferably on existing modified areas
Game production adheres to stocking rates and species as per the conservation permits. If no such permit is required a faunal/floral specialist must undertake a carrying capacity assessment, and provide a management plan for off-takes and species composition
Strict adherence to livestock stocking rates Sustainable manage of the land, which should include alien
clearing and a burn programme which enhance the ecological functioning of the grassland, and protection of wetlands and riparian areas
Activities are managed by an Environmental Management Programme (EMPr)
HIGH IMPACT TOURISM
Resorts, hotels, Golf courses, Eco-estates
Activities have the legislated environmental permissions Control of alien invasive species Setbacks from wetland and riparian areas Green Building design utilised Maintenance of ecological infrastructure Management of solid and liquid waste
INFRASTRUCTURE
Activities have the legislated environmental permissions Control of alien invasive species Setbacks from wetland and riparian areas Activities are managed by an Environmental Management
Programme (EMPr)
RURAL/TRADITIONAL SETTLEMENT
Includes various gradation of settlement densities, with the addition of a variety of agricultural activities such as cropping and grazing of livestock
Control of alien invasive species Activities located outside of sensitive ecosystems, such as river
beds, riparian zones and wetland buffers and preferably on existing modified areas
Maintenance of ecological infrastructure
RESIDENTIAL
Activities have the legislated environmental permissions Control of alien invasive species Setbacks from wetland and riparian areas Maintenance of ecological infrastructure Management of solid and liquid waste
MIXED USE
This category includes conventional urban activities such as, retail, offices, commercial workshops, places of public amusement, restaurants, and warehouses. It further includes fuel filling stations, logistics hubs, and transport focus points that cater for bus and taxi ranks, truck stops etc.
Activities have the legislated environmental permissions Control of alien invasive species Setbacks from wetland and riparian areas Maintenance of ecological infrastructure Activities are managed by an Environmental Management
Programme (EMPr) Management of solid and liquid waste

Biodiversity Sector Plan - Zululand District Municipality 2015
Octob e r 2 015 - Ve rs io n 2 .0 61
LAND USE CATEGORY LAND USE MANAGEMENT PRACTICES/CONTROLS IN PLACE
CIVIC AND SOCIAL
Category includes education, health, welfare, social services, places of worship, cemeteries and memorial parks
Activities have the legislated environmental permissions Control of alien invasive species Setbacks from wetland and riparian areas Maintenance of ecological infrastructure
INDUSTRY
Activities have the legislated environmental permissions Control of alien invasive species Setbacks from wetland and riparian areas Maintenance of ecological infrastructure Management of solid and liquid waste Activities are managed by an Environmental Management
Programme (EMPr)
INDUSTRIAL - EXTRACTIVE INDUSTRY / QUARRYING AND MINING
Mineral extraction by underground strip, opencast and quarrying, with related footprint of waste dumps, storage dumps, settlement ponds, processing & beneficiation
Activities have the legislated environmental permissions Control of alien invasive species Setbacks from wetland and riparian areas Maintenance of ecological infrastructure Activities are managed by an Environmental Management
Programme (EMPr)

Biodiversity Sector Plan - Zululand District Municipality 2015
Octob e r 2 015 - Ve rs io n 2 .0 62
Table 5-3: Terrestrial and Aquatic Land Use Management Guidelines
* Aquatic refers to both the freshwater and estuarine environments; ** Areas identified as ESA: WHS Buffer Areas also tend to have an additional set of land-use guidelines which are intended to address World heritage Site
Buffer requirements specifically; *** Assumption that all best land use practices are followed. Within PA, assumption that this is a land use management tool and only an option that is investigated where it is not possible to
utilise indigenous game to achieve the desired outcome.
Key
1.Compatible activity Recommended
2.Potential activity Potential may exist depending on the existing land-use and potential, the current ecological state, and the sustainable nature of the development type in question.
3.Incompatible activity Not Recommended
LAND-USE
NON-URBAN DEVELOPMENT MIXED TRADITIONAL URBAN AND
NON-URBAN DEVELOPMENT TRADITIONAL URBAN
DEVELOPMENT
AGRICULTURE
ENVIRONMENTAL SERVICES & CONSERVATIO
N AREAS
TOURISM INFRASTRUCTURE AND
SERVICES
RU
RA
L/T
RA
DIT
ION
AL S
ET
TLE
ME
NT
RE
SID
EN
TIA
L
MIX
ED
US
E
CIV
IC A
ND
SO
CIA
L
INDUSTRY
Conservation Category
IRR
IGA
TE
D C
RO
P
PR
OD
UC
TIO
N
EX
TE
NS
IVE
CR
OP
PR
OD
UC
TIO
N
INT
EN
SIV
E C
RO
P
PR
OD
UC
TIO
N
AG
RI-
IND
US
TR
Y
INT
EN
SIV
E P
RO
DU
CT
ION
O
F A
NIM
ALS
AN
D/O
R
AN
IMA
L P
RO
DU
CT
S
EX
TE
NS
IVE
AN
IMA
L
PR
OD
UC
TIO
N
FO
RE
ST
RY
CO
NS
ER
VA
TIO
N
MA
NA
GE
ME
NT
AN
D S
TE
WA
RD
SH
IP
EC
OLO
GIC
AL
INF
RA
ST
RU
CT
UR
E
MO
DIF
IED
OP
EN
SP
AC
E
LO
W I
MP
AC
T/ E
CO
-
TO
UR
ISM
ME
DIU
M I
MP
AC
T T
OU
RIS
M
HIG
H I
MP
AC
T T
OU
RIS
M
AIR
ST
RIP
RO
AD
S A
ND
RA
ILW
AY
S
UT
ILIT
IES
AN
D S
ER
VIC
ES
SE
WE
RA
GE
WO
RK
S
WA
TE
R W
OR
KS
PR
OJE
CT
S A
ND
CA
TC
HM
EN
T T
RA
NS
FE
RS
EX
TR
AC
TIV
E IN
DU
ST
RY
/
QU
AR
RY
ING
AN
D M
ININ
G
IND
US
TR
Y
TE
RR
ES
TR
IAL
Terrestrial Protected Area 3 3 3 3 3 3 3 1 3 3 2 3 3 2 3 3 2 3 3 3 3 3 3 3
Critical Biodiversity Area: Irreplaceable 3 3 3 3 3 1 3 1 1 3 2 3 3 2 2 2 2 3 3 3 3 3 3 3
Critical Biodiversity Area: Optimal 3 3 3 3 3 1 3 1 1 3 2 3 3 2 2 2 2 3 3 3 3 3 3 3
Ecological Support Areas 2 3 2 3 3 1 3 1 1 2 2 2 3 2 3 2 2 2 3 3 3 3 3 3
Ecological Support Areas : Protected Area Buffers
2 2 2 2 2 2 2 1 2 2 2 2 2 2 2 2 2 2 2 3 3 3 2 2
Ecological Support Areas: World Heritage Site Buffers**
2 2 2 2 2 2 2 1 2 2 2 2 2 2 2 2 2 2 2 3 3 3 2 2
AQ
UA
TIC
*
Critical Biodiversity Areas: Irreplaceable
3 3 3 3 3 1 3 1 1 3 2 3 3 3 2 2 3 3 3 3 3 3 3 3
Critical Biodiversity Areas: Optimal 3 3 3 3 3 1 3 1 1 3 2 3 3 3 2 2 3 3 3 3 3 3 3 3
Aquatic Ecological Support Area 3 3 2 3 2 1 3 1 1 3 2 2 3 3 2 2 3 2 2 3 3 3 3 3
Mo
dif
ied
/ D
eg
rad
ed
Natural 2 2 2 2 2 1 2 1 1 2 1 2 2 2 2 2 2 2 2 2 2 2 2 2
Modified: Degraded natural 2 2 2 1 2 1 2 2 1 2 1 2 2 2 2 2 2 2 2 2 2 2 2 2
Modified: Old cultivated lands 1 1 1 1 1 1 1 2 3 1 1 1 1 1 1 1 1 1 1 1 1 1 1 1
Modified: Agriculture 1 1 1 1 1 2 1 2 3 1 2 1 1 1 1 1 1 2 1 3 3 3 2 3
Built-up / Settlement 2 2 2 2 2 3 2 3 3 2 2 2 1 2 1 1 1 2 2 1 1 1 2 1
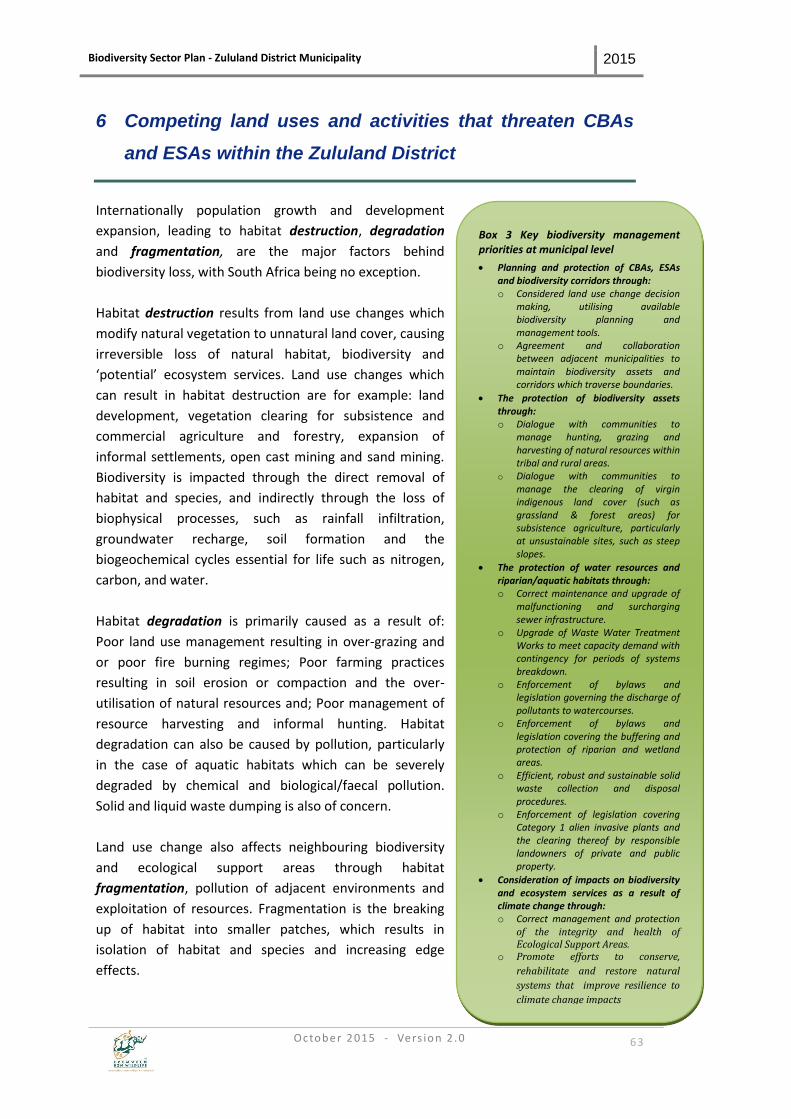
Biodiversity Sector Plan - Zululand District Municipality 2015
Octob e r 2 015 - Ve rs io n 2 .0 63
6 Competing land uses and activities that threaten CBAs
and ESAs within the Zululand District
Internationally population growth and development
expansion, leading to habitat destruction, degradation
and fragmentation, are the major factors behind
biodiversity loss, with South Africa being no exception.
Habitat destruction results from land use changes which
modify natural vegetation to unnatural land cover, causing
irreversible loss of natural habitat, biodiversity and
‘potential’ ecosystem services. Land use changes which
can result in habitat destruction are for example: land
development, vegetation clearing for subsistence and
commercial agriculture and forestry, expansion of
informal settlements, open cast mining and sand mining.
Biodiversity is impacted through the direct removal of
habitat and species, and indirectly through the loss of
biophysical processes, such as rainfall infiltration,
groundwater recharge, soil formation and the
biogeochemical cycles essential for life such as nitrogen,
carbon, and water.
Habitat degradation is primarily caused as a result of:
Poor land use management resulting in over-grazing and
or poor fire burning regimes; Poor farming practices
resulting in soil erosion or compaction and the over-
utilisation of natural resources and; Poor management of
resource harvesting and informal hunting. Habitat
degradation can also be caused by pollution, particularly
in the case of aquatic habitats which can be severely
degraded by chemical and biological/faecal pollution.
Solid and liquid waste dumping is also of concern.
Land use change also affects neighbouring biodiversity
and ecological support areas through habitat
fragmentation, pollution of adjacent environments and
exploitation of resources. Fragmentation is the breaking
up of habitat into smaller patches, which results in
isolation of habitat and species and increasing edge
effects.
Box 3 Key biodiversity management priorities at municipal level
Planning and protection of CBAs, ESAs and biodiversity corridors through: o Considered land use change decision
making, utilising available biodiversity planning and management tools.
o Agreement and collaboration between adjacent municipalities to maintain biodiversity assets and corridors which traverse boundaries.
The protection of biodiversity assets through: o Dialogue with communities to
manage hunting, grazing and harvesting of natural resources within tribal and rural areas.
o Dialogue with communities to manage the clearing of virgin indigenous land cover (such as grassland & forest areas) for subsistence agriculture, particularly at unsustainable sites, such as steep slopes.
The protection of water resources and riparian/aquatic habitats through: o Correct maintenance and upgrade of
malfunctioning and surcharging sewer infrastructure.
o Upgrade of Waste Water Treatment Works to meet capacity demand with contingency for periods of systems breakdown.
o Enforcement of bylaws and legislation governing the discharge of pollutants to watercourses.
o Enforcement of bylaws and legislation covering the buffering and protection of riparian and wetland areas.
o Efficient, robust and sustainable solid waste collection and disposal procedures.
o Enforcement of legislation covering Category 1 alien invasive plants and the clearing thereof by responsible landowners of private and public property.
Consideration of impacts on biodiversity and ecosystem services as a result of climate change through: o Correct management and protection
of the integrity and health of Ecological Support Areas.
o Promote efforts to conserve,
rehabilitate and restore natural
systems that improve resilience to
climate change impacts

Biodiversity Sector Plan - Zululand District Municipality 2015
Octob e r 2 015 - Ve rs io n 2 .0 64
Box 3 details key municipal level biodiversity management priorities within the District as a means to
mitigate the above impacts.
6.1 Land uses
Approximately 46% of the District forms part of the grassland biome, of which a significant portion
has undergone large scale transformation, with recent changes in conservation status (e.g.
reclassification from least threatened to vulnerable). Identified future threats to the District
comprise of high alien plant invasion suitability, high afforestation potential, and an increase of
population density (Driver, et al. 2004) .
Approximately half of the District falls under traditional tenure. Most of the balance is in private
ownership (mainly commercial farms), while relatively small areas are in state ownership, or private
ownership in towns. The state land comprises mainly nature conservation areas and Department of
Water Affairs and Forestry water resources and public works land.
The dominant land use in private and tribal lands is commercial and small-scale subsistence
agriculture, respectively. The settlement pattern reveals that a large portion of the district’s
population live in rural villages, many at some distance from the main road network. The geological
formations in the District have given rise to predominantly rugged terrain, with settlement and
agricultural development focusing on more accessible flatter areas. Settlement patterns in steeper
communally owned areas reflect the spatial configuration of access roads (Zululand District
Municipality 2013).
The 2013-2014 Zululand District IDP notes that up to the late 1990’s the District’s economy was
dependant on heavy coal mining, however as a result of the open markets on coal mining, many
mines have closed and the economy of the area has declined. The potential for economic growth in
Zululand is now seen to be within the tourism and agriculture sectors (Zululand District Municipality
2013).
Tourism
Tourism has already started to play a larger role in the economy of the area, and the District has
noted the need to market Zululand as a tourist and investment opportunity to attract development,
and to promote Zululand as an International Tourism Destination.
Zululand is a favourite haunt of both local and international bird watchers. One of Africa’s most
established and celebrated ecotourism initiatives, the Zululand Birding Route (ZBR), along with the
established Greater Limpopo Birding Route, are worth an estimated R50 million per year in direct
economic value to the South African region. Conservationists have pointed out that many of the 70
top ‘birding sites’ on the ZBR have been saved by this economic incentive toward conserving sites
important for birds and biodiversity.
Most of the eco-tourist facilities are located in the north and north-eastern areas of the district
(including Ithala Game Reserve, the Pongolapoort Dam and biosphere and the new Paris Dam as well
as a number of private game ranches. Other eco-tourist facilities are found in the south at Ulundi
Biodiversity Sector Plan - Zululand District Municipality 2015
Octob e r 2 015 - Ve rs io n 2 .0 65
(eMakhosini-Ophathe Heritage Park) and at various private game farms. A majestic expanse of
indigenous mountain forest is located south of Ithala. A gravel road winds its way into a less well
known part of the District, to the Ngome Forest and, within it, the Ntendeka wilderness area. The
Hluhluwe-iMfolozi Park flanks Zululand municipality on the east. There is significant potential for
integrating cultural and heritage tourism with conservation land uses in the District. The most
significant of these are in and surrounding the eMakhosini- Ophathe Heritage Park, coupled with the
cultural and historical sites around Ulundi town. Other important tourist areas relate to the
battlefields around Vryheid and Babanango, extending beyond the Zululand District, and the
promotion of game reserves such as Thaka Zulu.
Agriculture
Agriculture is a major sector within the Municipality and is noted as having the potential to
contribute to the development of employment opportunities as well as addressing matters related
to food security. The 2013-2014 IDP for the District sets out that:
Good agricultural potential exists in the western highlands and the eDumbe Municipality has very high potential as has most of the Abaqulusi municipality. High potential in the Phongola valley is as a result of irrigation opportunities that have been developed in this area. Current land cover reflects these potentials. The communal areas of Ulundi and Nongoma are however not as fortunate and the agricultural potential is marginal to poor except for the high lying plateaus in each district. However, these make up a small portion of the total area. Valley bushveld of the two Umfolozi Rivers does provide considerable potential for the development of irrigation. Given the high temperatures in these valleys and the moderate winters, these areas are perfectly suited for the production of vegetables in the winter or off-season. Moreover, the deep low altitude river valleys of Pongolo and Mfolozi Rivers provide an excellent opportunity for intensive agricultural production where irrigation is available where sugar cane and out of season vegetables and sub-tropical fruits can be planted. Agricultural potential outside these valleys is limited to stock and game farming.
The KZN Department of Agriculture has three primary programmes that focus on the emerging
farmer community within the Municipality. (i) Under the auspices of the Flagship Programme, the
Department of Agriculture has commenced implementation of the One Home, One Garden initiative
with effect from January 2011. Participants are identified by the extension officers on the basis of
need; each extension officer has a list of community gardens including those located within the
traditional authority areas. However, participation in this initiative is not limited to existing
community gardens; individuals are encouraged to make an approach to the Department for
assistance with a community garden. Part of this initiative is to continue assisting local schools by
providing them with a supply of vegetable seeds. The extension officers employed by the KZN
Department of Agriculture will jointly capacitate participants in this initiative on a ward by ward
basis, commencing with those wards identified as being most deprived. (ii) The mechanisation
programme implemented by the KZN Department of Agriculture assists indigent and subsistence
farmers with a tractor to plough their fields and provides these farmers with maize and vegetable
seeds. (iii) Protection of animals by the provision of veterinary health services is the third
programme operated by the KZN Department of Agriculture within the service area of the
Municipality (Zululand District Municipality 2013).
Further programmes are through the redistribution and restitution projects that are implemented
on behalf of the Department of Land Affairs. A number of projects have been identified by the
Department of Environment, Agriculture and Tourism, as part of the Agrarian Revolution
Biodiversity Sector Plan - Zululand District Municipality 2015
Octob e r 2 015 - Ve rs io n 2 .0 66
Programme, and the then Department of Water Affairs and Forestry has also identified 9 288
hectares of land for small-grower timber expansion.
Land use impacts
The relationship between ecosystem integrity and land use is well established and recognition
thereof is crucial in the description of the biodiversity profile of an area. Land uses compatible with
biodiversity objectives and goals are those under which most biodiversity and associated processes
are expected to persist in the long-term. In general, land uses that result in irreversible loss of
natural habitat have the highest impact on biodiversity, and land uses that allow for natural habitat
to remain largely intact, have a lower impact on biodiversity; the single most important indicator is
the proportional loss of a cover of natural vegetation to some other form of cover.
A 2005 study by O’Connor and Kuyler (O'Connor and Kuyler 2005), concluded that conservation,
livestock or game ranching had the lowest impact on biodiversity integrity and retained substantial
natural asset, while that for tourism/recreation was intermediate. All other land uses examined as
part of the study (rural settlement, dryland cropping, irrigated cropping, dairy farming, plantation
forestry, and urban settlement) had a severe impact. Impact on biodiversity integrity depended
mainly on the extent of transformation and fragmentation, which accounted for the greatest impact
on habitats and species, and impairment of landscape functioning.
Extensive livestock and game ranching based on natural grassland are the most compatible land uses
for biodiversity conservation, after Protected Areas, provided lands are not overgrazed. The
extensive nature of livestock ranching means that poor management, particularly overgrazing and
injudicious use of fire, can negatively impact large areas of land. Fire management is a significant
determinant of the extent to which the above land use can contribute to biodiversity targets. Many
of the grasslands are fireclimax and it is necessary that when fire is applied as a management tool
that it be done in way that simulates natural processes. Whilst fire is essential to the system,
unfortunately fire is generally applied at too frequent intervals (annually) to encourage a “spring
flush”. Negative impacts are exacerbated where grazing is applied shortly after burning at intensive
stocking rates. Unfortunately due to the seasonal palatability of the grasslands in the District this is a
common management strategy for both commercial and subsistence farmers. This practice has
resulted in a loss of biodiversity, significant loss of basal cover, increased soil loss through sheet and
gully erosion and an increase in the occurrence and spread of alien invasive vegetation. This impact
is being experienced in areas critical for biodiversity conservation, such as the Nzahlatshe Mountain.
This translates into a negative impact on catchment integrity; stream flow in the dry season may be
reduced or may cease to flow, summer flows may be exacerbated leading to flooding, soil erosion
increases, veld productivity is reduced, seasonal water scarcity, poorer water quality and increased
water vulnerability. In addition, the life span of water storage and abstraction infrastructure is
seriously reduced through sedimentation. With 98% of surface waters in South Africa already
allocated to users, the adoption of new supply enhancement strategies is urgent.
The largest water user in District is the irrigation sector (approximately 50%), predominantly for
sugarcane in the Pongola catchments. The ecological reserve accounts for 40% of the water use in
the District. There is also a significant proportion of forestry in the District that is classified and

Biodiversity Sector Plan - Zululand District Municipality 2015
Octob e r 2 015 - Ve rs io n 2 .0 67
regulated as a stream flow reduction activity (SFRA). The Pongola River may experience some
deficits during the winter months and in addition, the lower Mfolozi and Mkuze catchments have a
yield deficit due to large irrigation abstraction and water transfer from the Mfolozi to the Mhlathuze
catchments.
Expectations are that the overall District population will experience little change within the next 25
years, with a decline in rural population likely to be balanced by increased urbanisation.
Concomitantly, multiple livelihood strategies are common, integrating informal economic activities
with traditional dependency on natural resources. Dependency on natural resources of the region by
most rural communities is an issue of concern. The unnaturally high concentration of people in rural
areas, coupled with the expansive nature of settlement, has resulted in significant pressure on
natural resources. Over-grazing, injudicious burning regimes, sheet and donga erosion,
unsustainable harvesting of plants, hunting of wildlife, and the spread of alien invasive plants are the
primary threats.
The relationship between crop production and biodiversity conservation is largely negative. If such
activities have occurred in an area, then that area is considered unsuitable for meeting conservation
goals. Grassland or savanna biodiversity does not readily recover from transformation to pastures,
croplands, or timber plantations once these land uses are abandoned. Current cropland, pastures
and commercial forestry were represented as transformed areas in the BSP. These land uses,
especially commercial afforestation, impact negatively on porosity (the ease with which organisms
can move through the landscape), connectivity and water resources. In terms of water resources,
irrigation practises in agricultural production generally increase water use and chemical inputs into
the environment. Where natural grasslands have been converted to intensive and irrigated pastures
biodiversity loss is comparable with crop production. However, well managed agricultural areas have
the potential to contribute to the delivery of some ecosystem services, although at a reduced rate in
comparison with natural conditions.
Land transformed to urban use inherently experiences the greatest loss in biodiversity integrity
through direct loss of natural asset, increased demands on natural resources, increases in pollution,
and negative impacts on ecosystem processes. Roads impact on biodiversity through direct
transformation, associated infrastructural impacts, and human activity, and has an effect on
connectivity and porosity that is disproportionate to the area transformed. Roads also often result in
ribbon development on account of improved accessibility. The identification of roads as
development corridors amplifies this risk.
Coal mining areas pose a significant threat to water quality, particularly in this District as the
majority are situated in the headwaters of the major river systems in the District, which also
comprise high water yield areas. Other potential mining activities, such as gold and diamond mining
generally pose only direct threats to biodiversity through transformation activities.
Biodiversity Sector Plan - Zululand District Municipality 2015
Octob e r 2 015 - Ve rs io n 2 .0 68
6.2 Invasive alien species
Apart from directly impacting on the integrity of habitat for indigenous biota, alien invasive plants
can alter ecosystem functioning, substantially reduce the productive value of land, and significantly
impact hydrological functioning depending on the scale of the invasion and the type of alien species.
Alien infestations may result in marked declines in stream flow; transformation of vegetation
composition and structure; local extirpation of individual plant or animal species or plant
communities; alteration of patterns of nutrient cycling and fire regime; accelerated soil erosion; and
rendering areas less accessible to management. In terms of livelihoods, invasive alien plants may
impact on tourism and agricultural production. Alien trees frequently disrupt tourism view-sheds,
and dense bramble may block access paths. This loss of productive land to alien plant invasions is a
significant concern as it often results in increasing pressure and degradation on remaining land that
may promote further invasion of alien plants. In many cases, the cost of clearing a dense infestation
exceeds the value of the land, resulting in significant management costs that need to be borne by
the landowner thus reducing profit margins (in commercial ventures) or increasing the vulnerability
of the rural poor.
There is however, an opportunity for contributions to rural livelihoods through employment
opportunities in eradication operations, as well as the beneficiation of some species as they provide
materials for the production of various household and saleable items such as building material, fuel
wood, crafts and furniture. One of these programmes is the Working for Water Programme, which is
a DWAF funded programme that targets the removal of invasive alien vegetation from riparian zones
using local labour. The target is to improve surface flow volumes and quality thereby providing
further water available for reticulation.
Bush encroachment is also a key threat in the region. Climate change is purported to favour the
expansion of woody species. Coupled with changes in burning and grazing regimes, woody species,
particularly, Acacia species have encroached into grassland areas, replacing high biodiversity value
grasslands with relatively low diversity bushveld and dense savanna.
6.3 Soil erosion potential
Soil erosion negatively impacts on ecosystem integrity through habitat degradation and suboptimal
ecosystem services. The ARC Potential Soil Erosion Map (Le Roux, et al. 2008) was used to identify
areas of high erosion potential. The majority of areas subject to significant erosion potential are
located within rural settlement areas, particularly the high erosion risk areas, especially within the
Nongoma Local Municipality and in the vicinity of Ulundi (See Figure 6-1).

Biodiversity Sector Plan - Zululand District Municipality 2015
Octob e r 2 015 - Ve rs io n 2 .0 69
Figure 6-1 Soil erosion potential for Zululand District
Biodiversity Sector Plan - Zululand District Municipality 2015
Octob e r 2 015 - Ve rs io n 2 .0 70
6.4 Climate change
As the dominant driver of biodiversity loss by the end of the 21st century (Millennium Ecosystem
Assessment 2005), climate change impacts, such as increased severity and unpredictability of
droughts, storms, and floods, and altered rainfall patterns, higher temperatures and higher
evaporation and transpiration will place more pressure on biodiversity assets and ecosystems.
Increased spread of diseases, increased fire risk and spread of exotic species are amongst the
secondary impacts of climate change placing increased pressure on biodiversity. As a result
biodiversity and ecosystem support areas need to be managed in such a way that their resilience to
extreme events is maintained and enhanced. Resilience enables ecosystems to absorb both
expected and unforeseen change, in order to retain ecological functioning (Cadman, et al. 2010).
The healthier and more biodiverse an ecosystem, and the better the maintenance of biodiversity
patterns, connectivity and ecosystem processes, the more resilient the biodiversity and ecological
support areas will be to climate change impacts. As a result biodiversity planning and management
needs to take account of the findings of climate change risk assessments (Laros and Jones 2010).
Ecological corridors and habitat buffer areas are important mechanisms for maintaining ecological
networks, allowing plants and animals to migrate, disperse and adapt to the pressures of changing
habitat conditions and climate (Cadman, et al. 2010).
Climate change scenarios predict major changes in biome distribution in South Africa. Individual
species and ecosystems will respond differently to climate change, some potentially increasing in
abundance or range, others declining or contracting. Ecosystems will experience changes in their
species mix, and these changes may increase their vulnerability to further change or to climate
extremes. Models indicate that climate change impacts will largely consist of latitudinal and
altitudinal shifts in potential species' distributions while others suggest that the complete
disappearance of critical climate types and dependent species are possible. Climate change will
affect not only the survivorship of particular species, but also fragment the landscape and affect the
natural resources that species have adapted to use in their natural environment. Species are thus
marginalised and forced to move elsewhere to find places to live and food to eat. The impact of
climate change will therefore increase the risk of species extinction and impact on biodiversity
integrity. This District comprises biophysical and altitudinal gradients extending in all directions,
primarily as a result of the central and western highland areas, which highlights the critical role that
this municipality is likely to perform in biodiversity conservation in response to climate change. The
2004 NSBA (Driver, et al. 2004) concluded that this District includes areas of biome resilience, where
the current biome may persist in the face of climate change, under different climate change
scenarios. However, ongoing fragmentation increases vulnerability to climate change and reduces
resilience.

Biodiversity Sector Plan - Zululand District Municipality 2015
Octob e r 2 015 - Ve rs io n 2 .0 71
6.4.1 Impacts of climate change on biodiversity and ecosystem services
The White Paper on the National Climate Change Response (DEA 2011a) details the following
findings regarding the impacts of climate change on biodiversity and ecosystem services in South
Africa:
Biodiversity: impacts of climate change
Up to 30% of endemic species may be at an increasingly high risk of extinction by the latter
half of this century if climate change is unmitigated.
Marine ecosystems and species are at risk from changes in water temperature, ocean
acidification and changes in ocean current.
Changes in rainfall patterns and temperatures, and rising atmospheric carbon dioxide levels
could shift the distribution of terrestrial biomes with many implications for species diversity,
ecosystem processes such as wildfires, and critical ecosystem services such as water yield
and grazing biomass.
Increasing frequency of extreme rainfall events will influence runoff quality and quantity in
complex ways, significantly affecting the marine and estuarine environment. Reduced water
flow will increase the salinity of estuaries, affecting the breeding grounds and nursery areas
of many marine species. Coastal estuaries will also be vulnerable to long-term sea-level rise.
Rising atmospheric carbon dioxide has poorly known direct effects on ecosystems. It may be
increasing the cover of shrubs and trees in Grassland and Savannah Biomes, with mixed
effects on biodiversity and possible positive implications for carbon sequestration.
Additional stresses to biodiversity resulting from climate change include wildfire frequency
(which appears to already show climate change-related` increases in the Fynbos Biome), and
the prevalence of invasive alien species. These stresses combined with reduced and
fragmented habitats will further increase the vulnerability of biodiversity to climate change.
Water resources: impacts of climate change
Based on current projections South Africa will exceed the limits of economically viable land-
based water resources by 2050. The adequate supply of water for many areas can be
sustained only if immediate actions are taken to stave off imminent shortages. The water
sector must balance the allocation of limited water resources amongst major users
(agriculture, domestic urban use and industry), whilst addressing the need to ensure fair
access to water for all South Africa's people as well as a sufficient ecological allocation to
maintain the integrity of ecosystems and thereby the services they provide.
Rainfall is expected to become more variable, with an increase of extreme events such as
flooding and droughts resulting in a much more variable runoff regime.
Increased rainfall intensity will exacerbate scouring in rivers and sedimentation in dams,
potentially impacting on water supply and treatment infrastructure.
Higher temperatures, combined with higher carbon dioxide levels, will contribute to
increased growth of algae as well as faster evaporation rates negatively impacting water
resources.
Downscaled climate modelling suggests that the western and interior parts of the country
are likely to become drier, and the eastern parts of the country wetter.

Biodiversity Sector Plan - Zululand District Municipality 2015
Octob e r 2 015 - Ve rs io n 2 .0 72
6.4.2 Mitigation of climate change impacts on biodiversity and ecosystem
services
The climate change impact mitigation strategies proposed in the White Paper on the National
Climate Change Response (DEA 2011a) and which have relevance to activities at a municipal level,
include the following:
Biodiversity: mitigation of climate change impacts
Conserve, rehabilitate and restore natural systems that improve resilience to climate change
impacts or that reduce impacts. For example, mangrove forests reduce storm surge impacts
and riparian vegetation and wetland ecosystems reduce the potential impact of floods.
Opportunities to conserve biodiversity and extend the conservation estate through the
development of carbon off-set programmes to be actively developed.
Expand the protected area network (in line with the National Protected Area Expansion
Strategy) where it improves climate change resilience, and manage threatened biomes,
ecosystems, and species in ways that will minimise the risks of species extinction.
Encourage partnerships for effective management of areas not under formal protection,
especially freshwater ecosystem priority areas, critical biodiversity areas, ecological support
areas and threatened ecosystems.
Enhance existing programmes to combat the spread of terrestrial and marine alien and
invasive species, especially in cases where such infestations worsen the impacts of climate
change.
Water resources: mitigation of climate change impacts Integrating climate change considerations in the short-, medium- and long-term water
planning processes across relevant sectors such as agriculture, industry, economic
development, health, science and technology.
Ensuring that water adaptation measures are managed from a regional perspective given the
transboundary nature of our major rivers.
Implementing best catchment and water management practices to ensure the greatest
degree of water security and resource protection under changing climatic conditions and, in
particular, investment in water conservation and water demand management.
Exploring new and unused resources, particularly groundwater, re-use of effluent, and
desalination.
Reducing the vulnerability and enhancement of the resilience to water-related impacts of
climate change in communities and sectors at greatest risk.

Biodiversity Sector Plan - Zululand District Municipality 2015
Octob e r 2 015 - Ve rs io n 2 .0 73
7 Conclusions and recommendations
The following tasks are essential within the Zululand District to achieving biodiversity targets in the
long term:
All planners, environmental consultants and developers must consult the BSP map to
determine the biodiversity conservation status of land which is under application for
development or land use change.
The land use guidelines within this document must be consulted to determine which land uses
and land management types are compatible based on the biodiversity status of the land.
When decision making covers land within proximity of municipal boundaries, district and local
municipal level planners must ensure collaboration with planners from adjacent
municipalities, and in accordance with their appropriate BSP or environmental plan, regarding
alignment of biodiversity conservation planning, and land use change applications.
Areas shown as critical for biodiversity or ecosystem maintenance within the BSP must be
appropriately buffered from development and land use change impacts, in consultation with
Ezemvelo KZN Wildlife, Environmental Affairs and Water Affairs.
Best practise land management to be put in place.
Alien clearing programs put in place.

Biodiversity Sector Plan - Zululand District Municipality 2015
Octob e r 2 015 - Ve rs io n 2 .0 74
8 References
Begg, G.W. 1989. The wetlands of Natal (Part 3) The location, status and function of the
priority wetlands of Natal. Natal Town and Regional Planning Report 73.
Bentrup, G. 2008. Conservation Buffers: design guidelines for buffers, corridors and
greenways. Gen. Tech. Rep. SRS - 109. Asheville, NC: Department of Agriculture,
Forestry Service, Southern Reserch Station.
n.d. BGIS. Accessed January 2013. http://bgis.sanbi.org/ecosystems/project.asp.
Briginshaw, D M, M Kahn, and C A.C Ferguson. 2011. KwaZulu-Natal Land Use
Management System Guidelines for the Preparation of Schemes for Municipalities. KZN
Department of Co-operative Governance and Traditional Affairs.
Cadman, M, C Petersen, A Driver, N Sekhran, K Maze, and S Munzhedzi. 2010. Biodiversity
for Development: South Africa’s landscape approach to conserving biodiversity and
promoting ecosystem resilience. . South African National Biodiversity Institute.
Collett, A, and F J Mitchell. 2012. KwaZulu-Natal Agricultural: Land Potential Categories
Internal Report, V1, KZN Report N/A/2012/12. KZN Agriculture and Environmental Affairs
and Agriculture, Forestry and Fisheries.
DEA. 2011a. “National Environmental Managment: Biodiversity Act: National List of
ecosystems that are threatened and in need of protection.” Government Gazette
No,34809 in Government Notice No.1002 of 9 December 2011. 9 December.
DEA. 2011a. White Paper on the National Climate Change Response. Government Notice
No. 757 in Government Gazette No. 34695 of 19 October 2011.
DEAT. 2009. “National Environmental Management Biodiversity Act, 2004: Guideline
Regarding the Determination of Bioregions and the Preparation of and Publication of
Bioregional Plans.” Government Gazette No. 32006 in Government Gazette Notice
No.291 of 16 March 2009. Pretoria.
Driver, A et al. 2011. “Implementation Manual for the Freshwater Ecosystem Priority Areas.”
WRC Report No. 1801/1/11, August.
Driver, A, K Maze, M Rouget, A T Lombard, J Nel, J K Turpie, R M Cowling, et al. 2004.
“Nationaol Spatial Biodiversity Assessment 2004: Priorities for biodiversity conservation in
South Africa.”
Driver, A., K.J. Sink, J.L. Nel, S. Holness, L. Van Niekerk, F. Daniels, Z. Jonas, P.A. Majiedt,
L. Harris, and K. Maze. 2012. National Biodiversity Assessment 2011: An assessment of
South Africa’s biodiversity and ecosystems. Synthesis Report. Pretoria: South African
National Biodiversity Institute and Department of Environmental Affairs.
EKZNW. 2008. “Biodiversity Stewardship Operations Manual, V2, March 2008.”
EKZNW. 2007b. Ezemvelo KwaZulu-Natal Modelled Priority Water Production Surface 2007
V1.0. Unpublished GIS Coverage [watpro07_w31], Biodiversity Conservation Planning
Division, Ezemvelo KZN Wildlife, P. O. Box 13053, Cascades, Pietermaritzburg, 3202.
EKZNW. 2010e. KwaZulu-Natal Provincial Macro-Ecological Corridors version 3.
Unpublished GIS Coverage [kzncor05v310_wll], Biodiversity Conservation Planning
Division, Ezemvelo KZN Wildlife, P. O. Box 13053, Cascades, Pietermaritzburg, 3202.
EKZNW. 2014. “KZN Biodiversity Spatial Planning Terms & Processes. Version 3, February
2014. Ezemvelo KwaZulu-Natal Wildlife, Pietermaritzburg.”
Biodiversity Sector Plan - Zululand District Municipality 2015
Octob e r 2 015 - Ve rs io n 2 .0 75
EKZNW. 2011. “KZN Conventional Transformation 2008 V1.1. Unpublished GIS data
[Conventional_Transformation_Layer], Biodiversity Conservation Planning Division,
Ezemvelo KZN Wildlife, P. O. Box 13053, Cascades, Pietermaritzburg, 3202.”
EKZNW. 2013. KZN Estuarine Protected Area Expansion Plan 2012/13: Identifying the 20%
priority estuaries to be recommended for Department of Environmental Affairs for
proclamation by 2014. Unpublished Report, Biodiversity Conservation Planning Division,
Ezemvelo KZN Wildlife, P. O. Box 13053, Cascades, Pietermaritzburg, 3202.: EKZNW.
EKZNW. 2009a. KZN Protected Area Expansion strategy and Action Plan (2009-2028).
Pietermaritzburg: Ezemvelo KZN Wildlife unpublished report.
Ezemvelo KZN Wildlife. 2013. “Document describing the Conservation Planning Terms for
the EKZNW Spatial Planning Products. Version 2, 30 January 2013. Ezemvelo KwaZulu-
Natal Wildlife, Pietermaritzburg.”
Government of South Africa. 2008. National Protected Area Expansion Strategy for South
Africa 2008: Priorities for expanding the protected area network for ecological
sustainability and climate change adaption. Pretoria: Government of South Africa.
IUCN. 2011. IUCN Redlist of Threatened Species. Accessed May 2011.
http://www.iucnredlist.org.
Jewitt, D. 2009. Summary: Development of the macro-ecological corridors of KZN, Internal
Report,Biodiversity Conservation Planning Division, Ezemvelo KZN Wildlife, P. O. Box
13053, Cascades, Pietermaritzburg.
Laros, M. T., and F. E. Jones. 2010. Local Action for Biodivesity Guidebook: Biodiversity
Managment for Local Governments. Local Governments for Sustainability and IUCN.
Le Roux, J J, T H Morgenthal, J Malherbe, D J Pretorius, and P D Sumner. 2008. “Water
erosion prediction at a national scale for South Africa. Department of Geography,
Geoinformatics and.”
Malan, G. 2001. “The avifauna of riparian-Pinus habitat edges at Mooiplaas forestry estate,
KwaZulu-Natal, South Africa.” South African Journal of Wildlife Research 31: 73 - 84.
Millennium Ecosystem Assessment. 2005. Ecosystems and Human Well-being: Biodiversity
Synthesis. . Washington, DC.: World Resources Institute.
O'Connor, T G, and P Kuyler. 2005. “National Grasslands Initiative: Identification of
Compatible Land Uses for Maintaining Biodiversity Integrity. Report for the South African
National Biodiversity Institute's National Grasslands Biodiversity Programme.”
n.d. Peace Parks Foundation. Accessed January 2013. http://www.peaceparks.co.za.
SANBI's Grassland Programme. 2012. “Dialogue on Ecological Infrastructure.” Dialogue on
Ecological Infrastructure. 8.
Thorn-Ex cc, and Afzelia Environmental Consulting. 2011. “Biodiversity Sector Plan for the
Zululand District,Municipality, KwaZulu-Natal: Technical Report February 2010.”
Turpie, J.K., and L. Van Niekerk. 2012. South African National Biodiversity Assessment
2011: Technical Report. Volume 3: Estuary Component. Stellenbosch: CSIR Report
Number CSIR/NRE/ECOS/ER/2011/0045/B. Council for Scientific and Industrial
Research.
UNECSO. 2009. World Heritage And bufferZones, World Heritage Papers 25. UNESCO
World Heritage Centre.
Zululand District Municipality. 2013. “Zululand District Municipality Integrated Development
Plan for 2013 2014.”

Biodiversity Sector Plan - Zululand District Municipality 2015
Octob e r 2 015 - Ve rs io n 2 .0 76
n.d. About the Ramsar Convention. Accessed January 2013.
http://www.ramsar.org/cda/en/ramsar-about-about-ramsar/main/ramsar/1-
36%5E7687_4000_0_.
n.d. About World Heritage. Accessed January 2013. http://whc.unesco.org/.
n.d. “EIA Regulations, 2010.” GN R.543 in GG 33306 of 18 June 2010.

Biodiversity Sector Plan - Zululand District Municipality 2015
Octob e r 2 015 - Ve rs io n 2 .0 77
Appendices
Appendix 1: Buffers used in the formation of CBAs and ESAs
There are three main forms of buffer which are considered in the creation of the KZN Biodiversity
Planning process; namely those that reflect land-use management guideline principals associated
with agreements and/or conventions, those that must be considered in order to better reflect a
mapped feature (e.g., buffer a river line to more accurately reflect the width aspect associated with
the feature in question), and those that are associated with geographical feature and/or a specific
species that are required to ensure the persistence of that feature or specific species.
Policy buffers
Buffers which have been created to reflect areas of interest based on National and/or International
agreements and/or legislation.
Map category Buffer Buffer Reasoning
Protected Areas 5km unless
otherwise stated
Based on EIA Regulations, 2010 identified area of geographic
concern
World Heritage Site 10km unless
otherwise stated
Based on EIA Regulations, 2010 identified area of geographic
concern
Mapping buffers
Unlike the terrestrial and estuarine features which are reflected as polygon features (i.e., display
areas of importance); the riverine features are currently reflected as a series of mapped lines
interspersed with polygons reflecting areas of obvious larger surface water extent. In order to better
reflect these features areas of influence, three key principals were adopted when trying to more
accurately reflect the extent of these features in the end mapped products:
A standard dataset was used to reflect these features, in this case the river line and polygon
features extracted from the 1:50000 topographic datasets.
All perennial rivers were assumed to have a 15m width, with non-perennials reflecting a
slightly smaller 10m width.
All sections of the topographic rivers captured as polygons were NOT assigned these buffers.
CBA/ESA buffers
These buffers were applied to the mapped features identified as either Critical Biodiversity Areas
(CBA) or Ecological Support Areas (ESA). These were developed to better reflect the zones of
influence associated with each of these respective zones, aiding to protect the ‘core’ areas of
concern from edge effects, as well as providing ecological support at the same time, e.g. forage
areas, movement corridors, etc.

Biodiversity Sector Plan - Zululand District Municipality 2015
Octob e r 2 015 - Ve rs io n 2 .0 78
Summary of Buffers utilised in the Critical Biodiversity Area and Ecological Support Area Categories
Map category Layer Buffer Buffer Reasoning
CBA:
Irreplaceable
FSCA and FEPA Fish Sanctuary
(Cr and EN) associated perennial
rivers coverage extracted from
the 1:50000 topographic river
network and buffered
30m This is based on several papers and regulatory guidelines (EIA
Regulations, 2010 n.d.) and Gauteng Guidelines (within
urban edges), this minimum distance seems to best protect
aquatic habitat functions (leaf and woody input), aquatic
species diversity and water temperature (Bentrup 2008).
CBA: Optimal FSCA and FEPA Fish Sanctuary
(Vu and NT) associated
perennial rivers coverage
extracted from the 1:50000
topographic river network and
buffered
30m This is based on several papers and regulatory guidelines (EIA
Regulations, 2010 n.d.) and Gauteng Guidelines (within
urban edges), this minimum distance seems to best protect
aquatic habitat functions (leaf and woody input), aquatic
species diversity and water temperature (Bentrup 2008).
CBA:
Irreplaceable
Linkage
FEPA flagship free flowing
rivers, adapted to the perennial
rivers coverage extracted from
the 1:50000 topographic river
network and buffered
30m This is based on several papers and regulatory guidelines (EIA
Regulations, 2010 n.d.) and Gauteng Guidelines (within
urban edges), this minimum distance seems to best protect
aquatic habitat functions (leaf and woody input), aquatic
species diversity and water temperature (Bentrup 2008).
Ecological
Support Areas
FSCA identified wetlands 100m NFEPA generic buffer as per the NFEPA guideline for FEPA
priority wetland
KZN 24 priority wetlands 500m The 24 priority wetlands as identified by Beggs (Begg
1989).received a NFEPA generic buffer as per the NFEPA
guideline for FEPA priority wetland clusters
FEPA priority wetland clusters 500m This was defined in the NFEPA generic buffer guideline
FEPA flagship free flowing
rivers, KZN free flowing rivers
and FSCA associated perennial
rivers coverage extracted from
the 1:50000 topographic river
network and buffered
70m This ESA 70m buffer was added in addition to the CBA 30m
buffer already applied, bringing the combined buffer width
to 100m. This is the commonly ascribed buffer ascribed in
the EIA Regulations (2010), the Dept. Water Affairs
Guidelines, the FEPA generic buffer and the Gauteng
Guideline document.
FSCA identified non-perennial
rivers extracted from the
1:50000 topographic river
network coverage and buffered
70m This ecotonal buffer provides supporting habitat for the
continued existence of key fauna and flora within the
associated ESA river systems. The distance supports
avifaunal requirements (Malan 2001), as well as meets the
requirements of a large number of aquatic species as well as
aids in the mitigation of adverse impacts upon a number of
abiotic factors such as hydrology and water temperature
(Bentrup 2008)
Priority estuaries Still to
be
defined
The buffer distance defined applies primarily to estuaries
identified as being important for migrant birds.
ESA: landscape
corridors
KZN top 10 free flowing rivers
adapted to 1:50000 topographic
coverage river network
(excluding the 4 NFEPA
identified Flag Ship rivers
located within KZN)
70m This ESA 70m buffer was added in addition to the CBA 30m
buffer already applied, bringing the combined buffer width
to 100m. This is the commonly ascribed buffer ascribed in
the EIA Regulations (2010), the Dept. Water Affairs
Guidelines, the FEPA generic buffer and the Gauteng
Guideline document.

Biodiversity Sector Plan - Zululand District Municipality 2015
Octob e r 2 015 - Ve rs io n 2 .0 79
Appendix 2: Metadata list for spatial information used in the mapping procedures for
development of the Zululand District Municipality Biodiversity Sector Plan

Biodiversity Sector Plan - Zululand District Municipality 2015
Octob e r 2 015 - Ve rs io n 2 .0 80
Appendix 3: Local Stakeholder and Expert input
Site Aspect REFERENCES identified
Upper Pongola Biodiversity Stewardship Initiative
This conglomerate of farms consists of large areas of intact grasslands and contains NFEPA wetlands. Priority species such as Oribi (EN), Rudds Lark (EN), Wattled Crane (CR) and Grey Crowned Crane (EN) contribute to the site conservation value.
Mnguni, 2013 a,b,c. KZN Biodiversity Stewardship Programme: Site Assessment for the Upper Pongola Biodiversity Stewardship initiative.
Angus Burns/ EKZNW NHS047
Zululand District Municipality 1 Blue Swallow EKZNW Red Data List & Blue Swallow Database; EKZNW BSP For Zululand District Municipality (FEB 2010)
Zululand District Municipality 11 Oribi EKZNW Oribi Database; EKZNW BSP For Zululand District Municipality (FEB 2010)
Zululand District Municipality 12 Oribi EKZNW Oribi Database; EKZNW BSP For Zululand District Municipality (FEB 2010)
Zululand District Municipality 13 Oribi EKZNW Oribi Database; EKZNW BSP For Zululand District Municipality (FEB 2010)
Zululand District Municipality 2 Oribi EKZNW Oribi Database; EKZNW BSP For Zululand District Municipality (FEB 2010)
Zululand District Municipality 21 Oribi EKZNW Oribi Database; EKZNW BSP For Zululand District Municipality (FEB 2010)
Zululand District Municipality 23 Vulture & Blue Crane EKZNW Red Data List, Vulture & Blue Crane Database; EKZNW BSP For Zululand District Municipality (FEB 2010)
Zululand District Municipality 24 Vulture & Blue Crane EKZNW Red Data List, Vulture Database & Blue Crane Database; EKZNW BSP Zululand District Municipality (FEB 2010)
Zululand District Municipality 27 Blue Crane EKZNW Red Data List & Blue Crane Database; EKZNW BSP Zululand District Municipality (FEB 2010)
Zululand District Municipality 28 Blue Crane EKZNW Red Data List & Blue Crane Database; EKZNW BSP Zululand District Municipality (FEB 2010)
Zululand District Municipality 3 Oribi EKZNW Oribi Database; EKZNW BSP For Zululand District Municipality (FEB 2010)
Zululand District Municipality 30 Vulture EKZNW Red Data List & Vulture Database; EKZNW BSP Zululand District Municipality (FEB 2010)
Zululand District Municipality 31 Vulture & Wattled Crane EKZNW Red Data List, Wattled Crane & Vulture Database; EKZNW BSP Zululand District Municipality (FEB 2010)

Biodiversity Sector Plan - Zululand District Municipality 2015
Octob e r 2 015 - Ve rs io n 2 .0 81
Site Aspect REFERENCES identified
Zululand District Municipality 32 Vulture EKZNW Red Data List & Vulture Database; EKZNW BSP Zululand District Municipality (FEB 2010)
Zululand District Municipality 34 Vulture EKZNW Red Data List & Vulture Database; EKZNW BSP Zululand District Municipality (FEB 2010)
Zululand District Municipality 37 Vulture EKZNW Red Data List & Vulture Database; EKZNW BSP Zululand District Municipality (FEB 2010)
Zululand District Municipality 38 Vulture EKZNW Red Data List & Vulture Database; EKZNW BSP Zululand District Municipality (FEB 2010)
Zululand District Municipality 4 Oribi EKZNW Oribi Database; EKZNW BSP For Zululand District Municipality (FEB 2010)
Zululand District Municipality 40 Vulture EKZNW Red Data List & Vulture Database; EKZNW BSP Zululand District Municipality (FEB 2010)
Zululand District Municipality 41 Vulture EKZNW Red Data List & Vulture Database; EKZNW BSP Zululand District Municipality (FEB 2010)
Zululand District Municipality 42 Vulture EKZNW Red Data List & Vulture Database; EKZNW BSP Zululand District Municipality (FEB 2010)
Zululand District Municipality 42 Vulture EKZNW Red Data List & Vulture Database; EKZNW BSP Zululand District Municipality (FEB 2010)
Zululand District Municipality 47 Blue Crane, Wattled Crane & Vulture EKZNW Red Data List, Blue Crane, Wattled Crane & Vulture Database; EKZNW BSP Zululand District Municipality (FEB 2010)
Zululand District Municipality 48 Ngome State Forest 1:50000 Topographic Map; EKZNW BSP Zululand District Municipality (FEB 2010)
Alex Wood
Zululand District Municipality 49 Nhlazatshe Mountain Cycad Colony EKZNW BSP Zululand District Municipality (FEB 2010) Alex Wood
Zululand District Municipality 50 Priority Plant Areas EKZNW BSP Zululand District Municipality (FEB 2010) Alex Wood
Zululand District Municipality 52 Priority Plant Areas EKZNW BSP Zululand District Municipality (FEB 2010) Alex Wood
Zululand District Municipality 53 Priority Plant Areas EKZNW BSP Zululand District Municipality (FEB 2010) Alex Wood
Zululand District Municipality 54 Priority Plant Areas EKZNW BSP Zululand District Municipality (FEB 2010) Alex Wood
Zululand District Municipality 55 Priority Plant Areas EKZNW BSP Zululand District Municipality (FEB 2010) Alex Wood
Zululand District Municipality 56 Protea Gaguedi EKZNW BSP Zululand District Municipality (FEB 2010) Alex Wood
Zululand District Municipality 57 Red Aloe EKZNW BSP Zululand District Municipality (FEB 2010) Alex Wood
Zululand District Municipality 58 Rensberg Cycad Colony and Priority Plant Areas EKZNW BSP Zululand District Municipality (FEB 2010) Alex Wood
Zululand District Municipality 59 Senqeni Cycad Colony and Priority Plant Areas EKZNW BSP Zululand District Municipality (FEB 2010) Alex Wood

Biodiversity Sector Plan - Zululand District Municipality 2015
Octob e r 2 015 - Ve rs io n 2 .0 82
Site Aspect REFERENCES identified
Zululand District Municipality 6 Oribi EKZNW Oribi Database; EKZNW BSP For Zululand District Municipality (FEB 2010)
Zululand District Municipality 60 Hlomo Hlomo Cycad Colony and Priority Plant Areas EKZNW BSP Zululand District Municipality (FEB 2010) Alex Wood
Zululand District Municipality 60 Hlomo Hlomo Cycad Colony and Priority Plant Areas EKZNW BSP Zululand District Municipality (FEB 2010) Alex Wood
Zululand District Municipality 61 Ngome State Forest & Blue Swallow EKZNW Red Data List & Blue Swallow Database; 1:50000 Topographic Map; EKZNW BSP Zululand District Municipality (FEB 2010)
Zululand District Municipality 62 Ngome State Forest & Blue Swallow EKZNW Red Data List & Blue Swallow Database; 1:50000 Topographic Map; EKZNW BSP Zululand District Municipality (FEB 2010)
Zululand District Municipality 62 Ngome State Forest & Blue Swallow EKZNW Red Data List & Blue Swallow Database; 1:50000 Topographic Map; EKZNW BSP Zululand District Municipality (FEB 2010)
Zululand District Municipality 63 Priority Plant List & Vulture EKZNW Red Data List & Vulture Database; EKZNW BSP Zululand District Municipality (FEB 2010)
Zululand District Municipality 64 Priority Plant List & Vulture EKZNW Red Data List & Vulture Database; EKZNW BSP Zululand District Municipality (FEB 2010)
Zululand District Municipality 65 Blue Crane, Blue Swallow & Ngome State Forest EKZNW Red Data List, Blue Crane & Blue Swallow Database; 1:50000 Topographic Map; EKZNW BSP Zululand District Municipality (FEB 2010)
Zululand District Municipality 8 Oribi EKZNW Oribi Database; EKZNW BSP For Zululand District Municipality (FEB 2010)