Embed Size (px)
Citation preview

Profitability
Chapter 8
© 2011 Cengage Learning. All Rights Reserved. May not be scanned, copied or duplicated, or posted to a publicly accessible website, in whole or in part.
Chapter 8, Slide #2
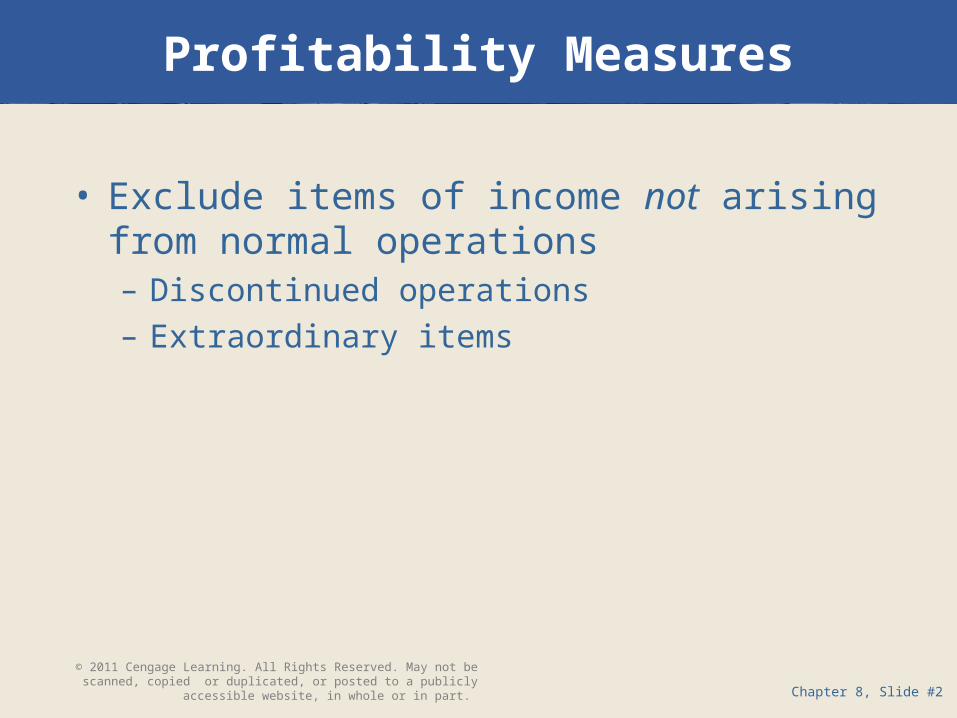
Profitability Measures
• Exclude items of income not arising from normal operations– Discontinued operations– Extraordinary items
© 2011 Cengage Learning. All Rights Reserved. May not be scanned, copied or duplicated, or posted to a publicly accessible website, in whole or in part.

Chapter 8, Slide #3
Net Profit Margin
• Also referred to as return on sales• Reflects net income dollars generated by each dollar of sales• Potential distortion
– Net “other” income or loss
Net Income Before Noncontrolling Interest,Equity Income, and Nonrecurring Items
Net Sales
© 2011 Cengage Learning. All Rights Reserved. May not be scanned, copied or duplicated, or posted to a publicly accessible website, in whole or in part.
Chapter 8, Slide #4
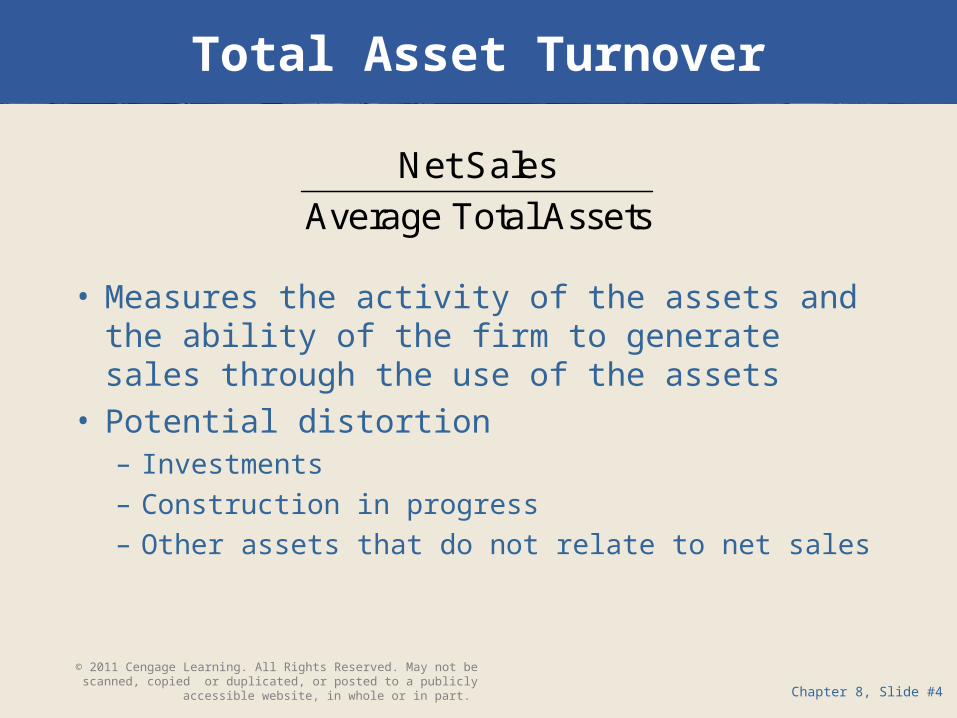
Total Asset Turnover
• Measures the activity of the assets and the ability of the firm to generate sales through the use of the assets
• Potential distortion– Investments– Construction in progress– Other assets that do not relate to net sales
Net Sales
Average Total Assets
© 2011 Cengage Learning. All Rights Reserved. May not be scanned, copied or duplicated, or posted to a publicly accessible website, in whole or in part.
Chapter 8, Slide #5
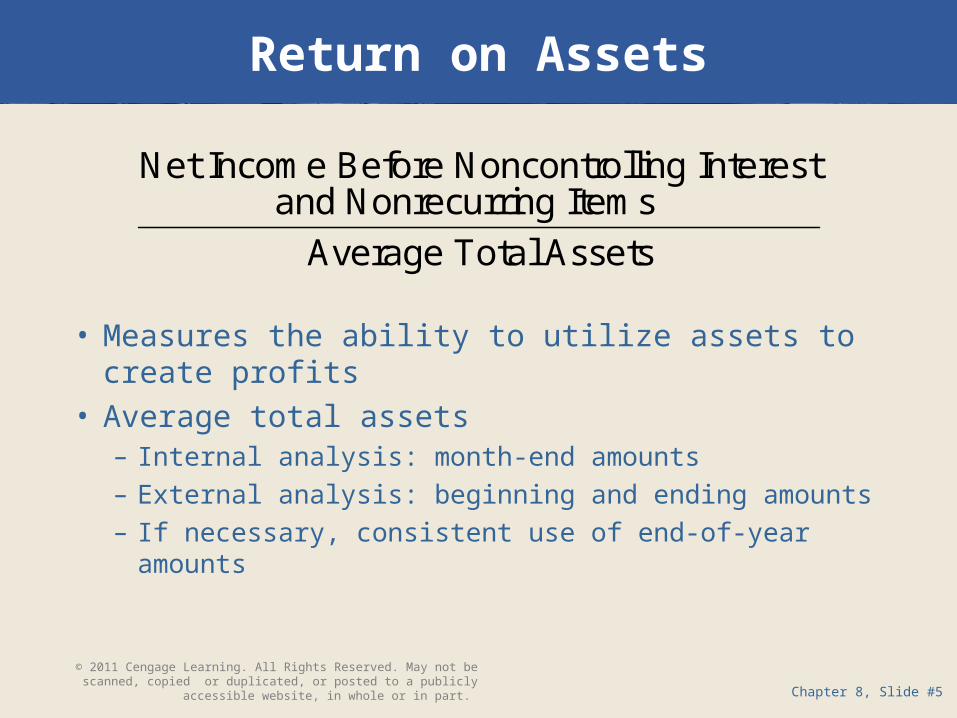
Return on Assets
• Measures the ability to utilize assets to create profits
• Average total assets– Internal analysis: month-end amounts– External analysis: beginning and ending amounts– If necessary, consistent use of end-of-year amounts
Net Income Before Noncontrolling Interest and Nonrecurring Items
Average Total Assets
© 2011 Cengage Learning. All Rights Reserved. May not be scanned, copied or duplicated, or posted to a publicly accessible website, in whole or in part.
Chapter 8, Slide #6
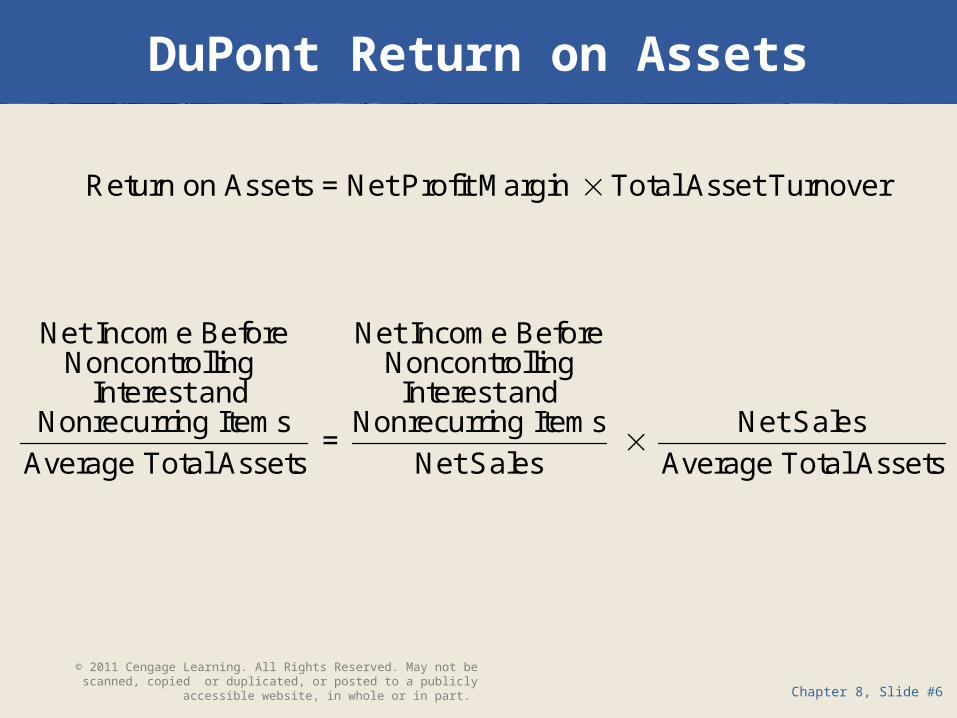
DuPont Return on Assets
Return on Assets = Net Profit Margin Total Asset Turnover
Net Income Before Net Income BeforeNoncontrolling Noncontrolling
Interest and Interest andNonrecurring Items Nonrecurring
= Average Total Assets
Items Net Sales
Net Sales Average Total Assets
© 2011 Cengage Learning. All Rights Reserved. May not be scanned, copied or duplicated, or posted to a publicly accessible website, in whole or in part.
Chapter 8, Slide #7
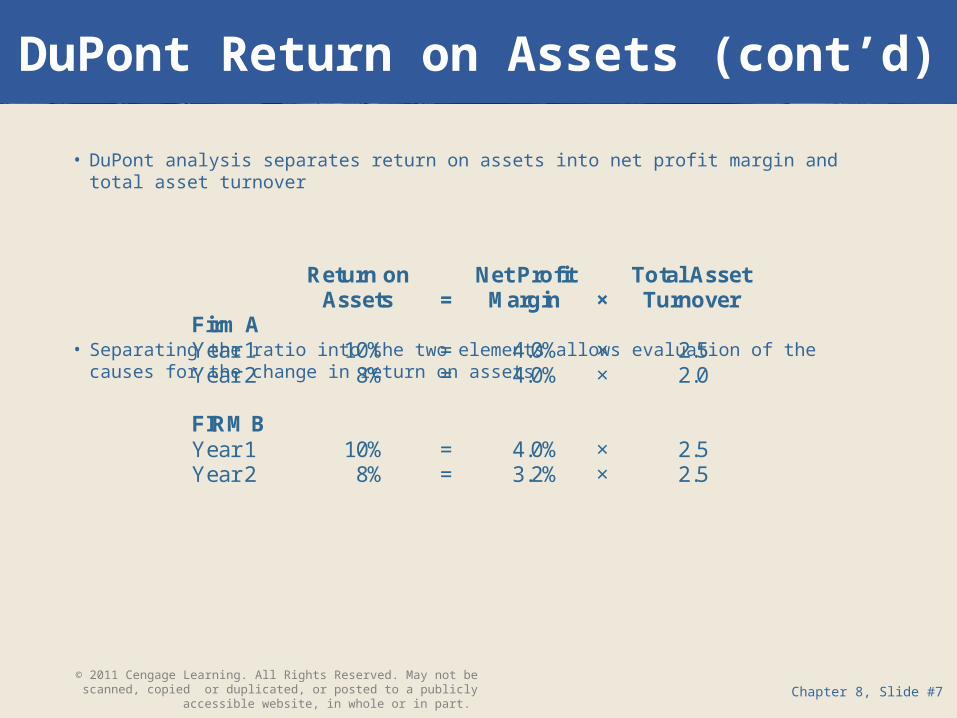
DuPont Return on Assets (cont’d)
• DuPont analysis separates return on assets into net profit margin and total asset turnover
• Separating the ratio into the two elements allows evaluation of the causes for the change in return on assets
Return on Net Profit Total Asset Assets = Margin × Turnover Firm A Year 1 10% = 4.0% × 2.5 Year 2 8% = 4.0% × 2.0 FIRM B Year 1 10% = 4.0% × 2.5 Year 2 8% = 3.2% × 2.5
© 2011 Cengage Learning. All Rights Reserved. May not be scanned, copied or duplicated, or posted to a publicly accessible website, in whole or in part.

Chapter 8, Slide #8
DuPont Analysis Variation
• Consider only operating assets and income– Operating assets exclude
• Construction in progress• Long-term investments• Intangibles• ‘Other’ assets
– Operating income includes only• Net sales• Operating expenses
• May give significantly different results• Reflective of ROA from primary business
© 2011 Cengage Learning. All Rights Reserved. May not be scanned, copied or duplicated, or posted to a publicly accessible website, in whole or in part.
Chapter 8, Slide #9
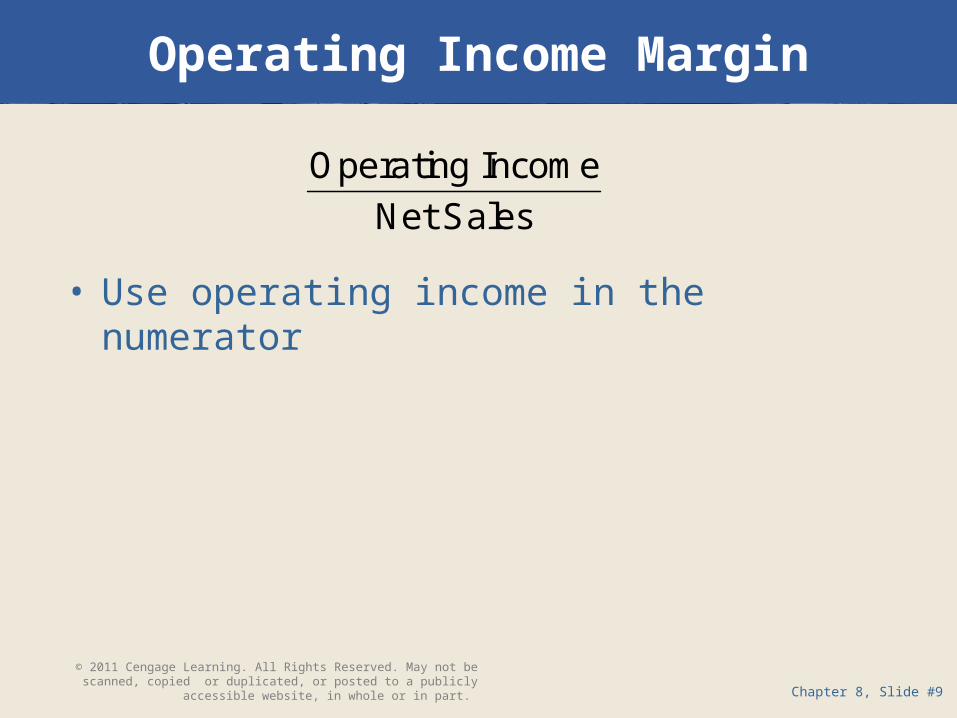
Operating Income Margin
• Use operating income in the numerator
Operating Income
Net Sales
© 2011 Cengage Learning. All Rights Reserved. May not be scanned, copied or duplicated, or posted to a publicly accessible website, in whole or in part.
Chapter 8, Slide #10
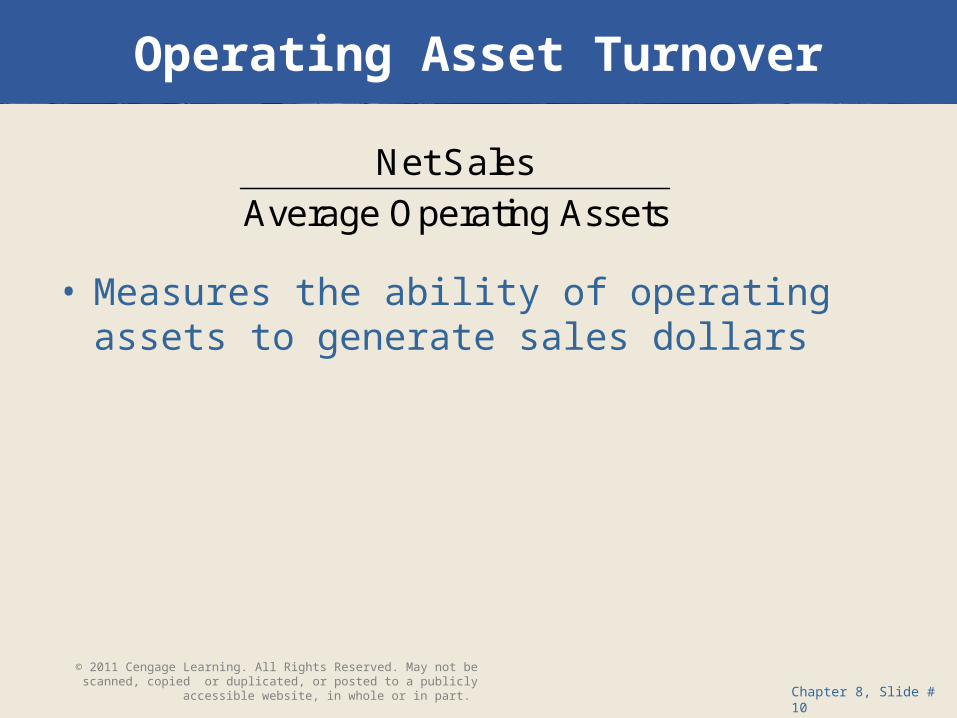
Operating Asset Turnover
• Measures the ability of operating assets to generate sales dollars
Net Sales
Average Operating Assets
© 2011 Cengage Learning. All Rights Reserved. May not be scanned, copied or duplicated, or posted to a publicly accessible website, in whole or in part.
Chapter 8, Slide #11
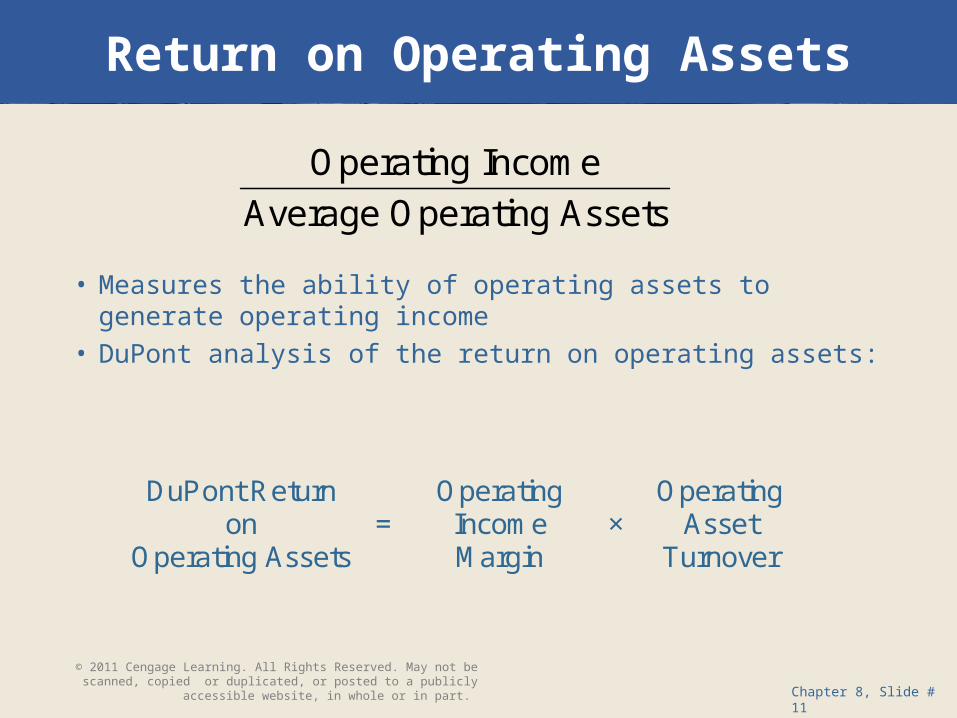
Return on Operating Assets
• Measures the ability of operating assets to generate operating income
• DuPont analysis of the return on operating assets:
Operating Income
Average Operating Assets
DuPont Return Operating Operating on = Income × Asset Operating Assets Margin Turnover
© 2011 Cengage Learning. All Rights Reserved. May not be scanned, copied or duplicated, or posted to a publicly accessible website, in whole or in part.
Chapter 8, Slide #12
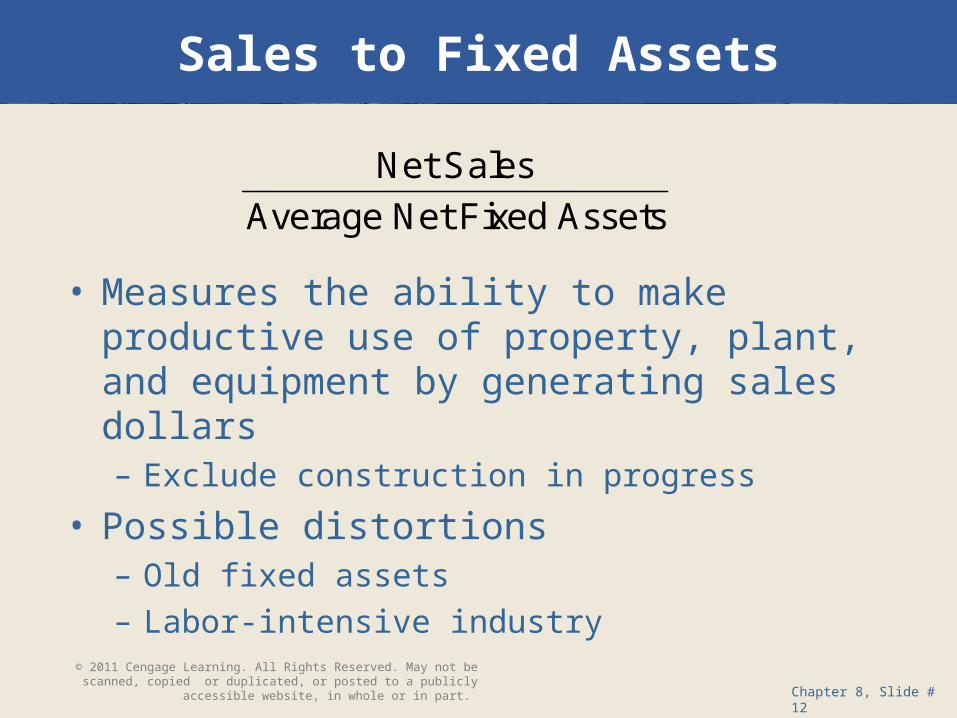
Sales to Fixed Assets
• Measures the ability to make productive use of property, plant, and equipment by generating sales dollars– Exclude construction in progress
• Possible distortions– Old fixed assets– Labor-intensive industry
Net Sales
Average Net Fixed Assets
© 2011 Cengage Learning. All Rights Reserved. May not be scanned, copied or duplicated, or posted to a publicly accessible website, in whole or in part.
Chapter 8, Slide #13
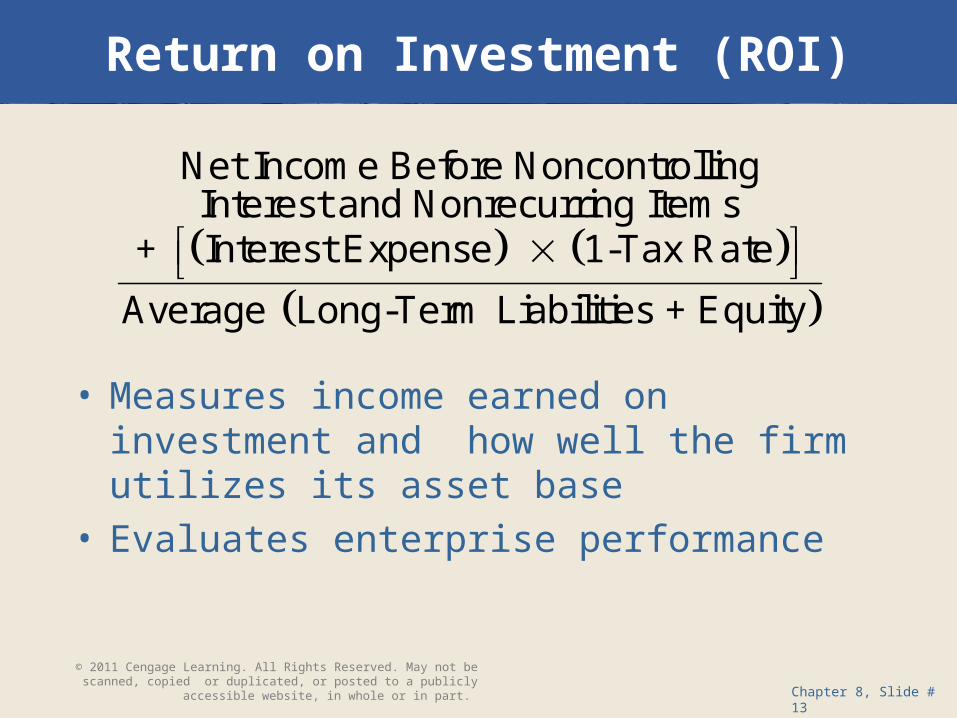
Return on Investment (ROI)
• Measures income earned on investment and how well the firm utilizes its asset base
• Evaluates enterprise performance
Net Income Before NoncontrollingInterest and Nonrecurring Items
+ Interest Expense 1-Tax Rate
Average Long-Term Liabilities + Equity
© 2011 Cengage Learning. All Rights Reserved. May not be scanned, copied or duplicated, or posted to a publicly accessible website, in whole or in part.
Chapter 8, Slide #14
Return on Investment (ROI) (cont’d)
• Measures ability to reward investors and to attract providers of future funds
• Evaluates the earnings performance without regard to financing sources
© 2011 Cengage Learning. All Rights Reserved. May not be scanned, copied or duplicated, or posted to a publicly accessible website, in whole or in part.
Chapter 8, Slide #15
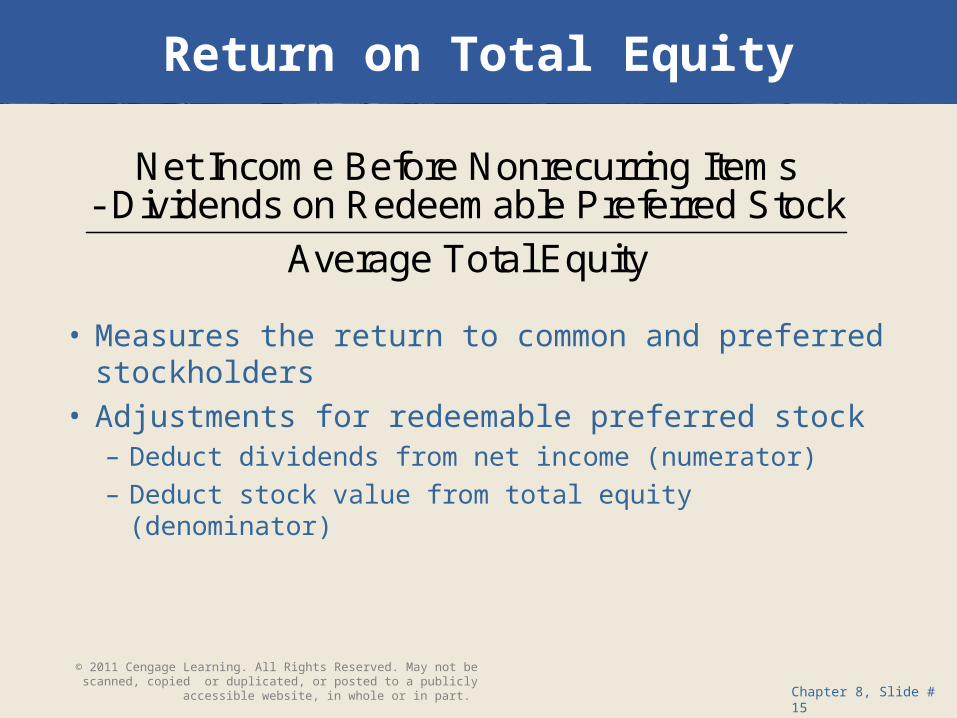
Return on Total Equity
• Measures the return to common and preferred stockholders
• Adjustments for redeemable preferred stock– Deduct dividends from net income (numerator)– Deduct stock value from total equity (denominator)
Net Income Before Nonrecurring Items- Dividends on Redeemable Preferred Stock
Average Total Equity
© 2011 Cengage Learning. All Rights Reserved. May not be scanned, copied or duplicated, or posted to a publicly accessible website, in whole or in part.
Chapter 8, Slide #16
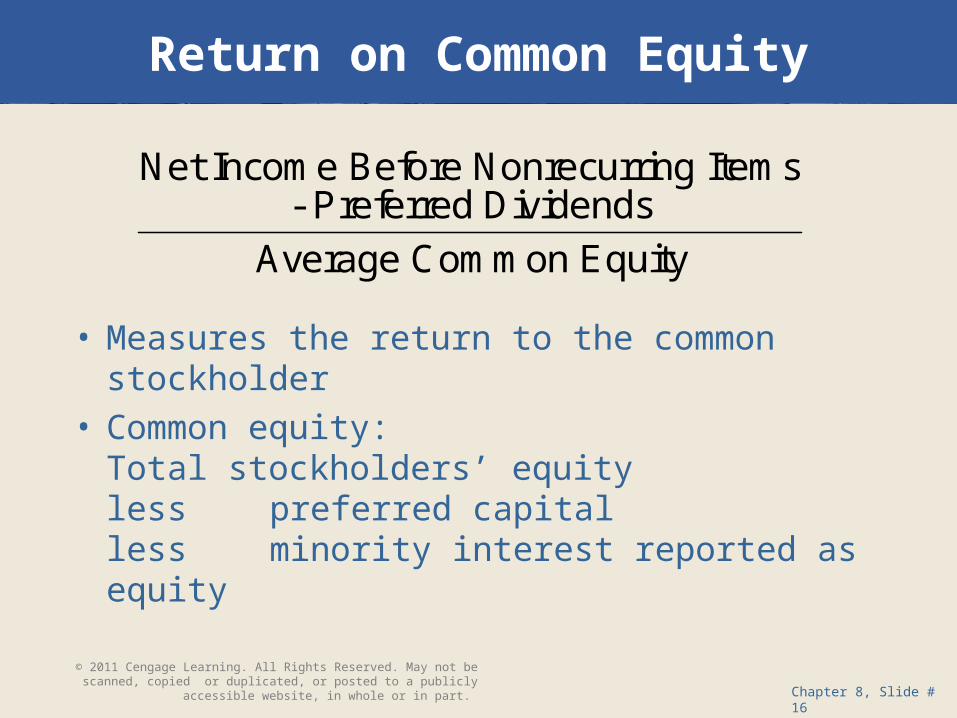
Return on Common Equity
• Measures the return to the common stockholder
• Common equity: Total stockholders’ equityless preferred capitalless minority interest reported as equity
Net Income Before Nonrecurring Items- Preferred Dividends
Average Common Equity
© 2011 Cengage Learning. All Rights Reserved. May not be scanned, copied or duplicated, or posted to a publicly accessible website, in whole or in part.
Chapter 8, Slide #17
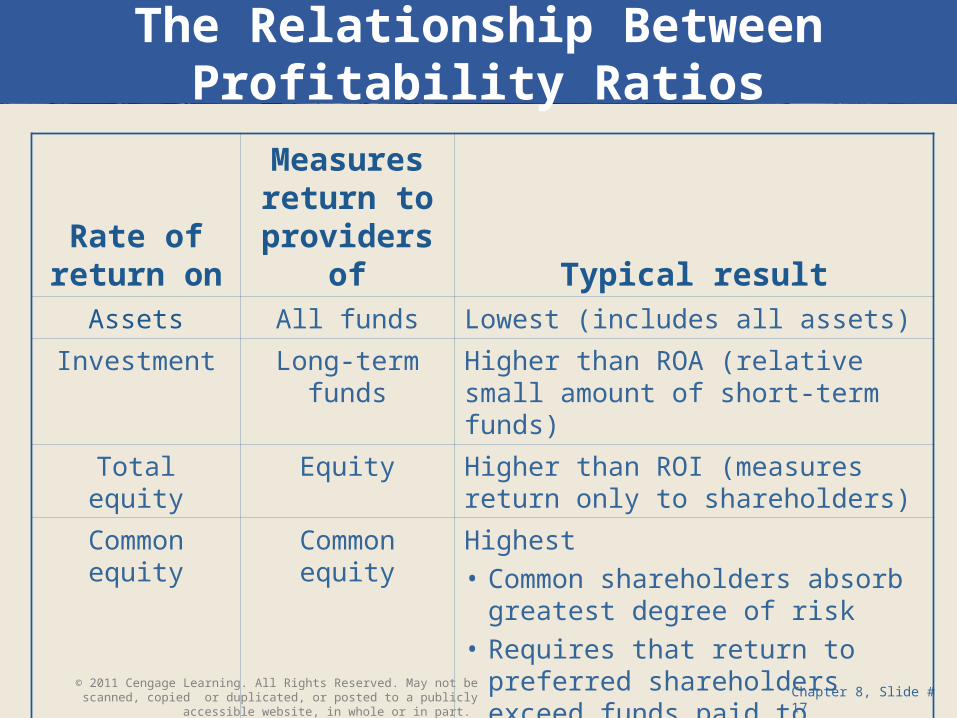
The Relationship Between Profitability Ratios
Rate ofreturn on
Measuresreturn to
providers of Typical resultAssets All funds Lowest (includes all assets)
Investment Long-term funds Higher than ROA (relative small amount of short-term funds)
Total equity Equity Higher than ROI (measures return only to shareholders)
Common equity Common equity Highest• Common shareholders absorb
greatest degree of risk• Requires that return to preferred
shareholders exceed funds paid to preferred shareholders
© 2011 Cengage Learning. All Rights Reserved. May not be scanned, copied or duplicated, or posted to a publicly accessible website, in whole or in part.
Chapter 8, Slide #18
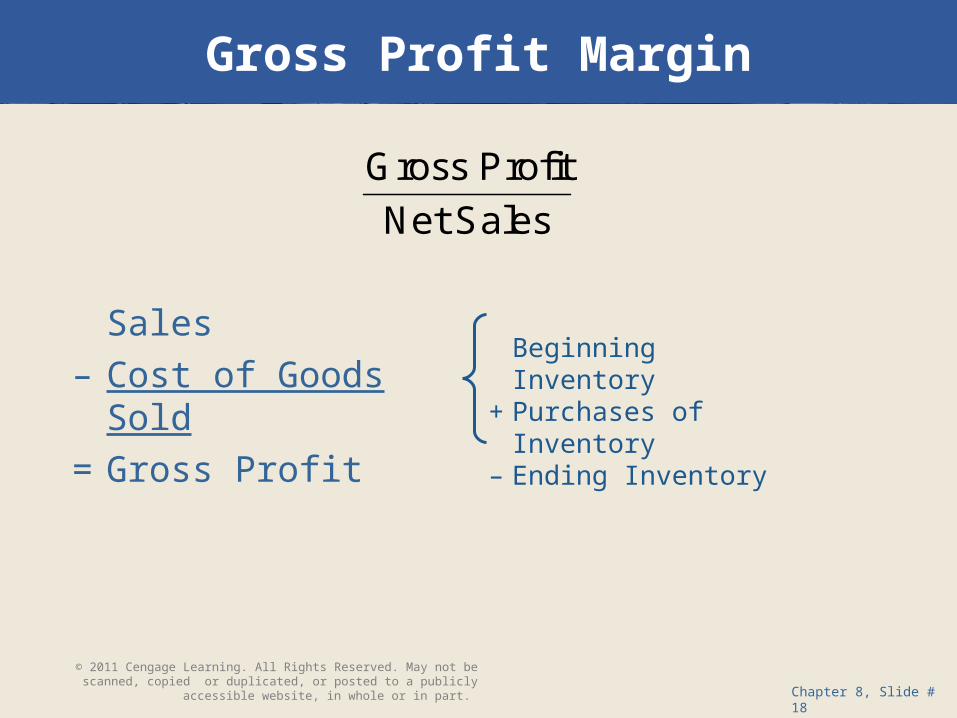
Gross Profit Margin
Sales
– Cost of Goods Sold
= Gross Profit
Beginning Inventory+ Purchases of Inventory– Ending Inventory
Gross Profit
Net Sales
© 2011 Cengage Learning. All Rights Reserved. May not be scanned, copied or duplicated, or posted to a publicly accessible website, in whole or in part.
Chapter 8, Slide #19
Gross Profit Margin Analysis
• Analysis helps the following ways:– Managers budget gross profit levels in projections– Cost control– Estimate inventory levels for interim financials and
insurance losses in merchandising industries– Used by auditor and IRS to judge accuracy of
accounting systems
© 2011 Cengage Learning. All Rights Reserved. May not be scanned, copied or duplicated, or posted to a publicly accessible website, in whole or in part.
Chapter 8, Slide #20
Segment Reporting
• Operating segments– Separate financial information is available– Evaluated by the chief decision making officer
• Geographical information– Revenues earned– Asset concentration
• Major customers• Products and services
© 2011 Cengage Learning. All Rights Reserved. May not be scanned, copied or duplicated, or posted to a publicly accessible website, in whole or in part.
Chapter 8, Slide #21
Gains and Losses from Prior Period Adjustments
• Charged directly to retained earnings– Changes in accounting principles– Realization of net operating loss carryforward tax
benefits from purchased subsidiaries– Changes in accounting entity– Correction of errors originating in prior periods
© 2011 Cengage Learning. All Rights Reserved. May not be scanned, copied or duplicated, or posted to a publicly accessible website, in whole or in part.
Chapter 8, Slide #22
Comprehensive Income
• Items not included in net income• Reported as a separate component of
stockholders’ equity– Foreign currency translation adjustments– Unrealized holding gains and losses from available-
for-sale marketable securities– Changes to stockholders’ equity resulting from
additional minimum pension liability adjustments– Unrealized gains and losses from derivative
instruments
© 2011 Cengage Learning. All Rights Reserved. May not be scanned, copied or duplicated, or posted to a publicly accessible website, in whole or in part.
Chapter 8, Slide #23
Comprehensive Income (cont’d)
• Traditional profitability analysis utilizes net income– Items of accumulated other comprehensive income
are excluded from analysis
• Consider supplemental analysis including other comprehensive income items for– Return on assets– Return on investment– Return on total equity– Return on common equity
© 2011 Cengage Learning. All Rights Reserved. May not be scanned, copied or duplicated, or posted to a publicly accessible website, in whole or in part.
Chapter 8, Slide #24
Pro Forma Financial Information
• Non-GAAP-based financial information• Release timed to coincide with release of
GAAP financial results• Sarbanes-Oxley Act of 2002 requires
– Reconciling of pro forma data to GAAP financial condition and results of operations
– Pro forma data is not misleading or untrue
© 2011 Cengage Learning. All Rights Reserved. May not be scanned, copied or duplicated, or posted to a publicly accessible website, in whole or in part.
Chapter 8, Slide #25
Interim Reports
• Unaudited financial reports covering fiscal periods of less than one year– Interim reports are an integral part of the annual
report– Quarterly information is disclosed in the annual
report
• SEC requires quarterly information be filed on Form 10-Q
• Produced quickly; rely on more estimates
© 2011 Cengage Learning. All Rights Reserved. May not be scanned, copied or duplicated, or posted to a publicly accessible website, in whole or in part.