Embed Size (px)
Citation preview

Program CommitteeMonday, June 4, 2018
Room 340‐D
Hamilton‐Wentworth District School Board20 Education Court, P.O. Box 2558
Hamilton, ON L8N 3L1
AGENDA: 5:30 pm
1. Call to Order
2. Approval of the Agenda
3. Transforming Learning Everywhere Report
4. Update on the Special High Skills Majors (SHSM)
5. Adjournment

Executive Summary Topic: Transforming Learning Everywhere Report – June 2018 Context Transforming Learning Everywhere (TLE) is a multi-year HWDSB initiative focused on preparing HWDSB students to be “future ready” through the development of the skills and competencies needed to be successful in our changing economy and society. 2017-18 is year four of the Transforming Learning Everywhere (TLE) initiative, a multi-year HWDSB project focused on preparing HWDSB students to be “future ready” through the development of the skills and competencies needed to be successful in our changing economy and society. HWDSB staff and students will increasingly work and learn in both the physical and digital worlds and, therefore, preparing staff and students for success in both the physical and digital worlds is vital. TLE’s Theory of Action: If evidence based pedagogy, accelerated by digital tools, is utilized, then there will be increases in teacher and student engagement, student achievement and well-being, which will result in positive changes in teacher practice and student outcomes. Connections to the Strategic Directions and Annual Plan Since the development of the new HWDSB Strategic Directions in 2015-16, TLE has been embedded in the work of realizing our Annual Goals for Positive Culture and Well-Being and Student Learning and Achievement rather than as a stand-alone initiative. Specifically, the following key actions continue to serve the original purpose of TLE but are now seen as integral to the achievement of our Annual Plan goals: Provisioning digital technology to ensure all students have equitable access to digital tools to support their learning; Increasing the use of teaching practices that develop critical thinking, communication, problem-solving and
collaboration skills, such as inquiry learning, deep learning, experiential learning, and problem-based learning, in all subject areas;
Acknowledging that learning for staff and students occurs in both the physical and digital worlds and therefore providing blended learning opportunities, such as e-learning, for staff and students;
Supporting the system to change the conditions of teaching and learning in a 21st Century classroom through learning relationships, opportunities, and environments;
Supporting educators to adopt of new technology/digital tools into the classroom and into their teacher practice. In the original TLE implementation plan (please see Appendix A), full implementation would be characterized by the integration of the strategy into HWDSB practices, policies and therefore become part of how the organization operates. A shift towards full implementation is underway. The enclosed report includes: An outline of the implementation and measurement of TLE in 2017-18, including iPad deployment; The planned implementation and measurement of TLE in 2018-19, including iPad deployment; An overview of the iPad deployment budget; Supporting documents in appendices.
3-1

2017-18 Transforming Learning Everywhere Report
Name of Report: Transforming Learning Everywhere Report Date: June 4th, 2018
******************************** Priority: Student Learning and Achievement, Positive Culture and Well-being Context 2017-18 is year four of the Transforming Learning Everywhere (TLE) initiative, a multi-year HWDSB project focused on preparing HWDSB students to be “future ready” through the development of the skills and competencies needed to be successful in our changing economy and society. As noted in the recent Royal Bank of Canada report Humans Wanted, “an assessment of 20,000 skills rankings across 300 occupations and 2.4 million expected job openings shows an increasing demand for foundational skills such as critical thinking, co-ordination, social perceptiveness, active listening and complex problem solving.” The report also argues that “digital fluency will be essential to all new jobs. This does not mean we need a nation of coders, but a nation that is digitally literate.”1 (Royal Bank of Canada 2018). HWDSB staff and students will increasingly work and learn in both the physical and digital worlds and, therefore, preparing staff and students for success in both the physical and digital worlds is vital. TLE’s Theory of Action: If evidence based pedagogy, accelerated by digital tools, is utilized, then there will be increases in teacher and student engagement, student achievement and well-being, which will result in positive changes in teacher practice and student outcomes. Connections to the Strategic Directions and Annual Plan Since the development of the new HWDSB Strategic Directions in 2015-2016, TLE has been embedded in the work of realizing our Annual Goals for Positive Culture and Well-Being and Student Learning and Achievement rather than as a stand-alone initiative. Specifically, the following key actions continue to serve the original purpose of TLE but are now seen as integral to the achievement of our Annual Plan goals: Provisioning digital technology to ensure all students have equitable access to digital tools to support their learning; Increasing the use of teaching practices that develop critical thinking, communication, problem-solving and
collaboration skills, such as inquiry learning, deep learning, experiential learning, and problem-based learning, in all subject areas;
Acknowledging that learning for staff and students occurs in both the physical and digital worlds and therefore providing blended learning opportunities, such as e-learning, for staff and students;
Supporting the system to change the conditions of teaching and learning in a 21st Century classroom through learning relationships, opportunities, and environments;
Supporting educators to adopt of new technology/digital tools into the classroom and into their teacher practice. In the original TLE implementation plan (please see Appendix A), full implementation would be characterized by the integration of the strategy into HWDSB practices, policies and therefore become part of how the organization operates. A shift towards full implementation is underway. 2017-18 TLE Implementation
1 Retrieved from www.rbc.com/humanswanted
3-2

As signaled at the May 18th, 2017 Program Committee Meeting, the intentional shift to embedding key actions related to TLE into the implementation of Annual Plan began in 2017-18. Throughout the year, the work that was previously “branded” as TLE was now simply seen as effective instructional practice: iPad provisioning would be considered as providing learning tools, and teaching approaches such as inquiry and experiential learning would be considered as simply effective teaching practice. The shift was influenced by the learning gleaned from the earlier deployment of 1:1 iPads at Nora Frances Henderson and the Seven North Elementary Schools as well as the New Pedagogies for Deep Learning pilot. As a result, the work that could be explicitly connected to TLE, in 2017-18, included: Expanding the deployment of iPads through the provision of kits in grade 7-8 and ensuring all incoming grade nine
students had access to an iPad (please see Table One below); Shifting the professional learning support provided by Digital Program Team to a needs-based, job-embedded
professional development rather than a large group approach; Continuing to promote the adoption of effective pedagogy, including inquiry learning, problem-based learning, deep
learning, experiential learning, and knowledge building, in support of our strategic directions; Measuring the impact of TLE through the TLE-Collaborative Inquiry Project; Analyzing the 2016-17 Positive Climate Survey for insights regarding the impact of technology on student
engagement and well-being. Table One: iPad Deployment Panel 2017-18 Deployment Elementary 1:1 devices in grades 4-8 at the 7 North Elementary Schools (Adelaide Hoodless, A.M. Cunningham,
Cathy Weaver, Dr. Davey, Memorial City, Prince of Wales, Queen Victoria ) and 6-8 at Glen Brae Elementary School.
Classroom kits in grades 4 to 8. Secondary 1:1 devices in grades 9-12 at Nora Henderson Secondary School. 1:1 devices in grades 9 and 10 in all secondary schools. 1:1 devices in grades 9, 10, and 11 at Delta and Sir John A Macdonald Secondary Schools. Both Deploy 1:1 devices in self-contained special education classes.
Measurement Approach 2017-18 A shift in how we measure the impact of TLE also began in 2017-18. Acknowledging the challenges of directly connecting student well-being and achievement outcomes to the use of technology for large numbers of students, an experimental study was developed to measure TLE and is underway (please see Appendix B). The key research question in the study was: How can we directly link student achievement and explore well-being data to our TLE strategy? The question was researched by inviting educators to learn and work together through a collaborative inquiry where they formed into learning teams based on shared student need and then attempted to address that need using effective pedagogy and technology, supported by the Program Department. The process allowed for participants to reflect and share their own learning as well as their impact on student learning.
Table 3: TLE-CI Teams The TLE-Collaborative Inquiry ran over three dates: November 15, 2017; November 23, 2017 and April 29, 2018. 49 staff attended the last session (please see Table 3 for participating schools). Approximately 1000 students have been impacted in some way from the TLE-CI work. The focus of the learning was not only on using tech tools, but also in leveraging 21st century skills and competencies. The student achievement data connected to the project will
TLE-Collaborative Inquiry Schools and Teams Dundas Valley, Saltfleet, and Sherwood (4 teachers) Prince of Wales and Helen Detweiler (6 teachers) Henderson (4 teachers) Janet Lee, Lawfield, and Sir William Osler (5 teachers) Glendale and Bennetto (3 teachers) Bellmoore (6 teachers) Billy Green and Bellmoore (4 teachers) Winona (4 teachers) Balaclava, A. M. Cunningham and Glen Echo (5 teachers) Y.O.U. Program (2 teachers)
3-3

be gathered and analyzed after June 30th, 2018 and will be reported back to the Program Committee in the Fall of 2018. 2016-17 TLE Related Positive Climate Data The 2016-178 Positive Climate Survey of students from grades 4 to 12 provides some insight into the impact of TLE. The Positive Climate Survey is voluntary for students to complete and therefore provides possible trends rather than definitive answers. HWDSB deployed the Positive Climate survey in the Spring of 2017 reaching 9045 students between Grades 4 and 8. Of the respondents, 4325 identified as male, 4417 identified as female, and 303 did not answer the gender question. There were 5051 secondary students who answered the Positive Climate Survey in the spring of 2017. There were 2314 students identified as male, 2475 identified as female, and 282 students who did not answer the question, or who opted for LGBTQ++. It needs to be noted that the survey did not seek to evaluate TLE or iPad use, but its data may be of value when deciding future directions for technology deployment. Overall Elementary Themes At Elementary, key themes arising from the survey include: An increase in technology use may increase positive attitudes towards technology as a learning tool; Access to electronic devices appears to increase engagement in learning with classroom kits having a greater impact
than 1:1 iPads. Overall Secondary Themes At Secondary, key themes arising from the survey include: Using technology appears to increase engagement in learning as well as increasing positive attitudes towards
technology as a learning tool; Access to technology does appear to increase engagement but there was no difference in engagement between
students with access to 1:1 iPads over iPad kits. The Seven North Elementary Schools Four of the Seven North Elementary Schools (Cathy Wever, Glen Brae, Memorial City, and Prince of Wales) participated in the 2016-17 School Climate Survey. Overall, these four schools showed a consistently lower level of engagement than the rest of the HWDSB, which cannot be definitively related to technology use and may be related to other school conditions. All four schools are High Priority Schools. Key insights arising from examination of the data for these four school include: There was no appreciable difference in the in attitudes towards technology in these four schools versus the rest of
the HWDSB; The students in these four schools showed a decrease in engagement as attitudes towards technology improved,
but they also indicated that as technology use grows, their engagement in learning grows. Please see Appendix C for the questions asked to determine engagement and attitudes towards technology, and for a more detailed breakdown of the 2016-17 School Climate Data. Implementation in 2018-19 2018-19 is year five of TLE with a focus on continuing implementation in the original plan (see Appendix A) and on continuing to embed TLE into Annual Plan implementation. Key actions for planned 2018-19 include: • Continuing to deploy 1:1 iPads in secondary schools for incoming grade nine students; • Assessing next steps in iPad deployment in the 7 North Elementary Schools through the question: Do we continue
with 1:1 or do we shift to kits? • Continuing to focus on effective pedagogy including inquiry learning, problem-based learning, deep learning, and
knowledge building with intentional work in assessment for, as, and of learning; • Enhancing our focus on Culturally Relevant and Responsive Pedagogy, an equity focused teaching approach that
places a strong emphasis on responding to student voice when developing learning opportunities; using student identities and experiences as a support for learning; developing critical thinking skills; and ensuring varying perspectives are used in delivering the curriculum;
3-4

• Supporting students in the acquisition of global competencies and the knowledge and competencies to learn in the digital and physical worlds through: Learning opportunities in physical and digital worlds through blended learning Learning relationships that create inquiry-based, deep learning, and experiential learning opportunities Learning environments that enable students to access a variety of tools and resources, both analog and
digital, as a support for learning. Table Two: iPad Deployment 2018-19 Panel 2017-18 Deployment Elementary 1:1 devices in grades 4-8 at the 7 North Elementary Schools (Adelaide Hoodless, A.M. Cunningham,
Cathy Weaver, Dr. Davey, Memorial City, Prince of Wales, Queen Victoria ) and 6-8 at Glen Brae Elementary School.
Classroom kits in grades 4 to 8. Secondary 1:1 devices in grades 9-12 at Nora Henderson Secondary School. 1:1 devices in grades 9, 10, 11 and 12 at Delta and Sir John A Macdonald Secondary Schools. 1:1 devices in grades 9, 10, and 11 in all secondary schools. Both Deploy 1:1 devices in self-contained special education classes.
Measurement Approach Measurement of TLE in 2018-19 will build on the methodology used in 2017-18. The Research and Analytics Department, in collaboration with the Program Department, will: • Engage the current TLE-Collaborative Inquiry groups in continuing to embed technology in their teaching practice
while inviting a second cohort of educators to engage in collaborative inquiry and use technology in their practice; • Continue to monitor the professional learning that is demonstrating growth over time and collaborate Program Staff
to monitor where they are providing support and record activities; • Monitor the scale of innovation (Coburn, 2003) depth, spread, sustainability and ownership of professional learning
via focus groups with TLE-Collaborative inquiry cohorts at the end of year. Budget process and TLE: The cost of the iPad deployment plan outlined above has been built into the 2018-19 budget that will be presented to the Finance and Facilities Committee on May 28th, 2018 and then to Board on June 11th, 2018. The proposed total costing for iPad deployment is $2,410,000 Please see Appendix D for the proposed costing of iPad deployment in 2018-19.
3-5

Appendix A: TLE Implementation Plan
In consultation with Dr. Carol Campbell, an expert in whole system reform and large‐scale change strategies, we developed the following framework to describe changes we expect to see as we move from initial implementation of TLE to sustainability.
3-6

Appendix B: TLE-Collaborative Inquiry Research Design Research Question How can we directly link student achievement and explore wellbeing data to our TLE strategy?
Research Design Quasi-experimental, repeated measures, mixed method (i.e., differences between groups, with pre and post data, in addition to focus groups)
Method This study will compare three groups of students: Group 1: (No interventions) Pre/Post data of students randomly and anonymously selected from our database as a baseline comparison group for the other two groups. Group 2: (iPads only) Pre/Post data from students who have iPads in their classrooms. Group 3 (CI + iPads): Pre/Post data from students who have iPads in their classrooms and whose educators participated in 21st Century professional learning (i.e., Collaborative Inquiry = CI).
Measures 1. Pre/post Student grades (report cards). 2. Pre/Post Student learning skills (report cards). 3. Post only: Student Climate Survey Data with TLE questions regarding technology use and
classroom well-being for all students (post only, Spring 2018).
3-7

Appendix C
Elementary Climate Survey TLE data 2016-17 HWDSB deployed the Positive Climate survey in the Spring of 2017 reaching 9045 students between Grades 4 and 8 who responded; 4325 identified as male, 4417 identified as female, and 303 did not answer the gender question. Table 1. Number of Elementary Students Surveyed by Grade Grade Frequency Valid Percent Grade 4 1674 18.5% Grade 5 1877 20.8% Grade 6 1856 20.5% Grade 7 1916 21.2% Grade 8 1722 19.0%
Students were asked to answer questions on three constructs related to TLE; engagement, attitudes about technology and how technology is used. Each construct will be described individually. Engagement Students were asked seven questions to characterize how engaged they are at school and asked on a 5-point scale how much they agree with each statement. The engagement questions were:
1. In school I pay attention. 2. I complete my work on time. 3. I am interested in school. 4. I check my work for mistakes. 5. I study at home even when I don't have a test. 6. When I read a book I ask myself questions to make sure I understand what it's about. 7. If I am confused about a word or a problem, I will do something to figure it out.
The questions are combined to create an overall engagement score. The higher the score, the more engaged students are (minimum 7 to maximum of 35). The engagement questions were found to be statistically reliable, indicating that they are all measuring the same engagement behaviours. Attitudes About Technology We asked students 5 questions about their attitudes towards using technology and asked them to rate how much they agreed with each question (5-point scale). The attitudes about technology questions were:
1. I think using technology helps me learn. 2. I like using technology in my classroom. 3. My school helps students to use technology tools in class. 4. I know how to use technology tools in my class. 5. I regularly use technology tools in my class to support my learning.
The questions were combined to create an overall attitude about technology score. The higher the score, the more positive attitudes and knowledge they have about technology (minimum score of 5 to a maximum of 25). Use of Technology Last, we asked students eight questions about how they use technology at school. They were asked to rate how much they agree with these questions on a 5-point scale as well.
1. To do my homework.
3-8

2. While the teacher is teaching. 3. To look up what the teacher taught. 4. To practice skills with specific apps like word games, or math. 5. To do assignments. 6. To get feedback from the teacher. 7. To get feedback from my peers. 8. To hand in work for marks.
All eight questions were combined into an overall use of technology score. The higher the score, the more they use it. (Minimum score of 8 to a maximum of 40). Analysis A) Correlations. Table 2 demonstrates that attitudes about technology and engagement were negatively correlated, and this correlation is very small, and given the size of the sample, most likely a chance finding (i.e., in correlational analyses, with large samples like this survey, the chances of finding relationships is very high so these findings must be interpreted with caution). Table 2. Correlations – All Grades and All Elementary Schools
Pearson r
Attitudes about Technology
Using Technology
Engagement -.10** .26** Using Technology -.30** -
**significant at the .001 level There is a more robust positive relationship between using technology and engagement. This correlation suggests that using technology is related to increases in engagement scores. We cannot state that these two factors influence each other, only that there is relationship between them. Attitudes about technology and using technology is also moderately and positively related, suggesting that as attitudes about technology increase, attitudes about technology also increase. B) Differences of Engagement according to Access to Devices. Students were asked if they had technology in their class. A small number of students stated they had no technology in their class (n = 335). The majority of students stated they had a kit of iPads to use in their class (n = 6841) and 1321 stated they had their own iPad to use. We then compared these three levels of technological access of responses on engagement to determine if level of access made a difference in their engagement scores. Table 3 demonstrates there was a significant difference of engagement scores between students who did not have any technology compared to those students who had either a kit or their own device (F(2, 8496) = 15.18, p = .00). It turns out that engagement is highest when students had kits compared to one-to-one access. This is not an experimental test, only a report of differences between groups. For example, we could postulate that however one possible reason for this explanation is that with kits, students are collaborating more in class with the kit, and with less access, the iPad are more of a novelty. Further research would need to be conducted in order to provide evidence of any possible hypotheses. Table 3. Engagement and Device Access Access Engagement
Mean (Standard Deviation)
No access to technology 30.01 (10.79) iPad Kits 32.72 (9.46) One-to-one 31.95 (10.02)
3-9

Focused Examination of Data in the Seven North Elementary Schools In the Positive Climate Survey, four of the seven schools participated in the data collection; Cathy Wever, Glen Brae, Memorial City and Prince of Wales. The following analyses report the data combining these four schools. Table 4, 5 and 6 demonstrates the descriptive statistics between all elementary schools and the four schools in the north with the three TLE constructs. Table 4. Comparisons of Engagement Grade All
Elementary Schools (n)
Mean (SD) Four of the Seven North Schools (n)
Mean (SD)
Grade 4 1674 32.92 (9.71) 72 30.36 (12.74) Grade 5 1877 33.10 (9.72) 107 32.70 (10.60 Grade 6 1856 32.90 (9.38) 179 31.92 (9.90) Grade 7 1916 31.91 (9.61) 158 29.72 (9.69) Grade 8 1722 31.09 (9.65) 139 30.25 (8.65)
There are significant differences in engagement between the four schools in the north and the rest of the elementary schools, t(8500) = - 4.00, p < .01 indicating that for the four schools sampled here, they consistently rate themselves lower in engagement. Table 5. Attitudes toward Technology Grade All
Elementary Schools (n)
Mean (SD) Four of the Seven North Schools (n)
Mean (SD)
Grade 4 1542 10.79 (4.76) 72 9.96 (4.71) Grade 5 1762 10.34 (4.62) 105 9.99 (5.87) Grade 6 1775 10.06 (4.52) 174 10.54 (5.67) Grade 7 1715 10.79 (4.85) 162 10.51 (5.29) Grade 8 1484 11.19 (5.28) 114 12.07 (5.68)
There are no significant differences between the students in the four north schools and the rest of the students in other elementary schools in their attitudes toward technology. Table 6. Use of Technology Grade All
Elementary Schools (n)
Mean (SD) Four of the Seven North Schools (n)
Mean (SD)
Grade 4 1421 20.74 (6.58) 61 24.27 (6.81) Grade 5 1640 21.15 (6.37) 92 24.95 (6.78) Grade 6 1701 22.23 (6.21) 169 23.47 (6.25) Grade 7 1628 22.64 (6.08) 150 24.70 (5.64) Grade 8 1430 23.11 (6.21) 109 22.22 (6.02)
There is a significant difference between students in the four north schools and the rest of the elementary schools in using technology t(7750) = 7.84, p < .01. Table 7. Correlations in the Four North Schools Pearson r Attitudes about
Technology Using Technology
Engagement -.18** .37** Using Technology -.35** -
**significant at the .001 level
3-10

In terms of just the four schools in the north, the correlations between the three constructs are more complicated to explain. As attitudes about technology increase, engagement attitudes decrease which defies explanation, however, using technology increases, engagement also increases. There is a relationship, although in a descriptive correlational analysis we cannot say if or how one construct had any impact on the other. Summary: There may be many reasons for the associations between these constructs which may be worth pursuing further. Correlations only describe patterns in data. For a deeper discussion around the nature of this relationship between how students use technology, what is perceived as valuable, and if technology actually has an impact on engagement would need to be explored through other research designs. An example that would need to be explored would be the role that social media plays in students’ attitudes, which could be accounting for the negative perceptions of using technology. It is interesting that for these four schools, engagement in general is significantly lower than other elementary schools, however, we cannot say why definitively. We can speculate with some confidence that according to our theory and work on High Priority Schools, socio-economic status has a role to play. To test this hypothesis, there was a significant difference between our High Priority Schools and other elementary schools in HWDSB on engagement (t(8574) = 7.07, p < .01 and engagement is lower in our High Priority Schools these schools. Thus, attitudes and the complexities inherent in the operationalization and measurement of attitudes aside, the correlation between using technology and engagement is stronger for these four schools. There is a significant difference in use of technology for these schools indicating that we are making a difference for these students in preparing them for a digital world.
Secondary Climate Survey TLE data 2016-17
There were 5051 students who answered the Positive Climate Survey in the spring of 2017. There were 2314 students identified as male, 2475 identified as female, and 282 students who did not answer the question, or who opted for LGBTQ++. Table 8. Number of Secondary Students Surveyed. Grade Frequency Valid Percent Grade 9 1853 36.4% Grade 10 1364 26.8% Grade 11 1038 20.4% Grade 12 833 16.4%
A) Correlations. Attitudes about technology and engagement were positively correlated suggesting that as attitudes about technology increase so does engagement (Table 9). There is a positive relationship between using technology and engagement indicating that using technology increases so does engagement. Attitudes about technology and using technology is also moderately and positively related, suggesting that as attitudes about technology increase, attitudes about technology also increase. Table 9. Correlations between the three TLE Constructs. Pearson r Attitudes about
Technology Using Technology
Engagement .21** .27** Using Technology .49** -
**significant at the .001 level B) Differences on Engagement according to Access to Devices. Students were asked if they had technology in their class. A small number of students stated they had no technology in their class (n = 274). The majority of students stated they had access to their own iPad to use (n = 1735) and 455 stated they had access to kits of iPads in their class. Table 10 demonstrates the differences of access on engagement, there was
3-11

a significant difference between having no technology and access to a kit or a one-to-one own device, F(2, 4874) = 22.07, p < .01. There was no significant difference on engagement and access to a kit or a one-to-one device. Table 10. Differences of Access and Engagement. Access Engagement
Mean (Standard Deviation)
No access to technology 20.05 (7.88) iPad Kits 22.90 (6.47) One-to-one 23.17 (5.66)
3-12

APPENDIX D: Proposed TLE Budget 2018-19
Updated Business Plan
This schedule has been updated to incorporate leasing the technology and to incorporate the increase in funding from the Ministry for technology.
Summary Actual Actual Actual
2014‐15 2015‐16 2016‐17 2017‐18 2018‐19 2019‐20 2020‐21 and beyond
Costs*
Technology 636,000$ 783,000$ 1,255,000$ 2,000,000$ 2,200,000$ 2,400,000$ 2,400,000$
Temporary Assistance 111,000$ 130,000$ 134,000$ ‐$ ‐$ ‐$ ‐$
Additional Licencing 100,000$ 110,000$ 200,000$ 210,000$ 300,000$ 300,000$
747,000$ 1,013,000$ 1,499,000$ 2,200,000$ 2,410,000$ 2,700,000$ 2,700,000$
Revenue Sources
School Budgets 90,000$ 100,000$ 200,000$ 530,000$ 650,000$ 650,000$ 650,000$
Ministry Technology EPO** 437,000$ 536,000$ 538,000$ 330,000$ 110,000$ 110,000$ 110,000$
Operating Savings 220,000$ 377,000$ 761,000$ 1,340,000$ 1,650,000$ 1,940,000$ 1,940,000$
747,000$ 1,013,000$ 1,499,000$ 2,200,000$ 2,410,000$ 2,700,000$ 2,700,000$
Surplus/Deficit ‐$ ‐$ ‐$ ‐$ ‐$ ‐$ ‐$
NOTE:
* Does not include Professional Development. Professional Development related to TLE is incorporated into the Board's Professional Development
Budget.
** Assumption that this grant will continue into the future.
3-13

1
EXECUTIVE REPORT TO PROGRAM COMMITTEE
TO: PROGRAM COMMITTEE FROM: Manny Figueiredo, Director of Education DATE: June 4th, 2018 PREPARED BY: Peter Sovran, Associate Director, Learning Services Bill Torrens, Superintendent of Student Achievement: Program RE: Update on the Special High Skills Majors (SHSM)
Action Monitoring X Rationale/Benefits: The following report provides an update on the expansion of Specialist High Skills Major (SHSM) programs within the HWDSB Program Strategy.
Background: On Monday, November 13th, 2017 the Board of Trustees accepted the October 19th, 2017 Program Committee report authorizing the expansion of SHSM programs within the HWDSB Program Strategy. The rationale for expansion included: The SHSM programming envisioned through the Program Strategy has been opened successfully, with two
exceptions; The enrolment or participation rates in SHSM program are lower than expected due to a pattern that most students
prefer to stay at their home schools rather than move to another school in grade 11; The Ministry of Education is seeking to increase SHSM participation rates to 25%; There is interest and demand for additional programming at secondary schools, based on anecdotal evidence;
Using the application parameters outlined by the Program Committee, the Program Department supported school in making an application for new SHSM programs. 13 applications were considered and submitted to the Ministry of Education for approval. All 13 were accepted by the Ministry. In 2017-2018, 1000 students participated in SHSM programs (please see Appendix A for a listing of enrollment by program). The new programs create an anticipated SHSM enrollment of 1359 students in 43 programs (please see Appendix One for a listing of programs and locations). The following provides a list of new SHSM Programs opening in September 2018: Sector School Name
Business Dundas Valley SS Non-profit Glendale SS Construction Nora Henderson SS Business Orchard Park SS
4-1
2
Health and Wellness Orchard Park SS Information and Communications Technology Saltfleet HS Transportation Sherwood SS Transportation Sir Winston Churchill SS Business Waterdown DHS Hospitality and Tourism Westdale SS Environment Westmount SS Health and Wellness Westmount SS Information and Communications Technology Westmount SS
Next Steps: Next steps in supporting the new SHSM programs include: The Program Department providing learning and support for new programs and new SHSM Leads; Planning and Accommodation Department creating suggested boundaries for each SHSM as a tier three program; The Transportation Department gathering information related to enrollments in the new SHSM to determine
transportation needs, if any. Appendix C provides a listing of SHSM Programs.
4-2

3
Appendix A: HWDSB Specialized High Skills Majors Enrollment by Program 2017-18
PROGRAM Actual Enrolment For 2017-18 (Oct 31)
Total Enrollment
Ancaster: Aviation Gr 11: 6 Gr 12: 5 11 Ancaster: ICT Gr 11: 9 Gr 12: 1 10 Delta: Health and Wellness Gr 11: 11 Gr 12: 5 16 Delta: Hospitality Gr 11: 10 Gr 12: 7 17 DVSS: Arts and Culture Gr 11: 7 Gr 12: 12 19 DVSS: Manufacturing Gr 11: 19 Gr 12: 10 29 DVSS: Transportation Gr 11: 11 Gr 12: 2 13 Glendale: Arts and Culture Gr 11: 33 Gr 12: 28 61 Glendale: Business Gr 11: 29 Gr 12: 16 45 Glendale: Transportation Gr 11: 4 Gr 12: 3 7 NFH: ICT Gr 11: 11 Gr 12: 13 24 NFH: Justice Gr 11: 4 Gr 12: 9 13 NFH: Manufacturing Gr 11: 12 Gr 12: 10 22 NFH: Transportation Gr 11: 4 Gr 12: 5 9 OP: Arts and Culture Gr 11: 21 Gr 12: 1 22 OP: Hospitality Gr 11: 11 Gr 12: 4 15 Saltfleet: Construction Gr 11: 25 Gr 12: 17 42 Saltfleet: Horticulture Gr 11: 13 Gr 12: 12 25 Saltfleet: Non-Profit Gr 11: 21 Gr 12: 9 30 Sherwood: Health and Wellness Gr 11: 33 Gr 12: 21 54 SAM: Arts and Culture Gr 11: 46 Gr 12: 34 80 SAM: Health and Wellness Gr 11: 24 Gr 12: 25 49 SAM: Hospitality Gr 11: 18 Gr 12: 14 32 SJAM: Hospitality Gr 11: 4 Gr 12: 21 25 SWC: Aviation Gr 11: 14 Gr 12: 5 19 SWC: Health and Wellness Gr 11: 27 Gr 12: 28 55 SWC: Manufacturing Gr 11: 19 Gr 12: 7 26 Waterdown: Environment Gr 11: 43 Gr 12: 6 49 Westdale: Arts and Culture Gr 11: 67 Gr 12: 50 117 Westdale: Construction Gr 11: 36 Gr 12: 28 64 Total Gr 11: 592 Gr 12:408 1000
4-3
4
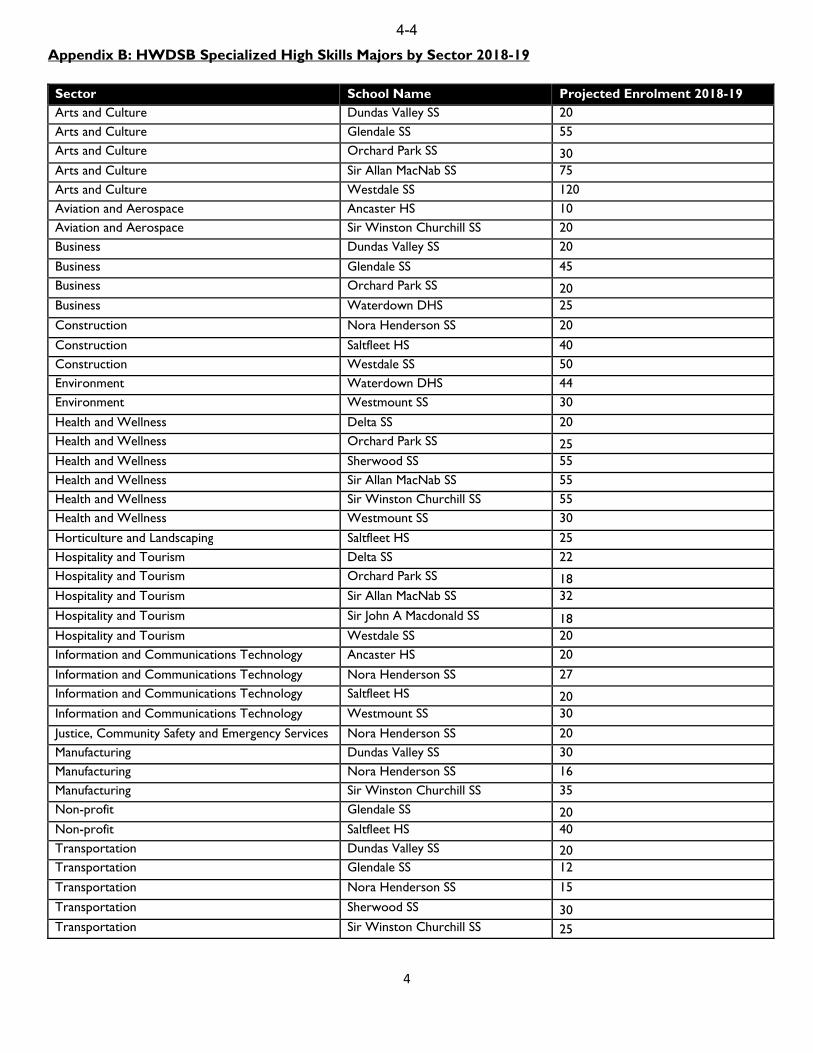
Appendix B: HWDSB Specialized High Skills Majors by Sector 2018-19 Sector School Name Projected Enrolment 2018-19 Arts and Culture Dundas Valley SS 20 Arts and Culture Glendale SS 55 Arts and Culture Orchard Park SS 30 Arts and Culture Sir Allan MacNab SS 75 Arts and Culture Westdale SS 120 Aviation and Aerospace Ancaster HS 10 Aviation and Aerospace Sir Winston Churchill SS 20 Business Dundas Valley SS 20
Business Glendale SS 45 Business Orchard Park SS 20 Business Waterdown DHS 25
Construction Nora Henderson SS 20
Construction Saltfleet HS 40 Construction Westdale SS 50 Environment Waterdown DHS 44 Environment Westmount SS 30
Health and Wellness Delta SS 20 Health and Wellness Orchard Park SS 25 Health and Wellness Sherwood SS 55 Health and Wellness Sir Allan MacNab SS 55 Health and Wellness Sir Winston Churchill SS 55 Health and Wellness Westmount SS 30
Horticulture and Landscaping Saltfleet HS 25 Hospitality and Tourism Delta SS 22 Hospitality and Tourism Orchard Park SS 18 Hospitality and Tourism Sir Allan MacNab SS 32
Hospitality and Tourism Sir John A Macdonald SS 18 Hospitality and Tourism Westdale SS 20 Information and Communications Technology Ancaster HS 20
Information and Communications Technology Nora Henderson SS 27 Information and Communications Technology Saltfleet HS 20 Information and Communications Technology Westmount SS 30
Justice, Community Safety and Emergency Services Nora Henderson SS 20 Manufacturing Dundas Valley SS 30 Manufacturing Nora Henderson SS 16 Manufacturing Sir Winston Churchill SS 35 Non-profit Glendale SS 20 Non-profit Saltfleet HS 40 Transportation Dundas Valley SS 20 Transportation Glendale SS 12
Transportation Nora Henderson SS 15
Transportation Sherwood SS 30 Transportation Sir Winston Churchill SS 25
4-4

5
Appendix C: HWDSB SHSM Programs
EN
TRY
GRADE
PROGRAMS
Ancaster
Dundas VSS
Glendale
Nora
Henderson
New North
SS
Orchard Park
Saltfleet
Sherw
ood
Sir Allan
MacNab
Sir Winston
Churchill
Waterdown
Westdale
Westmount
SPEC
IALIST HIGH SKILLS M
AJOR PROGRAMS
11 Arts & Culture:
Arts X X X
11
Arts & Culture: Digital Media
X
X New Appl'n with school opening
X
11 Aviation & Aerospace
X X
11 Business X X X X
11 Construction X X X
11
Energy
X (from SJAM) will
need to reapply
11 Environment X X
11 Horticulture X
11 Health & Wellness
X (from Delta)
X X X X X
11
Hospitality/ Tourism (Food
Services)
X (Presently at Delta and
SJAM)
X X
X New Appl'n for
2017/18
X (Tourism)
11 Information & Communication
X
X X X
11
Justice, Community Safety, & Emergency Services
X
11
Manufacturing
X
X* (From NFH SS upon
closure)
X
11
Non‐Profit
X X
11 Transportation X
X
X
x x
Updated Legend
Existing SHSM Approval renewed by Ministry of Education by 2016/17 New SHSM Application
submitted and approved for 2016/17
New SHSM Application submitted and approved for 2017/18 Need to Re‐Apply in the
Future
New SHSM Application submitted and approved for 2018/19
4-5