Embed Size (px)
Citation preview
EPIC F ina l Report
Program Electric Program Investment Charge (EPIC)
Project
EPIC 1.05 – Demonstrate New Resource Forecast Methods to Better Predict Variable Resource Output
Reference Name
New Forecast Methods for Improved Storm Damage Modeling
Department Emergency Management Project Sponsor Jason Regan
Business Lead Mike Voss
Date December 12, 2016
Version Type Final
Contact [email protected]

EPIC Final Report | 1-05 Demonstrate New Resource Forecast Methods to Better Predict Variable Resource Output
Table of Contents 1. Executive Summary __________________________________________________________ 4
Key Accomplishments ________________________________________________________ 4
Key Learnings and Next Steps __________________________________________________ 5 Storm Damage Model.................................................................................................. 5 Fire Danger Rating System (FDRS) ................................................................................ 6 Solar Irradiance Database ............................................................................................ 6
Conclusion _________________________________________________________________ 7
2. Introduction ________________________________________________________________ 9
3. Project Summary ___________________________________________________________ 10
3.1 Issues Addressed ______________________________________________________ 10 Storm Damage Modeling ............................................................................... 10 3.1.1 Fire Risk Assessment ...................................................................................... 10 3.1.2 Solar Irradiance Forecasting ........................................................................... 11 3.1.3
3.2 Project Objectives _____________________________________________________ 12
3.3 Scope of Work ________________________________________________________ 12
4. Major Tasks _______________________________________________________________ 13
4.1 POMMS Base System ___________________________________________________ 13 POMMS Base System Deliverable................................................................... 13 4.1.1 POMMS Base System Description .................................................................. 13 4.1.2
4.2 Storm Damage Models _________________________________________________ 16 Storm Damage Model Deliverable.................................................................. 16 4.2.1 Storm Outage System Description .................................................................. 16 4.2.2
4.3 Fire Danger Rating System _______________________________________________ 17 Fire Danger Rating System Deliverable ........................................................... 17 4.3.1 Key Fire Danger Rating Terms ........................................................................ 18 4.3.1 Fire Danger Rating System Key Partners ......................................................... 21 4.3.2 Fire Danger Rating System Description ........................................................... 23 4.3.3
4.4 Solar Irradiance System _________________________________________________ 26 Solar Irradiance System Deliverable ............................................................... 26 4.4.1 Solar Irradiance Basics ................................................................................... 26 4.4.2 Solar Irradiance System Description ............................................................... 31 4.4.3 Solar Irradiance Use Cases ............................................................................. 33 4.4.4
5. Project Results and Key Findings _______________________________________________ 34
5.1 Storm Damage Models _________________________________________________ 34 Large Storm Prediction Accuracy .................................................................... 35 5.1.1 Storm Forecast Operational Efficiency ........................................................... 36 5.1.2 Storm Emergency Response Efficiency ........................................................... 36 5.1.3 Employee Field Safety .................................................................................... 37 5.1.4
5.2 Fire Danger Rating System _______________________________________________ 37
5.3 Solar Irradiance System _________________________________________________ 38 Increased PV Visibility .................................................................................... 38 5.3.1 Single Source and Scalable ............................................................................. 40 5.3.2 Use Cases and User Feedback ........................................................................ 41 5.3.3
5.4 Summary of Key Learnings and Next Steps __________________________________ 41

EPIC Final Report | 1-05 Demonstrate New Resource Forecast Methods to Better Predict Variable Resource Output
Storm Damage Model................................................................................................ 41 Fire Danger Rating System (FDRS) .............................................................................. 42 Solar Irradiance Database .......................................................................................... 43
6. Data Access _______________________________________________________________ 44
7. Technology Transfer Plan ____________________________________________________ 44
8. Adaptability to other Utilities / Industry _________________________________________ 44
9. Value proposition __________________________________________________________ 45
10. Metrics ___________________________________________________________________ 46
11. Conclusion ________________________________________________________________ 47
List of Figures Figure 4-1 WRF Model and Key Specs ..................................................................................................13 Figure 4-2 POMMS Web Portal View ...................................................................................................14 Figure 4-3 Sample POMMS Output ......................................................................................................15 Figure 4-4 SOPP Outage Model Schematic ...........................................................................................16 Figure 4-5 SOPP Outage Model Inputs and Outputs .............................................................................16 Figure 4-6 Adjective Fire Danger Rating ...............................................................................................19 Figure 4-7 NFDRS Training ...................................................................................................................21 Figure 4-8 PG&E Fire Index Data Flow and System Overview ...............................................................22 Figure 4-9 Example Hourly Map Output ...............................................................................................23 Figure 4-10 Example 3km Resolution of Daily Maximum Fire Danger Rating ........................................23 Figure 4-11 Schematic of how POMMS Data Feeds into New Fire Danger Risk Assessment Tool ..........24 Figure 4-12 Example Fire Adjective Index Email ...................................................................................25 Figure 4-13 Impacts of Lat/Long on Amount of Radiation per Meter Square ........................................26 Figure 4-14 Measurements of Solar Irradiance ....................................................................................27 Figure 4-15 Solar Irradiance Data Origins .............................................................................................30 Figure 5-1 Storm Forecast Performance (MAPE) ..................................................................................35 Figure 5-2 Average Response Time Metrics .........................................................................................36 Figure 5-3 Granularity of Existing Versus New Fire Danger Rating System ............................................37 Figure 5-5 Solar Irradiance System Example Output .............................................................................38 Figure 5-6 Example Output from Solar Irradiance Web Page ................................................................39
List of Tables
Table 4-1 Fire Danger Rating System Key Terms ...................................................................................19 Table 4-2 NWCG Fire Danger Ratings Defined ......................................................................................20 Table 6-1 EPIC Primary and Secondary Guiding Principles ....................................................................45

EPIC Final Report | 1-05 Demonstrate New Resource Forecast Methods to Better Predict Variable Resource Output
3
List of Acronyms AMI Advanced Metering Infrastructure ARW Advanced Research WRF BI Burning Index BLM Bureau of Land Management CAISO California Independent System Operator CAL FIRE California Department of Forestry and Fire Protection CAL OES California Governor’s Office of Emergency Services CF Capacity Factor CPUC California Public Utilities Commission DER Distributed Energy Resources DERMS Distributed Energy Resource Management System DG Distributed Generation DIF Diffuse Horizontal Irradiance DNI Direct Normal Irradiance EPIC Electric Program Investment Charge ERC Energy Release Component FDRS Fire Danger Rating System FWW Fire Weather Watches GHI Global Horizontal Irradiance GIS Geographic Information System LAPS Local Analysis and Prediction System MAPE Mean Absolute Percentage Error NetCDF Network Common Data Form NFDRS National Fire Danger Rating System NWCG National Weather Coordinating Group NWP Numerical Weather Prediction POAI Plane of Array Irradiance POMMS PG&E Operational Mesoscale Modeling System PV Photovoltaic RET Risk Evaluation Tool RFW Red Flag Warnings SC Spread Component SDG&E San Diego Gas & Electric SL Staffing Level SOPP Storm Outage Prediction Project SPI Solar Potential Index STDF Short Term Demand Forecasts TMY Typical Meteorological Year USFS United States Forest Service VVO Volt-Var Optimization WRAS Wildland Fire Assessment System WRF Weather Research and Forecast Model

EPIC Final Report | 1-05 Demonstrate New Resource Forecast Methods to Better Predict Variable Resource Output
4
1. Executive Summary
Pacific Gas and Electric Company’s (PG&E) Electric Program Investment Charge (EPIC) Project 1.05 Demonstrate New Resource Forecast Methods to Better Predict Variable Resource Output successfully developed and demonstrated a new mesoscale meteorological1 model to provide more granular and accurate weather forecasting input to PG&E’s storm damage prediction model and to other PG&E forecasting applications, such as catastrophic wildfire risk and photovoltaic (PV) generation. This model is known as the PG&E Operational Mesoscale Modeling System, or POMMS. PG&E uses weather forecast data for numerous applications such as storm damage predictions, fire danger ratings and various load and generation forecasts such as PV generation forecasts. The Global Forecast System (GFS) and European Center Model (ECM) Numerical Weather Prediction (NWP) models–which are industry standard models used by PG&E for forecasting applications such as predicting levels of storm damage–lack sufficient spatial resolution to predict surface conditions detailed enough for effective storm damage modeling. A new weather forecast system based on mesoscale modeling will allow PG&E to obtain higher resolution weather predictions, which in turn will improve the accuracy of various other weather-based forecast applications. The newly developed model employs a horizontal spatial resolution of 3 kilometer (km) as opposed to the current 12 km model resolution. Increased granularity and accuracy could enable increased accuracy of forecasting for large storms, increased efficiencies in storm preparation, improved accuracy in identifying fire risks, and increased visibility into solar irradiance data.
Key Accomplishments The following is a summary of the project’s key accomplishments:
POMMS: Developed and demonstrated a functional mesoscale meteorological model that runs four times per day and produces hourly 3 km resolution weather forecasts out to 84 hours for PG&E’s service territory. All of the use cases demonstrated in this project, including the Storm Damage Model, Fire Danger Rating System and Solar Irradiance System are built upon this foundational deliverable.
Storm Damage Model: Integrated POMMS weather forecasts into SOPP to improve storm damage and outage forecasts, and also contributed to improved overall weather guidance for several PG&E use cases.
Fire Danger Rating System: Developed a new fire danger awareness system that combines weather data from POMMS and information from the National Fire Danger Rating System (NFDRS). The new fire danger awareness system was deployed in demonstration mode during the summer 2016 fire season.
Solar Irradiance System: Developed and demonstrated a single-source, comprehensive database of historical, present-day, and forecast solar irradiance data2, as well as an internal interface to deliver specific data to projects and use cases. The system also includes a function to compute power output (kW) leveraging weather, solar position and PV system specification data.
1 A meteorological model is a numerical based weather prediction system, incorporating multiple parameters such as
temperature and precipitation. Mesoscale refers to the length scale of weather patterns. Analyzing the model at 3km as opposed to 12km allows for a more detailed view of the weather on a more localized and granular scale. 2 Solar irradiance is a measure of radiant energy from the sun

EPIC Final Report | 1-05 Demonstrate New Resource Forecast Methods to Better Predict Variable Resource Output
5
Key Learnings and Next Steps The project gathered several key learnings from each of these activities:
Storm Damage Model
Learning – POMMS Integrated with SOPP is Technically Feasible and Provides Value: The project found that outputs from mesoscale meteorological models can be successfully and cost-effectively integrate into a utility-facing system to provide inputs into other weather-based prediction tools and applications. The implementation of POMMS is correlated with an improvement in the accuracy of forecasting for large storms. POMMS has, according to user feedback within PG&E operations, provided improved understanding of storm timing and progression to the SOPP Model, which has allowed for improved staging of 911 responders in advance of adverse weather. The POMMS high resolution forecast model provides better granularity in space and time to identify weather hazards, and PG&E safety programs leverage this information to keep field personnel informed of these adverse conditions. Additionally, the integration of POMMS has lowered the amount of time required to create a weather event forecast, for instance medium weather events went from approximately 8 hours down to 4-6 hours.
Next Step - Transition to Full Production: With EPIC 1.05 demonstrating both technical feasibility as well as operational value, PG&E explored transitioning POMMS to become “fully operational”. As a result, PG&E has now successfully made this transition. In the demonstration, POMMS was running in a development environment with a third party vendor running the model and ingesting the data into weather maps. POMMS is now running the post-processing to produce the POMMS maps in-house, and the system is running in two production environments (for redundancy) and a QA environment. This technology is now leveraged in production by PG&E for weather forecasting, storm outage prediction, 911 response and informing field crews about potential weather-related hazards. Next Step – Leverage POMMS Data for Additional Use Cases: PG&E plans to continue maintaining POMMS, as well as to continue seeking new potential opportunities to incorporate this data into additional use cases. For example, PG&E will consider leveraging the POMMS data through SOPP for EPIC 2.10 Emergency Preparedness Modeling. EPIC 2.10 seeks to develop and demonstrate an integrated solution that uses damage model outputs and real-time restoration constraints to recommend restoration strategies and build resource work plans. The increased weather data granularity from POMMS could potentially lead to more accurate outage and damage predictions at the device or feeder level, which could in turn allow the project to better determine the right crew/troubleman mix.
Learning – POMMS Requires a Large Amount of Computational Capacity: A large amount of computational capacity is required for both running the model to create the raw-gridded weather forecast data as well as for post-processing of the raw outputs to produce the POMMS maps of various weather variables and daily files that contain hourly values of 2-m temperature, relative humidity, wind, precipitation and shortwave solar variables on the 3km resolution grid. A high performance computing cluster is required with several multicore processors and large amounts of storage on a 10 gigabit ethernet network for the creation of the raw-gridded data. While less intensive than running the model, an enterprise quality computing environment is required for post-processing as well.

EPIC Final Report | 1-05 Demonstrate New Resource Forecast Methods to Better Predict Variable Resource Output
6
Next Step – Move Computing In-House for Cost-Efficiency: Two third parties were leveraged to run processing for the project, one for running the weather forecast data model and another for post-processing to create the weather maps. During the timeframe of the project, PG&E acquired the necessary computing capacity to internally run the post-processing computations. As a result, PG&E recommended moving the production of POMMS maps and daily files in-house to keep operational costs to a minimum. PG&E has successfully made this transition.
Fire Danger Rating System (FDRS)
Learning – The New FDRS Improves Fire Risk Identification Capabilities: The demonstration Fire Danger Rating System consistently outperformed the previous system, producing a more consistent and verifiable prediction of fire danger. The higher spatial and temporal resolution outputs from POMMS allowed the project team to establish fire danger ratings that could be updated hourly, for each of PG&E’s fire zones (as opposed to lower resolution data updated daily). This improved accuracy could enable operations to enact better targeted safety and response protocols for fire threats. Next Step – Evaluate Incorporating Hourly Fire Risk Information in Operational Processes: Following the demonstration deployment, the new fire danger awareness system became fully operational and replaced the previous risk assessment tool. Current processes are based on applying daily fire danger maximum values, which can be overly conservative if the actual fire danger is extreme for only a few hours, for example. PG&E plans to explore the cost and benefit of transforming operational processes to incorporate the hourly fire danger rating information. Using hourly fire ratings would better reflect the variability of weather conditions and allow planning and operations groups to allocate resources more efficiently. Additionally, leveraging this information will potentially enhance reliability. For instance, during extreme fire danger conditions, operators shut off the automatic reclosing functionality. This is a safety protocol to ensure that if a line fails due to fire conditions, the system will not automatically attempt to restore power. Leveraging daily fire danger information, operators are more conservative in keeping this functionality turned off than if updated hourly information was available. Leveraging more up to date information would enhance reliability, as it would limit the amount of time automatic reclosing capability was shut off.
Solar Irradiance Database
Learning – Visibility of Granular Solar Irradiance Data: With increasing penetration of behind-the-meter generation across the system, especially at the distribution level, managing the grid will become increasingly more complex under variable weather conditions due to variation in voltage, frequency, and load, as well as utility-side energy supply. The ability to assess current and future grid impacts from behind-the-meter PV generation requires accurate irradiance measurements and reliable predictions at high temporal and geographic resolutions. This opportunity necessitates a more robust data set of historical, present-day, and forecast solar irradiance as the primary driver of calculating PV generation estimates From a utility planning perspective, it is also helpful to have a single source of irradiance data (historical, current, and forecasted) for internal consistency.

EPIC Final Report | 1-05 Demonstrate New Resource Forecast Methods to Better Predict Variable Resource Output
7
The Solar Irradiance System developed and demonstrated in EPIC 1.05 successfully enabled this visibility into high resolution solar irradiance and PV generation data. The results demonstrated that overall the data that was accurate, stable and easy to access, with a few noted areas of improvement such as shading and fog, further detailed below. This granular data was leveraged by multiple use cases for the purposes of understanding PV impacts to enhance management of the grid. Overall, user feedback was strongly positive. The consolidated system enabled rapid and easy access to this critical data. Users provided feedback that the solar irradiance data and PV generation estimations are important components to a number of applications, such as enhancing energy procurement processes with better visibility of PV generation impacts. Next Step – Maintain Database/Portal and Explore Additional Opportunities: PG&E plans to continue maintaining the solar irradiance database and web portal, as well as to continue exploring new potential opportunities to incorporate this data into additional use cases.
Learning – Improvement Needed for Weather Forecasting Model Related to Fog: Once the Solar Irradiance System was in place, the irradiance forecast data was reviewed on a daily basis, with comprehensive evaluations of the credibility and accuracy of incoming model data, as well as the “stability” of the forecast data from one update to the next. Overall, the system was found to be stable and accurate. However, minor deficiencies were noted with the existing weather model system’s ability to handle the progression and dissipation of summertime marine stratus (fog) along the immediate coastline and through the San Francisco Bay Area. Some notable issues were with the timing of fog burn-off, or the complete absence of fog in the pre-dawn forecast issuances which would then be corrected once the sun had risen (revealing fog at the coast in the visible imagery).
Next Step – Explore Enhancements to Weather Forecasting Model: There have been recently published forecasting technology developments including techniques that may address these specific deficiencies in short-term (next few hours ahead) forecasting. PG&E will consider evaluating these new technologies to potentially integrate into the Solar Irradiance System.
Learning – Improvement Needed for PV Generation Estimates Related to Shaded Systems: PV generation estimates were found to be especially accurate for fully non-shaded systems. However, in order to enhance accuracy for shaded systems, more data is needed with regards to PV characteristics and environmental data (such as projected shading from buildings and trees). Next Step – Explore Options for PV Generation Estimating Technology for Shaded Systems: As new technologies are developed to address this issue, PG&E will consider evaluating those advancing technologies to estimate shading for PV generation data.
Conclusion This project successfully achieved all of its key objectives and, in doing so, has leveraged high resolution weather data to improve several areas, such as storm preparation, efficiently scheduling work crews for fire related events or changing the way the system is operated during time of high fire risk, and assessing current and future grid impacts from behind-the-meter PV generation. Through the work executed in this project and documented in this report, PG&E has gained substantial insight on the technical feasibility and value of implementing a system with high temporal and spatial resolution weather data.

EPIC Final Report | 1-05 Demonstrate New Resource Forecast Methods to Better Predict Variable Resource Output
8
Storm and fire preparation and response and increased PV penetration are relevant topics that universally impact utilities. The current industry standard weather data is of lower spatial and temporal resolution than that which was demonstrated in this project. Leveraging the higher resolution data, the findings of this project are relevant and adaptable to other utilities and industries. Due to the achievements of the project, PG&E will continue to maintain the POMMS, Fire Danger Rating System and Solar Irradiance System for storm and fire forecasts, emergency response, and leveraging high resolution solar irradiance data to understand PV impacts. POMMS integrated with SOPP has improved the accuracy of forecasting for large storms and allowed for increased efficiencies in storm preparation. The new fire danger model leveraging POMMS data has demonstrated improved accuracy in identifying fire risks enabling improved reliability and safety. The Solar Irradiance System developed and demonstrated by this project has proven to be an accurate and easily accessible source of information to be leveraged for understanding the impacts of PV generation on management of the grid. The project also identified some areas of improvement and future opportunities for key learnings. PG&E will consider leveraging the POMMS data through SOPP for optimized work resource allocation for emergency response and restoration. PG&E will also consider implementation of updated processes for leveraging hourly fire danger data as opposed to daily information for increased system reliability. Additionally, PG&E will consider incorporating data on fog opacity and fog burn off estimates in the solar irradiance database for the increased accuracy of PV generation estimation. Ultimately, EPIC 1.05 demonstrated the technical feasibility and significant value of leveraging robust, high resolution weather and solar irradiance data systems in support of reliability, safety and affordability, with several key learnings that will enable continued enhancement and future opportunities.

EPIC Final Report | 1-05 Demonstrate New Resource Forecast Methods to Better Predict Variable Resource Output
9
2. Introduction
This report documents the EPIC 1.05 Demonstrate New Resource Forecast Methods to Better Predict Variable Resource Output project achievements, highlights key learnings from the project that have industry-wide value, and identifies future opportunities for PG&E to leverage this project. The California Public Utilities Commission (CPUC) passed two decisions that established the basis for this demonstration program. The CPUC initially issued D. 11-12-035, Decision Establishing Interim Research, Development and Demonstrations and Renewables Program Funding Level3, which established the Electric Program Investment Charge (EPIC) on December 15, 2011. Subsequently, on May 24, 2012, the CPUC issued D. 12-05-037, Phase 2 Decision Establishing Purposes and Governance for Electric Program Investment Charge and Establishing Funding Collections for 2013-20204, which authorized funding for technology demonstration and deployment (TD&D). In this later decision, CPUC defined TD&D as “the installation and operation of pre-commercial technologies or strategies at a scale sufficiently large and in conditions sufficiently reflective of anticipated actual operating environments to enable appraisal of the operational and performance characteristics and the financial risks associated with a given technology.”5 The decision also required the EPIC Program Administrators6 to submit Triennial Investment Plans to cover three-year funding cycles for 2012-2014, 2015-2017, and 2018-2020. On November 1, 2012, in A.12-11-003, PG&E filed its first triennial Electric Program Investment Charge (EPIC) Application at the CPUC, requesting $49,328,000 including funding for 26 Technology Demonstration and Deployment Projects. On November 14, 2013, in D.13-11-025, the CPUC approved PG&E’s EPIC plan, including $49,328,000 for this program category. Pursuant to PG&E’s approved EPIC triennial plan, PG&E initiated, planned and implemented the following project: 1.05 Demonstrate New Resource Forecast Methods to Better Predict Variable Resource Output. Through the annual reporting process, PG&E kept CPUC staff and stakeholder informed on the progress of the project. The following is PG&E’s final report on this project.
3 http://docs.cpuc.ca.gov/PublishedDocs/WORD_PDF/FINAL_DECISION/156050.PDF 4 http://docs.cpuc.ca.gov/PublishedDocs/WORD_PDF/FINAL_DECISION/167664.PDF
5 Decision 12-05-037 pg. 37 6 Pacific Gas & Electric (PG&E), San Diego Gas & Electric (SDG&E), Southern California Edison (SCE), and the California Energy Commission (CEC)
EPIC Final Report | 1-05 Demonstrate New Resource Forecast Methods to Better Predict Variable Resource Output
10
3. Project Summary
This section summarizes the industry gaps the project addresses, the project’s objectives, the scope of work, and the major tasks, milestones, and their corresponding deliverables.
3.1 Issues Addressed
The Global Forecast System (GFS) and European Center Model (ECM) Numerical Weather Prediction (NWP) models, which are an industry standard models used by PG&E for forecasting applications such as predicting levels of storm damage, lack sufficient spatial resolution to predict surface conditions detailed enough for optimized storm damage modeling. Current NWP models have a horizontal spatial resolution of 12 kilometers (km) at the surface—this data must then be numerically down-scaled to estimate detailed surface conditions. A more robust solution is to employ a mesoscale7 model with a horizontal spatial resolution of 3 km, which allows for a much more accurate depiction of actual weather conditions at the surface and enables better representation of the hundreds of microclimates in PG&E’s service territory. A new system based on mesoscale modeling will allow PG&E to use higher resolution weather predictions to address several high priority issues: improving storm responses through more accurate storm damage modeling; achieving better fire weather awareness; and assessing grid impacts from behind-the-meter storage leveraging solar irradiance data.
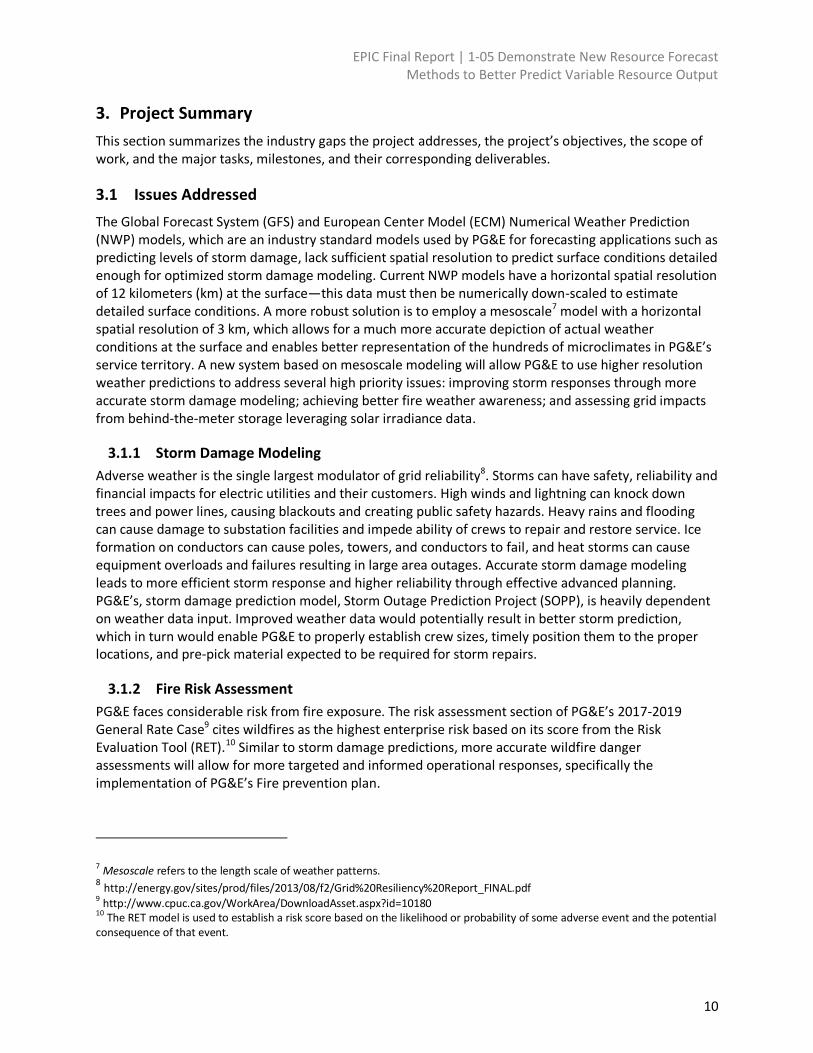
Storm Damage Modeling 3.1.1
Adverse weather is the single largest modulator of grid reliability8. Storms can have safety, reliability and financial impacts for electric utilities and their customers. High winds and lightning can knock down trees and power lines, causing blackouts and creating public safety hazards. Heavy rains and flooding can cause damage to substation facilities and impede ability of crews to repair and restore service. Ice formation on conductors can cause poles, towers, and conductors to fail, and heat storms can cause equipment overloads and failures resulting in large area outages. Accurate storm damage modeling leads to more efficient storm response and higher reliability through effective advanced planning. PG&E’s, storm damage prediction model, Storm Outage Prediction Project (SOPP), is heavily dependent on weather data input. Improved weather data would potentially result in better storm prediction, which in turn would enable PG&E to properly establish crew sizes, timely position them to the proper locations, and pre-pick material expected to be required for storm repairs.
Fire Risk Assessment 3.1.2
PG&E faces considerable risk from fire exposure. The risk assessment section of PG&E’s 2017-2019 General Rate Case9 cites wildfires as the highest enterprise risk based on its score from the Risk Evaluation Tool (RET).10 Similar to storm damage predictions, more accurate wildfire danger assessments will allow for more targeted and informed operational responses, specifically the implementation of PG&E’s Fire prevention plan.
7 Mesoscale refers to the length scale of weather patterns. 8 http://energy.gov/sites/prod/files/2013/08/f2/Grid%20Resiliency%20Report_FINAL.pdf 9 http://www.cpuc.ca.gov/WorkArea/DownloadAsset.aspx?id=10180 10
The RET model is used to establish a risk score based on the likelihood or probability of some adverse event and the potential consequence of that event.
EPIC Final Report | 1-05 Demonstrate New Resource Forecast Methods to Better Predict Variable Resource Output
11
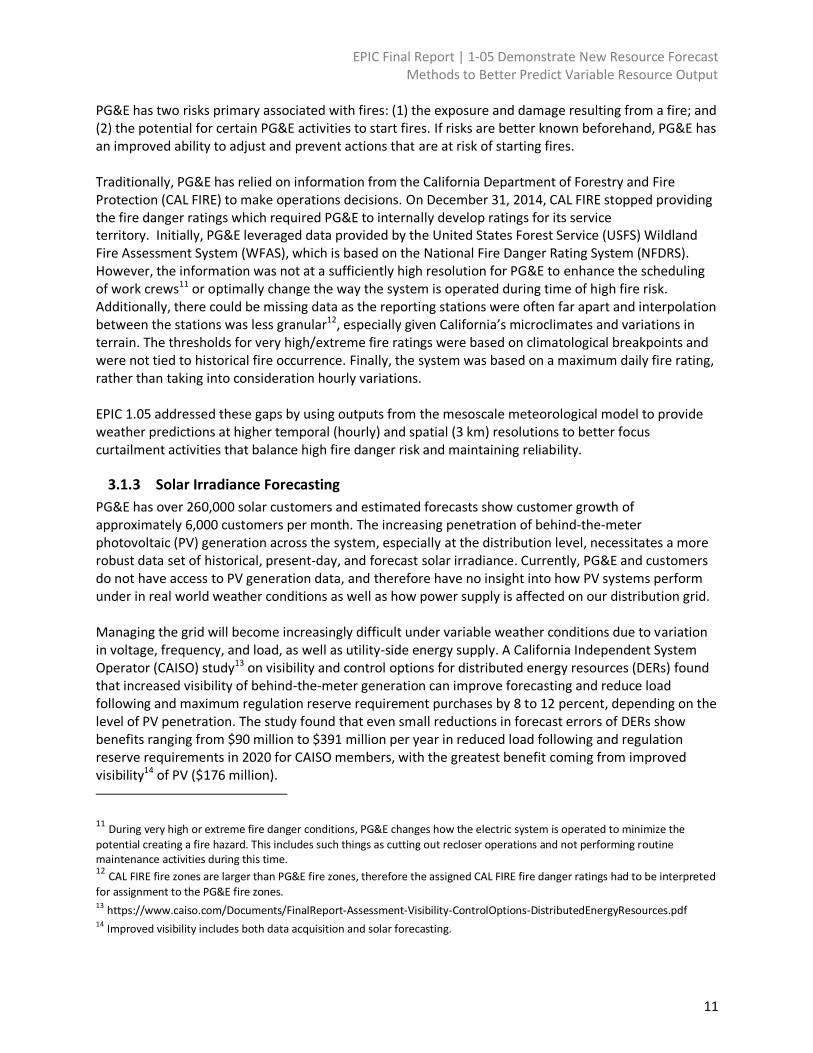
PG&E has two risks primary associated with fires: (1) the exposure and damage resulting from a fire; and (2) the potential for certain PG&E activities to start fires. If risks are better known beforehand, PG&E has an improved ability to adjust and prevent actions that are at risk of starting fires. Traditionally, PG&E has relied on information from the California Department of Forestry and Fire Protection (CAL FIRE) to make operations decisions. On December 31, 2014, CAL FIRE stopped providing the fire danger ratings which required PG&E to internally develop ratings for its service territory. Initially, PG&E leveraged data provided by the United States Forest Service (USFS) Wildland Fire Assessment System (WFAS), which is based on the National Fire Danger Rating System (NFDRS). However, the information was not at a sufficiently high resolution for PG&E to enhance the scheduling of work crews11 or optimally change the way the system is operated during time of high fire risk. Additionally, there could be missing data as the reporting stations were often far apart and interpolation between the stations was less granular12, especially given California’s microclimates and variations in terrain. The thresholds for very high/extreme fire ratings were based on climatological breakpoints and were not tied to historical fire occurrence. Finally, the system was based on a maximum daily fire rating, rather than taking into consideration hourly variations. EPIC 1.05 addressed these gaps by using outputs from the mesoscale meteorological model to provide weather predictions at higher temporal (hourly) and spatial (3 km) resolutions to better focus curtailment activities that balance high fire danger risk and maintaining reliability.
Solar Irradiance Forecasting 3.1.3
PG&E has over 260,000 solar customers and estimated forecasts show customer growth of approximately 6,000 customers per month. The increasing penetration of behind-the-meter photovoltaic (PV) generation across the system, especially at the distribution level, necessitates a more robust data set of historical, present-day, and forecast solar irradiance. Currently, PG&E and customers do not have access to PV generation data, and therefore have no insight into how PV systems perform under in real world weather conditions as well as how power supply is affected on our distribution grid. Managing the grid will become increasingly difficult under variable weather conditions due to variation in voltage, frequency, and load, as well as utility-side energy supply. A California Independent System Operator (CAISO) study13 on visibility and control options for distributed energy resources (DERs) found that increased visibility of behind-the-meter generation can improve forecasting and reduce load following and maximum regulation reserve requirement purchases by 8 to 12 percent, depending on the level of PV penetration. The study found that even small reductions in forecast errors of DERs show benefits ranging from $90 million to $391 million per year in reduced load following and regulation reserve requirements in 2020 for CAISO members, with the greatest benefit coming from improved visibility14 of PV ($176 million). 11 During very high or extreme fire danger conditions, PG&E changes how the electric system is operated to minimize the
potential creating a fire hazard. This includes such things as cutting out recloser operations and not performing routine maintenance activities during this time. 12 CAL FIRE fire zones are larger than PG&E fire zones, therefore the assigned CAL FIRE fire danger ratings had to be interpreted
for assignment to the PG&E fire zones. 13 https://www.caiso.com/Documents/FinalReport-Assessment-Visibility-ControlOptions-DistributedEnergyResources.pdf 14 Improved visibility includes both data acquisition and solar forecasting.
EPIC Final Report | 1-05 Demonstrate New Resource Forecast Methods to Better Predict Variable Resource Output
12
The primary driver of PV generation is solar irradiance. The ability to assess current and future grid impacts from behind-the-meter PV generation requires accurate irradiance measurements and reliable predictions at high temporal and geographic resolutions. From a utility planning perspective, it is also helpful to have a single source of irradiance data (historical, current, and forecasted) for internal consistency.
3.2 Project Objectives
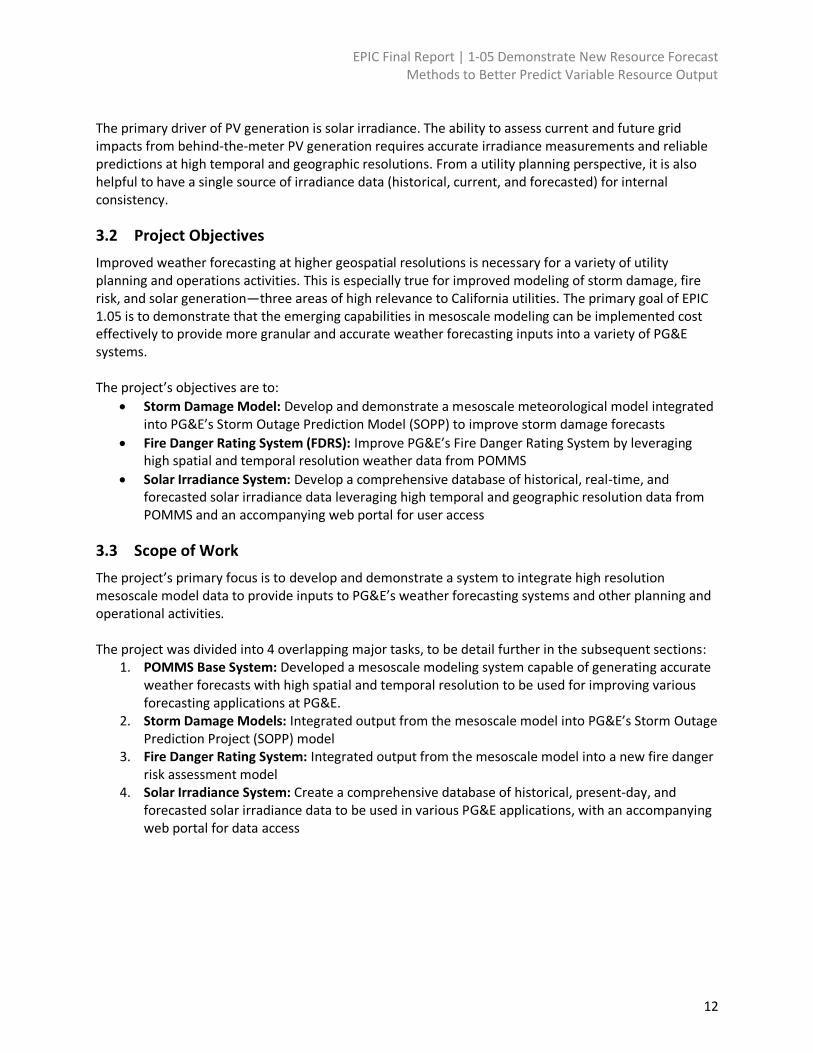
Improved weather forecasting at higher geospatial resolutions is necessary for a variety of utility planning and operations activities. This is especially true for improved modeling of storm damage, fire risk, and solar generation—three areas of high relevance to California utilities. The primary goal of EPIC 1.05 is to demonstrate that the emerging capabilities in mesoscale modeling can be implemented cost effectively to provide more granular and accurate weather forecasting inputs into a variety of PG&E systems. The project’s objectives are to:
Storm Damage Model: Develop and demonstrate a mesoscale meteorological model integrated into PG&E’s Storm Outage Prediction Model (SOPP) to improve storm damage forecasts
Fire Danger Rating System (FDRS): Improve PG&E’s Fire Danger Rating System by leveraging high spatial and temporal resolution weather data from POMMS
Solar Irradiance System: Develop a comprehensive database of historical, real-time, and forecasted solar irradiance data leveraging high temporal and geographic resolution data from POMMS and an accompanying web portal for user access
3.3 Scope of Work
The project’s primary focus is to develop and demonstrate a system to integrate high resolution mesoscale model data to provide inputs to PG&E’s weather forecasting systems and other planning and operational activities. The project was divided into 4 overlapping major tasks, to be detail further in the subsequent sections:
1. POMMS Base System: Developed a mesoscale modeling system capable of generating accurate weather forecasts with high spatial and temporal resolution to be used for improving various forecasting applications at PG&E.
2. Storm Damage Models: Integrated output from the mesoscale model into PG&E’s Storm Outage Prediction Project (SOPP) model
3. Fire Danger Rating System: Integrated output from the mesoscale model into a new fire danger risk assessment model
4. Solar Irradiance System: Create a comprehensive database of historical, present-day, and forecasted solar irradiance data to be used in various PG&E applications, with an accompanying web portal for data access

EPIC Final Report | 1-05 Demonstrate New Resource Forecast Methods to Better Predict Variable Resource Output
13
4. Major Tasks
4.1 POMMS Base System
POMMS Base System Deliverable 4.1.1
EPIC 1.05 developed a mesoscale modeling system (POMMS) capable of generating accurate weather forecasts with high spatial (3km) and temporal (60 minutes) resolution to be used for improving various forecasting applications at PG&E. It generates a gridded output four times per day to incorporate the most recent weather information available, and has the capability to generate forecasts up to 84 hours into the future. The outputs are various weather conditions including wind, temperature, precipitation, frozen precipitation, lightning, and solar irradiance. The finer resolution allows for much more accurate depiction of actual weather conditions at the surface and enables better representation of the hundreds of microclimates in PG&E’s service territory. All of the use cases demonstrated in this project, including the Storm Damage Model, Fire Danger Rating System and Solar Irradiance System are built upon this foundational deliverable.
POMMS Base System Description 4.1.2
The POMMS system leverages the Weather Research and Forecast Model (WRF)15, which produces raw gridded weather forecast data. WRF is a publicly available high resolution weather forecast model, created at the National Center for Atmospheric Research. This model uses a dynamic solver called the Advanced Research WRF (ARW) which is largely developed and maintained by the MMM Laboratory16, and a Local Analysis and Prediction System (LAPS)17 data assimilation scheme. This forecast model is then customized to PG&E’s service territory. Figure 4-1 below gives a visual representation of the grid on the left, and the key specifications used in the model on the right.
Figure 4-1 WRF Model and Key Specs
15 http://www.wrf-model.org/index.php 16 http://www2.mmm.ucar.edu/wrf/users/ 17 http://laps.noaa.gov/

EPIC Final Report | 1-05 Demonstrate New Resource Forecast Methods to Better Predict Variable Resource Output
14
The POMMS application runs automated scripts to download the raw WRF model output. From there, a Python script controls a series of NCAR Command Language (NCL) scripts that produce maps of various weather variables for weather forecasting as well as producing daily Network Common Data Form (NetCDF)18 files that contain hourly values of 2-m temperature, relative humidity, wind, precipitation and shortwave solar variables on the 3km resolution grid. The portal leverages interpolated19 point values generated by the mesoscale model to produce various data visualizations. Figure 4-2 below depicts the POMMS internal web portal, where the outputs of the model can be viewed by users. Each item in this portal can be selected to view maps of PG&E’s territory overlaid with specific data values, as illustrated in Figure 4-3.
Figure 4-2 POMMS Web Portal View
18 http://www.unidata.ucar.edu/software/netcdf/ 19 Interpolating refers to calculating new data points based on surrounding data points

EPIC Final Report | 1-05 Demonstrate New Resource Forecast Methods to Better Predict Variable Resource Output
15
Figure 4-3 Sample POMMS Output
This technology demonstration project worked with two suppliers to obtain and integrate data into POMMS, where one supplier managed and ran the computationally-intensive model over PG&E’s service territory, and the second vendor managed the post-processing activities that allow data to be integrated with the POMMS. A high performance computing cluster is required with several multicore processors and large amounts of storage on a 10 gigabit Ethernet network for the creation of the raw gridded data. While less intensive than running the model, an enterprise quality computing environment is required for post-processing as well.
4.2 Storm Damage Models
Storm Damage Model Deliverable 4.2.1
EPIC 1.05 delivered an integrated system with POMMs weather data providing inputs to PG&E’s Storm Outage Prediction Project (SOPP) model for storm risk assessments and pre-event guidance.
Storm Outage System Description 4.2.2
PG&E supplies electric operations with daily weather guidance, which highlights potential adverse weather in the service area during the next 10 days. The forecast goes out daily (3 times daily during storm events) and is as a key decision support tool for operations. A main component of the forecast is the SOPP (Storm Outage Prediction Project) Model, which details expected outage activity in each of PG&E’s 19 Divisions over the next 4 days, along with an estimate of the number of troublemen and crew resources required for assessment and repair. The model also projects the expected timing of weather risk and includes other added derivative products such as the expected number of 911 Standby calls and the number of assessment and dispatch resources needed during storm events.
EPIC Final Report | 1-05 Demonstrate New Resource Forecast Methods to Better Predict Variable Resource Output
16
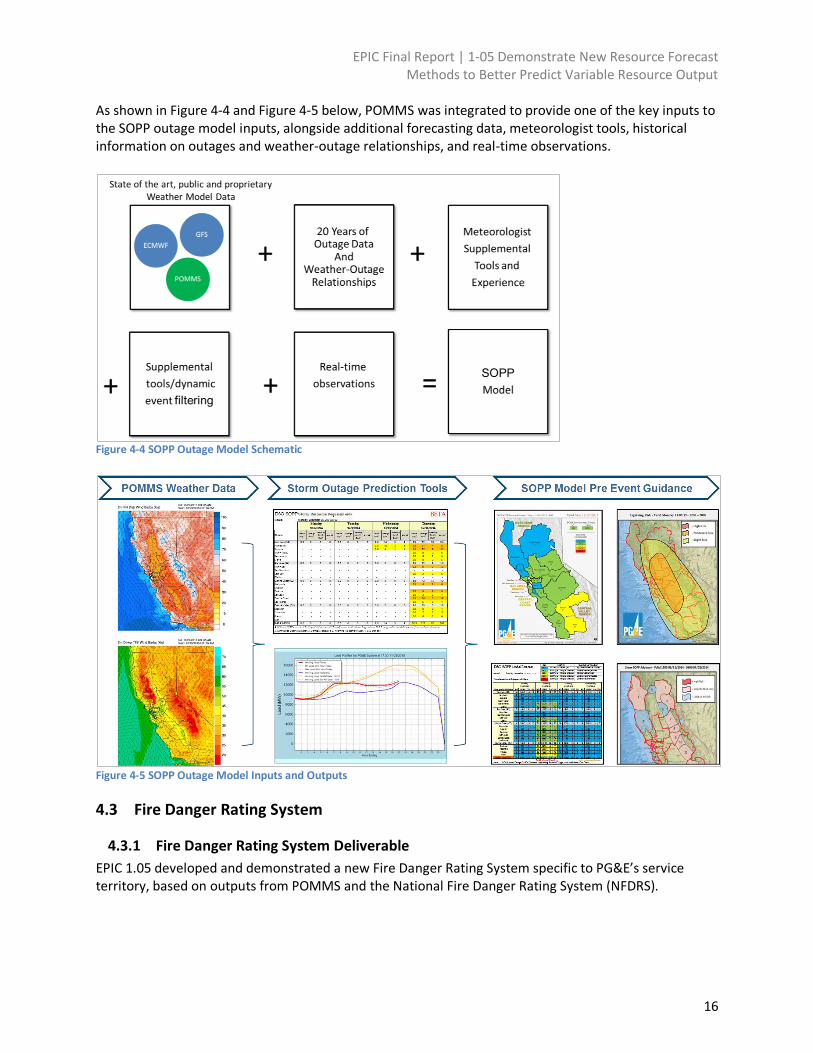
As shown in Figure 4-4 and Figure 4-5 below, POMMS was integrated to provide one of the key inputs to the SOPP outage model inputs, alongside additional forecasting data, meteorologist tools, historical information on outages and weather-outage relationships, and real-time observations.
Figure 4-4 SOPP Outage Model Schematic
Figure 4-5 SOPP Outage Model Inputs and Outputs
4.3 Fire Danger Rating System
Fire Danger Rating System Deliverable 4.3.1
EPIC 1.05 developed and demonstrated a new Fire Danger Rating System specific to PG&E’s service territory, based on outputs from POMMS and the National Fire Danger Rating System (NFDRS).

EPIC Final Report | 1-05 Demonstrate New Resource Forecast Methods to Better Predict Variable Resource Output
17
Key Fire Danger Rating Terms 4.3.1
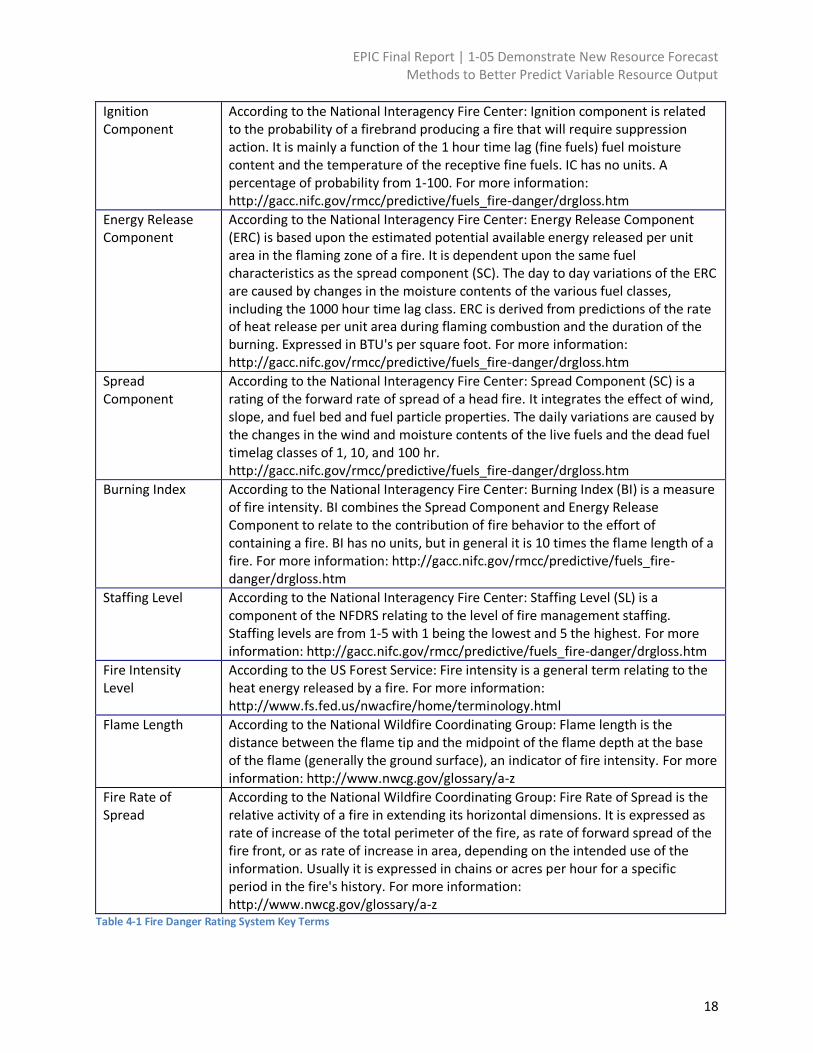
Listed and defined below in Table 4-1 are several of the key terms that are used to describe the Fire Danger Rating System.
Term Definition
Fire Danger According to the National Weather Coordinating Group (NWCG): The most commonly accepted definition of fire danger today is: “The resultant descriptor of the combination of both constant and variable factors which affect the initiation, spread and difficulty of control of wildfires on an area” (from Deeming et al. 197220). The various factors of fuels, weather, topography and risk are combined to assess the daily fire potential on an area. Fire danger is usually expressed in numeric or adjective terms. For more information: http://www.nwcg.gov/sites/default/files/products/pms932.pdf
Fire Danger Rating Areas
“Fire danger rating areas are necessary for effective and efficient use of NFDRS. The areas represent regions of similar climate, fuels, and topography. The size of these areas must be sufficiently small that similarity of fire danger is preserved and yet they must be large enough that fire control planning can function efficiently. Fire danger rating areas provide geographic regions for fire control planning” (Fosberg and Furman, 197121). For more information: http://www.nwcg.gov/sites/default/files/products/pms932.pdf
Fire Adjective Index value per Fire Index zone
The fire adjective index combines weather forecast data and dead fuel information to classify the daily fire threat from low to extreme. A Fire Index zone is a static geographical area that is given a unique Fire Index number. “Fire Area Adjective” or “Fire Index Area” boundaries are designated by the California Department of Forestry and Fire Protection and United States Forest Service for the purpose of establishing a fire-danger rating based on local fire conditions.
Fuel moisture Fuel moisture is a measure of the amount of water in a fuel (vegetation) available to a fire, and is expressed as a percent of the dry weight of that specific fuel. For more information: https://www.ncdc.noaa.gov/monitoring-references/dyk/deadfuelmoisture.
Fire Weather Watches and Red Flag Warnings
Fire Weather Watches and Warnings are issued by the National Weather Service as an alert for critical weather or dry conditions that could lead to increased fire activity. Fire Weather Watches are issued when critical weather conditions could occur in the next 12-72 hours. A Red Flag Warning is the highest alert and is issued when weather conditions may result in extreme fire activity in the next 24 hours. For more information: http://www.wrh.noaa.gov/firewx/main.php.
20 Deeming, J. E., J. W. Lancaster, M. A. Fosberg, R. W. Furman, and M.J. Schroeder. 1972. The National Fire-Danger Rating System. USDA Forest Service, Rocky Mountain Forest and Range Experiment Station, Research Paper RM-84, Ft. Collins, Colorado. 165 pp. Revised 1974. 21 Fosberg, M. A. and R. W. Furman. 1971. Fire Climate and Fire-Danger Rating Areas. USDA Forest Service, Rocky Mountain Forest and Range Experiment Station, Office Report 2106-6, Ft. Collins, Colorado. 10 pp.
EPIC Final Report | 1-05 Demonstrate New Resource Forecast Methods to Better Predict Variable Resource Output
18
Ignition Component
According to the National Interagency Fire Center: Ignition component is related to the probability of a firebrand producing a fire that will require suppression action. It is mainly a function of the 1 hour time lag (fine fuels) fuel moisture content and the temperature of the receptive fine fuels. IC has no units. A percentage of probability from 1-100. For more information: http://gacc.nifc.gov/rmcc/predictive/fuels_fire-danger/drgloss.htm
Energy Release Component
According to the National Interagency Fire Center: Energy Release Component (ERC) is based upon the estimated potential available energy released per unit area in the flaming zone of a fire. It is dependent upon the same fuel characteristics as the spread component (SC). The day to day variations of the ERC are caused by changes in the moisture contents of the various fuel classes, including the 1000 hour time lag class. ERC is derived from predictions of the rate of heat release per unit area during flaming combustion and the duration of the burning. Expressed in BTU's per square foot. For more information: http://gacc.nifc.gov/rmcc/predictive/fuels_fire-danger/drgloss.htm
Spread Component
According to the National Interagency Fire Center: Spread Component (SC) is a rating of the forward rate of spread of a head fire. It integrates the effect of wind, slope, and fuel bed and fuel particle properties. The daily variations are caused by the changes in the wind and moisture contents of the live fuels and the dead fuel timelag classes of 1, 10, and 100 hr. http://gacc.nifc.gov/rmcc/predictive/fuels_fire-danger/drgloss.htm
Burning Index According to the National Interagency Fire Center: Burning Index (BI) is a measure of fire intensity. BI combines the Spread Component and Energy Release Component to relate to the contribution of fire behavior to the effort of containing a fire. BI has no units, but in general it is 10 times the flame length of a fire. For more information: http://gacc.nifc.gov/rmcc/predictive/fuels_fire-danger/drgloss.htm
Staffing Level According to the National Interagency Fire Center: Staffing Level (SL) is a component of the NFDRS relating to the level of fire management staffing. Staffing levels are from 1-5 with 1 being the lowest and 5 the highest. For more information: http://gacc.nifc.gov/rmcc/predictive/fuels_fire-danger/drgloss.htm
Fire Intensity Level
According to the US Forest Service: Fire intensity is a general term relating to the heat energy released by a fire. For more information: http://www.fs.fed.us/nwacfire/home/terminology.html
Flame Length According to the National Wildfire Coordinating Group: Flame length is the distance between the flame tip and the midpoint of the flame depth at the base of the flame (generally the ground surface), an indicator of fire intensity. For more information: http://www.nwcg.gov/glossary/a-z
Fire Rate of Spread
According to the National Wildfire Coordinating Group: Fire Rate of Spread is the relative activity of a fire in extending its horizontal dimensions. It is expressed as rate of increase of the total perimeter of the fire, as rate of forward spread of the fire front, or as rate of increase in area, depending on the intended use of the information. Usually it is expressed in chains or acres per hour for a specific period in the fire's history. For more information: http://www.nwcg.gov/glossary/a-z
Table 4-1 Fire Danger Rating System Key Terms

EPIC Final Report | 1-05 Demonstrate New Resource Forecast Methods to Better Predict Variable Resource Output
19
The National Weather Coordinating Group (NWCG) defines the fire danger ratings as follows in Table 4-2.
Fire Danger Rating and Color Code
Description
Low (L) (Green)
Fuels do not ignite readily from small firebrands although a more intense heat source, such as lightning, may start fires in duff or punky wood. Fires in open cured grasslands may burn freely a few hours after rain, but woods fires spread slowly by creeping or smoldering, and burn in irregular fingers. There is little danger of spotting.
Moderate (M) (Blue)
Fires can start from most accidental causes, but with the exception of lightning fires in some areas, the number of starts is generally low. Fires in open cured grasslands will burn briskly and spread rapidly on windy days. Timber fires spread slowly to moderately fast. The average fire is of moderate intensity, although heavy concentrations of fuel, especially draped fuel, may burn hot. Short-distance spotting may occur, but is not persistent. Fires are not likely to become serious and control is relatively easy.
High (H) (Yellow)
All fine dead fuels ignite readily and fires start easily from most causes. Unattended brush and campfires are likely to escape. Fires spread rapidly and short-distance spotting is common. High-intensity burning may develop on slopes or in concentrations of fine fuels. Fires may become serious and their control difficult unless they are attacked successfully while small.
Very High (VH) (Orange)
Fires start easily from all causes and, immediately after ignition, spread rapidly and increase quickly in intensity. Spot fires are a constant danger. Fires burning in light fuels may quickly develop high intensity characteristics such as long-distance spotting and fire whirlwinds when they burn into heavier fuels.
Extreme (E) (Red)
Fires start quickly, spread furiously, and burn intensely. All fires are potentially serious. Development into high intensity burning will usually be faster and occur from smaller fires than in the very high fire danger class. Direct attack is rarely possible and may be dangerous except immediately after ignition. Fires that develop headway in heavy slash or in conifer stands may be unmanageable while the extreme burning condition lasts. Under these conditions the only effective and safe control action is on the flanks until the weather changes or the fuel supply lessens.
Table 4-2 NWCG Fire Danger Ratings Defined
As illustrated in Figure 4-6, using the computed Ignition Component (IC) and Staffing Level (SL), The National Weather Coordinating Group (NWCG) determines the adjective fire-danger rating (R) from the adjective fire-danger matrix.
Figure 4-6 Adjective Fire Danger Rating
EPIC Final Report | 1-05 Demonstrate New Resource Forecast Methods to Better Predict Variable Resource Output
20
Fire Danger Rating System Key Partners 4.3.2
EPIC 1.05 consulted with multiple partners to overhaul PG&E’s fire danger rating methodology to take into account higher spatial and temporal resolution data. The following groups were key project partners. In addition to individual interactions, most of these groups participated in at least one of two external sharing and coordination meetings. The first meeting was a Joint Fire Science Meeting hosted by EPIC 1.05 at PG&E in December 2015, with the objective of discussing electric utility fire danger predictive platforms and seeking opportunities to collaborate. The second meeting was the 2016 Wildland Fire Kickoff Meeting in Sacramento at the California Fire and Rescue Training Authority, with the meeting objective of reviewing current conditions for both fire danger, the drought and fuel conditions throughout the state.
California Department of Forestry and Fire Protection (CAL FIRE): CAL FIRE provides fire response, emergency services and protection as well as stewardship over California’s wildlands. The Battalion Chief participated in the Joint Fire Science Meeting as well as the 2016 Wildfire Kickoff meeting. CAL FIRE provided valuable feedback on limitations of the existing fire danger assessment system on how EPIC 1.05 might best construct fire business thresholds specific to PG&E. CAL FIRE also gave positive feedback on the project’s overall approach to fire danger modeling. CAL FIRE recommended a specific course on NFDRS (National Fire Danger Rating System) that a member of the EPIC 1.05 project team completed (Figure 4-7), to establish PG&E’s commitment and credentials in the fire danger awareness arena.
U.S. Forest Service: The U.S. Forest Service manages and protects the United States’ national forests and grasslands. EPIC 1.05 interfaced with and received advice from the Geographic Area Coordination Center South Ops Lead Meteorologist. He participated in the Joint Fire Science Meeting as well as the 2016 Wildfire Kickoff meeting and provided an overview and lessons learned from SAWTI – Santa Ana Wildfire Threat Index, and guidance on utilizing the Nelson Fuel Model within NFDRS – National Fire Danger Rating System.
National Weather Service (NWS): NWS provides weather, water, and climate data, forecasts and warnings for the protection of life and property and enhancement of the national economy. The NWS participated in the Joint Fire Science Meeting as a key stakeholder.
San Diego Gas & Electric (SDG&E): SDG&E is a regulated public utility that provides energy service in San Diego and southern Orange counties. SDG&E participated in the Joint Fire Science Meeting, and provided technical background on their fire danger awareness tools and systems.
Fire Weather Research Lab: San José State University's Fire Weather Research Laboratory is focused on uncovering the science behind fire-atmosphere interactions. The lab Director participated in the Joint Fire Science Meeting, and provided general consulting and advice on fire danger prediction techniques.
Bureau of Land Management (BLM): BLM is responsible for management public lands across the country, including wildland fire management. BLM participated in the 2016 Wildfire Kickoff meeting as a key stakeholder.
California Governor’s Office of Emergency Services (Cal OES): The primary goals of Cal OES include anticipating and enhancing prevention and detection capabilities to protect California

EPIC Final Report | 1-05 Demonstrate New Resource Forecast Methods to Better Predict Variable Resource Output
21
from hazards and threats, strengthening California’s ability to plan, prepare for, and provide resources to mitigate the impacts of disasters, emergencies, crimes, and terrorist events, and effectively responding to and recovering from both human-caused and natural disasters. Cal OES participated in the 2016 Wildfire Kickoff meeting as a key stakeholder.
PG&E’s Wildfire Risk Council: The Wildfire Risk Council is a cross-functional group made up of internal PG&E Fire stakeholders including but not limited to individuals from Vegetation Management, Electric Emergency Management, Electric Operations, Reliability and Compliance, and Legal. Representatives from this diverse group of stakeholders participated and presented at the 2016 Wildfire Kickoff meeting, on topics such as wildfire risk, asset protection, vegetation management capabilities and aerial detection capabilities.
In addition to the project partners above, another key agency to recognize is the National Wildfire Coordinating Group (NWCG).NWCG provides national leadership to develop, maintain, and communicate interagency standards, guidelines, qualifications, training, and other capabilities that enable interoperable operations among federal and non-federal entities. Member agencies include (but not limited to) the Bureau of Land Management, United States Fire Administration, International Association of Fire Chiefs, and the National Park Service. NWCG is responsible for establishing and maintaining standards and procedures for fire danger rating, developing and disseminating fire danger rating training and guidance and providing leadership in the National Fire Danger Rating System and associated decision support applications22.
Figure 4-7 NFDRS Training
22 http://www.nwcg.gov/sites/default/files/products/pms932.pdf

EPIC Final Report | 1-05 Demonstrate New Resource Forecast Methods to Better Predict Variable Resource Output
22
Fire Danger Rating System Description 4.3.3
PG&E Operational Mesoscale Modeling System (POMMS) was employed to provide granular operational wildfire threat assessment. The National Fire Danger Rating System in combination with post-processing techniques lead to the determination of hourly fire index adjective ratings covering a 3km resolution grid of the PG&E Service Territory for the current day and day ahead. Outline of System (illustrated in Figure 4-8)
1. POMMS processes high resolution weather data
2. NFDRS/Nelson Dead Fuel model runs using POMMS weather data as input
3. NFDRS post-processing along with incorporation of NWS Red Flag Warnings determine the Fire
Adjective Index value at a 3km resolution for the PG&E Service Area
4. The Geographic Information System (GIS) performs spatial averaging statistics to determine the
daily Fire Adjective Index value per Fire Index zone
5. Daily emails are sent highlighting the Fire Index zones with very high or extreme values
Figure 4-8 PG&E Fire Index Data Flow and System Overview
NFDRS and Nelson Dead Fuel Model: Once a day, the POMMS application runs the NFDRS and Nelson Dead Fuel Moisture Model and creates daily NetCDF output files containing hourly 1hr, 10hr, 100hr, and 1000hr fuel moisture, ignition component, energy release component, flame length, fire rate of spread, spread component, burning index, and fire intensity level. The script also produces hourly maps of a selection of the fire variables (example in Figure 4-9 below). The NFDRS model runs out 48 hours, so each model run can output model information for the current day and the day ahead.
POMMS WRF POMMS Post-
Processing NFDRS & Nelson Dead Fuel Model
NFDRS Post-processing
PG&E Fire Index System
(GIS)
Fire Adjective Index Email (TD – 1464s)
PG&E Fire Index Data Flow and System Overview

EPIC Final Report | 1-05 Demonstrate New Resource Forecast Methods to Better Predict Variable Resource Output
23
Figure 4-9 Example Hourly Map Output
NFDRS Post-Processing: The application runs an automated script to copy the NFDRS output files into a working directory where another NCL script uses threshold values of burning index in combination with ignition component values to determine the hourly fire index adjective rating on the 3km resolution grid. For the current day and the day ahead, the script outputs the daily maximum ratings for each latitude/ longitude point to a csv file, which is copied to a web directory on all servers and also produces the daily max, hourly, and district-averaged maps of the fire adjective index. An example of the 3km resolution of the daily maximum fire danger rating is shown below in Figure 4-10.
Figure 4-10 Example 3km Resolution of Daily Maximum Fire Danger Rating
EPIC Final Report | 1-05 Demonstrate New Resource Forecast Methods to Better Predict Variable Resource Output
24
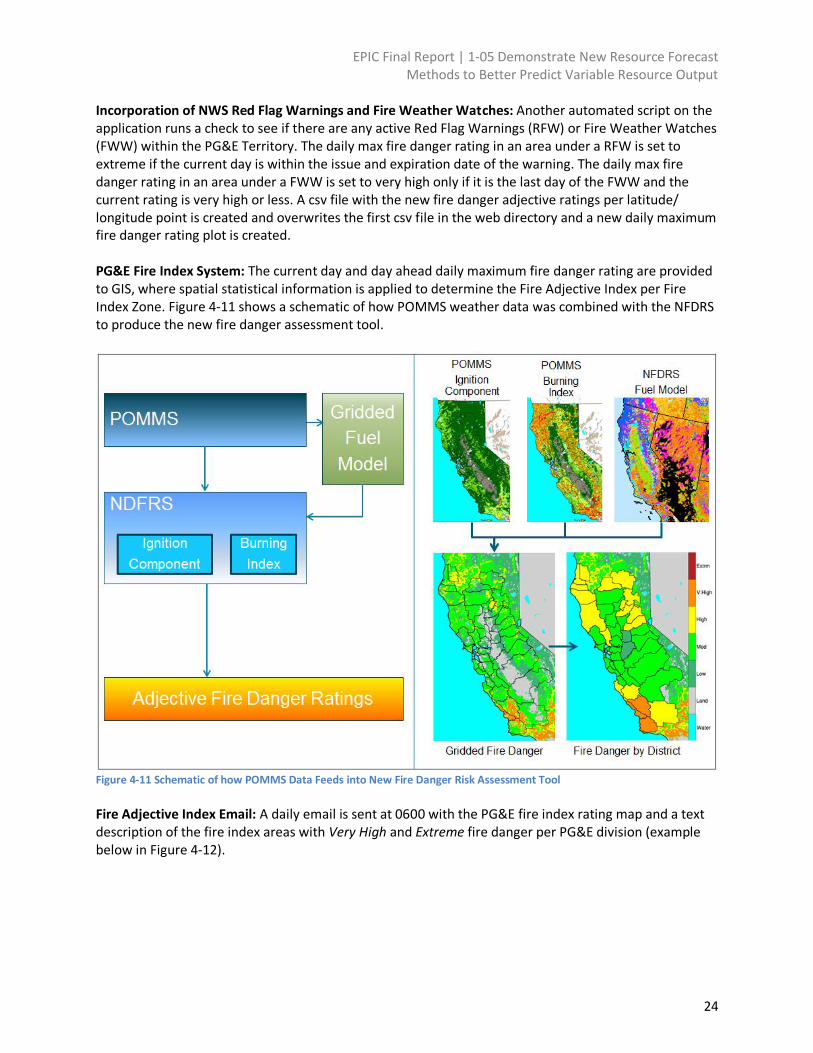
Incorporation of NWS Red Flag Warnings and Fire Weather Watches: Another automated script on the application runs a check to see if there are any active Red Flag Warnings (RFW) or Fire Weather Watches (FWW) within the PG&E Territory. The daily max fire danger rating in an area under a RFW is set to extreme if the current day is within the issue and expiration date of the warning. The daily max fire danger rating in an area under a FWW is set to very high only if it is the last day of the FWW and the current rating is very high or less. A csv file with the new fire danger adjective ratings per latitude/ longitude point is created and overwrites the first csv file in the web directory and a new daily maximum fire danger rating plot is created. PG&E Fire Index System: The current day and day ahead daily maximum fire danger rating are provided to GIS, where spatial statistical information is applied to determine the Fire Adjective Index per Fire Index Zone. Figure 4-11 shows a schematic of how POMMS weather data was combined with the NFDRS to produce the new fire danger assessment tool.
Figure 4-11 Schematic of how POMMS Data Feeds into New Fire Danger Risk Assessment Tool
Fire Adjective Index Email: A daily email is sent at 0600 with the PG&E fire index rating map and a text description of the fire index areas with Very High and Extreme fire danger per PG&E division (example below in Figure 4-12).

EPIC Final Report | 1-05 Demonstrate New Resource Forecast Methods to Better Predict Variable Resource Output
25
Figure 4-12 Example Fire Adjective Index Email
4.4 Solar Irradiance System
Solar Irradiance System Deliverable 4.4.1
EPIC 1.05 developed and demonstrated a single-sourced, comprehensive database and corresponding web portal of historical, present-day, and forecasted solar irradiance data. The data is provided in a gridded format at 3 km spatial resolution and 15- and 60-minute temporal resolution, and new data is ingested hourly into PG&E’s system. The front-end, internal web portal enables data access, requests, delivery and knowledge sharing. The system also includes a function to compute PV power output (kW) leveraging weather, solar position and PV system specification data leveraging a conversion methodology designed by NREL23. The project team conducted an industry review of renewable forecasting methods and tools and developed a detailed comparison of third-party solar forecasters. The metrics of comparison included day-ahead forecast accuracy, cost of services, and scalability. A third-party vendor was selected to deliver historical, present-day, and forecasted solar irradiance data for the demonstration.
Solar Irradiance Basics 4.4.2
The sun constantly emits electromagnetic radiation at many wavelengths and in all directions, of which a small fraction of radiation is intercepted by the earth on its annual orbit around the sun. Solar generation makes use of the visible, near-ultraviolet, and near-infrared wavelength range of radiation (aka shortwave radiation), which are cumulatively around 1,367 watts per meter square (W/m2: the unit of measure for radiation) when reaching earth's outer atmosphere. However, as illustrated in Figure 4-13, given the spherical shape of the earth, the incoming shortwave radiation directed towards higher
23 Version 5 documentation can be found here: http://www.nrel.gov/docs/fy14osti/62641.pdf

EPIC Final Report | 1-05 Demonstrate New Resource Forecast Methods to Better Predict Variable Resource Output
26
latitude regions "hits" at a higher angle of incidence, exhibiting more of glancing blow, than a direct hit. This results in "beam spreading" in which the same 1,367 W/m2 of incoming shortwave radiation are more widely spread across a larger surface area. Because of such, areas farther north and south of the equator receive less shortwave radiation per unit of surface area. Earth does not stand still, but revolves (i.e. orbits) and rotates (i.e. spins) around its tilted axis. So not only does the amount of incoming shortwave radiation vary by latitude, but also by time of day, and day of the year. Due to the combination of these factors, the sun is more directly overhead at noon than 5am, 5pm, or midnight, and the sun is higher in the sky on a June day, than it is in December. For a given location (latitude/longitude), date and time, and with knowledge about the earth's position relative to the sun, accurately determining the amount of incoming shortwave radiation is actually a relatively simple procedure. However, the earth has a 12-kilometer (km) thick atmosphere that greatly complicates the process, especially when clouds are present.
Figure 4-13 Impacts of Lat/Long on Amount of Radiation per Meter Square
Clear Sky Irradiance Shortwave radiation travels from the sun, through outer space, before reaching the top of earth's atmosphere. On the last portion of the journey, shortwave radiation passes through the 12-km thick atmosphere that surrounds our planet, comprised of many gaseous molecules -1044 to be exact. There are four "paths" for the incoming shortwave radiation as it travels through the atmosphere to the earth's surface:
1. The shortwave radiation runs into and is absorbed by an air molecule. 2. The shortwave radiation runs into an air molecule, and is reflected back to space. 3. The shortwave radiation runs into an air molecule and is scattered in all directions, some down
towards earth. 4. The shortwave radiation misses all air molecules and reaches the earth's surface unimpeded.

EPIC Final Report | 1-05 Demonstrate New Resource Forecast Methods to Better Predict Variable Resource Output
27
The portion of incoming solar radiation that reaches the earth's surface and comes directly from the path to the sun (some from #3: forward scattering, but mostly from #4: direct from the sun) is known as direct normal irradiance (DNI). The portion of incoming shortwave radiation that reaches the earth's surface and comes from atmospheric scattering (#4) is known as diffuse horizontal irradiance (DIF). The combination of DNI and DIF is known as global horizontal irradiance (GHI). Conceptually, GHI can be thought of as the sunlight that reaches the earth's surface, and is the unit of measure most closely linked to solar generation. For context, GHI peaks around 550-650 W/m2 on a clear sky January day, and 1030-1080 W/m2 on a clear sky June day. When considering GHI, normal is defined (which changes by location, time of day, and day of year) as the amount of incoming solar radiation that reaches the earth's surface under "clear sky" conditions. During most hours of a "clear sky" day, DNI is a much larger contributor to GHI than DIF, except for dusk and dawn when the sun is close to the horizon and most incoming solar radiation reaching the earth's surface via atmospheric scattering (i.e. twilight). Figure 4-14 illustrates the four key measurements of solar irradiance.
Figure 4-14 Measurements of Solar Irradiance
Cloudy Sky Irradiance While "clear sky" GHI is the idealized normal, real-life clear sky conditions are not an all day-everyday occurrence. Ever-evolving weather patterns produce complex cloud patterns that move, grow, and change as they progress. By definition, a cloud is a collection of water vapor molecules that have condensed to form water droplets or ice crystals suspended in the atmosphere. Depending on the cloud height, thickness, and composition, different clouds have wide-ranging effects on atmospheric scattering, and the ability of incoming solar radiation to pass through them. Detailed studies have been conducted by the meteorological community to understand cloud physics and thermodynamics, and the ability of different cloud types to scatter incoming solar radiation. To relate back to the above topic, if a cloud is directly between you and the sun, then DIF is a much larger
EPIC Final Report | 1-05 Demonstrate New Resource Forecast Methods to Better Predict Variable Resource Output
28
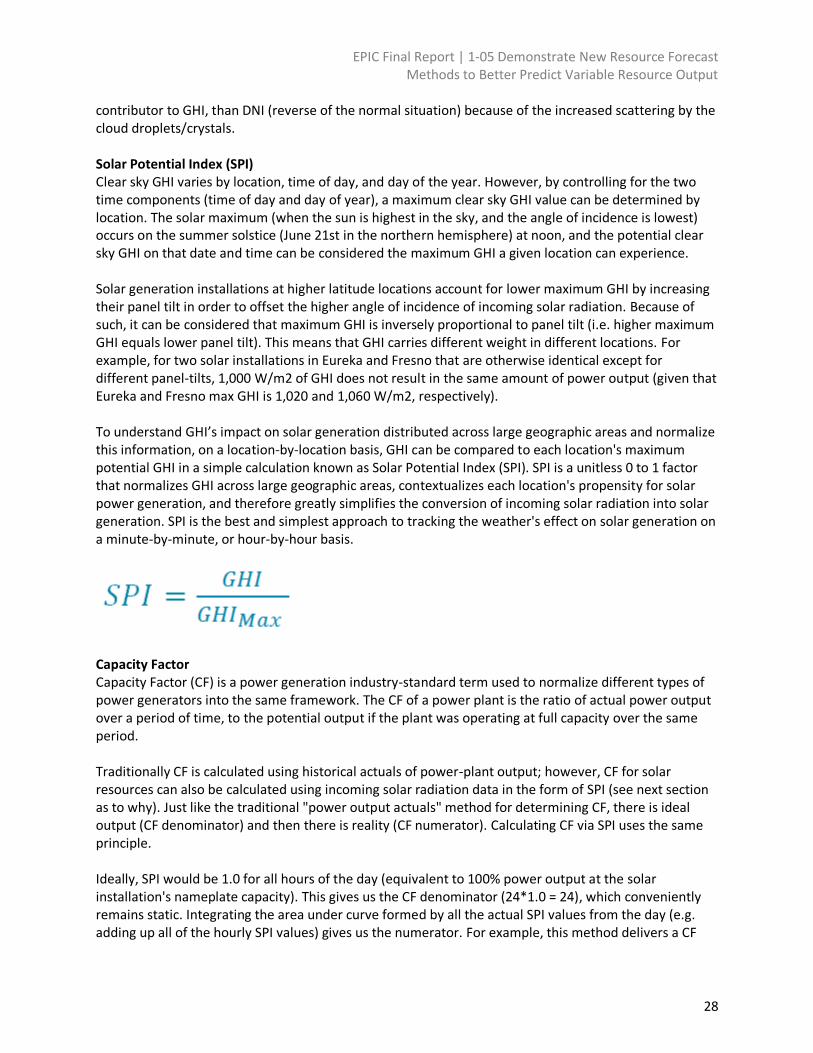
contributor to GHI, than DNI (reverse of the normal situation) because of the increased scattering by the cloud droplets/crystals. Solar Potential Index (SPI) Clear sky GHI varies by location, time of day, and day of the year. However, by controlling for the two time components (time of day and day of year), a maximum clear sky GHI value can be determined by location. The solar maximum (when the sun is highest in the sky, and the angle of incidence is lowest) occurs on the summer solstice (June 21st in the northern hemisphere) at noon, and the potential clear sky GHI on that date and time can be considered the maximum GHI a given location can experience. Solar generation installations at higher latitude locations account for lower maximum GHI by increasing their panel tilt in order to offset the higher angle of incidence of incoming solar radiation. Because of such, it can be considered that maximum GHI is inversely proportional to panel tilt (i.e. higher maximum GHI equals lower panel tilt). This means that GHI carries different weight in different locations. For example, for two solar installations in Eureka and Fresno that are otherwise identical except for different panel-tilts, 1,000 W/m2 of GHI does not result in the same amount of power output (given that Eureka and Fresno max GHI is 1,020 and 1,060 W/m2, respectively). To understand GHI’s impact on solar generation distributed across large geographic areas and normalize this information, on a location-by-location basis, GHI can be compared to each location's maximum potential GHI in a simple calculation known as Solar Potential Index (SPI). SPI is a unitless 0 to 1 factor that normalizes GHI across large geographic areas, contextualizes each location's propensity for solar power generation, and therefore greatly simplifies the conversion of incoming solar radiation into solar generation. SPI is the best and simplest approach to tracking the weather's effect on solar generation on a minute-by-minute, or hour-by-hour basis.
Capacity Factor Capacity Factor (CF) is a power generation industry-standard term used to normalize different types of power generators into the same framework. The CF of a power plant is the ratio of actual power output over a period of time, to the potential output if the plant was operating at full capacity over the same period. Traditionally CF is calculated using historical actuals of power-plant output; however, CF for solar resources can also be calculated using incoming solar radiation data in the form of SPI (see next section as to why). Just like the traditional "power output actuals" method for determining CF, there is ideal output (CF denominator) and then there is reality (CF numerator). Calculating CF via SPI uses the same principle. Ideally, SPI would be 1.0 for all hours of the day (equivalent to 100% power output at the solar installation's nameplate capacity). This gives us the CF denominator (24*1.0 = 24), which conveniently remains static. Integrating the area under curve formed by all the actual SPI values from the day (e.g. adding up all of the hourly SPI values) gives us the numerator. For example, this method delivers a CF

EPIC Final Report | 1-05 Demonstrate New Resource Forecast Methods to Better Predict Variable Resource Output
29
value of 0.18 for a clear sky day in January, a CF value of 0.31 on a clear sky day in June, and a CF value of 0.14 for a cloudy day in June. Translating these CF values into total energy generated by a 300 kW size solar installation would net 54, 99, and 42 kWh, respectively. Ultimately the observed/estimated and forecast SPI values can be calculated and converted to CF for the whole solar irradiance dataset, which in turn can be easily translated into daily total generation (based on location and array capacity). Because of its relatability to industry standards, CF is the best and simplest approach to understanding the weather's effect on daily total solar generation. Irradiance to Power Conversion Methodologies There are many solar power technologies available today (fixed and tracking photovoltaics, solar-thermal, etc.), but all use incoming solar radiation as the fuel that drives generation. For example, photovoltaics (PV) is a methodology in which a crystalline semiconductor material intercepts incoming solar radiation, and converts it to direct current (DC) electricity. In turn, the DC electricity is converted to alternating current (AC) electricity by an inverter. The strength of the DC output from a PV array is contingent upon the amount of incoming solar radiation, and the engineering systems are designed for one-to-one input-to-output conversion. Irradiance to power conversion calculations are done primarily in two ways, by using either top-down, or bottom-up methodologies.
Top-Down Methodology: The simplistic top-down method of forecasting aggregate solar power by all rooftop solar installations connected to a feeder is to multiply the aggregate nameplate capacity by SPI (this method works for other, larger levels of aggregation such as by substation, planning area, subLAP, region, etc.). For example, if the aggregate nameplate capacity of all the rooftop solar installation on a given feeder is 500 kW, and the current hour's SPI is 0.5: the expected solar power output would be 250 kW. This efficient method works well for larger areas of aggregation (feeder and higher), and requires little information about each solar installation (only location and size). However, the accuracy of top-down methodology falls short for individual solar installations because localized shading and system losses and design factors have to be considered in order to properly forecast solar power output.
Bottom-Up Methodology: There are many models that can be utilized to perform a bottom-up irradiance to power conversion. Many require some solar system design specifications (i.e. metadata). For example, here is a subset of some of the necessary inputs:
o Array Tilt - Angle up from parallel to the earth's surface o Array Azimuth - direction (relative to north) that panel is facing o Nameplate DC Capacity - total size of all PV modules, in kilowatts o Inverter Capacity - total capability of array's inverter for converting DC electricity
into AC electricity into AC electricity o Array Location - Latitude/Longitude o GHI intercepted in the plane of the PV array (aka POAI: Plane of Array Irradiance)
The majority of inputs to a bottom-up irradiance to power model are static metadata values, with the exception of GHI (incoming solar radiation). However, with accurate records/estimates/predictions of the amount of GHI intercepted by the solar array, the amount of power output can be accurately determined in turn. In other words, the most dynamic part solar power output estimation/prediction is
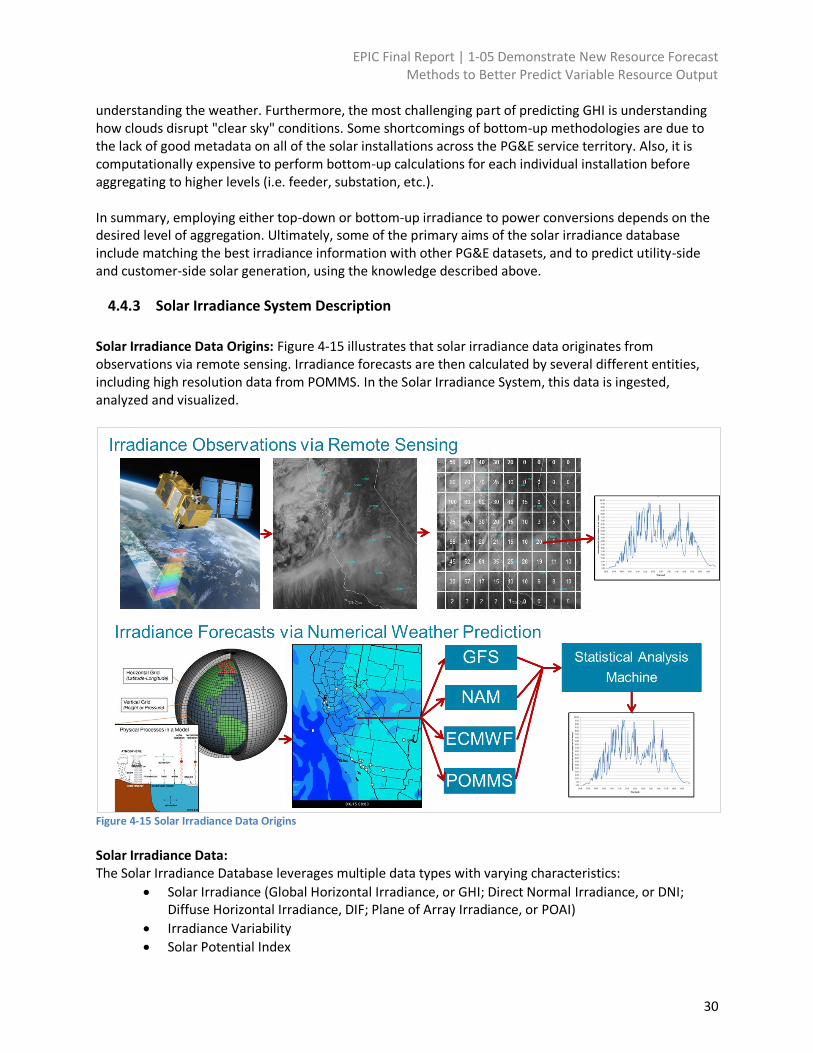
EPIC Final Report | 1-05 Demonstrate New Resource Forecast Methods to Better Predict Variable Resource Output
30
understanding the weather. Furthermore, the most challenging part of predicting GHI is understanding how clouds disrupt "clear sky" conditions. Some shortcomings of bottom-up methodologies are due to the lack of good metadata on all of the solar installations across the PG&E service territory. Also, it is computationally expensive to perform bottom-up calculations for each individual installation before aggregating to higher levels (i.e. feeder, substation, etc.). In summary, employing either top-down or bottom-up irradiance to power conversions depends on the desired level of aggregation. Ultimately, some of the primary aims of the solar irradiance database include matching the best irradiance information with other PG&E datasets, and to predict utility-side and customer-side solar generation, using the knowledge described above.
Solar Irradiance System Description 4.4.3
Solar Irradiance Data Origins: Figure 4-15 illustrates that solar irradiance data originates from observations via remote sensing. Irradiance forecasts are then calculated by several different entities, including high resolution data from POMMS. In the Solar Irradiance System, this data is ingested, analyzed and visualized.
Figure 4-15 Solar Irradiance Data Origins
Solar Irradiance Data: The Solar Irradiance Database leverages multiple data types with varying characteristics:
Solar Irradiance (Global Horizontal Irradiance, or GHI; Direct Normal Irradiance, or DNI; Diffuse Horizontal Irradiance, DIF; Plane of Array Irradiance, or POAI)
Irradiance Variability
Solar Potential Index

EPIC Final Report | 1-05 Demonstrate New Resource Forecast Methods to Better Predict Variable Resource Output
31
Capacity Factor
PV Power Output Data Timeframes:
Forecast - forward looking data used to plan next several hours to next several days o Interval: 60 minute (two regions with 15-minute data available) o Leadtime: 60 minutes extending out 7 days o Updated every 30 minutes with the latest forecast information
Observation - real-time and historical estimates for reviewing and characterizing past events o Interval: 30 minute o Historical data extending back to January 2012 o Updated in real-time every 30 minutes
Typical Meteorological (TMY) - climate-type curves for long-term (greater than 7-day) planning o Interval: 60 minute o Monthly profiles for typical and clear sky conditions
Geospatial Coverage: The solar irradiance database has 3-kilometer 3-dimensional gridded weather information (north-south, east-west layers at varying past/future time-slices) that cover the entirety of the Service Territory at 60-minute intervals. In addition to "Service Area" coverage, the database made data available for several select regions (San Jose and Fresno) with higher geospatial resolution (1km) and shorter time-intervals (15-minute). Other Key Datasets Included in the System: The DG Resource and Utility Scale Resources datasets outline where all the PV assets are located as well as their design specifications. Combining this info with the Solar Position and Grid Point datasets we can produce PV output estimations/forecasts. Lastly, PG&E Asset Metadata describes how these resources are connected to the distribution/transmission system, thus allowing for effective mapping and integration of the PV output data.
DG Resources: This dataset includes all PG&E service point ID’s that are classified as Net Energy Metering and have solar power technology connected to their address. Data such as module make/model, total system size, panel orientation, installation date, and inverter efficiency are included.
Utility Scale Resources: This data is infrequently updated, only when asset specs have changed or a new resource has been contracted with.
Solar Position: Astrological solar position information, which is used to determine or specify solar zenith and azimuth
PG&E Asset Metadata: This data is critical for identifying the location of the DG asset and in turn relating it to corresponding weather. Additionally, grander-scale aggregations of PV output need the mappings to link everything from service point ID up to PG&E Region (through transformers, feeders, substations, distribution planning areas, sub laps, districts, and divisions).
Grid Point Data: Weather forecast data as well as observation data are provided in a gridded format, ranging in resolution from 1km to 40km. Different applications, timescales, and forecast lead times lend to the requirement of data from a variety of weather forecast sources. Variables included in this data include:
o Longitude and latitude o Elevation (meters) o Max GHI from nearest TMY data point

EPIC Final Report | 1-05 Demonstrate New Resource Forecast Methods to Better Predict Variable Resource Output
32
o Inside/outside PG&E territory o AC Capacity (kW) associated with that grid point o Corresponding District (if inside territory) o District weight (AC Capacity point relative to AC Capacity’ of district as a whole)
Solar Irradiance System includes the following key technical attributes:
Processes that transfer data from outside PG&E firewall to PG&E SQL servers inside the firewall. The data files include a Service Area Forecast for 3-km/60-minute resolution data, and a High Resolution Forecast for 1-km/15-minute resolution data.
SQL processes that ingest new/updated data
SQL functions and processes that create, deliver, and archive weather and client-facing data
An internally hosted Web-Page, which includes an API
Processes for creating graphics, which are visible on the internal web
Solar Irradiance Use Cases 4.4.4
EPIC 1.05 provided outputs specific to several use cases (e.g., irradiance for a particular region and time period, generation potential, estimated generation, variability, etc.) for a number of different applications, described below:
EPIC 2.04 DG Monitoring & Voltage Tracking: EPIC 2.04 aims to utilize the voltage measurement capabilities of SmartMeters™ to monitor distributed generation (DG) output and identify voltage fluctuations caused by the intermittent nature of distributed renewable resources. The project will use data analytics techniques and Advanced Metering Infrastructure (AMI) (and other) data to determine the impact of photovoltaic (PV) penetration on Rule-2-violations24 and create a rating for the probability that a Rule 2 violation is caused by DG. For voltage issue investigations, leveraging the algorithm to verify PV as a root cause may potentially reduce the need for field visits. A key component of achieving this objective will be to incorporate the data for distributed PV generation across the PG&E distribution system. As such, EPIC 1.05 is providing historical, real-time and forecasted customer-level solar power output in a time series as an input into the algorithm that will rate the likelihood of a voltage violation (on a given transformer) being caused by DG fluctuations.
EPIC 1.21 Automatic Identification of Distributed Photovoltaic (PV) Resources: EPIC 1.21 aims to validate and integrate a software platform to identify photovoltaic (PV) resources by leveraging SmartMeter™ data. This project focuses on addressing the issue of unauthorized interconnections in an automated fashion by developing an algorithm to identify resources, including integration with the PG&E billing and interconnection database, as well as develop an automated outreach system for identified customers. This will potentially enhance PG&E’s ability to manage the impact on the grid and limit the safety risks associated with otherwise undetected distributed PV installations. EPIC 1.05 provided historical irradiance data as an input to the algorithm to correlate solar irradiance with load as a predictor of the presence of a PV system.
24 http://www.pge.com/tariffs/tm2/pdf/ELEC_RULES_2.pdf

EPIC Final Report | 1-05 Demonstrate New Resource Forecast Methods to Better Predict Variable Resource Output
33
EPIC 1.23 Photovoltaic (PV) Submetering: EPIC 1.23’s primary objectives are to obtain additional unnetted PV data to support customer call center bill experience and to provide additional service to its customers. PV generation data was to be integrated with the existing MyEnergy web portal for the customers’ benefit. EPIC 1.05 provided historical solar irradiance data converted to AC power output. EPIC 1.23 then evaluated the accuracy of this PV generation estimation alongside another algorithm.
EPIC 2.02 Pilot Distributed Energy Resource Management Systems (DERMS): The primary objective of DERMs is to demonstrate new technology to monitor and control DERs to manage system constraints and evaluate the potential value of DER flexibility to the grid. EPIC 1.05 provided solar irradiance data in order for the DERMS project to create Distribution Planning Area PV output profiles (as 0-100% scaling factors) to be used for long-term resource adequacy and load-capacity planning purposes.
Smart Grid Voltage and Reactive Power Optimization Pilot Project (VVO): Through its VVO Pilot project, PG&E is working to determine how it can optimize the operating voltage and reactive power on its distribution system, which will result in reduced customer energy usage and reduced utility system losses for the benefit of its customers. Specifically, this project seeks to (1) enhance grid system monitoring and control, (2) manage grid system voltage and losses, and (3) support increased penetration of distributed renewable resources. EPIC 1.05 provided historical and forecasted customer-level solar irradiance time series data, with a forecast interval of 15 minutes, from 15 minutes ahead through 4 hours ahead. This data is being leveraged in the VVO application to make sure that VVO regulators do not try to overcorrect voltage violations when distribution solar variability is occurring (driven by cloud variability).
Smart Grid Short Term Demand Forecasts Pilot Project (STDF): PG&E procures short-term electricity on behalf of its bundled customer demand in the California Independent System Operator (CAISO) markets. The STDF Pilot goal is to investigate a new demand forecasting methodology using more granular sources of data as inputs to the short term forecast model for PG&E’s bundled customer demand. Within this new approach, PG&E is utilizing local area weather data in the forecast model to capture the impact of micro-climates on load forecasts. Potential benefits of this new approach include increased certainty of load forecast leading to reduced energy and ancillary services procurement costs, increased system reliability by ensuring sufficient resources are matched and available to meet demand, and improved accounting for unaccounted energy and associated costs. EPIC 1.05 provided historical / forecast service-territory-level irradiance time series data for day-ahead load forecasting, as an input into the load model to account for distributed solar generation.
PG&E energy procurement operations: EPIC 1.05 provided forecast resource-level PV output for use as a back-up to CAISO forecasts. The data is also used to help understand the amount of natural gas to procure which is being affected by both utility-side and distributed solar.
5. Project Results and Key Findings
This section summarizes EPIC 1.05’s technical results, key findings, and next steps.

EPIC Final Report | 1-05 Demonstrate New Resource Forecast Methods to Better Predict Variable Resource Output
34
5.1 Storm Damage Models
EPIC 1.05 explored the use of the POMMS data as an input to PG&E’s Storm Outage Prediction Project (SOPP) Model as a way to improve advanced planning and storm responses. The SOPP Model is a collection of tools and techniques developed by the PG&E to aid in forecasting outages. The SOPP model relates the weather forecast to previous weather conditions and previous outage activity to predict future outage activity. One of the key inputs to the SOPP Model is weather forecast data from (NWP). One of the limitations of the pre-POMMS storm predictions was the accuracy and granularity of the numerical weather input data. These data had a horizontal spatial resolution of 12 to 25 km at the surface, and it had to be numerically downsized to estimate more detailed surface conditions. This technology demonstration project has allowed PG&E to implement a more robust solution by using POMMS data, which has a horizontal spatial resolution of 3 km. Integrating POMMS data into the SOPP model has allowed for a more accurate depiction of actual weather conditions at the surface and enables better representation of the hundreds of microclimates in the PG&E Service Area.
Large Storm Prediction Accuracy 5.1.1
PG&E’s storm response has improved steadily in recent years as indicated by lower CAIDI scores during storm events (CAIDI is Customer Average Interruption Duration Index and indicates how fast power is restored on average) in minutes. The improvement is due to many factors, including higher resolution inputs from POMMS. It is difficult to quantify how much of the improvement is attributable to POMMS and how much is attributable to less violent storms or improved system infrastructure. The component that can be quantified and assessed is the accuracy of SOPP Model predictions for the number of expected outages per day at the transformer level and above. The primary metric for forecast error is the Mean Absolute Percentage Error (MAPE), shown in the equation below. MAPE = (Actual Number of Outages – Predicted Number of Outages) / Actual Number of Outages. Figure 5-1 shows graphs of the bi-monthly MAPE for various sized storms from 2012 to 2016. It is apparent that there is a marked decrease in MAPE (y-axis) for large storms since the introduction of POMMS in January 2015. Although the downward trend in MAPE is clear on the chart, it is important to remember that this reduction in forecast error could be attributed to other factors that coincided with the introduction of POMMS, such as improved human interpretation of model outputs based on iterative learning over time. Forecast error also varies widely based on storm size, how PG&E responded, and other conditions, such as the resistance of vegetation to failure, that are constantly changing. For smaller storms, there is no indication from the results of the demonstration of a significant improvement or worsening in SOPP model forecast performance after POMMS was implemented.

EPIC Final Report | 1-05 Demonstrate New Resource Forecast Methods to Better Predict Variable Resource Output
35
Figure 5-1 Storm Forecast Performance (MAPE)
Storm Forecast Operational Efficiency 5.1.2
The addition of POMMS has demonstrated value for PG&E outage forecasting processes. Producing an outage forecast is a labor intensive process that involves utilizing a set of tools to create a forecast. The integration of POMMS has lowered the amount of time required to create a weather event forecast. For instance, forecasting for medium sized (Cat 2) weather events went from approximately 8 hours down to 4-6 hours. The other indication that POMMS is of value comes directly from how the forecasters are incorporating POMMS. POMMS is now a top shelf tool in translating the weather scenario to operations, both in the SOPP model and on storm briefing calls.
Storm Emergency Response Efficiency 5.1.3
Faster Response: Whenever a utility hazard is attended to by a first responder other than PG&E (e.g., police or fire department personnel), PG&E works to relieve that first responder within an hour. Performance in meeting this metric has been tracked over time, and there has been a marked improvement from 35 minutes to 29 minutes over the course of the demonstration timeframe (Figure 5-2).
The key to 911 responses is having the appropriate staffing levels, especially when storm events occur and 911 call volume surges. The higher spatial and temporal resolution outputs from POMMS have facilitated more efficient 911 standby responses because of improved predictions on the timing and geographic focus of likely 911 call locations. User Feedback: According to user feedback, PG&E’s Standby 911 response has shown significant improvement over the past two years, as the response teams leverage 911 standby event forecast information derived from the SOPP Model. The POMMS has provided improved understanding of storm timing and progression to the SOPP Model, which has allowed for improved of staging 911 responders in advance of adverse weather. The pre-storm guidance from the 911 Standby Event Forecast, along with increased mid-storm situational awareness, has provided key contributions to the overall improvement in 911 Standby responses. Detailed weather information is now available during pre-storm briefings and the added details in the POMMS model have provided greater detail and accuracy for these critical deliberations.

EPIC Final Report | 1-05 Demonstrate New Resource Forecast Methods to Better Predict Variable Resource Output
36
Figure 5-2 Average Response Time Metrics
Employee Field Safety 5.1.4
PG&E’s Safety Programs works to inform field staff of adverse weather. Adverse weather poses numerous safety hazards to PG&E personnel in the field (e.g., lightning, floods, high winds excessive heat, etc.). Field personnel receive advanced warning of hazardous conditions and PG&E’s ability to provide these accurate and timely warnings depends on the quality of data feeding into their systems. The higher resolution weather forecasts from POMMS provides more granular information on a spatial and temporal basis, allowing the safety programs to leverage the information to keep field personnel safe. According to user feedback: “Adverse weather poses numerous safety hazards to PG&E personnel in the field, whether it’s lightning, flooding, mudslides, icy roadways, gusty winds, or excessive heat. The POMMS high resolution forecast model provides better granularity in space and time to identify these weather hazards, and the PG&E Safety programs leverages this information to keep field personnel informed.”
5.2 Fire Danger Rating System
Prior to this demonstration project, the underlying data that fed into PG&E’s fire danger rating tool came from Wildland Fire Assessment System. In collaboration with both internal and external stakeholders25, the project team developed an improved fire danger assessment tool that used weather data from POMMS in combination with the same information from the National Fire Danger Rating System as the previous tool. In addition to the use of POMMS weather data, the new fire danger tool also includes National Weather Service red flag warnings. The demonstration Fire Danger Rating System consistently outperformed the previous system, producing a more consistent and verifiable prediction of fire danger. The higher spatial and temporal resolution outputs from POMMS allowed the project team to establish individual fire danger ratings that could be updated hourly, for each of PG&E’s fire zones. This improved accuracy could enable operations to enact better targeted safety and response protocols for fire threats. Figure 5-3 illustrates an example of the new tool’s output compared to the previous tool.
25 Stakeholder included CAL FIRE, USFS, NWS, SDG&E, SJSU Fire Weather Research Lab, and the Wildfire Risk Council.
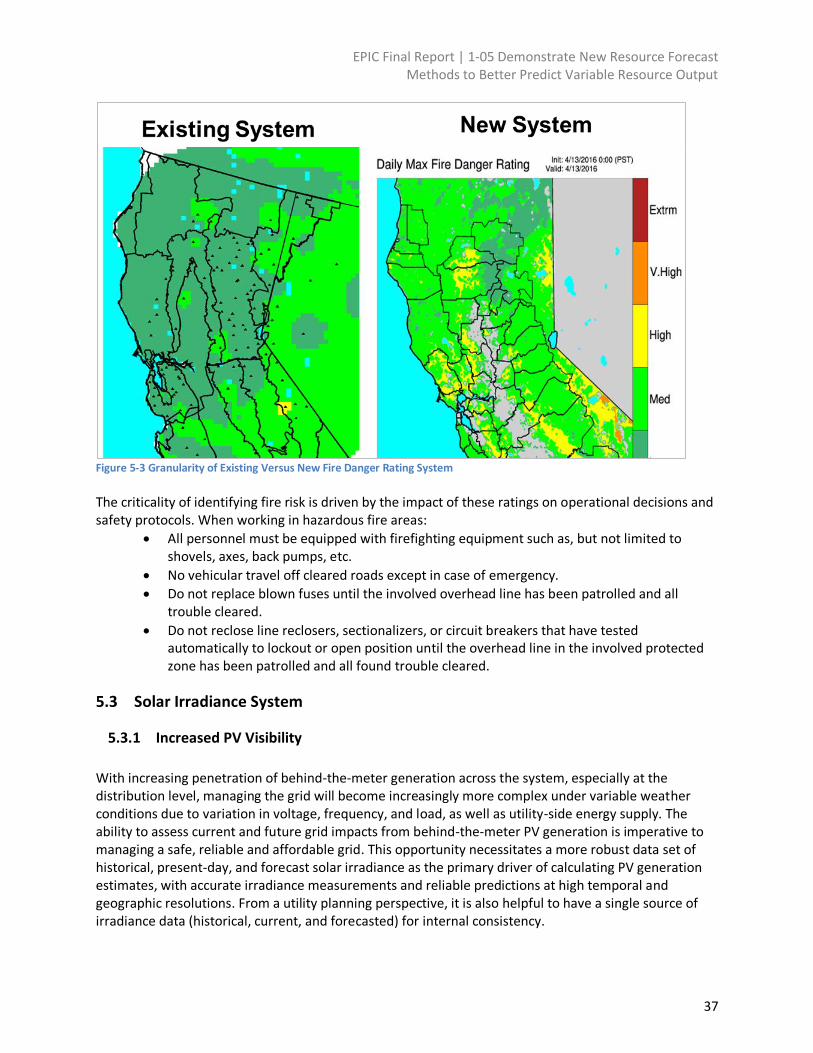
EPIC Final Report | 1-05 Demonstrate New Resource Forecast Methods to Better Predict Variable Resource Output
37
Figure 5-3 Granularity of Existing Versus New Fire Danger Rating System
The criticality of identifying fire risk is driven by the impact of these ratings on operational decisions and safety protocols. When working in hazardous fire areas:
All personnel must be equipped with firefighting equipment such as, but not limited to shovels, axes, back pumps, etc.
No vehicular travel off cleared roads except in case of emergency.
Do not replace blown fuses until the involved overhead line has been patrolled and all trouble cleared.
Do not reclose line reclosers, sectionalizers, or circuit breakers that have tested automatically to lockout or open position until the overhead line in the involved protected zone has been patrolled and all found trouble cleared.
5.3 Solar Irradiance System
Increased PV Visibility 5.3.1
With increasing penetration of behind-the-meter generation across the system, especially at the distribution level, managing the grid will become increasingly more complex under variable weather conditions due to variation in voltage, frequency, and load, as well as utility-side energy supply. The ability to assess current and future grid impacts from behind-the-meter PV generation is imperative to managing a safe, reliable and affordable grid. This opportunity necessitates a more robust data set of historical, present-day, and forecast solar irradiance as the primary driver of calculating PV generation estimates, with accurate irradiance measurements and reliable predictions at high temporal and geographic resolutions. From a utility planning perspective, it is also helpful to have a single source of irradiance data (historical, current, and forecasted) for internal consistency.

EPIC Final Report | 1-05 Demonstrate New Resource Forecast Methods to Better Predict Variable Resource Output
38
The Solar Irradiance System developed and demonstrated in EPIC 1.05 enabled this visibility into high resolution solar irradiance and PV generation data. This granular data was leveraged by multiple use cases for the purposes of understanding PV impacts to enhance management the grid. The data is readily available and can be accessed rapidly. From the web portal, PG&E users can view a number of data outputs, including:
Irradiance (global horizontal irradiance, direct normal irradiance, diffuse horizontal irradiance, and plane of array irradiance);
Irradiance variability;
Solar Potential Index;
Capacity Factor; and
PV power output. The database is structured in a gridded format, with 3 km spatial resolution and 15- and 60-minute temporal resolution, as shown in Figure 5-5. Each grid point is associated with values for solar irradiance and SPI that are available at hourly and 15-minue intervals for the time period spanning from 2014 to the present, as well as forecasted up to a week ahead. The database is routinely updated with new data ingested on an hourly basis.
Figure 5-5 Solar Irradiance System Example Output
The solar irradiance and SPI data provide the foundation for a front-end, internal web portal for data requests, data delivery, and knowledge sharing. On the back end, the portal automatically runs conversion calculations to translate raw irradiance or SPI values into power output, the primary unit of analysis for planning and operations activities regarding distributed generation. The web page allows internal stakeholders to select a variety of attributes (e.g., data type, region, interval, etc.) to generate data specific to a project and delivers the data either as a flat file export or a web page display.

EPIC Final Report | 1-05 Demonstrate New Resource Forecast Methods to Better Predict Variable Resource Output
39
Figure 5-6 shows an example web page display that shows the output for a three day forecast of capacity factor for different districts in PG&E’s service territory.
Figure 5-6 Example Output from Solar Irradiance Web Page
Development and demonstration of this system enabled PG&E to gain and apply numerous insights into the right sets of components and tools needed to combine with solar irradiance data to produce quality power forecasts, including:
Incorporating a Solar Position Algorithm to determine the geometry between the sun and the panels is critical for determining the amount of incoming energy that is absorbed by the panels versus what is reflected. EPIC 1.05 was able to develop an algorithm to determine the necessary components.
“Plane of Array” calculations are contingent on technology type (i.e. whether the panels track with the sun). EPIC 1.05 was able to implement an algorithm that determined the amount of energy in the plane of the array for any technology type.
The project determined a need for an asset to weather data matcher. EPIC 1.05 developed an algorithm that matches a given location to the closest point for which observed/forecast weather data is available.
Once the Solar Irradiance System was in place, the irradiance forecast data was reviewed on a daily basis, with comprehensive evaluations of the credibility and accuracy of incoming model data, as well as the “stability” of the forecast data from one update to the next. Overall, the system was found to be stable and accurate. However, minor deficiencies were noted with the existing weather model system’s ability to handle the progression and dissipation of summertime marine stratus (fog) along the immediate coastline and through the San Francisco Bay Area. Some notable issues were with the timing of fog burn-off, or the complete absence of fog in the pre-dawn forecast issuances which would then be corrected once the sun had risen (revealing fog at the coast in the visible imagery).
Single Source and Scalable 5.3.2
The tool is currently only available ad-hoc to specific groups within PG&E, however the format of the solar irradiance database and its translation to the front-end web portal is flexible and scalable. It provides a single platform to capture and maintain knowledge within PG&E, as well as allows internal stakeholders to leverage a single-source of data that promotes cost efficiency (i.e., each individual group does not have to find a way to procure the same data) and internal consistency (i.e., source data and conversion calculations are all consistent). As an additional advantage, the overall system for ingesting and automatically converting data is source agnostic—the tool can readily pivot to more accurate

EPIC Final Report | 1-05 Demonstrate New Resource Forecast Methods to Better Predict Variable Resource Output
40
forecasts of irradiance if and when they become available, whether internally or from other external sources.
Use Cases and User Feedback 5.3.3
EPIC 1.05 demonstrated that a single-source, comprehensive database of historical, present-day, and forecast solar irradiance data was a critical input to increased visibility and analysis of PV generation. Overall, user feedback was strongly positive. The consolidated system enabled rapid and easy access to this critical data. Users provided feedback that the solar irradiance data and PV generation estimations are a key component to a number of applications, such as enhancing energy procurement processes with better visibility of PV generation impacts. One use case provided additional insight when leveraging the solar irradiance data for estimated PV generation data and forecasting. EPIC 1.23 Photovoltaic (PV) Submetering’s primary objectives were to develop, test, and validate various ways of collecting or estimating solar generation output data and enable a subset of customers to view their estimated solar generation data through integration with the PG&E YourAccount platform, PG&E’s the customer web portal. EPIC 1.05 provided historical solar irradiance data as an input to calculated to power output for this project. EPIC 1.23 then compared the accuracy of this PV generation estimation alongside another algorithm against actual historical PV generation values. According to EPIC 1.23 project results, the PV generation algorithm proved to be robust and accurate, based on the data available for the analysis. The project found slight areas for improvement in a few select weather types, namely a shallow marine layer at the coast or by magnitude/timing issues associated with either monsoonal moisture transport, or frontal passage. With complete data on PV system characteristics, PG&E can generate accurate and reliable generation estimates for fully, non-shaded systems; however, capturing shading data is also required to generate the same level of generation estimates for the remaining PG&E solar population.
5.4 Summary of Key Learnings and Next Steps
The project gathered several key learnings from each of these activities:
Storm Damage Model
Learning – POMMS Integrated with SOPP is Technically Feasible and Provides Value: The project found that outputs from mesoscale meteorological models can be successfully and cost-effectively integrate into a utility-facing system to provide inputs into other weather-based prediction tools and applications. The implementation of POMMS is correlated with an improvement in the accuracy of forecasting for large storms. POMMS has, according to user feedback within PG&E operations, provided improved understanding of storm timing and progression to the SOPP Model, which has allowed for improved staging of 911 responders in advance of adverse weather. The POMMS high resolution forecast model provides better granularity in space and time to identify weather hazards, and PG&E safety programs leverage this information to keep field personnel informed of these adverse conditions. Additionally, the integration of POMMS has lowered the amount of time required to create a weather event forecast, for instance medium weather events went from approximately 8 hours down to 4-6 hours.
EPIC Final Report | 1-05 Demonstrate New Resource Forecast Methods to Better Predict Variable Resource Output
41
Next Step - Transition to Full Production: With EPIC 1.05 demonstrating both technical feasibility as well as operational value, PG&E explored transitioning POMMS to become “fully operational”. As a result, PG&E has now successfully made this transition. In the demonstration, POMMS was running in a development environment with a third party vendor running the model and ingesting the data into weather maps. POMMS is now running the post-processing to produce the POMMS maps in-house, and the system is running in two production environments (for redundancy) and a QA environment. This technology is now leveraged in production by PG&E for weather forecasting, storm outage prediction, 911 response and informing field crews about potential weather-related hazards. Next Step – Leverage POMMS Data for Additional Use Cases: PG&E plans to continue maintaining POMMS, as well as to continue seeking new potential opportunities to incorporate this data into additional use cases. For example, PG&E will consider leveraging the POMMS data through SOPP for EPIC 2.10 Emergency Preparedness Modeling. EPIC 2.10 seeks to develop and demonstrate an integrated solution that uses damage model outputs and real-time restoration constraints to recommend restoration strategies and build resource work plans. The increased weather data granularity from POMMS could potentially lead to more accurate outage and damage predictions at the device or feeder level, which could in turn allow the project to better determine the right crew/troubleman mix.
Learning – POMMS Requires a Large Amount of Computational Capacity: A large amount of computational capacity is required for both running the model to create the raw gridded weather forecast data as well as for post-processing of the raw outputs to produce the POMMS maps of various weather variables and daily files that contain hourly values of 2-m temperature, relative humidity, wind, precipitation and shortwave solar variables on the 3km resolution grid. A high performance computing cluster is required with several multicore processors and large amounts of storage on a 10 gigabit Ethernet network for the creation of the raw gridded data. While less intensive than running the model, an enterprise quality computing environment is required for post-processing as well. Next Step – Move Computing In-House for Cost-Efficiency: Two third parties were leveraged to run processing for the project, one for running the weather forecast data model and another for post-processing to create the weather maps. During the timeframe of the project, PG&E acquired the necessary computing capacity to internally run the post-processing computations. As a result, PG&E recommended moving the producing the POMMS maps and daily files in-house to keep operational costs to a minimum. PG&E has successfully made this transition.
Fire Danger Rating System (FDRS)
Learning – The New FDRS Improves Fire Risk Identification Capabilities: The demonstration Fire Danger Rating System consistently outperformed the previous system, producing a more consistent and verifiable prediction of fire danger. The higher spatial and temporal resolution outputs from POMMS allowed the project team to establish fire danger ratings that could be updated hourly, for each of PG&E’s fire zones (as opposed to lower resolution data updated daily). This improved accuracy could enable operations to enact better targeted safety and response protocols for fire threats.

EPIC Final Report | 1-05 Demonstrate New Resource Forecast Methods to Better Predict Variable Resource Output
42
Next Step – Evaluate Incorporating Hourly Fire Risk Information in Operational Processes: Following the demonstration deployment, the new fire danger awareness system became fully operational and replaced the previous risk assessment tool. Current processes are based on applying daily fire danger maximum values, which can be overly conservative if the actual fire danger is extreme for only a few hours for example PG&E plans to explore the cost and benefit of transforming operational processes to incorporate the hourly fire danger rating information. Using hourly fire ratings would better reflect the variability of weather conditions and allow planning and operations groups to allocate resources more efficiently. Additionally, leveraging this information will potentially enhance reliability. For instance, during extreme fire danger conditions, operators shut off the automatic reclosing functionality. This is a safety protocol to ensure that if a line fails due to fire conditions, the system will not automatically attempt to restore power. Leveraging daily fire danger information, operators are more conservative in keeping this functionality turned off than if updated hourly information was available. Leveraging more up to date information would enhance reliability, as it would limit the amount of time automatic reclosing capability was shut off.
Solar Irradiance Database
Learning – Visibility of Granular Solar Irradiance Data: With increasing penetration of behind-the-meter generation across the system, especially at the distribution level, managing the grid will become increasingly more complex under variable weather conditions due to variation in voltage, frequency, and load, as well as utility-side energy supply. The ability to assess current and future grid impacts from behind-the-meter PV generation requires accurate irradiance measurements and reliable predictions at high temporal and geographic resolutions. This opportunity necessitates a more robust data set of historical, present-day, and forecast solar irradiance as the primary driver of calculating PV generation estimates From a utility planning perspective, it is also helpful to have a single source of irradiance data (historical, current, and forecasted) for internal consistency. The Solar Irradiance System developed and demonstrated in EPIC 1.05 successfully enabled this visibility into high resolution solar irradiance and PV generation data. The results demonstrated that overall the data that was accurate, stable and easy to access, with a few noted areas of improvement such as shading and fog, further detailed below. This granular data was leveraged by multiple use cases for the purposes of understanding PV impacts to enhance management of the grid. Overall, user feedback was strongly positive. The consolidated system enabled rapid and easy access to this critical data. Users provided feedback that the solar irradiance data and PV generation estimations are important components to a number of applications, such as enhancing energy procurement processes with better visibility of PV generation impacts. Next Step – Maintain Database/Portal and Explore Additional Opportunities: PG&E plans to continue maintaining the solar irradiance database and web portal, as well as to continue exploring new potential opportunities to incorporate this data into additional use cases.
Learning – Improvement Needed for Weather Forecasting Model Related to Fog: Once the Solar Irradiance System was in place, the irradiance forecast data was reviewed on a daily basis, with comprehensive evaluations of the credibility and accuracy of incoming model data, as well as the “stability” of the forecast data from one update to the next. Overall, the system was found to be

EPIC Final Report | 1-05 Demonstrate New Resource Forecast Methods to Better Predict Variable Resource Output
43
stable and accurate. However, minor deficiencies were noted with the existing weather model system’s ability to handle the progression and dissipation of summertime marine stratus (fog) along the immediate coastline and through the San Francisco Bay Area. Some notable issues were with the timing of fog burn-off, or the complete absence of fog in the pre-dawn forecast issuances which would then be corrected once the sun had risen (revealing fog at the coast in the visible imagery).
Next Step – Explore Enhancements to Weather Forecasting Model: There have been recently published forecasting technology developments including techniques that may address these specific deficiencies in short-term (next few hours ahead) forecasting. PG&E will consider evaluating these new technologies to potentially integrate into the Solar Irradiance System.
Learning – Improvement Needed for PV Generation Estimates Related to Shaded Systems: PV generation estimates were found to be especially accurate for fully non-shaded systems. However, in order to enhance accuracy for shaded systems, more data is needed with regards to PV characteristics and environmental data (such as projected shading from buildings and trees). Next Step – Explore Options for PV Generation Estimating Technology for Shaded Systems: As new technologies are developed to address this issue, PG&E will consider evaluating those advancing technologies to estimate shading for PV generation data.
6. Data Access
Upon request, PG&E will provide access to data collected that is consistent with the CPUC's data access requirements for EPIC data and results.
7. Technology Transfer Plan
A primary benefit of the EPIC program is the technology and knowledge sharing that occurs both internally within PG&E, and across the other IOUs, the CEC and the industry. In order to facilitate this knowledge sharing, PG&E has and will share the results of this project in industry workshops and through public reports published on the PG&E website. Specifically, below is information sharing forums where the results and lessons learned from this EPIC project were presented: Information Sharing Forums Held
CUFM – California Utility Forecasting Meeting April 29, 2015 at CAISO
2015 Wildland Fire Kickoff Meeting, May 29, 2015, Sacramento Regional Fire/EMS Communications Center – Training Center
Northern and Central CA Joint Fire-Science Meeting, Dec 3, 2015 at PG&E
2016 Wildland Fire Kickoff Meeting, May 4th 2016, California Fire and Rescue Training Authority, Sacramento
Additional Potential Information Sharing Forums In the comings months, PG&E will continue exploring industry outreach in order to share project learnings and discuss future potential opportunities.
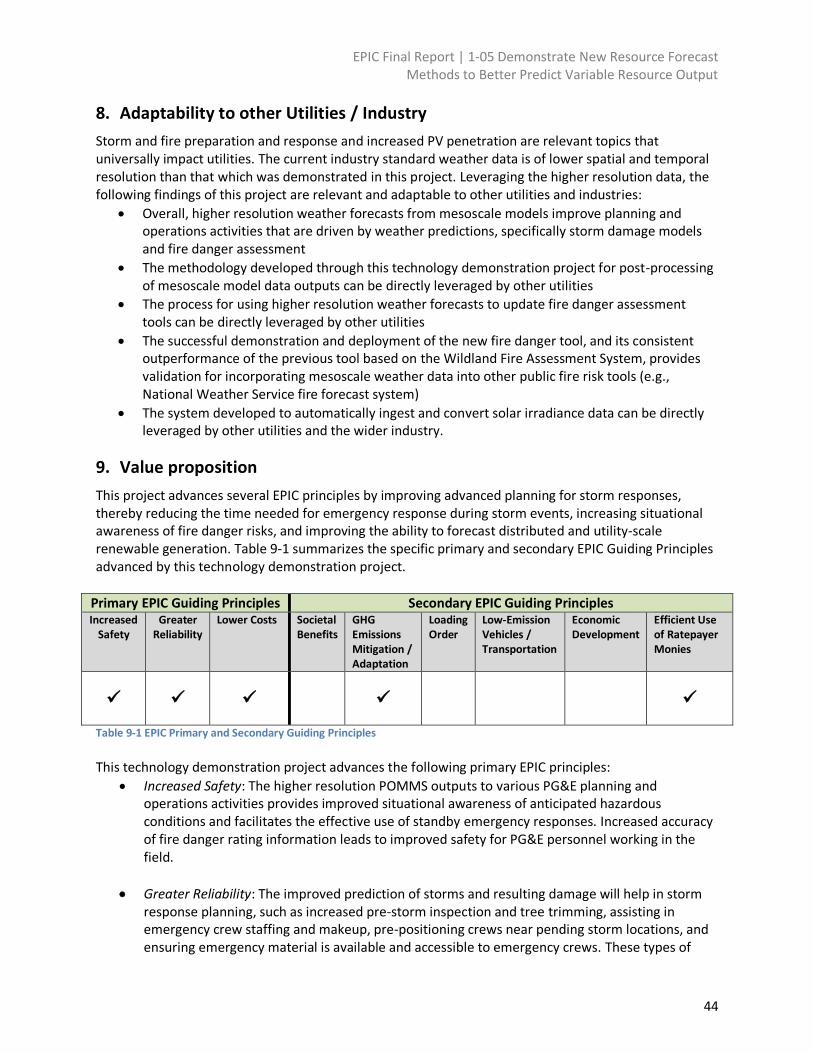
EPIC Final Report | 1-05 Demonstrate New Resource Forecast Methods to Better Predict Variable Resource Output
44
8. Adaptability to other Utilities / Industry
Storm and fire preparation and response and increased PV penetration are relevant topics that universally impact utilities. The current industry standard weather data is of lower spatial and temporal resolution than that which was demonstrated in this project. Leveraging the higher resolution data, the following findings of this project are relevant and adaptable to other utilities and industries:
Overall, higher resolution weather forecasts from mesoscale models improve planning and operations activities that are driven by weather predictions, specifically storm damage models and fire danger assessment
The methodology developed through this technology demonstration project for post-processing of mesoscale model data outputs can be directly leveraged by other utilities
The process for using higher resolution weather forecasts to update fire danger assessment tools can be directly leveraged by other utilities
The successful demonstration and deployment of the new fire danger tool, and its consistent outperformance of the previous tool based on the Wildland Fire Assessment System, provides validation for incorporating mesoscale weather data into other public fire risk tools (e.g., National Weather Service fire forecast system)
The system developed to automatically ingest and convert solar irradiance data can be directly leveraged by other utilities and the wider industry.
9. Value proposition
This project advances several EPIC principles by improving advanced planning for storm responses, thereby reducing the time needed for emergency response during storm events, increasing situational awareness of fire danger risks, and improving the ability to forecast distributed and utility-scale renewable generation. Table 9-1 summarizes the specific primary and secondary EPIC Guiding Principles advanced by this technology demonstration project.
Primary EPIC Guiding Principles Secondary EPIC Guiding Principles Increased
Safety Greater
Reliability Lower Costs Societal
Benefits GHG Emissions Mitigation / Adaptation
Loading Order
Low-Emission Vehicles / Transportation
Economic Development
Efficient Use of Ratepayer Monies
Table 9-1 EPIC Primary and Secondary Guiding Principles
This technology demonstration project advances the following primary EPIC principles:
Increased Safety: The higher resolution POMMS outputs to various PG&E planning and operations activities provides improved situational awareness of anticipated hazardous conditions and facilitates the effective use of standby emergency responses. Increased accuracy of fire danger rating information leads to improved safety for PG&E personnel working in the field.
Greater Reliability: The improved prediction of storms and resulting damage will help in storm response planning, such as increased pre-storm inspection and tree trimming, assisting in emergency crew staffing and makeup, pre-positioning crews near pending storm locations, and ensuring emergency material is available and accessible to emergency crews. These types of

EPIC Final Report | 1-05 Demonstrate New Resource Forecast Methods to Better Predict Variable Resource Output
45
pre-storm activities will reduce the time for storm response, restoration, and repairs, thus improving reliability. Additionally, the improved Fire Danger Rating System will increase fire awareness within the company and allow more focused targeting in time and space of when to shut off automatic reclosing capability. Finally, the availability of irradiance data provided by this technology demonstration project will help PG&E understand the changing base load characteristic resulting from increased PV generation. It will provide planners with more accurate information, which will help improve the distribution planning process and energy procurement.
Lower Costs: The improvement in pre-storm readiness activities will result in faster storm response, restoration and repair, thus resulting in reduced storm repair costs. Additionally, the improved fire danger assessment tool will improve situational awareness of potential risks and allow for more efficient planning and allocation of resources. Finally, improved forecasts of distributed or utility scale PV generation will reduce procurement costs because of reduced load following and regulation reserve requirements.
This technology demonstration project advances the following secondary EPIC principles:
GHG Emissions Mitigation: Improved storm damage predictions driven by the POMMS weather data can lead to more efficient and targeted storm responses, which could subsequently lower the number of repair trucks on the road.
Efficient Use of Ratepayer Monies: A mesoscale meteorological model will provide improved and more granular weather forecasts to be used as inputs into the SOPP Model, and other PG&E planning and operations activities. This will allow for more efficient allocation of resources in Electrical Operations. Additionally, a centralized system for irradiance data within PG&E is more efficient than procuring and developing independent systems for each project requiring this data.
10.Metrics
The following metrics were identified for this project and included in PG&E’s EPIC Annual Report as potential metrics to measure project benefits at full scale. Given the proof of concept nature of this EPIC project, these metrics are forward looking.
D.13-11-025, Attachment 4. List of Proposed Metrics and Potential Areas of Measurement (as applicable to a specific project or investment area in applied research, technology demonstration, and market facilitation)
See Section
3. Economic benefits
a. Maintain / Reduce operations and maintenance costs 5.1, 5.2, 5.3
4. Environmental benefits
a. GHG emissions reductions (MMTCO2e) 5.1
5. Safety, Power Quality, and Reliability (Equipment, Electricity System)
c. Forecast accuracy improvement 5.1, 5.2, 5.3
e. Utility worker safety improvement and hazard exposure reduction 5.1, 5.2, 5.3
EPIC Final Report | 1-05 Demonstrate New Resource Forecast Methods to Better Predict Variable Resource Output
46
11.Conclusion
This project successfully achieved all of its key objectives and, in doing so, has leveraged high resolution weather data to improve several areas, such as storm preparation, efficiently scheduling work crews for fire related events or changing the way the system is operated during time of high fire risk, and assessing current and future grid impacts from behind-the-meter PV generation. Through the work executed in this project and documented in this report, PG&E has gained substantial insight on the technical feasibility and value of implementing a system with high temporal and spatial resolution weather data. Storm and fire preparation and response and increased PV penetration are relevant topics that universally impact utilities. The current industry standard weather data is of lower spatial and temporal resolution than that which was demonstrated in this project. Leveraging the higher resolution data, the findings of this project are relevant and adaptable to other utilities and industries. Due to the achievements of the project, PG&E will continue to maintain the POMMS, Fire Danger Rating System and Solar Irradiance System for storm and fire forecasts, emergency response, and leveraging high resolution solar irradiance data to understand PV impacts. Storm Forecast, Emergency Response and Field Safety POMMS, integrated with SOPP, has improved the accuracy of forecasting for large storms. Additionally, the integration of POMMS has lowered the amount of time required to create a weather event forecast, for medium weather events went from approximately 8 hours down to 4-6 hours. According to user feedback within PG&E operations, the POMMS model has provided improved understanding of storm timing and progression to the SOPP Model, which has allowed for improved staging of 911 responders in advance of adverse weather. Additionally, the POMMS high resolution forecast model provides better granularity in space and time to identify weather hazards, and PG&E safety programs leverage this information to keep field personnel informed of these adverse conditions. As a result, this technology is now fully operational and is leveraged daily by PG&E for weather forecasting, storm outage prediction, 911 response and informing field crews about potential weather-related hazards. Fire Danger Modeling Accuracy and Field Safety The demonstration Fire Danger Rating System consistently outperformed the previous system. The higher spatial and temporal resolution outputs from POMMS allowed the project team to establish individual fire danger ratings that could be updated hourly, for each of PG&E’s fire zones (as opposed to lower resolution data updated daily). This improved accuracy will enable operations to enact targeted safety protocols in response to the fire threat. Following the demonstration deployment, the new fire danger awareness system became fully operational and replaced the previous risk assessment tool. Solar Irradiance System The ability to assess current and future grid impacts from behind-the-meter PV generation requires accurate irradiance measurements and reliable predictions at high temporal and geographic resolutions. From a utility planning perspective, it is also helpful to have a single source of irradiance data (historical, current, and forecasted) for internal consistency. A comprehensive database of historical, present-day, and forecast solar irradiance data was successfully developed and demonstrated in this project. The Solar Irradiance System developed and demonstrated in EPIC 1.05 successfully enabled this visibility into high resolution solar irradiance and PV generation data. The results demonstrated data that was

EPIC Final Report | 1-05 Demonstrate New Resource Forecast Methods to Better Predict Variable Resource Output
47
accurate, stable and easy to access. This granular data was leveraged by multiple use cases for the purposes of understanding PV impacts to enhance management the grid. Future Opportunities and Areas of Improvement The demonstration identified areas of improvement as well as future opportunities for key learnings:
Leverage POMMS for Additional Use Cases: PG&E will consider leveraging the POMMS data through SOPP for additional use cases, including EPIC 2.10 Emergency Preparedness Modeling. EPIC 2.10 seeks to develop and demonstrate an integrated solution that uses damage model outputs and real-time restoration constraints to recommend restoration strategies and build resource work plans. The increased weather data granularity from POMMS could potentially lead to more accurate outage and damage predictions at the device or feeder level, which could in turn allow the project to better determine the right crew/troubleman mix.
Implement Operational Processes Accounting for Hourly Fire Danger Data: While the Fire Danger Rating System is implemented in production, current operational processes are still based on leveraging a daily fire danger maximum value and have not yet been updated to utilize the hourly information available to the operators. PG&E plans to review the actions required to transform these processes. Using hourly fire ratings would better reflect the variability of weather conditions and allow planning and operations groups to allocate resources more efficiently. Additionally, leveraging this information will potentially enhance reliability. For instance, during fire danger conditions, operators may shut off the automatic reclosing functionality. This is a safety protocol to ensure that if a line fails due to fire conditions, the system will not automatically attempt to restore power. Leveraging daily fire danger information, operators are more conservative in keeping this functionality turned off than if updated hourly information was available. Leveraging more up to date information will enhance reliability, as automatic reclosing can restore power more rapidly than field visits.
Review Additional Opportunities for Leveraging Solar Irradiance Data: PG&E plans to continue maintaining the solar irradiance database and web portal, as well as to continue seeking new potential opportunities to incorporate this data into additional use cases. Enhance Forecasting Techniques for Solar Irradiance: Demonstration results indicated that overall the irradiance data is robust and demonstrates the direct correlation between irradiance and PV power output. However, minor deficiencies were noted with the existing weather model system’s ability to handle the progression and dissipation of summertime marine stratus (fog) along the immediate coastline and through the San Francisco Bay Area. There have been recently published forecasting technology developments including techniques that address these specific deficiencies in short-term (next few hours ahead) forecasting. PG&E will consider evaluating new technologies to potentially integrate into the Solar Irradiance System.
Ultimately, EPIC 1.05 demonstrated the technical feasibility and significant value of leveraging robust, high resolution weather and solar irradiance data systems in support of reliability, safety and affordability, with several key learnings that will enable continued enhancement and future opportunities.