Embed Size (px)
Citation preview

Background thematic report no. 5
Progress Report on
Major Health Related Research and Studies
2013 and 2014
Report Prepared for Joint Annual Review (JAR)
February 2015
Government of Nepal (GoN)
Ministry of Health and Population (MoHP)
Ramshah Path, Kathmandu, Nepal

i
CONTENTS
Contents .................................................................................................................................................. i
Acronyms and abbreviations .................................................................................................................. ii
1 Introduction ................................................................................................................................... 1
1.1 Background ........................................................................................................................... 1
1.2 Objectives and Methods ....................................................................................................... 1
1.3 Recent Major Health-Related Studies ................................................................................... 1
1.4 Research Proposals ............................................................................................................... 5
2 Reproductive Health ...................................................................................................................... 6
2.1 Family Planning ..................................................................................................................... 6
2.2 Maternal and Newborn Health ............................................................................................. 8
2.3 The Aama Programme ........................................................................................................ 13
3 Child Health ................................................................................................................................. 16
3.1 Immunization ...................................................................................................................... 16
3.2 Nutrition .............................................................................................................................. 16
4 Epidemiology and Disease Control .............................................................................................. 17
5 Health Infrastructure ................................................................................................................... 23
6 Health Financing .......................................................................................................................... 26
7 Logistics Management and Procurement .................................................................................... 28
8 Human Resources ........................................................................................................................ 31
9 Local Health Governance ............................................................................................................. 34
10 Conclusions .................................................................................................................................. 38

ii
ACRONYMS AND ABBREVIATIONS
24/7 24 hours, seven days a week
AA anaesthesia assistant
ANC antenatal care
ANM auxiliary nurse midwife
ASBA advanced skilled birth assistant
AWPB annual work plan and budget
BCC behaviour change communication
BEONC basic emergency obstetric and neonatal care
BZH Bheri Zonal Hospital
CDMA code division multiple access
CEONC comprehensive emergency obstetric and neonatal care
CI confidence interval
DBP diastolic blood pressure
DDC districtdevelopmentcommittee
DHO districthealthoffice
DoHS Department of Health Services
DPHO District PublicHealthOffice
DTT district technical team
DUDBC Department of Urban Development and Building Construction
FCHV female community health volunteer
FHD Family Health Division
FY fiscal year
GAAP Governance and Accountability Action Plan
GESI gender,equalityand socialinclusion
HFOMC health facility operation and management committee
HIIS Health Infrastructure Information System
HMIS Health Management Information System
HR Human Resources
HRH Human Resourcesfor Health
HTSP healthy timing and spacing of pregnancy
IEC information education and communication
INGO International Non-GovernmentalOrganisation
IUCD intrauterine contraceptive device
IUD intrauterine device
JAR JointAnnual Review
JCM JointConsultative Meeting
JE Japanese encephalitis
JZH Janakpur Zonal Hospital
LARCs long-acting reversible contraceptives
LF Logical Framework
LGCDP Local Governance and Community Development Programme
LHGSP Local Health Governance Strengthening Programme
LLIN long lasting insecticide net
LMD Logistics Management Division
iii
LMIS Logistics Management Information System
M&E monitoring and evaluation
Masl m above sea level
MCHW maternaland child healthworker
MD Management Division
MDGP Doctor of Medicine in General Practice
MIS managementinformation systems
MoF Ministry ofFinance
MoHP Ministry of Health and Population
NCD non-communicable disease
NHRC National Health Research Council
NHSP Nepal Health Sector Programme
NHSSP Nepal Health Sector Support Programme
NMICS Nepal Multiple Indicator Cluster Survey
OC outcome
OP output
OPD outpatient department
PHCC primaryhealth carecentre
PNC post natal care
QI quality improvement
RA rapid assessment
RR relative risk
SBA skilled birth attendant
SBP systolic blood pressure
SHP sub-health post
STS Service Tracking Survey
SZH Seti Zonal Hospital
UNFPA United NationsPopulationFund
UNICEF United Nations Children Fund
USAID United StatesAgencyfor International Development
VDC village development committee
VHW village health worker
WHO World Health Organisation
1
1 INTRODUCTION
1.1 Background
Nepal’s health system has changed dramatically over the last few decades. Changes in the political
system, technological improvements, enhanced access to information and services, increased
urbanisation and connectivity, changes in the development process, the promotion of equity and social
inclusion, and many other changes have shaped a new reality. These and other factors have had a
profound impact on the epidemiological and health seeking behaviour patterns of the population. As a
result, new opportunities and challenges are arising.
Facing this new reality calls for rethinking the concept of the government’s role and of the public policy
in health service provision. It is time for innovation, for building new decision making capabilities, and
for consolidating and ensuring stability and the effective operation of the government’s health policy.
With rising expectations and demand for health services, the government’s responsibility to provide an
efficient and purposeful health system has increased considerably. This responsibility includes
protecting economically and socially vulnerable groups, combating poverty, ensuring universal health
service coverage and social health protection, promoting equity, mobilising financial and human
resources, and protecting vulnerable people against catastrophic payments for treatment.
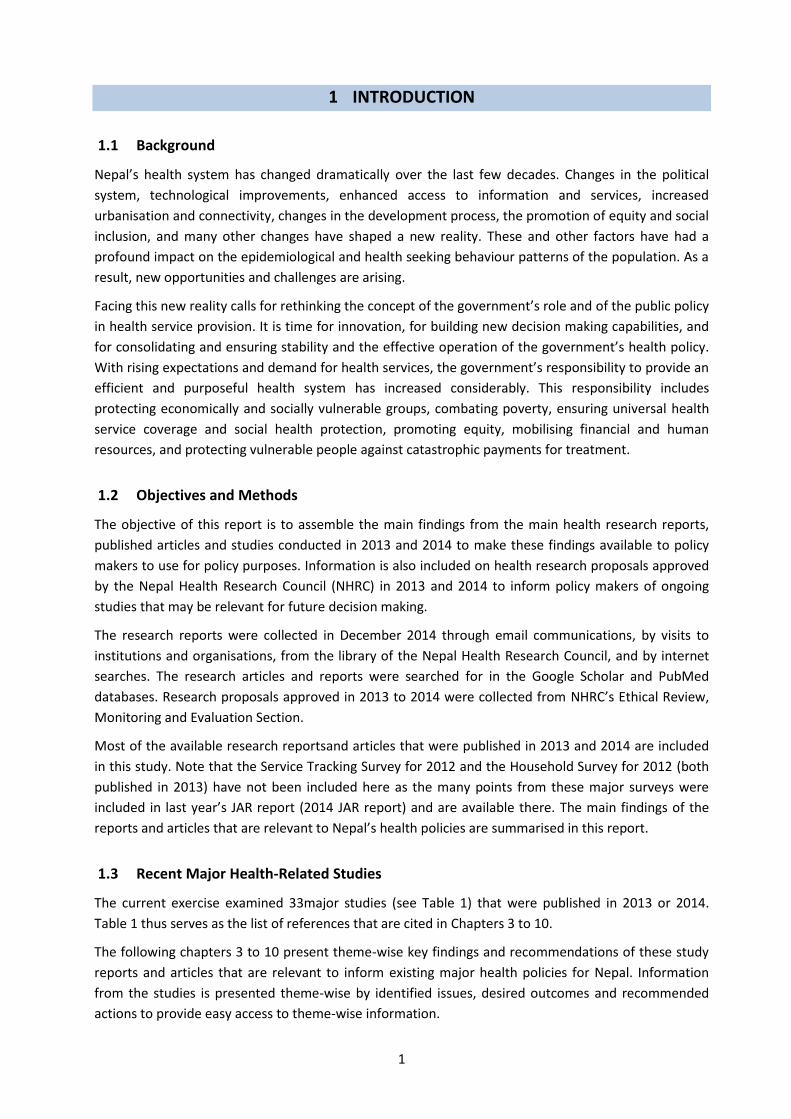
1.2 Objectives and Methods
The objective of this report is to assemble the main findings from the main health research reports,
published articles and studies conducted in 2013 and 2014 to make these findings available to policy
makers to use for policy purposes. Information is also included on health research proposals approved
by the Nepal Health Research Council (NHRC) in 2013 and 2014 to inform policy makers of ongoing
studies that may be relevant for future decision making.
The research reports were collected in December 2014 through email communications, by visits to
institutions and organisations, from the library of the Nepal Health Research Council, and by internet
searches. The research articles and reports were searched for in the Google Scholar and PubMed
databases. Research proposals approved in 2013 to 2014 were collected from NHRC’s Ethical Review,
Monitoring and Evaluation Section.
Most of the available research reportsand articles that were published in 2013 and 2014 are included
in this study. Note that the Service Tracking Survey for 2012 and the Household Survey for 2012 (both
published in 2013) have not been included here as the many points from these major surveys were
included in last year’s JAR report (2014 JAR report) and are available there. The main findings of the
reports and articles that are relevant to Nepal’s health policies are summarised in this report.
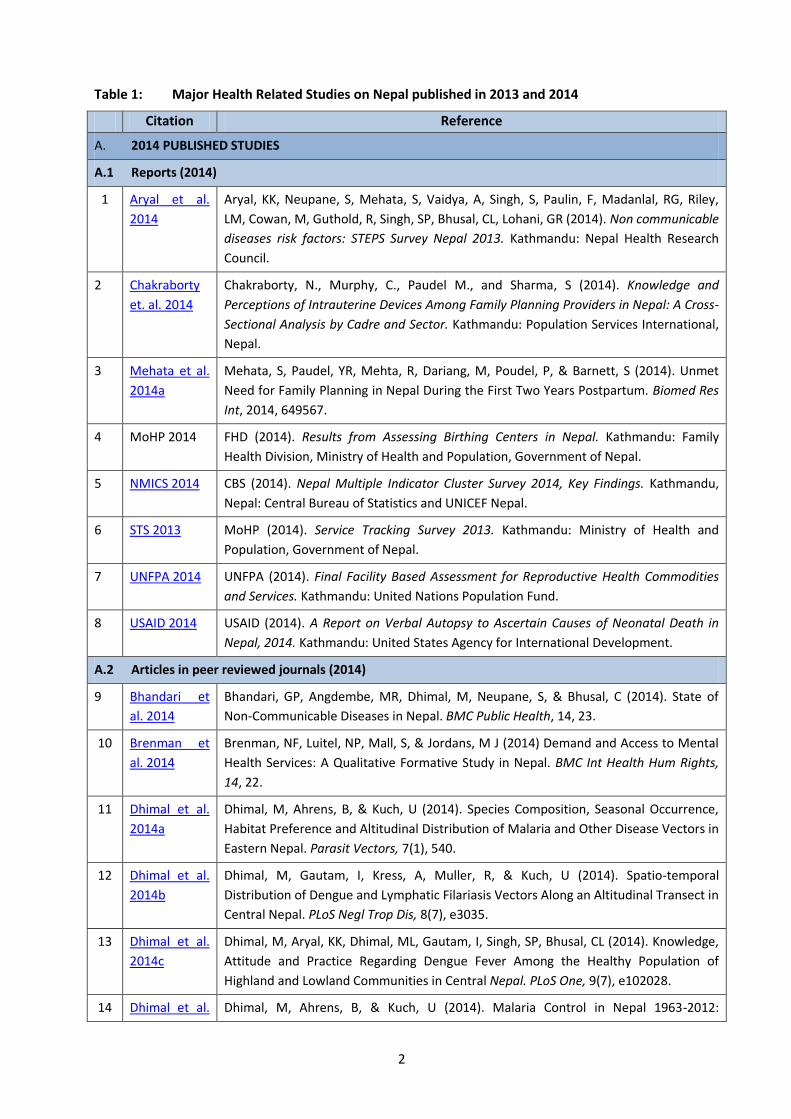
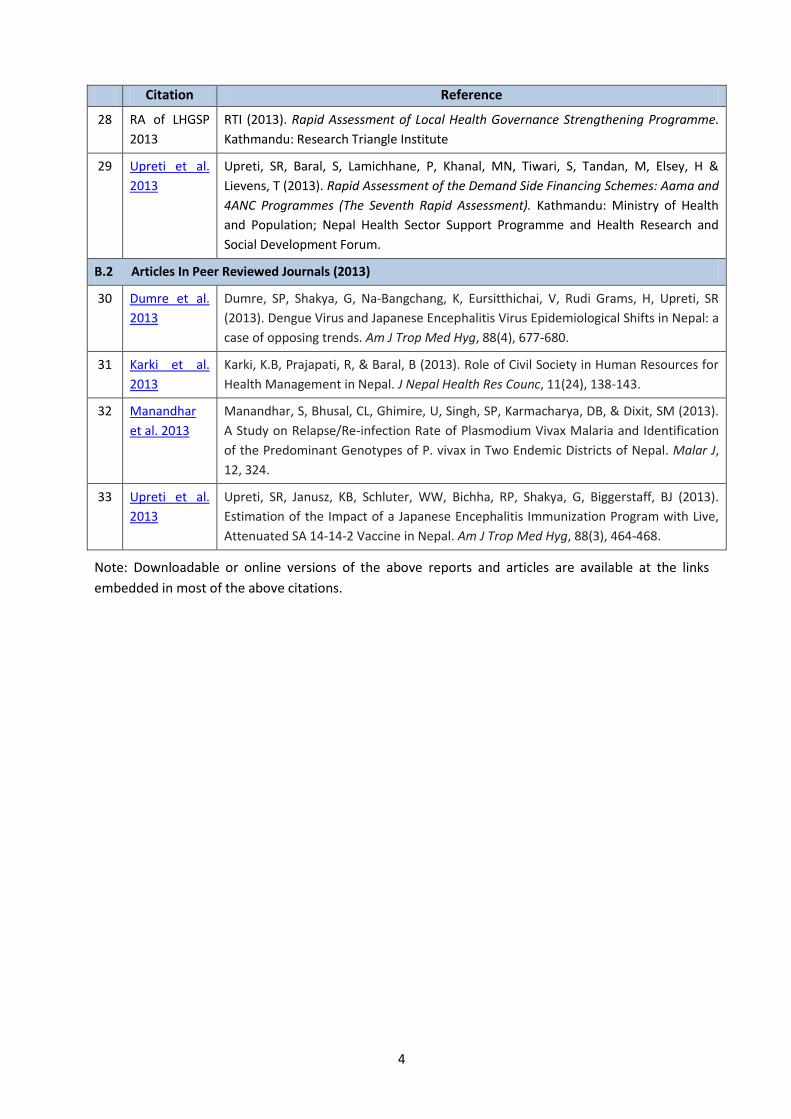
1.3 Recent Major Health-Related Studies
The current exercise examined 33major studies (see Table 1) that were published in 2013 or 2014.
Table 1 thus serves as the list of references that are cited in Chapters 3 to 10.
The following chapters 3 to 10 present theme-wise key findings and recommendations of these study
reports and articles that are relevant to inform existing major health policies for Nepal. Information
from the studies is presented theme-wise by identified issues, desired outcomes and recommended
actions to provide easy access to theme-wise information.
2
Table 1: Major Health Related Studies on Nepal published in 2013 and 2014
Citation Reference
A. 2014 PUBLISHED STUDIES
A.1 Reports (2014)
1 Aryal et al.
2014
Aryal, KK, Neupane, S, Mehata, S, Vaidya, A, Singh, S, Paulin, F, Madanlal, RG, Riley,
LM, Cowan, M, Guthold, R, Singh, SP, Bhusal, CL, Lohani, GR (2014). Non communicable
diseases risk factors: STEPS Survey Nepal 2013. Kathmandu: Nepal Health Research
Council.
2 Chakraborty
et. al. 2014
Chakraborty, N., Murphy, C., Paudel M., and Sharma, S (2014). Knowledge and
Perceptions of Intrauterine Devices Among Family Planning Providers in Nepal: A Cross-
Sectional Analysis by Cadre and Sector. Kathmandu: Population Services International,
Nepal.
3 Mehata et al.
2014a
Mehata, S, Paudel, YR, Mehta, R, Dariang, M, Poudel, P, & Barnett, S (2014). Unmet
Need for Family Planning in Nepal During the First Two Years Postpartum. Biomed Res
Int, 2014, 649567.
4 MoHP 2014 FHD (2014). Results from Assessing Birthing Centers in Nepal. Kathmandu: Family
Health Division, Ministry of Health and Population, Government of Nepal.
5 NMICS 2014 CBS (2014). Nepal Multiple Indicator Cluster Survey 2014, Key Findings. Kathmandu,
Nepal: Central Bureau of Statistics and UNICEF Nepal.
6 STS 2013 MoHP (2014). Service Tracking Survey 2013. Kathmandu: Ministry of Health and
Population, Government of Nepal.
7 UNFPA 2014 UNFPA (2014). Final Facility Based Assessment for Reproductive Health Commodities
and Services. Kathmandu: United Nations Population Fund.
8 USAID 2014 USAID (2014). A Report on Verbal Autopsy to Ascertain Causes of Neonatal Death in
Nepal, 2014. Kathmandu: United States Agency for International Development.
A.2 Articles in peer reviewed journals (2014)
9 Bhandari et
al. 2014
Bhandari, GP, Angdembe, MR, Dhimal, M, Neupane, S, & Bhusal, C (2014). State of
Non-Communicable Diseases in Nepal. BMC Public Health, 14, 23.
10 Brenman et
al. 2014
Brenman, NF, Luitel, NP, Mall, S, & Jordans, M J (2014) Demand and Access to Mental
Health Services: A Qualitative Formative Study in Nepal. BMC Int Health Hum Rights,
14, 22.
11 Dhimal et al.
2014a
Dhimal, M, Ahrens, B, & Kuch, U (2014). Species Composition, Seasonal Occurrence,
Habitat Preference and Altitudinal Distribution of Malaria and Other Disease Vectors in
Eastern Nepal. Parasit Vectors, 7(1), 540.
12 Dhimal et al.
2014b
Dhimal, M, Gautam, I, Kress, A, Muller, R, & Kuch, U (2014). Spatio-temporal
Distribution of Dengue and Lymphatic Filariasis Vectors Along an Altitudinal Transect in
Central Nepal. PLoS Negl Trop Dis, 8(7), e3035.
13 Dhimal et al.
2014c
Dhimal, M, Aryal, KK, Dhimal, ML, Gautam, I, Singh, SP, Bhusal, CL (2014). Knowledge,
Attitude and Practice Regarding Dengue Fever Among the Healthy Population of
Highland and Lowland Communities in Central Nepal. PLoS One, 9(7), e102028.
14 Dhimal et al. Dhimal, M, Ahrens, B, & Kuch, U (2014). Malaria Control in Nepal 1963-2012:

3
Citation Reference
2014d Challenges on the Path Towards Elimination. Malar J, 13, 241.
15 Dhimal et al.
2014e
Dhimal, M, O'Hara, RB, Karki, R, Thakur, GD, Kuch, U, & Ahrens, B (2014). Spatio-
Temporal Distribution of Malaria and its Association with Climatic Factors and Vector-
Control Interventions in Two High-Risk Districts of Nepal. Malar J, 13, 457.
16 Karkee et al.
2014
Karkee, R, Lee, AH, & Khanal, V (2014). Need Factors for Utilisation of Institutional
Delivery Services in Nepal: An Analysis from Nepal Demographic and Health Survey,
2011. BMJ Open, 4(3), e004372.
17 Khanal et al.
2014
Khanal, V, Adhikari, M, Karkee, R, & Gavidia, T (2014). Factors Associated with the
Utilisation of Postnatal Care Services among the Mothers of Nepal: Analysis of Nepal
Demographic and Health Survey 2011. BMC Women’s Health, 14, 19.
18 Mehata et al.
2014b
Mehata, S, Paudel, YR, Dotel, BR, Singh, DR, Poudel, P, & Barnett, S (2014). Inequalities
in the Use of Family Planning in Rural Nepal. Biomed Res Int, 2014, 636439.
19 Onta et al.
2014
Onta, S, Choulagai, B, Shrestha, B, Subedi, N, Bhandari, GP, & Krettek, A (2014).
Perceptions of Users and Providers on Barriers to Utilizing Skilled Birth Care in Mid-
and Far-Western Nepal: A Qualitative Study. Glob Health Action, 7, 24580.
20 Tiwari et al.
2014
Tiwari, R, Ausman, LM, & Agho, KE (2014). Determinants of Stunting and Severe
Stunting Among Under-fives: Evidence from the 2011 Nepal Demographic and Health
Survey. BMC Pediatr, 14, 239.
21 Upreti et al.
2014
Upreti, SR, Gurung, S, Patel, M, Dixit, SM, Krause, LK, Shakya, G, Wannemuehler, K,
Rajbhandari, R, Bohara, R & Schluter, WW (2014). Prevalence of Chronic Hepatitis B
Virus Infection Before and After Implementation of a Hepatitis B Vaccination Program
among Children in Nepal. Vaccine, 32(34), 4304-4309.
B. 2013 PUBLISHED STUDIES
B.1 Reports (2013)
22 Aryal et al.
2013
Aryal, S, Dariang, M & Cullen, R (2013). Improving the Quality of Pre-Discharge
Postnatal Care in Selected Facilities in Banke District. Kathmandu: Ministry of Health
and Population, Government of Nepal.
23 FHD 2013 FHD and NHSSP (2013). Responding to Increased Demand for Institutional Childbirths
at Referral Hospitals in Nepal: Situational Analysis and Emerging Options, 2013.
Kathmandu: Family Health Division and Nepal Health Sector Support Programme.
24 HERD 2013 HERD (2013). Comprehensive District Assessment (CDA) of Health Insurance in Kailali
District 2014. Kathmandu: Health Research and Social Development Forum, Nepal.
25 HR Mapping
2013
MoHP (2013). Mapping the Human Resource Functions across the Ministry of Health
and Population and Other Government Ministries, Departments and Agencies.
Kathmandu: Ministry of Health and Population.
26 HRH Nepal
country
profile 2013
MoHP (2013). Human Resources for Health Nepal Country Profile. Kathmandu:
Ministry of Health and Population and Nepal Health Research Council.
27 Malaria TRac
Study 2013
PSI (2013). TRaC Study Evaluating LLIN Use among General Population and Children
Under 5 years of age in 31 Malaria Risk Districts. Kathmandu: Population Service
International Nepal.
4
Citation Reference
28 RA of LHGSP
2013
RTI (2013). Rapid Assessment of Local Health Governance Strengthening Programme.
Kathmandu: Research Triangle Institute
29 Upreti et al.
2013
Upreti, SR, Baral, S, Lamichhane, P, Khanal, MN, Tiwari, S, Tandan, M, Elsey, H &
Lievens, T (2013). Rapid Assessment of the Demand Side Financing Schemes: Aama and
4ANC Programmes (The Seventh Rapid Assessment). Kathmandu: Ministry of Health
and Population; Nepal Health Sector Support Programme and Health Research and
Social Development Forum.
B.2 Articles In Peer Reviewed Journals (2013)
30 Dumre et al.
2013
Dumre, SP, Shakya, G, Na-Bangchang, K, Eursitthichai, V, Rudi Grams, H, Upreti, SR
(2013). Dengue Virus and Japanese Encephalitis Virus Epidemiological Shifts in Nepal: a
case of opposing trends. Am J Trop Med Hyg, 88(4), 677-680.
31 Karki et al.
2013
Karki, K.B, Prajapati, R, & Baral, B (2013). Role of Civil Society in Human Resources for
Health Management in Nepal. J Nepal Health Res Counc, 11(24), 138-143.
32 Manandhar
et al. 2013
Manandhar, S, Bhusal, CL, Ghimire, U, Singh, SP, Karmacharya, DB, & Dixit, SM (2013).
A Study on Relapse/Re-infection Rate of Plasmodium Vivax Malaria and Identification
of the Predominant Genotypes of P. vivax in Two Endemic Districts of Nepal. Malar J,
12, 324.
33 Upreti et al.
2013
Upreti, SR, Janusz, KB, Schluter, WW, Bichha, RP, Shakya, G, Biggerstaff, BJ (2013).
Estimation of the Impact of a Japanese Encephalitis Immunization Program with Live,
Attenuated SA 14-14-2 Vaccine in Nepal. Am J Trop Med Hyg, 88(3), 464-468.
Note: Downloadable or online versions of the above reports and articles are available at the links
embedded in most of the above citations.

5
1.4 Research Proposals
The 185 research proposals approved by NHRC in 2013-2014 are presented by the national health
research priority areas in Figure 1. The highest number of proposals is on ‘health care delivery systems’
and the least on ‘geriatric health’.
Figure 1: Research proposals approved by NHRC in 2013 and 2014
2616
104
124 3 3 3 1 1 1
15
99
169 11
313
82 4 6
1 1 012
86
0
20
40
60
80
100
120
Proposals approved in 2014 Proposals approved in 2013
6
2 REPRODUCTIVE HEALTH
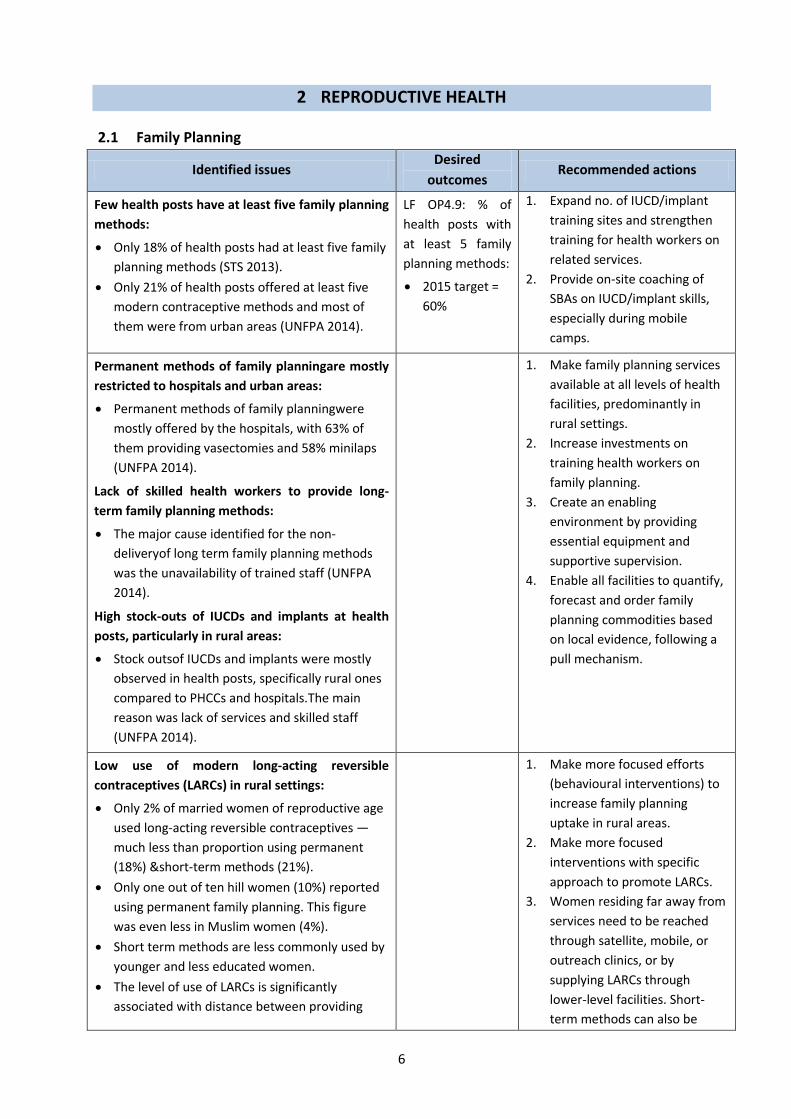
2.1 Family Planning
Identified issues Desired
outcomes Recommended actions
Few health posts have at least five family planning
methods:
Only 18% of health posts had at least five family
planning methods (STS 2013).
Only 21% of health posts offered at least five
modern contraceptive methods and most of
them were from urban areas (UNFPA 2014).
LF OP4.9: % of
health posts with
at least 5 family
planning methods:
2015 target =
60%
1. Expand no. of IUCD/implant
training sites and strengthen
training for health workers on
related services.
2. Provide on-site coaching of
SBAs on IUCD/implant skills,
especially during mobile
camps.
Permanent methods of family planningare mostly
restricted to hospitals and urban areas:
Permanent methods of family planningwere
mostly offered by the hospitals, with 63% of
them providing vasectomies and 58% minilaps
(UNFPA 2014).
Lack of skilled health workers to provide long-
term family planning methods:
The major cause identified for the non-
deliveryof long term family planning methods
was the unavailability of trained staff (UNFPA
2014).
High stock-outs of IUCDs and implants at health
posts, particularly in rural areas:
Stock outsof IUCDs and implants were mostly
observed in health posts, specifically rural ones
compared to PHCCs and hospitals.The main
reason was lack of services and skilled staff
(UNFPA 2014).
1. Make family planning services
available at all levels of health
facilities, predominantly in
rural settings.
2. Increase investments on
training health workers on
family planning.
3. Create an enabling
environment by providing
essential equipment and
supportive supervision.
4. Enable all facilities to quantify,
forecast and order family
planning commodities based
on local evidence, following a
pull mechanism.
Low use of modern long-acting reversible
contraceptives (LARCs) in rural settings:
Only 2% of married women of reproductive age
used long-acting reversible contraceptives —
much less than proportion using permanent
(18%) &short-term methods (21%).
Only one out of ten hill women (10%) reported
using permanent family planning. This figure
was even less in Muslim women (4%).
Short term methods are less commonly used by
younger and less educated women.
The level of use of LARCs is significantly
associated with distance between providing
1. Make more focused efforts
(behavioural interventions) to
increase family planning
uptake in rural areas.
2. Make more focused
interventions with specific
approach to promote LARCs.
3. Women residing far away from
services need to be reached
through satellite, mobile, or
outreach clinics, or by
supplying LARCs through
lower-level facilities. Short-
term methods can also be

7
Identified issues Desired
outcomes Recommended actions
health facility and home (Mehata et al. 2014). promoted through such clinics.
Substantial unmet family planning needs in first
two years postpartum:
Women desiring another pregnancy within 24
months = 4%; but women experiencing a
subsequent pregnancy in less than 24 months
(against WHO recommendation) = 50%.
Unmet need for family planning varied greatly:
highest among 0-5 months postpartum (85%),
lowest among 12-24 months postpartum (56%)
in postpartum women.
The unmet need for pregnancy limiting was
highest among first 24 months postpartum
women, associated with ecological zone. The
highest unmet need for pregnancylimiting was
in mountains and hill areas in comparison to the
Tarai. However, spacing needs were highest in
the Tarai
(Mehata et al. 2014a).
LF Purpose 7:
contraceptive
prevalence rate:
2015 target =
67%
LF OC2.3: % unmet
need for family
planning:
2015 target =
18%
1. Coach SBAs on-site on IUCD
and implant skills, especially at
mobile camps.
2. Further support providers to
manage side-effects, and to
recognize women in times of
high unmet need (such as post-
partum or post-abortion), as
suitable candidates for IUDs.
3. Intensify post-partum family
planning services through the
joint Extended Programme of
Immunization and family
planning services, and scale-up
this approach following
institutional deliveries.
4. Include PNC checklist and post-
partum family planning
(focusing on health timing and
spacing of pregnancy [HTSP])
in SBA training programme.
5. Develop HTSP audio-visual
training materials for trainers
and clients.
6. Improve counselling skills of
health providers to motivate
couples to use family planning
and on post-family planning
acceptance advice.
7. Develop strategies for
informing men about family
planning and reproductive
health issues using male
mobilisers through
partnerships with NGOs.
8. Focus on improving the
availability of LARCs at health
posts.
Half of providers had good knowledge on IUCDs
among providers:
Over 50% of providers were able to name the
four side effects most frequently associated
with IUDs. However, one-third of providers in
Nepal view at least one IUD side effect as
‘unacceptable’.(Chakraborty et al. 2014).

8
2.2 Maternal and Newborn Health
Challenges identified Desired outcomes Recommended actions
Basic emergency obstetric and neonatal care (BEONC)
Few primary health care centres (PHCCs) are
providing all BEONC signal functions 24/7:
In 2013, only 23% of PHCCs were able to
provide all BEONC signal functions 24/7 (STS
2013).
LF OP 4.6:% of
PHCCs providing all
BEONC signal
functions
2015 target =
70%
1. Use regional health reviews
to focus on PHCCs without
birthing centres/BEONC and
BEONC signal functions.
2. Assure trained SBAs and
equipment is available in
PHCCs to provide BEONC
services.
3. Trial the placingof SBAs at
hospital birthing centres (for
a few weeks)for them to gain
skills performing assisted
deliveries and removal of
retained products.
4. Establish hospital-based
mentoring systems for SBAs
working at PHCCs and lower
levels, for skill enhancement.
Of the seven BEONC signal functions, the weakest
areas of provision were:
Assisted deliveries— 77% of PHCCs able to
provide assisted delivery in 2013
Remove retained products — 68% of facilities
able to remove retained products in 2013.
(STS 2013)
Comprehensive emergency obstetric care (CEONC) availability
Access to CEONC care is improving:
Increased access to CEONC from 76% in 2013 to
81% in 2014(FHD records)
LF OP4.5: % districts
having at least one
public facility
providing all CEONC
signal functions
2015 target =
76%
1. Continue to provide CEONC
fund to overcome barriers to
CEONC availability at district
hospitals (for short term
recruitment, buying new
equipment, maintenance &
repair).
2. Introduce multi-year
contracting to improve
continuity of human
resources (HR) and thus
service delivery.
3. Increase production of
CEONC service providers
including advanced skilled
birth assistant (ASBA) and
Diploma in Gyn and Obs, and
anaesthesia assistants.
4. Continue CEONC workshops
and review meetings in
selected district hospitals
where management is
inadequate.
5. Provide clear guidelines and

9
Challenges identified Desired outcomes Recommended actions
ToRs to private sector and do
regular performancereviews
6. Strengthen blood transfusion
services at CEONC sites
Far away from reachingthe target of 80% of health
posts having a birthing centre:
Only 68% of health postshave birthing centres
doing deliveries 24/7 (STS 2013).
2015 target
>80%
1. Where feasible, the better
use of existing birthing
centres.
2. Promote the establishment
of new strategically located
birthing centres.
Substantially underused birthing centres:
Only 12% of births took place at birthing
centres.
Limited awareness in communities about the
range of services that birthing centres offered.
Mothers and their families generally believed
that birthing centres provided poorer quality
services than hospitals, citing limited amenities
and the young, inexperienced nurses, who they
felt were unwilling to take responsibility for
ensuring safe childbirth. A lack of round-the-
clock services availability also limited uptake of
care at birthing centres
(STS 2013)
Unit cost of normal deliveries is low at hospitals
and high at birthing centres:
There was a 12-fold difference between the unit
costs of a normal birth in the sample of birthing
centres studied (FHD 2013).
1. Enhance hospitals’ capacity
to accommodate the
increased number of
childbirths by expanding
maternity wardsand
establishing new birthing
units at hospitals.
2. Work out an investment plan
for new birthing units in
zonal hospitals.
3. Review NHSP-2 Tarai birthing
centres expansion plan to
increase use of centres at
strategic locations, with
centre packages that ensure
24/7 services with 80% SBS
capacity use, & support
&ownership by local
stakeholders & communities.
4. Ensure effective referral
mechanisms including free
transport with links to
referral hospitals for
technical backup.
5. Review level and use of
Aama funds for improving
maternity services at the
facility level.
6. Enhance use of private sector
with appropriate guidelines
and monitoring mechanisms.
7. Establish coordination &
collaboration between public
& private hospitals &
DPHOs&DHOs.
Seriously over stretched maternity wards:
In all studied hospitals, maternity ward bed
occupancy rates in 2011/12 were 80–145%,
indicating that quality of care (QoC) probably
was being compromised.
Reasons for overcrowding were: almost 98% of
users were self-referred (greater client trust in
referral hospitals), the general belief that bigger
hospitals provide better quality and safer
services, round-the-clock opening times,
availability of a wider range of investigation and
treatment services at hospitals, ease of access
via roads and travel networks, and preference
of ambulance drivers to go to referral hospitals
(FHD 2013)

10
Challenges identified Desired outcomes Recommended actions
Dramatic increase in demand for maternity
services in hospitals in past four years:
The largeproportion(88%) of all institutional
births that took place in a hospital. Public
hospitals (65%) were more commonly used than
private hospitals (23%).
The use of hospitals for normal childbirths had
increased by 43% overall in previous 4 years.
(FHD 2013)
Inadequate availability and accessibility of skilled
birth care:
Major barriers to skilled birth care included
inadequate knowledge of the importance of
services offered by SBAs, distance to health
facilities, unavailability of transport services,
and poor availability of SBAs. Other barriers
included poor infrastructure, inadequate
information about services/facilities, cultural
practices and beliefs, and low prioritization of
birth care (Onta et al. 2014).
LF P10: 2013 target
= % of births
conducted by an
SBA
2015 target =
60%
1. Train and recruit locally
available health workers
2. Help community groups to
establish transport
mechanisms, and contribute
to upgrading physical
facilities and services at
health institutions.
Antenatal care (ANC)
Many women not making 4 ANC visits:
Only half (50.1%) of sampled pregnant women
had made four or more antenatal care visits
while 62.9% did notknowany of the four main
defined birth preparation activities (Karkee et
al. 2014).
LF P8: % of pregnant
women attending at
least four ANC visits:
2015 target =
80%
1. Develop communication
approaches to reach women,
men and in-laws to recognise
the benefits of institutional
deliveries, 4ANC visits, PNC
and the dangers of home-
based deliveries.
2. Pilot use of community-
based auxiliary nurse
midwives (ANMs) in
underserved hill and
mountain areas to improve
provision of ANC.
3. Continue and expand use of
antenatal ultrasound in
selected remote districts.
Postnatal care (PNC)
Poor PNC coverage:
Less than half (43.2%) of mothers had attended
postnatal care within first six weeks after birth
— 40.9% attended immediate postnatal care.
Mothers who did farming work, and whose
LF P11: % of women
having three post
natal check-ups as
per the protocol:
2015 target =
1. Increase awareness of and
access to services on PNC
visits through community-
based
programmes,especially for

11
Challenges identified Desired outcomes Recommended actions
partners’main occupation was farming were
less likely to attend immediate postnatal care
Khanal et al. 2014
50% rural, poor, and less
educated mothers.
Substantial barriers remain for PNC coverage:
The main barriers for providing institutional pre-
discharge PNC were language difficulties, lack of
health staff time and low levels of family
support for the PNC education process.
Group education sessions wererelated to
greater recall by clients of pregnancy and
newborn advice, danger sign information and
family planning messages.
The use of checklists strengthened health
worker capacity to provide comprehensive,
systematic health advice and danger sign
information.
(Aryal et al. 2013)
1. Widen the reach of pre-
discharge PNC messages so
they are reinforced in
women’s communities.
2. Identify opportunities for
PNC task-shiftingto reduce
pressure on hospital wards
and reinforce messages in
communities.
3. Promote group PNC
counselling at facilities where
there are sufficient births
and augment with
standardised, quality-assured
IEC materials.
4. Align the branding of PNC
information across the tools
used by health workers,
materials received by women
and other PNC materials
available at community level.
5. Reconsider the on-going
requirement for a checklist
as a tool for health workers
and as a monitoring tool for
delivering PNC.
6. Ensure that pre-discharge
PNC focuses on the first 6 to
24 hours post-partum as
many women are discharged
within 6 hours post-partum.
7. Identify indicators for
monitoring level of PNC
provision including PNC
quality (8 indicators
suggested).

12
Challenges identified Desired outcomes Recommended actions
Newborn health
More neonates die at home, mostly due to
neonatal sepsis, birth asphyxia, and prematurity
related conditions (USAID 2014):
The majority of deaths occurred at home (53%).
The three leading causes of neonatal mortality
were neonatal sepsis (48%), birth asphyxia
(16%) and prematurity-related (13%).
Half of all deaths (including stillbirths) occurred
by day 3.
More neonatal deaths in disadvantaged ethnic
groups:
Four out of ten neonatal deaths (39%) occurred
among disadvantaged Janajatis.
Stillbirth accounted for largest proportion of
neonatal deaths:
Stillbirths accounted for 38% of total neonatal
deaths, of which 73% were fresh still births.
Deaths due to neonatal sepsis were more
common in hills region.
Health problems faced by most neonates:
81% of mothers said that their child had been ill
at least once in its first month of life.
More than 50% of mothers gave a history of
their babies having chest in-drawing, fever or
coughs.
More than half of mothers reported hearing
either stridor, grunting or wheezing and flaring
of nostrils in their babiesat time of illness.
One out of ten babies exhibited developmental
delays (USAID 2014).
66% of mothers were aware about messages of
essential newborn care. Only half had received
the messages through an FCHV (51%)
(USAID 2014)
1. Explorethe causes of
neonatal deaths and plan
appropriate interventions
focusing on neonatal sepsis,
asphyxia and prematurity
related conditions.
2. Improve the quality of
perinatal health care.
3. Establish referral
mechanisms to address
neonatal emergencies.
4. Promote care-seeking
behaviour and strengthen
links between communities
and health facilities in areas
with high neonatal mortality
and low service use.

13
2.3 The Aama Programme
Challenges identified Desired outcome Recommendation
Client Awareness
Awareness and understanding of the Aama
Programme is good but differs significantly
between population groups:
Almost all clients from mountain zones were
aware of the transport incentive (99%), whilst
only 72% of clients from hill zones and 86%
from Tarai zone were aware.
Among clients aware of the transport incentive,
most of the clients in mountain districts were
aware of it prior to their arrival at the health
facility.
(STS 2013)
High awareness
and accurate
knowledge of
both Aama and
4ANC are
maintained across
all population
groups.
1. Make more use of the role
and potential influence of
health workers in
campaigns to raise
awareness of the Aama
Programme and other safe
motherhood incentives.
Inconsistent practices in fund disbursement from
DHOs/DPHOs to health facilities:
The inconsistent practices frequently resulted in
a fund deficit at DHOs/DPHOs and health facility
level (Upreti et al. 2013).
Funds are
disbursed to
facilities in a
timely and
constant way,
thus ensuring
deficits are
avoided.
1. Revise the Aama guidelines
to include detailed
instructions on the fund
flow mechanism to avoid
delays in fund
disbursement.
Women struggle to prove they meet 4ANC and
delivery eligibility criteria (Upreti et al. 2013)
Women are able
to easily access
the 4ANC
programme to
obtain incentives.
1. Review the criteria for
accessing the 4ANC
incentive, taking into
consideration the
practicalities for women at
the time of delivery.
Aama payments are an important and increasing
source of income for public hospitals:
The share of hospitals’ income from Aama
payments increased from 12% in 2008/09 to
22% in 2011/12 (FHD 2013).
Not all facilities are implementing the Aama
Programme:
All sampled district hospitals & PHCCs were
implementing the Aama Programme, but one-
third of sampled health posts (32%) were not
(STS 2013).
The 4ANC programme is poorlyimplemented:
The 4ANC programme is poorly implemented in
all facilities. One of the explanations for this is
the difficulty women face in meeting the criteria
required to obtain the 4ANC programme
All public
hospitals, PHCC
and birthing
centres
implement the
Aama Programme
1. More closely monitor public
health facilities’
implementation of the
Aama Programme.
2. Review the criteria for
accessing the Aama
incentive, taking into
account the practicalities
for women at the time of
delivery.

14
Challenges identified Desired outcome Recommendation
incentives(Upreti et al. 2013)
Women frequently pay for ‘free’ delivery care
under Aama:
38% of women received free care.
58% of maternity clients paid for delivery care
60% of Dalit and Janajati maternity clients paid
for delivery care
(STS 2013)
Women receive
free delivery care
services in public
health facilities
and listed private
facilities
1. Improve monitoring of
public health
facilities’implementation of
the Aama Programme.
Women are frequently denied transport
incentives:
17% of mothers hadn’t receivedtheir transport
incentives (STS 2013).
All eligible clients
receive their full
transport
incentives
Not all women are receiving free care:
Overall, 57% of clients (including at private
facilities) are still paying some costs to health
facilities for their deliveries. The explanations
provided by HFOMCs of what the unit cost is
used to cover and the distribution of the
incentive among staff was not always clear. This
may provide a grey area which may facilitate
fund misappropriation (Upreti et al. 2013).
1. Improve orientations to
HFMOCs on recommended
uses of the Aama unit cost
payments as specified in the
Aama Programme
guidelines.
Incentives frequently given to relatives, not
women clients:
In the Tarai districts the majority of incentives
disbursed were handed to husbands or other
relatives rather than the women clients directly.
(Upreti et al. 2013)
Incentives are
disbursed directly
to women in line
with guidance.
1. Work with health workers
in Tarai districts to explore
culturally appropriate ways
to ensure that Aama
incentives are given directly
to women rather than to
husbands or other relatives.
Lack of orientations on guidelines:
District offices (DHOs and DPHOs) and health
facilities are rarely orientated on the Aama and
4ANC programmes (Upreti et al. 2013).
Orientation on
Aama and 4ANC
programme
provided
regularly to
facility staff
1. Provide orientations on the
Aama guidelines for all
involved in implementing
the Aama Programme.
Explore the feasibility of
using a cascade approach.
Reporting systems show mismatches of
information about Aama fund distribution:
There was a discrepancy of around 10%
between health facility and district office
records on Aama fund distribution.
There was a discrepancy of around 5% between
health facility records and reports from women.
Although the guidelines state that planning and
budgeting for the Aama Programme should be
All reporting
systems provide
matching data
about fund
disbursement.
Clients’ reports
match facilities’
records.
1. Strengthen reporting
systems between health
facilities and DHOs/DPHOs&
regularly monitor with
cross-verification to deter
fundmisuse.
2. FHD should engage DHOs
and DPHOs to develop
locally appropriate and

15
Challenges identified Desired outcome Recommendation
done centrally, it was found that those districts
involved in developing their own plans and
budgets were more likely to manage their
budgets well and have less fund deficits
throughout the year.
(Upreti et al. 2013)
owned plans and budgets
for Aama and 4 ANC progs.
Poor public accountability over distribution of
Aama incentives:
Only 57% in round 7 facilities had publically
displayed Aama beneficiaries (Upreti et al.
2013).
All facilities
publically display
information from
Annex 10 of the
Aama guidelines
on a routine
basis.
1. Routine monitoring and
supervisory visits are
needed to ensure the
routine display of Aama
beneficiaries at facilities.
The engagement of
HFOMCs in this is also
required to ensure that
Annex 10 is displayed.

16
3 CHILD HEALTH
3.1 Immunization
Issues identified Desired outcome Recommended actions
Lack of information related to cold chain system
for effective vaccine management
WHO
recommends an
at least 80%
score in vaccine
supply chain
management
criteria
1. Information related to cold
chain system needs to be
generated
3.2 Nutrition
Issues identified through research Desired outcome Recommended actions
The burden of malnutrition:
The prevalence of stunting and severe
stunting were 26.3% and 10.2% respectively
for children aged 0–23 months, and 40.6% and
15.9% respectively for those aged 0–59
months.
The most consistent significant risk factors for
stunted and severely stunted children, aged
0–23 months and 0–59 months were
household wealth index (poorest households),
perceived size of baby (small babies) and
breastfeeding for more than 12 months.
(Tiwari et al. 2014)
The Nepal Multiple Indicator Cluster Suvey
reports the prevalence of stunting and severe
stunting as 37% and 16%; the prevalence of
wasting and severe wasting as 11% and 3%;
and the prevalence of underweight and severe
underweight as 30% and 9% respectively for
children aged 0–59 months (NMICS 2014).
% of children under
five who are
stunted
2015 target =
28%
1. Community-based
interventions are needed to
target children born to
mothers of low
socioeconomic status.

17
4 EPIDEMIOLOGY AND DISEASE CONTROL
Issues identified Desired outcome Recommended actions
Malaria and mosquito borne diseases
Not everyone in 31 malaria risk districts was
using long lasting insecticide nets (LLINs):
83% under-5 children had slept under a LLIN
the previous night.
78% people had used an LLIN at house the
previous night.
The use of LLINs in high-risk districts was
lower (73%) than in moderate-risk districts
(78%)
(Malaria Trac study 2013)
LF OC3.1: % of
children under 5
years sleeping
under a long lasting
insecticide treated
bed net the
previous night in
high-risk areas:
2015 target =
80%
1. The mass distribution of
LLINs every 3 or more years
in high risk VDCs according to
attrition rate of specific
brands. And if resources
permit, also in moderate risk
areas at a rate of 1 LLIN per
1.6 persons.
Nepal has a high receptivity and vulnerability
to malaria transmission:
Of total malaria cases reported in Nepal in
2013, 30–40% were categorized as imported
cases. 1
Malaria elimination
in Nepal by 2026
1. Fill key staff positions at the
Epidemiology and Disease
Control Division (EDCD),
Vector Borne Disease
Research and Training Centre
(VBDRTC) and in districts.
2. Perform a comprehensive
human resources and
training needs assessment to
finalize a comprehensive
human resources plan with
clear ToRs and appropriate
structures at all levels.
Include post-training follow-
up mechanisms.
3. Develop training packages for
each category of key staff to
be trained.
4. Need mass distribution of
LLINs every 3 or more years
in high risk VDCs according to
attrition rate of specific
brands. And if resources
permit, also do in moderate
risk areas at ratio of 1 LLIN
per 1.6 persons.
Shift of malaria and other diseases vector to
higher altitude (mountains):
The known malaria vectors in Nepal—
Anopheles fluviatilis, A. annularis and
1. Initiate monitoring,
surveillance and research on
vector borne diseases in
previously disease-free,
1 Information received from secondary source — original source not available.
18
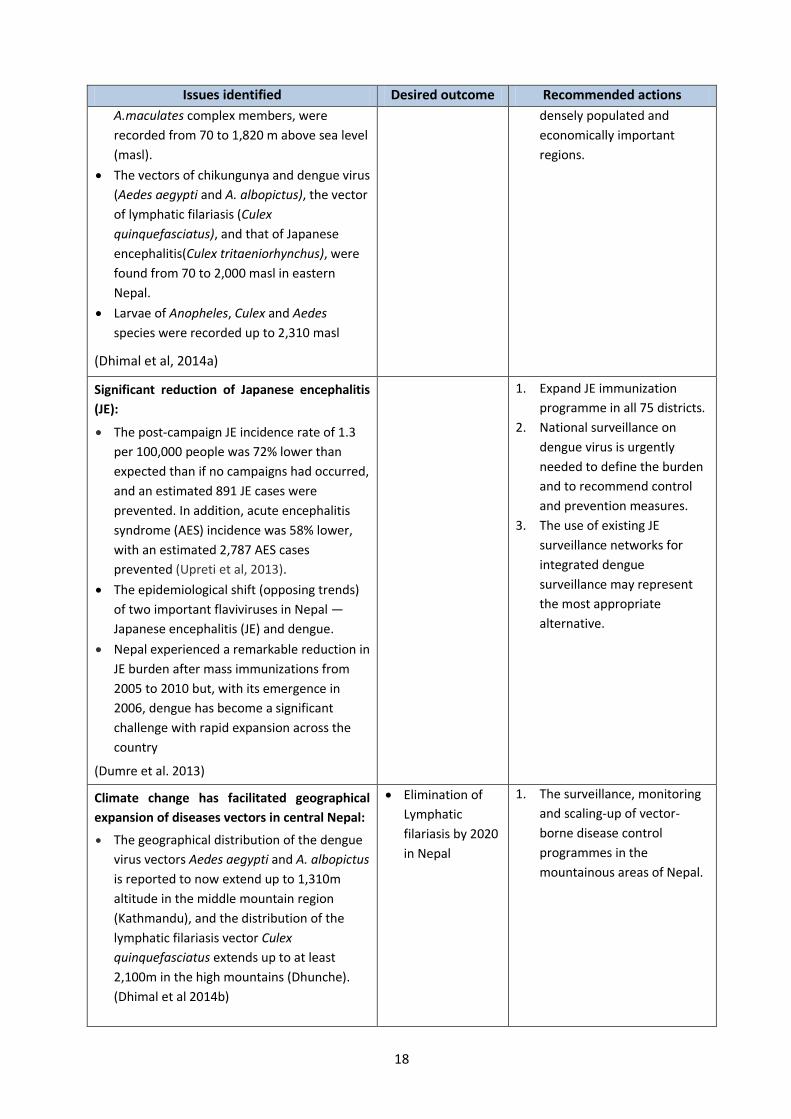
Issues identified Desired outcome Recommended actions
A.maculates complex members, were
recorded from 70 to 1,820 m above sea level
(masl).
The vectors of chikungunya and dengue virus
(Aedes aegypti and A. albopictus), the vector
of lymphatic filariasis (Culex
quinquefasciatus), and that of Japanese
encephalitis(Culex tritaeniorhynchus), were
found from 70 to 2,000 masl in eastern
Nepal.
Larvae of Anopheles, Culex and Aedes
species were recorded up to 2,310 masl
(Dhimal et al, 2014a)
densely populated and
economically important
regions.
Significant reduction of Japanese encephalitis
(JE):
The post-campaign JE incidence rate of 1.3
per 100,000 people was 72% lower than
expected than if no campaigns had occurred,
and an estimated 891 JE cases were
prevented. In addition, acute encephalitis
syndrome (AES) incidence was 58% lower,
with an estimated 2,787 AES cases
prevented (Upreti et al, 2013).
The epidemiological shift (opposing trends)
of two important flaviviruses in Nepal —
Japanese encephalitis (JE) and dengue.
Nepal experienced a remarkable reduction in
JE burden after mass immunizations from
2005 to 2010 but, with its emergence in
2006, dengue has become a significant
challenge with rapid expansion across the
country
(Dumre et al. 2013)
1. Expand JE immunization
programme in all 75 districts.
2. National surveillance on
dengue virus is urgently
needed to define the burden
and to recommend control
and prevention measures.
3. The use of existing JE
surveillance networks for
integrated dengue
surveillance may represent
the most appropriate
alternative.
Climate change has facilitated geographical
expansion of diseases vectors in central Nepal:
The geographical distribution of the dengue
virus vectors Aedes aegypti and A. albopictus
is reported to now extend up to 1,310m
altitude in the middle mountain region
(Kathmandu), and the distribution of the
lymphatic filariasis vector Culex
quinquefasciatus extends up to at least
2,100m in the high mountains (Dhunche).
(Dhimal et al 2014b)
Elimination of
Lymphatic
filariasis by 2020
in Nepal
1. The surveillance, monitoring
and scaling-up of vector-
borne disease control
programmes in the
mountainous areas of Nepal.

19
Issues identified Desired outcome Recommended actions
Low levels of good knowledge on dengue
fever:
Only one out of ten people had good
knowledge of dengue.
Only third of people (37%) had good
practices related to preventing dengue.
Educated people had good practice levels.
(Dhimal et al. 2014c)
1. Start massive awareness
programmeby developing
IEC/BCC programmes on
dengue fever and by using
radio and TV for messaging
on dengue virus (DENV)
vector control and by
orienting more health
professionals, teachers and
community leaders.
2. Include dengue fever
prevention and control in
school and university
curricula to raise awareness
among students, and use
them as multipliers.
Over the last decade, the incidence of
confirmed malaria has declined significantly in
Nepal. (Dhimal et al. 2014d).
The constant incidence of P.falciparum and
clinically suspected malaria:
An analysis of malariometric indicators of 31
malaria-risk districts between 2004 and 2012
showed no significant reduction in incidence
of P. falciparum and clinically suspected
malaria (Dhimal et al, 2014c).
1. Improve access to diagnostic
facilities to confirm clinically
suspected cases and their
treatment.
2. Carry out more operational
research to generate local
evidence on sustainability
and risks of malaria
elimination efforts in Nepal.
3. Strengthen the regional
initiative for Bangladesh,
Bhutan, India and Nepal
(BBIN)to implement cross-
border activities for the
control of vector borne
diseases including malaria.
4. Establish border malaria
check posts and screen all
fever cases there.
5. Protect high risk groups that
are currently not covered by
the indoor residual
spraying/LLIN strategy (e.g.
people affected by natural
disasters, labourers returning
from malaria endemic areas,
forest dwelling populations)
with protection from malaria
vectors.

20
Issues identified Desired outcome Recommended actions
6. Strengthen the current
preventive and control
measures to sustain and
consolidate achievements
made so far, with improved
community involvement
without reducing national
and international support.
Opposing trends of malaria incidence reported
in high-risk malaria districts after introducing
LLINs:
Confirmed malaria incidencereduced from
2.24 per 10,000 in 2007 to 0.31 per 10,000
people in 2011 in Morang district, but
increased from 3.38 to 8.29 per 10,000
people in Kailali district.
Malaria hotspots persisted mostly in the
same villages of Kailali district, whereas in
Morang malaria hotspots shifted to new
villages after introducing LLINs.
A 1°C increase in minimum and mean
temperatures increased malaria incidence by
27% (relative risk [RR] =1.27, 95% confidence
interval [CI] =1.12-1.45)and 25% (RR =1.25,
95% CI =1.11-1.43), respectively. The
reduction in malaria incidence was 25% per
one unit increase of LLIN (RR =0.75, 95% CI
=0.62-0.92).
The incidence of malaria was 82% lower in
Morang than in Kailali (RR =0.18, 95% CI
=0.11-0.33).
(Dhimal et al. 2014e)
Malaria
elimination by
2026 in Nepal
1. LLIN coverage should be
scaled up to entire districts
rather than high-incidence
foci only.
2. Consider climatic factors for
malaria micro-
stratification;prescribe
mosquito repellents for those
who live in forests, forest
fringes and foothills and who
regularly visit forests.
3. Control imported cases by
establishing fever check posts
at border crossings.
High relapse rate of Plasmodium vixax malaria
in Nepal:
A relapse/re-infection rate of 17% (n= 137)
was determined for P. vivax in Kailali and
Kanchanpur districts
Malaria
elimination by
2026 in Nepal
1. Expand such studiesto other
endemic regions of Nepal to
help provide a complete
picture on relapse/re-
infection rates and parasite
genotypic variability to help
control and manage malaria.
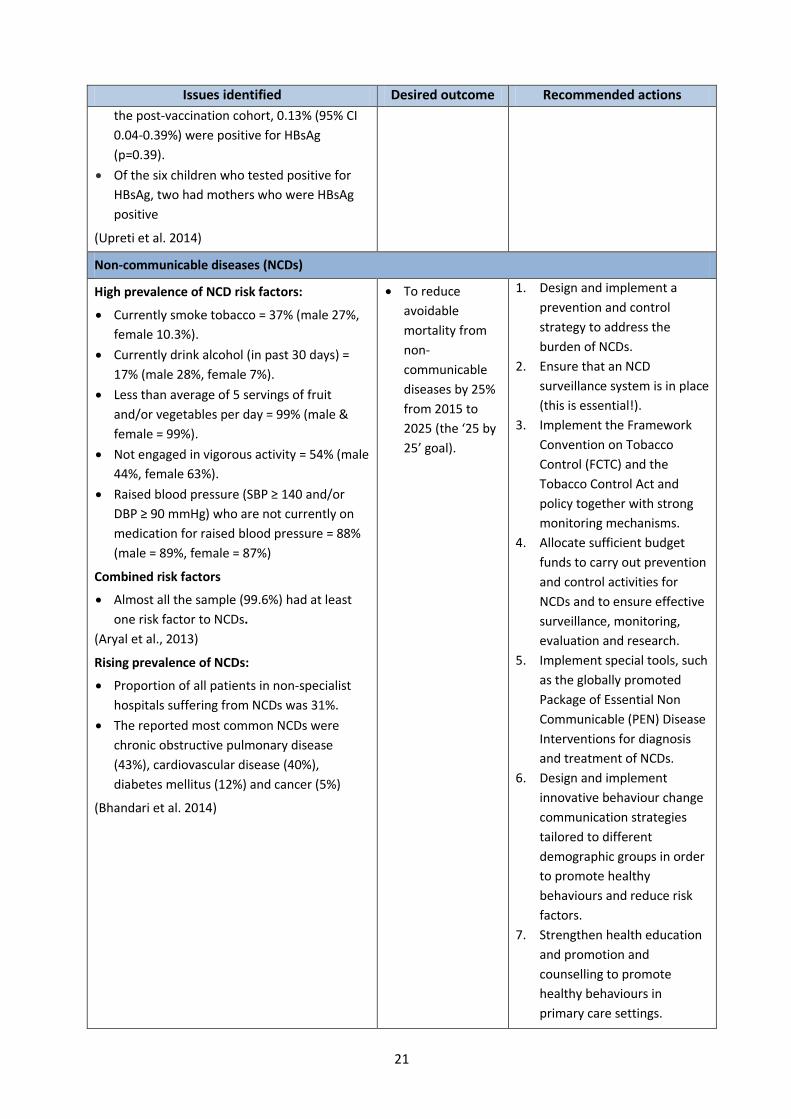
Low burden of chronic HBV infection (hepatitis
B) among children born in both pre- and post-
vaccination cohorts:
Of 1,200 children born in the pre-vaccination
cohort, 0.28% (95% CI 0.09-0.85%) were
positive for HBsAg. Of 2,187 children born in
1. Continue current hepatitis B
vaccination strategies.
21
Issues identified Desired outcome Recommended actions
the post-vaccination cohort, 0.13% (95% CI
0.04-0.39%) were positive for HBsAg
(p=0.39).
Of the six children who tested positive for
HBsAg, two had mothers who were HBsAg
positive
(Upreti et al. 2014)
Non-communicable diseases (NCDs)
High prevalence of NCD risk factors:
Currently smoke tobacco = 37% (male 27%,
female 10.3%).
Currently drink alcohol (in past 30 days) =
17% (male 28%, female 7%).
Less than average of 5 servings of fruit
and/or vegetables per day = 99% (male &
female = 99%).
Not engaged in vigorous activity = 54% (male
44%, female 63%).
Raised blood pressure (SBP ≥ 140 and/or
DBP ≥ 90 mmHg) who are not currently on
medication for raised blood pressure = 88%
(male = 89%, female = 87%)
Combined risk factors
Almost all the sample (99.6%) had at least
one risk factor to NCDs.
(Aryal et al., 2013)
Rising prevalence of NCDs:
Proportion of all patients in non-specialist
hospitals suffering from NCDs was 31%.
The reported most common NCDs were
chronic obstructive pulmonary disease
(43%), cardiovascular disease (40%),
diabetes mellitus (12%) and cancer (5%)
(Bhandari et al. 2014)
To reduce
avoidable
mortality from
non-
communicable
diseases by 25%
from 2015 to
2025 (the ‘25 by
25’ goal).
1. Design and implement a
prevention and control
strategy to address the
burden of NCDs.
2. Ensure that an NCD
surveillance system is in place
(this is essential!).
3. Implement the Framework
Convention on Tobacco
Control (FCTC) and the
Tobacco Control Act and
policy together with strong
monitoring mechanisms.
4. Allocate sufficient budget
funds to carry out prevention
and control activities for
NCDs and to ensure effective
surveillance, monitoring,
evaluation and research.
5. Implement special tools, such
as the globally promoted
Package of Essential Non
Communicable (PEN) Disease
Interventions for diagnosis
and treatment of NCDs.
6. Design and implement
innovative behaviour change
communication strategies
tailored to different
demographic groups in order
to promote healthy
behaviours and reduce risk
factors.
7. Strengthen health education
and promotion and
counselling to promote
healthy behaviours in
primary care settings.

22
Issues identified Desired outcome Recommended actions
There are numerous obstacles for delivering
mental health services:
Pragmatic barriers at the health facility level,
the stigma against mental health problems,
lack of awareness and some cultural norms
reduce access and demand for mental health
services (Brenman et al. 2014).
1. Improve awareness, such as
by channelling education
through trusted and
respected community figures,
and responding to the need
for openness or privacy in
educational programmes.
2. Design and
adaptinterventions to
address and overcome
stigma against seeking
treatment for mental health
problems
23
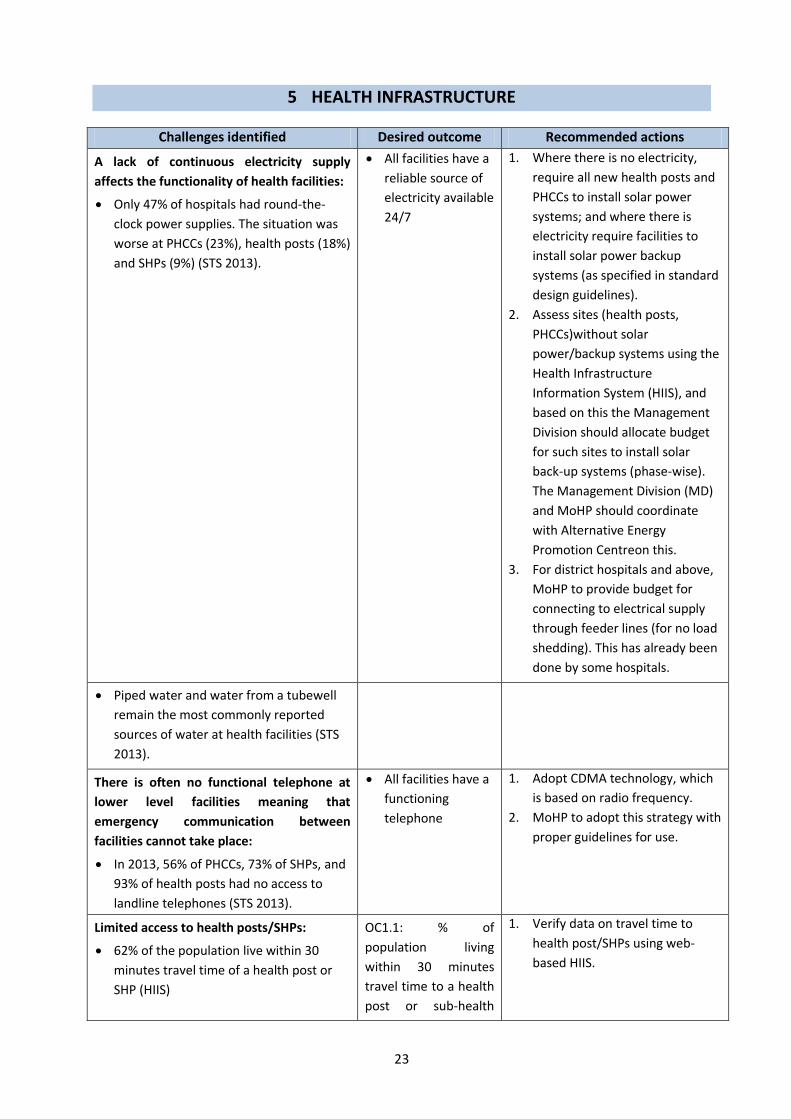
5 HEALTH INFRASTRUCTURE
Challenges identified Desired outcome Recommended actions
A lack of continuous electricity supply
affects the functionality of health facilities:
Only 47% of hospitals had round-the-
clock power supplies. The situation was
worse at PHCCs (23%), health posts (18%)
and SHPs (9%) (STS 2013).
All facilities have a
reliable source of
electricity available
24/7
1. Where there is no electricity,
require all new health posts and
PHCCs to install solar power
systems; and where there is
electricity require facilities to
install solar power backup
systems (as specified in standard
design guidelines).
2. Assess sites (health posts,
PHCCs)without solar
power/backup systems using the
Health Infrastructure
Information System (HIIS), and
based on this the Management
Division should allocate budget
for such sites to install solar
back-up systems (phase-wise).
The Management Division (MD)
and MoHP should coordinate
with Alternative Energy
Promotion Centreon this.
3. For district hospitals and above,
MoHP to provide budget for
connecting to electrical supply
through feeder lines (for no load
shedding). This has already been
done by some hospitals.
Piped water and water from a tubewell
remain the most commonly reported
sources of water at health facilities (STS
2013).
There is often no functional telephone at
lower level facilities meaning that
emergency communication between
facilities cannot take place:
In 2013, 56% of PHCCs, 73% of SHPs, and
93% of health posts had no access to
landline telephones (STS 2013).
All facilities have a
functioning
telephone
1. Adopt CDMA technology, which
is based on radio frequency.
2. MoHP to adopt this strategy with
proper guidelines for use.
Limited access to health posts/SHPs:
62% of the population live within 30
minutes travel time of a health post or
SHP (HIIS)
OC1.1: % of
population living
within 30 minutes
travel time to a health
post or sub-health
1. Verify data on travel time to
health post/SHPs using web-
based HIIS.
24
Challenges identified Desired outcome Recommended actions
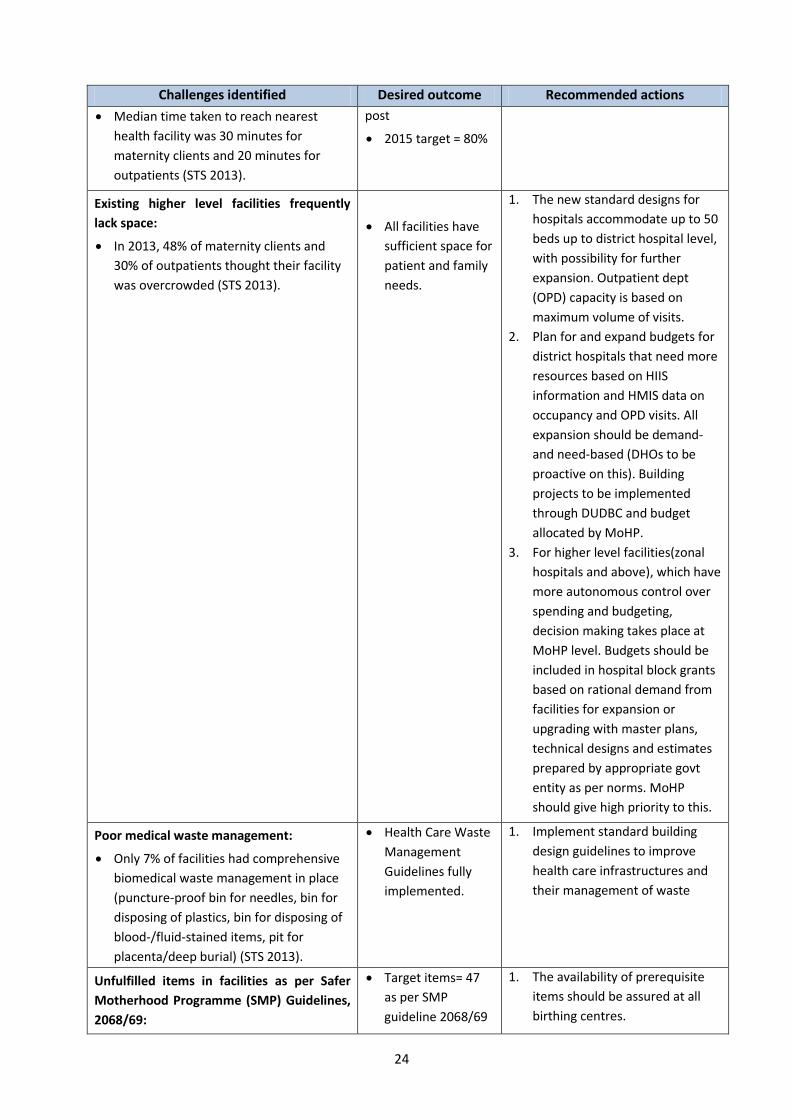
Median time taken to reach nearest
health facility was 30 minutes for
maternity clients and 20 minutes for
outpatients (STS 2013).
post
2015 target = 80%
Existing higher level facilities frequently
lack space:
In 2013, 48% of maternity clients and
30% of outpatients thought their facility
was overcrowded (STS 2013).
All facilities have
sufficient space for
patient and family
needs.
1. The new standard designs for
hospitals accommodate up to 50
beds up to district hospital level,
with possibility for further
expansion. Outpatient dept
(OPD) capacity is based on
maximum volume of visits.
2. Plan for and expand budgets for
district hospitals that need more
resources based on HIIS
information and HMIS data on
occupancy and OPD visits. All
expansion should be demand-
and need-based (DHOs to be
proactive on this). Building
projects to be implemented
through DUDBC and budget
allocated by MoHP.
3. For higher level facilities(zonal
hospitals and above), which have
more autonomous control over
spending and budgeting,
decision making takes place at
MoHP level. Budgets should be
included in hospital block grants
based on rational demand from
facilities for expansion or
upgrading with master plans,
technical designs and estimates
prepared by appropriate govt
entity as per norms. MoHP
should give high priority to this.
Poor medical waste management:
Only 7% of facilities had comprehensive
biomedical waste management in place
(puncture-proof bin for needles, bin for
disposing of plastics, bin for disposing of
blood-/fluid-stained items, pit for
placenta/deep burial) (STS 2013).
Health Care Waste
Management
Guidelines fully
implemented.
1. Implement standard building
design guidelines to improve
health care infrastructures and
their management of waste
Unfulfilled items in facilities as per Safer
Motherhood Programme (SMP) Guidelines,
2068/69:
Target items= 47
as per SMP
guideline 2068/69
1. The availability of prerequisite
items should be assured at all
birthing centres.
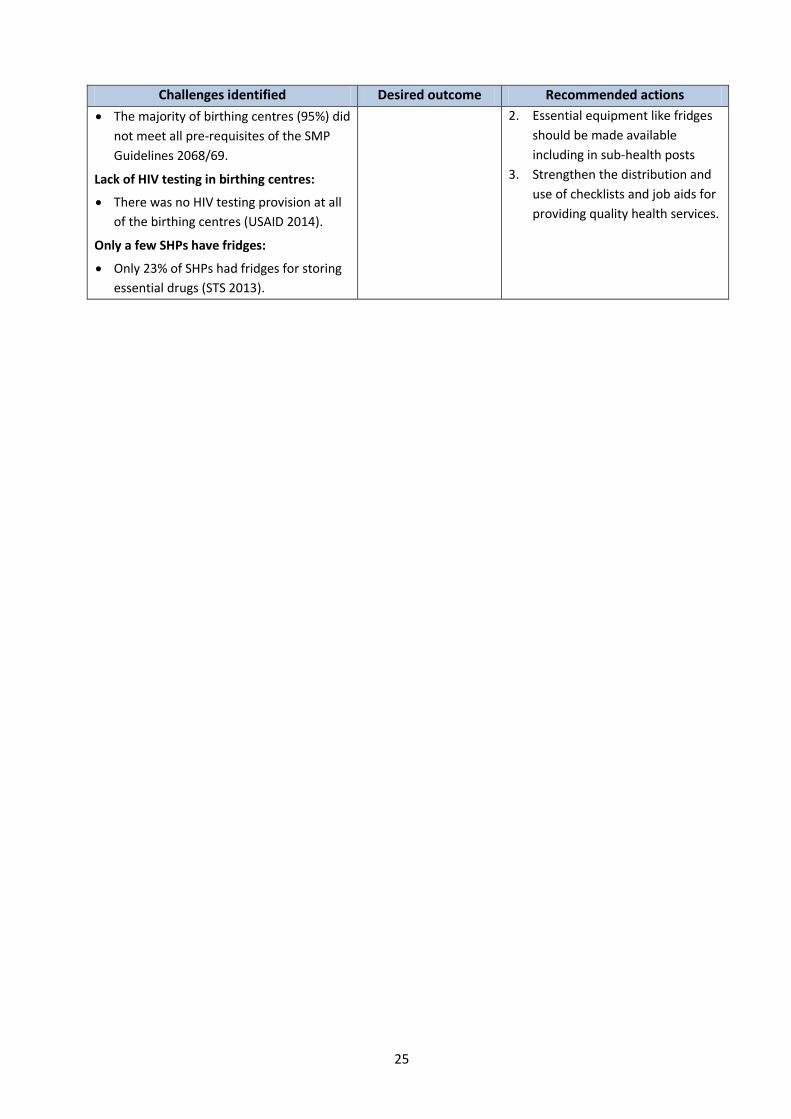
25
Challenges identified Desired outcome Recommended actions
The majority of birthing centres (95%) did
not meet all pre-requisites of the SMP
Guidelines 2068/69.
Lack of HIV testing in birthing centres:
There was no HIV testing provision at all
of the birthing centres (USAID 2014).
Only a few SHPs have fridges:
Only 23% of SHPs had fridges for storing
essential drugs (STS 2013).
2. Essential equipment like fridges
should be made available
including in sub-health posts
3. Strengthen the distribution and
use of checklists and job aids for
providing quality health services.
26
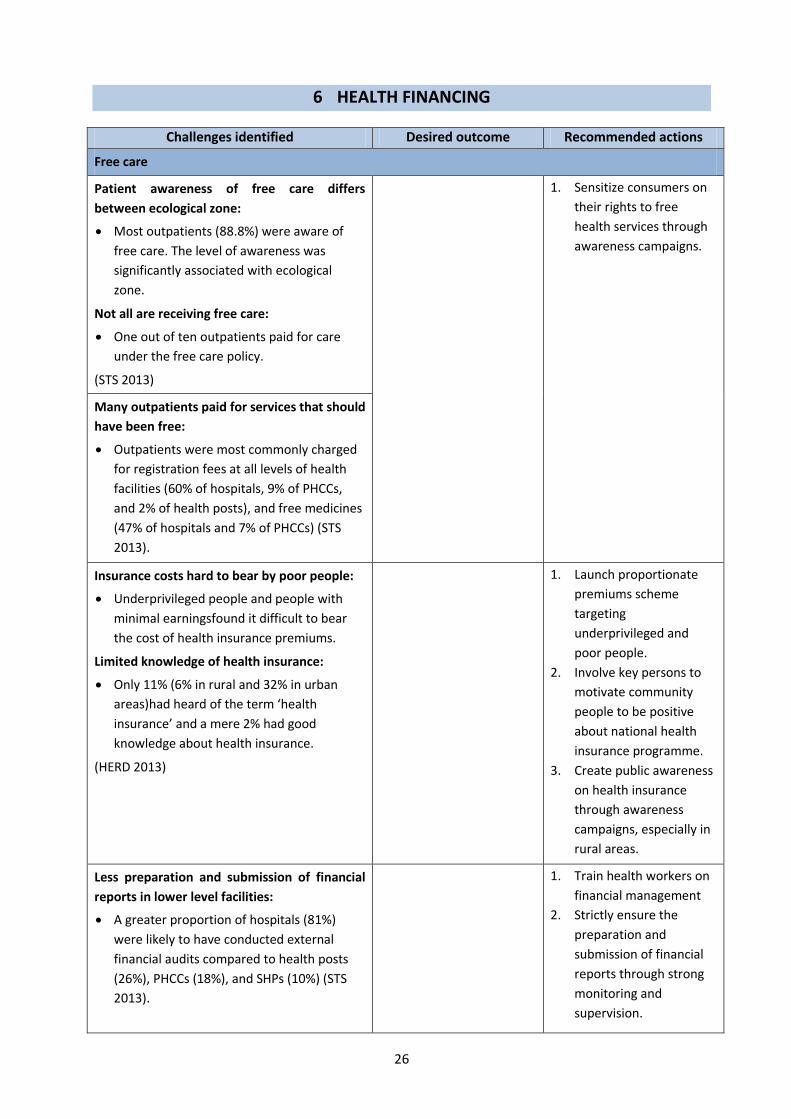
6 HEALTH FINANCING
Challenges identified Desired outcome Recommended actions
Free care
Patient awareness of free care differs
between ecological zone:
Most outpatients (88.8%) were aware of
free care. The level of awareness was
significantly associated with ecological
zone.
Not all are receiving free care:
One out of ten outpatients paid for care
under the free care policy.
(STS 2013)
1. Sensitize consumers on
their rights to free
health services through
awareness campaigns.
Many outpatients paid for services that should
have been free:
Outpatients were most commonly charged
for registration fees at all levels of health
facilities (60% of hospitals, 9% of PHCCs,
and 2% of health posts), and free medicines
(47% of hospitals and 7% of PHCCs) (STS
2013).
Insurance costs hard to bear by poor people:
Underprivileged people and people with
minimal earningsfound it difficult to bear
the cost of health insurance premiums.
Limited knowledge of health insurance:
Only 11% (6% in rural and 32% in urban
areas)had heard of the term ‘health
insurance’ and a mere 2% had good
knowledge about health insurance.
(HERD 2013)
1. Launch proportionate
premiums scheme
targeting
underprivileged and
poor people.
2. Involve key persons to
motivate community
people to be positive
about national health
insurance programme.
3. Create public awareness
on health insurance
through awareness
campaigns, especially in
rural areas.
Less preparation and submission of financial
reports in lower level facilities:
A greater proportion of hospitals (81%)
were likely to have conducted external
financial audits compared to health posts
(26%), PHCCs (18%), and SHPs (10%) (STS
2013).
1. Train health workers on
financial management
2. Strictly ensure the
preparation and
submission of financial
reports through strong
monitoring and
supervision.

27
Challenges identified Desired outcome Recommended actions
Insufficient human resources for financial
management:
Insufficient human resources for financial
management were reported by 38% of
PHCCs, 17% of health posts, 14% of
hospitals, and 5% of SHPs, as the main
reason for not submitting financial reports.
Release of funds
Delays in the release of fiscal year budgets:
60% of hospitals had received budget from
the government once or twice during FY
2069/70; and 33% had requested a budget
four times or more (STS 2013).

28
7 LOGISTICS MANAGEMENT AND PROCUREMENT
Challenges identified Desired outcome Recommended actions
Stock outs of essential drugs:
In 2013 63% of hospitals, 34% of
health posts, 31% of SHPs and
31% of PHCCs experienced no
stock outs of essential drugs (STS
2013).
LF OP7.1: % of public health
facilities with no stock outs of
listed free essential drugs in all
four quarters:
2015 target = 40% of all
facilities experience no stock
out of listed free tracer
essential drugs.
1. Define or revise minimum
stocks of essential drugs.
2. Investigate reasons for
stock outs and which drugs
are most stocked out.
3. Provide staff training on the
timely ordering of drugs.
4. Introduce an alternative
system for obtaining drugs
if certain drugs cannot be
provided from an MoHP
warehouse.
5. Consider introducing text
message or smart phone -
ordering system for key
drugs.
6. Statistically, there should be
agreement between
different health facility
surveys (including LMIS and
STS) on which drugs are
traced and the
methodology used. LMIS
measures once a quarter.
Infrequent reviews of drug supplies:
Annual reviews of drug supplies
are not routinely undertaken in all
facilities. Reviews are less likely in
lower level facilities with just 34%
of SHPs undertaking reviews in
2013 (STS 2013).
Facilities regularly monitor and
proactively manage drug
supplies.
1. Introduce systems and
guidelines on how to
monitor and manage the
drugs supply.
2. Introduce a feedback
system with ad-hoc
inspections from LMD
contract managers and
central warehouse
managers visiting facilities.
Inappropriate drug storage:
In 2013, 63% of facilities were
found not to be storing drugs in
cool and dry places (STS 2013).
Facilities store drugs securely
and in line with
manufacturers’ storage
recommendations(all facilities
should store drugs in cool and
dry places).
1. Improve awareness of the
importance of keeping
drugs in cool and dry places.
Introduce the use of shelves
for storing drugs on.
In 2013, 23% of facilities with
drugs did not store them as per
first expired, first out (FEFO)
principles.
All facilities that store
temperature-sensitive drugs
have constant access to at
least one refrigerator. Where
2. Together with relevant
DoHS divisions and centres,
LMD’s contract
management unit should

29
Challenges identified Desired outcome Recommended actions
In 2013, all the hospitals had at
least one functional refrigerator
while 96% of SHPs, 59% of health
posts and 23% of PHCCs did not
have a functional refrigerator to
maintain the cold-chain.
(STS 2013)
power supply is unreliable, ice-
boxes (and solar power)
should be used.
track which facilities receive
refrigerators, and make a
priority list of where to
supply new refrigerators, as
well as ensure that all
facilities are aware of how
to procure spare parts.
Distributed arefrigerator
maintenance manual to all
facilities.
All facilities use a ‘first in-first
out’ storage system
Less availability of essential
maternal and reproductive health
medicines at lower level facilities:
There was abig discrepancy in the
availability of essential maternal
and reproductive health
medicines (7 essential drugs)
between hospitals (97% had them
in stock) and SHPs (only 14.3%).
Inadequate lifesaving drugs:
Only about 61% of health facilities
had the 7 life-saving drugs. These
were mostly in Western and Far-
Western Regions
(UNFPA 2014)
1. All facilities should be able
to quantify, forecast and
order commodities based
on relevant local evidence
following a pull mechanism.
2. Strengthen supply chain
management, particularly
for below-district level
facilities, and increase the
availability of refrigerators.
Gaps in equipment, especially in
PHCCs:
67% of PHCCs faced problems
related to shortages of equipment
in the last FY — a proportion
greater than in health posts
(47%), SHPs (37%), and hospitals
(36%).
The most common problems
faced were shortages of x-ray
machines in hospitals and aneroid
blood pressure machines (in 35%
of PHCCs, 28% of health posts and
24% of SHPs).
A greater proportion of PHCCs
(41%) faced supplies problems
(drugs and equipment) than
health posts (35%), SHPs (25%)
and hospitals (24%)
(STS 2013)
Facilities have enough
equipment available to
provide quality care.
The use of mobile phones
(SMS/smart phone apps) in the
pull system for ordering and
monitoring.
1.Investigate reasons for
equipment shortages:
Provide training if due to
poor understanding by
storekeepers of ‘minimum
levels’.
If due to lacking possibility to
obtain equipment from LMD
(or other source), LMD (with
NHSSP support) should
investigate reasons for it
happening and find and
implement solutions.
If due to problems in
ordering system (pull/push),
revise system (e.g. improve
LMIS), introducing better
warehouse management
systems, strengthen IT
capacity in facilities and/or

30
Challenges identified Desired outcome Recommended actions
introduce text message
system for ordering (if pull
system is used).
2.Analyse how different modern
technologies (such as text
messaging and barcodes) can
improve present LMIS system,
especially for more precise
ordering (pulling) and the
distant monitoring of inventory
levels.
3. It is also recommended to
assess the supply of medical
equipment supplied from local
markets(often funded by
HFMOCs or local government)
to estimate whether these
resources can be harnessed in a
more strategic way.
Non-functioning equipment found in
most health facilities:
In the last FY, around half of
PHCCs (51%), 44% of health posts,
35% of hospitals, and 29% of SHPs
faced the problem of equipment
not working as a result of
breakages (STS 2013).
Sub-standard equipment is not
received into the system. Put a
preventive management
system for acceptance in place
and follow procedures.
Equipment is checked
regularly and faulty equipment
is repaired or replaced.
Budget is available to cover
equipment repair and
maintenance costs.
1. Investigate reasons for
broken equipment.
2. Establish earmarked
budgets managed by district
health authorities for
regular repair and
maintenance of medical
equipment. Include in
AWPBs according to GAAP
requirement.
3. Update the Equipment
ManagementImplementatio
n Guidelines (no date) to:
o refer to preventive
maintenance manual,
and repair and
maintenance budgets;
and
o include advice on use of
preventive maintenance
and of technicians for
repair and maintenance.

31
8 HUMAN RESOURCES
Challenges identified Desired outcome Recommended action
A low (and reducing) proportion of
sanctioned doctor posts are filled across
the health system:
In 2013, only 23% of sanctioned doctor
posts were filled at PHCCs.
In 2013, only 47% of sanctioned doctor
posts were filled at district hospitals.
(STS 2013)
LF OP3.1.1: % of
sanctioned posts filled –
doctors at PHCCs
2015 target = 90%
OP3.1.2: % of
sanctioned posts filled –
doctors at district
hospitals
2015 target = 90%
A low (and reducing) proportion of
sanctioned nurse posts are filled across
health system:
In 2013, 39% of sanctioned nurse posts
were filled at PHCCs.
In 2013, 55% of sanctioned nurses’ posts
were filled at district hospitals
(STS 2013)
OP3.1.3: % of
sanctioned posts that
are filled – nurses at
PHCCs
2015 target = 90%
OP3.1.4: % of
sanctioned posts that
are filled – nurses at
district hospitals
2015 target = 90%
Very poor performance on district
hospitals having adequate staff to provide
CEONC services:
In 2013, no district hospital had at least
1 MDGP or obstetrician/gynaecologist; 5
nurses and 1 anaesthetist or
anaesthetist assistants (AAs) (= NHSP-2
target) (STS 2013).
LF OP3.3: % of district
hospitals that have at
least 1 MDGP or
obstetrician/
gynaecologist; 5 nurses
(SBA), and 1
anaesthetist or
anaesthetist assistant:
2015 target = 80%
1. Encourage medical colleges to
place resident postgraduates in
district CEONC hospitals.
2. Develop and implement a plan to
increase number of trainee ASBAs
and AAs as part of wider HRH
planning.
3. Continue to use the Diploma in
Gynaecology and Obstetrics
(DGO) training programme to
increase number of trained
obs/gyn staff as a short term
measure.
4. Create MDGP/obs-gyn/AA posts
at the district level

32
Challenges identified Desired outcome Recommended action
Too few sanctioned posts filled:
Less than three-quarters (72%) of
sanctioned positions in higher-level
hospitals were filled (STS 2013).
Sanctioned post
numbers reflect
staffing needs in
health facilities.
5. Continue to use CEONC funds as
transitional strategy until
recommended staffing is available
through government-sanctioned
posting.
6. Clarity on guidance for using
multi-year contracts to enable
effective recruitment and
retention.
All SBAs trained:
All nurses/ANMs (57%) have received
SBA training (MoHP 2014)
LF OP3.3: Number of
production and
deployment of SBAs
2015 target = 7,000
1. Provide SBA training to all
nurses/ANMs assigned to provide
labour and delivery (L&D) services
to birthing centre clients.
Poor gender and ethnic mix of health
providers:
The sex of health providers is closely
related to the type of staff position, with
women most likely to occupy nursing
positions and MCHW roles, and men
more likely to be doctors, medical
officers, health assistants, AHWs and
VHWs.
Across every level of health facility, the
majority of senior positions were held
by staff from the Brahmin and Chhetri
caste groups. There was very low
representation of Dalits and Muslims
across all health facilities.
(STS 2013)
1. Fully implement the ‘Guidelines
for GESI Mainstreaming in the
Health Sector’ (2013)
Human resources management and
development constraints:
The overlapping functions for human
resources information, postings and
transfers and the management of
personnel training.
Gaps in terms of the lack of separate
entities, i) for the overall coordination of
HR activities, ii) to oversee HR
development and iii) to
overseeemployee relations.
Bottlenecks: i) long multi-step processes
for carrying out activities such as
forming new posts, and ii) required
involvement of multiple entities within
and outside MoHP for approving and
1. Improve coordination — As
interim step, explore mechanisms
for improving coordination across
govt entities that carry out HRH
functions and between HRH
departments and departments as
thenew health strategy is
developed and implemented.
2. Improve organisational structure
— In the short term, reduce the
turnover of senior HRH resource
leaders. In the longer term,
identify a more suitable structure
for managing all HRH functions in
a more coordinated way, noting
best practices of other countries.

33
Challenges identified Desired outcome Recommended action
implementing changes.
The critical shortage of human resource
professionals within MoHP and DoHS,
with no professional staff with specific
human resource qualifications.
Rapid staff turnover — especially critical
for leadership roles
(HR Mapping 2013)
Absorbing qualified health workers:
There is sufficient production of the
main health professionals, with high
futuresupply very likely. There is a need
to ensure that there are effective
strategies in place, such as those
contained in the HRH Strategic Plan, to
absorb qualified health workers that are
produced and available for work into
the public and private health
sectors(HRH Nepal country profile
2013).
1. In the short term, develop ways
of building capacity of human
resources leaders. In the longer
term MoHP should consider
creating posts for professional
human resource leaders who
remain within MoHP.
Role of civil society in human resource
management:
The roles of civil society in HRH
management need to be recognized
and documented to ensure their
active participation in formulating
and implementing policies, strategies
and planning related to HRH for
effective and quality healthcare
services in Nepal (Karki et al. 2013).

34
9 LOCAL HEALTH GOVERNANCE
Challenges identified Desired outcomes Recommended actions
Local Health Governance
National level:
The continuation of centralised annual
work planning and budgeting.
The absence of a defined institutional
home within MoHP for the local
governance of health services.
The current grant provision for
comprehensive health care is grossly
insufficient, with delayed fund flows.
Synergy with other community
development initiatives under MoFALD, i.e.
LGCDP and other community based
programmes (on- and off-budget), is
insufficient.
Sub-optimal coordination (inter-sectoral
and intra-ministerial), in particular MoHP–
MoFALD.
(RA of LHGSP 2013)
District level:
Revisit composition of district technical
teams (DTTs) to ensure participation of
community reps at district level.
Urgently need to clearly define the division
of labour between DPHOs/DHOs and
district development committees
District health planning and approval is
being inadequately implemented and
resource management and financial
governance mechanism needs improving.
(RA of LHGSP 2013)
Health facility level:
Local planning process needs further
standardisation.
Single year contracting is an issue in local
hiring of human resources.
Although HFOMCshave been somewhat
strengthened; they lack full capacity to
operate, lead and manage policy, and deal
with overall health service delivery
functions and health facility management.
Improved health
governance
1. Expand the Local Health
Governance Strengthening
Programme (LHGSP) to cover all
VDCs in pilot districts.
2. Align the profile analysis,
planning, programming and
budgeting process with DDCs’
and VDCs’ standard planning
processes.
3. Promote transparency and
formal checks and balances.
4. Increase grants and expand
DTTs.
5. Clarify roles and responsibilities
of key stakeholders.
6. Revisit LHGSP’s institutional
setup, especially its
management functions.
7. Strengthen M&E and local
accountabilitychecking by
HFOMCs.
8. Enable and promote research on
health local governance.

35
Challenges identified Desired outcomes Recommended actions
Great need to integrate planning process
at local level with greater participation of
community people.
The several sub-sector and programme
specific committees at local levelare not
linked: i.e. health, agriculture, education,
water supplyand forestry.
The reporting mechanism and financial
management capacity of HFOMCsis weak.
Translating issues from social audits and
community hearings into action is weak
due to weak local capacity, inactive local
bodies and resource gaps.
No authority is delegated to HFOMCs for
local hiring to fill vacant positions.
(RA of LHGSP 2013)
2013 targets for social auditing have been
met;(with higher level facilities performing
less well):
15% of health facilities that undertook
social audits as per MoHP guidelines in the
last fiscal year.
11% of facilities conducted a social audit in
the last fiscal year, made findings public
and incorporated recommended actions in
AWPB.
31% of facilities with a HFOMCs/ hospital
development committee (HDC) meeting on
a monthly basis.
70% of facilities had at least 3 females and
at least 2 Dalit and Janajati members in
their HFOMC/HDC.
(STS 2013)
% health facilities
undertaking social
audits as per MoHP
guidelines:
2015 target
=25%
% of facilities with at
least 3 females and
at least 2 Dalit and
Janajati members
on HFOMC/HDC:
2015 target
=100%
Representation of females and Janajati and Dalits
Met 2013 target:
72% of health facilities had at least three
females and at least two Dalit and Janajati
members on HFOMCs and hospital
development committee (HDCs) (STS 2013)
OP 1.3: % of
HFOMCS with at
least 3 female
members and at
least 2 Janajati and
Dalit members.
2015 target =
100%

36
Challenges identified Desired outcomes Recommended actions
Quality of Services
Satisfied clients:
Most (85%) of maternity clients and
outpatients (90%) were satisfied with the
services they received at health facilities.
The top five recommendations made by
maternity clients to improve the health
facility in which they had delivered were:
o maintain clean and hygienic health
facilities (35%);
o provide adequate number of beds
(23%);
o free services (13%);
o havemore helpful staff (13%); and
o encourage good behaviour among
health workers (13%).
The top five recommendations made by
outpatients to improve the health facility
that they had attended were:
o maintain cleanliness and hygienic
health facilities (19%);
o increase the availability of competent
and skilled health workers (18%);
o maintain privacy more (9%);
o increase the number of female service
providers (9%); and
o reduce waiting times (7%)
(STS 2013).
% of clients satisfied
with health care at
public health facility
Target by
2015=80%
Supervisory visits:
PHCCs (95%) and health posts (92%) were
more likely to have received a supervisory
visit in the last year than hospitals (65%)
and SHPs (79%)
(STS 2013)
Many positions lay vacant:
Many vacant posts including all senior
posts (medical superintendents [MSs],
matrons, and nursing supervisors) across
all six referral hospitals.
Only 45% of gynaecologist/obstetrician
positions were filled.
60% of anaesthetist positions were vacant,
and three hospitals (SZH, BZH, JZH), were
managing without anaesthetists.
1. Ensure the availability of
appropriately skilled human
resources as per sanctioned
positions at hospitals
2. Revise the human resources
strategy (sanctioned positions)
as per the current population
structures andservice use
pattern for ensuring quality
services.

37
Challenges identified Desired outcomes Recommended actions
Hospital development committees (HDC)
had hired health workers locally to address
staff shortages; but a gap of 277 SBAs and
28 obstetricians and doctors remained in
these referral hospitals
(FHD 2013)
3. Develop guidelineson hiring
required human resources
including fair salaries and
benefits at local level.
4. Enhance the capacity of hospital
development committees
(HDCs)on hospital management
including their role and
responsibility for ensuring
quality services
5. Run experience sharing visits for
HDC members to learn from
better performing hospitals
Quality improvement committees common
on hospitals:
More hospitals had quality improvement
committees (41%) and QI plans (35%) than
lower level-health facilities (STS 2013).

38
10 CONCLUSIONS
Credible measures of the effects of health policy are powerful instruments for focusing the attention of
policy makers on improving and promoting equity in health services. Evidence produced using rigorous
methodology and systematic research is very useful for measuring, describing, monitoring, evaluating
and analysing the implementation of health policies.
In Nepal, the various components of essential health care services,including reproductive, maternal
and child health services, have sufficient evidence to enable clear and systematic planning and action
to improve the health indicators. However, other areas, including nutrition, mental health, oral health,
non-communicable diseases, and other areas need more research to generate necessary information.