Embed Size (px)
Citation preview

Deep Mining 2012 — Y. Potvin (ed) © 2012 Australian Centre for Geomechanics, Perth, ISBN 978-0-9806154-8-7
Deep Mining 2012, Perth, Australia 71
Progress with empirical performance charting for
confident selection of ground support in seismic
conditions
P.A. Mikula Mikula Geotechnics Pty Ltd, Australia
Abstract
The methods available for estimating dynamic-capable ground support requirements need to contend with the extreme variability of the mining environment in dynamic conditions, and uncertainties in knowledge of seismic-related data. The site geotechnical engineer, with the task of selecting a ground support scheme, is searching for a sufficient engineering result in the face of this variability and uncertainty.
While knowledge has progressed rapidly in the field, it is not yet possible to have full confidence in mechanistic selection methods because they depend on various assumptions, and do not cater for variability and uncertainty in operational mining. The empirical chart approach by contrast bypasses many assumptions and accommodates the variability, so it can stand as an operational tool.
The empirical approach in this paper is based on underground observations of seismic damage and the performance of ground support at three Australian mines. It defines working relationships between peak particle velocity due to seismicity, the load and energy dissipation capacities of ground support, and the damage occurring in excavations.
The charts facilitate selection of the required ground support load and energy dissipation capacities for a defined dynamic environment. A key advantage of the empirical approach is that it is calibrated to the peculiarities of the specific mine site.
The charts have also given insight into criteria that indicate whether a support scheme is adequately resistant against failure of weak links.
1 Introduction
This paper documents progress on a site-specific empirical charting approach to dynamic ground support selection. A chart was developed several years ago to assist the mining of the ROB5 orebody at Mt Charlotte Mine (Mikula and Lee, 2007), followed by charts for Argo Mine and the Long-Victor Complex, with each revision expanding the knowledge base.
The dynamic ground support selection task is complex. It must contend with many factors related to the complexities of seismic event mechanisms, the varying susceptibility of excavations to damage, the different damage mechanisms, the complex behaviour of ground support schemes, and the imprecise nature of much of the available data.
The objective of the site geotechnical engineer in dynamic support selection is clear, namely in this context of extreme variability and imprecision, to obtain a sufficient engineering specification for at least the following aspects of support and reinforcement:
an energy dissipation demand component
a load demand component
a displacement or elongation demand component.
https://papers.acg.uwa.edu.au/p/1201_05_mikula/

Progress with empirical performance charting for confident selection of ground support P.A. Mikula in seismic conditions
72 Deep Mining 2012, Perth, Australia
Any ground support design or selection tool carries confidence only to the extent that it accounts for, or accommodates, all the variability and uncertainty impacting on the selection. A brief recall of the sources of variability suggests that it would be difficult for mechanistic analysis methods to provide sufficient confidence. However, an empirical approach, despite its inherent simplifications, has the potential to meet the engineering requirement. An empirical approach is attractive as it bypasses some of the assumptions of some other methods, and addresses more of the variability. As a bonus, this approach also provides useful insight into failure of weak links and how they may be avoided.
The aim of this paper is to present the context and application of an empirical chart concept, and demonstrate that it is well within the capability of a mine site to collect the required data and construct an empirical model of their site. This paper reports on work in progress at Long-Victor Mine. There is no guarantee that the findings are generic across mine sites – this is yet to be verified by independent application to numerous other mine datasets.
The paper addresses the following:
the design problem
review of three foundational concepts: peak particle velocity (PPV), damage rating scales, and scheme dynamic capabilities
analysis approaches: mechanistic, numerical and empirical
description and application of the empirical chart method.
In this paper the term ‘scheme’ rather than ‘system’ is uniquely used to designate an installed collection of multiple ground support and reinforcement elements intended to work together. The term ‘screen’ is used to designate any surface support type, including mesh and fibrecrete.
2 The design problem
Given the current state of published knowledge, three broad approaches to the design problem can be considered for use on operational mine sites known to the author. Undoubtedly, other methods are being researched, and variations or combinations, proprietary and public, are in use. The approaches are:
a mechanistic approach – define equations that mimic the expected behaviour mechanism
a numerical approach – construct sufficiently detailed simulation models
an empirical approach – collect site data and interpret behaviour.
The fundamental methodology in the above approaches has these components:
Define expected seismic event locations and source parameters. It is necessary to have some idea of the nature and character of the expected dynamic disturbance sources. This often is based on interpretation of historical data collected by a seismic monitoring system, but should also take into account the potential occurrence of rogue, i.e. outside of known history expectations, fault slip events on major structures.
Define a ground motion relationship for the mine. It is necessary to have a way of defining how a dynamic disturbance will propagate around the mine, and how the vibrations will affect openings. Usually this is done by relating PPV, distance, and event magnitude. PPV is widely used as an input parameter for seismic calculations. However, it is possible that PPV may not be the best parameter to use, or even a suitable parameter, or that other input parameters should also be included. PPV is used in the empirical charts here for lack of a better alternative. A discussion of PPV follows later.
Define damage criteria. This is a statement of what level of dynamic vibrational disturbance will cause the worst-case extent of damage to rock and ground support. This sounds simple but is not,

Ground support
Deep Mining 2012, Perth, Australia 73
because the support scheme interacts with the rock to influence both scheme damage and rock mass damage.
Define a specification to guide selection of a scheme that would ‘survive the dynamic occurrence.’ This is a major topic involving consideration of risks related to:
○ Technical survival – the concept that no scheme component will fail.
○ Operator survival – the concept that no operator will be affected by an occurrence.
○ Financial survival – the concept of no loss of equipment nor loss of access.
This paper considers only the technical survival aspect. However, in practice, mine management must be aware of all risk types and stakeholder requirements, define risk targets to the geotechnical engineers, and collect sufficient data to show that those risk targets are being met. The mine manager may require a higher support requirement to be confident it would meet all risk scenarios.
3 PPV concepts and definitions
3.1 Near and far-field
If the event source is distant, the PPV is regarded as the far-field PPV. The far-field incoming PPV can be estimated by empirical calculation (e.g. formulae in Kaiser et al., 1995; Heal, 2007).
If the event source is so close to a damaged excavation, within say twice the source radius of the source that the damage approximately coincides with the event, then the near-field PPV applies. For near-field, a zone not well understood, the practice has been to select a PPV value corresponding to the far-field value computed at the source radius distance from the source, with a cap of 3 m/s.
Conservative practice suggests that near-field PPV would be used unless there is confidence that far-field PPV applies. For larger events, source radii can be very large so the excavation and damage can often be within the near-field.
3.2 Incoming PPV
The incoming PPV (or source or incident PPV) is defined in this paper as that radiated from an event. The incoming PPV relates to the situation at a point within solid media without defects – it is not the PPV that actually arrives at a free surface of an excavation.
The actual pattern of PPV is very complex (Daehnke et al., 1996). The incoming PPV is not accurately known, and there are many types of waves besides just P and S. Faults can act as wave guides and focus (amplify) incoming dynamic energy onto particular areas. Vibration changes with the stiffness (thickness, softness, blockiness) of the fractured zone.
3.3 Ejection PPV
The ejection PPV is defined in this paper as the PPV of a point on the surface of the excavation during the dynamic event. It is definitely not the same as the incoming PPV. The incoming PPV is a dynamic stress wave which only excites or attacks the rock mass, and initiates a cascade of phenomena that may lead to damage. The nature of the failure, or of the damage mechanism, then generates the ejection PPV as a byproduct. The ejection PPV is what is felt by the ground support scheme.
For a local strainburst, i.e. not initiated by a remote event vibration, there is zero incoming PPV because the burst is the source, and being at the edge of the excavation it generates its own ejection PPV.
3.4 Site effect factor
A site effect factor is sometimes applied as a multiplier to the incoming PPV to try to approximate the ejection PPV. For instance the site effect typical for Western Australian hard rock mines has been quoted as

Progress with empirical performance charting for confident selection of ground support P.A. Mikula in seismic conditions
74 Deep Mining 2012, Perth, Australia
about 2 (Heal, 2007). The author’s experience at Long-Victor Mine suggests an average site effect factor of 3 may be typical there. This effect is poorly understood, but amplification of the ground motion by a factor of up to 10 times is considered possible (Milev and Spottiswood, 2005).
In reality, the site effect is a variable, not a constant, is frequency dependent, and depends on numerous factors. Without measurement, no-one knows what it is or was in any particular instance. Sensors (geophones, accelerometers) that are positioned in the solid rock mass register the incoming PPV, and do not experience the site effect.
The author has often attempted to back-calculate the site effect from the distance to which a block of ejected rock has apparently been thrown, but this has been depressingly unsuccessful. Momentum and kinetic energy both, rather than ejection velocity alone, are relevant to the work that the scheme has to do.
4 Damage rating scales
For charting purposes, damage caused by a certain event is qualitatively rated (Table 1) using scales of S0 to S5 for steel element damage, and SC0 to SC5 for fibrecrete/shotcrete damage (0 represents no damage, 5 total destruction). The scales are collectively denoted Support Damage Scales (SDS). The ratings are adopted from Kaiser et al. (1992) but it has been found helpful to create separate ratings for fibrecrete rather than combining it with steel support as in the original scales. Rock damage scales are also used, but they are not required for charting. Rock damage need not be similar to support damage. Sometimes less support damage may be related to more rock damage, and vice versa.
Table 1 Support damage scale rating summary guidelines for damage caused by a seismic event, based
on Kaiser et al. (1992)
Rating Steel Support Damage Guideline
S0 No damage
S1 First signs of distress
S2 Loaded, plates deformed, mesh bagged but functional
S3 Heavy loaded, few broken, mesh bagged, some torn/open
S4 Major damage, broken bolts, mesh failed or bagged to capacity, rock ejected
S5 Complete failure of support components
Rating Shotcrete/Fibrecrete Damage Guideline
SC0 No damage
SC1 First cracks in shotcrete
SC2 Shotcrete cracked and loaded
SC3 Shotcrete fractured, debonding, some fragments
SC4 Shotcrete heavily fractured, large pieces fallen
SC5 Shotcrete non-functional
Importantly, ratings of S3 or SC3 are calibrated as the limits of tolerable damage. This calibration meets the operational need to ensure that engineers will know whether an excavation fitted with a certain scheme will experience:
Acceptable damage (rating 0 to 2) – i.e. damage is sufficiently limited that it need not be repaired, but it may be repaired if weakening or fatigue is suspected.

Ground support
Deep Mining 2012, Perth, Australia 75
Tolerable damage (rating 3) – i.e. damage requires a level of repair or rehabilitation, but the repair effort and cost can be tolerated.
Intolerable damage (rating 4 or 5) – i.e. damage is so extensive that the repair effort and cost, if contemplated, would be prohibitively high.
This rating calibration does not take into account any level of hazards to persons, equipment and access, which are outside of the scope of this paper. With this calibration in place, engineers first specify the rating to which a particular proposed excavation must perform. The empirical chart can then define the scheme capacities to meet that performance rating.
5 Ground support scheme dynamic capabilities
A necessary input to most scheme selection approaches is an estimate of the energy dissipation and load capacities of the selected scheme under dynamic conditions. However, there are difficulties:
Dynamic testing of schemes and individual components is a difficult major undertaking (Player et al., 2008a, 2008b, 2009a, 2009b, 2009c; Heal and Potvin, 2007) and it is not feasible to test every scheme under every circumstance. Test data has considerable scatter showing that many factors play a role in any individual test result.
Dynamic performance varies with the nature and characteristics of each field damage mechanism, with rates and directions of loading, and with scheme installation variations and deficiencies.
Ground support schemes experience weak links. Common weak links are bolt load capacity (bolts break) and screen capacity (mesh tears or the mesh/bolt collar linkage fails). If these weak links exist, other greater capacities are irrelevant and wasted until the deficiencies are removed and all the components are matched for load, energy and displacement parameters.
The nominal installed capacity is unlikely to be equal to the capacity actually utilised or mobilised in the course of a dynamic incident. The term ‘mobilised capacity’ is introduced as an estimate of the portion of installed capacity that was actually mobilised during the event. It can only be determined after the event, based on underground observation of clues such as slippage, bagging of mesh, fracturing of fibrecrete, loading or loss of bolt plates and collar assemblies. Mobilised capacity accounts for failure of some components if that has occurred.
5.1 Using time-stamps to move from component capacity to scheme capacity
How can scheme capacity numbers be derived from component capacities in the absence of specific testing of schemes?
It is tempting but incorrect to ignore the difficulties and simply adopt manufacturer statements. For example, assume that Bolt X has an energy dissipation capacity of 22 kJ, mesh Y has a capacity of 8 kJ/m2, and add those to arrive at a scheme capacity.
Dynamic interaction between scheme components is complex. In the absence of test data, the author has adopted the following four principles for estimating actual scheme performance based on observations. This process is applied individually to every single data point in the empirical charts.
5.1.1 Displacement-driven process
Component displacement is the starting point. This is the elongation of a solid element, the sliding distance of a yielding element, or the deflection of a surface support element. For deflection of a surface support element, the nominated deflection is the maximum occurring in between bolts.
It is observed that any component displaces conformably with the failing rock mass (until and unless a component fails). This is true regardless of the failure mechanism (strainburst, shakedown, fault slip), which causes the displacement to occur. Displacement (i.e. not PPV) controls the load and energy dissipation in

Progress with empirical performance charting for confident selection of ground support P.A. Mikula in seismic conditions
76 Deep Mining 2012, Perth, Australia
each component. If the displacement history of a component is known, the load and energy data can be estimated. For each component, it is possible to estimate or guess a displacement-energy dissipation curve or a displacement-load curve.
Fortunately, displacement is visible and can be, and ideally always should be, measured or estimated in the course of underground observations of damage. Photographic visualisation technology now facilitates these measurements, by routinely surveying all as-mined development, then simply resurveying sites that experience damage (A. Day, 2011, pers. comm.).
As a corollary, this displacement monitoring can be used in a direct practical fashion to establish the remaining support scheme capacity after every seismic hit.
5.1.2 Displacement time-stamp concept
The concept of a time-stamp is introduced to link different component displacements at the same instant in time during a dynamic occurrence. For example at the same time instant – Time-stamp #1 – a bolt collar may have experienced 50 mm displacement while mesh has 200 mm displacement. At Time-stamp #2, the bolt may be at 60 mm displacement and the mesh at 250 mm. The actual times need not be known – rather, only the different displacements experienced at the same instants in time. Table 2 shows a worked example of time-stamps for a hypothetical occurrence.
Table 2 Hypothetical time-stamp example. Displacement is the independent variable. A bolt density
of 1 bolt/m2 is assumed so that the energy and load data are per unit area. Fibrecrete
fails but the other components remain functional in this example. Peak mobilised energy
dissipation occurs at time-stamp #4. Peak mobilised load capacity however occurs at time-
stamp #1
Time-Stamp #0 #1 #2 #3 #4
Component Displacement or Sliding (mm)
Bolt A 0 5 10 40 50
Mesh B 0 10 50 100 250
Fibrecrete C 0 10 50 100 250
Energy Dissipation Mobilised Per Unit Area (kJ)
Bolt A 0 0.2 0.4 1.6 2.1
Mesh B 0 0 0 1.0 4.0
Fibrecrete C 0 2.2 10.7 15.0 15.0
SUM at time-stamp 0 2.4 11.1 17.6 21.1
Load Mobilised Per Unit Area (kN)
Bolt A 0 42 42 42 42
Mesh B 0 0 0 6 24
Fibrecrete C 0 50 20 0 0
SUM at time-stamp 0 92 62 48 66
5.1.3 Energy dissipation capacity
A fundamental observation is that cumulative energy dissipation never decreases with displacement of a component. Therefore, it is valid to compute energy relative to observed displacement, per component, and sum or superimpose the component energies at the final time-stamp representing the cessation of the dynamic occurrence.

Ground support
Deep Mining 2012, Perth, Australia 77
5.1.4 Load capacity
Load capacity may increase or decrease with displacement. Peak loads occur at different displacements for different components. One element could be pre-peak while another may already be ruptured. Therefore, peak load is not the simple sum of maximum load capacity of components. Rather, it is the highest sum of the capacities obtained at any of the time-stamps.
Table 2 shows a time-stamp example for a scheme of three components typical of the Long-Victor Mine. Other time-stamp examples could be constructed, e.g. for a friction bolt clamped by shearing, as was the case in numerous database points.
The energy and load data in Table 2 are not necessarily manufacturer data, but are interpreted for this mine site. The energy and load data come from multiple sources, briefly summarised as follows:
Bolt A is a 3 m long jumbo friction bolt. These bolts were dynamically tested by WASM (Western Australian School of Mines) for Lightning Nickel (Player, 2009). Sliding energy dissipation was measured at 2.8 kJ per 100 mm slip per 1 m of resisting bolt length (Figure 1). Apply the bolt spacing pattern to obtain energy dissipation per unit area. A typical 1.5 m anchor sliding 50 mm will dissipate 2.1 kJ; pro-rata for other slide distances. To dissipate that amount of energy, the load exerted on the bolt must average 42 kN, which the bolt should survive.
Mesh B is weldmesh. The figure adopted for energy dissipation is 2 kJ per unit area per every 100 mm of displacement due to bulking, up to 500 mm maximum, but only if due to bulking, and only after the first 50 mm of mesh displacement which serves to tighten the mesh. Mesh fastening at Long-Victor is not stiff, so 500 mm mesh displacements without failure are occasionally seen (Figure 2). Meanwhile WASM tests (Player et al., 2008b) obtained mesh rupture at average dynamic force of 55 kN.
Fibrecrete C is 75 mm thick. Crack initiation (also the point of peak load capacity of 50 kN) is taken at 10 mm deflection, and complete failure at 70 mm deflection. Energy dissipation is adopted as a maximum of 15 kJ per unit area.
Table 2 assumes no shear loading of scheme components. If component failure occurs, e.g. fibrecrete in Table 2, the redistribution of load is assumed to drive the scheme rapidly through further time-stamps in search of a new equilibrium, which may or may not be found. Mobilised energies are then obtained at the final time-stamp, including the effect of any weak link failures, while mobilised load is the peak which might have been reached at any of the time-steps. This procedure only provides a ballpark estimate, but that is adequate in the context of extreme variability, and adequate for application in the empirical chart.
Figure 1 Friction bolt tested dynamic performance in pure axial loading for Long-Victor conditions.
Average energy dissipation was 2.8 kJ per 100 mm of slip per 1 m long bolt anchorage
length

Progress with empirical performance charting for confident selection of ground support P.A. Mikula in seismic conditions
78 Deep Mining 2012, Perth, Australia
Figure 2 Examples of extensive mesh bagging observed at Long-Victor Mine
6 Analysis approaches
With these understandings of PPV, damage rating scales and ground support scheme capacities, three scheme selection approaches are now considered: mechanistic, numerical, and empirical. The first two are only briefly surveyed and then the remainder of this paper focuses on the empirical chart method. Other methods, combinations and variations exist, with enhancements such as using probability to manage the variability observed in practice.
No scheme selection method is bullet-proof. The author’s practice is to apply more than one method to a situation, to gain an increased engineering understanding of the strengths and weaknesses of the methods. Whatever methods are used to select a scheme, it is professionally appropriate to compare a proposed scheme for consistency with schemes adopted generally in industry practice in seismically active mines. An example is shown in Volume 2, Table 2.5, Kaiser et al. (1995).
7 Mechanistic or analytical methods
The mechanistic approach is based on defining equations that mimic an expected behaviour mechanism. Two examples used in some Western Australian mines are a Canadian Rockburst Handbook (CRH) method (Kaiser et al., 1995) and a kinetic/potential energy method (Kaiser et al., 1995; Heal, 2007).
7.1 Canadian Rockburst Handbook method
A method modified from the CRH (Kaiser et al., 1995) may be used to calculate the requirements for energy dissipation, load capacity, and element displacement (elongation or yield). This method was applied for example in developing the Safety Case for Beaconsfield Mine, and is well documented (Scott et al., 2008). The method was built on a particular model of seismic failure using data dominantly from Creighton Mine, so it is well suited to that mine (D. Thibodeau, 2011, pers. comm.). Points to note about this method:
Calibration is required. Results are very sensitive to the value of the calibration factor and other factors. A back-analysis study by the author showed that for the Long-Victor site, the best-fit calibration factor C was in the expected range of 0.5 to 0.7, and possibly equal to 0.63.
Numerous assumptions are made, which detracts from the confidence of the method.
Results are dependent on similarity between the model of seismic damage and that occurring in practice. Application of the method to Long-Victor found that the total depths of failure estimated by the method were very large, quite unlike those observed.

Ground support
Deep Mining 2012, Perth, Australia 79
The method estimates some interesting parameters, including a static load that will be applied to bolts due to the bulking of the broken rock mass, and a bolt yield or elongation distance required to survive the bulking of the broken rock mass.
The method also estimates a momentary shakedown load that will be applied to bolts. This shakedown load is very high due to extreme accelerations (up to 10 times gravity or more) applied during the event. If the bolt has sufficient yield or damping capacity it will survive that high load; if not it will break. For some PPV scenarios the shakedown load capacity requirements are onerous and bolt strength is the weakest link.
7.2 Kinetic/potential energy method
This is a widely used method, based on simple mechanics related to the ejection of a block of rock from the backs or walls of an excavation. Points to note about this method:
Calculations use the square of ejection velocity, so errors in the value of velocity are compounded. The actual ejection velocity is usually unknown.
The method suggests that wall support requirements will be less than backs, as the potential energy change for wall ejection is zero.
The method is dependent on assumptions for size and thickness of failure.
The method does not account for damage mechanisms other than pure ejection. Momentum change should also be included. Momentum change equates arithmetically to the product of the component load and the impulse duration. A rigid scheme with a shorter impulse duration will need to withstand a higher load to meet the momentum demand.
Common practice has been to assume as an input for this method the displacement d of the block that is ejected, then calculate energy changes, then select a scheme that will survive those energy changes. However this approach is incorrect. The d parameter should be an output resulting from the interaction of the scheme with the damaging excitation. This can be easily demonstrated by studying results obtained for different d values for different schemes.
Interaction of the scheme with the rock will change the kinetic energy demand. To illustrate this, consider that as movement develops during an event, some support types (e.g. fibrecrete) apply restraint at small displacement, while others (e.g. mesh) do not respond to the displacement until it has become substantial. The stiff support component (fibrecrete) will commence to interact with the rock while d is very small. Crucially, this is also while rock velocity and kinetic energy are still very small (a block at rest has to accelerate through a distance in order to reach ejection velocity) and screen confinement still applies.
So, provided it does not fail, a stiffer scheme should be more efficient and effective in controlling damage. The author suspects that this may be why fibrecrete with mesh covering and dense bolting is a good scheme for the Long-Victor dynamic environment.
8 Numerical methods
This approach is not the same as the conventional numerical stress analysis modelling which is routinely performed as part of mine design investigations for most mines. That modelling can estimate details important for scheme design, such as depths of failure, and volumes that might be subject to ejection, but it does not incorporate dynamic sources.
The numerical approach considered here is a sufficiently detailed simulation model of a real dynamic system. The computer model is a very precise replica of the detail of the rock mass, structure, excavations, ground support schemes, and the dynamic source. This is now possible with advancements in computer

Progress with empirical performance charting for confident selection of ground support P.A. Mikula in seismic conditions
80 Deep Mining 2012, Perth, Australia
power (Beck et al., 2010). It is beyond the scope of this paper to explore these options, but they appear to hold promise.
Most mines do not currently have the degree of detailed information required for such models, and the challenge is to be confident that all the important details are collected and modelled.
9 Empirical methods
The empirical approach is based on collection of experience-based site data as the basis to interpret behaviour. Three related examples are presented. The first two originate from the Australian Centre of Geomechanics (ACG), and the third is the modification developed by the author.
An empirical approach to designing site-based ground support is attractive as it bypasses some of the assumptions and complexities of other methods. A key advantage is that it is calibrated to the peculiarities of the specific mine site. All the variables, whatever they may be, known or unknown, are canvassed within the method to the extent that prior mine history reflects future history.
In empirical approaches, much scatter in the data is expected as it reflects the real world variability – refer, for instance, to other empirical methods such as the Mathews Stability Graph or the Barton Q Chart.
9.1 Rockburst simulation method
Over the last few years the ACG carried out a series of in situ simulated rockburst tests in various mines, using blasting to generate strong dynamic loading on a supported excavation surface. A detailed presentation of the results is given by Heal (2007).
The simulation tests were done to examine the behaviour of schemes rather than individual components. The test analyses included observation or measurement of a damage rating using the SDS scales, PPV of ejection, and a measured failure thickness. From the latter two parameters the kinetic energy of the ejecta was computed so that the energy applied to the ground support scheme could be estimated.
The simulations provided valuable probing into weak links and relative performance of schemes. To the extent that the blasting environment and resulting PPV differ from the event environment, the experimental damage results will differ from event-caused damage. Probably blast damage would be more limited than event damage for the same PPV (blasts have lower moment and higher energy). However, given the many unknowns and assumptions in this field, the simulation results are helpful and can educate engineering judgement going forwards. Application at Long-Victor found that the method provides realistic estimates of thickness of failure that will be adequately supported.
9.2 MS-RAP excavation vulnerability potential method
If a representative seismic event history for an area has been collected, MS-RAP software can assess dynamic support requirements for that area. MS-RAP provides an estimate of the hazard of seismic damage, and the sensitivity of the hazard to a change in the scheme. The input data for this assessment comprises:
A seismicity history sufficient to adequately estimate approximate magnitude and location of the maximum expected event.
The vulnerability of the area to damage. This is based on four terms: E1 the stress level, E2 the span of the opening, E3 the existing or proposed ground support, and E4 the presence of faults, dykes and structures. These four terms are combined to define a parameter called excavation vulnerability potential (EVP).
The mapping of the EVP parameter to the damage output is based on charting numerous case study data points collected from several mines. Being case study points, they represent realistic performance points that take all site variables into account. Points to note about this method:

Ground support
Deep Mining 2012, Perth, Australia 81
The assessment is not applicable for areas outside of the seismic sensor array (incomplete seismic history).
The assessment is incomplete for areas that could experience anomalous seismicity, i.e. fault slip. Study of geological structure, stress and strength information is required alongside the seismic monitoring record to try to anticipate anomalous seismicity.
Assumptions are made to simplify the input data down to the four terms E1–E4 as locality variables. This is necessary and probably adequate to obtain a ballpark hazard estimate.
The method visually flags any localities with high probability of seismic damage, and the relative reduction in damage obtainable by increasing scheme capacities.
The method uses only the incoming PPV, i.e. the site effect problem is bypassed.
The empirical chart method below varies from the MS-RAP EVP method in that:
Some EVP parameters (E1, E2 and E4) are not currently included.
The damage weak links are assessed.
The E3 EVP parameter, representing ground support, is expanded and interpreted.
10 The Empirical Chart method
The method defines relationships between PPV, scheme capacities, and damage occurring in excavations.
This empirical chart method is based on back-analysis of a large number of underground observations of seismic damage and the performance of ground support at three West Australian mines: Mt Charlotte, Argo and Long-Victor. For background information on these mines refer to Mikula and Lee (2000) and Sweby (2007).
The first chart was constructed by Mikula and Lee (2007) to assist scheme selection for the ROB5 stope at Mt Charlotte. That chart did not include many of the subsequent developments, and is currently in the process of being upgraded. This was followed by an improved second version for Long-Victor, a third for Argo, and recently a fourth revision for Long-Victor. Much has been learned, such as what data was essential to collect and what could be bypassed. Work is ongoing to study numerous new aspects that have become apparent during the charting to date.
10.1 Chart design and methodology
10.1.1 Number of data points
Data points consulted were as listed in Table 3. Only damage occurrences known to be dynamic were included. There were multiple damage localities and ground support schemes, so in total it was possible to identify and chart many separate datasets. For the Long-Victor studies, data was filtered by three confidence assessments (of seismic event parameters, knowledge of the scheme, and knowledge of the damage). Not all the available damage observations were used.
Table 3 Data points consulted for the empirical charts
Data Type Long-Victor Argo Mt Charlotte Total
Damage observations total 201 43 186 430
Damage observations used 112 43 186 341
Seismic events represented 45 16 36 97
Progress with empirical performance charting for confident selection of ground support P.A. Mikula in seismic conditions
82 Deep Mining 2012, Perth, Australia
10.1.2 Content of data points
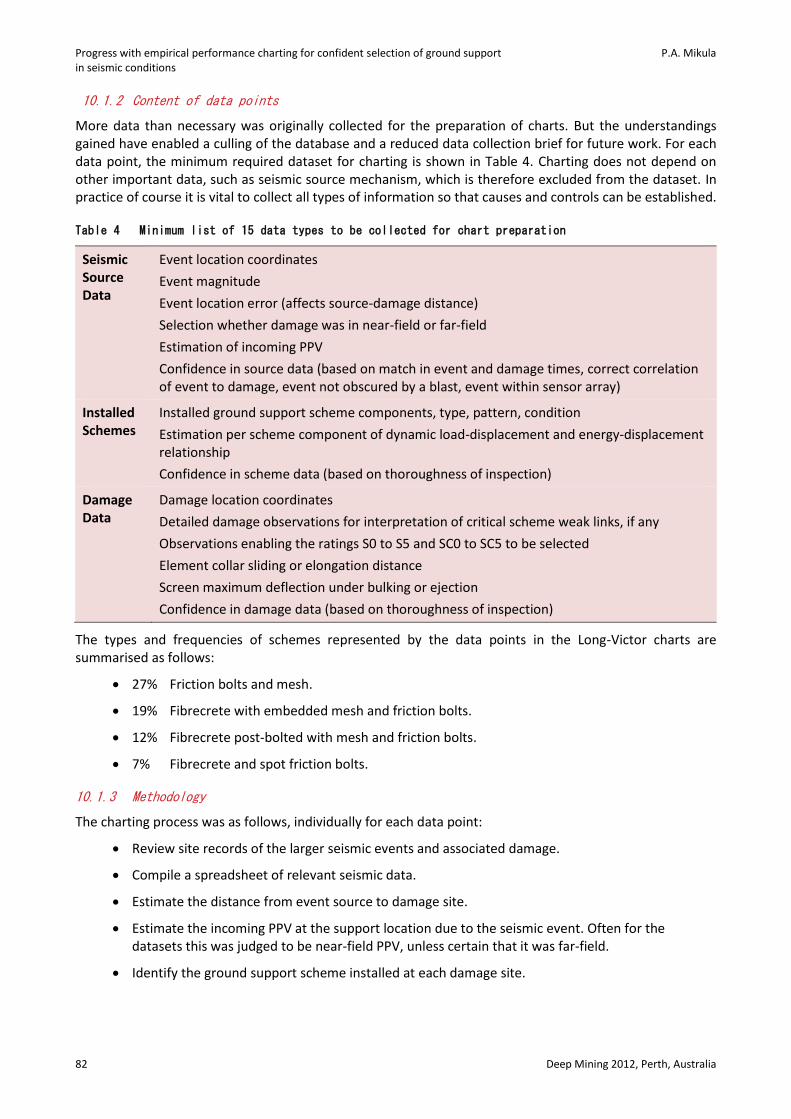
More data than necessary was originally collected for the preparation of charts. But the understandings gained have enabled a culling of the database and a reduced data collection brief for future work. For each data point, the minimum required dataset for charting is shown in Table 4. Charting does not depend on other important data, such as seismic source mechanism, which is therefore excluded from the dataset. In practice of course it is vital to collect all types of information so that causes and controls can be established.
Table 4 Minimum list of 15 data types to be collected for chart preparation
Seismic Source Data
Event location coordinates
Event magnitude
Event location error (affects source-damage distance)
Selection whether damage was in near-field or far-field
Estimation of incoming PPV
Confidence in source data (based on match in event and damage times, correct correlation of event to damage, event not obscured by a blast, event within sensor array)
Installed Schemes
Installed ground support scheme components, type, pattern, condition
Estimation per scheme component of dynamic load-displacement and energy-displacement relationship
Confidence in scheme data (based on thoroughness of inspection)
Damage Data
Damage location coordinates
Detailed damage observations for interpretation of critical scheme weak links, if any
Observations enabling the ratings S0 to S5 and SC0 to SC5 to be selected
Element collar sliding or elongation distance
Screen maximum deflection under bulking or ejection
Confidence in damage data (based on thoroughness of inspection)
The types and frequencies of schemes represented by the data points in the Long-Victor charts are summarised as follows:
27% Friction bolts and mesh.
19% Fibrecrete with embedded mesh and friction bolts.
12% Fibrecrete post-bolted with mesh and friction bolts.
7% Fibrecrete and spot friction bolts.
10.1.3 Methodology
The charting process was as follows, individually for each data point:
Review site records of the larger seismic events and associated damage.
Compile a spreadsheet of relevant seismic data.
Estimate the distance from event source to damage site.
Estimate the incoming PPV at the support location due to the seismic event. Often for the datasets this was judged to be near-field PPV, unless certain that it was far-field.
Identify the ground support scheme installed at each damage site.

Ground support
Deep Mining 2012, Perth, Australia 83
Estimate the mobilised energy dissipation capacity and load capacity of the scheme. This was done point by point using the logic described earlier, using estimates of sliding, elongation and/or bulking distances for each component.
Create charts of PPV versus scheme capacities. Some data points appear on multiple charts. To be conservative, if damage at a location was variable, only the worst-rated damage was plotted.
10.1.4 Advantages of this empirical method
The method is automatically calibrated to the peculiarities of the mine site. The chart conclusions will be valid, even if for example the seismic system has a bias in calculating magnitude, or if the actual scheme energy capacity is overestimated, or if scheme components are degraded, so long as the bias is consistent in both the data collection (back-analysis) and the forecasting (forward-analysis) exercises.
In this method, both the site calibration and the forward design are based only on incoming PPV, so that the site effect problem is bypassed. No site effect need be attached to the PPV. The PPV is simply a proxy for the dynamic radiation and only needs to be calculated the same way each time.
10.1.5 Disadvantages of this empirical method
While it avoids some assumptions of other methods, the charting method does have its own difficulties. Observations are not always easily or consistently measured and documented, even if the same person collects the data using the same methodology. It is necessary that sites carefully review each case history to check and correct the accuracy of the data used.
Forensic investigation of damage occurrences is required to collect valid information. If one event triggers others, it is necessary to discern which event was responsible for which damage. Indeed it is necessary to ensure that the damage was in fact dynamic. Some dynamic damage mechanisms are clear, e.g. in ejection tendons are bent to point in the direction of ejection, but some are not.
In relation to scheme capacities, much depends also on good estimation of displacements of scheme components. The photographic methods are clear favourites here.
The empirical charts are not directly portable between sites unless demonstrated otherwise. For example sites have different seismic systems (the Long-Victor system is an ESG Hyperion) which may compute different PPV for the same event. Upgrade of seismic software can change source parameters. Support schemes and installation techniques will differ. The bolt load and energy data are educated estimates for Long-Victor Mine. These and many other factors impact on the charts.
10.2 Parameters investigated to find optimum chart design
Among the studies conducted with the charts were surveys of the effects of many parameters and chart design options. This was done by designing spreadsheets in Microsoft Excel to facilitate the study of each parameter. This enabled all the charts shown in this paper and many more to be created in just minutes.
Some of the chart parameters tested to date were in situ stress, excavation span, rock type, radiation incidence angle (defining whether the damaged excavation point received a direct hit through to being fully shielded), and excavation profile damage position (back, shoulder, wall, floor). However, these were found to be minor parameters in comparison with PPV and the mobilised load and energy.
11 The Long-Victor charts and their application for scheme selection
Some of the Long-Victor charts are now presented (Figures 3 and 4).

Progress with empirical performance charting for confident selection of ground support P.A. Mikula in seismic conditions
84 Deep Mining 2012, Perth, Australia
Figure 3 Mobilised energy capacity – (left) steel damage and (right) fibrecrete damage. The 3/4 and
2/3 demarcation lines are indicated
Figure 4 Mobilised load capacity – (left) steel damage and (right) fibrecrete damage. The 3/4 and
2/3 demarcation lines are indicated

Ground support
Deep Mining 2012, Perth, Australia 85
11.1 Demarcation lines
The charts include demarcation lines, sometimes tentatively, to interpret conservative S3, S4, SC3, and SC4 performance. These lines are based on the datasets, and reflect the known experience at the three studied mines.
Demarcation lines are simply lower-bound or conservative envelope lines. The choice was made to use straight lines passing through the origin, and to not consider outlier data close to the origin in positioning the lines. The objective is to position demarcations that bound essentially all site experience of a certain damage level. The wide scatter in points denoting a particular damage level such as S3 is ignored in setting the demarcation lines.
Conservative rather than average demarcation lines are used, so that in forward-analysis there is confidence that adverse variability is accounted for. Using an average trend line would mean inadequate performance for 50% of the installed schemes in a forward-analysis, which is unacceptable. Empirical design should be based on upper and lower limits, not averages.
11.2 Data scatter
While there is scatter in the data, and scarce data on occasion, the overall trends are identifiable and are as expected. Scatter in data shows the range of variability and uncertainty, so overlap between categories is expected. The important target is that a conservative-end separation of data must be apparent, as is seen.
The empirical approach does not and need not smooth out the data scatter. It does not even need to explain the scatter in the data, nor the fine distinctions between damage ratings. It only needs to demonstrate that there is a spread in the damage ratings such that a conservative demarcation line can be fitted.
Due to the scatter, it is not possible to say that the installed scheme at a chosen data point was, for instance, 40% effective in preventing ejection. It is possible, however, to compare a scheme against the scheme that would be required in the most conservative scenario encountered in the mine.
11.3 Generation of scheme selection guidelines
From the charts, guidelines may be defined by noting that the conservative or lower S4 or SC4 demarcations are the limit of tolerable performance, and the lower S3, SC3 define acceptable performance. These are denoted as the S3/4 and the S2/3 demarcations for steel components, and similarly for fibrecrete data. These demarcations are listed for the main Long-Victor charts in Table 5. (Table 5 also refers to weak links which are discussed later.)
Table 5 Demarcations inferred from charts. The 3/4 data indicates tolerable/intolerable damage
boundaries, and 2/3 data indicates acceptable/tolerable damage boundaries
Energy Requirement Per Unit Area kJ per PPV of 1 m/s
Load Requirement Per Unit Area kN per PPV of 1 m/s
Demarcation Class All Data Weak Link Bolt or Screen Failure
All Data Weak Link Bolt or Screen Failure
Refer Figure Figure 3 Figure 6 Figure 4 Figure 7
Steel S3/4 11.5 11.5 69 69
Steel S2/3 16.6 78
Fibrecrete SC3/4 8.7 76
Fibrecrete SC2/3 18.9 125
Progress with empirical performance charting for confident selection of ground support P.A. Mikula in seismic conditions
86 Deep Mining 2012, Perth, Australia
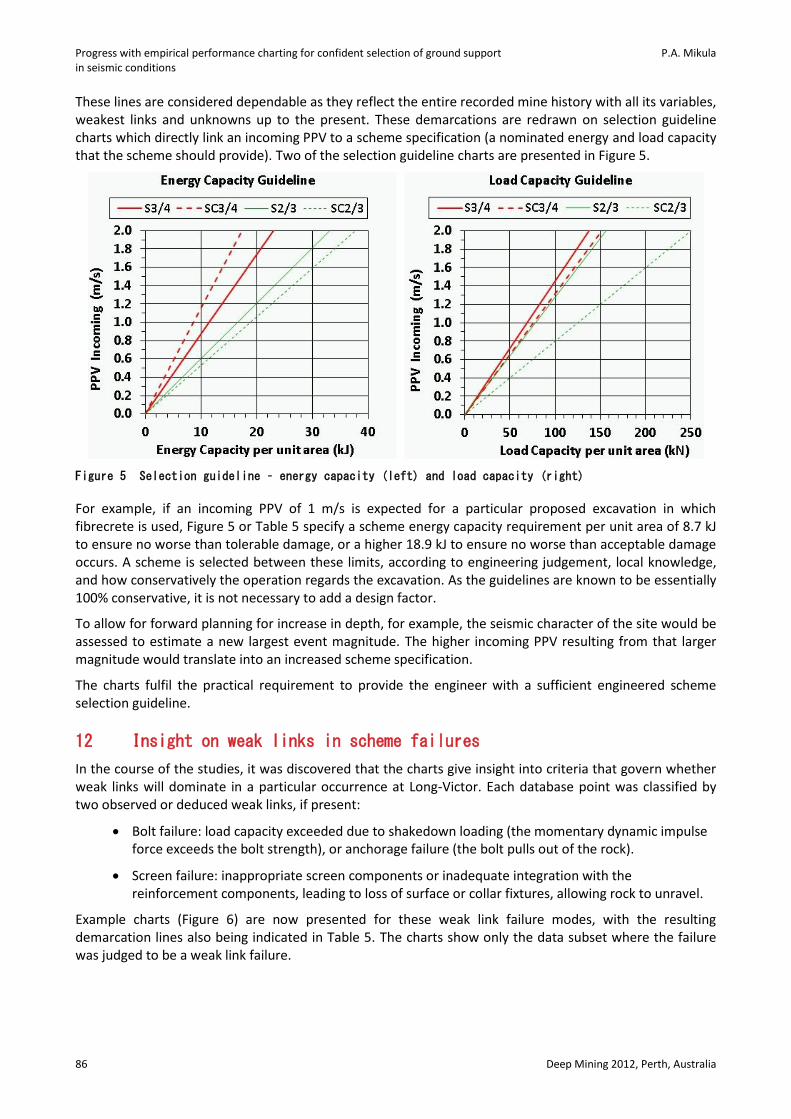
These lines are considered dependable as they reflect the entire recorded mine history with all its variables, weakest links and unknowns up to the present. These demarcations are redrawn on selection guideline charts which directly link an incoming PPV to a scheme specification (a nominated energy and load capacity that the scheme should provide). Two of the selection guideline charts are presented in Figure 5.
Figure 5 Selection guideline – energy capacity (left) and load capacity (right)
For example, if an incoming PPV of 1 m/s is expected for a particular proposed excavation in which fibrecrete is used, Figure 5 or Table 5 specify a scheme energy capacity requirement per unit area of 8.7 kJ to ensure no worse than tolerable damage, or a higher 18.9 kJ to ensure no worse than acceptable damage occurs. A scheme is selected between these limits, according to engineering judgement, local knowledge, and how conservatively the operation regards the excavation. As the guidelines are known to be essentially 100% conservative, it is not necessary to add a design factor.
To allow for forward planning for increase in depth, for example, the seismic character of the site would be assessed to estimate a new largest event magnitude. The higher incoming PPV resulting from that larger magnitude would translate into an increased scheme specification.
The charts fulfil the practical requirement to provide the engineer with a sufficient engineered scheme selection guideline.
12 Insight on weak links in scheme failures
In the course of the studies, it was discovered that the charts give insight into criteria that govern whether weak links will dominate in a particular occurrence at Long-Victor. Each database point was classified by two observed or deduced weak links, if present:
Bolt failure: load capacity exceeded due to shakedown loading (the momentary dynamic impulse force exceeds the bolt strength), or anchorage failure (the bolt pulls out of the rock).
Screen failure: inappropriate screen components or inadequate integration with the reinforcement components, leading to loss of surface or collar fixtures, allowing rock to unravel.
Example charts (Figure 6) are now presented for these weak link failure modes, with the resulting demarcation lines also being indicated in Table 5. The charts show only the data subset where the failure was judged to be a weak link failure.

Ground support
Deep Mining 2012, Perth, Australia 87
Figure 6 Weak link (bolt or screen) failure – (left) scheme mobilised energy, (right) scheme
mobilised load
The weak link charts for the Long-Victor data showed clear demarcations defining required scheme energy and load capacities that would avoid bolt or screen failure. Interestingly, these demarcations turned out to be identical to the 3/4 demarcation lines in the corresponding charts in Figures 3 and 4. Therefore they have been labelled as 3/4 lines in Figure 6.
Most of the Long-Victor intolerable damage data points appear on the Figure 6 charts, indicating that the majority of intolerable damage has been due to weak link failures.
Note that Figure 6 shows scheme capacities, not component capacities. Thus the design target is that no scheme weak link component must be allowed to fail before the scheme as a whole can reach the energy and load levels indicated by the demarcation lines.
The charts had sparsely populated zones devoid of much data below the demarcation lines. This indicates that the demarcation lines were confident specifications of requirements to avoid bolt/screen failure.
With the data points representing bolt and screen failure removed from the chart, the remaining points represented damage sustained by adequately-matched schemes (schemes where components were matched to deliver at least adequate performance). The spread of those points across the charting space can be appreciated by reviewing Figures 3 and 4. These charts suggest that performance of a well-matched scheme is proportional to its energy and load capacity.
13 Conclusions
The charting method is a promising step towards empirical design for dynamic support schemes. This work has attempted to explain the limitations and data variability that go into the method.
This work has developed an empirical chart system which fulfils the practical requirement to provide a sufficient engineered dynamic support selection method. It does this by providing conservative guidelines which reflect all the observed variability as defined for the mine site.

Progress with empirical performance charting for confident selection of ground support P.A. Mikula in seismic conditions
88 Deep Mining 2012, Perth, Australia
If the past observed seismic history is sufficient, and is a valid representation of future history, then the method can be used for forward planning and design. But it is always essential to verify in the construction period that the estimates and assumptions made in the design period are valid.
As the charts depend on the past history and variability of the Long-Victor Complex, they are not portable to another mine. Attempting to do that is not valid unless it can be demonstrated otherwise.
The original data collection and interpretation needed to create the charts presented in this paper were onerous. The key data observation items to be collected were information on the weak links in the schemes, definition of the actual displacement, and elongation or sliding of all ground support components. However, in the light of progress a reduced data collection need has been defined, to expedite future work.
Many mine sites already have databases of relevant data, so it is well within site capabilities to interpret their data into the empirical chart format. The author looks forwards to the results of such work.
Finally, the work has estimated scheme capacities required to eliminate bolt and screen weak link occurrences. With those eliminated, the damage sustained by well-matched schemes is suggested to be approximately inversely proportional to scheme load and energy capacities.
Acknowledgements
As always I thank God for wisdom in my work. Sincere thanks are due to Max Lee, Graham Swan, Denis Thibodeau, and the ACG reviewers who spent time and effort reviewing and commenting on the draft paper. Thanks are also due to Lightning Nickel Pty Ltd management for enabling me to persevere with the project, and for permission to publish the site data. I do so appreciate the geotechnical engineers at Long-Victor Mine who assisted in the discussions and patiently tried to understand what on earth I was up to over the years.
References
Beck, D., Stacey, K. and Gilbert, D. (2010) Mine to tunnel scale discontinuum simulation of repeated dynamic loading of mine excavations, in Proceedings Second Ground Control in Mining Conference, Sydney, Australia, Australian Institute of Mining and Metallurgy.
Daehnke, A., Rossmanith, H.P. and Knasmillner, R.E. (1996) Using dynamic photoelasticity to evaluate the influence of parting planes on stress waves interacting with stopes, International Journal for Numerical and Analytical Methods in Geomechanics, Vol. 20, pp. 101–117.
Heal, D. (2007) Ground support for rockbursting conditions – Theory and Practice, Section 5, in Course Note Advanced Ground Support in Underground Mining (COR 0703), 2–4 May 2007, Perth, Australia, Australian Centre for Geomechanics.
Heal, D. and Potvin, Y. (2007) In-situ dynamic testing of ground support using simulated rockbursts, in Proceedings Fourth International Seminar on Deep and High Stress Mining (Deep Mining 07), Y. Potvin (ed), 7‒9 November 2007, Perth, Australia, Australian Centre for Geomechanics, Perth, pp. 373–394.
Kaiser, P.K., Tannant, D.D., McCreath, D.R. and Jesenak, P. (1992) Rockburst damage assessment procedure, Rock Support in Mining and Underground Construction, P.K. Kaiser and D.D. McCreath (eds), Balkema, Rotterdam, pp. 639–647.
Kaiser, P.K., McCreath, D.R. and Tannant, D.D. (1995) Rockburst Support Handbook, Geomechanics Research Centre, in 2 volumes, Laurentian University, Canada.
Mikula, P.A. and Lee, M.F. (2000) Bulk low grade mining at Mt Charlotte Mine, in Proceedings MassMin 2000, G. Chitombo (ed), 29 October to 2 November 2000, Brisbane, Australia, Australasian Institute of Mining and Metallurgy, Melbourne, pp. 623‒635.
Mikula, P.A. and Lee, M.F. (2007) Empirical performance chart for ground support in seismic conditions at Mt Charlotte, in Proceedings Fourth International Seminar on Deep and High Stress Mining (Deep Mining 07), Y. Potvin (ed), 7‒9 November 2007, Perth, Australia, Australian Centre for Geomechanics, Perth, pp. 325–334.
Milev, A.M. and Spottiswood, S.M. (2005) Strong ground motion and site response in deep South African mines, Journal of the South African Institute of Mining and Metallurgy, Vol. 105, No. 7, Aug, pp. 515–524., and comment on that paper by Ortlepp, W.D., Journal of the South African Institute of Mining and Metallurgy, Vol. 106, No. 7, August 2006, pp. 593–597, and reply to those comments by the original authors, ibid pp. 598–599.
Player, J.R., Thompson, A. and Villaescusa, E. (2009a) Dynamic testing of reinforcement systems, in Proceedings 6th International Symposium on Ground Support in Mining and Civil Engineering Construction, April 2008, Cape Town, South Africa, SAIMM, pp. 597-622.
Player, J.R. (2009) Dynamic testing of fero friction stabilisers for Lightning Nickel, Internal Report by WA School of Mines.

Ground support
Deep Mining 2012, Perth, Australia 89
Player, J.R., Villaescusa, E. and Thompson, A.G. (2008a) Dynamic testing of reinforcement systems, in Proceedings 6th International Symposium on Ground Support in Mining and Civil Engineering Construction, April 2008, Cape Town, South Africa, SAIMM, pp. 597–622.
Player, J.R., Villaescusa, E. and Thompson, A.G. (2009b) Dynamic testing of friction rock stabilisers, RockEng09, Rock Engineering in Difficult Conditions, M. Diederichs and G. Grasselli (eds), Paper 4027, CIM, Montreal, 12 p.
Player, J.R., Villaescusa, E. and Thompson, A.G. (2009c) Dynamic testing of threadbar used for rock reinforcement, RockEng09, Rock Engineering in Difficult Conditions, M. Diederichs and G. Grasselli (eds), Paper 4030, CIM, Montreal, 12 p.
Player, J.R., Morton, E.C., Thompson, A.G. and Villaescusa, E. (2008b) Static and dynamic testing of steel wire mesh for mining applications of rock surface support, in Proceedings 6th International Symposium on Ground Support in Mining and Civil Engineering Construction, April 2008, Cape Town, South Africa, SAIMM, pp. 693–706.
Scott, C., Penney, A.R. and Fuller, P. (2008) Competing factors in support selection for the West Zone of the Beaconsfield Gold Mine, Tasmania, Narrow Vein Mining Conference, Ballarat, Australia, October 2008, pp. 173–178.
Sweby, G. (2007) Kambalda Nickel Operations - Mining in high stress, seismically active conditions, in Challenges in Deep and High Stress Mining, Y. Potvin, J. Hadjigeorgiou and D. Stacey (eds), Australian Centre for Geomechanics, Perth, pp. 171–180.

Progress with empirical performance charting for confident selection of ground support P.A. Mikula in seismic conditions
90 Deep Mining 2012, Perth, Australia