Embed Size (px)
Citation preview
HAL Id: hal-03374098https://hal.archives-ouvertes.fr/hal-03374098
Submitted on 11 Oct 2021
HAL is a multi-disciplinary open accessarchive for the deposit and dissemination of sci-entific research documents, whether they are pub-lished or not. The documents may come fromteaching and research institutions in France orabroad, or from public or private research centers.
L’archive ouverte pluridisciplinaire HAL, estdestinée au dépôt et à la diffusion de documentsscientifiques de niveau recherche, publiés ou non,émanant des établissements d’enseignement et derecherche français ou étrangers, des laboratoirespublics ou privés.
Prohibitin Inactivation in Adipocytes Results inReduced Lipid Metabolism and Adaptive Thermogenesis
ImpairmentZhanguo Gao, Alexes Daquinag, Cale Fussell, Amel Djehal, Laurent Désaubry,
Mikhail Kolonin
To cite this version:Zhanguo Gao, Alexes Daquinag, Cale Fussell, Amel Djehal, Laurent Désaubry, et al.. Prohibitin In-activation in Adipocytes Results in Reduced Lipid Metabolism and Adaptive Thermogenesis Impair-ment. Diabetes, American Diabetes Association, 2021, 70 (10), pp.2204-2212. �10.2337/db21-0094�.�hal-03374098�
Prohibitin Inactivation in Adipocytes Results in Reduced Lipid
Metabolism and Adaptive Thermogenesis Impairment
Zhanguo Gao,1 Alexes C. Daquinag,1
Cale Fussell,1
Amel Djehal,2,3 Laurent Désaubry,2
and Mikhail G. Kolonin1
1 The Brown Foundation Institute of Molecular Medicine,
University of Texas Health Science Center, Houston, TX 77030, USA
2 INSERM-University of Strasbourg, Regenerative Nanomedicine Laboratory (UMR1260),
Faculty of Medicine, FMTS, Strasbourg, France
3 Superior National School Biotechnology Taoufik Khaznadar, Constantine, Algeria
Corresponding author: Mikhail G. Kolonin
Phone: 713-500-3146
Page 1 of 28
For Peer Review Only
Diabetes
Diabetes Publish Ahead of Print, published online July 13, 2021
2
Prohibitin-1 (PHB) is a multifunctional protein previously reported to be important for
adipocyte function. PHB is expressed on the surface of adipose cells, where it interacts
with a long chain fatty acid (LCFA) transporter. Here, we show that mice lacking PHB in
adipocytes (PHB Ad-KO) have a defect in fat tissue accumulation despite having larger
lipid droplets in adipocytes due to reduced lipolysis. Although PHB Ad-KO mice do not
display glucose intolerance, they are insulin resistant. We show that PHB Ad-KO mice are
lipid intolerant due to a decreased capacity of adipocytes for LCFA uptake. Instead, PHB
Ad-KO mice have increased expression of glucose transporter GLUT1 in various tissues
and use glucose as a preferred energy source. We demonstrate that PHB Ad-KO mice have
defective brown AT, are cold-intolerant, and display a reduced basal energy expenditure.
Systemic repercussions of PHB inactivation in adipocytes were observed in both males
and females. Consistent with lower cellular mitochondrial content and reduced UCP1
protein expression, brown adipocytes lacking PHB display decreased proton leak and
switch from aerobic metabolism to glycolysis. Treatment of differentiating brown
adipocytes with small molecules targeting PHB suppressed mitochondrial respiration and
uncoupling. Our results demonstrate that PHB in adipocytes is essential for normal fatty
acid uptake, oxidative metabolism, and adaptive thermogenesis. We conclude that PHB
inhibition could be investigated as an approach to altering energy substrate utilization.
Page 2 of 28
For Peer Review Only
Diabetes
3
INTRODUCTION
An important function of adipose tissue (AT) is the maintenance of energy balance and healthy
metabolism (1). Adipocytes are the lipid-storing cells of AT, dysfunction of which results in type-2
diabetes. Prohibitin-1 (PHB) is a multi-functional protein found in various cellular compartments
and also secreted, reported to be important for normal adipocyte function (2). Studies based on
small molecule ligands of PHB modifying its function have helped to map the diverse functions of
this protein in metabolic, inflammatory, cardiac, connective tissue, and neurological diseases, as
well as in cancer (3). A key insight on adipose function of PHB was the mouse model
overexpressing PHB from the aP2 promoter, which resulted in increased adiposity and impaired
glucose homeostasis despite elevated mitochondrial biogenesis (4). By screening for molecules
that home to white AT (WAT), we previously identified a peptide (sequence KGGRAKD) that
binds to PHB on the surface of adipose endothelium (5). In search for PHB function in WAT
endothelium, we have identified annexin A2 (ANX2), as a PHB-binding protein containing the
amino acid sequence KGRRAED mimicked by the WAT-homing peptide KGGRAKD. We have
shown that ANX2 and PHB are found in a protein complex present in the cell membrane lipid rafts
of both mouse and human WAT (6). We subsequently demonstrated that PHB and ANX2 are
found in complex with the fatty acid translocase CD36 and demonstrated that the ANX2-PHB
interaction supports LCFA uptake by adipocytes in cell culture (7). However, the importance of
PHB in adipose physiology still remained unclear due to the lack on in vivo adipocyte loss-of-
function models.
The ability of adipocytes in WAT to store and metabolize lipids predetermines susceptibility to
metabolic diseases (1). Visceral AT (VAT) mainly stores lipids, and its excessive expansion,
inflammation, and dysfunction in obesity is linked with the metabolic syndrome (8). In contrast,
subcutaneous AT (SAT) can protect from metabolic disease through generation of mitochondria-
rich adipocytes specialized to activate lipolysis and burn lipids through adaptive thermogenesis
Page 3 of 28
For Peer Review Only
Diabetes
4
(9). Like brown AT (BAT), beige adipocytes in SAT express the uncoupling protein 1 (UCP1),
which leaks protons to uncouple substrate oxidation from ATP synthesis (10). Both BAT and beige
adipocytes activate energy expenditure and can counteract metabolic consequences of obesity
in mice (1). A possible function of PHB in BAT has not been investigated.
Based on our previous findings (7), we hypothesized that PHB promotes LCFA uptake in WAT.
In addition, based on the known mitochondrial function of PHB (4), we also hypothesized that it
regulates metabolic activity and may be particularly important for BAT function. Here, we tested
these hypotheses by analyzing mice lacking PHB specifically in adipocytes and by using
pharmacological PHB modulators.
RESEARCH DESIGN AND METHODS
Animal Experiments
All animal experimentations were approved by the University of Texas Health Animal Care and
Use Committee. Mice were housed in the animal facility with a 12 h light/dark cycle at temperature
of 22-24°C with free access to water and diet. PHB fl/fl mice (11) and Apn-Cre mice (Jackson
Laboratories Stock 010803) were used for crosses. For DIO induction, mice were fed 58 kcal%
(fat) diet (Research Diets, D12331). Body composition was measured using EchoMRI-100T (Echo
Medical Systems). Indirect calorimetry studies were performed with OXYMAX (Columbus
Instruments) Comprehensive Lab Animal Monitoring System (CLAMS) as described previously
(12). Food intake and spontaneous locomotor activity was quantified over a 2-day time course at
the same time. The core body temperature was determined using a MicroTherma 2K High
Precision Type K Thermocouple Meter (THS-221-092, ThermoWorks)/RET-3 rectal probe
(Braintree Scientific) as described previously (12). Cold tolerance/ adaptive thermogenesis was
measured upon placing mice into environmental chamber IS33SD (Powers Scientific) as
Page 4 of 28
For Peer Review Only
Diabetes
5
described (13). For glucose tolerance test, glucose (2 g/kg body weight) was injected i.p. into
overnight-fasted mice. For insulin tolerance test, insulin (0.6 U/kg body weight) was injected i.p.
into mice fasted four hours. Blood glucose concentration was measured with a glucometer (One
Touch Ultra). Intravenous fat tolerance tests were performed by injecting overnight-fasted mice
with 100 μL of Intralipid 20% fat emulsion. Blood from tail vain was measured for triglyceride using
EnzyChromTM Triglyceride Assay Kit (BioAssay System, cat # ETGA-200). Lipolysis was induced
by i.p. injection of isoproterenol (10 mg/kg). Plasma FFA were measured with a kit from BioAssay
System (EnzyChromTM Free Fatty Assay Kit, cat # EFFA-100).
Cell lines and Culture assays
For stromal cell isolation, outer ears and SAT pads of 8-week-old mice were excised, minced and
digested in 0.5 mg/ml collagenase type I (Worthington Biochemical) and 2.5 mg/ml of dispase
Roche, cat # 04942078001) solution in a shaking bath for 1h at 37°C. The cell suspension was
filtered through a 70 µm cell strainer (Thomas Scientific, cat # 1181X53) followed by centrifugation
(360 × g, 5 min, RT). Pelleted cells were plated in 100 mm Petri dishes (p = 0) in DMEM / 10%
FBS. Brown preadipocyte cells (13) were cultured in DMEM / 10% FBS. For white adipogenesis
induction, cells grown to confluence were cultured in medium containing 1.7 µM insulin/0.5 mM
IBMX, 1 μM dexamethasone and 5 μM pioglitazone for 3 days and 1.7 µM insulin afterwards, as
described previously (12). For brown adipogenesis induction, cells grown to confluence were
cultured in medium containing 50 nM insulin/0.5 mM IBMX, 1 μM dexamethasone, 1 nM 3,5,3′-
Triiodothyronine (T3) and 5 μM rosiglitazone for 3 days, and 50 nM insulin with 1 nM T3
afterwards. For fatty acid uptake, adipocytes from differentiated ear fibroblast cells were treated
with 2 µM BODIPY-C16 for 30 min, fixed and stained with Hoechst 33258 (Invitrogen, H3569),
and imaged as described (7). LCFA uptake by adipocytes was quantified with the QBT™ Assay
(Molecular Devices) as described (7). PHB ligands (3; 14; 15) were diluted as described
previously (Jl130 at 0.1uM, Mel56 at 10uM, SA1m at 10uM) in beige adipocyte inducing medium.
Page 5 of 28
For Peer Review Only
Diabetes
6
The Seahorse XF Cell Mito Stress Test Kit (Agilent Technologies, Cat # 103015-100 ) was used
to analyze mitochondrial respiration in beige adipocytes treated with PHB inhibitors for 2 hours.
Oxygen consumption rate (OCR) was measured upon successive treatment with oligomycin
(1mM), FCCP (Carbonyl cyanide-p-trifluoromethoxyphenylhydrazone, 1mM) and rotenone /
antimycin A (0.5mM).
Quantitative real-time RT-PCR
Total RNA was extracted using the Trizol Reagent (Life Technologies, 15596018).
Complementary DNAs were generated using High-Capacity cDNA Reverse Transcription Kit
(Applied Biosystems, 4368814). PCR reactions were performed on a CFX96 Real-Time System
C1000 Touch thermal cycler (Bio-Rad) using Q-PCR Master Mix (Gendepot, Q5600-005).
Expression of mouse Phb, Ucp1, and Cox IV was normalized to 18S RNA. Primers were as
follows: Ucp1, 5′-TCTCAGCCGGCTTAATGACTG-3′ and 5′-GGCTTGCATTCTGACCTTCAC-3′;
Cox IV, 5’- CTGCCCGGAGTCTGGTAATG-3’ and 5’- CAGTCAACGTAGGGGGTCATC-3’; Phb,
5’- GCATTGGCGAGGACTATGAT-3’ and 5’- CTCTGTGAGGTCATCGCTCA-3’ and 18S RNA,
5′-AAGTCCCTGCCCTTTGTACACA-3′ and 5′-GATCCGAGGGCCTCACTAAAC-3′.
Cell and tissue analysis
Paraformaldehyde-fixed cells and formalin-fixed paraffin-embedded tissue sections were
analyzed by immunofluorescence as described previously (12). Upon blocking, primary (4°C, 12
h) and secondary (room temperature, 1 h) antibody incubations were carried out. Antibodies,
diluted in PBS with 0.05% Tween 20, were as follows: anti-UCP1 (Alpha Diagnostic, UCP-11A;
1:400); anti-PHB (Invitrogen, cat # MA5-32000, 1:100); anti-Perilipin1 (Abcam, cat # ab61682;
1:200) and pHSL (Cell Signaling, cat # 4126,1:100). Donkey Alexa 488-conjugated (1:200) and
Cy3-conjugated (1:300) IgG, were from Jackson ImmunoResearch. MitoTracker® Deep Red
Page 6 of 28
For Peer Review Only
Diabetes
7
(ThermoFisher, cat# M22426) was used (200nM) to stain live cells for 30 minutes prior to fixation.
Nuclei were stained with Hoechst 33258 (Invitrogen, H3569). Images were acquired with a
confocal Leica TCS SP5 microscope/LAS AF software (Leica) or Carl Zeiss upright Apotome Axio
Imager Z1/ZEN2 Core Imaging software. Adipocyte size was quantified by measuring cell area
with Adiposoft plugin of Image J software.
Immunoblotting
Whole-cell lysates was prepared in RIPA buffer and analyzed as described previously (12). AT
lysates were separated by SDS-PAGE and subsequently analyzed by immunoblotting. The
following antibodies were used: anti-UCP1 (Sigma, U6382; 1:5000), anti-PHB (Invitrogen, cat #
MA5-32000, 1:1000), and anti-β-actin (Abcam, ab8226; 1:5000). The signal was detected using
the Odyssey CLx imaging system (LI-COR) and quantified with Image J analysis software.
Statistical Analysis
All statistical analyses were performed with GraphPad Prism 6 software. Experimental results are
shown as mean +/- SEM. Two-tailed Student unpaired t tests were performed to littermates unless
otherwise indicated. P<0.05 was considered significant.
Data Sharing Statement: additional data and critical resources supporting the reported findings,
methods, and conclusions will be available upon request.
RESULTS
Adipose tissue abnormality in mice with PHB-KO adipocytes
To create a model with a knock-out (KO) of PHB in adipocytes, we used an Adiponectin-Cre (Apn-
Cre) strain with adipocyte-specific Cre expression (16). We crossed it with the Phb1fl/fl strain (11)
Page 7 of 28
For Peer Review Only
Diabetes
8
in which the Phb gene is flanked by loxP recombination sites. Apn-Cre;Phbfl/fl (PHB adipo-KO)
and Cre-negative Phbfl/fl (WT) littermates were then compared. PHB knockout was confirmed by
western blot on extracts from WAT and BAT, which demonstrated a marked reduction in protein
expression (Fig. 1A). Residual expression remained as expected due to PHB expression in other
cell types (stroma, endothelium and leukocytes). We then phenotyped male PHB adipo-KO and
WT littermates. EchoMRI analysis demonstrated a reduced fat body mass accumulation in KO
mice (Fig.1B), which by 3 months of age was detectable for males and females (Fig.1 A). While
high fat diet (HFD) feeding expectedly induced obesity development in WT mice (Fig.1 B), the KO
littermates failed to increase adiposity (Fig. 1C). Analysis of internal organs demonstrated both
subcutaneous and visceral lipodystrophy in PHB Ad-KO males (Fig. 1D) and females (Fig. S1B).
There was no significant effect of PHB adipo-KO on lean body mass (Fig. 1C), as well as on
appetite (Fig. S1C) or locomotor activity (Fig. S1D). Analysis of haematoxylin / eosin (H&E)-
stained WAT sections revealed that PHB Ad-KO mice have significantly larger adipocytes in both
VAT and SAT, compared to WT littermates (Fig. 1E; Fig. S1E). To investigate how PHB loss
affects lipid droplets, we induced adipogenesis in stromal cells isolated from mouse SAT and
ears. Lipid-laden adipocytes differentiated from cells of both WT and PHB Ad-KO mice (Fig. S1F),
and there was no difference in adipogenesis marker expression (Fig. S1G). However, consistent
with a previous report (17), knockout of Phb gene in 3T3-L1 preadipocytes (Fig. S1H) resulted in
an inhibition of adipogenic transcription program (Fig. S1I) and delayed lipid droplet accumulation
(Fig. S1J). This indicates that, while PHB regulates adipogenesis, its deletion in mature
adipocytes PHB Ad-KO mice does not preclude lipid droplet maintenance. Consistent with WAT
adipocyte hypertrophy, cultured PHB Ad-KO adipocytes, confirmed to lack PHB by
immunofluorescence (FL), accumulated lipid droplets that tended to be larger than in WT
adipocytes (Fig. 1F). This indicated that PHB also plays a role in lipid droplet maintenance post-
adipogenesis.
Page 8 of 28
For Peer Review Only
Diabetes
9
Lipid metabolism in PHB ad-KO mice
To find an explanation to the WAT phenotype of PHB Ad-KO mice, we analyzed lipid metabolism.
First we analyzed cultured adipocytes for the ability to uptake a fluorophore-labeled palmitic acid,
BODIPY-C16 FA. This revealed a marked defect of PHB-null adipocytes to uptake LCFA (Fig. 2A).
Quantification of this defect was performed by the QBT assay with a fluorophore-labeled fatty
acid. This conformed efficiency of insulin-induced LCFA uptake by PHB-null adipocytes (Fig. 2B).
To confirm these findings in vivo, we performed a lipid tolerance test on mice. Upon iv LCFA
infusion, the time course of triglyceride blood concentration demonstrated a delay in clearance
for PHB Ad-KO littermates compared to WT (Fig. 2C). Consistent with reduced LCFA uptake,
indirect calorimetry analysis of mice in metabolic chambers demonstrated that PHB Ad-KO mice
had increased respiratory exchange ratio (RER) (Fig. 2D), indicating lower utilization of lipid as
energy source. Non-fasting circulating FFA levels were found to be higher in PHB Ad-KO
littermates, consistent with a decreased ability of adipocytes to uptake and utilize them (Fig. 2E).
Liver histopathology revealed steatosis in PHB-Ad KO mice (Fig. S2A). Triglyceride content was
also quantified and found significantly higher for both liver and skeletal muscle of PHB-Ad KO
mice (Fig. S2B). This indicates that inefficient adipocyte fatty acid uptake in these mice results in
increased ectopic lipid deposition.
As a potential mechanistic explanation for the increased adipocyte size despite a decrease in
LCFA uptake, we investigated lipolysis. Upon its induction by injection of a β-adrenergic agonist
isoproterenol, circulating FFA levels were expectedly increased in WT mice. In contrast to WT
mice, the induction by isoproterenol was not observed in PHB Ad-KO littermates (Fig. 2E).
Consistent with this, phosphorylated (activated) hormone-sensitive lipase (pHSL) expression was
virtually undetectable in both white and brown adipocytes of PHB Ad-KO mice (Fig. 2F). Because
HSL is phosphorylated by protein kinase A (PKA), we measured PKA activity with phospho-PKA
substrate antibodies. Our data indicate relatively low PKA activity in SAT, VAT, and BAT of PHB-
Page 9 of 28
For Peer Review Only
Diabetes
10
KO AT mice, elucidating the mechanism for reduced lipolysis (Fig. S2C). This indicates that PHB-
KO adipocyte hypertrophy results from a lipolysis defect.
Glucose metabolism in PHB ad-KO mice
RER increase observed in male (Fig. 2D) and female (Fig. S3A) PHB Ad-KO mice suggested
their switch to glucose as the main energy substrate. In accord with this, IF analysis expression
of a glucose transporter GLUT1 was found to be higher in WAT and BAT, as well as in liver and
skeletal muscle of PHB Ad-KO mice (Fig. S3B). There was a trend for higher non-fasting glucose
levels in PHB Ad-KO male littermates, suggesting an increase in gluconeogenesis (Fig. S3C).
Analysis of male mice raised on chow did not reveal a difference in fasting glucose clearance
rates (Fig. S3D). Analysis of PHB Ad-KO females raised on chow also revealed increased steady-
state glucose levels and normal fasting glucose clearance (Fig. S3F-G). Interestingly, upon HFD
feeding PHB Ad-KO mice displayed a higher glucose tolerance than WT littermates (Fig. 2G).
However, both male and female PHB Ad-KO littermates displayed a significantly lower insulin
tolerance when raised not only on HFD (Fig. 2H) but also on chow (Fig. S3E; Fig. S3H).
Combined, our data indicate that adipocyte PHB deficiency leads to systemic upregulation of
glucose metabolism and insulin resistance.
Brown AT and adaptive thermogenesis in PHB ad-KO mice
Thermogenic activity of BAT relies on both lipolysis and mitochondrial function. Based on the
lipolysis defect revealed here (Fig. 2E-F) and previous PHB implication in mitochondrial
biogenesis (4), we analyzed BAT. Interscapular AT was drastically smaller in both male and
female PHB Ad-KO mice, compared to WT littermates (Fig. 3A). Its WAT-like appearance
indicated a lower mitochondrial content. H&E-staining of interscapular AT sections confirmed its
whitening in PHB Ad-KO mice (Fig. 3B), with larger lipid droplets being consistent with deficient
lipolysis. Western blotting of protein extracts demonstrated that UCP1 expression in BAT of PHB
Page 10 of 28
For Peer Review Only
Diabetes
11
Ad-KO mice was undetectable (Fig. 3C). As expected for the lack of this key uncoupling protein,
core body temperature measurement in mice placed at 4C, indicated a significantly reduced cold
tolerance of PHB Ad-KO males (Fig. 3D) and females (Fig. S4A). Consistent with this, oxygen
consumption measured by indirect calorimetry revealed a reduction nighttime and daytime energy
expenditure in PHB Ad-KO males (Fig. 3E) and females (Fig. S4B).
Mitochondrial dysfunction in PHB-KO adipocytes
In addition to UCP1 expression loss in BAT, RT-PCR analysis revealed lower Cox IV gene
expression in PHB Ad-KO BAT and WAT (Fig. S4C). Reduction in this nuclear-encoded enzyme
essential for electron transport may account for mitochondrial dysfunction. In addition, there was
a significant reduction of mitochondrial content in both BAT and WAT (Fig. S4D). We used a cell
culture model to investigate the consequences of mitochondrial defect in PHB-KO adipocytes.
UCP1 expression was observed in WT but not in PHB-KO brown adipocytes differentiated from
stromal cells (Fig. 3F-G). Notably, differentiated PHB-KO cells had larger lipid droplets, indicative
of them differentiating into white rather than brown adipocytes (Fig. 3F-G). The Seahorse XF Cell
Mito Stress Assay was then performed on these cells to analyze mitochondrial respiration. Lower
basal and induced oxygen consumption rate (OCR) revealed a defect in mitochondrial respiration
of PHB-KO adipocytes (Fig. 3H). Consistent with the lack of UCP1, oligomycin-resistant OCR was
lower in PHB-KO adipocytes, indicating a decreased proton leak (Fig. 3I). Importantly,
extracellular acidification rate (ECAR), measured by the XF Cell Mito Stress Assay, was found to
be significantly higher for PHB-KO adipocytes (Fig. S4E). These data indicate that the cells switch
from mitochondria-dependent oxidative phosphorylation to glycolysis in the absence of PHB.
Pharmacological PHB targeting block with brown adipocyte differentiation and function
Finally, we investigated the involvement of PHB in different aspects of brown adipocyte biology.
We used mouse immortalized brown preadipocytes (IBP) (13) induced to undergo brown
adipogenesis. For PHB targeting, we used the previously characterized PHB small molecule
Page 11 of 28
For Peer Review Only
Diabetes
12
ligands JI130, Mel56, and SA1m (3; 14; 15). Treatment of preadipocytes during adipogenesis
induction did not interfere with differentiation, as evident from lipid droplet formation (Fig. 4A).
However, MitoTracker staining revealed a notably lower signal in cells treated with each PHB
ligand, compared to control adipocytes (Fig. 4A). This indicated that PHB is important for
mitochondrial biogenesis in brown adipocytes. Consistent with this, Seahorse Real-time ATP Rate
Assay demonstrated a decrease in mitochondrial respiration (Fig. S5A) and in extracellular
acidification (Fig. S5B), with JI130 having the strongest effect compared to the other two PHB
small molecules. There was also a shift to glycolytic ATP production (Fig. S5C) and a decrease
in uncoupled respiration (Fig. S5D) in treated cells. We then treated IBP-derived adipocytes with
the same PHB modulators after the completion of brown differentiation. The Seahorse XF Cell
Mito Stress Assay revealed that JI130 strongly decreased both basal and induced OCR, while
Mel56 and SA1m also had lower effects (Fig. 4B). All three compounds significantly decreased
proton leak, as well as spare respiration capacity (Fig. 4C). However, neither compound
significantly affected ATP production, confirming that cells switch from mitochondria-dependent
oxidative phosphorylation to glycolysis in the absence of PHB.
DISCUSSION
Our analysis of PHB adipo-KO mice reveals their defect in fat mass accumulation despite normal
food intake. Adipocyte hypoplasia accounts for this lipodystrophy because adipocyte size is
increased in WAT of PHB adipo-KO mice. While we confirm the previously reported (17)
requirement of PHB for initiation of adipogenesis, in PHB adipo-KO mice adipocytes differentiate
normally because PHB deletion is driven by expression of Apn, a late adipogenesis gene. Our
data show that inactivation of PHB post-adipogenesis leads to hypertrophy of mature adipocytes
due to a reduction in PKA and HSL activity resulting in decreased lipolysis. This could be
explained by reduced activity of adrenergic receptors in “whitened” PHB-deficient adipocytes
because PKA activity is regulated by cAMP, downstream of GPCR activation. Although PHB Ad-
Page 12 of 28
For Peer Review Only
Diabetes
13
KO mice do not display glucose intolerance, both males and females have incresed levels of
blood glucose and are insulin resistant. Diabetes development in these mice occurs despite a
systemic increase in glucose transprter expression. Our results indicate that the drastic
disbalance in substrate utilization in PHB Ad-KO mice is due to their lipid intolerance. This is
supported by the notion that PHB Ad-KO mice fed HFD clear glucose better than WT mice,
suggesting that increased lipid load further boosts glucose utilization. Lipid intolerance of PHB
Ad-KO mice, resulting in steatosis, could be explained by a decreased capacity of adipocytes for
LCFA uptake, LCFA oxidation, or both. By using cell culture models, we demonstrate a defect in
lipid uptake by PHB-KO adipocytes. This is consistent with the phenotypes reported for CD36 KO
(18) and ANX2 KO (7) mice. Our data confirms that PHB, in complex with CD36, regulates FA
uptake and contributes to lipid accumulation in AT.
As expected, the metabolic consequences of adipocyte PHB overexpression (4) are opposite to
the phenotype we describe in PHB Ad-KO mice. Importantly, our data reveals a previously
unappreciated function of PHB in brown adipocytes, pointing to the role of PHB in fatty acid
oxidation. A marked defect in BAT observed in PHB Ad-KO mice results in their cold-intolerance
and reduced energy expenditure. The reduced mitochondrial content in AT of PHB Ad-KO mice
is consistent with our results from PHB-KO cells, as well as WT cells treated with PHB ligands.
The apparent role of PHB in mitochondrial biogenesis and function is consistent with results from
PHB overexpression models (4). We show that, brown adipocytes lacking PHB have a decreased
proton leak, consistent with a reduced UCP1 protein expression. PHB-null cells also have lower
mitochondrial respiration, consistent with a reduced expression of mitochondrial transporter Cox
IV. Upon treatment of differentiated brown adipocytes with pharmacological PHB modulators, a
decrease in mitochondrial respiration and uncoupling was similarly observed. Importantly,
glycolysis was induced in PHB-KO or PHB-inhibited adipocytes in compensation for the oxidative
defect. Combined, our results demonstrate that PHB in adipocytes is essential for normal lipid
Page 13 of 28
For Peer Review Only
Diabetes
14
metabolism and adaptive thermogenesis, and that its adipocyte dysfunction derails AT function,
energy substrate utilization, and leads to metabolic dysfunction.
Our previous studies discovered that PHB is expressed on the surface of adipocytes and
endothelial cells selectively in AT. We have used a PHB-homing peptide, KGGRAKD, to direct an
apoptosis-inducing peptide D(KLAKLAK)2 to WAT in an experimental approach to obesity reversal
(5). WAT vascular-targeting capacity of the hunter-killer CKGGRAKDC-D(KLAKLAK)2 peptide has
been validated in mouse, rat, and non-human primates, has shown to have anti-obesity effects
(19; 20). This study suggests a possibility that the anti-obesity effect could result in part due to
the loss of PHB function executed by cells expressing it in adipose tissues.
Acknowledgments. The authors thank Shelly Lu for providing Phb1fl/fl mice.
Funding. This work was supported by NIH grant 2R01DK088131 to MGK.
Duality of Interest. No potential conflicts of interest relevant to this article were reported.
Authors Contributions. M.G.K. Z.G. and L.D. conceived / designed the experiments, analyzed
data, and wrote the manuscript; Z.G., A.C.D., A.D. and C.F. designed and performed the
experiments, analyzed data, and edited the manuscript. M.G.K. is the guarantor of this work and,
as such, had full access to all the data in the study and takes responsibility for the integrity of the
data and the accuracy of the data. Guarantor: M.G.K.
References
1. Rosen ED, Spiegelman BM: What we talk about when we talk about fat. Cell 2014;156:20-44
2. Ande SR, Nguyen KH, Nyomba BLG, Mishra S: Prohibitin in Adipose and Immune Functions.
Trends Endocrinol Metab 2016;27:531-541
Page 14 of 28
For Peer Review Only
Diabetes
15
3. Wang D, Tabti R, Elderwish S, Abou-Hamdan H, Djehal A, Yu P, Yurugi H, Rajalingam K, Nebigil
CG, Desaubry L: Prohibitin ligands: a growing armamentarium to tackle cancers, osteoporosis,
inflammatory, cardiac and neurological diseases. Cell Mol Life Sci 2020;77:3525-3546
4. Ande SR, Nguyen KH, Padilla-Meier GP, Wahida W, Nyomba BL, Mishra S: Prohibitin
overexpression in adipocytes induces mitochondrial biogenesis, leads to obesity development, and
affects glucose homeostasis in a sex-specific manner. Diabetes 2014;63:3734-3741
5. Kolonin MG, Saha PK, Chan L, Pasqualini R, Arap W: Reversal of obesity by targeted ablation of
adipose tissue. Nature Med 2004;10:625-632
6. Staquicini FI, Cardo-Vila M, Kolonin MG, Trepel M, Edwards JK, Nunes DN, Sergeeva A,
Efstathiou E, Sun J, Almeida NF, Tu SM, Botz GH, Wallace MJ, O'Connell DJ, Krajewski S,
Gershenwald JE, Molldrem JJ, Flamm AL, Koivunen E, Pentz RD, Dias-Neto E, Setubal JC, Cahill
DJ, Troncoso P, Do KA, Logothetis CJ, Sidman RL, Pasqualini R, Arap W: Vascular ligand-receptor
mapping by direct combinatorial selection in cancer patients. Proc Natl Acad Sci USA
2011;108:18637-18642
7. Salameh A, Daquinag AC, An Z, K. H, Pasqualini R, Arap W, Kolonin MG: Prohibitin/annexin 2
interaction regulates fatty acid transport in adipose tissue. JCI Insight 2016;1:86351-86357
8. Sun K, Tordjman J, Clement K, Scherer PE: Fibrosis and adipose tissue dysfunction. Cell Metab
2013;18:470-477
9. Kajimura S, Spiegelman BM, Seale P: Brown and Beige Fat: Physiological Roles beyond Heat
Generation. Cell Metab 2015;22:546-559
10. Cannon B, Nedergaard J: Brown adipose tissue: function and physiological significance. Physiol
Rev 2004;84:277-359
11. Ko KS, Tomasi ML, Iglesias-Ara A, French BA, French SW, Ramani K, Lozano JJ, Oh P, He L,
Stiles BL, Li TW, Yang H, Martinez-Chantar ML, Mato JM, Lu SC: Liver-specific deletion of prohibitin
1 results in spontaneous liver injury, fibrosis, and hepatocellular carcinoma in mice. Hepatology
2010;52:2096-2108
Page 15 of 28
For Peer Review Only
Diabetes

16
12. Gao Z, Daquinag AC, Fussell C, Zhao Z, Dai Y, Rivera A, Snyder BE, Eckel-Mahan KL, Kolonin
MG: Age-associated telomere attrition in adipocyte progenitors predisposes to metabolic disease.
Nat Metab 2020;2:1482-1497
13. Gao Z, Daquinag AC, Su F, Snyder B, Kolonin MG: PDGFRalpha / PDGFRbeta signaling
balance modulates progenitor cell differentiation into white and beige adipocytes. Development
2018;145:1-13
14. Djehal A, Krayem M, Najem A, Hammoud H, Cresteil T, Nebigil CG, Wang D, Yu P, Bentouhami
E, Ghanem GE, Desaubry L: Targeting prohibitin with small molecules to promote melanogenesis
and apoptosis in melanoma cells. Eur J Med Chem 2018;155:880-888
15. Perron A, Nishikawa Y, Iwata J, Shimojo H, Takaya J, Kobayashi K, Imayoshi I, Mbenza NM,
Takenoya M, Kageyama R, Kodama Y, Uesugi M: Small-molecule screening yields a compound that
inhibits the cancer-associated transcription factor Hes1 via the PHB2 chaperone. The Journal of
biological chemistry 2018;293:8285-8294
16. Eguchi J, Wang X, Yu S, Kershaw EE, Chiu PC, Dushay J, Estall JL, Klein U, Maratos-Flier E,
Rosen ED: Transcriptional control of adipose lipid handling by IRF4. Cell Metab 2011;13:249-259
17. Ande SR, Xu Z, Gu Y, Mishra S: Prohibitin has an important role in adipocyte differentiation. Int
J Obes 2012;36:1236-1244
18. Febbraio M, Abumrad NA, Hajjar DP, Sharma K, Cheng W, Pearce SF, Silverstein RL: A null
mutation in murine CD36 reveals an important role in fatty acid and lipoprotein metabolism. J
BiolChem 1999;274:19055-19062
19. Barnhart KF, Christianson DR, Hanley PW, Driessen WH, Bernacky BJ, Baze WB, Wen S, Tian
M, Ma J, Kolonin MG, Saha PK, Do KA, Hulvat JF, Gelovani JG, Chan L, Arap W, Pasqualini R: A
peptidomimetic targeting white fat causes weight loss and improved insulin resistance in obese
monkeys. Sci Transl Med 2011;3:108-112
20. Kim DH, Woods SC, Seeley RJ: Peptide designed to elicit apoptosis in adipose tissue
endothelium reduces food intake and body weight. Diabetes 2010;59:907-915
Page 16 of 28
For Peer Review Only
Diabetes
17
Figure Legends
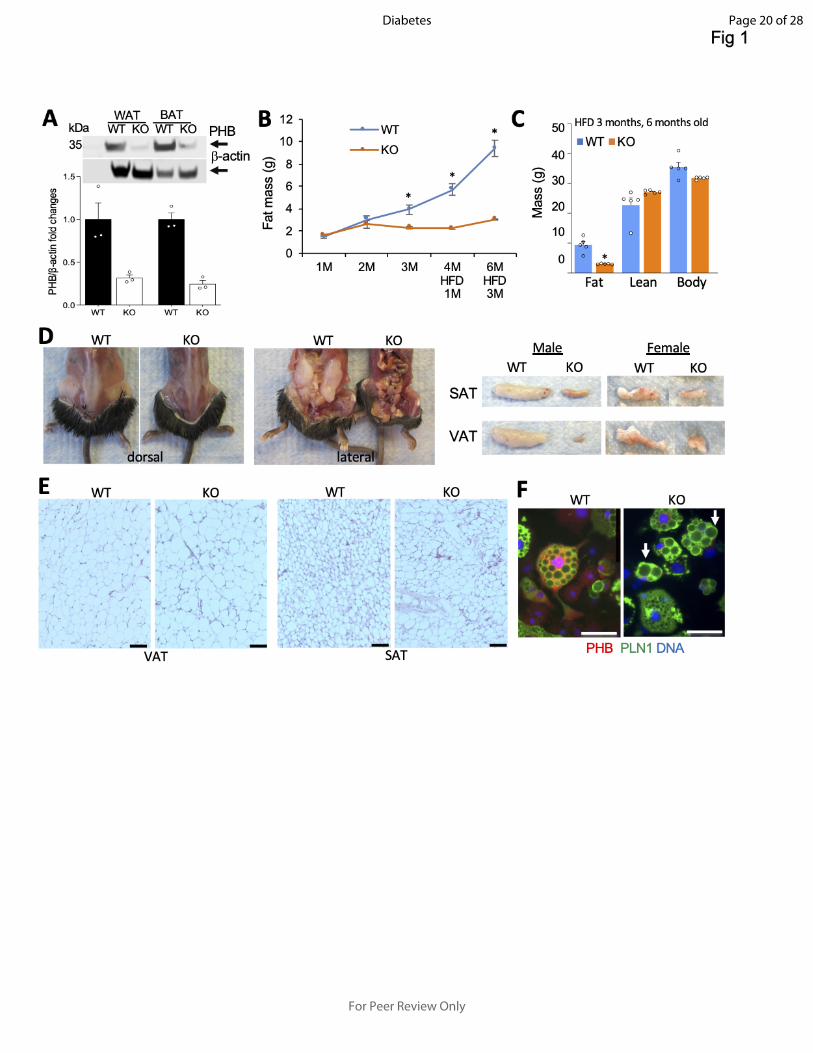
Figure 1- Adipocyte PHB KO mice are lipodystrophic despite adipocyte hypertrophy. A: Western
blotting on extracts from WAT and BAT confirms the loss of PHB expression in PHB Ad-KO male
mice, as compared to WT littermates. Actin immunoblotting: loading control. Graph: band intensity
quantification. B: EchoMRI measurements on male mice raised for 3 months on chow and 3
months of HFD reveals reduced fat mass accumulation in PHB Ad-KO littermates. N=5 mice. C:
EchoMRI measurements on male mice from B show a lack of difference in lean body mass. D:
Images demonstrating subcutaneous and visceral lipodystrophy in PHB Ad-KO male littermates.
Resected SAT and VAT (one side) are compared on the right for males and females. E: H&E-
staining of sections reveals larger adipocytes in VAT and SAT of PHB Ad-KO male mice,
compared to WT littermates. F: Ear-derived fibroblasts subjected to white adipogenesis for 8 days
demonstrate accumulation of large lipid droplets (arrows) in PHB Ad-KO adipocytes. IF shows
that PHB expression is lost in PHB Ad-KO adipocytes expressing perilipin-1 (PLN1). In all panels,
plotted are mean ± SEM; *P<0.05 (Student’s t-test). Scale bar: 50 µm.
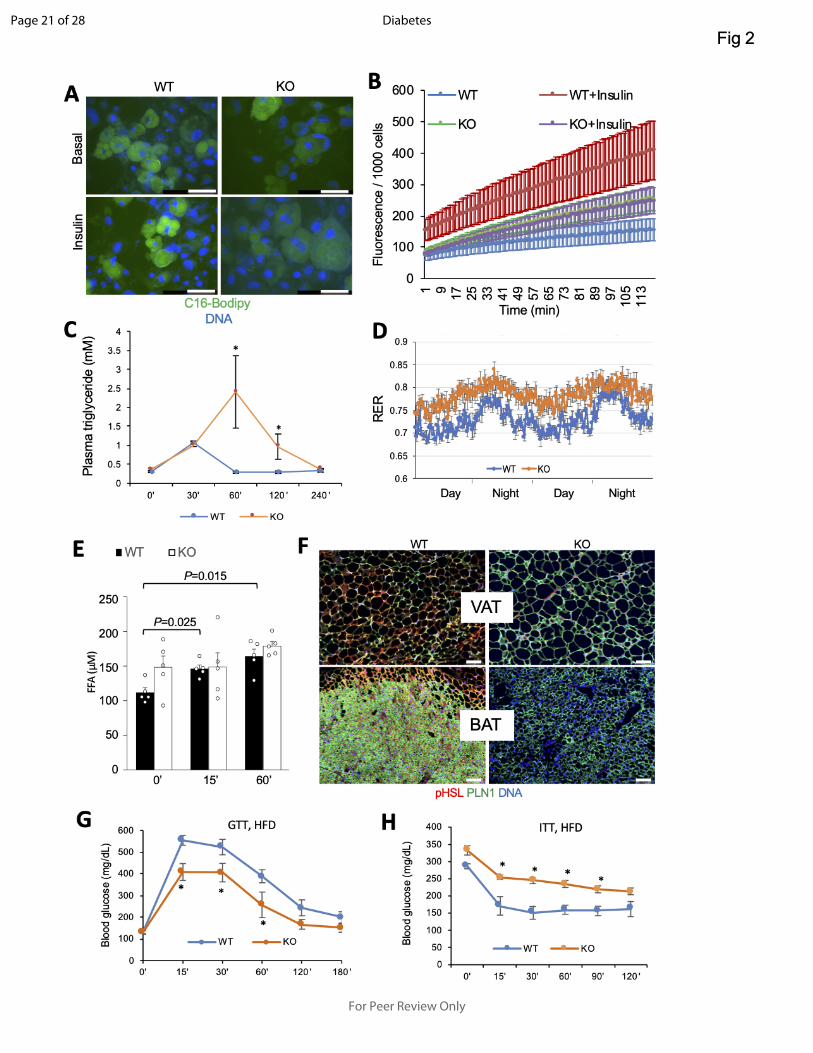
Figure 2- Lipid metabolism defect and insulin resistance in adipocyte PHB KO mice. A: Uptake
of BODIPY-C16 FA (green) added to cell culture medium (2uM) by WT and PHB-null adipocytes
non-stimulated or stimulated with insulin (200nM). B: QBT assay demonstrating that insulin-
induced LCFA uptake by PHB-null adipocytes is significantly lower than by WT adipocytes. N=5
wells. C: Triglyceride blood concentration analysis upon iv Intralipid infusion into pre-starved mice
shows a delay in clearance for PHB Ad-KO littermates compared to WT (N=6). D: Respiratory
exchange ratio (RER) measured by indirect calorimetry over 2 days demonstrates an increase in
Page 17 of 28
For Peer Review Only
Diabetes
18
PHB Ad-KO male mice. E: Plasma concentration of FFA after isoproterenol injection, elevated at
baseline and not further induced in PHB Ad-KO mice (N=5). F: IF on VAT and BAT sections
reveals lower expression of phosphorylated hormone-sensitive lipase (pHSL) in adipocytes
(expressing perilipin-1). G: Glucose tolerance test (GTT) in male mice raised on HFD. After o/n
fasting, littermates (N=5) were injected with glucose (1 g/kg body weight) i.p. and glucose in blood
was measured. H: Insulin tolerance test (ITT) in male mice raised on HFD. After 4 hr fasting,
littermates (N=5) were injected with insulin (0.6 U/kg body weight) i.p. and glucose in blood was
measured. In all panels, plotted are mean ± SEM; *P<0.05 (Student’s t-test). Scale bar: 50 µm.
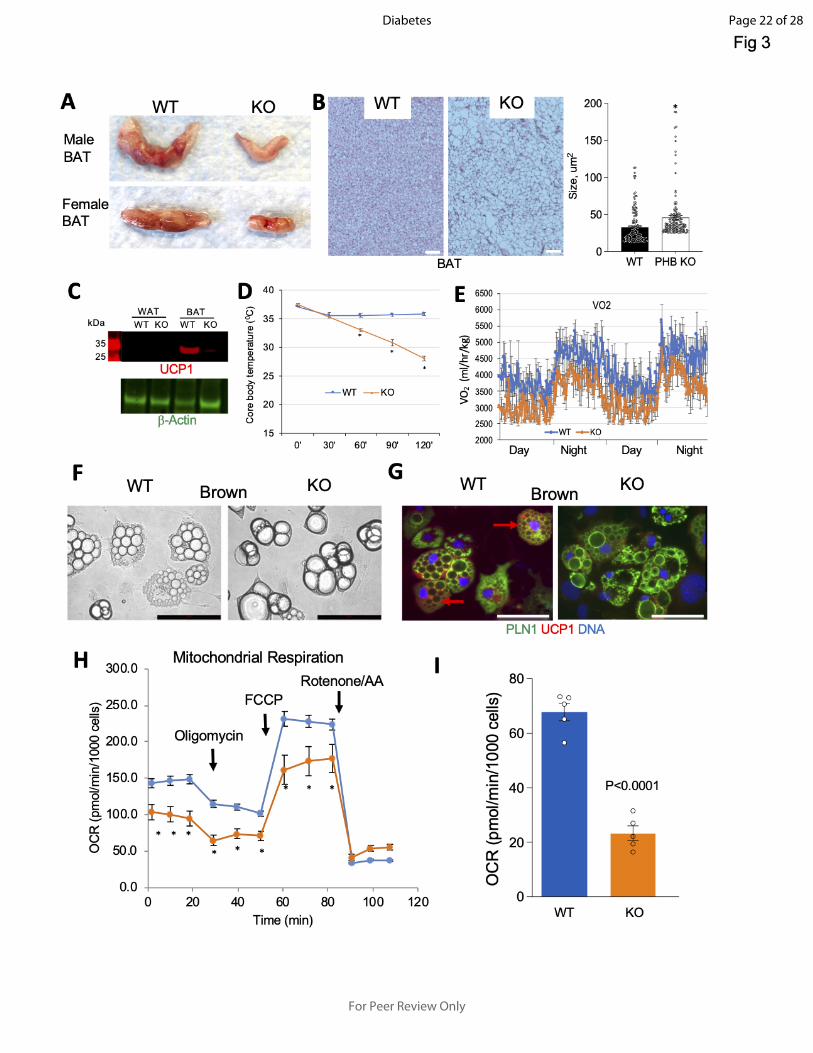
Figure 3- BAT adaptive thermogenesis defect in PHB Ad-KO mice. A: appearance of resected
interscapular BAT in WT and PHB Ad-KO male and female littermates. B: H&E-staining of
sectioned BAT from WT and PHB Ad-KO littermates. Graph: adipocyte size quantification. C:
Western blotting on extracts from WAT and BAT demonstrates the loss of UCP1 expression in
BAT of PHB Ad-KO mice. Actin immunoblotting: loading control. D: Body temperature
maintenance in mice placed at 4oC, indicating reduced cold tolerance of PHB Ad-KO mice (N=5).
E: Indirect calorimetry data showing reduced oxygen consumption by PHB Ad-KO mice. F: Ear-
derived fibroblasts subjected to brown adipogenesis for 8 days demonstrate accumulation of
larger lipid droplets (arrows) in PHB-KO adipocytes. G: IF on cells from F shows that UCP1
expression (arrows) is not induced in PHB Ad-KO adipocytes expressing perilipin-1 (PLN1). H-I:
XF Cell Mito Stress assay used to analyze mitochondrial respiration in cells from PHB Ad-KO and
WT mice subjected to brown adipogenesis. Oxygen consumption rate (OCR), measured upon
successive treatment with oligomycin, FCCP (Carbonyl cyanide-p-
trifluoromethoxyphenylhydrazone) and rotenone / antimycin A, demonstrates lower basal and
induced mitochondrial function in PHB-KO adipocytes. I: oligomycin-resistant OCR, reflecting
ATP-uncoupled respiration, is lower in PHB-KO adipocytes. In all panels, plotted are mean ±
SEM; *P<0.05 (Student’s t-test). Scale bar: 50 µm.
Page 18 of 28
For Peer Review Only
Diabetes
19
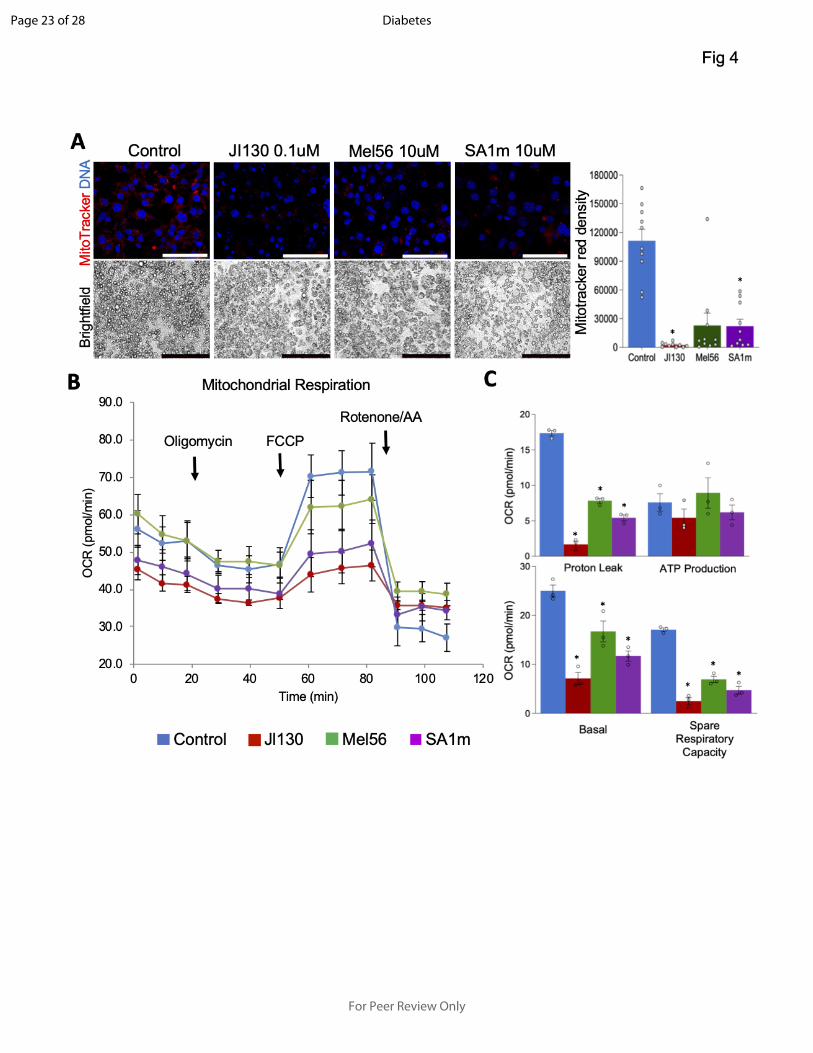
Figure 4- PHB modulators suppress mitochondrial respiration and uncoupling.
A: Mouse brown preadipocytes were treated with indicated PHB ligands during brown
adipogenesis induction for 8 days. Brightfield images demonstrate comparable adipocyte
differentiation in control and treated cells. MitoTracker staining reveals lower mitochondrial
activity in adipocytes upon PHB modulator treatment. Graph: red fluorescence quantification.
Scale bar: 50 µm. B: Mouse brown preadipocytes were induced to undergo brown adipogenesis
for 8 days and then treated with indicated PHB ligands. Seahorse XFe24 / Flux Assay
demonstrates a decrease of mitochondrial respiration upon treatment with each PHB modulator.
C: Analysis of data from B revealing a decrease in basal and spare respiration and in uncoupling,
but not in ATP production, upon treatment with each PHB modulator. Plotted are mean ± SEM;
*P<0.05 (Student’s t-test).
Page 19 of 28
For Peer Review Only
Diabetes
Page 20 of 28
For Peer Review Only
Diabetes
Page 21 of 28
For Peer Review Only
Diabetes
Page 22 of 28
For Peer Review Only
Diabetes
Page 23 of 28
For Peer Review Only
Diabetes
A BFig S1
0200400600800
1000120014001600
1 10 19 28 37 46 55 64 73 82 91 100
109
118
127
136
145
154
163
172
181
190
199
208
217
WT Apn-cre;Phb KO
day Night Day night
X-Co
unts
0
50
100
150
200
250
300
350
Chow HFD
WT KO
Bloo
dgl
ucos
e(m
g/dL
)
ANX2
PHB
37
25
kDa
WT KOWT KO
H J
8 week old 14 week old
0
1
2
3
4
5
Fig S1a food intake
Gra
m/m
ouse
/day
Chow HFD
WT KO WT KO
3T3-L1
0.0
0.5
1.0
1.5
2.0
SVF ear FB day3
Rel
ativ
em
RN
A(K
O/W
T)
WTKO
SVF ear fb SVF ear fb SVF ear fb
aP2 adiponectin Phb
0.0
0.2
0.4
0.6
0.8
1.0
1.2
SVF ear FB day5
Rel
ativ
em
RN
A(K
O/W
T)
SVF ear fb SVF ear fb SVF ear fb
aP2 adiponectin Phb
Day
10D
ay3
F GSVF WT SVF KO ear WT ear KO
D
C
WT KO
lateral
dorsal
Female
0
1
2
3
4
Diabetes Female fat mass
Fatm
ass
(gra
m)
1M 2M 3M
WTKO
0
5
10
15
20
25
Phb female BW
Body
wig
ht(g
ram
)
1M 2M 3M
Female
0
1
2
3
4
Diabetes Female fat mass
Fatm
ass
(gra
m)
1M 2M 3M
WTKO
0
5
10
15
20
25
Phb female BWBo
dyw
ight
(gra
m)
1M 2M 3M
0.0
0.2
0.4
0.6
0.8
1.0
1.2
3T3 PHB differentiation qPCR
Rel
ativ
em
RN
Aex
pres
sion
Phb Pparγ aP2 adiponectin0.0
0.2
0.4
0.6
0.8
1.0
1.2
3T3 PHB differentiation qPCR
Rel
ativ
em
RN
Aex
pres
sion
Phb Pparγ aP2 adiponectin
I
E
G
F
80
100
120
140
160
180
200
0' 15' 60'
WT KO
P=0.015E
FFA
(uM
)
P=0.025
** * *
E*
SAT VAT*
WT PHB KO400
600
800
1000
1200
Size
,um
2
WT PHB KO400
600
800
1000
1200
Size
,um
2
WT KO WT KO
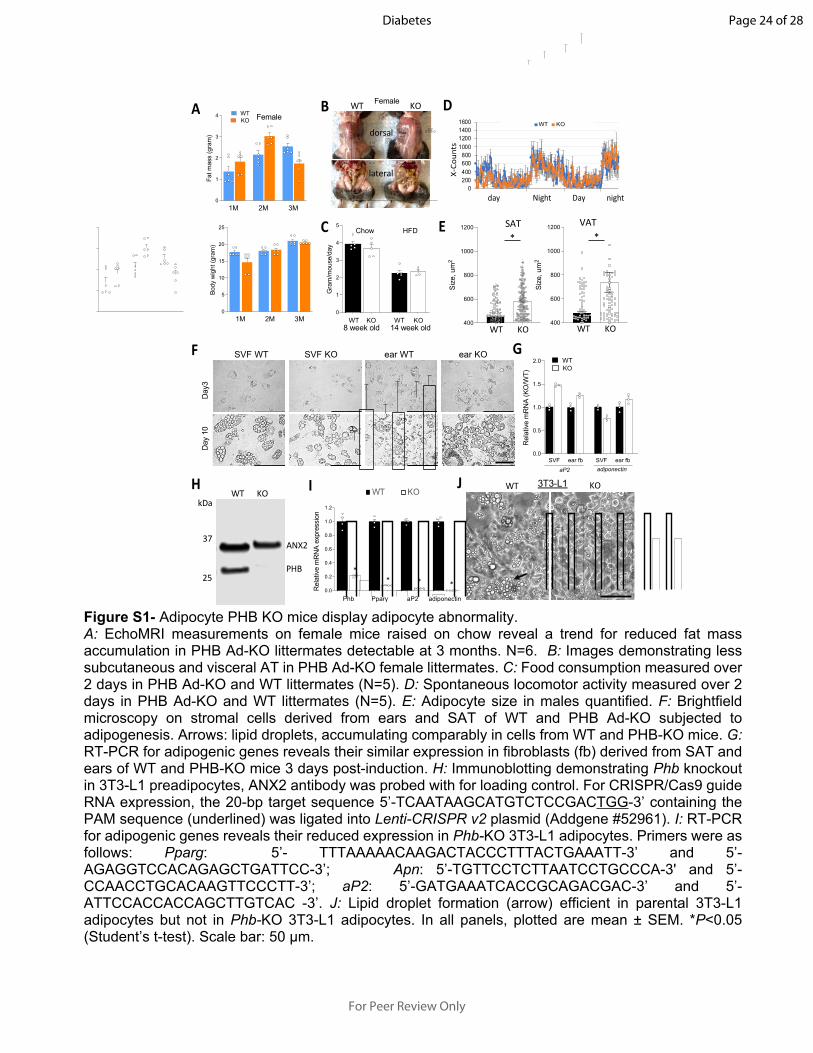
Figure S1- Adipocyte PHB KO mice display adipocyte abnormality.A: EchoMRI measurements on female mice raised on chow reveal a trend for reduced fat mass accumulation in PHB Ad-KO littermates detectable at 3 months. N=6. B: Images demonstrating less subcutaneous and visceral AT in PHB Ad-KO female littermates. C: Food consumption measured over 2 days in PHB Ad-KO and WT littermates (N=5). D: Spontaneous locomotor activity measured over 2 days in PHB Ad-KO and WT littermates (N=5). E: Adipocyte size in males quantified. F: Brightfield microscopy on stromal cells derived from ears and SAT of WT and PHB Ad-KO subjected to adipogenesis. Arrows: lipid droplets, accumulating comparably in cells from WT and PHB-KO mice. G: RT-PCR for adipogenic genes reveals their similar expression in fibroblasts (fb) derived from SAT and ears of WT and PHB-KO mice 3 days post-induction. H: Immunoblotting demonstrating Phb knockout in 3T3-L1 preadipocytes, ANX2 antibody was probed with for loading control. For CRISPR/Cas9 guide RNA expression, the 20-bp target sequence 5’-TCAATAAGCATGTCTCCGACTGG-3’ containing the PAM sequence (underlined) was ligated into Lenti-CRISPR v2 plasmid (Addgene #52961). I: RT-PCR for adipogenic genes reveals their reduced expression in Phb-KO 3T3-L1 adipocytes. Primers were as follows: Pparg: 5’- TTTAAAAACAAGACTACCCTTTACTGAAATT-3’ and 5’-AGAGGTCCACAGAGCTGATTCC-3’; Apn: 5’-TGTTCCTCTTAATCCTGCCCA-3' and 5’- CCAACCTGCACAAGTTCCCTT-3’; aP2: 5’-GATGAAATCACCGCAGACGAC-3’ and 5’-ATTCCACCACCAGCTTGTCAC -3’. J: Lipid droplet formation (arrow) efficient in parental 3T3-L1 adipocytes but not in Phb-KO 3T3-L1 adipocytes. In all panels, plotted are mean ± SEM. *P<0.05 (Student’s t-test). Scale bar: 50 µm.
Page 24 of 28
For Peer Review Only
Diabetes

2
C
WT
KO
pPKA PLN1 DNA
SAT VAT BAT
Fig S2
KOWT
TAG
(ug/
100m
gtis
sue) Liver
A B
*
*
0
100
200
300
400
500
600
700
800
900
Trig
lyce
ride
(ug/
100m
gtis
sue)
WT KO
0
20
40
60
80
100
120
Muscle TAG
Trig
lyce
ride
(ug/
100m
gtis
sue)
Liver TAG
*
*
0
100
200
300
400
500
600
700
800
900
Trig
lyce
ride
(ug/
100m
gtis
sue)
WT KO
0
20
40
60
80
100
120
Muscle TAG
Trig
lyce
ride
(ug/
100m
gtis
sue)
Liver TAG
Muscle
WT KOMasson’s Trichrome
WT KO
Figure S2- Lipid metabolism disbalance in PHB Ad-KO mice. A: Masson’s trichrome staining reveals lipid droplet deposition in livers of PHB Ad-KO mice. B: Measurement of extracted triglycerides used for quantification of ectopic lipid deposition in livers and gastrocnemius muscle of Ad-KO mice. EnzyChrom™ Triglyceride Assay Kit from BioAssay System (ETGA-200) was used. C: IF analysis of PKA substrate phosphorylation (antibody from CellSignaling, Cat. #9621, 1:100) in adipocytes of SAT, VAT and BAT identified based on perilipin-1 (PLN1) expression. Phospho-PKA (arrows) is lower in Ad-KO tissues. In all panels, plotted are mean ± SEM. *P<0.05 (Student’s t-test). Scale bar: 50 µm.
Page 25 of 28
For Peer Review Only
Diabetes
3
C
Fig S3
050
100150200250300350400450
0' 30' 60' 120' 180'
GTT
WT KO
Blo
odgl
ucos
e(m
g/dL
)
0
50
100
150
200
250
300
0' 15' 30' 60' 90' 120' 180
ITT
WT KO
Blo
odgl
ucos
e(m
g/dL
) **
* * * *
D
0
100
200
300
400
500
0' 15'
30'
60'
90'
120'
180'
GTT, chow
WT KO
E
0
50
100
150
200
250
300
0' 15' 30' 60' 90' 120' 180
ITT
WT KOB
lood
gluc
ose
(mg/
dL) *
** * * *
, chow
F G
Male
0
100
200
300
400
figs2a
Blo
odgl
ucos
e(m
g/dL
)
Chow HFDAdpn-cre;PHB chow, female, n=3
Non fasting glucose
*
WT KO0
50
100
150
200
250
300
350
female NFG
Glu
cose
(mg/
dL)
0
50
100
150
200
250
300
350
Chow HFD
WT KO
Bloo
dgl
ucos
e(m
g/dL
)
Blo
odgl
ucos
e(m
g/dL
)
MaleMale
050
100150200250300350400450500
0' 30' 60' 90' 120' 180'
GTT-female 3M
WT KO
0
50
100
150
200
250
0' 15' 30' 60' 90' 120'
ITT-female 3M
WT KO
Blo
odgl
ucos
e(m
g/dL
)
Blo
odgl
ucos
e(m
g/dL
)
050
100150200250300350400450500
0' 30' 60' 90' 120' 180'
GTT-female 3M
WT KO
0
50
100
150
200
250
0' 15' 30' 60' 90' 120'
ITT-female 3M
WT KO
Blo
odgl
ucos
e(m
g/dL
)
Blo
odgl
ucos
e(m
g/dL
)
050
100150200250300350400450500
0' 30' 60' 90' 120' 180'
GTT-female 3M
WT KO
0
50
100
150
200
250
0' 15' 30' 60' 90' 120'
ITT-female 3M
WT KO
Blo
odgl
ucos
e(m
g/dL
)
Blo
odgl
ucos
e(m
g/dL
)
050
100150200250300350400450500
0' 30' 60' 90' 120' 180'
GTT-female 3M
WT KO
0
50
100
150
200
250
0' 15' 30' 60' 90' 120'
ITT-female 3M
WT KO
Blo
odgl
ucos
e(m
g/dL
)
Blo
odgl
ucos
e(m
g/dL
)
HFemale Female Female***
*
WT
KO
GLUT1 PLN1 DNA
VAT BAT LiverA Muscle
RER, Female
0.7
0.8
0.9
1
1.1
1 15 29 43 57 71 85 99 113
127
141
155
169
183
197
211
RER
WT KO
*
Res
pira
tory
exch
ange
rate
0.7
0.8
0.9
1
1.1
11
52
94
35
77
18
59
91
131
271
411
551
691
831
972
11
RER
WT KO
*
Res
pira
tory
exch
ange
rate
B
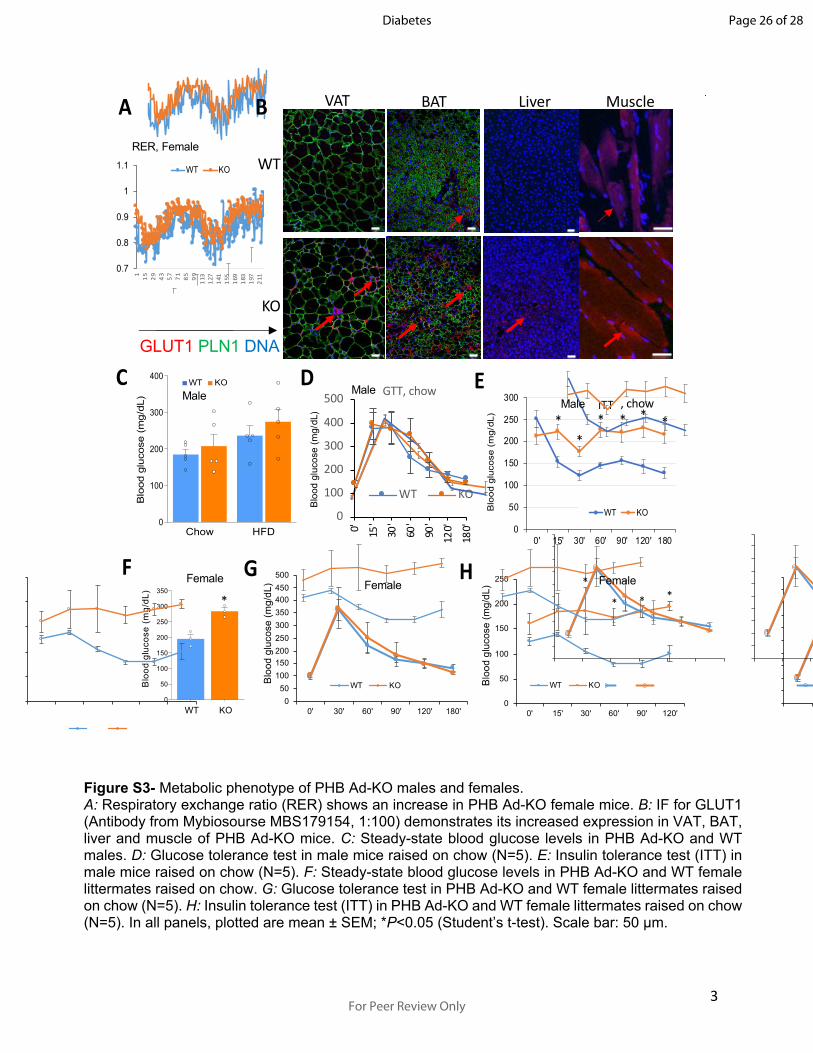
Figure S3- Metabolic phenotype of PHB Ad-KO males and females.A: Respiratory exchange ratio (RER) shows an increase in PHB Ad-KO female mice. B: IF for GLUT1 (Antibody from Mybiosourse MBS179154, 1:100) demonstrates its increased expression in VAT, BAT, liver and muscle of PHB Ad-KO mice. C: Steady-state blood glucose levels in PHB Ad-KO and WT males. D: Glucose tolerance test in male mice raised on chow (N=5). E: Insulin tolerance test (ITT) in male mice raised on chow (N=5). F: Steady-state blood glucose levels in PHB Ad-KO and WT female littermates raised on chow. G: Glucose tolerance test in PHB Ad-KO and WT female littermates raised on chow (N=5). H: Insulin tolerance test (ITT) in PHB Ad-KO and WT female littermates raised on chow (N=5). In all panels, plotted are mean ± SEM; *P<0.05 (Student’s t-test). Scale bar: 50 µm.
Page 26 of 28
For Peer Review Only
Diabetes
4
Fig S4
E
* * *
Oligomycin
FCCPRotenone/AA
C
****
*** ***
***
*
Ucp1 Cox IV Phb Ucp1 Cox IV Phb
WAT BAT
6.0
8.0
10.0
12.0
14.0
16.0
18.0
20.0
0 20 40 60 80 100 120
ECAR
(mpH
/min
/100
0)
Time (min)
WT beige KO beige
Mt-D
NA
/Nu-
DN
A
0.0
0.2
0.4
0.6
0.8
1.0
1.2
MtDNA/NuDNA WAT
MtD
NA/
NuD
NA
0.0
0.2
0.4
0.6
0.8
1.0
1.2
1.4
MtDNA/NuDNA BAT
MtD
NA/
NuD
NA
0.0
0.2
0.4
0.6
0.8
1.0
1.2
MtDNA/NuDNA WAT
MtD
NA/
NuD
NA
0.0
0.2
0.4
0.6
0.8
1.0
1.2
1.4
MtDNA/NuDNA BAT
MtD
NA/N
uDNA
VAT BAT
0.0
20.040.060.080.0
100.0
120.0140.0
OC
R(p
mol
/min
/100
0)
Basal
WT KO
**
D
A B
VO2
(ml/h
r/kg
)
Female
30
32
34
36
38
40
42
0 30' 60' 90' 120' 150'
Female CTT
WT Apn-cre;Phb KO
Cor
ebo
dyte
mpe
ratu
re(0 C
)
* **
Female
0.0
20.040.060.080.0
100.0
120.0140.0
OC
R(p
mol
/min
/100
0)
Basal
WT KO
Rel
ativ
em
RN
Aex
pres
sion
WT KO WT KO
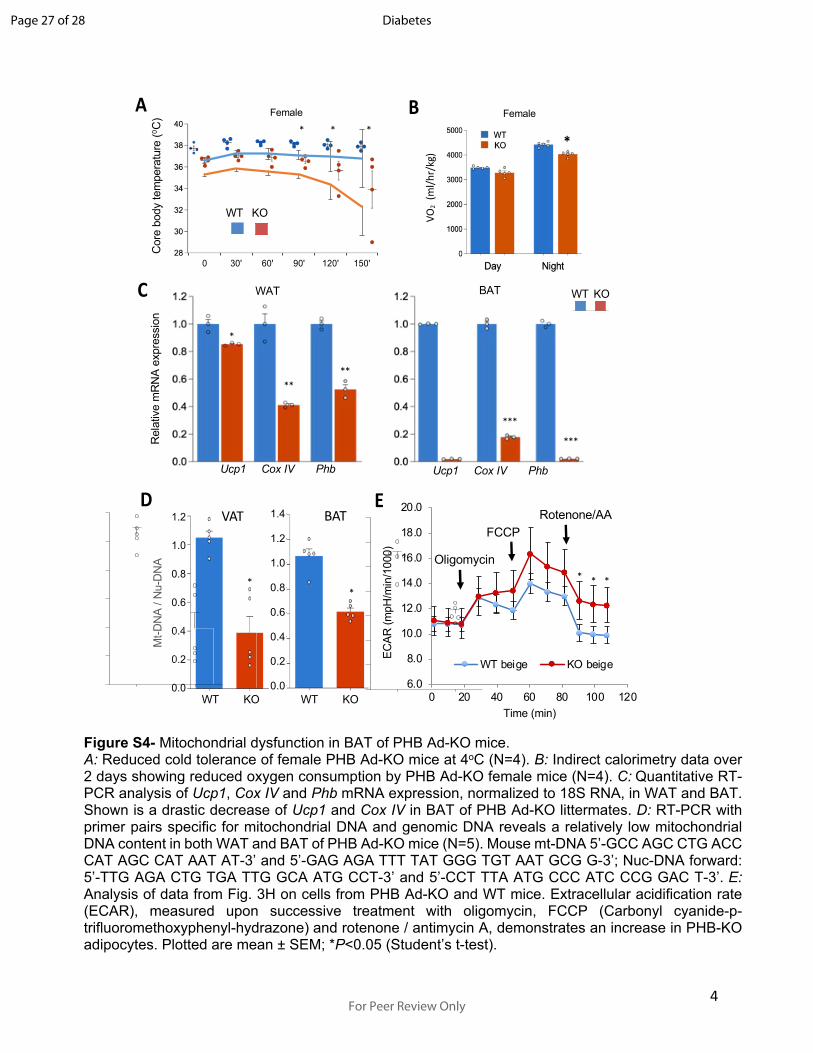
Figure S4- Mitochondrial dysfunction in BAT of PHB Ad-KO mice. A: Reduced cold tolerance of female PHB Ad-KO mice at 4oC (N=4). B: Indirect calorimetry data over 2 days showing reduced oxygen consumption by PHB Ad-KO female mice (N=4). C: Quantitative RT-PCR analysis of Ucp1, Cox IV and Phb mRNA expression, normalized to 18S RNA, in WAT and BAT. Shown is a drastic decrease of Ucp1 and Cox IV in BAT of PHB Ad-KO littermates. D: RT-PCR with primer pairs specific for mitochondrial DNA and genomic DNA reveals a relatively low mitochondrial DNA content in both WAT and BAT of PHB Ad-KO mice (N=5). Mouse mt-DNA 5’-GCC AGC CTG ACC CAT AGC CAT AAT AT-3’ and 5’-GAG AGA TTT TAT GGG TGT AAT GCG G-3’; Nuc-DNA forward: 5’-TTG AGA CTG TGA TTG GCA ATG CCT-3’ and 5’-CCT TTA ATG CCC ATC CCG GAC T-3’. E: Analysis of data from Fig. 3H on cells from PHB Ad-KO and WT mice. Extracellular acidification rate (ECAR), measured upon successive treatment with oligomycin, FCCP (Carbonyl cyanide-p-trifluoromethoxyphenyl-hydrazone) and rotenone / antimycin A, demonstrates an increase in PHB-KO adipocytes. Plotted are mean ± SEM; *P<0.05 (Student’s t-test).
Page 27 of 28
For Peer Review Only
Diabetes
5
50
70
90
110
130
150
170
0 20 40 60 80
OC
R(p
mol
/min
/ug
prot
ein)
Time (min)
Oligomycin
Rotenone/AA
A
* **
050
100150200250300350400450
0 20 40 60 80Time (min)
Oligomycin Rotenone/AA25.0
18.7
12.5
6.25ECAR
(mpH
/min
/ug
prot
ein)
B
Fig S5
C
0.1
1.0
Control Jl130 Mel56 SA1m
mito
ATP
/gly
coAT
Ppr
oduc
tion
rate
Control Jl130XF ATP Rate Index
XF ATP Rate Index D
Mel56JI130 SA1mControl
* * *
* * * * *
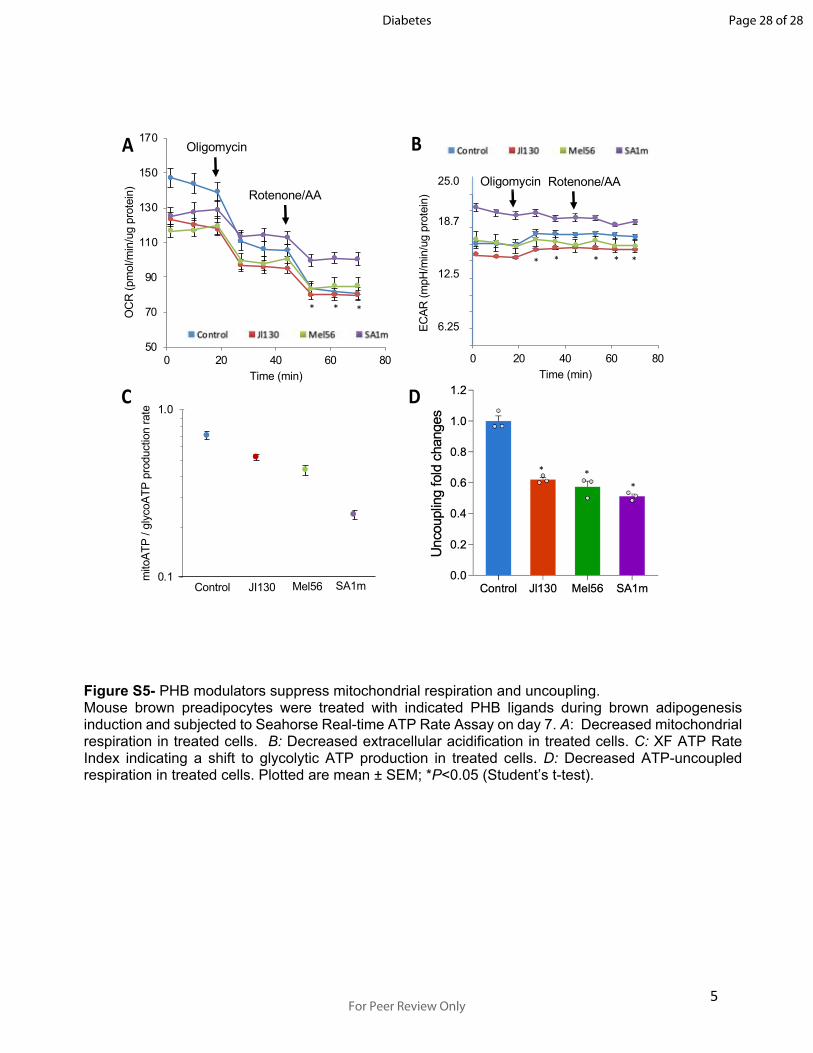
Figure S5- PHB modulators suppress mitochondrial respiration and uncoupling.Mouse brown preadipocytes were treated with indicated PHB ligands during brown adipogenesis induction and subjected to Seahorse Real-time ATP Rate Assay on day 7. A: Decreased mitochondrial respiration in treated cells. B: Decreased extracellular acidification in treated cells. C: XF ATP Rate Index indicating a shift to glycolytic ATP production in treated cells. D: Decreased ATP-uncoupled respiration in treated cells. Plotted are mean ± SEM; *P<0.05 (Student’s t-test).
Page 28 of 28
For Peer Review Only
Diabetes