Embed Size (px)
Citation preview
PROJECT COMPLETION REPORT (PCR) A. PROJECT DATA AND KEY DATES Project Number: P-ZM-AAC-001
Project Name: Small-Scale Irrigation Project (SIP)
Country (ies): Republic of Zambia
Lending Instrument(s): ADF Loan and Grant Sector: Agriculture
Environmental Classification: Category II
Original Commitment Amount: ADF Loan UA 5,290,000 and TAF Grant UA 760,000
Amount Cancelled: N/A
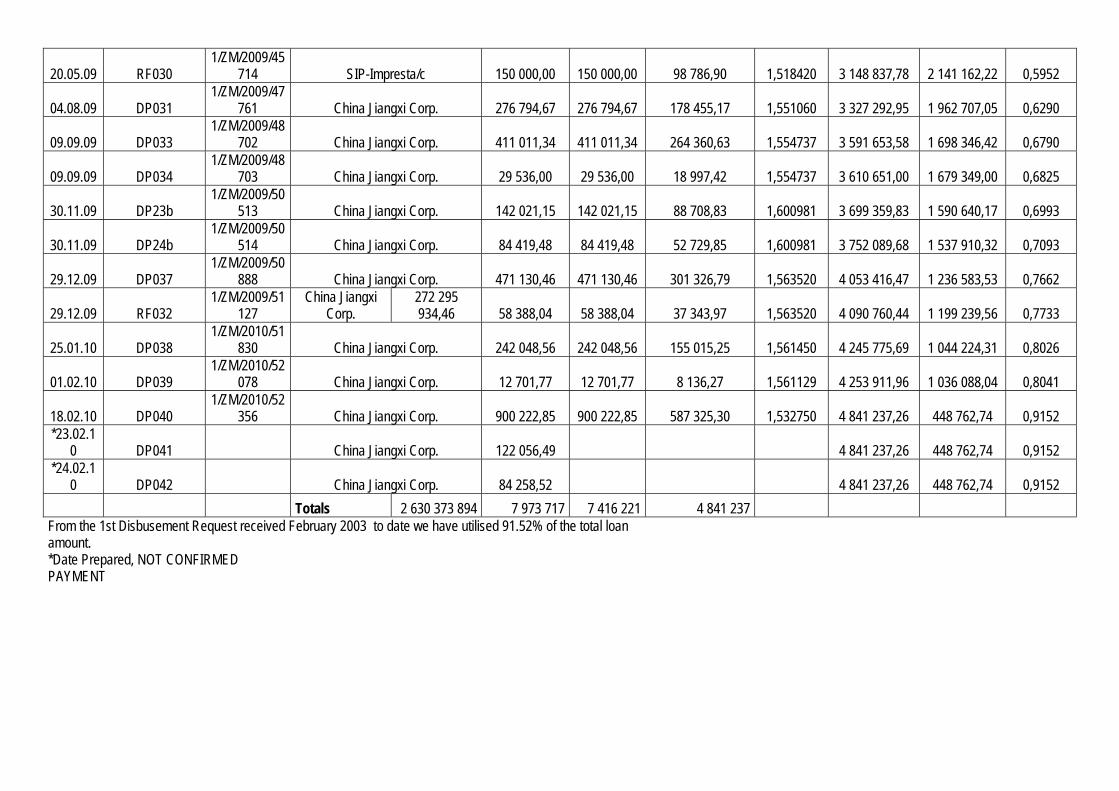
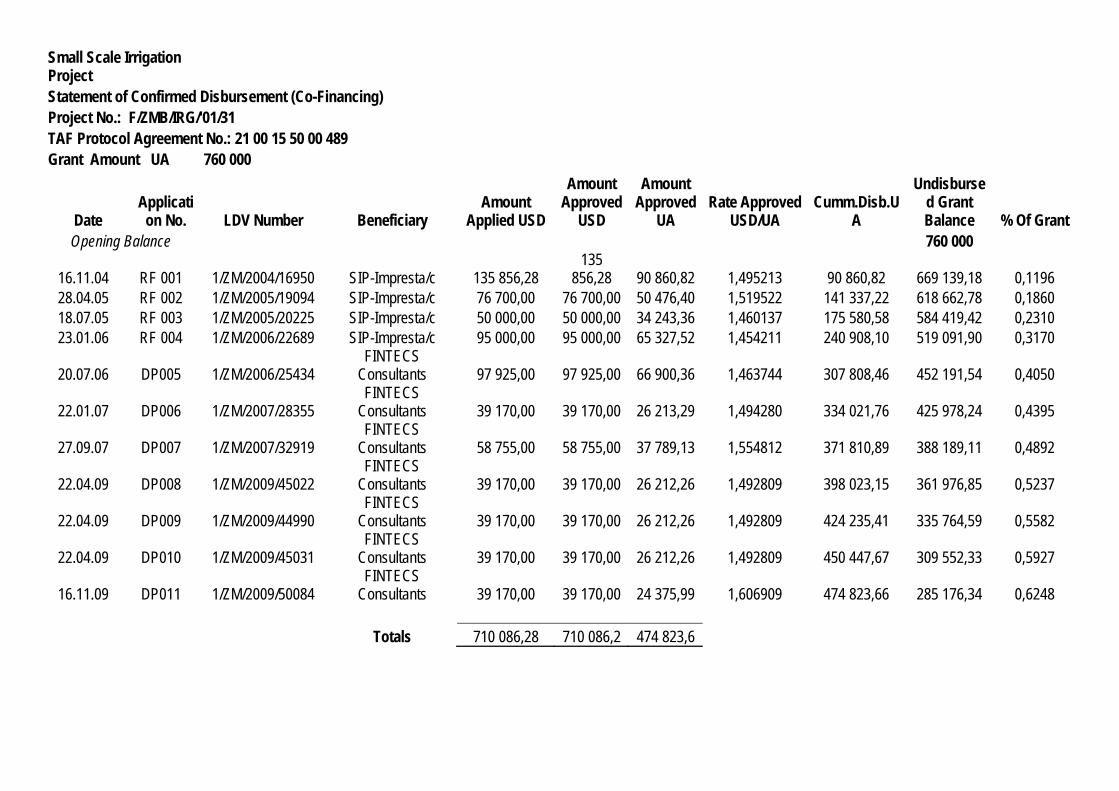
Amount Disbursed: Loan UA 4,841,237.25 and Grant UA 474,823.64
Percent Disbursed: Loan 91.52% and Grant 62.48%
Borrower: The Government of the Republic of Zambia Executing Agency(ies) [List the main Ministries, Project Implementation Units, Agencies and civil society organizations responsible for implementing project activities.] Ministry of Agriculture and Cooperatives (MACO). Day-to-day implementation by Project Implementation Unit (PIU). District level by District Project Managers. Steering Committee of 13 members for overall project supervision. Co-financers and other External Partners [List all other sources and amounts of financing, technical assistance or other resources used in this project] Government of Zambia (UA 0.79 million out of UA 1.31 million) and Beneficiaries (UA 0.11 million out of UA 0.68 million). There were no external partners. II. KEY DATES Project Concept Note Cleared by Ops. Com. N/A
Appraisal Report Cleared: 13 June 2000
Board Approval: July 2000
Restructuring(s) N/A
Original Date Actual Date Difference in months
[Actual-Original]
EFFECTIVENESS 1 janv 01 15 mars 02 15
MID-TERM REVIEW 31 déc 03 24 mai 07 41
CLOSING 31 déc 07 30 juin 10 30
III. RATINGS SUMMARY All summary ratings are auto-generated by the computer from the relevant section in the PCR. CRITERIA SUB-CRITERIA RATING
PROJECT OUTCOME
Achievement of Outputs 1
Achievement of Outcomes 1
Timeliness 2
OVERALL PROJECT OUTCOME 1
BANK PERFORMANCE
Design and Readiness 2
Supervision 2
OVERALL BANK PERFORMANCE 2
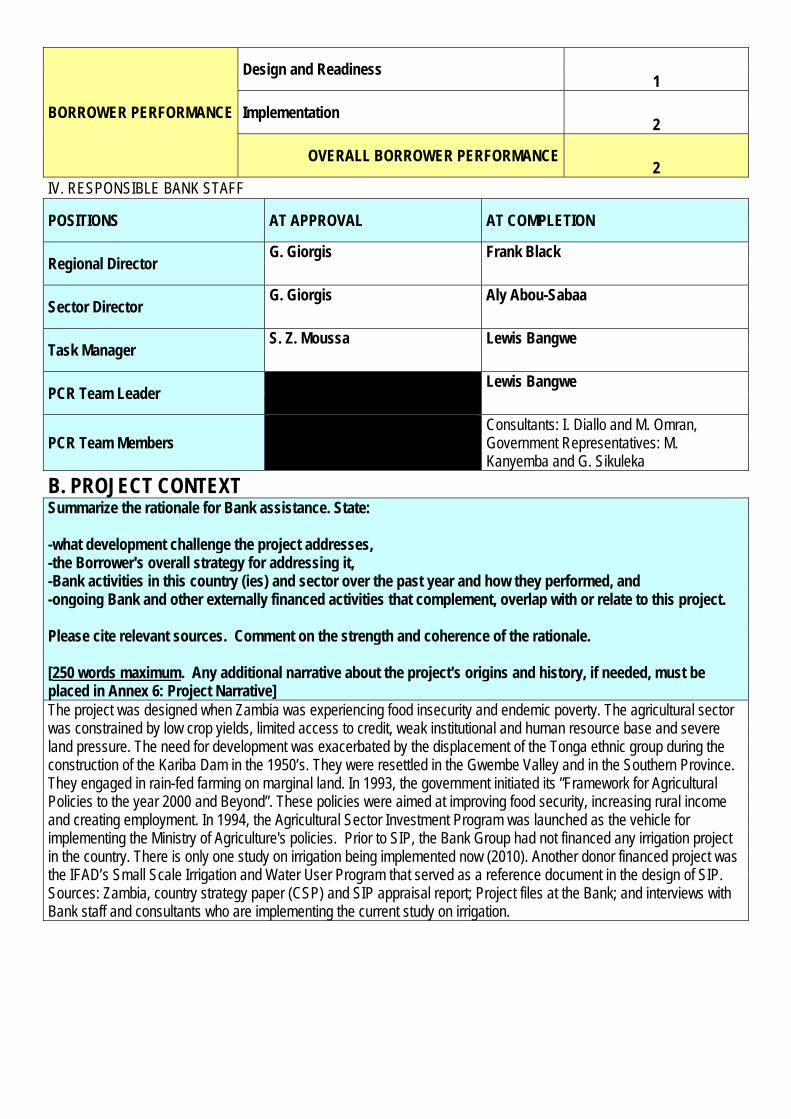
BORROWER PERFORMANCE
Design and Readiness 1
Implementation 2
OVERALL BORROWER PERFORMANCE 2
IV. RESPONSIBLE BANK STAFF
POSITIONS AT APPROVAL AT COMPLETION
Regional Director G. Giorgis Frank Black
Sector Director G. Giorgis Aly Abou-Sabaa
Task Manager S. Z. Moussa Lewis Bangwe
PCR Team Leader Lewis Bangwe
PCR Team Members Consultants: I. Diallo and M. Omran,
Government Representatives: M. Kanyemba and G. Sikuleka
B. PROJECT CONTEXT Summarize the rationale for Bank assistance. State: -what development challenge the project addresses, -the Borrower's overall strategy for addressing it, -Bank activities in this country (ies) and sector over the past year and how they performed, and -ongoing Bank and other externally financed activities that complement, overlap with or relate to this project. Please cite relevant sources. Comment on the strength and coherence of the rationale. [250 words maximum. Any additional narrative about the project's origins and history, if needed, must be placed in Annex 6: Project Narrative] The project was designed when Zambia was experiencing food insecurity and endemic poverty. The agricultural sector was constrained by low crop yields, limited access to credit, weak institutional and human resource base and severe land pressure. The need for development was exacerbated by the displacement of the Tonga ethnic group during the construction of the Kariba Dam in the 1950’s. They were resettled in the Gwembe Valley and in the Southern Province. They engaged in rain-fed farming on marginal land. In 1993, the government initiated its ”Framework for Agricultural Policies to the year 2000 and Beyond”. These policies were aimed at improving food security, increasing rural income and creating employment. In 1994, the Agricultural Sector Investment Program was launched as the vehicle for implementing the Ministry of Agriculture's policies. Prior to SIP, the Bank Group had not financed any irrigation project in the country. There is only one study on irrigation being implemented now (2010). Another donor financed project was the IFAD’s Small Scale Irrigation and Water User Program that served as a reference document in the design of SIP. Sources: Zambia, country strategy paper (CSP) and SIP appraisal report; Project files at the Bank; and interviews with Bank staff and consultants who are implementing the current study on irrigation.
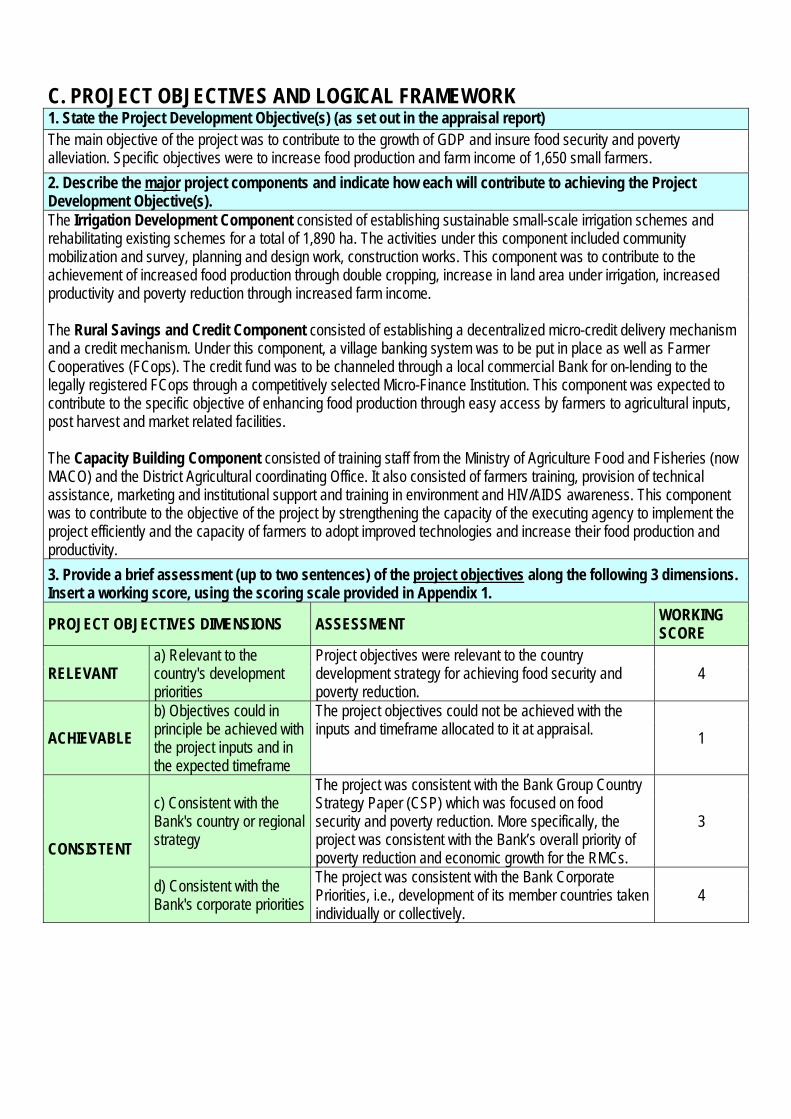
C. PROJECT OBJECTIVES AND LOGICAL FRAMEWORK 1. State the Project Development Objective(s) (as set out in the appraisal report) The main objective of the project was to contribute to the growth of GDP and insure food security and poverty alleviation. Specific objectives were to increase food production and farm income of 1,650 small farmers. 2. Describe the major project components and indicate how each will contribute to achieving the Project Development Objective(s). The Irrigation Development Component consisted of establishing sustainable small-scale irrigation schemes and rehabilitating existing schemes for a total of 1,890 ha. The activities under this component included community mobilization and survey, planning and design work, construction works. This component was to contribute to the achievement of increased food production through double cropping, increase in land area under irrigation, increased productivity and poverty reduction through increased farm income. The Rural Savings and Credit Component consisted of establishing a decentralized micro-credit delivery mechanism and a credit mechanism. Under this component, a village banking system was to be put in place as well as Farmer Cooperatives (FCops). The credit fund was to be channeled through a local commercial Bank for on-lending to the legally registered FCops through a competitively selected Micro-Finance Institution. This component was expected to contribute to the specific objective of enhancing food production through easy access by farmers to agricultural inputs, post harvest and market related facilities. The Capacity Building Component consisted of training staff from the Ministry of Agriculture Food and Fisheries (now MACO) and the District Agricultural coordinating Office. It also consisted of farmers training, provision of technical assistance, marketing and institutional support and training in environment and HIV/AIDS awareness. This component was to contribute to the objective of the project by strengthening the capacity of the executing agency to implement the project efficiently and the capacity of farmers to adopt improved technologies and increase their food production and productivity. 3. Provide a brief assessment (up to two sentences) of the project objectives along the following 3 dimensions. Insert a working score, using the scoring scale provided in Appendix 1.
PROJECT OBJECTIVES DIMENSIONS ASSESSMENT WORKING SCORE
RELEVANT a) Relevant to the country's development priorities
Project objectives were relevant to the country development strategy for achieving food security and poverty reduction.
4
ACHIEVABLE b) Objectives could in principle be achieved with the project inputs and in the expected timeframe
The project objectives could not be achieved with the inputs and timeframe allocated to it at appraisal. 1
CONSISTENT
c) Consistent with the Bank's country or regional strategy
The project was consistent with the Bank Group Country Strategy Paper (CSP) which was focused on food security and poverty reduction. More specifically, the project was consistent with the Bank’s overall priority of poverty reduction and economic growth for the RMCs.
3
d) Consistent with the Bank's corporate priorities
The project was consistent with the Bank Corporate Priorities, i.e., development of its member countries taken individually or collectively.
4
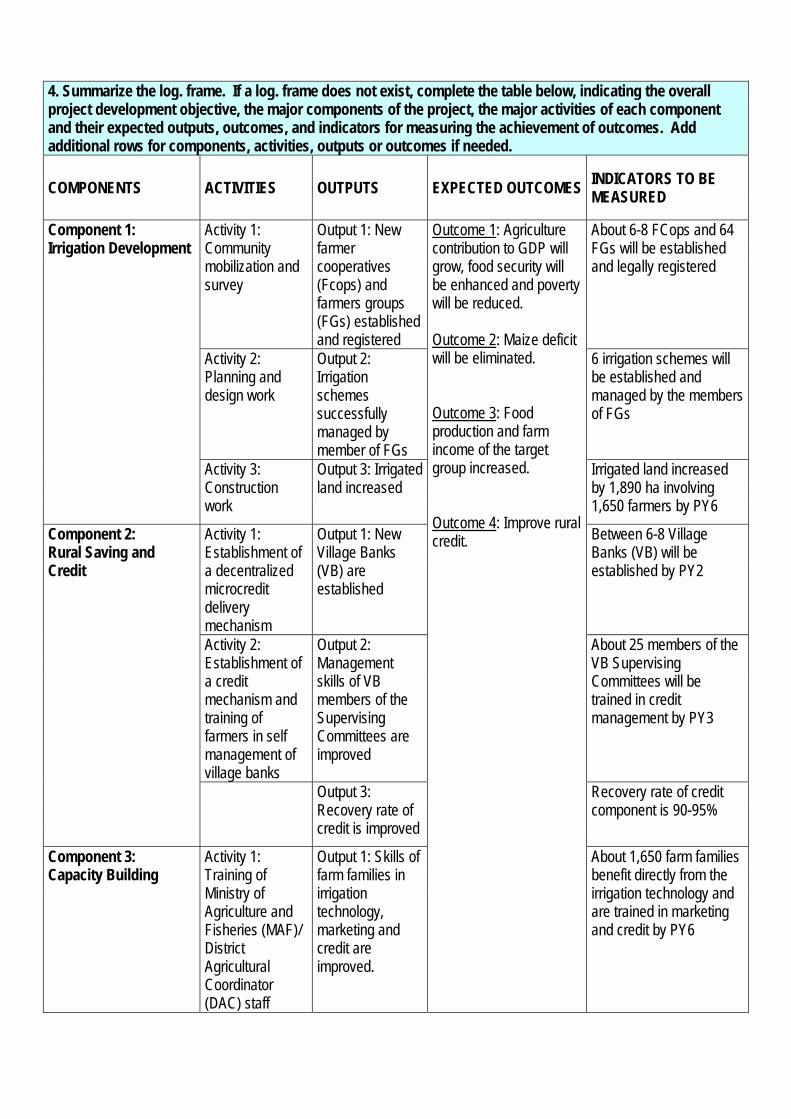
4. Summarize the log. frame. If a log. frame does not exist, complete the table below, indicating the overall project development objective, the major components of the project, the major activities of each component and their expected outputs, outcomes, and indicators for measuring the achievement of outcomes. Add additional rows for components, activities, outputs or outcomes if needed.
COMPONENTS ACTIVITIES OUTPUTS EXPECTED OUTCOMES INDICATORS TO BE MEASURED
Component 1: Irrigation Development
Activity 1: Community mobilization and survey
Output 1: New farmer cooperatives (Fcops) and farmers groups (FGs) established and registered
Outcome 1: Agriculture contribution to GDP will grow, food security will be enhanced and poverty will be reduced. Outcome 2: Maize deficit will be eliminated. Outcome 3: Food production and farm income of the target group increased. Outcome 4: Improve rural credit.
About 6-8 FCops and 64 FGs will be established and legally registered
Activity 2: Planning and design work
Output 2: Irrigation schemes successfully managed by member of FGs
6 irrigation schemes will be established and managed by the members of FGs
Activity 3: Construction work
Output 3: Irrigated land increased
Irrigated land increased by 1,890 ha involving 1,650 farmers by PY6
Component 2: Rural Saving and Credit
Activity 1: Establishment of a decentralized microcredit delivery mechanism
Output 1: New Village Banks (VB) are established
Between 6-8 Village Banks (VB) will be established by PY2
Activity 2: Establishment of a credit mechanism and training of farmers in self management of village banks
Output 2: Management skills of VB members of the Supervising Committees are improved
About 25 members of the VB Supervising Committees will be trained in credit management by PY3
Output 3: Recovery rate of credit is improved
Recovery rate of credit component is 90-95%
Component 3: Capacity Building
Activity 1: Training of Ministry of Agriculture and Fisheries (MAF)/ District Agricultural Coordinator (DAC) staff
Output 1: Skills of farm families in irrigation technology, marketing and credit are improved.
About 1,650 farm families benefit directly from the irrigation technology and are trained in marketing and credit by PY6
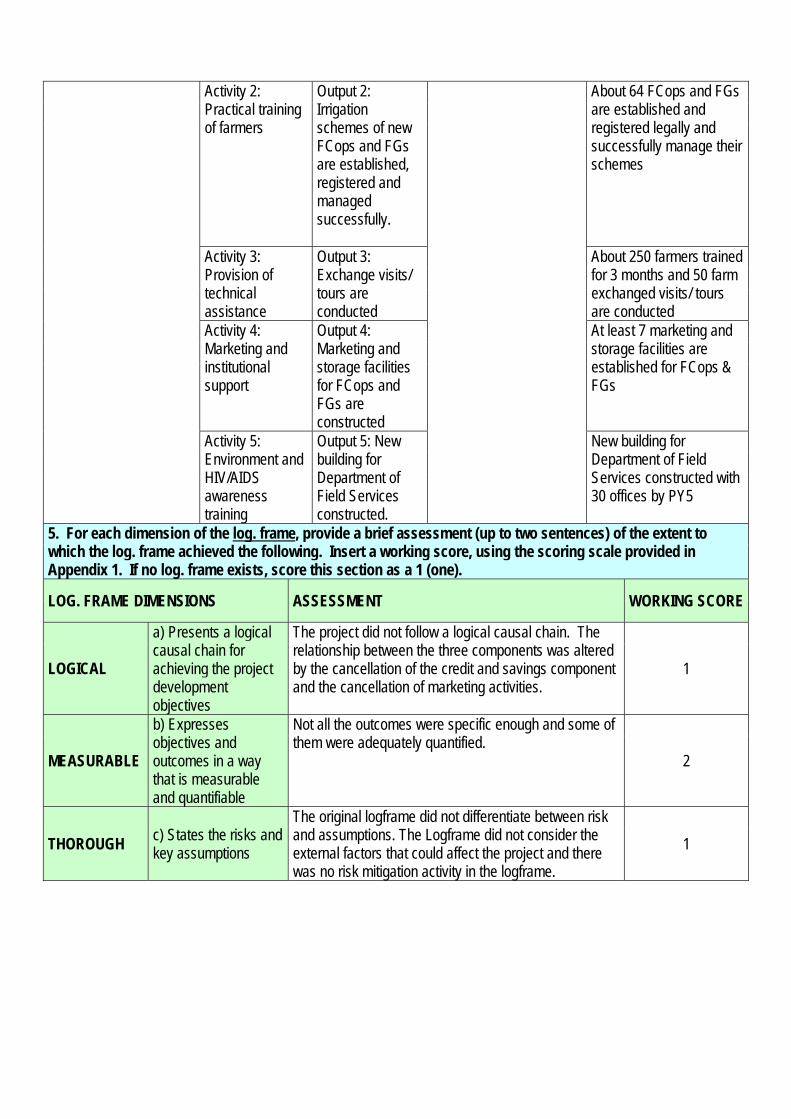
Activity 2: Practical training of farmers
Output 2: Irrigation schemes of new FCops and FGs are established, registered and managed successfully.
About 64 FCops and FGs are established and registered legally and successfully manage their schemes
Activity 3: Provision of technical assistance
Output 3: Exchange visits/ tours are conducted
About 250 farmers trained for 3 months and 50 farm exchanged visits/ tours are conducted
Activity 4: Marketing and institutional support
Output 4: Marketing and storage facilities for FCops and FGs are constructed
At least 7 marketing and storage facilities are established for FCops & FGs
Activity 5: Environment and HIV/AIDS awareness training
Output 5: New building for Department of Field Services constructed.
New building for Department of Field Services constructed with 30 offices by PY5
5. For each dimension of the log. frame, provide a brief assessment (up to two sentences) of the extent to which the log. frame achieved the following. Insert a working score, using the scoring scale provided in Appendix 1. If no log. frame exists, score this section as a 1 (one).
LOG. FRAME DIMENSIONS ASSESSMENT WORKING SCORE
LOGICAL
a) Presents a logical causal chain for achieving the project development objectives
The project did not follow a logical causal chain. The relationship between the three components was altered by the cancellation of the credit and savings component and the cancellation of marketing activities.
1
MEASURABLE
b) Expresses objectives and outcomes in a way that is measurable and quantifiable
Not all the outcomes were specific enough and some of them were adequately quantified.
2
THOROUGH c) States the risks and key assumptions
The original logframe did not differentiate between risk and assumptions. The Logframe did not consider the external factors that could affect the project and there was no risk mitigation activity in the logframe.
1
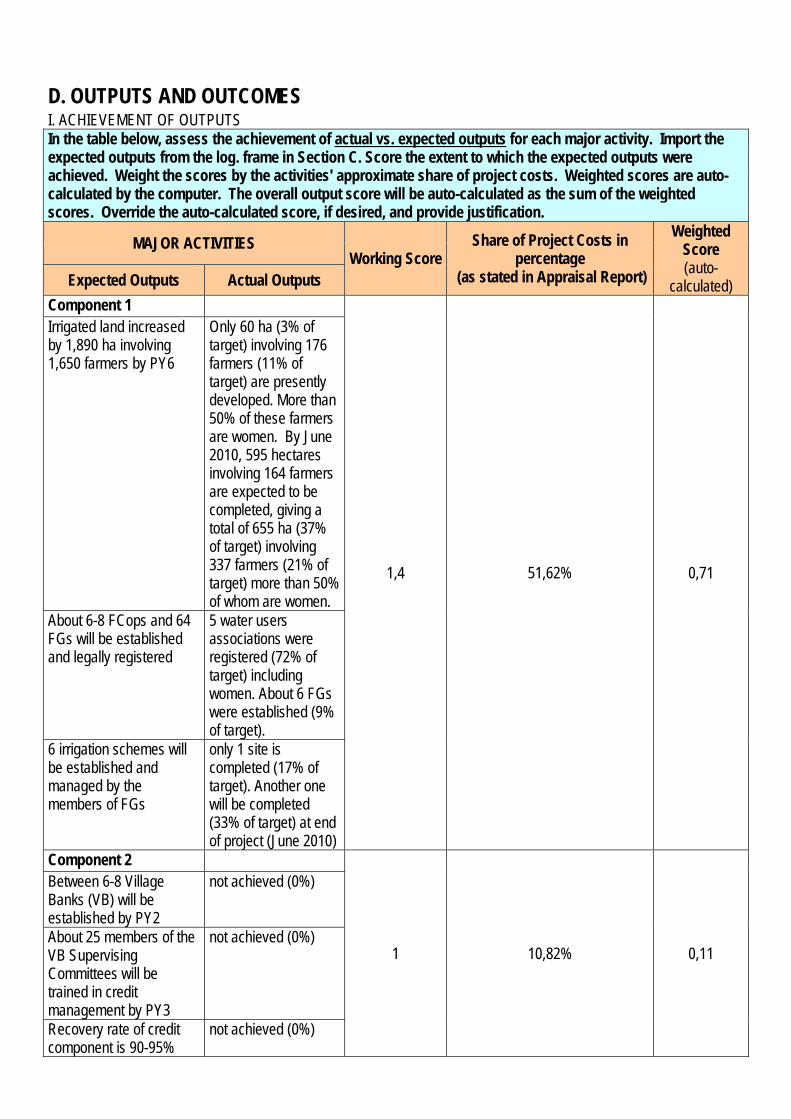
D. OUTPUTS AND OUTCOMES I. ACHIEVEMENT OF OUTPUTS In the table below, assess the achievement of actual vs. expected outputs for each major activity. Import the expected outputs from the log. frame in Section C. Score the extent to which the expected outputs were achieved. Weight the scores by the activities' approximate share of project costs. Weighted scores are auto-calculated by the computer. The overall output score will be auto-calculated as the sum of the weighted scores. Override the auto-calculated score, if desired, and provide justification.
MAJOR ACTIVITIES Working Score
Share of Project Costs in percentage
(as stated in Appraisal Report)
Weighted Score (auto-
calculated) Expected Outputs Actual Outputs Component 1
1,4 51,62% 0,71
Irrigated land increased by 1,890 ha involving 1,650 farmers by PY6
Only 60 ha (3% of target) involving 176 farmers (11% of target) are presently developed. More than 50% of these farmers are women. By June 2010, 595 hectares involving 164 farmers are expected to be completed, giving a total of 655 ha (37% of target) involving 337 farmers (21% of target) more than 50% of whom are women.
About 6-8 FCops and 64 FGs will be established and legally registered
5 water users associations were registered (72% of target) including women. About 6 FGs were established (9% of target).
6 irrigation schemes will be established and managed by the members of FGs
only 1 site is completed (17% of target). Another one will be completed (33% of target) at end of project (June 2010)
Component 2
1 10,82% 0,11
Between 6-8 Village Banks (VB) will be established by PY2
not achieved (0%)
About 25 members of the VB Supervising Committees will be trained in credit management by PY3
not achieved (0%)
Recovery rate of credit component is 90-95%
not achieved (0%)
Component 3
1,2 37,56% 0,44
About 1,650 farm families benefit directly from the irrigation technology and are trained in marketing and credit by PY6
54 extension staff were trained and provided with 54 motorcycles; in turn they trained 1,613 farmers covering 13 modules (98% of target)
About 64 FCops and FGs are established and registered legally and successfully manage their schemes
not achieved (0%)
About 250 farmers trained for 3 months and 50 farm exchanged visits/ tours are conducted
The project arranged farmers visits between Nega Nega, Kanakantapa and Buleya Malima sites to exchange views (50% of target)
At least 7 marketing and storage facilities are established for FCops & FGs
not achieved (0%)
New building for Department of Field Services constructed with 30 offices by PY5
not achieved (0%)
OVERAL OUTPUT SCORE [Score is calculated as the sum of weighted scores] 1
Provide justification for over-riding the auto-calculated score
Insert the new score or re-enter the autocalculated score 1
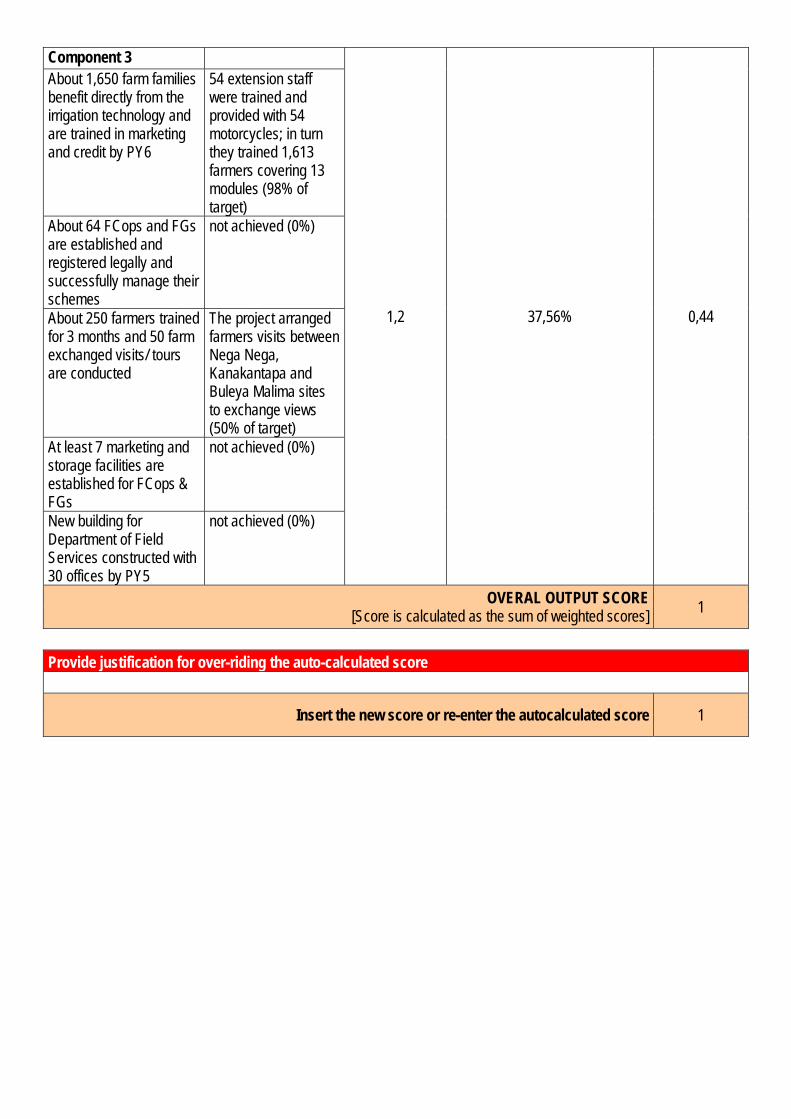
II. ACHIEVEMENT OF OUTCOMES 1. Using available monitoring data, assess the achievement of expected outcomes. Import the expected outcomes from the log. frame in Section C. Score the extent to which the expected outcomes were achieved. The overall outcome score will be auto-calculated as an average of the working scores. Override the auto-calculated score, if desired, and provide justification.
OUTCOMES Working Score
Expected Actual
1. Agriculture contribution to GDP will be more than 17.3% by PY6.
The appraisal report mentioned that the agricultural contribution to the GDP will be more than 17.3%, but it did not mention by how much. Meanwhile, the project did not have a significant impact, sufficient enough to affect the agricultural contribution to GDP.
1
2. the 25% maize deficit will be eliminated
The project did not produce significant maize production to eliminate or even reduce maize deficit 1
3. Household income increased from: $0.66 - 1.85 for small-holders $2.05 – 9.30 for emerging farms
The first phase of Buleya Malima scheme is the only completed site with 60 hectares involving 176 farmers. They have not reached full production level for the income to be assessed; however, the average income for the 176 farmers reached $1.29 per day. The weighted average of the actual income for the 176 households is estimated at 7% of the targeted income for 1650 households.
1
OVERALL OUTCOME SCORE [Score is calculated as an average of the working scores] 1
Check here to override the auto-calculated score
Provide justification for over-riding the auto-calculated score
Insert the new score or re-enter the autocalculated score 1
2. Additional outcomes. Comment on the project's additional outcomes not captured in the log. frame, including cross-cutting issues (e.g., gender). The project was able to involve women which represented more than 50% of the targeted group. Women were represented in farmers’ associations and farmers groups as well. In addition the irrigation schemes will be managed by women representing more than 50% of the targeted farmers. These women will own their irrigation plots.
3. Risks to sustained achievement of outcomes. State the factors that affect, or could affect, the long-run or sustained achievement of project outcomes. Indicate if any new activity or institutional change is recommended to help sustain outcomes. The analysis should draw upon the sensitivity analysis in Annex 3, where appropriate. The risks/ factors are: lack of access roads will affect the marketing of agricultural production. Lack of credit will prevent acquisition of required agricultural inputs and equipment. The change of climate (drought) leading to reduced water level could affect agricultural production. Conversely, flooding could also negatively affect production of crops. International market prices of sugarcane could affect the viability of the project. Lack of services such as extension could affect farmers production capacity. There is a need for the government to assist farmers with adequate market information, promotion of private sector through tax incentives. However, switching to sugarcane production at Nega Nega will mitigate against the risk associated with food crop production due to facilities provided for credit, marketing and extension services.
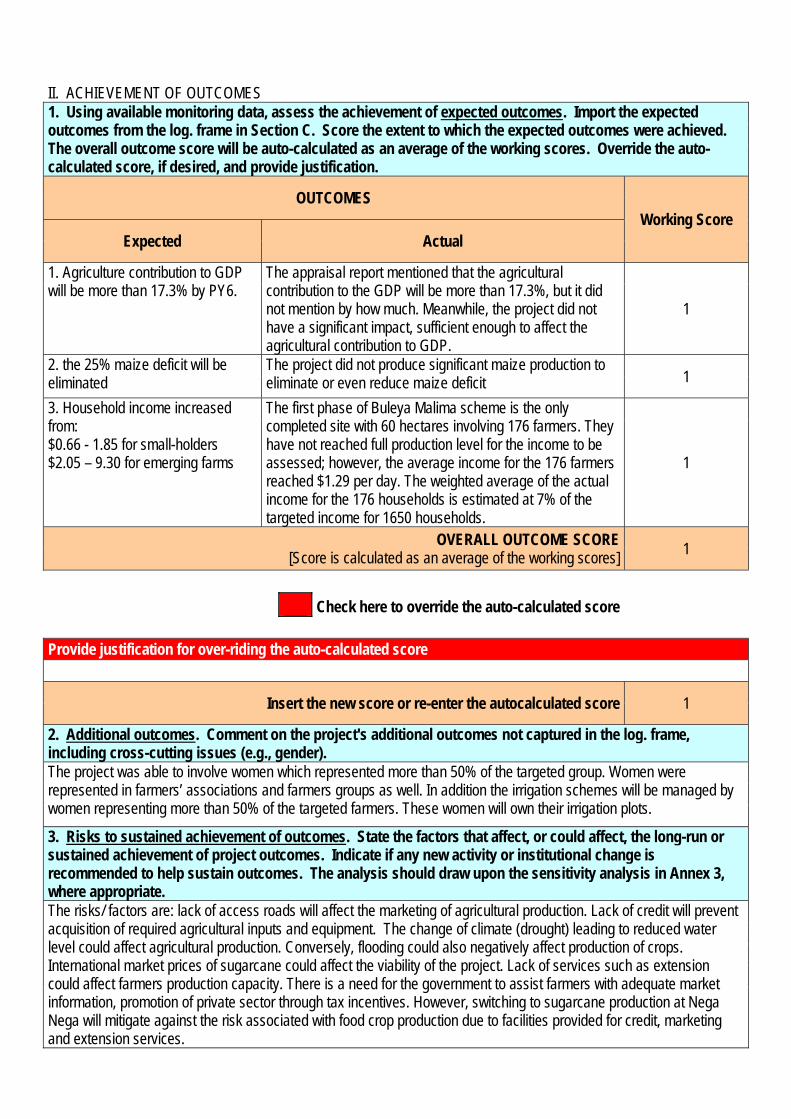
E. PROJECT DESIGN AND READINESS FOR IMPLEMENTATION 1. State the extent to which the Bank and the Borrower ensured the project was commensurate with the Borrower’s capacity to implement by designing the project appropriately and by putting in place the necessary implementation arrangements. Consider all major design aspects, such as extent to which project design took into account lessons learned from previous PCRs in the sector or the country (please cite key PCRs); whether the project was informed by robust analytical work (please cite key documents); how well Bank and Borrower assessed the capacity of the implementing agencies and/or Project Implementation Unit; scope of consultations and partnerships; economic rationale of project; and provisions made for technical assistance. [200 words maximum. Any additional narrative about implementation should be included at Annex 6: Project Narrative] During project preparation and appraisal, the Bank identified the Ministry of Agriculture as the Executing Agency. This ministry has a long standing experience in managing irrigation projects through its Technical Services Branch. For the implementation of SIP, the Ministry appointed a full time Project Coordinator assisted by a Secretary and an Accountant. At district level, a District Project Manager was recruited to ensure smooth project implementation. A Project Steering Committee was put in place to periodically review project progress and provide direction for effective project implementation. The project design was based on various consultative meetings with communities, traditional leaders and government staff. However, the project design was not based on full fledge engineering and feasibility studies nor was it based on adequate assessment of costs. As a result, the project was under budgeted by at least 50 per cent. The project design was also inadequate in terms of components as the credit and savings component was found to be unrealistic. Although provision was made for technical assistance, there was no recruitment made in the area of credit, civil works, social mobilization and environmental management. The recruitment of TA was limited only to the technical & feasibility study. Other TAs were not recruited due to lack of funds. There was no previous PCR to serve as a reference for SIP. 2. For each dimension of project design and readiness for implementation, provide a brief assessment (up to two sentences). Insert a working score, using the scoring scale provided in Appendix 1.
PROJECT DESIGN AND READINESS
FOR IMPLEMENTATION DIMENSIONS
ASSESSMENT WORKING SCORE
REALISM
a) Project complexity is matched with country capacity and political commitment.
Although the project was in line with government development objectives and political commitment, its implementation was not commensurate with the country capacity to implement the project particularly at the district level. Also, the design of the project was not realistic in terms of cost and schedule of implementation.
1
RISK ASSESSMENT AND MITIGATION
b) Project design includes adequate risk analysis.
The project design did not include adequate risk analysis and this was reflected in the logframe with confusion between risk and assumptions. 1
USE OF COUNTRY SYSTEMS
c) Project procurement, financial management, monitoring and/or other systems are based on those already in use by government and/or other partners.
The Bank procurement and financial system was used by the project. It was observed that the country procurement and financial system was in line with that of the Bank and other donors such as the World Bank. However, the monitoring and evaluation system of the project did not perform as well and was not in conformity with Bank’s requirements. 1
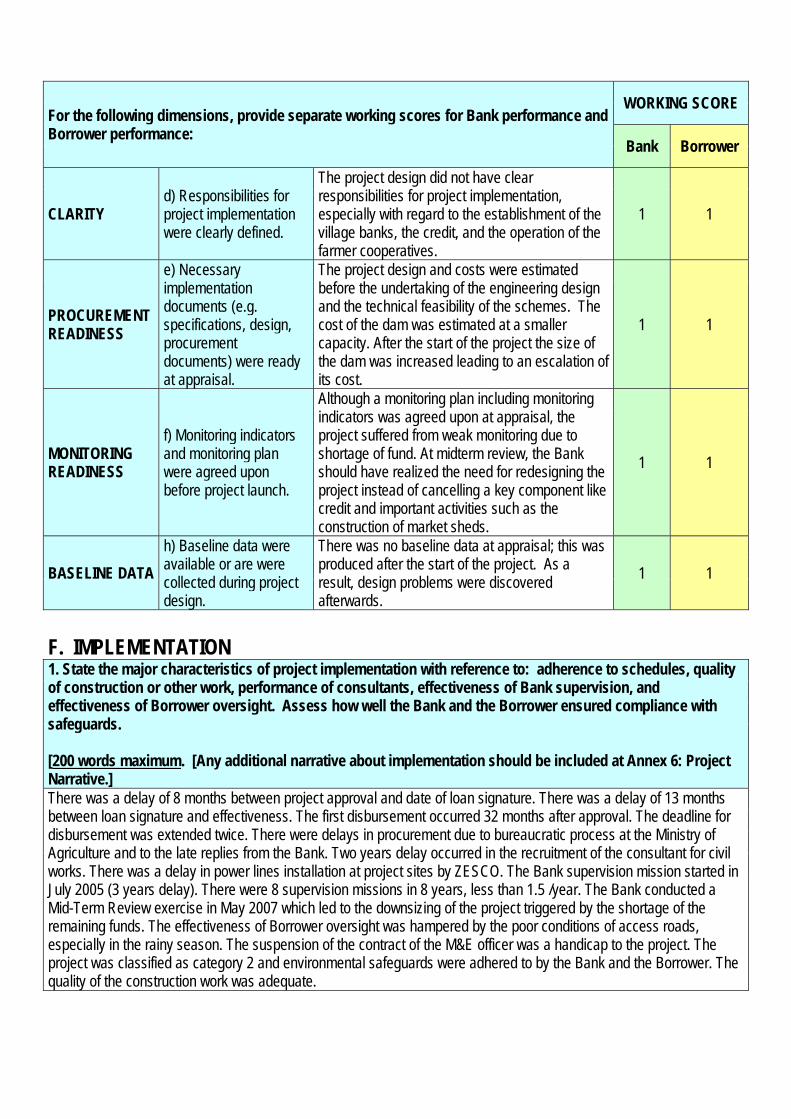
For the following dimensions, provide separate working scores for Bank performance and Borrower performance:
WORKING SCORE
Bank Borrower
CLARITY d) Responsibilities for project implementation were clearly defined.
The project design did not have clear responsibilities for project implementation, especially with regard to the establishment of the village banks, the credit, and the operation of the farmer cooperatives.
1 1
PROCUREMENT READINESS
e) Necessary implementation documents (e.g. specifications, design, procurement documents) were ready at appraisal.
The project design and costs were estimated before the undertaking of the engineering design and the technical feasibility of the schemes. The cost of the dam was estimated at a smaller capacity. After the start of the project the size of the dam was increased leading to an escalation of its cost.
1 1
MONITORING READINESS
f) Monitoring indicators and monitoring plan were agreed upon before project launch.
Although a monitoring plan including monitoring indicators was agreed upon at appraisal, the project suffered from weak monitoring due to shortage of fund. At midterm review, the Bank should have realized the need for redesigning the project instead of cancelling a key component like credit and important activities such as the construction of market sheds.
1 1
BASELINE DATA h) Baseline data were available or are were collected during project design.
There was no baseline data at appraisal; this was produced after the start of the project. As a result, design problems were discovered afterwards.
1 1
F. IMPLEMENTATION 1. State the major characteristics of project implementation with reference to: adherence to schedules, quality of construction or other work, performance of consultants, effectiveness of Bank supervision, and effectiveness of Borrower oversight. Assess how well the Bank and the Borrower ensured compliance with safeguards. [200 words maximum. [Any additional narrative about implementation should be included at Annex 6: Project Narrative.] There was a delay of 8 months between project approval and date of loan signature. There was a delay of 13 months between loan signature and effectiveness. The first disbursement occurred 32 months after approval. The deadline for disbursement was extended twice. There were delays in procurement due to bureaucratic process at the Ministry of Agriculture and to the late replies from the Bank. Two years delay occurred in the recruitment of the consultant for civil works. There was a delay in power lines installation at project sites by ZESCO. The Bank supervision mission started in July 2005 (3 years delay). There were 8 supervision missions in 8 years, less than 1.5 /year. The Bank conducted a Mid-Term Review exercise in May 2007 which led to the downsizing of the project triggered by the shortage of the remaining funds. The effectiveness of Borrower oversight was hampered by the poor conditions of access roads, especially in the rainy season. The suspension of the contract of the M&E officer was a handicap to the project. The project was classified as category 2 and environmental safeguards were adhered to by the Bank and the Borrower. The quality of the construction work was adequate.
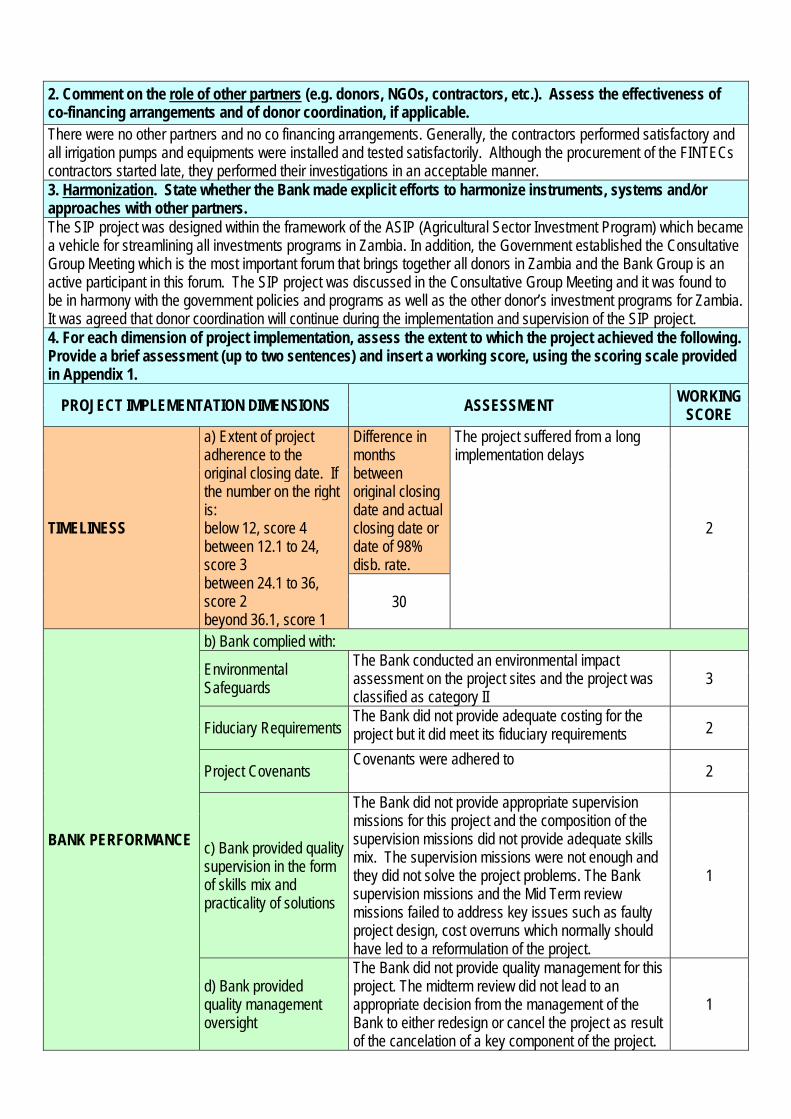
2. Comment on the role of other partners (e.g. donors, NGOs, contractors, etc.). Assess the effectiveness of co-financing arrangements and of donor coordination, if applicable. There were no other partners and no co financing arrangements. Generally, the contractors performed satisfactory and all irrigation pumps and equipments were installed and tested satisfactorily. Although the procurement of the FINTECs contractors started late, they performed their investigations in an acceptable manner. 3. Harmonization. State whether the Bank made explicit efforts to harmonize instruments, systems and/or approaches with other partners. The SIP project was designed within the framework of the ASIP (Agricultural Sector Investment Program) which became a vehicle for streamlining all investments programs in Zambia. In addition, the Government established the Consultative Group Meeting which is the most important forum that brings together all donors in Zambia and the Bank Group is an active participant in this forum. The SIP project was discussed in the Consultative Group Meeting and it was found to be in harmony with the government policies and programs as well as the other donor’s investment programs for Zambia. It was agreed that donor coordination will continue during the implementation and supervision of the SIP project. 4. For each dimension of project implementation, assess the extent to which the project achieved the following. Provide a brief assessment (up to two sentences) and insert a working score, using the scoring scale provided in Appendix 1.
PROJECT IMPLEMENTATION DIMENSIONS ASSESSMENT WORKING SCORE
TIMELINESS
a) Extent of project adherence to the original closing date. If the number on the right is: below 12, score 4 between 12.1 to 24, score 3 between 24.1 to 36, score 2 beyond 36.1, score 1
Difference in months between original closing date and actual closing date or date of 98% disb. rate.
The project suffered from a long implementation delays
2
30
BANK PERFORMANCE
b) Bank complied with:
Environmental Safeguards
The Bank conducted an environmental impact assessment on the project sites and the project was classified as category II
3
Fiduciary Requirements The Bank did not provide adequate costing for the project but it did meet its fiduciary requirements 2
Project Covenants Covenants were adhered to
2
c) Bank provided quality supervision in the form of skills mix and practicality of solutions
The Bank did not provide appropriate supervision missions for this project and the composition of the supervision missions did not provide adequate skills mix. The supervision missions were not enough and they did not solve the project problems. The Bank supervision missions and the Mid Term review missions failed to address key issues such as faulty project design, cost overruns which normally should have led to a reformulation of the project.
1
d) Bank provided quality management oversight
The Bank did not provide quality management for this project. The midterm review did not lead to an appropriate decision from the management of the Bank to either redesign or cancel the project as result of the cancelation of a key component of the project.
1
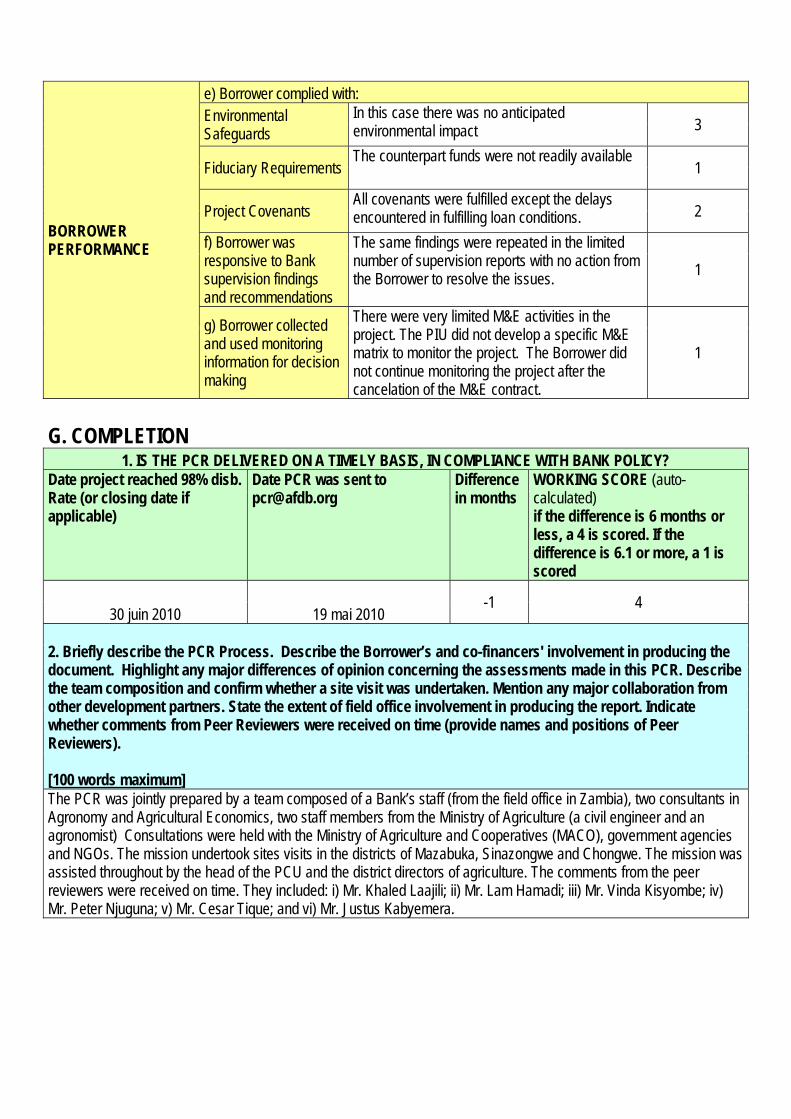
BORROWER PERFORMANCE
e) Borrower complied with: Environmental Safeguards
In this case there was no anticipated environmental impact 3
Fiduciary Requirements The counterpart funds were not readily available
1
Project Covenants All covenants were fulfilled except the delays encountered in fulfilling loan conditions. 2
f) Borrower was responsive to Bank supervision findings and recommendations
The same findings were repeated in the limited number of supervision reports with no action from the Borrower to resolve the issues. 1
g) Borrower collected and used monitoring information for decision making
There were very limited M&E activities in the project. The PIU did not develop a specific M&E matrix to monitor the project. The Borrower did not continue monitoring the project after the cancelation of the M&E contract.
1
G. COMPLETION
1. IS THE PCR DELIVERED ON A TIMELY BASIS, IN COMPLIANCE WITH BANK POLICY? Date project reached 98% disb. Rate (or closing date if applicable)
Date PCR was sent to [email protected]
Difference in months
WORKING SCORE (auto-calculated) if the difference is 6 months or less, a 4 is scored. If the difference is 6.1 or more, a 1 is scored
30 juin 2010 19 mai 2010 -1 4
2. Briefly describe the PCR Process. Describe the Borrower’s and co-financers' involvement in producing the document. Highlight any major differences of opinion concerning the assessments made in this PCR. Describe the team composition and confirm whether a site visit was undertaken. Mention any major collaboration from other development partners. State the extent of field office involvement in producing the report. Indicate whether comments from Peer Reviewers were received on time (provide names and positions of Peer Reviewers). [100 words maximum] The PCR was jointly prepared by a team composed of a Bank’s staff (from the field office in Zambia), two consultants in Agronomy and Agricultural Economics, two staff members from the Ministry of Agriculture (a civil engineer and an agronomist) Consultations were held with the Ministry of Agriculture and Cooperatives (MACO), government agencies and NGOs. The mission undertook sites visits in the districts of Mazabuka, Sinazongwe and Chongwe. The mission was assisted throughout by the head of the PCU and the district directors of agriculture. The comments from the peer reviewers were received on time. They included: i) Mr. Khaled Laajili; ii) Mr. Lam Hamadi; iii) Mr. Vinda Kisyombe; iv) Mr. Peter Njuguna; v) Mr. Cesar Tique; and vi) Mr. Justus Kabyemera.
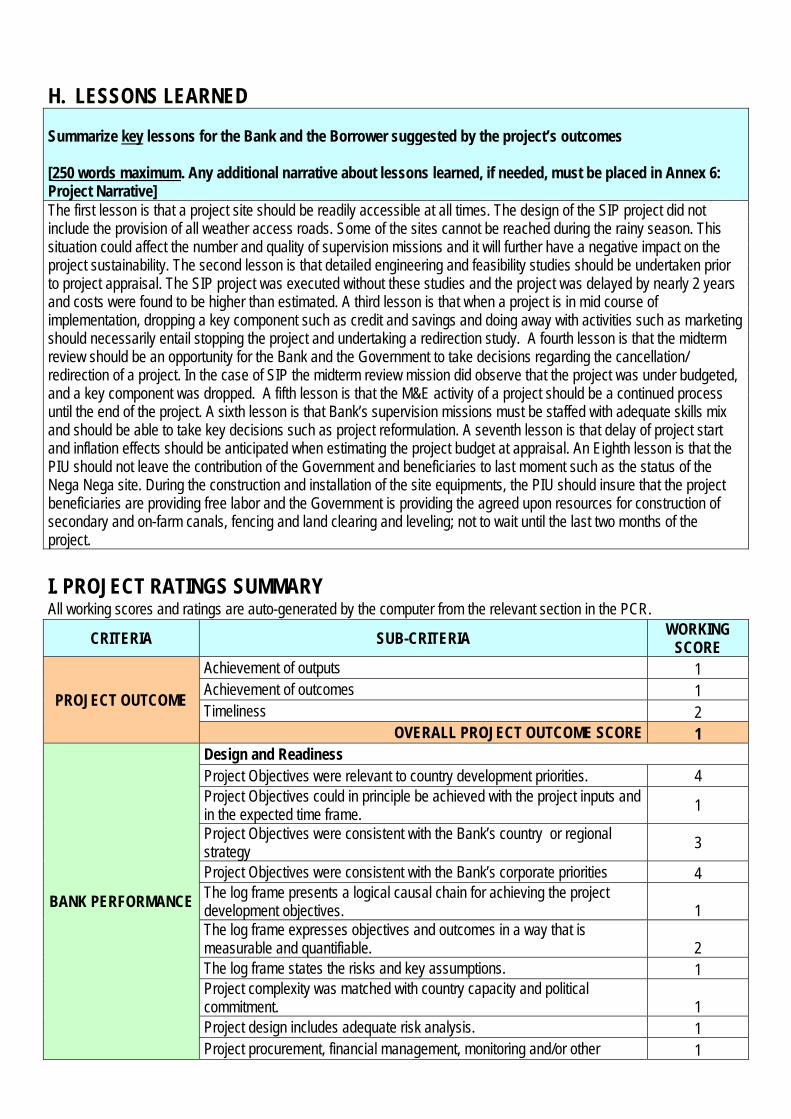
H. LESSONS LEARNED Summarize key lessons for the Bank and the Borrower suggested by the project’s outcomes [250 words maximum. Any additional narrative about lessons learned, if needed, must be placed in Annex 6: Project Narrative] The first lesson is that a project site should be readily accessible at all times. The design of the SIP project did not include the provision of all weather access roads. Some of the sites cannot be reached during the rainy season. This situation could affect the number and quality of supervision missions and it will further have a negative impact on the project sustainability. The second lesson is that detailed engineering and feasibility studies should be undertaken prior to project appraisal. The SIP project was executed without these studies and the project was delayed by nearly 2 years and costs were found to be higher than estimated. A third lesson is that when a project is in mid course of implementation, dropping a key component such as credit and savings and doing away with activities such as marketing should necessarily entail stopping the project and undertaking a redirection study. A fourth lesson is that the midterm review should be an opportunity for the Bank and the Government to take decisions regarding the cancellation/ redirection of a project. In the case of SIP the midterm review mission did observe that the project was under budgeted, and a key component was dropped. A fifth lesson is that the M&E activity of a project should be a continued process until the end of the project. A sixth lesson is that Bank’s supervision missions must be staffed with adequate skills mix and should be able to take key decisions such as project reformulation. A seventh lesson is that delay of project start and inflation effects should be anticipated when estimating the project budget at appraisal. An Eighth lesson is that the PIU should not leave the contribution of the Government and beneficiaries to last moment such as the status of the Nega Nega site. During the construction and installation of the site equipments, the PIU should insure that the project beneficiaries are providing free labor and the Government is providing the agreed upon resources for construction of secondary and on-farm canals, fencing and land clearing and leveling; not to wait until the last two months of the project. I. PROJECT RATINGS SUMMARY All working scores and ratings are auto-generated by the computer from the relevant section in the PCR.
CRITERIA SUB-CRITERIA WORKING SCORE
PROJECT OUTCOME
Achievement of outputs 1 Achievement of outcomes 1 Timeliness 2
OVERALL PROJECT OUTCOME SCORE 1
BANK PERFORMANCE
Design and Readiness Project Objectives were relevant to country development priorities. 4 Project Objectives could in principle be achieved with the project inputs and in the expected time frame. 1
Project Objectives were consistent with the Bank’s country or regional strategy 3
Project Objectives were consistent with the Bank’s corporate priorities 4 The log frame presents a logical causal chain for achieving the project development objectives. 1 The log frame expresses objectives and outcomes in a way that is measurable and quantifiable. 2 The log frame states the risks and key assumptions. 1 Project complexity was matched with country capacity and political commitment. 1 Project design includes adequate risk analysis. 1 Project procurement, financial management, monitoring and/or other 1
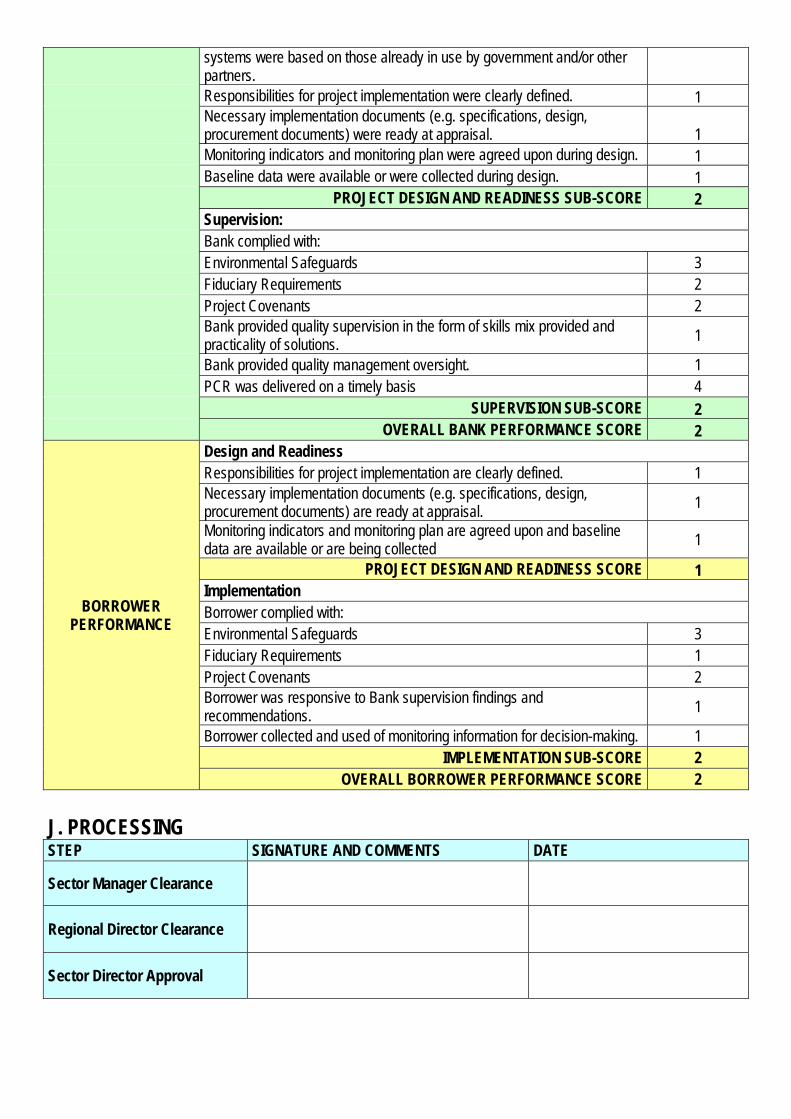
systems were based on those already in use by government and/or other partners. Responsibilities for project implementation were clearly defined. 1 Necessary implementation documents (e.g. specifications, design, procurement documents) were ready at appraisal. 1 Monitoring indicators and monitoring plan were agreed upon during design. 1 Baseline data were available or were collected during design. 1
PROJECT DESIGN AND READINESS SUB-SCORE 2 Supervision: Bank complied with: Environmental Safeguards 3 Fiduciary Requirements 2 Project Covenants 2 Bank provided quality supervision in the form of skills mix provided and practicality of solutions. 1
Bank provided quality management oversight. 1 PCR was delivered on a timely basis 4
SUPERVISION SUB-SCORE 2 OVERALL BANK PERFORMANCE SCORE 2
BORROWER PERFORMANCE
Design and Readiness Responsibilities for project implementation are clearly defined. 1 Necessary implementation documents (e.g. specifications, design, procurement documents) are ready at appraisal. 1
Monitoring indicators and monitoring plan are agreed upon and baseline data are available or are being collected 1
PROJECT DESIGN AND READINESS SCORE 1 Implementation Borrower complied with: Environmental Safeguards 3 Fiduciary Requirements 1 Project Covenants 2 Borrower was responsive to Bank supervision findings and recommendations. 1
Borrower collected and used of monitoring information for decision-making. 1 IMPLEMENTATION SUB-SCORE 2
OVERALL BORROWER PERFORMANCE SCORE 2 J. PROCESSING STEP SIGNATURE AND COMMENTS DATE
Sector Manager Clearance
Regional Director Clearance
Sector Director Approval
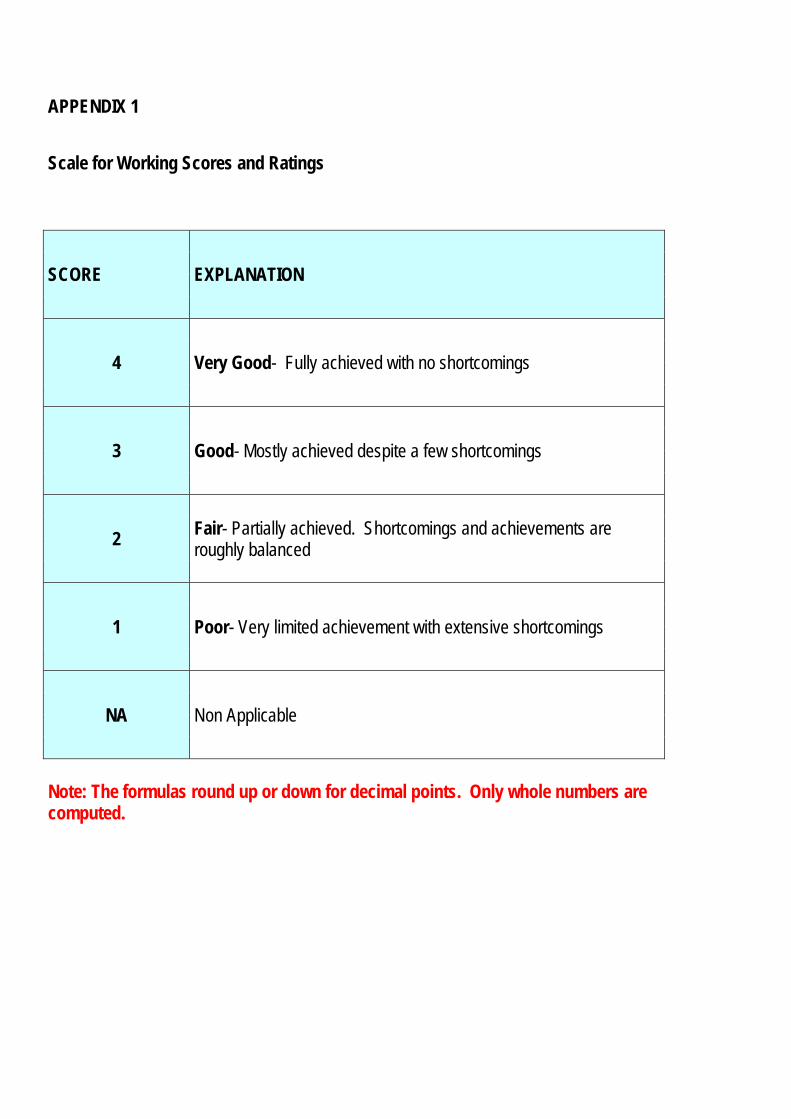
APPENDIX 1
Scale for Working Scores and Ratings
SCORE EXPLANATION
4 Very Good- Fully achieved with no shortcomings
3 Good- Mostly achieved despite a few shortcomings
2 Fair- Partially achieved. Shortcomings and achievements are roughly balanced
1 Poor- Very limited achievement with extensive shortcomings
NA Non Applicable
Note: The formulas round up or down for decimal points. Only whole numbers are computed.
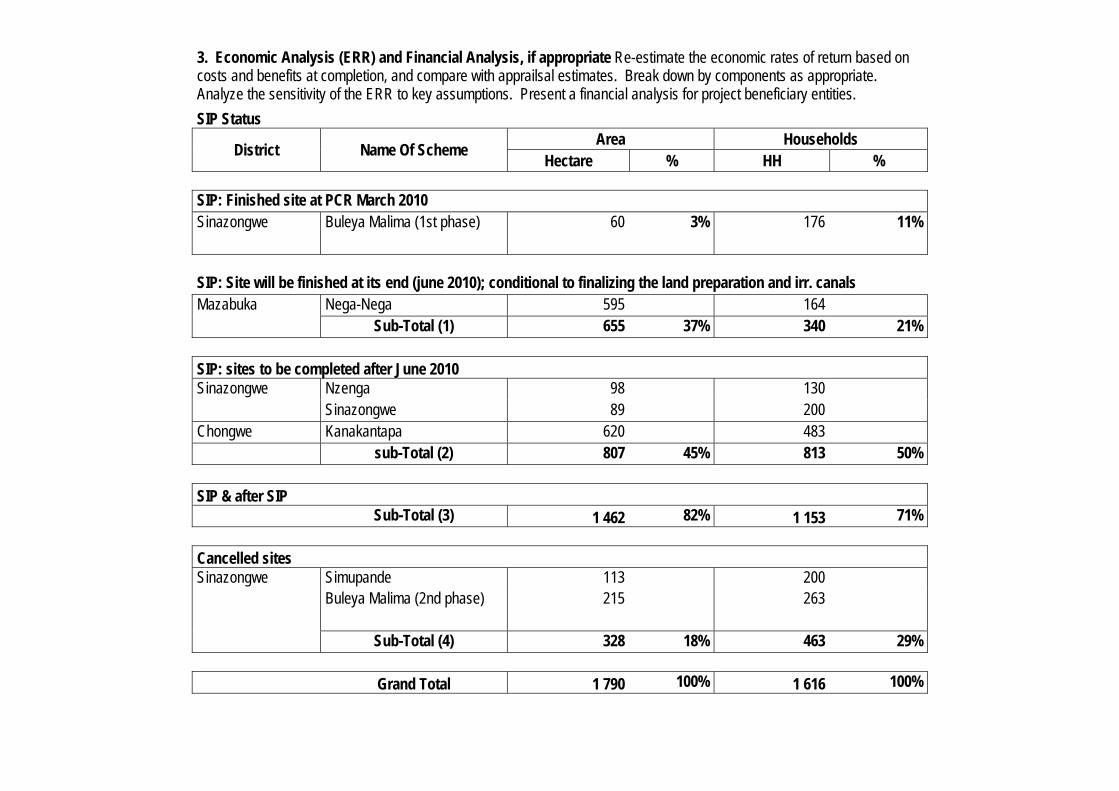
3. Economic Analysis (ERR) and Financial Analysis, if appropriate Re-estimate the economic rates of return based on costs and benefits at completion, and compare with apprailsal estimates. Break down by components as appropriate. Analyze the sensitivity of the ERR to key assumptions. Present a financial analysis for project beneficiary entities. SIP Status
District Name Of Scheme Area Households Hectare % HH %
SIP: Finished site at PCR March 2010 Sinazongwe Buleya Malima (1st phase) 60 3% 176 11%
SIP: Site will be finished at its end (june 2010); conditional to finalizing the land preparation and irr. canals Mazabuka Nega-Nega 595 164 Sub-Total (1) 655 37% 340 21% SIP: sites to be completed after June 2010 Sinazongwe Nzenga 98 130
Sinazongwe 89 200 Chongwe Kanakantapa 620 483 sub-Total (2) 807 45% 813 50% SIP & after SIP Sub-Total (3) 1 462 82% 1 153 71% Cancelled sites Sinazongwe Simupande 113 200
Buleya Malima (2nd phase) 215 263
Sub-Total (4) 328 18% 463 29% Grand Total 1 790 100% 1 616 100%
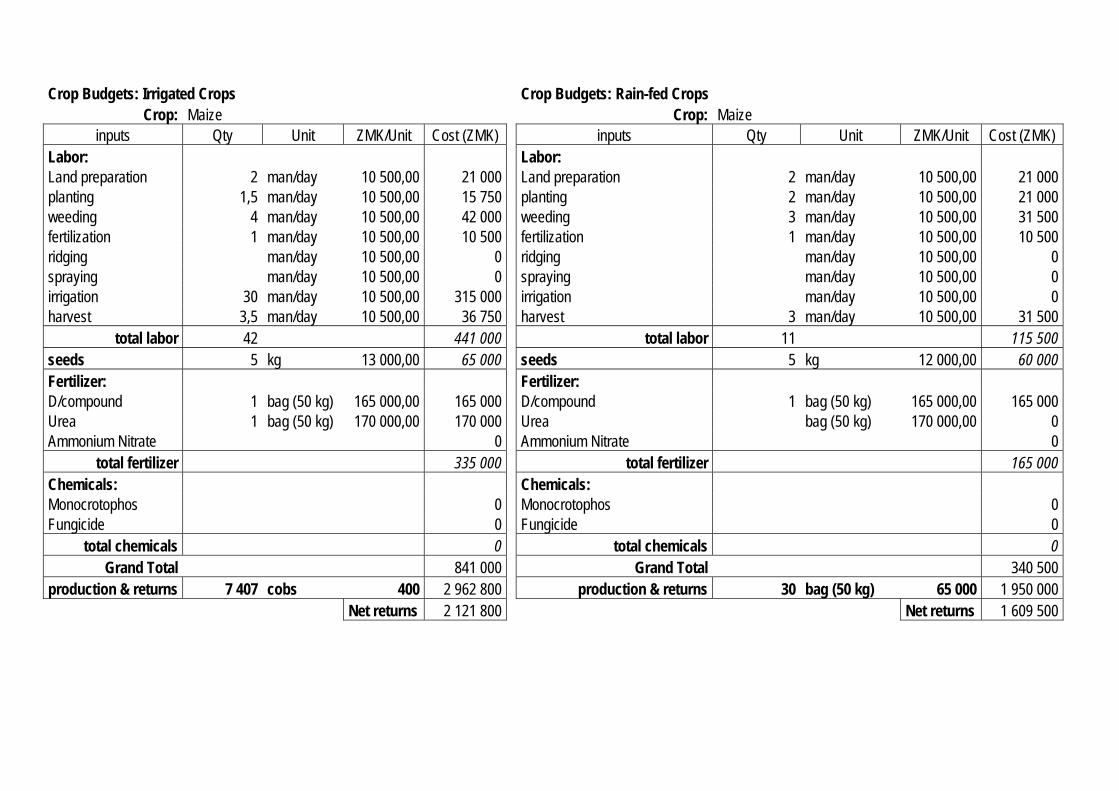
Crop Budgets: Irrigated Crops Crop Budgets: Rain-fed Crops Crop: Maize Crop: Maize
inputs Qty Unit ZMK/Unit Cost (ZMK) inputs Qty Unit ZMK/Unit Cost (ZMK) Labor: Labor: Land preparation 2 man/day 10 500,00 21 000 Land preparation 2 man/day 10 500,00 21 000 planting 1,5 man/day 10 500,00 15 750 planting 2 man/day 10 500,00 21 000 weeding 4 man/day 10 500,00 42 000 weeding 3 man/day 10 500,00 31 500 fertilization 1 man/day 10 500,00 10 500 fertilization 1 man/day 10 500,00 10 500 ridging man/day 10 500,00 0 ridging man/day 10 500,00 0 spraying man/day 10 500,00 0 spraying man/day 10 500,00 0 irrigation 30 man/day 10 500,00 315 000 irrigation man/day 10 500,00 0 harvest 3,5 man/day 10 500,00 36 750 harvest 3 man/day 10 500,00 31 500
total labor 42 441 000 total labor 11 115 500 seeds 5 kg 13 000,00 65 000 seeds 5 kg 12 000,00 60 000 Fertilizer: Fertilizer: D/compound 1 bag (50 kg) 165 000,00 165 000 D/compound 1 bag (50 kg) 165 000,00 165 000 Urea 1 bag (50 kg) 170 000,00 170 000 Urea bag (50 kg) 170 000,00 0 Ammonium Nitrate 0 Ammonium Nitrate 0
total fertilizer 335 000 total fertilizer 165 000 Chemicals: Chemicals: Monocrotophos 0 Monocrotophos 0 Fungicide 0 Fungicide 0
total chemicals 0 total chemicals 0 Grand Total 841 000 Grand Total 340 500
production & returns 7 407 cobs 400 2 962 800 production & returns 30 bag (50 kg) 65 000 1 950 000 Net returns 2 121 800 Net returns 1 609 500
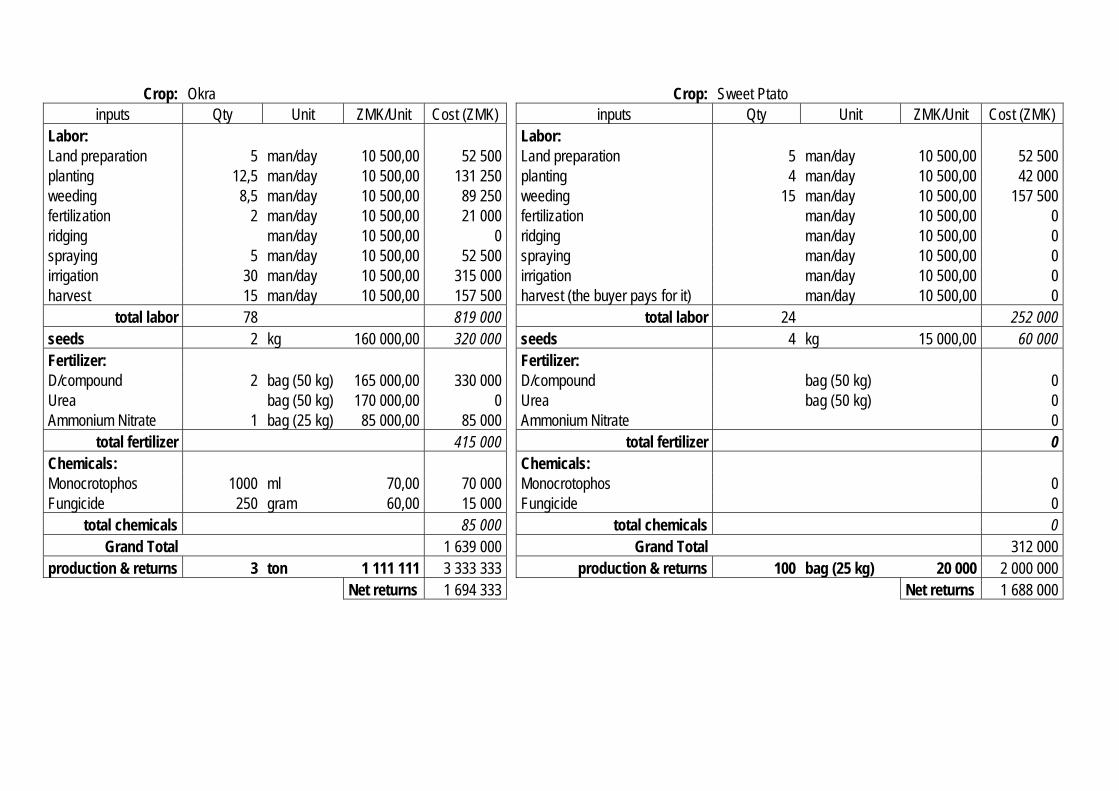
Crop: Okra Crop: Sweet Ptato inputs Qty Unit ZMK/Unit Cost (ZMK) inputs Qty Unit ZMK/Unit Cost (ZMK)
Labor: Labor: Land preparation 5 man/day 10 500,00 52 500 Land preparation 5 man/day 10 500,00 52 500 planting 12,5 man/day 10 500,00 131 250 planting 4 man/day 10 500,00 42 000 weeding 8,5 man/day 10 500,00 89 250 weeding 15 man/day 10 500,00 157 500 fertilization 2 man/day 10 500,00 21 000 fertilization man/day 10 500,00 0 ridging man/day 10 500,00 0 ridging man/day 10 500,00 0 spraying 5 man/day 10 500,00 52 500 spraying man/day 10 500,00 0 irrigation 30 man/day 10 500,00 315 000 irrigation man/day 10 500,00 0 harvest 15 man/day 10 500,00 157 500 harvest (the buyer pays for it) man/day 10 500,00 0
total labor 78 819 000 total labor 24 252 000 seeds 2 kg 160 000,00 320 000 seeds 4 kg 15 000,00 60 000 Fertilizer: Fertilizer: D/compound 2 bag (50 kg) 165 000,00 330 000 D/compound bag (50 kg) 0 Urea bag (50 kg) 170 000,00 0 Urea bag (50 kg) 0 Ammonium Nitrate 1 bag (25 kg) 85 000,00 85 000 Ammonium Nitrate 0
total fertilizer 415 000 total fertilizer 0 Chemicals: Chemicals: Monocrotophos 1000 ml 70,00 70 000 Monocrotophos 0 Fungicide 250 gram 60,00 15 000 Fungicide 0
total chemicals 85 000 total chemicals 0 Grand Total 1 639 000 Grand Total 312 000
production & returns 3 ton 1 111 111 3 333 333 production & returns 100 bag (25 kg) 20 000 2 000 000 Net returns 1 694 333 Net returns 1 688 000
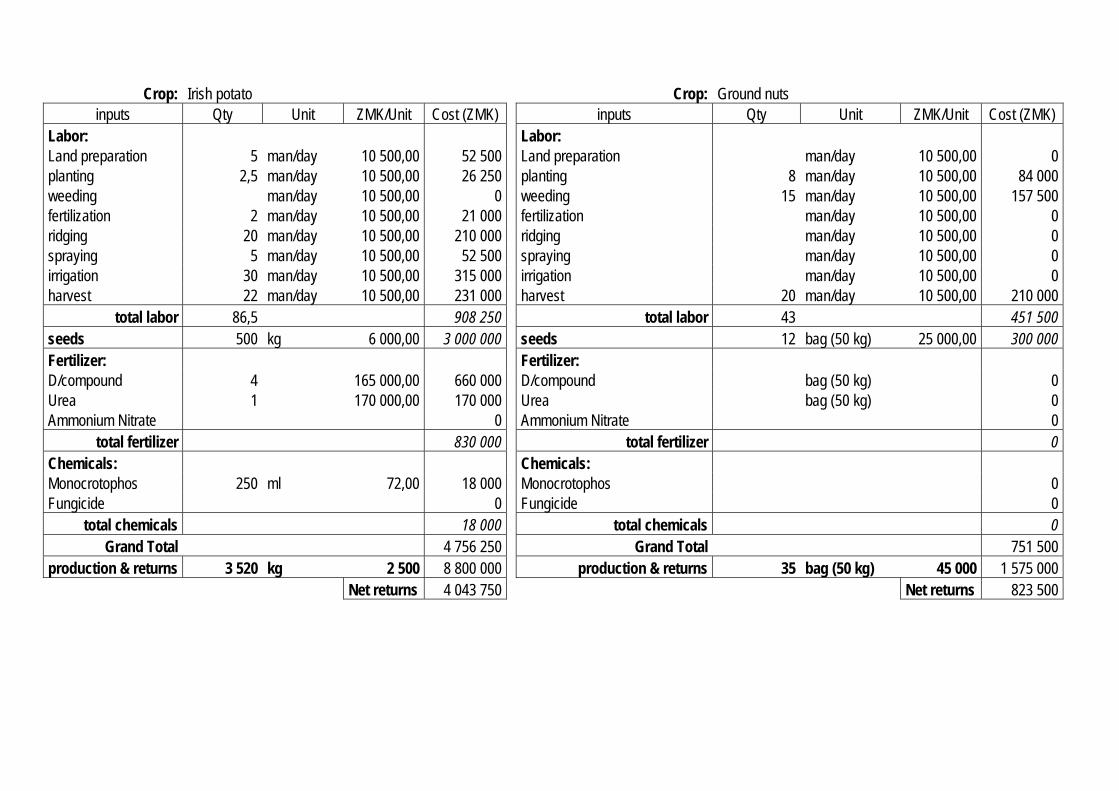
Crop: Irish potato Crop: Ground nuts inputs Qty Unit ZMK/Unit Cost (ZMK) inputs Qty Unit ZMK/Unit Cost (ZMK)
Labor: Labor: Land preparation 5 man/day 10 500,00 52 500 Land preparation man/day 10 500,00 0 planting 2,5 man/day 10 500,00 26 250 planting 8 man/day 10 500,00 84 000 weeding man/day 10 500,00 0 weeding 15 man/day 10 500,00 157 500 fertilization 2 man/day 10 500,00 21 000 fertilization man/day 10 500,00 0 ridging 20 man/day 10 500,00 210 000 ridging man/day 10 500,00 0 spraying 5 man/day 10 500,00 52 500 spraying man/day 10 500,00 0 irrigation 30 man/day 10 500,00 315 000 irrigation man/day 10 500,00 0 harvest 22 man/day 10 500,00 231 000 harvest 20 man/day 10 500,00 210 000
total labor 86,5 908 250 total labor 43 451 500 seeds 500 kg 6 000,00 3 000 000 seeds 12 bag (50 kg) 25 000,00 300 000 Fertilizer: Fertilizer: D/compound 4 165 000,00 660 000 D/compound bag (50 kg) 0 Urea 1 170 000,00 170 000 Urea bag (50 kg) 0 Ammonium Nitrate 0 Ammonium Nitrate 0
total fertilizer 830 000 total fertilizer 0 Chemicals: Chemicals: Monocrotophos 250 ml 72,00 18 000 Monocrotophos 0 Fungicide 0 Fungicide 0
total chemicals 18 000 total chemicals 0 Grand Total 4 756 250 Grand Total 751 500
production & returns 3 520 kg 2 500 8 800 000 production & returns 35 bag (50 kg) 45 000 1 575 000 Net returns 4 043 750 Net returns 823 500
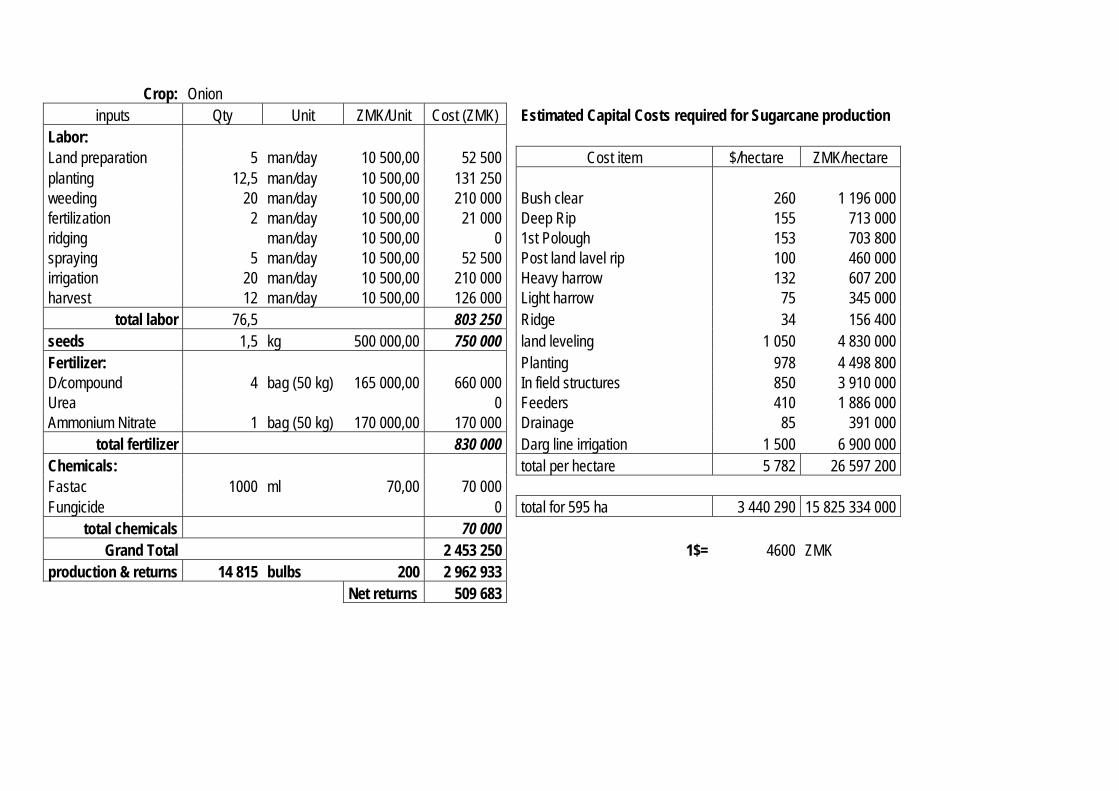
Crop: Onion inputs Qty Unit ZMK/Unit Cost (ZMK) Estimated Capital Costs required for Sugarcane production
Labor: Land preparation 5 man/day 10 500,00 52 500 Cost item $/hectare ZMK/hectare planting 12,5 man/day 10 500,00 131 250 weeding 20 man/day 10 500,00 210 000 Bush clear 260 1 196 000 fertilization 2 man/day 10 500,00 21 000 Deep Rip 155 713 000 ridging man/day 10 500,00 0 1st Polough 153 703 800 spraying 5 man/day 10 500,00 52 500 Post land lavel rip 100 460 000 irrigation 20 man/day 10 500,00 210 000 Heavy harrow 132 607 200 harvest 12 man/day 10 500,00 126 000 Light harrow 75 345 000
total labor 76,5 803 250 Ridge 34 156 400 seeds 1,5 kg 500 000,00 750 000 land leveling 1 050 4 830 000 Fertilizer: Planting 978 4 498 800 D/compound 4 bag (50 kg) 165 000,00 660 000 In field structures 850 3 910 000 Urea 0 Feeders 410 1 886 000 Ammonium Nitrate 1 bag (50 kg) 170 000,00 170 000 Drainage 85 391 000
total fertilizer 830 000 Darg line irrigation 1 500 6 900 000 Chemicals: total per hectare 5 782 26 597 200 Fastac 1000 ml 70,00 70 000 Fungicide 0 total for 595 ha 3 440 290 15 825 334 000
total chemicals 70 000 Grand Total 2 453 250 1$= 4600 ZMK
production & returns 14 815 bulbs 200 2 962 933 Net returns 509 683
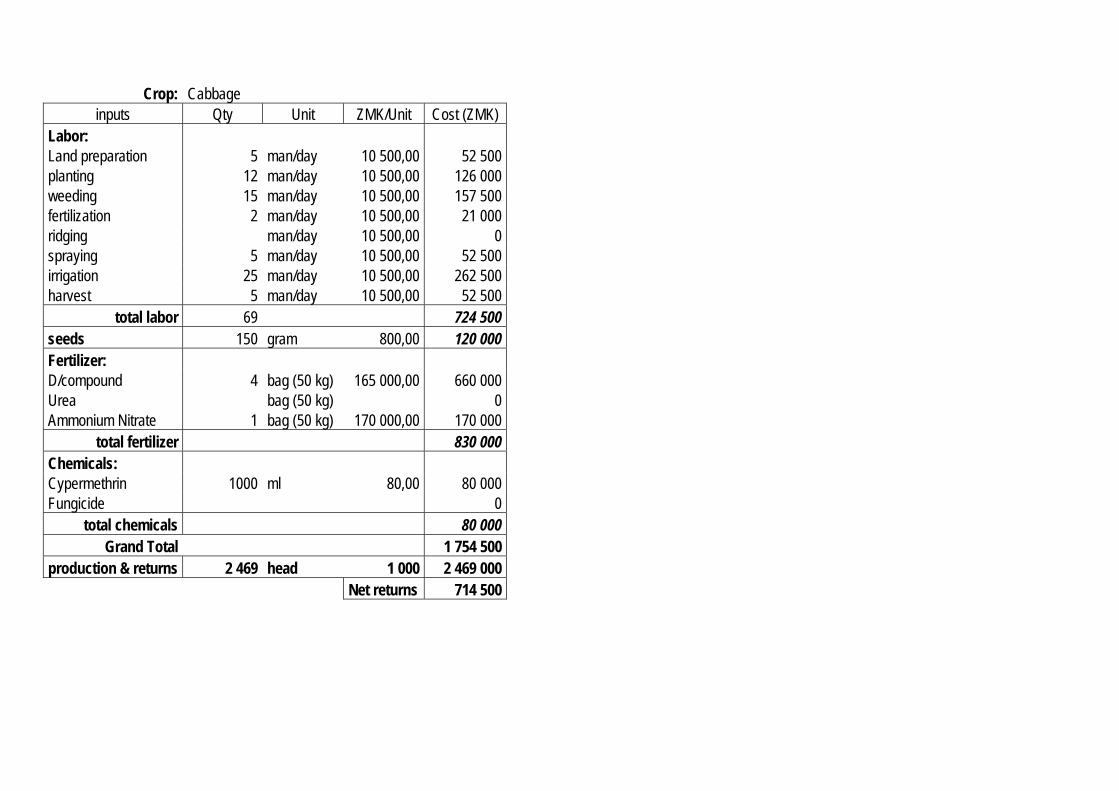
Crop: Cabbage inputs Qty Unit ZMK/Unit Cost (ZMK)
Labor: Land preparation 5 man/day 10 500,00 52 500 planting 12 man/day 10 500,00 126 000 weeding 15 man/day 10 500,00 157 500 fertilization 2 man/day 10 500,00 21 000 ridging man/day 10 500,00 0 spraying 5 man/day 10 500,00 52 500 irrigation 25 man/day 10 500,00 262 500 harvest 5 man/day 10 500,00 52 500
total labor 69 724 500 seeds 150 gram 800,00 120 000 Fertilizer: D/compound 4 bag (50 kg) 165 000,00 660 000 Urea bag (50 kg) 0 Ammonium Nitrate 1 bag (50 kg) 170 000,00 170 000
total fertilizer 830 000 Chemicals: Cypermethrin 1000 ml 80,00 80 000 Fungicide 0
total chemicals 80 000 Grand Total 1 754 500
production & returns 2 469 head 1 000 2 469 000 Net returns 714 500
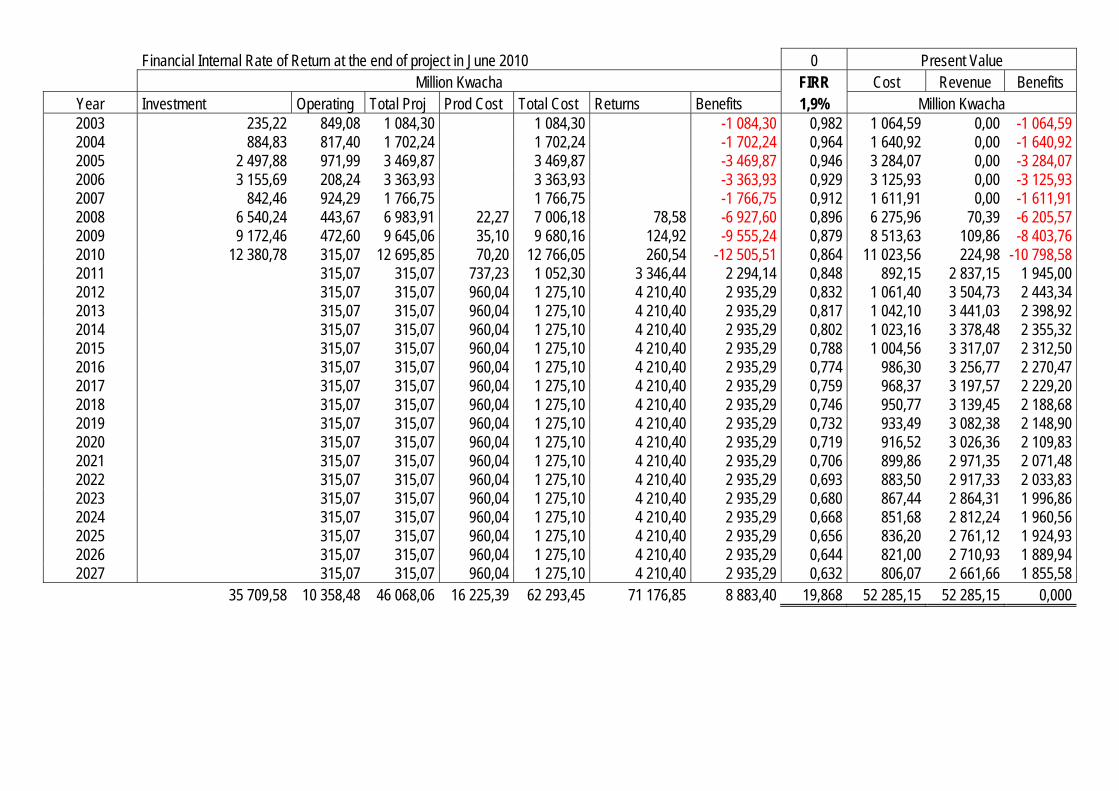
Financial Internal Rate of Return at the end of project in June 2010 0 Present Value Million Kwacha FIRR Cost Revenue Benefits
Year Investment Operating Total Proj Prod Cost Total Cost Returns Benefits 1,9% Million Kwacha 2003 235,22 849,08 1 084,30 1 084,30 -1 084,30 0,982 1 064,59 0,00 -1 064,59 2004 884,83 817,40 1 702,24 1 702,24 -1 702,24 0,964 1 640,92 0,00 -1 640,92 2005 2 497,88 971,99 3 469,87 3 469,87 -3 469,87 0,946 3 284,07 0,00 -3 284,07 2006 3 155,69 208,24 3 363,93 3 363,93 -3 363,93 0,929 3 125,93 0,00 -3 125,93 2007 842,46 924,29 1 766,75 1 766,75 -1 766,75 0,912 1 611,91 0,00 -1 611,91 2008 6 540,24 443,67 6 983,91 22,27 7 006,18 78,58 -6 927,60 0,896 6 275,96 70,39 -6 205,57 2009 9 172,46 472,60 9 645,06 35,10 9 680,16 124,92 -9 555,24 0,879 8 513,63 109,86 -8 403,76 2010 12 380,78 315,07 12 695,85 70,20 12 766,05 260,54 -12 505,51 0,864 11 023,56 224,98 -10 798,58 2011 315,07 315,07 737,23 1 052,30 3 346,44 2 294,14 0,848 892,15 2 837,15 1 945,00 2012 315,07 315,07 960,04 1 275,10 4 210,40 2 935,29 0,832 1 061,40 3 504,73 2 443,34 2013 315,07 315,07 960,04 1 275,10 4 210,40 2 935,29 0,817 1 042,10 3 441,03 2 398,92 2014 315,07 315,07 960,04 1 275,10 4 210,40 2 935,29 0,802 1 023,16 3 378,48 2 355,32 2015 315,07 315,07 960,04 1 275,10 4 210,40 2 935,29 0,788 1 004,56 3 317,07 2 312,50 2016 315,07 315,07 960,04 1 275,10 4 210,40 2 935,29 0,774 986,30 3 256,77 2 270,47 2017 315,07 315,07 960,04 1 275,10 4 210,40 2 935,29 0,759 968,37 3 197,57 2 229,20 2018 315,07 315,07 960,04 1 275,10 4 210,40 2 935,29 0,746 950,77 3 139,45 2 188,68 2019 315,07 315,07 960,04 1 275,10 4 210,40 2 935,29 0,732 933,49 3 082,38 2 148,90 2020 315,07 315,07 960,04 1 275,10 4 210,40 2 935,29 0,719 916,52 3 026,36 2 109,83 2021 315,07 315,07 960,04 1 275,10 4 210,40 2 935,29 0,706 899,86 2 971,35 2 071,48 2022 315,07 315,07 960,04 1 275,10 4 210,40 2 935,29 0,693 883,50 2 917,33 2 033,83 2023 315,07 315,07 960,04 1 275,10 4 210,40 2 935,29 0,680 867,44 2 864,31 1 996,86 2024 315,07 315,07 960,04 1 275,10 4 210,40 2 935,29 0,668 851,68 2 812,24 1 960,56 2025 315,07 315,07 960,04 1 275,10 4 210,40 2 935,29 0,656 836,20 2 761,12 1 924,93 2026 315,07 315,07 960,04 1 275,10 4 210,40 2 935,29 0,644 821,00 2 710,93 1 889,94 2027 315,07 315,07 960,04 1 275,10 4 210,40 2 935,29 0,632 806,07 2 661,66 1 855,58
35 709,58 10 358,48 46 068,06 16 225,39 62 293,45 71 176,85 8 883,40 19,868 52 285,15 52 285,15 0,000
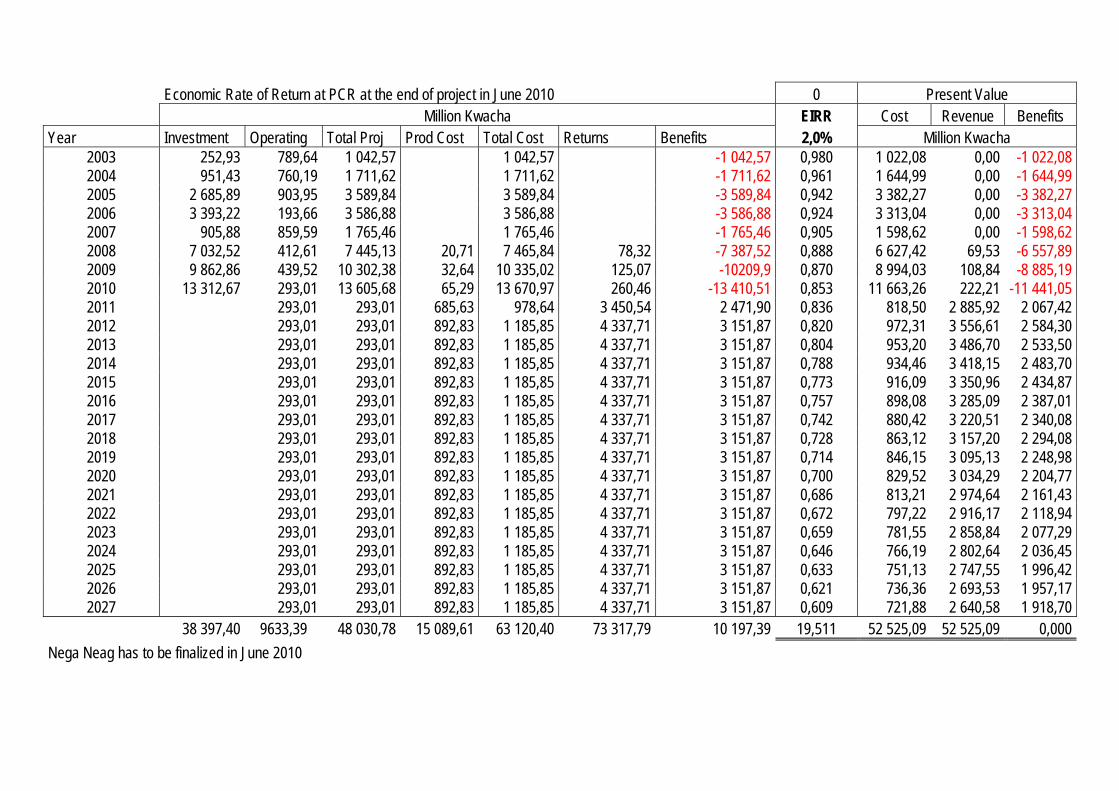
Economic Rate of Return at PCR at the end of project in June 2010 0 Present Value Million Kwacha EIRR Cost Revenue Benefits Year Investment Operating Total Proj Prod Cost Total Cost Returns Benefits 2,0% Million Kwacha
2003 252,93 789,64 1 042,57 1 042,57 -1 042,57 0,980 1 022,08 0,00 -1 022,08 2004 951,43 760,19 1 711,62 1 711,62 -1 711,62 0,961 1 644,99 0,00 -1 644,99 2005 2 685,89 903,95 3 589,84 3 589,84 -3 589,84 0,942 3 382,27 0,00 -3 382,27 2006 3 393,22 193,66 3 586,88 3 586,88 -3 586,88 0,924 3 313,04 0,00 -3 313,04 2007 905,88 859,59 1 765,46 1 765,46 -1 765,46 0,905 1 598,62 0,00 -1 598,62 2008 7 032,52 412,61 7 445,13 20,71 7 465,84 78,32 -7 387,52 0,888 6 627,42 69,53 -6 557,89 2009 9 862,86 439,52 10 302,38 32,64 10 335,02 125,07 -10209,9 0,870 8 994,03 108,84 -8 885,19 2010 13 312,67 293,01 13 605,68 65,29 13 670,97 260,46 -13 410,51 0,853 11 663,26 222,21 -11 441,05 2011 293,01 293,01 685,63 978,64 3 450,54 2 471,90 0,836 818,50 2 885,92 2 067,42 2012 293,01 293,01 892,83 1 185,85 4 337,71 3 151,87 0,820 972,31 3 556,61 2 584,30 2013 293,01 293,01 892,83 1 185,85 4 337,71 3 151,87 0,804 953,20 3 486,70 2 533,50 2014 293,01 293,01 892,83 1 185,85 4 337,71 3 151,87 0,788 934,46 3 418,15 2 483,70 2015 293,01 293,01 892,83 1 185,85 4 337,71 3 151,87 0,773 916,09 3 350,96 2 434,87 2016 293,01 293,01 892,83 1 185,85 4 337,71 3 151,87 0,757 898,08 3 285,09 2 387,01 2017 293,01 293,01 892,83 1 185,85 4 337,71 3 151,87 0,742 880,42 3 220,51 2 340,08 2018 293,01 293,01 892,83 1 185,85 4 337,71 3 151,87 0,728 863,12 3 157,20 2 294,08 2019 293,01 293,01 892,83 1 185,85 4 337,71 3 151,87 0,714 846,15 3 095,13 2 248,98 2020 293,01 293,01 892,83 1 185,85 4 337,71 3 151,87 0,700 829,52 3 034,29 2 204,77 2021 293,01 293,01 892,83 1 185,85 4 337,71 3 151,87 0,686 813,21 2 974,64 2 161,43 2022 293,01 293,01 892,83 1 185,85 4 337,71 3 151,87 0,672 797,22 2 916,17 2 118,94 2023 293,01 293,01 892,83 1 185,85 4 337,71 3 151,87 0,659 781,55 2 858,84 2 077,29 2024 293,01 293,01 892,83 1 185,85 4 337,71 3 151,87 0,646 766,19 2 802,64 2 036,45 2025 293,01 293,01 892,83 1 185,85 4 337,71 3 151,87 0,633 751,13 2 747,55 1 996,42 2026 293,01 293,01 892,83 1 185,85 4 337,71 3 151,87 0,621 736,36 2 693,53 1 957,17 2027 293,01 293,01 892,83 1 185,85 4 337,71 3 151,87 0,609 721,88 2 640,58 1 918,70
38 397,40 9633,39 48 030,78 15 089,61 63 120,40 73 317,79 10 197,39 19,511 52 525,09 52 525,09 0,000 Nega Neag has to be finalized in June 2010
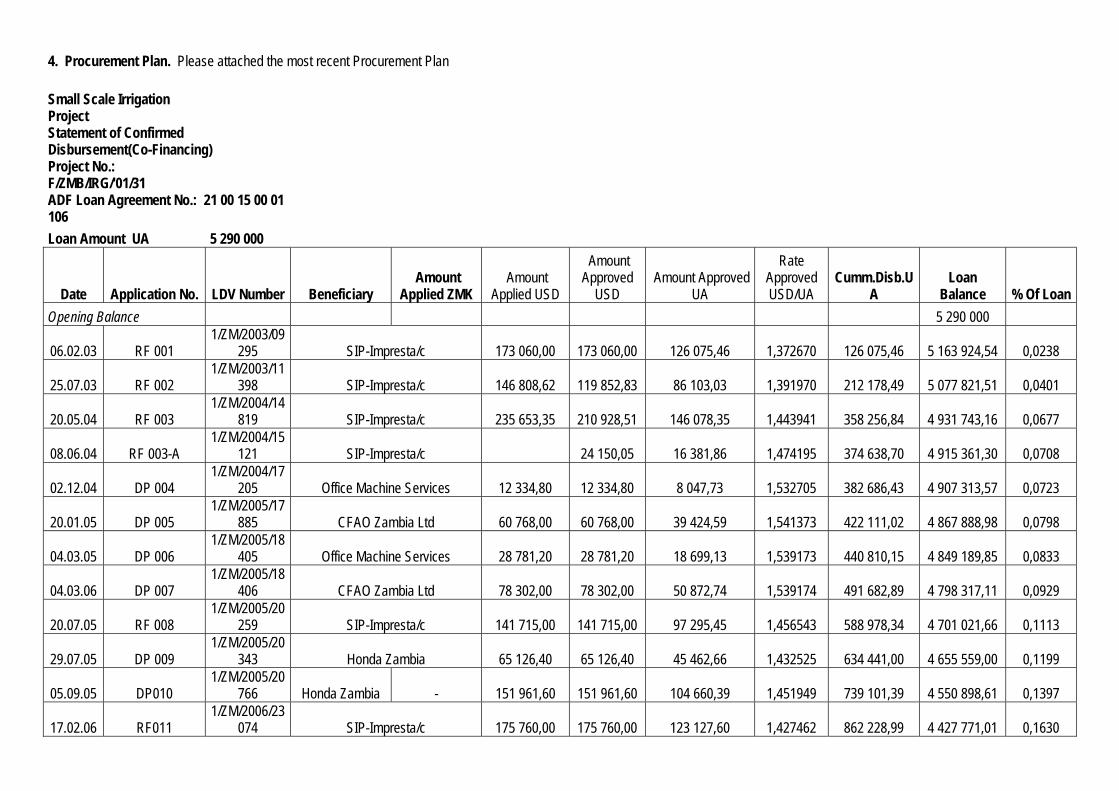
4. Procurement Plan. Please attached the most recent Procurement Plan Small Scale Irrigation Project Statement of Confirmed Disbursement(Co-Financing) Project No.: F/ZMB/IRG/'01/31 ADF Loan Agreement No.: 21 00 15 00 01 106 Loan Amount UA 5 290 000
Date Application No. LDV Number Beneficiary Amount
Applied ZMK Amount
Applied USD
Amount Approved
USD Amount Approved
UA
Rate Approved USD/UA
Cumm.Disb.UA
Loan Balance % Of Loan
Opening Balance 5 290 000
06.02.03 RF 001 1/ZM/2003/09
295 SIP-Impresta/c 173 060,00 173 060,00 126 075,46 1,372670 126 075,46 5 163 924,54 0,0238
25.07.03 RF 002 1/ZM/2003/11
398 SIP-Impresta/c 146 808,62 119 852,83 86 103,03 1,391970 212 178,49 5 077 821,51 0,0401
20.05.04 RF 003 1/ZM/2004/14
819 SIP-Impresta/c 235 653,35 210 928,51 146 078,35 1,443941 358 256,84 4 931 743,16 0,0677
08.06.04 RF 003-A 1/ZM/2004/15
121 SIP-Impresta/c 24 150,05 16 381,86 1,474195 374 638,70 4 915 361,30 0,0708
02.12.04 DP 004 1/ZM/2004/17
205 Office Machine Services 12 334,80 12 334,80 8 047,73 1,532705 382 686,43 4 907 313,57 0,0723
20.01.05 DP 005 1/ZM/2005/17
885 CFAO Zambia Ltd 60 768,00 60 768,00 39 424,59 1,541373 422 111,02 4 867 888,98 0,0798
04.03.05 DP 006 1/ZM/2005/18
405 Office Machine Services 28 781,20 28 781,20 18 699,13 1,539173 440 810,15 4 849 189,85 0,0833
04.03.06 DP 007 1/ZM/2005/18
406 CFAO Zambia Ltd 78 302,00 78 302,00 50 872,74 1,539174 491 682,89 4 798 317,11 0,0929
20.07.05 RF 008 1/ZM/2005/20
259 SIP-Impresta/c 141 715,00 141 715,00 97 295,45 1,456543 588 978,34 4 701 021,66 0,1113
29.07.05 DP 009 1/ZM/2005/20
343 Honda Zambia 65 126,40 65 126,40 45 462,66 1,432525 634 441,00 4 655 559,00 0,1199
05.09.05 DP010 1/ZM/2005/20
766 Honda Zambia - 151 961,60 151 961,60 104 660,39 1,451949 739 101,39 4 550 898,61 0,1397
17.02.06 RF011 1/ZM/2006/23
074 SIP-Impresta/c 175 760,00 175 760,00 123 127,60 1,427462 862 228,99 4 427 771,01 0,1630
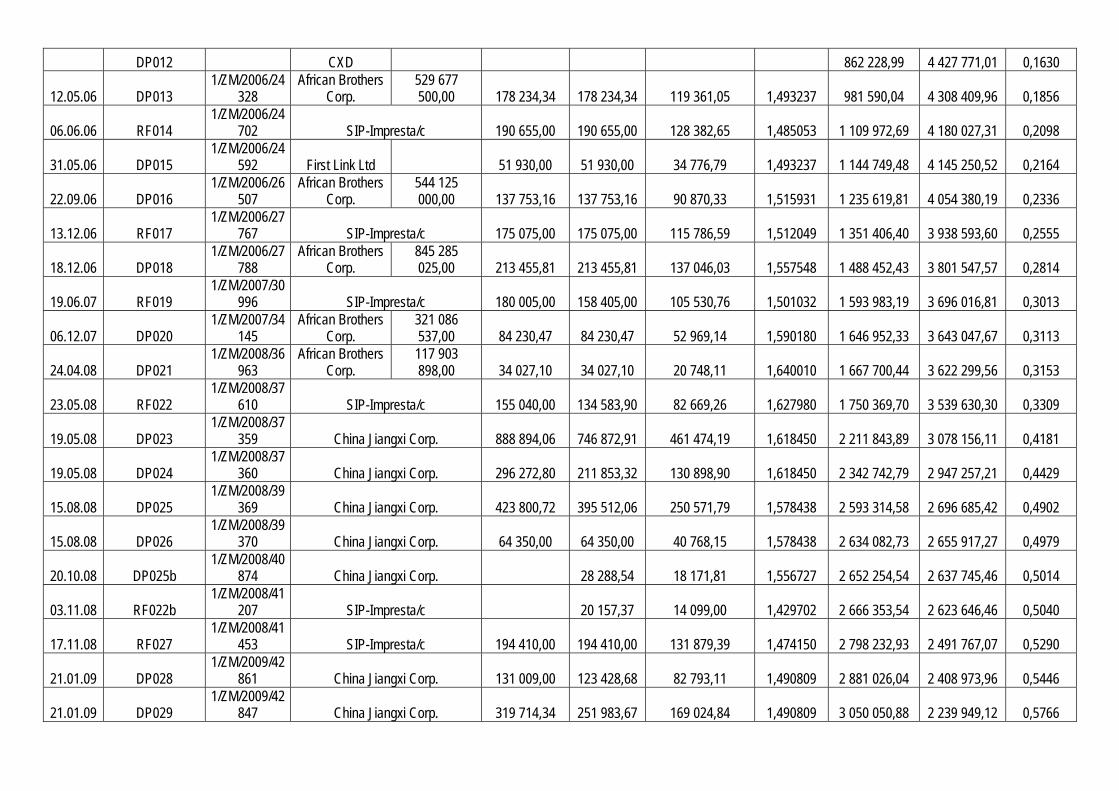
DP012 CXD 862 228,99 4 427 771,01 0,1630
12.05.06 DP013 1/ZM/2006/24
328 African Brothers
Corp. 529 677 500,00 178 234,34 178 234,34 119 361,05 1,493237 981 590,04 4 308 409,96 0,1856
06.06.06 RF014 1/ZM/2006/24
702 SIP-Impresta/c 190 655,00 190 655,00 128 382,65 1,485053 1 109 972,69 4 180 027,31 0,2098
31.05.06 DP015 1/ZM/2006/24
592 First Link Ltd 51 930,00 51 930,00 34 776,79 1,493237 1 144 749,48 4 145 250,52 0,2164
22.09.06 DP016 1/ZM/2006/26
507 African Brothers
Corp. 544 125 000,00 137 753,16 137 753,16 90 870,33 1,515931 1 235 619,81 4 054 380,19 0,2336
13.12.06 RF017 1/ZM/2006/27
767 SIP-Impresta/c 175 075,00 175 075,00 115 786,59 1,512049 1 351 406,40 3 938 593,60 0,2555
18.12.06 DP018 1/ZM/2006/27
788 African Brothers
Corp. 845 285 025,00 213 455,81 213 455,81 137 046,03 1,557548 1 488 452,43 3 801 547,57 0,2814
19.06.07 RF019 1/ZM/2007/30
996 SIP-Impresta/c 180 005,00 158 405,00 105 530,76 1,501032 1 593 983,19 3 696 016,81 0,3013
06.12.07 DP020 1/ZM/2007/34
145 African Brothers
Corp. 321 086 537,00 84 230,47 84 230,47 52 969,14 1,590180 1 646 952,33 3 643 047,67 0,3113
24.04.08 DP021 1/ZM/2008/36
963 African Brothers
Corp. 117 903 898,00 34 027,10 34 027,10 20 748,11 1,640010 1 667 700,44 3 622 299,56 0,3153
23.05.08 RF022 1/ZM/2008/37
610 SIP-Impresta/c 155 040,00 134 583,90 82 669,26 1,627980 1 750 369,70 3 539 630,30 0,3309
19.05.08 DP023 1/ZM/2008/37
359 China Jiangxi Corp. 888 894,06 746 872,91 461 474,19 1,618450 2 211 843,89 3 078 156,11 0,4181
19.05.08 DP024 1/ZM/2008/37
360 China Jiangxi Corp. 296 272,80 211 853,32 130 898,90 1,618450 2 342 742,79 2 947 257,21 0,4429
15.08.08 DP025 1/ZM/2008/39
369 China Jiangxi Corp. 423 800,72 395 512,06 250 571,79 1,578438 2 593 314,58 2 696 685,42 0,4902
15.08.08 DP026 1/ZM/2008/39
370 China Jiangxi Corp. 64 350,00 64 350,00 40 768,15 1,578438 2 634 082,73 2 655 917,27 0,4979
20.10.08 DP025b 1/ZM/2008/40
874 China Jiangxi Corp. 28 288,54 18 171,81 1,556727 2 652 254,54 2 637 745,46 0,5014
03.11.08 RF022b 1/ZM/2008/41
207 SIP-Impresta/c 20 157,37 14 099,00 1,429702 2 666 353,54 2 623 646,46 0,5040
17.11.08 RF027 1/ZM/2008/41
453 SIP-Impresta/c 194 410,00 194 410,00 131 879,39 1,474150 2 798 232,93 2 491 767,07 0,5290
21.01.09 DP028 1/ZM/2009/42
861 China Jiangxi Corp. 131 009,00 123 428,68 82 793,11 1,490809 2 881 026,04 2 408 973,96 0,5446
21.01.09 DP029 1/ZM/2009/42
847 China Jiangxi Corp. 319 714,34 251 983,67 169 024,84 1,490809 3 050 050,88 2 239 949,12 0,5766
20.05.09 RF030 1/ZM/2009/45
714 SIP-Impresta/c 150 000,00 150 000,00 98 786,90 1,518420 3 148 837,78 2 141 162,22 0,5952
04.08.09 DP031 1/ZM/2009/47
761 China Jiangxi Corp. 276 794,67 276 794,67 178 455,17 1,551060 3 327 292,95 1 962 707,05 0,6290
09.09.09 DP033 1/ZM/2009/48
702 China Jiangxi Corp. 411 011,34 411 011,34 264 360,63 1,554737 3 591 653,58 1 698 346,42 0,6790
09.09.09 DP034 1/ZM/2009/48
703 China Jiangxi Corp. 29 536,00 29 536,00 18 997,42 1,554737 3 610 651,00 1 679 349,00 0,6825
30.11.09 DP23b 1/ZM/2009/50
513 China Jiangxi Corp. 142 021,15 142 021,15 88 708,83 1,600981 3 699 359,83 1 590 640,17 0,6993
30.11.09 DP24b 1/ZM/2009/50
514 China Jiangxi Corp. 84 419,48 84 419,48 52 729,85 1,600981 3 752 089,68 1 537 910,32 0,7093
29.12.09 DP037 1/ZM/2009/50
888 China Jiangxi Corp. 471 130,46 471 130,46 301 326,79 1,563520 4 053 416,47 1 236 583,53 0,7662
29.12.09 RF032 1/ZM/2009/51
127 China Jiangxi
Corp. 272 295 934,46 58 388,04 58 388,04 37 343,97 1,563520 4 090 760,44 1 199 239,56 0,7733
25.01.10 DP038 1/ZM/2010/51
830 China Jiangxi Corp. 242 048,56 242 048,56 155 015,25 1,561450 4 245 775,69 1 044 224,31 0,8026
01.02.10 DP039 1/ZM/2010/52
078 China Jiangxi Corp. 12 701,77 12 701,77 8 136,27 1,561129 4 253 911,96 1 036 088,04 0,8041
18.02.10 DP040 1/ZM/2010/52
356 China Jiangxi Corp. 900 222,85 900 222,85 587 325,30 1,532750 4 841 237,26 448 762,74 0,9152 *23.02.1
0 DP041 China Jiangxi Corp. 122 056,49 4 841 237,26 448 762,74 0,9152 *24.02.1
0 DP042 China Jiangxi Corp. 84 258,52 4 841 237,26 448 762,74 0,9152 Totals 2 630 373 894 7 973 717 7 416 221 4 841 237 From the 1st Disbusement Request received February 2003 to date we have utilised 91.52% of the total loan amount. *Date Prepared, NOT CONFIRMED PAYMENT
Small Scale Irrigation Project Statement of Confirmed Disbursement (Co-Financing) Project No.: F/ZMB/IRG/'01/31 TAF Protocol Agreement No.: 21 00 15 50 00 489 Grant Amount UA 760 000
Date Applicati
on No. LDV Number Beneficiary Amount
Applied USD
Amount Approved
USD
Amount Approved
UA Rate Approved
USD/UA Cumm.Disb.U
A
Undisbursed Grant Balance % Of Grant
Opening Balance 760 000
16.11.04 RF 001 1/ZM/2004/16950 SIP-Impresta/c 135 856,28 135
856,28 90 860,82 1,495213 90 860,82 669 139,18 0,1196 28.04.05 RF 002 1/ZM/2005/19094 SIP-Impresta/c 76 700,00 76 700,00 50 476,40 1,519522 141 337,22 618 662,78 0,1860 18.07.05 RF 003 1/ZM/2005/20225 SIP-Impresta/c 50 000,00 50 000,00 34 243,36 1,460137 175 580,58 584 419,42 0,2310 23.01.06 RF 004 1/ZM/2006/22689 SIP-Impresta/c 95 000,00 95 000,00 65 327,52 1,454211 240 908,10 519 091,90 0,3170
20.07.06 DP005 1/ZM/2006/25434 FINTECS
Consultants 97 925,00 97 925,00 66 900,36 1,463744 307 808,46 452 191,54 0,4050
22.01.07 DP006 1/ZM/2007/28355 FINTECS
Consultants 39 170,00 39 170,00 26 213,29 1,494280 334 021,76 425 978,24 0,4395
27.09.07 DP007 1/ZM/2007/32919 FINTECS
Consultants 58 755,00 58 755,00 37 789,13 1,554812 371 810,89 388 189,11 0,4892
22.04.09 DP008 1/ZM/2009/45022 FINTECS
Consultants 39 170,00 39 170,00 26 212,26 1,492809 398 023,15 361 976,85 0,5237
22.04.09 DP009 1/ZM/2009/44990 FINTECS
Consultants 39 170,00 39 170,00 26 212,26 1,492809 424 235,41 335 764,59 0,5582
22.04.09 DP010 1/ZM/2009/45031 FINTECS
Consultants 39 170,00 39 170,00 26 212,26 1,492809 450 447,67 309 552,33 0,5927
16.11.09 DP011 1/ZM/2009/50084 FINTECS
Consultants 39 170,00 39 170,00 24 375,99 1,606909 474 823,66 285 176,34 0,6248 Totals 710 086,28 710 086,2 474 823,6
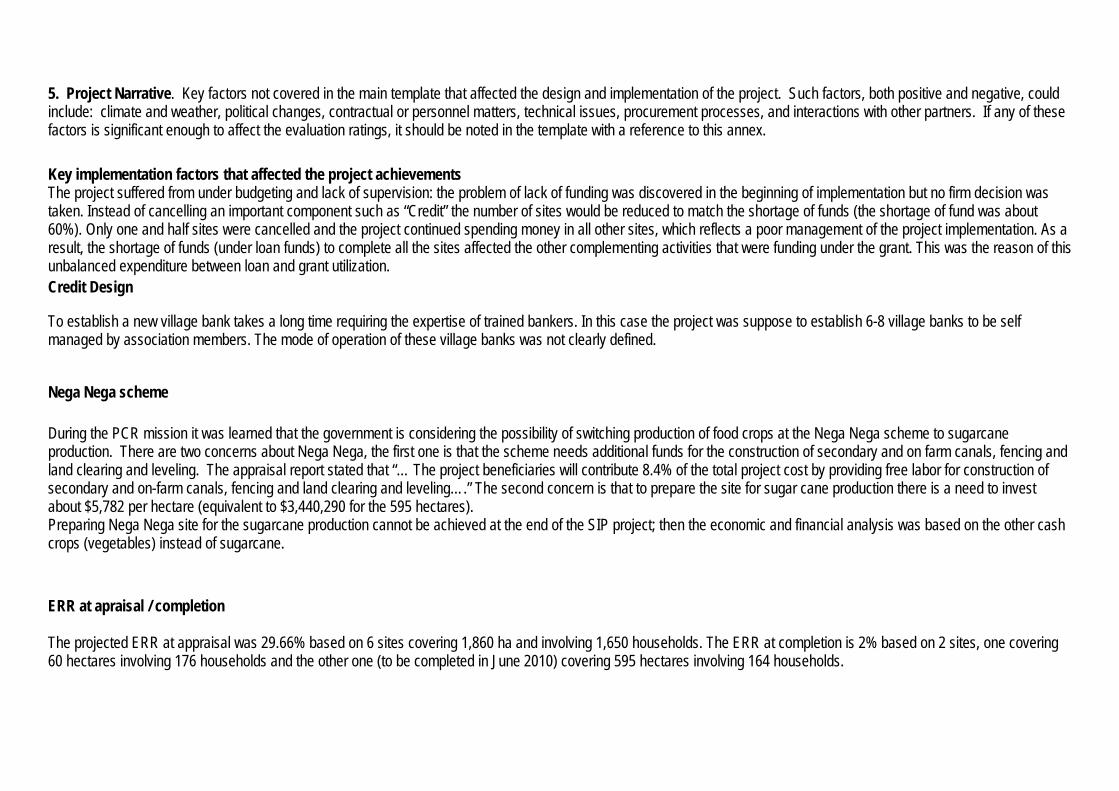
5. Project Narrative. Key factors not covered in the main template that affected the design and implementation of the project. Such factors, both positive and negative, could include: climate and weather, political changes, contractual or personnel matters, technical issues, procurement processes, and interactions with other partners. If any of these factors is significant enough to affect the evaluation ratings, it should be noted in the template with a reference to this annex. Key implementation factors that affected the project achievements The project suffered from under budgeting and lack of supervision: the problem of lack of funding was discovered in the beginning of implementation but no firm decision was taken. Instead of cancelling an important component such as “Credit” the number of sites would be reduced to match the shortage of funds (the shortage of fund was about 60%). Only one and half sites were cancelled and the project continued spending money in all other sites, which reflects a poor management of the project implementation. As a result, the shortage of funds (under loan funds) to complete all the sites affected the other complementing activities that were funding under the grant. This was the reason of this unbalanced expenditure between loan and grant utilization. Credit Design
To establish a new village bank takes a long time requiring the expertise of trained bankers. In this case the project was suppose to establish 6-8 village banks to be self managed by association members. The mode of operation of these village banks was not clearly defined.
Nega Nega scheme
During the PCR mission it was learned that the government is considering the possibility of switching production of food crops at the Nega Nega scheme to sugarcane production. There are two concerns about Nega Nega, the first one is that the scheme needs additional funds for the construction of secondary and on farm canals, fencing and land clearing and leveling. The appraisal report stated that “… The project beneficiaries will contribute 8.4% of the total project cost by providing free labor for construction of secondary and on-farm canals, fencing and land clearing and leveling….” The second concern is that to prepare the site for sugar cane production there is a need to invest about $5,782 per hectare (equivalent to $3,440,290 for the 595 hectares). Preparing Nega Nega site for the sugarcane production cannot be achieved at the end of the SIP project; then the economic and financial analysis was based on the other cash crops (vegetables) instead of sugarcane.
ERR at apraisal / completion The projected ERR at appraisal was 29.66% based on 6 sites covering 1,860 ha and involving 1,650 households. The ERR at completion is 2% based on 2 sites, one covering 60 hectares involving 176 households and the other one (to be completed in June 2010) covering 595 hectares involving 164 households.


![PROJECT COMPLETION REPORT ON THE URBAN ...ASIAN DEVELOPMENT BANK PCR: VAN 23616 PROJECT COMPLETION REPORT ON THE URBAN INFRASTRUCTURE PROJECT (Loan No. 1448-VAN [SF]) TO VANUATU June](https://img.pdfslide.net/doc/110x75/60af9a4e1a7f4f59226d8ffb/project-completion-report-on-the-urban-asian-development-bank-pcr-van-23616.jpg)


![ASIAN DEVELOPMENT BANK PCR: CAM 27410€¦ · ASIAN DEVELOPMENT BANK PCR: CAM 27410 PROJECT COMPLETION REPORT ON THE BASIC HEALTH SERVICES PROJECT (Loan 1447-CAM[SF]) IN CAMBODIA](https://img.pdfslide.net/doc/110x75/5f0729017e708231d41b9b0c/asian-development-bank-pcr-cam-27410-asian-development-bank-pcr-cam-27410-project.jpg)


![ASIAN DEVELOPMENT BANK PCR: INO 21147 · asian development bank pcr: ino 21147 project completion report on the nusa tenggara agriculture development project (loan nos. 952[sf]/953-ino)](https://img.pdfslide.net/doc/110x75/5e1dcbab74e6446e9f29f664/asian-development-bank-pcr-ino-21147-asian-development-bank-pcr-ino-21147-project.jpg)