Embed Size (px)
Citation preview

Do
cto
ral
Th
ese
s a
t N
TN
U,
20
06
:17
5
Nil
s O
lsso
n
Pro
ject
Fle
xibi
lity
in L
arge
Eng
inee
ring
Pro
ject
s
ISB
N 8
2-4
71
-81
21
-5
(pri
nte
d v
er.
)
ISB
N 8
2-4
71
-81
20
-7 (
ele
ctr
on
ic v
er.
)
ISS
N 1
50
3-8
18
1
NTNUNorwegian University ofScience and TechnologyThesis for the degree of
doktor ingeniørFaculty of Engineering Science and TechnologyDepartment of Civil and Transport Engineering
Doctoral Theses at NTNU, 2006:175Nils Olsson

Thesis for the degree of doktor ingeniør
Trondheim, September 2006
Norwegian University of
Science and Technology
Faculty of Engineering Science and Technology
Department of Civil and Transport Engineering
Nils Olsson
Project Flexibility in LargeEngineering Projects

i
Preface and Acknowledgements
The work presented in this thesis has been carried out at Department of Civil and Transport Engineering at NTNU. I would like to express my sincere thanks for the supportive and inspiring guidance that I have received from my supervisor Professor Knut Samset. He has always supported my choices and believed that this could be done.
During my work on several large projects, project flexibility has emerged as a key issue. I have frequently observed it to be a critical success factor, major risk and conflict topic, but rarely as an issue that was subject to a common understanding and a structured approach for handling. It appeared to be an area where it was possible to make a research contribution. Consequently, the topic became the ‘glue’ in the thesis.
Both scientifically and financially, this research has benefited from the Concept research programme. Concept focuses on front-end management of major investment projects. Funded by the Norwegian Ministry of Finance, the programme aims to develop know-how to make more efficient use of resources and improve the effectiveness of major public investments. In addition, I have received financial and scientific support from the Department of Civil and Transport Engineering at NTNU. This research has also been carried out in co-ordination with railway related research involving NSB AS, the Norwegian National Rail Administration and the Norwegian Research council.
Throughout the work on the thesis, I have enjoyed the discussions with my fellow Ph.D. candidates Ola Lædre, Ole Morten Magnussen, Andreas Seim, Mads Veiseth and Alexander Langlo. I have also appreciated the valuable co-operation with Per T. Eikeland, Ole Jonny Klakegg and Agnar Johansen.
My warmest thanks and love go to my wife, Rønnaug, and sons, Erland, Einar and Henrik, who have supported me all the way. According to the boys, the work on this thesis has made me more like a ‘nerd’ than ever before. My parents and sister have also been supportive. They have all personally illustrated what lifelong learning really means. Thanks to my father for proof reading.
And warm thanks to all my friends and colleagues at NTNU and SINTEF; it has been a pleasure working with you.
Trondheim, September 18, 2006
Nils Olsson

ii

iii
Part 1.

iv
v
Table of Contents
Preface and Acknowledgements ................................................................................................... iTable of Contents .......................................................................................................................... vFigures and Tables....................................................................................................................... viPaper Overview ........................................................................................................................ viiAbstract ......................................................................................................................... ix1. Introduction .......................................................................................................................... 1
1.1 Perspectives on project management............................................................................... 1 1.2 Uncertainty....................................................................................................................... 2 1.3 Flexibility......................................................................................................................... 2 1.4 Project flexibility ............................................................................................................. 3 1.5 Efficiency versus effectiveness........................................................................................ 4 1.6 Structure of the thesis ...................................................................................................... 5 1.7 Research questions........................................................................................................... 5
2. Study design .......................................................................................................................... 72.1 Research approach ........................................................................................................... 7 2.2 Empirical evidence .......................................................................................................... 7 2.3 Quality of information ..................................................................................................... 9
3. Flexibility in different project phases................................................................................ 113.1 A time perspective on projects....................................................................................... 11 3.2 Quantifications of flexibility based on scope reduction options.................................... 12 3.3 Flexibility visualisations ................................................................................................ 14
4. Project stakeholders ............................................................................................................ 174.1 Stakeholders................................................................................................................... 17 4.2 Incentives ....................................................................................................................... 18 4.3 Internal and external flexibility...................................................................................... 18
5. Effectiveness and efficiency ................................................................................................ 235.1 Cost implications ........................................................................................................... 23 5.2 Changes ........................................................................................................................ 24 5.3 Redundancy ................................................................................................................... 26
6. Project flexibility categorisations....................................................................................... 296.1 Producing a flexible result or producing the result in a flexible manner....................... 29 6.2 Modularity ..................................................................................................................... 31
7. Conclusions ........................................................................................................................ 357.1 How can different aspects of flexibility in projects be analysed? ................................. 35 7.2 What are the implications for front-end management? ................................................. 39 7.3 Generalising results........................................................................................................ 43 7.4 Further research ............................................................................................................. 44
References ........................................................................................................................ 47

vi
Figures and Tables
FiguresFigure 1. Performance measurement dimensions. (Moseng & Bredrup 1993) .............4 Figure 2. Development of selected project characteristics in a time perspective. (Paper
3, fig. 1. Based on Christensen & Kreiner 1991: 40, Midler 1995: 369, Samset 2001: 33, Mikkelsen & Riis 2003: 47).................................................................12
Figure 3. The relative size of the reduction lists as a percentage of the total budget at different phases of the projects. N=19 .................................................................14
Figure 4. Consequences of different values of the uncertainty, significance of decisions and the degree of freedom to manoeuvre compared to the desired room for manoeuvring in different project phases. (Paper 7, fig. 6. Based on Eikeland 2001: 40) ..............................................................................................................15
Figure 5. Internal and external flexibility, combined with internal and contextual uncertainty............................................................................................................19
Figure 6. Stakeholder perspectives on external flexibility in project phases...............20 Figure 7. External and internal flexibility in a time perspective..................................21 Figure 8. Indications of cost in relation to the degree of flexibility for internal
flexibility and external flexibility. .......................................................................24 Figure 9. Flexibility strategies in relation to redundancy and change management.
(Paper 8, fig. 3) ....................................................................................................27 Figure 10. Flexibility in the product and the decision process. (Based on Paper 1, fig.
1) ..........................................................................................................................30 Figure 11. A model for planning and execution of railway investment projects, and
how the studied projects fit the model. (Paper 5, fig. 2) ......................................32 Figure 12. The Norwegian rail network and location of studied projects (in grey). The
size and location of the new built rail lines are only for illustrational purpose. (Paper 5, fig. 1) ....................................................................................................33
Figure 13. Framework for analysing project flexibility. (Paper 8, fig. 1)....................35 Figure 14. Internal and external flexibility versus efficiency and effectiveness. ........37 Figure 15. Illustration of a situation of late locking of scope and fast execution.
(Based on Midler 1995, fig. 5).............................................................................41 Figure 16. Illustration of a situation of where areas of uncertainty are shielded off for
late locking. (Paper 7, fig. 7)................................................................................42 Figure 17. Illustration of a situation of incremental commitments, in three steps.......42 Figure 18. Illustration of a situation where a project is designed to absorb changes.
(Based on Figure 4)..............................................................................................43
TablesTable 1. The primary information sources upon which the thesis is based. ..................9 Table 2. Observed impact from the studied project strategies. (Paper 5, table 8) .......33 Table 3. Approaches to external flexibility management. ...........................................40
vii
Paper Overview The following papers are found in Part 2 of the thesis.
Paper 1. Olsson, N.O.E. 2006. Management of flexibility in projects. International Journal of
Project Management 24:1, 66–74.
Paper 2. Magnussen, O.M. & Olsson, N.O.E. 2006. Comparative analysis of cost estimates of
major public investment projects. International Journal of Project Management 24:4, 281–288.
Paper 3. Olsson, N.O.E. & Magnussen, O.M. 2006. ‘Projects trapped in their freedom:
Flexibility aspects of front-end quality assurance of major projects’. Paper submitted to Project Management Journal.
Paper 4. Olsson, N.O.E. 2004. ‘Flexibility in Engineering Projects: Blessing or Curse?’ Paper
presented at the NORDNET 2004 International PM Conference, 29 September – 1 October 2004, Helsinki, Finland.
Paper 5. Olsson, N.O.E. 2006. ‘Impact analysis of railway projects in a flexibility perspective’.
Transport Reviews 26:5, 557-569.
Paper 6. Henriksen, B., Olsson, N. & Seim, A. 2006. ‘Adjustments, effectiveness and
efficiency in Norwegian hospital construction projects’. Proceedings CIB W70 Trondheim International Symposium. Changing User Demands on Buildings, 12–14 June 2006, Trondheim, Norway.
Paper 7. Olsson, N.O.E. & Samset, K. 2006. ‘Front-End Management, Flexibility and Project
Success’. Paper presented at PMI Conference, 17-19 July 2006, Montreal, Canada.
Paper 8. Olsson, N.O.E. 2006.‘Flexibility and Front-End Management; Key to Project Success
and failure’ Paper accepted for presentation by ProMAC International Conference on Project Management, 27-29 September 2006, Sydney, Australia.

viii

ix
Abstract
Traditionally, projects tend to strive for increased predictability by managing details and attempting to bring all variables under control. However, experience shows that the chance of realising a plan without major amendments decreases with an increasing time horizon, which points to a need for flexible projects. A number of scholars argue that flexibility is necessary to face changes and uncertainty in the business environment. On the other hand, flexible projects are generally not described as desirable in project management literature. These conflicting approaches to flexibility have justified an analysis of the dynamics related to project flexibility, both from a theoretical and an empirical perspective. Such an analysis is presented in this thesis, based on analyses of large engineering projects in Norway. Most of the projects are governmental investments.
This thesis aims at structuring knowledge on project flexibility. Two types of results have emerged; the first related to how to analyse project flexibility, and the second related to how to manage flexible projects. Based on studies of different parts of the life cycle of projects, the research provides indications as to how flexibility can be addressed in the front-end phase of large public investments. A framework for analysing project flexibility is also proposed.
Chapter 1 discusses flexibility in a project management perspective, and raises key research questions. The research presented in this thesis addresses the dynamics between utilising benefits from flexible approaches and avoiding drawbacks. Being flexible is characterised by a capability to adapt to new, different or changing requirements.
Flexibility is used in a rather wide sense in the thesis, but is always related to the managing effects of uncertainty. Project flexibility includes adjustments and preparations in response to both internal and contextual uncertainty, such as for example, scope change management, iterative decision process and adjustments related to uncertain funding. Chapter 1 ends with two key research questions related to how to analyse and manage project flexibility.
Chapter 2 presents the research design. The thesis is based on nine papers. These papers are summarised in part one of the thesis. Three main data sources have been used, along with complementary information. First, project evaluations and summaries of 18 Norwegian investment projects have been analysed. Second, this research has benefited from access to an established database for major governmental investments, including results from 48 front-end assessments of large governmental projects. Third, a wider range of data has been collected in a multi-case study of four Norwegian railway projects.
The research is based on an inductive-deductive approach, using a combination of qualitative and quantitative information. Validity and reliability associated with the data used in this thesis are not sufficient to provide solid answers, taken in isolation. As is common in project management research, the small samples in the studies generally do not support statistical analysis of the data, particularly when subgroups of the material are subject to analysis. However, the research has taken previous

x
studies of related issues into account. The results presented in the thesis support many of the findings from other studies, but also indicate some nuances to common understanding of project flexibility. Further research is needed to clarify to what extent these indications are of a general nature or project-specific.
Chapter 3 discusses project flexibility in different project phases. A distinction is made between three project phases: front-end, planning and execution. Both this thesis and previous research point to a flexible front-end phase as the least controversial aspect of project flexibility. Low flexibility after the front-end phase increases the likelihood of projects being completed on time, within budget and according to specifications. Some models and measures of project flexibility in a time perspective are also presented in this chapter.
Chapter 4 analyses project flexibility from a stakeholder perspective. Project stakeholders are actively involved in a project, or their interests may be positively or negatively affected by the project. Project flexibility is perceived differently by different stakeholders. Flexibility for one project stakeholder can be another stakeholder’s risk.
An analysis of flexibility in stakeholder perspective called for a distinction between internal and external project flexibility. Project internal flexibility relates to flexibility within defined scope – how requirements are to be met. External flexibility refers to adjustments of project scope – what requirements are to be met. Project internal flexibility appears to be particularly desirable to project managers and contractors. Project external flexibility is more likely to be looked upon favourably by users and project owners. Incentives open to stakeholders affect their approaches to project flexibility. In general, flexible projects have a value for stakeholders which benefit from adjustments and come at a cost for those who have to adapt.
Chapter 5 highlights the relevance of efficiency and effectiveness when discussing flexible projects. In general, efficiency is related to producing direct project outputs, often measured in terms of cost, time and quality. Effectiveness is related to added value for owners and users. The case in favour of flexibility emphasises the possibility to increase a project’s effectiveness. The case against project flexibility highlights the negative effects on efficiency due to changes and the possibilities for frustration due to lack of decisions and commitments.
Analyses presented in this thesis indicate challenges in materialising the expected benefits of flexible projects. On the other hand, the expected decrease in efficiency in flexible projects has been frequently observed throughout the analysis. Chapter 5 also addresses redundancy as an enabler for project flexibility. Redundancy is created when more resources than strictly necessary are available. The logic behind redundancy is that a project with redundant resources will be efficient because it can be executed as planned, compared to a project with no redundancy that turns out to be error-prone in reality.
Chapter 6 discusses flexibility related to modularity, flexible decision processes and flexible final products. Flexibility in the decision process means that decisions and commitments in projects are made sequentially over phases. Flexibility in the product is achieved when the final product that a project is to produce is prepared for

xi
alternative use. There are indications that flexible projects utilise both flexible products and flexible decision processes, rather than emphasising one of these dimensions at the expense of the other. When analysing flexibility in decision processes, there was a need to make a distinction between planned and actual approaches to flexibility. Actual approaches turn out to be different from planned ones.
Modularity can be an enabler for flexible project management. On a macro level, modularity means that projects are divided into independent sub-units. Decision makers can then make incremental commitments to each sub-unit at a time. In the studied projects, macro modularisation was associated with cost control but also with lower benefit realisation than planned. On a micro level, modularisation means a decomposition of a product into modules with specified interfaces. Such modularisation can reduce the ‘knock-on’ effects of design changes.
Chapter 7 summarises a framework for analysing project flexibility and indicates guidelines for managing flexible projects. The framework for analysis consists of project flexibility categorisations, perspectives of analysis, and flexibility drivers and enablers. Approaches for the management of project flexibility are also suggested in Chapter 7. Successful strategies for project flexibility either aim at avoiding flexibility or at enabling projects to be flexible. Projects can avoid adjustments or live with them. One key to successful flexibility management in projects lies in the transition from an initial open-minded environment to the subsequent focused phases. Based on the results in the thesis, an attempt is made to list approaches to project flexibility management.
Even though the results are based on studies of only a few projects, there are indications that the drawbacks of flexible projects are largest when projects do not prepare for future adjustments. This notion is consistent with previous works on flexibility, which highlight that flexible decisions require a structural framework of strategies and guidelines. The suggested approaches and categorisations related to project flexibility are intended as an input to such a structural framework.

xii
.
1. Introduction
1
1. Introduction
This chapter discusses different approaches to project management from a flexibility perspective. One purpose of the chapter is to define how project flexibility is understood in this thesis, but also to give some illustrations of how others have used the concept of flexibility. Key research questions related to project flexibility are stated in this chapter. These questions have in common that they address the dynamics between utilising benefits from flexible approaches and avoiding drawbacks. The thesis is designed to address these questions.
A number of scholars have argued that flexibility is necessary to face the changes and uncertainty in the business environment. On the other hand, a wide range of studies indicate that a clear project definition and minimisation of changes also are critical factors for the success of projects. These approaches to project flexibility, which can appear as conflicting, have justified the study of the dynamics related to project flexibility that is presented in this thesis. The subject is analysed both from a theoretical and an empirical perspective.
1.1 Perspectives on project management
In a wide sense, projects include any activity that meets the characteristics of projects listed by the PMI (Project Management Institute) (2004: 5): ‘A project is a temporary endeavour undertaken to create a unique product or service’. Common characteristics of projects include: finite budgets and schedule constraints, complex and interrelated activities, clearly defined goals, and uniqueness (PMI 2004).
Projects are traditionally seen as temporary organisations designed for unique tasks (Cleland 2004), often in contrast to the mass producing core activities of organisations. Projects are initiated to solve tasks of almost any type (Engwall 2003) to such an extent that Western society seems to be heading towards a projectified society (Lundin & Söderholm 1998, Gareis 2004). A major benefit of organising a task as a project is the freedom to create an organisation more or less from scratch. While uniqueness is the competitive advantage of projects as a way of organising, changes and lack of predictability are commonly seen as the major pitfalls of projects. Successful projects are often claimed to be characterised by control and governance (Hall 1980, Morris & Hough 1987, Miller & Lessard 2000).
Söderlund (2004) discusses two main theoretical traditions in project management research. The first tradition has its roots in engineering science. Planning techniques and methods of project management, including the recent emphasis on uncertainty quantification and risk management, have been the major focus. This is in accordance with Packendorff (1995), who claims that a number of writers trace the intellectual roots of project management research and knowledge to various types of planning techniques, such as PERT (program evaluation and review technique) and CPM (critical path method). The other tradition has its intellectual roots in the social sciences and focuses especially on the organisational and behavioural aspects of projects. Söderlund (2004) terms these the engineering tradition and the social science tradition, respectively. In a similar distinction between project management traditions, Crawford & Pollack (2004) use the terms ‘hard’ and ‘soft’. Crawford &
1. Introduction
2
Pollack relate ‘hard’ project management approaches to objectivist, scientific approaches and that have parallels to Söderlund’s (2004) engineering tradition. The ‘soft’ project management approaches stem from interpretivist and constructivist schools of thought, and share similarities with Söderlund’s (2004) social science tradition.
1.2 Uncertainty The uncertainty of a decision in a project can be described as ‘the gap between the amount of information needed to perform at task and the amount of information already possessed by the organisation’ (Galbraith 1973: 5). Christensen & Kreiner (1991) make a distinction between operational and contextual uncertainty. They relate operational uncertainty to uncertainty within the defined scope of a project, and contextual uncertainty to the project context. Karlsen (1998) discusses environmental uncertainty, which represents uncertainty generated by factors outside a project’s system boundaries, and task uncertainty which relates to factors within project boundaries. Jensen et al. (2006) divide environmental uncertainty into two categories:institutional and interactional uncertainty. The purpose is to identify interactional uncertainty as representing environmental explanations necessary for understanding the circumstances of a project without including everything outside the projects.
This thesis does not aim at covering the issue of uncertainty in a broad perspective. However, the distinction between the two types of uncertainty that Karlsen (1998) and Christensen & Kreiner (1991), among others, discuss has implications for the analysis of project flexibility. This thesis uses the terms contextual uncertainty and internaluncertainty. Internal uncertainty is related to operational uncertainty (Christensen & Kreiner 1991) or task uncertainty (Karlsen 1998).
1.3 FlexibilityThe term flexibility is used in a rather wide meaning in this thesis, but generally related to managing effects of uncertainty. Bahrami & Evans (2005) list 11 concepts related to flexibility: adaptability, agility, elasticity, hedging, liquidity, malleability, mobility, modularity, robustness, resilience, and versatility. According to the Merriam-Webster Online Dictionary (2006), being flexible is ‘characterised by a ready capability to adapt to new, different, or changing requirements’, a definition of flexibility which is also used in this thesis. With such a wide definition, project flexibility includes preparations to manage both internal and contextual uncertainty, such as scope change management, iterative decision process, and adjustments related to uncertain funding in general.
In a planning perspective, Sager (1994) presents flexible planning as a proper response to an environment aiming at conflict solutions, since it favours democracy in collective choice processes. Further, Sager makes a distinction between opportunismand rigidity, and places ‘flexibility’ in between these two extremes. Rigidity implies unwillingness or lack of ability to adjust to a changing situation. In contrast, opportunism can be described as a policy of extreme adapting to new circumstances, without being guided by any rules or overall strategy. He points out that flexibility refers to future choices among satisfactory alternatives, and that flexibility implies adjustments in accordance with principles and criteria.

1. Introduction
3
Flexible projects are generally not described as desirable in project management literature. In other management disciplines, such as in strategic management, flexibility is an established enabler to manage uncertainty (see, for example, Mintzberg 1994). Flexibility is so well acknowledged as a key success factor of competitive organisations that Bahrami & Evans (2005) used the term ‘super-flexibility’ to describe the most flexible companies.
1.4 Project flexibility Project flexibility is part of a fundamental dilemma in project management. On the one hand, projects need stability and control to be executed efficiently, typically measured in terms of time, cost and meeting specifications. In this perspective, flexibility should be minimised. On the other hand, important decisions in projects must be taken based on limited information in an unpredictable world, creating a need for flexibility options.
The PMI (2004: 368) defines project management as ‘the application of knowledge, skills, tools, and techniques to project activities to meet project requirements’. In this terminology, project management is aimed at meeting project requirements, and not necessarily related to meeting the overall objectives of projects. The PMI (2004) and Bahrami & Evans (2005) argue that projects and project management are applied once an organisation has decided to escalate initial activities in a focused implementation. Other authors (e.g. Miller & Lessard 2000, Samset 2001) highlight the front-end phase in relation to project management. As discussed in Paper 7, the emphasis on the front-end phase in project management is related to how “project management” is defined by different authors. As an example, it is not entirely clear if PMI (2004) considers selecting the right project as a part of project management.
Mikkelsen & Riis (2003) have identified a dilemma in project planning: namely, that the importance of decisions is highest at the when the availability of information is at its lowest. A common way of reducing this dilemma is to increase the available knowledge about the project. A project flexibility approach to address this dilemma is to postpone irreversible decisions until more information is available.
The engineering tradition of project management, referred to by Söderlund (2004) and Crawford & Pollack (2004), focuses on stability for projects, particularly in their later phases. The social science tradition has a greater understanding of the benefits of project flexibility. Kreiner (1995) points out that the traditional focus on stability becomes challenged under conditions of uncertainty, which creates what he calls ‘drifting environments’. The drifting environments of a project are not necessarily caused by actual changes but may also result when the project owners, users or other stakeholders gain a better understanding of, and ability to express, their actual needs. The results presented in Paper 4 indicate that flexible projects are generally not desirable when the unit of analysis is limited to the project itself, but can be rational when a wider context is included in the analysis.
Real options represent one approach to project flexibility (see, for example, Amram & Kulatlaka 1999, Brennan & Trigeorgis 2000). Real options illustrate the value of flexibility based on theory related to financial options. Flexibility is compared to

1. Introduction
4
owning an option – the right, but not the obligation to take an action in the future (Amram & Kulatlaka 1999). The real options paradigm recognises that decisions are made sequentially over phases. Uncertainty can increase the value of a project as long as flexibility is preserved and resources are not irreversibly committed. The value of flexibility can be quantified in monetary terms. Uncertainty about the future profitability of an investment project makes it often optimal to postpone commitment to a project, compared to a situation in which there is no uncertainty (Brennan & Trigeorgis 2000).
Koskela (2000) describes how production principles, such as just-in-time, have been adopted in a theoretical framework aimed at the construction industry under the term lean construction. In this framework, the term ‘last responsive moment’ is used to achieve flexibility in projects (Ballard & Howell 2003). According to Ballard & Howell (2003), the last responsive moment means that decisions must be made within the lead time for realising alternatives and that a decision should not be made until it has to be made.
1.5 Efficiency versus effectiveness A project’s ability to produce its immediate outcome can be measured in terms of efficiency. It is a question of doing things right and producing project outputs in terms of the agreed scope, quality, cost, and time. It is a measure internal to the project and restricted to the project or contractor’s perspective. The longer-term effects of the project can be measured in terms of effectiveness – or, in other words, doing the right things. It is an external measure. Eikeland (2001) relates effectiveness to how the results of a project contribute to added value for owners and users. In OECD terms, effectiveness measures the realisation of the project’s objectives (OECD 2000). This is the perspective of the project owner or financing party, who in many types of projects might have a perspective similar to that of the users.
Performance measurement systems in organisations frequently strive to capture a range of performance aspects (see, for example, Sink & Tuttle 1989). Figure 1 shows that these aspects often include measures of efficiency, effectiveness and changeability. Project success is commonly measured in terms of efficiency and effectiveness. It is less common to measure changeability, or flexibility, in project management. While a high degree of flexibility is desirable to many organisations, it is more often mentioned as a threat than a key success criterion for projects.
Efficiency
Changeability
Performance
Effectiveness
Figure 1. Performance measurement dimensions. (Moseng & Bredrup 1993)

1. Introduction
5
A literature review in an early part of the work on this thesis (Paper 4) gave indications that flexible projects are primarily enablers for improvement of effectiveness rather than efficiency. This notion has served as guidance for the methodological choice of data collection and projects to be studied.
1.6 Structure of the thesis The thesis consists of two parts. Part one serves three main purposes. First, it states the key research questions that the whole thesis addresses. The research questions are presented in the next section of this chapter. Second, part one discusses the applied methodology of the thesis as a whole. The studies presented in each paper are utilised with the aim of making the whole thesis more than just the sum of its individual parts. Finally, part one provides a summary of results from the research.
Part two consist of nine papers. Paper 1, 2 and 3 present results relating to studies of major engineering projects, most of them governmental. One aim of these papers is to analyse similarities and differences between projects and flexibility approaches. Paper 4 consists of a literature study on flexibility. The next paper, Paper 5, focuses on railways. Railway investment projects were chosen for in-depth studies of one particular type of governmental investment. Another sector-specific study related to hospitals is presented in Paper 6. Paper 7 and 8 benefited from the analyses presented in the preceding papers, but also contribute other aspects to the subject.
1.7 Research questions The purpose of this research is to structure knowledge on project flexibility. Based on studies of different parts of the life cycle of projects, the research aims at providing indications as to how flexibility can be addressed in the front-end phase of large public investments.
The following two key research questions are addressed in the thesis:
How can different aspects of flexibility in projects be analysed? Flexibility is discussed as a blessing and a curse. Flexibility for one stakeholder is often viewed as another stakeholder’s risk. The thesis also aims at identifying other aspects of flexibility which can contribute to an analysis of the issue. These aspects will be summarised as an analytical framework for project flexibility.
After studying project flexibility, what are the implications for project front-end management?The thesis aims at identifying characteristics of successful project flexibility management. Such knowledge may prove valuable in the preparations of future projects. The results will be summarised as generic approaches for flexibility management.

1. Introduction
6

2. Study design
7
2. Study design
The research design of the thesis as a whole is presented in this chapter. Empirical evidence used in the thesis is also presented, including how it was obtained and why this particular information was chosen. Based on the empirical evidence and the design of the study, there is also a discussion of the quality of the data and how the evidence may be interpreted. In addition, the applied methodology in each study is presented in more detail for each of the included papers.
2.1 Research approach In this thesis, one phenomenon – flexibility – is analysed in a complex environment with several influencing factors. Investigating project flexibility from different angles has provided a multidimensional view of the subject. A combination of qualitative and quantitative information has been used. The thesis provides opportunities for triangulation, as described by Fellows & Liu (2003). An advantage of using multiple sources of information lies in the development of converging lines of evidence. To achieve a triangulation effect, information from two or more sources has been used to address the same research questions.
The research is based on an inductive-deductive approach, described by Fellows & Liu (2003). Inductive research explores an issue through observation. The aim is to establish explanatory principles or hypotheses. In deductive research, hypotheses are tested against observations.
Case studies included in the thesis apply a research methodology based on the works of Yin (2003). Three important principles in the research have been: (a) multiple sources of information, (b) use of case study databases to assemble evidence related to the cases, and (c) maintaining a chain of evidence with links between the questions asked, data collected and conclusions drawn.
2.2 Empirical evidence Several different information sources have been used. The main sources are:
1. Evaluations of Norwegian public investments 2. Ex-ante uncertainty analyses of major governmental investments 3. Case studies of Norwegian railway projects
In addition, the thesis benefits from case studies of the effects of the quality assurance of major governmental investment, railway traffic analyses and experiences from hospital projects.
To analyse project flexibility, information was needed to cover both efficiency and effectiveness aspects of projects. As the prime source of information regarding efficiency, major governmental investments were chosen. Work related to preparations and execution of the Norwegian quality-at-entry regime provided data that covered enough projects to justify some quantitative analysis. The quality-at entry

2. Study design
8
regime was introduced in 2000 by the Norwegian Ministry of Finance. It calls for mandatory quality assurance and uncertainty analysis of all governmental investments in Norway exceeding NOK 500 million (c.60 million USD). To achieve a wider perspective, the same type of information was also obtained for a limited number of non-governmental projects. Analysing effectiveness required a different approach regarding the number of projects as well as type of information. Railway projects were chosen because of the possibilities to gather information for a number of years.
In the following, the main information sources are described. Each of the papers in the annexes gives additional details.
Evaluations of Norwegian public investments A set of independent project evaluation reports was collected. Personal experience from projects was also utilised. To analyse the information related to the projects, codified data were entered into a database. This included information on the general characteristics of the project. On the basis of the descriptive information, an assessment was made of approaches to project flexibility. This was based on subjective assessments made by the researcher.
Ex-ante uncertainty analyses of major governmental investments The thesis has befitted from access to reports from assessments made under the Norwegian quality-at-entry regime. These assessments are made by consultants prior to the parliament’s appropriation of the projects. Information from the quality assurance reports has been entered into a database. The information is relatively detailed, but limited to the situation at the time of approval of the project investments in parliament. Transportation infrastructure includes roads, bridges and tunnels, and railways account for more than one-third of these projects. Defence-related projects also represents more than one-third. The remaining group of projects includes public buildings, hospitals and IT systems.
Case studies of Norwegian railway projects The benefits of projects materialise after the projects have been commissioned, calling for a rather long time perspective of the analysis. Railway projects were chosen because of the possibilities to gather information for fairly long time spans. The availability of timetables means that it is possible to measure key benefit elements such as travel time and frequency based on documentation. In addition, data on number of travellers and punctuality were included in the analyses. Being a multi-case study in the terminology used by Yin (2003), the analysis of four railway projects is based on multiple information sources. The most important sources are:
Documents from the involved organisations, as well as publicly available information. This includes reports, evaluations and quantitative information, such as timetables and statistics. Interviews Participant observation in meetings and other arenas where the projects have been discussed.
A summary of the most important information used in this thesis is shown in Table 1.

2. Study design
9
Information Content N= Paper Type of information
Sources
Evaluations of Norwegian public investments
Public and private sector projects from different sectors. Projects initiated 1986-2000
18 Paper 1 Paper 3
Primarily qualitative
Evaluation reports; personal experience
Ex-ante uncertainty analyses of major governmental investments
Governmental investments projects approved 2000-2004
48 Paper 2 Paper 3
Primarily quantitative
Consultant reports
Case studies of Norwegian railway projects
Railwayinvestment projects 1986-2000
4 Paper 5 Qualitative andquantitative
Interviews; statistics;evaluation reports; personal experience
Table 1. The primary information sources upon which the thesis is based.
2.3 Quality of information Because of the design of the study, the possibilities to assert the validity or test the reliability of the findings are limited. It cannot be statistically proved that the findings are generally applicable.
Reliability is related to consistency of a measure. Information is reliable if the measurement procedures provide the same result if applied repeatedly, even by different researchers. In this type of study, reliability cannot be ensured through large, representative samples of research material. The methods to extract and codify information may be affected by judgemental subjectivity. The problem of reliability may therefore be considerable in each of the sub-studies. To compensate for this, several sets of samples of research material have been used.
Validity concerns how well a measure does in fact measure what it is intended to measure. To address validity in this thesis, several indicators are used. The combined use of indicators gives a better measure than each of the indicators independently. According to Yin (2003), case studies using multiple sources of evidence are generally rated as having a higher quality, compared to those that rely only on single sources of information.
Validity and reliability associated with the data used in this thesis are not sufficient to provide solid answers, taken in isolation. However, the research has taken previous studies on related issues into account. To a large extent, the results found in this thesis are consistent with results in previous studies. Trustworthy results can only be established through a series of replications and validations. When the number of studies with consistent results grows, the confidence in the findings should increase. The thesis has to a certain extent indicated some nuances to common understanding of project flexibility. Further research is needed to clarify to what extent these indications are of a general nature or project-specific.

2. Study design
10
3. Flexibility in different project phases
11
3. Flexibility in different project phases
This chapter discusses project flexibility in different project phases. With efficiency in mind, both this thesis and previous research point to a flexible front-end phase as the least controversial aspect of project flexibility. From the same perspective, a flexible execution phase is generally not desired. One purpose of the chapter is to illustrate and analyse the background to these statements. In addition, an attempt is made to quantify some measures on project flexibility in a time perspective.
This thesis makes a distinction between three different project phases: front-end, planning and execution. The front-end phase covers the activities prior to the final decision to go ahead with the project. Even though planning is a part of the front-end phase, most projects also have a planning phase for more detailed preparation after the project has been decided upon. Projects are implemented in an execution phase,which ends when the project outputs are realised.
Authors on project management, including Morris & Hough (1987) and Miller & Lessard (2000), frequently warn against changes in projects once specifications have been established. Lundin & Söderholm (1995) describe how a project moves from relative openness at the beginning of the project, to being relatively closed in the execution phase. In the execution phase the predetermined action is supposed to be carried out according to the plans, in a ‘planned isolation’. The concept of project flexibility in the execution phase disturbs this planned isolation. In a similar way, Mahmoud-Jouini et al. (2004) characterise project management by the speed of three project phases: preparation, freezing and implementation.
In the study of 18 projects presented in Paper 1, changes and iterations were observed in all phases of the projects, but particularly during the planning phase. Highly flexible planning phases, and to a certain extent also execution phases, were pointed to as a major problem during the preparations for the quality assurance regime for major governmental investments (Berg et al. 1999).
3.1 A time perspective on projects Many textbooks on project management present models to illustrate how project attributes change during different project phases. Figure 2 is an attempt to summarise the different models. Even though the shapes of the curves vary between different authors, they have many similarities. Uncertainty, significance of decisions and the degree of freedom to manoeuvre are typically high at the beginning of the project, and low at the end. At the same time, variables such as the accumulated cost, available information and cost of changes begin at low levels and reach high levels at the end of a project.
Even though this type of figure as shown in Figure 2 is very common and appears logical, the models are primary illustrations, and appear to a lesser extent to be based directly on empirical evidence. There are obvious challenges in quantifying and measuring the different variables. One study in Miller & Lessard (2000: 34) shows that for one particular project, regulatory, political and financial risks were at their highest during the middle of the project.

3. Flexibility in different project phases
12
High
Low
Project time
Accumulated cost/Available information/Amendment cost
Uncertainty/Significance ofdecisions/Degree of freedom
to manoeuvre
Figure 2. Development of selected project characteristics in a time perspective. (Paper 3, fig. 1. Based on Christensen & Kreiner 1991: 40, Midler 1995: 369, Samset 2001: 33, Mikkelsen & Riis 2003: 47)
The ‘high to low’ curve may represent different variables, but the underlying message is similar. Christensen & Kreiner (1991: 40) use Galbraith’s (1973) definition of uncertainty as the difference between the required information and the information available. As the available information increases, the uncertainty decreases through the project. Samset (2001) uses a similar definition of uncertainty. Eikeland (2001), on the other hand, equalises ‘room for manoeuvring’ with the internal uncertainty of the project, related to internal decisions that will be, but are not yet taken. A decision is within the room for manoeuvring if it does not violate the consequences of previous decisions. Midler (1995) relates the decreasing degree of freedom to manoeuvre with an increasing degree of irreversibility in project decisions. Mahmoud-Jouini et al. (2004: 361) describe the descending curve as ‘possibilities of action in the project’. Mikkelsen & Riis, (2003: 47) let the ‘high to low’ curve represent the importance of decisions.
The ‘low to high’ curve usually represents either accumulated cost (Eikeland 2001), relative amount of information or knowledge available related to the project (Midler 1995, Mikkelsen & Riis 2003, Mahmoud-Jouini et al. 2004), or amendment cost (Samset 2001).
3.2 Quantifications of flexibility based on scope reduction options In the quality assurance reports for major governmental investments, it is a part of the consultants’ assignment to identify potential project scope reductions. These are reductions that can be carried out if other parts of the project turn out to be more costly than planned. If necessary, these parts of the scope can be taken out of the projects without threatening the fundamental functionality of the delivery. These possible reductions are summarised as reduction lists, where the potential cost

3. Flexibility in different project phases
13
reductions are described. In the studied projects, even though it was not a formal requirement, many of the consultants chosed to add due dates for the scope reductions, to indicate when decisions had to be made to realise any cost saving from the reductions.
Reductions in quality or functionality were proposed in almost half of the studied projects. These were reductions that lowered the quality, but the volume of core deliveries from projects remained the same as planned. For road projects, the length of the new road was not changed. A common type of reduction for roads was to reduce planned improvements of existing roads, in connection with the new construction. Adjustments of ambitions related to the aesthetic quality of the project deliveries were common. Examples of this category include planting fewer trees, establishing smaller lawns and reducing the aesthetic quality of concrete walls.
Reduction lists provide an illustration of the reductions that were judged to be manageable from a project management point of view. The need for fast decisions regarding possible reductions was very commonly emphasised. As a rule of thumb, reductions in system architecture and quality standards have to be made early in the projects. It is possible to make reductions in volume and visual impression at later stages, depending on the contract structure. Another comment was that the potential volume of the reductions was so small that it did not justify setting up a system to manage the reductions. Finally, it was frequently commented that the due dates for the reductions typically came before it was realistic for project management to have updated cost estimates that could indicate any potential overruns.
A quantitative analysis of flexibility in different project phases is included in Paper 3, using data from reduction lists in quality assurance reports for major governmental investments. For about half of the projects, the reduction lists also included due dates to define when the window of opportunity closed for each item on the reduction list. Based on the reduction lists and due dates, it was possible to illustrate how the due dates of the items on the reduction list expired as time passes. This means that a part of the curve for the freedom to manoeuvre in Figure 2 could be drawn based on the empirical data presented in Paper 3.The relative size of the remaining open reductions can be seen as an illustration of the ‘room for manoeuvring’. Figure 3 shows the curve generated from the reduction lists in relation to a whole project time span. The size of reduction list is indicated by the grey area in Figure 3. At the time of parliamentary approval, the total value of all possible reductions on the reduction lists was in the range of 5–7% of total project costs. It should be noted that the size of remaining items on the reduction lists drops relatively sharply after this point. The size and shape of the grey area in Figure 3 supports the illustrative models used in many textbooks, which were referred to in relation to Figure 2.

3. Flexibility in different project phases
14
0,0 %
10,0 %
20,0 %
30,0 %
40,0 %
50,0 %
60,0 %
70,0 %
80,0 %
90,0 %
100,0 %
0 10 20 30 40 50 60 70 80 90 100
High
Low
Degree of freedomto manoeuvre.Percent of totalbudget
Projecttime
10 %
100 %
100 %Decisionto finance
Figure 3. The relative size of the reduction lists as a percentage of the total budget at different phases of the projects. N=19
Another way of quantifying the remaining flexibility options at the time of final approval of projects is to look at the reduction lists and allocated reserves in combination. On average, the reduction lists amounted to 6% of the total project budget. At the same time, an average of 8% of the project budgets was allocated as reserves, to cover unexpected expenses. Adding these two types of flexibility gives an approximate total remaining flexibility of 14% of the total budget at the time of parliamentary approval. The remaining flexibility options ranging between 10% and 15% of the total budget appeared to be manageable at the time of final project approval, measured by the relative size of reduction lists and allocated reserves.
The Norwegian building and civil engineering contract, NS 8405 (Norsk bygge- og anleggskontrakt NS 8405 2004), states that a project owner cannot demand changes exceeding 15% of the total contract value. This value corresponds fairly well with the results presented above.
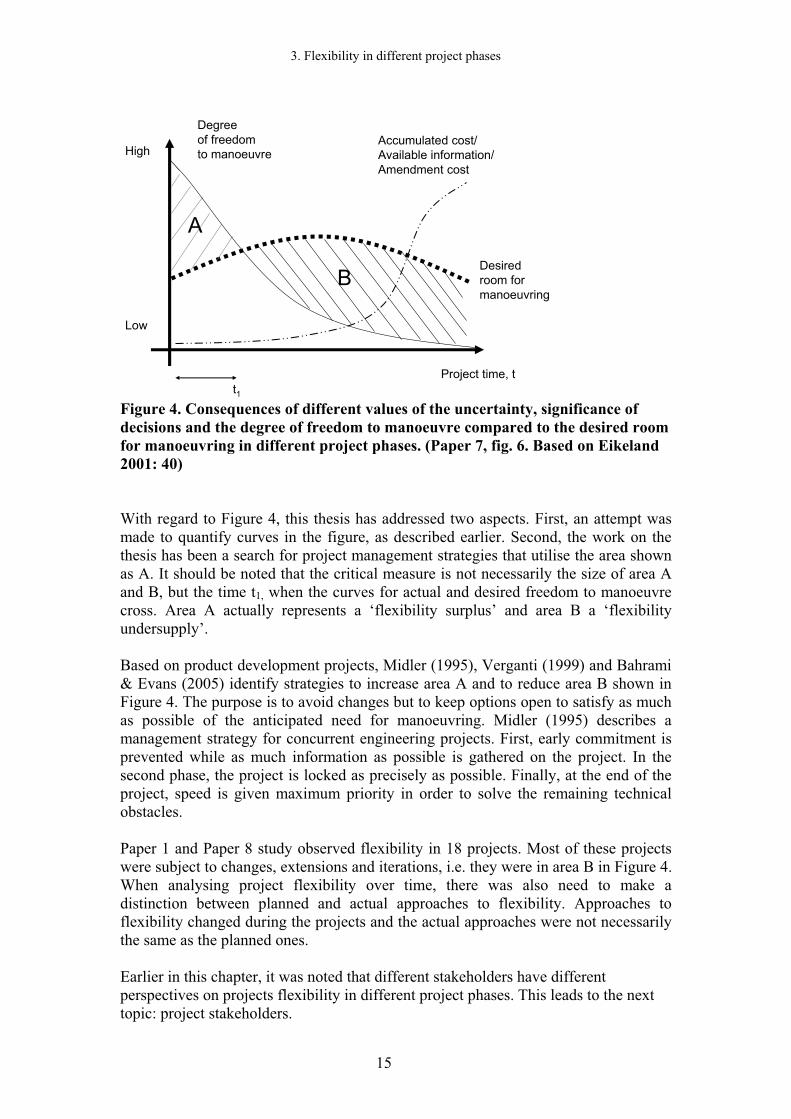
3.3 Flexibility visualisations According to Eikeland (2001), a decision is within the room for manoeuvring if it does not violate the consequences of previous decisions. As shown in Figure 4, the need for room for manoeuvring is within the actual room for manoeuvring in the early phase of projects (area A), but not during later parts of projects (area B). Eikeland (2001) also points out that a major challenge in project management is that the need for room for manoeuvring is typically at its highest when the actual freedom for manoeuvring has already decreased significantly. Area B represents situations when some stakeholders (for example, users or project owners) have a desired room for manoeuvring that is larger than the actual room. To satisfy the desire for adjustments, changes have to be made, because the adjustments violate previous decisions.
3. Flexibility in different project phases
15
High
Low
Project time, t
Degree of freedomto manoeuvre
Accumulated cost/Available information/Amendment cost
Desiredroom formanoeuvring
A
B
t1Figure 4. Consequences of different values of the uncertainty, significance of decisions and the degree of freedom to manoeuvre compared to the desired room for manoeuvring in different project phases. (Paper 7, fig. 6. Based on Eikeland 2001: 40)
With regard to Figure 4, this thesis has addressed two aspects. First, an attempt was made to quantify curves in the figure, as described earlier. Second, the work on the thesis has been a search for project management strategies that utilise the area shown as A. It should be noted that the critical measure is not necessarily the size of area A and B, but the time t1, when the curves for actual and desired freedom to manoeuvre cross. Area A actually represents a ‘flexibility surplus’ and area B a ‘flexibility undersupply’.
Based on product development projects, Midler (1995), Verganti (1999) and Bahrami & Evans (2005) identify strategies to increase area A and to reduce area B shown in Figure 4. The purpose is to avoid changes but to keep options open to satisfy as much as possible of the anticipated need for manoeuvring. Midler (1995) describes a management strategy for concurrent engineering projects. First, early commitment is prevented while as much information as possible is gathered on the project. In the second phase, the project is locked as precisely as possible. Finally, at the end of the project, speed is given maximum priority in order to solve the remaining technical obstacles.
Paper 1 and Paper 8 study observed flexibility in 18 projects. Most of these projects were subject to changes, extensions and iterations, i.e. they were in area B in Figure 4. When analysing project flexibility over time, there was also need to make a distinction between planned and actual approaches to flexibility. Approaches to flexibility changed during the projects and the actual approaches were not necessarily the same as the planned ones.
Earlier in this chapter, it was noted that different stakeholders have different perspectives on projects flexibility in different project phases. This leads to the next topic: project stakeholders.

3. Flexibility in different project phases
16

4. Project stakeholders
17
4. Project stakeholders
This chapter analyses project flexibility from a stakeholder perspective. Project stakeholders are actively involved in a project, or their interests may be positively or negatively affected by a project. An analysis of flexibility in a stakeholder perspective called for a distinction between internal and external project flexibility. Project internal flexibility relates to flexibility within defined scope. Project external flexibility relates to adjustments of scope. The approach to flexibility held by the different stakeholders is closely related to the incentives open to the stakeholders. Flexible projects have a value for those who can align a project to their priorities, but flexibility represents a cost for those who have to adapt.
4.1 StakeholdersAccording to McElroy & Mills (2000), project stakeholders are persons or groups of people who have a vested interest in the success of a project and the environment within which the project operates. In a study of large engineering projects, Olander & Landin (2005) found that it is important for a project management team to identify stakeholders that can affect a project, and then manage their differing demands throughout the project stages. Stakeholders may be organisations or individuals. The following discussion is focused on four types of project stakeholders: owners, users, project management, and contractors.
It is the project owner that takes the risk related to the cost and future viability of a project. Both these risks can to a certain extent be transferred to other actors in a project.
Users can be described using a wide or a narrow definition. The wide definition of users includes all that use the result of the project (the hospital, railway companies, etc.). During the project preparation and execution, users are not easily identified. This means that projects usually interact with user representatives, who act on behalf of those who intend to use the result of the project. The narrow definition of ‘users’ refers to such user representatives.
The ‘project management’ stakeholder refers to the project manager acting on behalf of the project owner and the organisation supporting this function. Contractors are responsible for implementing the whole or part(s) of the project.
Results presented in Paper 4 indicate that project owners and users are more likely to be positive towards changes aimed at increasing the benefit side of the projects, or related to effectiveness. Stakeholders whose main responsibility lies on the cost side of the project, such as project management and contractors, are less likely to embrace changes. According to Kreiner (1995), the project management is made the guardian of efficiency. Müller & Turner (2005) claim that owners should impose medium levels of structure on project managers. Too much structure will not give the project manager sufficient flexibility to deal with any uncertainties that arise. Too little structure will lead to anarchy.
4. Project stakeholders
18
4.2 IncentivesIncentives for different project stakeholders are strongly related to the contracting structure of a project and other financial obligations. A common tool for achieving flexibility in projects is the use of option-based contracts, which enable a continuous locking of the projects. Mahmoud-Jouini et al. (2004) point out that a key factor in creating win-win situations between the stakeholders in Engineering, Procurement and Construction (EPC) contracts lies in the flexibility of contracts and the implicit relations that are created by the contracts. Garel & Midler (2001) studied contractual structures that enable front-loading and coherent incentives for manufacturers and suppliers in the automotive industry. Their analysis is based on a game theory approach, where dealing with flexibility can be a win-win or zero-sum game between the stakeholders. In the co-development of automotive parts, the supplier receives no additional payments for late identification of the need for modifications in the design phase. The supplier therefore has strong incentives to provide engineering expertise to work closely with the manufacturer in order to understand the needs and the production process (Garel & Midler 2001).
The users are a group of stakeholders that often do not have contracts related to the projects. Their incentives are more likely to be related to quality than project cost. Even though Paper 1 found that the users in the studied projects favoured flexibility in general, especially one case showed that the users preferred bold commitments and clear answers in the front-end phase because they wanted to know as precisely as possible what they could expect from the project.
Flexibility also has to do with politics. In general, stakeholders are less likely to favour a continued flexible decision process when an initial decision has been taken in their favour. Consequently, a continued flexible decision process is valued by those who do not prefer an initial decision. Flexibility options might be used as a tool for stakeholders who want decisions to be remade. Flexible decision processes can be used to justify that decisions do not need to be taken or can be revised, thus becoming a tool for irresoluteness.
4.3 Internal and external flexibility A distinction can be made between internal and external project flexibility. Project internal flexibility relates to flexibility within a defined scope – how requirements will be met. Project external flexibility relates to adjustments of project scope – whatrequirements will be met.
Project internal flexibility has its roots in an efficiency perspective. In an engineering tradition, the objective of front-end management is to provide a well-defined framework for efficient project implementation. This does not mean that flexibility is undesirable, but that adjustments are held within the defined project scope. This perspective is often held by project managers and contractors. It is also the approach to flexibility that is taken by lean construction (including Koskela (2000) and Ballard & Howell (2003)). To illustrate the need for internal flexibility Koerckel et al. (2005) claim that work flow reliability historically has been c.50% in construction projects, based on a one-week planning horizon, i.e. only 50% of the tasks scheduled for one week can be expected to actually be completed during that particular week. As discussed in Paper 3 related to major Norwegian governmental projects, the
4. Project stakeholders
19
mandatory quality assurance aims at defining the projects as precisely as possible, but still provides project management with the freedom to decide how the specifications are to be met and budgets to be upheld. In a similar way, Turner (2004) claims that one of four necessary conditions for project success is that the project manager is empowered. The project owner should give guidance on how the project can be best achieved, but allow project managers flexibility to handle unforeseen circumstances. Note that Williams (1997) claims that project risk management and empowerment of teams within a project compete with each other in complex projects, because of interconnection between the tasks of different project teams.
Project external flexibility has its roots in an effectiveness perspective. Based on what is termed a social science tradition, an objective of the front-end phase is to align the content of the project to the objectives of the stakeholders. Objectives may be shifting; implying certain needs for flexibility. It is primarily the value of this type of flexibility that is quantified by real options (Amram & Kulatlaka 1999, Brennan & Trigeorgis 2000). This type of flexibility option appears particularly desirable to users and project owners.
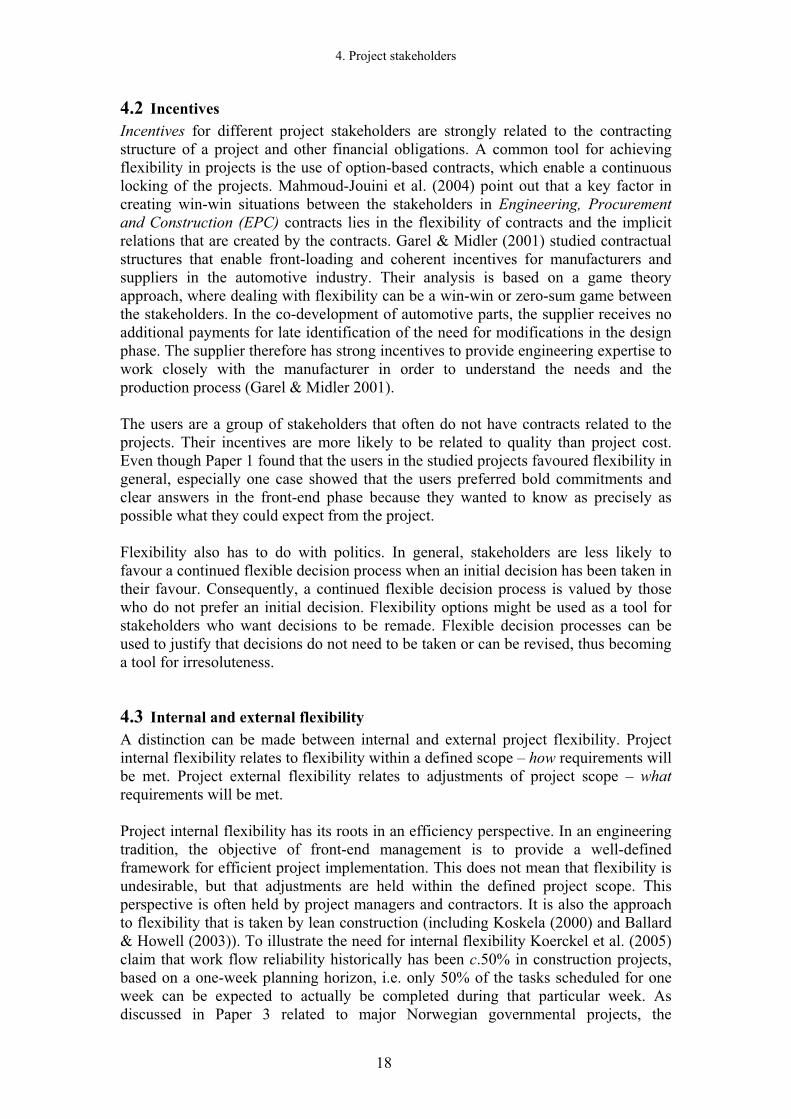
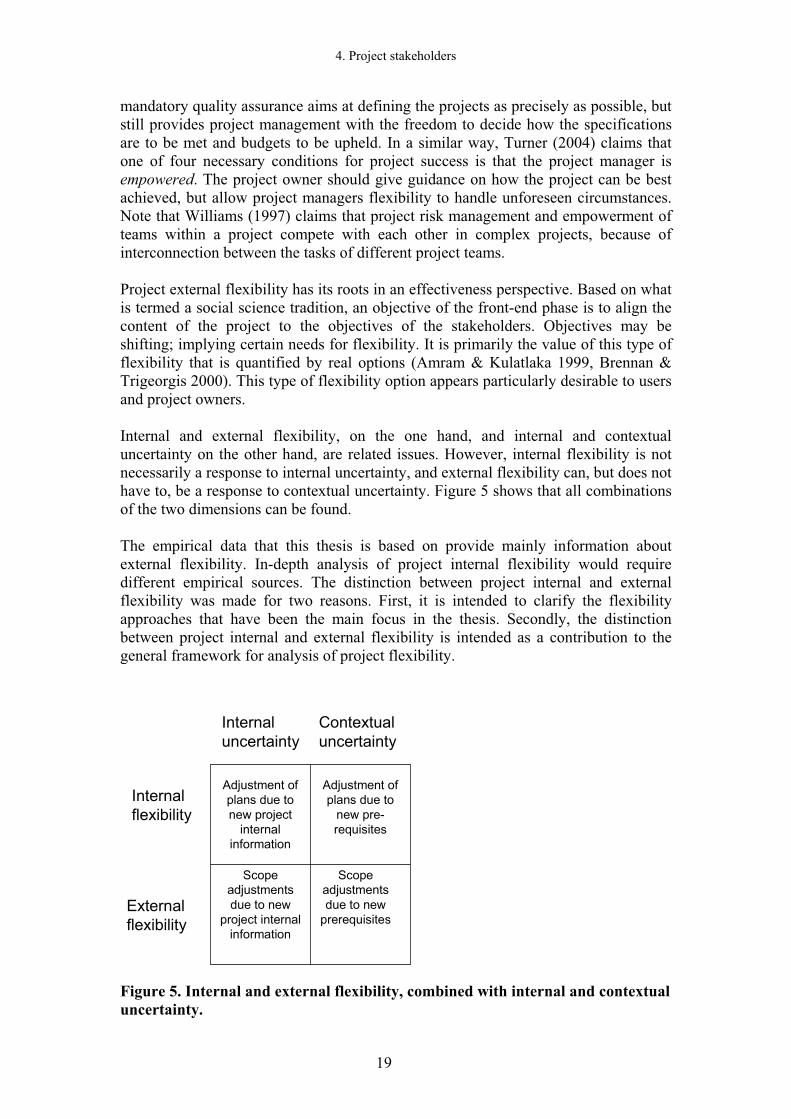
Internal and external flexibility, on the one hand, and internal and contextual uncertainty on the other hand, are related issues. However, internal flexibility is not necessarily a response to internal uncertainty, and external flexibility can, but does not have to, be a response to contextual uncertainty. Figure 5 shows that all combinations of the two dimensions can be found.
The empirical data that this thesis is based on provide mainly information about external flexibility. In-depth analysis of project internal flexibility would require different empirical sources. The distinction between project internal and external flexibility was made for two reasons. First, it is intended to clarify the flexibility approaches that have been the main focus in the thesis. Secondly, the distinction between project internal and external flexibility is intended as a contribution to the general framework for analysis of project flexibility.
Internaluncertainty
Contextual uncertainty
Externalflexibility
Internalflexibility
Adjustment of plans due to new project
internal information
Adjustment of plans due to
new pre-requisites
Scope adjustments due to new
project internal information
Scope adjustments due to new
prerequisites
Figure 5. Internal and external flexibility, combined with internal and contextual uncertainty.
4. Project stakeholders
20
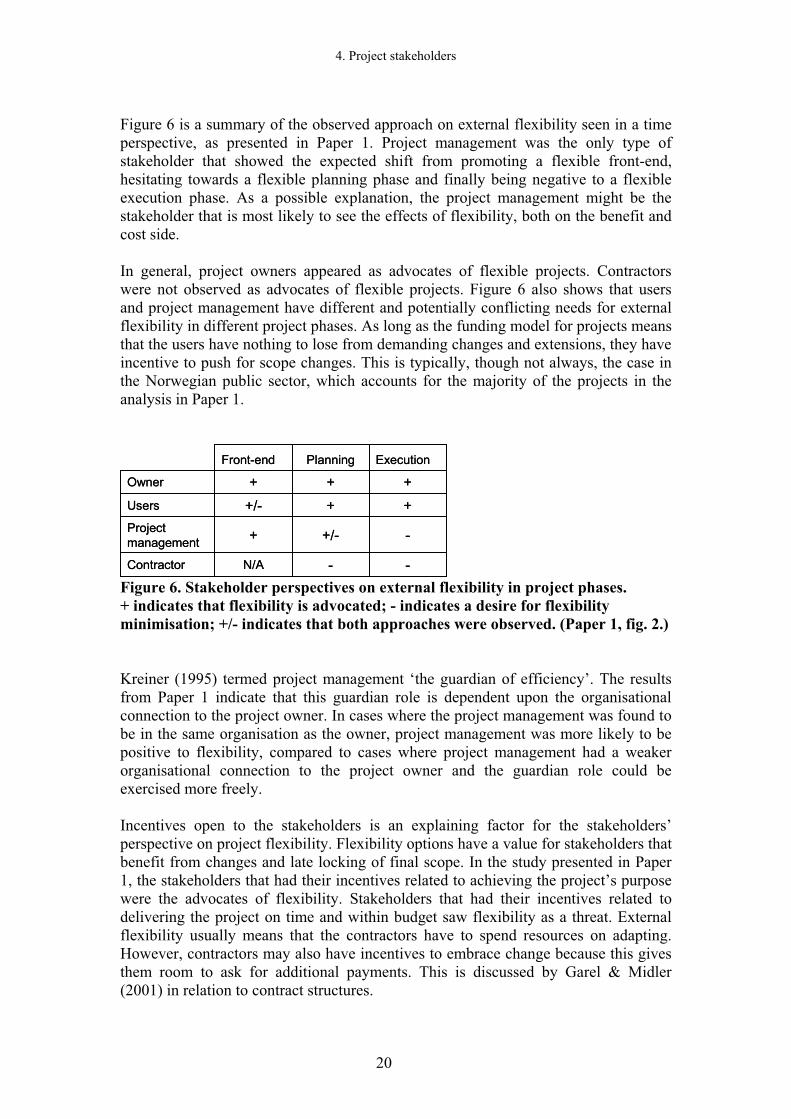
Figure 6 is a summary of the observed approach on external flexibility seen in a time perspective, as presented in Paper 1. Project management was the only type of stakeholder that showed the expected shift from promoting a flexible front-end, hesitating towards a flexible planning phase and finally being negative to a flexible execution phase. As a possible explanation, the project management might be the stakeholder that is most likely to see the effects of flexibility, both on the benefit and cost side.
In general, project owners appeared as advocates of flexible projects. Contractors were not observed as advocates of flexible projects. Figure 6 also shows that users and project management have different and potentially conflicting needs for external flexibility in different project phases. As long as the funding model for projects means that the users have nothing to lose from demanding changes and extensions, they have incentive to push for scope changes. This is typically, though not always, the case in the Norwegian public sector, which accounts for the majority of the projects in the analysis in Paper 1.
--N/AContractor
-+/-+Project management
+++/-Users
+++Owner
ExecutionPlanningFront-end
--N/AContractor
-+/-+Project management
+++/-Users
+++Owner
ExecutionPlanningFront-end
Figure 6. Stakeholder perspectives on external flexibility in project phases. + indicates that flexibility is advocated; - indicates a desire for flexibility minimisation; +/- indicates that both approaches were observed. (Paper 1, fig. 2.)
Kreiner (1995) termed project management ‘the guardian of efficiency’. The results from Paper 1 indicate that this guardian role is dependent upon the organisational connection to the project owner. In cases where the project management was found to be in the same organisation as the owner, project management was more likely to be positive to flexibility, compared to cases where project management had a weaker organisational connection to the project owner and the guardian role could be exercised more freely.
Incentives open to the stakeholders is an explaining factor for the stakeholders’ perspective on project flexibility. Flexibility options have a value for stakeholders that benefit from changes and late locking of final scope. In the study presented in Paper 1, the stakeholders that had their incentives related to achieving the project’s purpose were the advocates of flexibility. Stakeholders that had their incentives related to delivering the project on time and within budget saw flexibility as a threat. External flexibility usually means that the contractors have to spend resources on adapting. However, contractors may also have incentives to embrace change because this gives them room to ask for additional payments. This is discussed by Garel & Midler (2001) in relation to contract structures.

4. Project stakeholders
21
Based on results presented in Paper 1 and Paper 3, Figure 7 indicates that the room for external flexibility decreases over time. As the project scope becomes clarified, the relative focus on internal flexibility increases. The analysis of scope reductions presented in Paper 3 can be seen as an illustration of external flexibility. The shape of the right half of Figure 7 is based on these results, where external flexibility decreases rapidly after the final approval of a project.
Front-end Execution
Internal flexibilityExternal flexibility
Projecttime
Relative share
Figure 7. External and internal flexibility in a time perspective.

4. Project stakeholders
22
5. Effectiveness and efficiency
23
5. Effectiveness and efficiency
Project success is often measured in terms of efficiency and effectiveness. In general, efficiency is related to producing direct outputs, and effectiveness is related to added value for owners and users. Changes usually reduce project efficiency. Flexible approaches in projects are frequently seen as enablers of effectiveness. One key purpose of project flexibility is to achieve flexible projects without creating a flow of scope changes. Cost of changes is a common argument against project flexibility. Changes are key issues when discussing flexibility, but project flexibility as discussed in this thesis is a wider concept than scope change management.
5.1 Cost implications Figure 8 shows the relative cost in relation to the degree of flexibility. Two curves are drawn: one for internal (how?) flexibility and one for external (what?) flexibility. Increasing cost for high external flexibility is primarily related to external changes. To be highly flexible causes, on average, a higher cost, compared to a project that is less flexible. Increased cost of high flexibility comes either from redundant resources to manage changes and decision iterations, or unintended change to cost if such redundancy was not available but changes came anyway. This relation is similar to the traditional curve with increasing cost of changes over time in a project. It should be noted that increased cost can be compensated for by increased benefits. On the other hand, the cost curve related to internal flexibility decreases with higher flexibility. The fewer restrictions, the better opportunities a contactor or project manager has to optimise the use of available resources. This is a part of the logic behind lean construction.
The results presented in this thesis have shown significant cost overruns for highly flexible projects. Cost overruns have ranged at c.100% for highly flexible projects, as shown in Paper 7. These results have justified a steep rising cost curve for external flexibility in Figure 8. In comparison, Jacobsen (2006) refers to cost reductions related to high internal flexibility (or more precisely, related to lean construction implementations in the USA and Denmark) at c.10%. Koerckel et al. (2005) report that a lean construction initiative resulted in a 6.4% budget underrun on a railway investment project (related to the railway tunnel between Britain and France). The relatively flat curve related to cost reduction for internal flexibility is drawn with these numbers in mind.

5. Effectiveness and efficiency
24
High
Low
Cost
AdjustableHigh flexibility
Specified in detailLow flexibility
External flexibility
Internal flexibility
Figure 8. Indications of cost in relation to the degree of flexibility for internal flexibility and external flexibility.
Changes are a source of major disagreements between different project stakeholders. This issue deserves some attention, and is addressed in the next section.
5.2 ChangesAs pointed out by Williams (2000), change control is an established part of project management. Many textbooks on project management, including those by the PMI (2004) and Samset (2001), include explanations and illustrations which show that the scope change cost is typically low in the front-end phase of projects, and becomes increasingly higher with time. This increase in scope change cost over time is widely accepted, and is a major challenge to project flexibility. Once a project has been decided upon and the planning or execution has begun, scope changes are likely to reduce the efficiency of the project, as shown by Hanna et al. (2002).
The PMI (2004) defines the management of both changes and extensions as scope change control. A wide range of authors (including Morris & Hough 1987, Eikeland 2001, Love et al. 2004) have pointed to scope changes as a key driver to cost overruns of projects. Based on a study of 448 projects, Dvir & Lechler (2004) showed that changes in both plans and goals of projects typically reduce both the efficiency and customer satisfaction of engineering projects. Scope changes are key issues when discussing flexibility, but project flexibility as discussed in this thesis is a wider concept than scope change management. A change requires that something already has been decided and a project baseline has been established (PMI 2004). One key purpose of project flexibility is to achieve flexible projects without creating scope changes in them.
Typically, a scope change is proposed because the users or project owner want to increase the effectiveness of the project. As shown by Ibbs et al. (2001), using benefit-to-cost ratio, the reduction in efficiency might be compensated by a higher increase in effectiveness, depending on the timing and type of change. Two sources of

5. Effectiveness and efficiency
25
conflicts related to scope changes can be identified. First, conflicts may arise regarding quantification of the increase in effectiveness and reduction in efficiency. This is related to the high and unpredictable cost of change orders. The second conflict source is linked to allocating responsibility for reductions in efficiency. Challenges in estimating the effect of changes orders are discussed by Eden, Williams & Ackermann (2005). They particularly point to problems in finding a reference point which describes the performance of a project in a period when the project was not disturbed by changes. Eden, Ackermann & Williams (2005) describes underlying mechanisms for how changes can cause cost overruns. They point to non-linear relations between changes and cost development.
Project internal processes can be simulated, either ex ante to predict the outcome of a particular project design or ex post to explain and illustrate causes and effects in projects. Kunz, Levitt & Jin (1998) and Christiansen (1993) describe how principles from general management research can be applied in a computer based simulation model. This type of simulation has been used as decision support to predict the outcome of a particular project, as shown by Kunz, Rivero & Levitt (2000) and DNV (2000). Williams (2003) proposes combined use of causal mapping and System Dynamics to analyse the effect of a delay upon a project.
To quantify the effect of changes, Cooper & Reichelt (2004) have performed simulations of the aggregated disruptions caused by changes. Their simulations predicted that a change equivalent to 10% of the total project budget would cause disruptions amounting to 2.8 times the estimated size of a change.
Løken (2005) tested this estimate on a major scope change (called ‘U96’) in a Norwegian hospital project (Nytt Rikshospital). Based on a cut-off in year 2000, the scope change isolated was estimated to 424 million NOK, equivalent to c.10% the total cost. At the same cut-off time, total cost overruns were estimated to 1,105 million NOK. Simulations of Cooper & Reichelt (2004) then predict that such a change causes disruptions in the order of 2.8 times the estimated size of a change, or 1,013 million NOK. One interpretation of this is that disruptions from the scope change caused 92% the total cost overruns. This interpretation is supported by an evaluation report of the project (Arbeids- og administrasjonsdepartementet 2001). The evaluation report claims that this particular scope change was a major contribution to the total cost overruns, even though there were other additional factors.
Paper 3 studied how change management was approached in quality assurance reports. The strong emphasis on scope change management in the quality assurance reports indicates that changes and flexibility are primarily treated as something to be minimised, or at least to have a strict regime for. Management of changes was mentioned as a top issue in half of the projects. In most cases, the purpose was to establish a structured management of scope changes in order to minimise the amount and size of the changes.
Thus, at least two different strategies can be identified to manage scope changes: either to avoid changes or to reduce the negative impact from any changes that do arise. In the following, these two approaches for change management will be discussed in relation to redundancy.

5. Effectiveness and efficiency
26
5.3 Redundancy
According to Galbraith (1973), a critical limiting factor of organisations is the ability to handle the non-routine events that cannot be anticipated or planned for. When the ‘exceptions’ become too prevalent, they overwhelm the hierarchy’s ability to process them. Variations in organisation design arise from different strategies to increase planning ability and to reduce the number of exceptional events that management must resolve.
Galbraith (1973) defines a number of organisational forms that firms apply to manage uncertainty. These are either designed to increase capacity for information processing, or to reduce the need for information processing. Improvements in vertical or horizontal information processing are used to increase capacity for information processing. Slack resources or creation of self-contained tasks are used to reduce the information processing need. Self-contained tasks will be discussed in the next chapter, in relation to modularity.
Redundancy is an enabler for flexibility (Sager 1994). According to Landau (1969), redundancy is created by repetition, duplication and overlap. Galbraith (1973) points out that slack resources constitute an additional cost to an organisation. If a firm fails to actively create other strategies to address uncertainty, the slack resources strategy will occur by default. The logic behind redundancy is that a plan incorporating redundancy will be efficient because it can be executed as planned, compared to a plan with no redundancy that is vulnerable and error-prone in reality. Thompson (1967) also points out that the use of buffers or slack is common strategy for coping with uncertainty.
In Figure 9, ‘precision’ is used to indicate low redundancy and ‘slack’ to indicate high redundancy. The figure is inspired by a table in Olsson & Haugland (2004). Management of changes is another characteristic of alternative project flexibility strategies. Flexibility approaches can either aim at avoiding changes or managing changes. Figure 9 shows how these two perspectives, degree of redundancy and change management, characterise different approaches to project flexibility management. In the following, the different strategies are briefly presented.

5. Effectiveness and efficiency
27
High(Slack)
Low(Precision)
Avoidchanges
Managechanges
Capacity to handle changes
Flexibility in product or decision process
Hedge areas of expected changes
Agreement on scope
Degree of redundancyC
hang
em
anag
emen
tstra
tegy
Figure 9. Flexibility strategies in relation to redundancy and change management. (Paper 8, fig. 3)
Avoid changes, high redundancy Redundancy can be achieved by over-specification of future functionality. Future needs may be met without physical changes. Such needs may emerge during the project execution, or after the project has been delivered. Redundancy can also enable front-end analyses of alternative project concepts, which require recourses and time but may avoid later changes.
Avoid changes, low redundancy Aiming at a clear agreement on scope represents a traditional project management approach – to zoom in on project scope and then execute. After establishing the scope, project management aims at minimising external flexibility.
Manage changes, high redundancy High redundancy indicates a general capacity to manage a wide range of changes. ‘Slack’ is a keyword, including budget reserves, time slack in plans and organisation capacity to manage changes. On average, this increases project cost. However, it may still prove cost effective if the alternative is that the project will face changes which it does not have the resources to manage.
Manage changes, low redundancy In the process of locking specifications, certain parts are locked later than others. Low redundancy requires ability to identify and hedge areas exposed to changes. The late locking items must therefore be well defined and of a limited relative size.

5. Effectiveness and efficiency
28
6. Project flexibility categorisations
29
6. Project flexibility categorisations One aim of the thesis is to identify and describe different aspects of project flexibility. The previous chapters have discussed flexibility related to project phases, stakeholders and incentives, efficiency and effectiveness as well as redundancy.
Regarding categorisations of project flexibility, a distinction has already been made between internal and external flexibility. This chapter discusses flexibility related to modularity, flexible decision processes and flexible final products. The results of the analysis indicated that it was appropriate to make a distinction between planned and actual flexibility approaches.
6.1 Producing a flexible result or producing the result in a flexible manner Flexibility in a project can be associated with the decision process or the final product. This chapter describes these two dimensions of flexibility, and investigates interaction between them.
Flexibility in the decision process is based on an approach where decisions and commitments in the projects are made sequentially over episodes. The use of decision gate models provides a successive commitment to a project, as shown by Eskerod & Östergren (2000). Iterative and successive project decisions were also recommended by SIS TR 321 (Systems development reference model). The philosophy of not taking decisions until the last responsive moment, as shown by Ballard & Howell (2003), is also an example of flexibility in the decision process.
Flexibility in the product means that the design of the final product (what the project will produce) has taken into consideration possible future changes in use or requirements. If requirements are altered, no changes are needed because the design can accommodate the revised requirements. Flexibility in the product is achieved when the final product of the project is prepared for alternative use. As described by Brand (1994) and Blakstad (2001), this approach to flexibility is used in building construction. According to Arge & Landstad (2002), a commonly used classification of building adaptability was made in Sweden during the 1960s and 1970s. Based on this classification, generality is the ability of the building to meet shifting demands without physical changes. In this terminology, flexibility is related to possibilities for technical changes with minimum cost and disturbance. Lastly, elasticity means the potential for adding to or reducing the size of the building. In this thesis, all three characteristics collectively are referred to as flexibility.
Flexibility in the decision process and the product has been analysed independently by researchers previously (e.g. Brand 1994, Slaughter 2001, Boehm & Turner 2003). However, fewer studies have been made on the interaction between dimensions, Gill et al. (2005) being a notable exception. Flexibility in the decision process and the product may interact for any given project. Different types of interaction are depicted in Figure 10, each characterised by high or low flexibility in the process and product respectively. In Figure 10, high flexibility in the decision process in the study includes changes, extensions and iterations in the project preparations. A high flexibility in the product means that the result of the project is prepared for alternative use.

6. Project flexibility categorisations
30
The situation with low flexibility in both the product and the decision process means that no preparations for project flexibility are made. A strategy characterised by high flexibility in the product and low flexibility in the process is termed a ‘robust concept’. One assumption was that the decision process related to this type of project can be fairly straightforward because the result of the project is prepared for alternative use.
A basic principle in the situation with low flexibility in the product, and high flexibility in the process is that final decisions can be postponed in order to gain as much knowledge as possible. The situation with high flexibility in both the product and the process contains many of the aspects related to the other two strategies with high flexibility in either the process or the product.
The degree of flexibility in the product is typically intentionally established at an early stage in a project. On the other hand, a flexible decision process may either be intended or ad hoc.
Flexibility in decision process
Flex
ibili
tyin
pro
duct
Low High
High
Low Incrementaldecisions
No flexibilitypreparations
Flexibilitymaximization
Robustconcept
Figure 10. Flexibility in the product and the decision process. (Based on Paper 1, fig. 1)
Paper 1 describes studies of observed flexibility in 18 projects. Less than one-third of the projects had prepared for flexible decision processes. Paper 7 analyses flexibility in the decision process and the product related to cost overruns for the same 18 projects. Regardless of flexibility in the product, the 10 projects with highly flexible decision processes resulted in more than a 100% cost overrun, compared to the initial budgets. Most of these projects were subject to changes, extensions and iterations (summarised as ‘flexibility in the decision process’).
There are indications that projects with highly flexible product designs also had flexible decision processes as a response to contextual uncertainty. If this is the case, flexible products and flexible decision processes cannot compensate for each other as clear-cut as described in connection to Figure 10. It should be noted that the results are based on studies of few projects, especially when the projects are divided into subgroups.
6. Project flexibility categorisations
31
6.2 ModularityFlexibility can be related to the degree of modularity in projects. Modularity refers to the possibility to divide a project into more or less independent sub-units. According to Miller & Lessard (2000), modularity can enable projects to cope with uncertainty because individual components do not have a critical role.
Design modularity is a common approach to achieve flexibility (Thomke 1997, Hellström & Wikström 2005). Hellström & Wikström (2005: 394) define modularisation as ‘decomposition of a part of a product into building blocks (modules) with specified interfaces, driven by company-specific reasons’. Thomke (1997) claims that modularisation in product development projects is primarily a tool to improve project efficiency. One benefit of design modularity is that the ‘knock-on’ effects of changes can be reduced.
Galbraith (1973) defined organisational forms that firms apply to manage uncertainty. One strategy for reducing the need for information processing is the creation of self-contained tasks. This can be seen as a form of modularisation.
An approach of minimal commitment at each decision stage is a part of the ‘anti-disaster methodology’ proposed by Hall (1980: 267). According to Hall (1980: 272) ‘this would generally mean an incremental or adaptive approach to development of any kind, rather than a new major departure; it would suggest enlargement and adaptation of existing airports rather than building new ones’. Lee & Xia (2005) found that smaller and shorter information systems projects experienced fewer changes than larger projects and were more efficient in dealing with changes. They advise that projects with a duration of more than three to six months can be divided into time-boxes with well-defined deliverables. Another approach to incremental decision making is also found in real options (Amram & Kulatlaka 1999, Brennan & Trigeorgis 2000).
Civil engineering projects are often seen as indivisible and irreversible. Statements such as ‘we do not build half a bridge’ are used to argue against flexibility and modularisation. Miller & Lessard (2000) point to the irreversibility of large engineering projects and the importance of bold commitment from key stakeholders. In contrast, Genus (1997) advocates flexible and incremental decision making in large engineering projects, based on experiences from the Channel Tunnel between Britain and France.
The results presented in Paper 1 and Paper 8 also indicate that modularity frequently is an enabler for flexible decision processes. Highly modular projects were found likely to have highly flexible decision processes.
Modularity has been presented as an enabler for flexible project management. Modularity can be applied on a micro and macro level. On a micro level, design modularity is a tool for efficiency, including minimising the negative effect of changes. On a macro level, modularity is an enabler for flexible decisions processes. By dividing projects into independent sub-units, decision makers can make the incremental commitments.
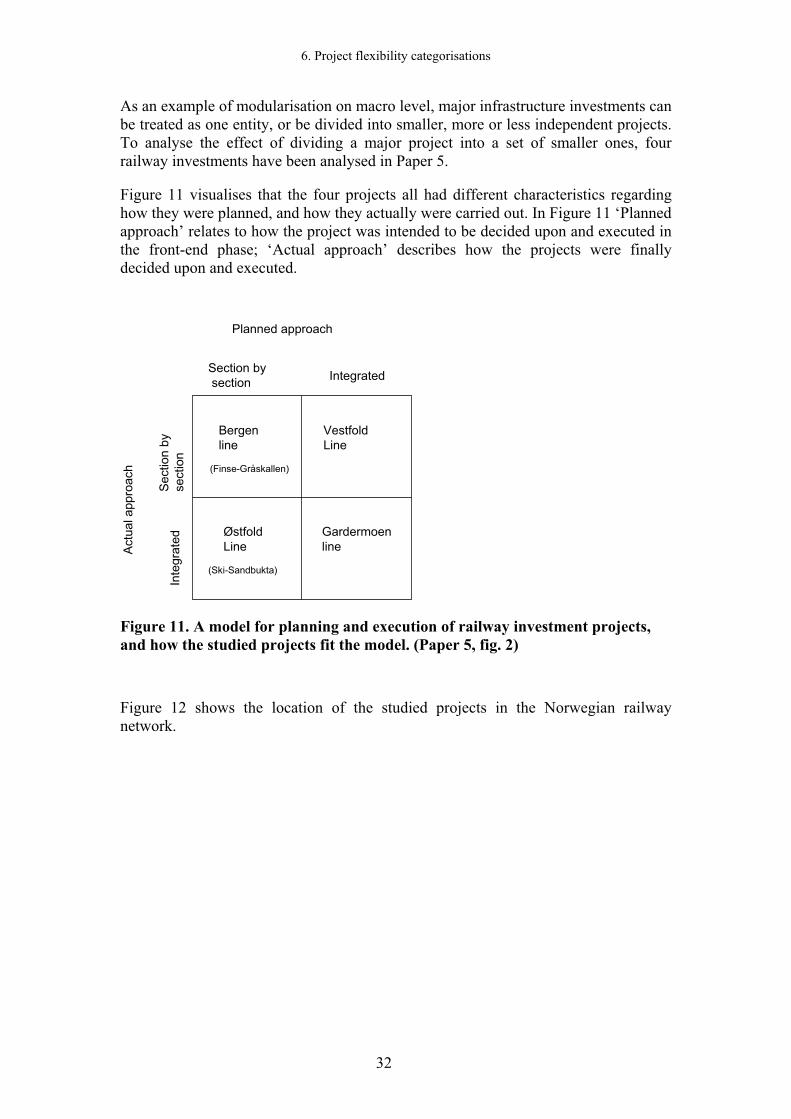
6. Project flexibility categorisations
32
As an example of modularisation on macro level, major infrastructure investments can be treated as one entity, or be divided into smaller, more or less independent projects. To analyse the effect of dividing a major project into a set of smaller ones, four railway investments have been analysed in Paper 5.
Figure 11 visualises that the four projects all had different characteristics regarding how they were planned, and how they actually were carried out. In Figure 11 ‘Planned approach’ relates to how the project was intended to be decided upon and executed in the front-end phase; ‘Actual approach’ describes how the projects were finally decided upon and executed.
Planned approach
Section bysection Integrated
Sect
ion
byse
ctio
n
VestfoldLine
Bergenline
Gardermoenline
ØstfoldLineAc
tual
appr
oach
Inte
grat
ed
(Finse-Gråskallen)
(Ski-Sandbukta)
Figure 11. A model for planning and execution of railway investment projects, and how the studied projects fit the model. (Paper 5, fig. 2)
Figure 12 shows the location of the studied projects in the Norwegian railway network.

6. Project flexibility categorisations
33
Bodø
Trondheim
Åndalsnes
KarlstadStockholm
GöteborgKøbenhavn
ÖstersundStockholm
Narvik KirunaBodenStockholm
LarvikKristiansand
Bergen
Hamar
Stavanger
Gardermoen line
Vestfoldline project
Østfoldline project
Bergenline project
Oslo
HaldenMoss
Figure 12. The Norwegian rail network and location of studied projects (in grey). The size and location of the new built rail lines are only for illustrational purpose. (Paper 5, fig. 1)
Table 2 presents a summary of the impact of the four railway projects studied. A comparison was made between the forecast and actual outcome of selected variables: travel time, frequency, punctuality, and number of travellers. The analysis also included a comparison between the situation before and after the investments. The study presented in Paper 5 indicates that the major drawback with section-by-section investments is that the traffic is not adjusted when each new railway section opens. Timetables must be adjusted to utilise new and potentially faster railway sections. Results presented in Paper 5 indicate that a critical mass of potential improvement is needed to justify timetable changes that utilise new infrastructure. Investments that are executed as integrated projects appear to be more likely to achieve timetable adjustments, compared to investments built and decided upon section by section.
Actual project approach
Development in number of travellers, compared to before
Train traffic compared to before
Cost
Section by section Small changes Moderate improvements
Control
Integrated Major increase Major improvements Overruns
Table 2. Observed impact from the studied project strategies. (Paper 5, table 8)
A real options approach to railway investment aims at maximising the benefit/cost ratio by sequenced decisions, continuously utilising updated information. The study in

6. Project flexibility categorisations
34
Paper 5 questions the possibilities to actually achieve reliable information related to benefits. The effects of investments do not materialise until the combined investments on a line reach a certain level. Dividing an investment into a series of sections, decided upon individually, may therefore result in lower benefits in terms of, for example, travel time, compared to an integrated project approach. These results are contrary to common understanding in the project management field, where flexibility usually is seen as a means of achieving increased benefit from a project, as described in Paper 4.
If modularisation of railway investments has disadvantages related to the realisation of benefits, it appears to provide cost control. These results are in accordance with Flyvbjerg et al. (2004), who point out that cost escalation of major transportation investments is highly dependent on the length of the project implementation phase. Longer implementation causes higher cost escalation.

7. Conclusions
35
7. Conclusions
This thesis aimed at structuring knowledge on project flexibility. Based on studies of different parts of the life cycle of projects, it was hoped that the research would provide indications to how flexibility can be addressed in the front-end phase of large public investments. This chapter summarises the findings and implications from the research. It should be borne in mind that it cannot be statistically proved that the findings are generally applicable. Validity and reliability associated with the data used in this thesis are not sufficient to provide solid answers, taken in isolation. Further research is needed to clarify to what extent these indications are of a general nature or project-specific.
7.1 How can different aspects of flexibility in projects be analysed? One aim of the thesis is to identify different aspects of flexibility and to discuss how they can contribute to analysis and management of project flexibility. Figure 13 shows how the different aspects can be put together as a framework for analysis of project flexibility. The framework for analysis consists of project flexibility categorisations, perspectives of analysis, and flexibility drivers and enablers.
Four categorisations of project flexibility have been discussed: planned flexibility versus actual flexibility approaches; internal flexibility versus external flexibility; flexible decision processes versus flexible final products; and modularity on macro and micro level.
Three perspectives on project flexibility are used. Project flexibility is seen from the perspective of different stakeholders, in different project phases and related to efficiency and effectiveness.
Finally, drivers and enables of project flexibility are listed and discussed. Uncertainty, project duration, conflicts, and insufficient project preparations are highlighted as flexibility drivers. The enablers are degree of redundancy, incentives open to the stakeholders, and modularity. The thesis has discussed flexibility, both related to each aspect in the framework individually, and seen in combination. When analysed in combination, the aspects have been combined two and two.
Flexibilitycategorisations
Planned vs. actual flexibilityInternal vs. external flexibilityDecision process vs. products
Enablers
RedundancyIncentivesModularity (micro and macro)
Project phasesStakeholdersEfficiency vs. effectiveness
Perspectivesof analysis Drivers
UncertaintyDurationConflictsInsufficient preparationsFlexibility options
Figure 13. Framework for analysing project flexibility. (Paper 8, fig. 1)

7. Conclusions
36
Flexibility categorisations The following is a short summary of findings related to the applied flexibility categorisations.
Planned flexibility versus actual flexibility approaches Approaches to project flexibility have been analysed over time. In the studies, there was a need to make a distinction between planned and actual approaches to flexibility. Approaches to flexibility changed during the projects. Actual approaches turned out to be different from planned approaches.
Internal flexibility versus external flexibility Another distinction was made between internal and external project flexibility. When flexibility is discussed in the literature and in general, it is most often related to external flexibility, referring to adjustments of project scope. This was also the case for the early work on this thesis. Project internal flexibility relates to flexibility within a defined scope – how requirements are to be met. Particularly, analyses of stakeholder approaches to flexibility are highly dependent upon whether internal or external flexibility is the subject of discussion. Internal and external flexibility are responses to contextual and internal uncertainty. However, internal flexibility is not limited to being a response to internal uncertainty. External flexibility can be, but does not have to be, a response to contextual uncertainty. All combinations of the two dimensions can be found.
Flexible decision process versus flexible final products Project flexibility was divided into flexibility in the decision process and the product may interact for any given project. For the purpose of categorising flexibility, a distinction between the flexibility types has been meaningful. This thesis has also made an attempt to study the interaction between flexibility in decision processes and the product. It was expected that flexible final products would compensate for less flexible decision processes and vice versa. The results show that this interaction is not as visible as first expected. This may be due to the small sample of projects. It may also be an indication that flexible projects utilise both flexible products and flexible decision processes, rather than emphasising one of these dimensions at the expense of the other.
Perspectives of analysis The results indicate that project flexibility is perceived differently depending on whose view one takes, and which part of a project’s life cycle is subject to analysis.
StakeholdersAs mentioned above, incentives open to stakeholders affect their approaches to project flexibility. Flexible projects have been presented as a blessing and curse. One aspect of this duality is that the flexibility for one project stakeholder can be another stakeholder’s risk. Project internal flexibility appears to be particularly desirable to project managers and contractors. Project external flexibility is more likely to be looked upon favourably by users and project owners, than by project managers and contractors.

7. Conclusions
37
Project phases Flexibility in the front-end phases is the least controversial aspect of project flexibility. This is particularly related to external flexibility. One objective of front-end management is to provide a well-defined framework for efficient project implementation. Project flexibility can then be restricted to adjustments within the strategic framework. The thesis has discussed the theoretical foundation for this approach, and shown empirically that minimising external flexibility after the front-end phase increases the likelihood of completing projects on time, within budget and according to specifications.
Efficiency and effectiveness Project flexibility has been studied from both efficiency and effectiveness perspectives. The case in favour of flexibility emphasises the possibility to increase a project’s effectiveness. As indicated in Figure 14, effectiveness is primarily addressed by external flexibility. Project scope is adjusted to utilise benefit opportunities. Regarding efficiency, such adjustment of project scope typically causes cost of changes. The net effect comes from a balance between the values of benefit opportunities and incurred cost of changes.
Internal flexibility (within the scope of a project) is primarily linked to cost reduction opportunities, which can be utilised by project management or involved contractors.
Efficiency Effectiveness
Externalflexibility(What?)
Internalflexibility(How?)
Changecosts
(LimitedImpact)
Benefitopportunities
Cost reductionopportunities
Figure 14. Internal and external flexibility versus efficiency and effectiveness.
The analyses presented in this thesis indicate a major challenge in materialising the expected benefits. On the other hand, the expected decrease in efficiency as a consequence of project flexibility has been frequently observed throughout the analysis.
7. Conclusions
38
DriversIn this context, drivers are factors that create needs or impose pressure on projects to be flexible.
Uncertainty Uncertainty is the key driver for project flexibility, and arguably the only one. The other drivers mentioned below are in fact only highlights of selected types of uncertainty. In this thesis, uncertainty has been related to a gap between the amount of information needed to make a decision and the amount of information available (based on Galbraith 1993). In order to manage this information gap, flexibility is primarily a way of reducing the amount of information needed. Other project management approaches often focuses on increasing the available amount of information.
DurationThe longer the duration of a project, the more likely it is that some prerequisites become no longer valid. Long duration is likely to result in more or less suppressed need for scope changes. Both cost and demand estimates are more uncertain the longer the time perspective is. What is ‘long’ duration is highly dependent upon the type of project. Experiences from previous projects of the same type provide indications of how long prerequisites are likely to stay sufficiently stable.
Conflicts Flexible projects can contribute to conflict solutions. However, conflicts that arose during the preparation or execution of a project have been observed as an important driver for flexibility. Project flexibility can also be an issue of conflict. Flexible decision processes are likely to be valued by those who do not prefer an initial decision. Stakeholders who benefit from the initial decisions are less likely to favour a continued flexible decision process.
Insufficient preparations Even though it is not a recommended situation, projects that for political or other reasons are pushed to a premature go-ahead decision are likely to need an active approach to flexibility. This type of project has been observed to be flexible, not because of opportunities for increased benefit or reduced cost, but to be possible to implement. For such projects, project flexibility serves as a cover-up for a lack of preparation.
Flexibility options Availability of flexibility options and redundant resources can serve as an invitation to make adjustments. Of the studied projects, those with a high planned flexibility in the decision process also had a high actual flexibility in the decision process. If there are possibilities for adjustments and iterations, it is likely that flexibility options will be utilised. This means that the presence (or knowledge) of flexibility enablers can work as a flexibility driver.

7. Conclusions
39
EnablersThis thesis refers to enablers as factors that contribute to making it possible for projects to be flexible.
Degree of redundancy Redundancy has been presented as an enabler for flexibility. Redundancy can be applied to flexibility in both the product and decision process. Flexibility in the product may be achieved by over-specification of future functionality. A flexible decision process calls for redundant recourses and time to perform analyses of alternative project concepts. The rationality behind the use of redundancy is that this use of resources is cost effective compared to later major changes.
IncentivesIncentives for different project stakeholders are strongly related to the contracting structure of a project and other financial obligations. A common tool for achieving flexibility in projects is the use of option-based contracts, which enable a continuous locking of the projects. Flexibility has a value for those that can benefit from adjustments, and it is a cost for those who have to adapt. The fewer restrictions on their part of the project, the better opportunities there are for any stakeholder to optimise the use of available resources.
Modularity on macro and micro level Modularity has also been identified as an enabler for flexible project management. On a micro level, design modularity is a tool for efficiency because it may reduce negative effect of changes. On a macro level, it has been shown that modularity can be an enabler for flexible decision processes because decision makers can make the incremental commitments. Macro modularisation of projects usually means that each module can be produced over a shorter time period than would have been the case for an integrated project. Shorter execution time reduces the probability for major adjustments during the project. Modularity on macro level was analysed for railway investment projects. In the studied projects, macro modularisation was associated with cost control but also with lower benefit realisation than planned.
7.2 What are the implications for front-end management? Successful strategies for project flexibility either aim at avoiding flexibility in projects or enabling projects to manage flexibility. Projects avoid adjustments or live with them. To be more specific and using the terminology presented in the thesis, successful strategies aim either at avoiding external flexibility after the front-end phase, or at managing external flexibility during the planning and execution phases. The following discussion is related to external flexibility. Project internal flexibility has not been analysed enough in this thesis to provide implications for project management.
The longer the time-frame of a project, the less likely it is that prerequisites will remain unchanged. This means that the longer the time-frame of a project, the more important it is to prepare the project to either avoid or manage changes.
Even though the results are based on studies of a few projects, this thesis has shown that the potential drawbacks of flexible projects are substantial, both in terms of

7. Conclusions
40
efficiency and effectiveness. There are also indications that the drawbacks are largest when projects do not prepare for subsequent adjustments. This notion is consistent with previous works on flexibility, including Sager (1994), Volberda (1997), Abbot & Banerji (2003), and Turner (2004), that view managing flexibility as an orderly response to a changing world.
The thesis has identified some characteristics of successful project flexibility management. These findings can be of value in front-end preparations of future projects. The following summary is based on results presented in the literature, along with results from the studied projects. Four approaches to project flexibility management are presented in Table 3, together with a summary of strengths and weaknesses for each approach.
Objective Approach Strengths Weaknesses Applications Avoidadjustments (after locking of scope)
1. Late locking of project scope and fast execution
Utilises the strengths of front-end(openness) and execution phase (focus)
Depends on fast locking of scope and execution. Lack of decisions in front-end phase can cause frustration.
Productdevelopment projects
Manage(limited) adjustments
2. Shield off areas of uncertainty
Allows the major part of a project to be executedwithoutadjustments
Still-open items must be of limited size (max. 10-15%). Identifying the right items
Technicalinstallations in buildings finally specified later than the rest of project
Avoidadjustments (in modules); Manageadjustments (betweenmodules)
3. Incremental commitments
Allows each module to be executedwithout changes
Each module will provide benefits. Longer totalimplementation time
Roads or railways divided into sections
Manageadjustments
4. Absorption More cost effective than dealing with adjustments with no availableresources
Amount of adjustments can escalate beyond control
Over-specification of functionality. Redundantengineeringcapacity
Table 3. Approaches to external flexibility management.
The four approaches are described in more detail in the following. Each approach is illustrated, including a comparison to the generic figures in Figure 2 and Figure 4. The dashed ‘high to low’ curve that illustrates decreasing freedom for manoeuvre is the same in Figure 15, Figure 16, Figure 17, and Figure 18. This curve represents a ‘traditional’ project preparation and implementation. The purpose of Figure 15, Figure
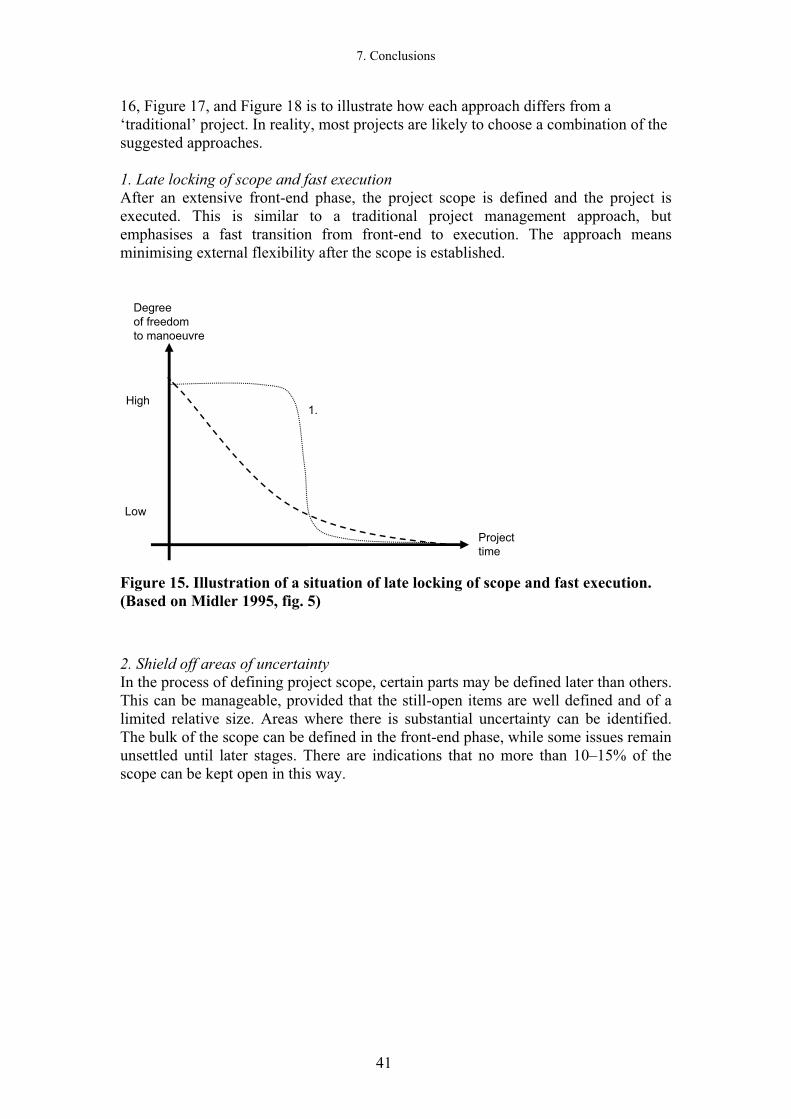
7. Conclusions
41
16, Figure 17, and Figure 18 is to illustrate how each approach differs from a ‘traditional’ project. In reality, most projects are likely to choose a combination of the suggested approaches.
1. Late locking of scope and fast execution After an extensive front-end phase, the project scope is defined and the project is executed. This is similar to a traditional project management approach, but emphasises a fast transition from front-end to execution. The approach means minimising external flexibility after the scope is established.
High
Low
Degree of freedomto manoeuvre
Projecttime
1.
Figure 15. Illustration of a situation of late locking of scope and fast execution. (Based on Midler 1995, fig. 5)
2. Shield off areas of uncertainty In the process of defining project scope, certain parts may be defined later than others. This can be manageable, provided that the still-open items are well defined and of a limited relative size. Areas where there is substantial uncertainty can be identified. The bulk of the scope can be defined in the front-end phase, while some issues remain unsettled until later stages. There are indications that no more than 10–15% of the scope can be kept open in this way.

7. Conclusions
42
Projecttime
Majorpartsof project
Shieldedpartsof projectHigh
Low
Degree of freedomto manoeuvre
2.
Figure 16. Illustration of a situation of where areas of uncertainty are shielded off for late locking. (Paper 7, fig. 7)
3. Incremental commitments In an incremental approach, projects are committed to piece by piece. Large projects are decided upon and executed as a series of smaller projects. Each module can be executed relatively isolated due to a relatively short implementation period. Modularising (on the macro level) of major projects offer flexibility options for decision makers. For modular projects, effectiveness may be low unless each module is designed to provide benefits as individual deliveries, and not only providing a foundation for future improvements.
Projecttime
3a. 3b. 3c.
High
Low
Degree of freedomto manoeuvre
Figure 17. Illustration of a situation of incremental commitments, in three steps.

7. Conclusions
43
4. Absorption Absorption can be obtained by redundancy or decoupling of dependencies. Regarding the physical design, redundancy includes over-specification and other types of flexibility in the product. Decoupling of dependencies can be achieved by a modular design, which reduces domino effects from changes. As for the project organisation, ‘slack’ is a keyword, including budget reserves, time slack in plans and organisation capacity to manage changes. In the studied projects, the lack of available resources has been observed more frequently than availability of such resources. With reference to Figure 18, means that a project is designed to address some of the desired room for manoeuvring that occurs, even if it violates the actual room for manoeuvring. In practice, this means to manage changes.
High
Low
Degree of freedomto manoeuvre
Projecttime
Desiredroom formanoeuvring
Figure 18. Illustration of a situation where a project is designed to absorb changes. (Based on Figure 4)
7.3 Generalising results The bulk of the research presented in this thesis is based on case studies. Case studies are generally not intended or suitable for generalisation of the results. The small samples in the studies do not warrant the use of statistical tools to test consistency and co-variation of data, particularly when subgroups of the material are subject to analysis.
Strictly speaking, the findings in this thesis are valid only for the scope of the observations made. However, all major Norwegian governmental investments (as this type of project was defined by the Ministry of Finance in 2001) that were approved between 2000 and 2004, have been included in the analysis. Among major Norwegian governmental investments carried out between 1986 and 2000, the sample is judged to be relatively representative. The studied railway projects include four of the largest railway investments in Norway since 1980. Regarding major Norwegian governmental investments, the sample is probably representative. To a certain extent the sample covers all applicable projects. Focusing on major Norwegian governmental investments, the major weakness of this thesis is probably not whether the studied projects are representative or not, but whether the studied aspects of the projects are comprehensive.

7. Conclusions
44
As mentioned, the vast majority of the studied projects are Norwegian governmental projects, and all projects were in a ‘public sector context’. While some of the principles discussed in the thesis are likely to be relevant for non-governmental projects, other aspects are likely to be different in commercial projects.
Stakeholder roles are likely to be different in projects where there is a close business link between investment costs and realised benefits. A close business link means both in terms of short time horizon and accountability for investment costs. Such close business links can be present in investments in new production facilities. The investment cost will be compensated for by increased productivity and possibly increased production volume. In such situations, it is likely that more stakeholders will be involved in balancing cost/benefit ratios regarding project scope and adjustments. However, the results from this thesis are likely to be more relevant to commercial projects for which the business link is not so close. This is the case if there is a long time between a decision and the ‘moment of truth’ when the investment provides payback, or when accountability for investment costs is less direct.
Only Norwegian investment projects have been analysed. The presentation of previous research has not been limited to Norwegian studies. During the literature search, one possible difference was found between experiences from Norwegian projects and general experiences in the project management community. In a Scandinavian management tradition, user involvement is emphasised as a key success factor in projects involving organisational change (see, for example, Trist & Bamforth 1951, Emery & Thorsrud 1976). The degree of user involvement is likely to vary between different countries and traditions. These variations may also influence other stakeholder roles in projects. On a detailed level, Paper 5 includes a discussion about the extent to which experiences from Norwegian railway projects are applicable to other countries.
7.4 Further research This thesis has explored project flexibility in a general perspective. An analysis of project flexibility in relation to project types; including industry, uncertainty level and degree of innovation is recommended. Industry-specific models and guidelines for project flexibility are likely to appeal to practitioners within the project management field. Further research is needed to map the implementation and effects of different approaches to flexibility in different types of projects.
Four approaches to flexibility management were proposed. A fifth approach can be imagined. With reference to Figure 18, this would mean to lower the ‘desired room for manoeuvring’-curve. In practice, this means to reduce the number and size of desired changes. To reduce user initiated changes, alignment, collaboration and communication in the front-end phase are likely issues. Computer-based visualisation tools can contribute to earlier and increased understanding of project deliveries. To anticipate and reduce owner initiated changes, selecting proper project concepts are a key issue, and it has to a certain extent been addressed in the thesis.
7. Conclusions
45
There appears to be a gap between the resistance to flexible projects among project management practitioners on the one side, and the promotion of flexibility by academics and stakeholders with no incentives related to project efficiency on the other side. This calls for increased emphasis on active use of present and developing knowledge of project flexibility. In addition, the project management filed can benefit from a pragmatic convergence of an idealistic promotion of project flexibility on one side, and experience-based hesitation to flexibility on the other side.
Regarding change management, analysis of which types of scope changes can be managed without severe reductions in project efficiency is proposed. There exist some developed simulation tools and methods which can be used to illustrate the effect of changes. Further use of such models is suggested. In order to calibrate the models, and gain additional understanding, it is interesting to simulate well documented projects ex post, so that simulated and observed results can be compared for the same projects.
The thesis has discussed flexibility relating to selected aspects individually, and in two-dimensional combinations. With larger samples, this type of analysis would benefit from regression analysis along the different aspects.
Further research is also called for to investigate the connection between modularisation of infrastructure investments and the realisation of anticipated benefits. This was especially discussed in Paper 5 in relation to railway investments. One question that arose was whether relatively limited investments in transportation infrastructure, and railways in particular, should be evaluated based on the actual reduction in travel time, or rather the potential travel time.
Finally, continued use of a combination of qualitative and quantitative research in the project management field is desirable. Such designs have the possibility to contribute to enhancing the credibility of project management as a research field. While structured qualitative research designs have been successfully applied, there is a potential for the increased use of quantitative research designs.

7. Conclusions
46

47
References
Abbot, A. & Banerji, K. 2003. Strategic flexibility and firm performance: The case of US based transnational corporations. Global Journal of Flexible Systems Management 4:1-2, 1–8.
Arge, K. & Landstad, K. 2002. Generalitet, fleksibilitet og elastisitet i bygninger. Prinsipper og egenskaper som gir tilpasningsdyktige kontorbygninger. [Generality, flexibility and elasticity in buildings. Principles for adaptability of office buildings.] Prosjektrapport 336, Norges byggforskningsinstitutt, Oslo.
Amram, M. & Kulatlaka, N. 1999. Real Options: Managing Strategic Investment in an Uncertain World. Financial Management Association Survey and Synthesis Series, Harvard Business School Press, Boston.
Arbeids- og administrasjonsdepartementet. 2001. Evaluering av NRH-prosjektet. PTL, SINTEF, Deloitte and Scanteam, Oslo.
Bahrami, H. & Evans, S. 2005. Super-Flexibility for Knowledge Enterprises.Springer, Berlin.
Ballard, G. & Howell, G.A. 2003. Lean project management. Building Research & Information 31:2, 119–133.
Berg, P., Andersen, K., Østby, L.-E., Lilleby, S., Stryvold, S., Holand, K., Korsnes, U., Rønning, K., Johansen, F. & Kvarsvik, T. 1999. Styring av statlige investeringer. Prosjektet for styring av statlige investeringer. [Management of Governmental Investments.] Finans- og tolldepartementet, Department of Finance, Oslo.
Blakstad, S.H. 2001. A Strategic Approach to Adaptability in Office Buildings. PhD thesis, Norwegian University of Science and Technology, Trondheim.
Boehm, B. & Turner, R. 2003. Observations on balancing discipline and agility. Proceedings of the Agile Development Conference ADC’03. IEEE Computer Society.
Brand, S. 1994. How Buildings Learn, What Happens After They’re Built. Viking Penguin, Penguin Books, New York.
Brennan, M.L. & Trigeorgis, L. 2000. Project Flexibility, Agency, and Competition: New Developments in the Theory and Application of Real Options. Oxford University Press, New York.
Christiansen, T.R. 1993. Modeling efficiency and effectiveness of coordination in engineering design teams: VDT – the Virtual Design Team. Ph.D. Dissertation, Dept. of Civil Engineering, Stanford University.

48
Christensen, S. & Kreiner, K. 1991. Prosjektledelse under usikkerhet. [Project Management under Uncertainty.] Universitetsforlaget, Oslo.
Cleland, D.I. 2004. The evolution of project management. IEEE Transactions on Engineering Management 51:4, 396–397.
Cooper, K.G. & Reichelt, K.S. 2004. Project changes: Sources, impacts, mitigation, pricing, litigation, and excellence. In: Morris, P.W.G. & Pinto, J.K. (eds.) TheWiley Guide to Managing Projects, 743–772.. John Wiley and Sons, Hoboken, NJ.
Crawford, L. & Pollack, J. 2004. Hard and soft projects: A framework for analysis. International Journal of Project Management 22:8, 645–653.
DNV 2000. Securing the Chernobyl bequest. FORUM The Corporate Magazine of Det Norske Veritas 4/2000, 30-31.
Dvir, D. & Lechler, T. 2004. Plans are nothing, changing plans is everything: The impact of changes on project success. Research Policy 33, 1–15.
Eden, C, Williams, T & Ackermann, F. 2005. Analysing project cost overruns: comparing the „measured mile“ analysis and system dynamics modelling. International Journal of Project Management 23:2, 135-139.
Eden, C, Ackermann, F.& Williams, T. 2005. The Amoebic Growth of Project Costs. Project Management Journal 36:2, 15-27.
Eikeland, P.T. 2001. Teoretisk Analyse av Byggeprosesser. [Theoretical Analaysis of the Construction Process.] Samspill i byggeprosessen, prosjektnr. 10602.
Emery, F. & Thorsrud, E. 1976. Democracy at Work. The Report of the Norwegian Industrial Democracy Program. Martinius Nijhoff Social Sciences Division, Leiden.
Engwall, M. 2003. No project is an island: Linking projects to history and context. Research Policy 32, 789–808.
Eskerod, P. & Östergren, K. 2000. Why do companies standardize projects work? Project Management 6:1, 34–39.
Fellows, P. & Liu, A. 2003. Research Methods for Construction. Blackwell Science, Oxford.
Flyvbjerg, B., Holm, M.S. & Buhl, S. 2005. How (in)accurate are demand forecasts in public works projects? The case of transportation. Journal of the American Planning Association 71:2; 131-146.
Galbraith, J.R. 1973. Designing Complex Organizations. Adison-Wesley, Reading, MA.
49
Gareis, R. 2004. Maturity of the Project-Oriented Organization. Nordnet International Project Management Conference, 29.9. – 2.10. 2004, Helsinki, Finland.
Garel, G. & Midler, C. 2001. Front-loading problem-solving in co-development: Managing the contractual, organisational and cognitive dimensions International Journal of Automobile Technology Management 1:2-3, 236–250.
Genus, A. 1997. Managing large-scale technology and inter-organisational relations: The case of the Channel Tunnel. Research Policy 26:2, 169–189.
Gill, N., Tommelein, I.D., Stout, A. & Garrett, T. 2005. Embodying product and process flexibility to cope with challenging project deliveries. Journal of Construction Engineering and Management 131:4, 439–448.
Hall, P. 1980. Great Planning Disasters. Weidenfeld and Nicolson, London.
Hanna, A.S., Calimic, R., Peterson, P.A. & Nordheim, E.V. 2002. Quantitative definition of projects impacted by change orders. Journal of Construction Engineering Management 128:1, 57–64.
Hellström, M. & Wikström, K. 2005. Project business concepts based on modularity – Improved maneuverability through unstable structures. International Journal of Project Management 23:5, 392–397.
Ibbs, C.W., Wong, C.K. & Kwak, Y.H. 2001. Project change management systems. Journal of Management in Engineering 17:3, 159–165.
Jacobsen, G. 2006. Trimmet Bygg teorien og erfaringer ved praktisk bruk I Veidekke AS. [Lean construction: theory and experiences from practical use in Veidekke AS] Project report. Norwegian University of Science and Technology, Trondheim.
Jensen, C., Johansson, S. & Löfström, M. 2006. Project relationships – A model for analyzing interactional uncertainty. International Journal of Project Management 24:1, 4–12.
Karlsen, J.T. 1998. Mestring av omgivelsesusikkerhet. PhD thesis, Norwegian University of Science and Technology, Trondheim.
Koerckel, A., Ballard, G. & España, F. 2005. Channel Tunnel Rail Link – A Lean Construction Implementation Case Study. ASQ World Conference on Quality and Improvement Proceedings 59, 111–120.
Koskela, L. 2000. An Exploration Towards a Production Theory and its Application to Construction. PhD thesis, VTT Publications 408, VTT, Technical Research Centre of Finland, Espoo.
Kreiner, K. 1995. In search of relevance: Project management in drifting environments. Scandinavian Journal of Management 11:4, 335–346.

50
Kunz, J.C., Rivero, C.E. & Levitt, R.E. (2000) Simulating work processes and organisations to ”engineer” strategic projects. Proceedings of tETCE/OMAE2000 Joint Conference: Energy for the New Millenium, February 14-17 2000, New Orleans.
Kunz, J.C., Levitt, R.E., Jin, Y. (1998) The Vitual Desing Team: A Computational Simulation Model of Project Organizations. Communications of the Association for Computing Machinery (CACM) 41:11, 84-91.
Landau, M. 1969. Redundancy, rationality and the problem of duplication and overlap Public Administration Review 29:July-August, 346–358.
Lee, G. & Xia, W. 2005. The ability to respond to business and technology changes: A study of flexibility measures. European Journal of Information Systems14:1, 75–92.
Løken, A. 2005. Endringshåndtering i prosjekt Nytt Rikshospital. [Change management in hospital development projects.] Project report. Norwegian University of Science and Technology, Trondheim.
Love., P.E.D., Irani, Z. & Edwards, D.J. 2004. A rework reduction model for construction projects. IEEE Transactions on Engineering Management 51:4, 426–440.
Lundin, R.A. & Söderholm, A. 1995. A theory of the temporary organization, Scandinavian Journal of Management 11:4, 437–455.
Lundin, R.A. & Söderholm, A. 1998. Conceptualizing a project society – discussion of an eco-institutional approach to a theory on temporary organisations. In: Lundin, R. & Midler, C. (eds.) Projects as Arenas for Renewal and Learning Proceses, 13–23. Kluwer Academic, Dordrecht.
Mahmoud-Jouini, S.B., Midler, C. & Garel, G. 2004. Time-to-market vs.time-to-delivery managing speed in engineering, procurement and construction projects. International Journal of Project Management 22:5, 359–367.
McElroy, B. & Mills, C. 2000. Managing stakeholders. In: Turner, R.J. & Simister, S.J. (eds.) Gower Handbook of Project Management. Gower, Aldershot.
Merriam-Webster Online Dictionary. 2006. http://www.m-w.com/ (accessed 4 April 2006).
Midler, C. 1995. ‘Projectification’ of the firm: The Renault case. ScandinavianJournal of Management 11:4, 363–375.
Mikkelsen, H. & Riis, J.O. 2003. Grunnbog i prosjektledelse [Text book in project management.] Prodevo ApS, Rungsted.

51
Miller, R. & Lessard, D. 2000. The Strategic Management of Large Engineering Projects, Shaping institutions, Risks and Governance. Massachusetts Institute of Technology, Cambridge, MA.
Ministry of Finance. 2001. The Norwegian Government Budget. [St. prp 1. (2001-2002)]. Oslo.
Mintzberg, H. 1994. The Rise and Fall of Strategic Planning, Prentice Hall International, Hemel Hempstead/Englewood Cliffs, NJ.
Morris, P.W.G. & Hough, G.H. 1987. The Anatomy of Major Projects. A Study of the Reality of Project Management. John Wiley and Sons, Chichester.
Moseng, B. & Bredrup, H. 1993. A methodology for industrial studies of productivity performance. Journal of Production Planning and Control 4:3.
Müller, R. & Turner, J.R. 2005. The impact of principal-agent relationship and contract type on communication between project owner and manager. International Journal of Project Management 23:5, 398–403.
Norsk bygge- og anleggskontrakt NS 8405 [Norwegian building and civil engineering contract.] 2004. Norsk Standard. Norges Standardiseringsforbund, Oslo.
OECD. 2000. OECD glossary of terms in evaluation and results based management.Paris: Organisation for Economic Co-operation and Development [OECD].
Olsson, N.O.E. & Haugland, H. 2004. Influencing factors on train punctuality – results from some Norwegian studies. Transport Policy 11:4, 387–397.
Olander, S. & Landin, A. 2005. Evaluation of stakeholder influence in the implementation of construction projects. International Journal of Project Management 23:4, 321–328.
Packendorff, J. 1995. Inquiring into the temporary organisation: New directions for project management research. Scandinavian Journal of Management 11:4, 319–334.
PMI. 2004. A Guide to the Project Management Body of Knowledge: PMBOK® Guide. Project Management Institute, Newton Square, PA.
Sager, T. 1994. Communicative Planning Theory. Ashgate Publishing Company, Brookfield, Vermont.
Samset, K. 2001. Prosjektvurdering i tidligfasen - Fokus på konseptet. Tapir akademisk forlag, Trondheim.
Sink, D.S. & Tuttle, T.C. 1989. Planning and Measurement in Your Organization of the Future. Industrial Engineering and Management Press, Norcross, GA.
52
SIS TR 321 Systems development reference model 1989.Standardiseringskommissionen i Sverige, Stockholm.
Skamris, M.K. & Flyvbjerg, B. 1997. Inaccuracy of traffic forecasts and cost estimates on large transport projects. Transportation Policy 4:3, 141–146.
Slaughter, S.E. 2001. Design strategies to increase building flexibility. BuildingResearch and Information 29:3, 208–217.
Söderlund, J. 2004. Building theories of project management: Past research, questions for the future. International Journal of Project Management 22, 183–191.
Thomke, S.H. 1997. The role of flexibility in the development of new products: An empirical study. Research Policy 26:1, 105–119.
Thompson, J. 1967. Organisations in Action: Social Science Bases in Administrative Theory. McGraw-Hill, New York.
Trist, E. & Bamforth, K.W. 1951. Some consequences of the Longwall method of coal getting. Human Relations 4:1, 3–33.
Turner, J.R. 2004. Editorial. Five necessary conditions for project success. International Journal of Project Management 22, 349–350.
Verganti, R. 1999. Planned flexibility: Linking anticipation and reaction in product development projects. Journal of Product Innovation Management 16:4, 363–376.
Volberda, H.W. 1997. Building flexible organizations for fast-moving markets. LongRange Planning 30:2, 169–183.
Williams, T 1997. Empowerment vs risk management? International Journal of Project Management 15:4, 219-222.
Williams, T. 2000. Safety regulation changes during projects: the use of system dynamics to quantify the effects of change. International Journal of Project Management 18:1, 23–31.
Williams, T. 2003. Assessing Extension of Time delays on major projectsInternational Journal of Project Management 21:1, 19-26.
Yin, R.K. 2003. Case Study Research: Design and Methods. Sage, Thousand Oaks, CA/London/Dehli.

Part 2.

Part 2 - Appendices
Paper 1. Olsson, N.O.E. 2006. Management of flexibility in projects. International Journal of
Project Management 24:1, 66–74.
Paper 2. Magnussen, O.M. & Olsson, N.O.E. 2006. Comparative analysis of cost estimates of
major public investment projects. International Journal of Project Management 24:4, 281–288.
Paper 3. Olsson, N.O.E. & Magnussen, O.M. 2006. ‘Projects trapped in their freedom:
Flexibility aspects of front-end quality assurance of major projects’. Paper submitted to Project Management Journal.
Paper 4. Olsson, N.O.E. 2004. ‘Flexibility in Engineering Projects: Blessing or Curse?’ Paper
presented at the NORDNET 2004 International PM Conference, 29.9. – 1.10. 2004, Helsinki, Finland.
Paper 5. Olsson, N.O.E. 2006. ‘Impact analysis of railway projects in a flexibility perspective’.
Transport Reviews 26:5, 557-569.
Paper 6. Henriksen, B., Olsson, N. & Seim, A. 2006. ‘Adjustments, effectiveness and
efficiency in Norwegian hospital construction projects’. Proceedings CIB W70 Trondheim International Symposium. Changing User Demands on Buildings, 12–14 June 2006, Trondheim, Norway.
Paper 7. Olsson, N.O.E. & Samset, K. 2006. ‘Front-End Management, Flexibility and Project
Success’. Paper presented at PMI Conference, 17-19 July 2006, Montreal, Canada.
Paper 8. Olsson, N.O.E. 2006.‘Flexibility and Front-End Management; Key to Project Success
and failure’ Paper accepted for presentation by ProMAC International Conference on Project Management, 27-29 September 2006, Sydney, Australia.
Paper 1.
Olsson, N.O.E. 2006. Management of flexibility in projects. International Journal of Project Management 24:1, 66–74

Management of flexibility in projects
Nils O.E. Olsson *
The Norwegian University of Science and Technology, Norway Department of Civil and Transport Engineering, Høgskoleringen 7A,
N-7491 Trondheim, Norway
Received 2 November 2004; received in revised form 1 March 2005; accepted 28 June 2005
Abstract
Project managers are challenged to keep their projects focused and at the same time support their organisation�s need to adapt tochanges and uncertainty in the business environment. The purpose of this paper is to analyse the dynamics related to project flex-ibility, both from a theoretical and an empirical perspective. To ensure the efficiency of the project organisations, flexibility is usuallynot desired in the late phases of projects. The projects in this study often applied flexibility even during these phases, usually basedon initiatives from project owners or users. It is paradoxical that while flexibility was frequently needed in the studied projects, it wasrarely prepared for. As a consequence, structured approaches to project flexibility management are called for. The study indicatesthat the opinion on project flexibility held by the involved stakeholders can to a large extent be explained by their incentives relatedto the projects. The empirical results in this paper are based on a multi-case study covering 18 projects.� 2005 Elsevier Ltd and IPMA. All rights reserved.
Keywords: Managing projects; Implementing strategy; Flexibility; Adjustments
1. Introduction
In a changing world, there is a desire of project own-ers and users to have ‘‘room to manoeuvre’’; to be ableto adjust projects as they gain knowledge about theirneeds and changes in the project context, as discussedby Midler [1]. A number of scholars, including Kreiner[2], argue that flexibility is necessary to face the changesand uncertainty in the business environment. On theother hand, a wide range of studies (including [3–5])indicates that a clear project definition is a critical suc-cess factor for projects.
This paper analyses flexibility in large investmentsprojects. To begin with, project flexibility is discussedfrom a theoretical standpoint. In order to illustrate dif-ferent aspects of flexibility, 18 Norwegian projects havebeen analysed. The projects include a wide range of dif-
ferent industries, project sizes and types. Most of theprojects are publicly financed.
2. Perspectives on project flexibility
Flexibility management is not a new concept. Sager[6] found several examples of flexibility as one approachto prepare for the effects of uncertainty in planning.However, Sager also notes that flexibility is an impor-tant term often used by planners but rarely scrutinisedtheoretically. Kreiner [2] points out that the traditionalfocus on stability in project management becomes chal-lenged under uncertainty. This creates ‘‘drifting environ-ments’’. Kreiner�s drifting environments are notnecessarily caused by actual changes in the project con-text. They may also occur when project stakeholders geta better understanding of their actual needs and im-proved ability to express the needs. Flexibility can alsobe seen as a response to environmental uncertainty, as
0263-7863/$30.00 � 2005 Elsevier Ltd and IPMA. All rights reserved.
doi:10.1016/j.ijproman.2005.06.010
* Tel.: +47 73 59 46 01; fax +47 73 59 70 21.E-mail address: [email protected].
www.elsevier.com/locate/ijproman
International Journal of Project Management 24 (2006) 66–74
INTERNATIONAL JOURNAL OF
PROJECTMANAGEMENT

discussed by Karlsen [7]. Real options are an establishedperspective on project flexibility with roots in financialoptions theory; see for example Brennan and Trigeorgis[8]. In this perspective, the value of flexibility can bequantified in monetary terms. Amram and Kulatilaka[9] compare flexibility to owning an option – the right,but not the obligation to take an action in the future.According to the real-options paradigm, uncertaintycan increase the value of a project, as long as flexibilityis preserved and resources are not irreversiblycommitted.
Mandelbaum and Buzacott [10] uses the number ofthe remaining alternatives after a decision has been ta-ken as a measure of flexibility. In a similar manner asMidler [2], Eikeland [11] discusses project flexibility re-lated to ‘‘room for manoeuvring’’. The ‘‘room formanoeuvring’’ is made up by future yet undeterminedinternal decisions, and may also be seen as a measure-ment of internal uncertainty of the project. Accordingto Eikeland [11], a decision is within the room formanoeuvring if it does not violate the consequences ofprevious decisions. Terms like adaptability and robust-ness are often used when discussing issues related towhat this paper calls flexibility. Flexibility may also bedescribed as a way of making irreversible decision morereversible or postponing irreversible decisions until moreinformation is available. Husby et al. [12] defines projectflexibility as ‘‘the capability to adjust the project to pro-spective consequences of uncertain circumstances withinthe context of the project’’. The use of the term flexibil-ity in this paper is based on this definition.
2.1. Flexibility in the process and the product
The capability of projects to adjust can be related tohow the projects are executed and to how adaptable thefinal product will be, once it has been produced. Flexi-bility in the decision process is based on an approachwhere decisions and commitments in the projects aremade sequentially over episodes.
Three strategies to achieve flexibility in the decisionprocess may be identified. Firstly, a ‘‘late locking’’ ofproject concepts, specifications and organisation canbe used, as discussed by Miller and Lessard [5]. Millerand Lessard refer to late locking as an exploring, itera-tive front-end process. They claim that late locking isas key success criteria for large engineering projects.Once the projects are locked, they are executed in a tra-ditional way. The second strategy is related to a contin-uous step-by-step locking of the project by a successivecommitment to projects. This may be achieved by theuse of decision gates models, as shown by Eskerodand Ostergren [13] or by incremental decision making,as advocated by Genus [14]. The third strategy is foundin contingency planning, where a set of base plans is de-fined, but also a set of alternative plans that can be acti-
vated if needed. According to Chapman and Ward [15],contingency plans reflect anticipated potential depar-tures from the defined plans for a project. Contingencyplans are alternative plans that can be used if the base-line plans cannot be executed. Chapman and Wardpoint out that it is important to restrict the developmentof detailed contingency plans in order to reduce plan-ning cost.
Flexibility in the product is achieved when the finalproduct of the project is prepared for alternative use.As described by Brand [16] and Blakkstad [17], this ap-proach to flexibility is used in building construction.According to Arge and Landstad [18], a commonly usedclassification of building adaptability was made in Swe-den during the 1960s and 1970s. Based on this classifica-tion, generality is the ability of the building to meetshifting demands without physical changes. In this ter-minology, flexibility is the possibility for constructionand technical changes with minimum cost and distur-bance. Finally, elasticity means the potential for increas-ing or reducing the size of the building. In this paper, allthese three characteristics are summarised as flexibilityin the product.
2.2. Interaction between flexibility in the decision process
and the product
Flexibility in the decision process and the productmay interact for any given project. The real options ap-proach treats flexibility in the decision process and theproduct relatively similar. However, from a projectmanagement point of view, it makes a major differenceif the flexibility lies in the product or the decision pro-cess. Different strategies for project flexibility manage-ment are identified in Fig. 1, each characterised byhigh or low flexibility in the process and product,respectively.
As indicated in Fig. 1, the situation with low flexibilityin both the product and the decision process assumes sta-ble environments. This does not necessarily mean thatthe environments are actually stable. It only means thatthe project concept and the management of the project
Flexibility in the process
Fle
xibi
lity
in th
e pr
oduc
t
Low
High
High
Low
Late orcontinouslocking,Contingencyplanning
Stableenvironment
FlowRobustconcept
Fig. 1. Flexibility in the product and the decision process.
N.O.E. Olsson / International Journal of Project Management 24 (2006) 66–74 67

are not designed for adjustments within the project timeframe. A strategy characterised by high flexibility in theproduct and low in the process is termed ‘‘robust con-cept’’ in Fig. 1. This project situation assumes that thedecision process related to the project can be fairlystraight forward because the result of the project is pre-pared for alternative use. An argument against such astrategy is that flexibility in the product can be costly.It is also challenging to target the flexibility to where itis needed. Flexibility in the product that turns out tonot be used, can be seen as a waste of resources.
A basic principle in the situation with low flexibilityin the product, and high flexibility in the process is thatfinal decisions can be postponed (for example, the freez-ing of specifications) in order to gain as much knowl-edge as possible. A low flexibility in the product isdesirable when flexibility in the product is costly. A po-tential drawback of this strategy is that it might causefrustration among project stakeholders, due to a lackof commitment and perceived uncertainty.
Fig. 1 also includes the situation with high flexibilityis both the product and the process. ‘‘Flow’’ has beenused as a description of this situation. It contains manyof the aspects related to the other two strategies withhigh flexibility in either the process or the product.
2.3. Modularity
Flexibility can be related to the degree of modularityin the projects. Modularity refers to the possibility to di-vide the project into more or less independent sub-units.According to Miller and Lessard [5], modularity can en-able projects to cope with uncertainty because individualcomponents do not have a critical role. Major ‘‘one-piece’’ projects such as bridges and tunnels have a lowlevel of modularity, based on the ‘‘we do not build halfa bridge’’-approach. Projects that are assumed to havehigher levels of modularity include IT-system develop-ment and road improvement projects.
2.4. Flexibility in different project phases
This paper makes a distinction between three differ-ent project phases: front-end, planning and execution.The front-end phase covers the activities prior to the fi-nal decision to go ahead with the project. Even thoughplanning is a part of the front-end phase, most projectsalso have a planning phase for more detailed prepara-tion after the project has been decided upon. Projectsare implemented in an execution phase, which endswhen the project outputs are realised.
Most authors agree on the value of flexibility in thefront-end phase of projects while flexibility is commonlyseen as undesirable in the execution phases of projects.Lundin and Soderholm [19] describe how a projectmoves from relative openness in the beginning of the
project, to relative closeness in the execution phase. Inthe execution phase, the predetermined action is sup-posed to be carried out according to the plans, in a‘‘planned isolation’’. The concept of project flexibilityin the execution phase disturbs this planned isolation.In a similar way, Mahmoud-Jouini et al. [20] character-ises project management by the speed of three projectphases: preparation, freezing and implementation.
Many authors on project management, includingMorris and Hough [4], warn against changes in projectsonce specifications have been established. Miller andLessard [5] point out the irreversibility of large engineer-ing projects and the importance of bold commitmentfrom key stakeholders. They argue against flexibilityonce the front-end phase is over.
2.5. Efficiency and effectiveness
Efficiency is linked to the immediate outcome of aproject. It is a question of doing things right and pro-ducing project outputs in terms of the agreed scope,quality, cost and time. It is an internal measure. Effec-tiveness, on the other hand, is linked to the longer-termeffects of the project, or to do the right things. Effective-ness is an external measure. Eikeland [11] relates effec-tiveness to how the results of a project contribute tovalue added for owners and users. According to Samset[21], effectiveness concerns the extent to which the pro-ject�s tactical objective, or the goal, can be achieved.
The literature review [22] found that flexibility is pri-marily an approach to improve effectiveness of projectsrather than efficiency. Major drawbacks of flexibility arerelated to reductions in efficiency. Flexibility was seen asa threat to delivering the project on time and withinbudget. In order to maximise efficiency, projects needsto be clearly defined in the front-end phase and executedaccording to the plans. Adjustments or remaining deci-sions shall be minimised. Flexibility promoters empha-sise the possibility for increased effectiveness. A projectwith sufficient flexibility to utilise opportunities to in-crease the value for owners and users might in the endprove to be more effective, as discussed in [2] and quan-tified by the real options approach [8].
2.6. Project stakeholders
Key stakeholders who are directly linked to most pro-jects are; project owners, users, project management andcontractors. Olsson [22] analysed the expected opinionon project flexibility. That project owners and usersare likely to be more positive towards changes aimedat increased effectiveness. Stakeholders those mainresponsibility lie on the cost side of the project, suchas project management and contractors, are less likelyto embrace changes. According to Kreiner [2], the pro-ject owner is made the guardian of relevance and there-
68 N.O.E. Olsson / International Journal of Project Management 24 (2006) 66–74

by the project�s effectiveness. The project manager ismade the guardian of efficiency.
2.7. Changes and extensions
Changes and extensions are a source of major dis-agreements between different actors in projects. PMI[23] defines the management of both changes and exten-sions as scope change control.
Many authors, including [1,4,24], have pointed toscope changes as a key driver to cost overruns of pro-jects. From a project management and contractor per-spective, scope changes are generally seen asundesirables, even though contractors can see changesas a possibility to improve the profit from the projects[25]. Scope changes are key issues when discussing flex-ibility, but project flexibility as discussed in this paper isa wider concept than scope change management.
A typical scope change is proposed because the usersor project owner wants to increase the effectiveness ofthe project. As shown by Ibbs et al. [26] using benefit-to-cost ratio, the reduction in efficiency might be com-pensated by a higher increase in effectiveness, dependingon the timing and type of change. Two sources of con-flicts related to scope changes can be identified. Conflictsmay arise regarding: (a) the quantification of the in-crease in effectiveness and reduction in efficiency; (b)the responsibility for the reduction in efficiency.
Based on a study of 448 projects, Dvir and Lechler[27] showed that changes in both plans and goals of pro-jects typically reduce both the efficiency and customersatisfaction of engineering projects.
Many textbooks on project management, including[3,28], include explanations and illustrations that illus-trate that the scope change cost is typically low in thefront-end phase of projects, and getting higher and high-er as time goes by. This increase in scope change costover time is widely accepted as a rule of thumb, and isa major challenge to project flexibility. Once a projecthas been decided upon and the planning or executionhas begun, changes are likely to reduce the efficiencyof the project, as shown by Hanna et al. [30]. However,Poppendieck and Poppendieck [29] argue that the al-most exponential increase in scope change cost over timein a project is not always applicable to IT-projects.Some types of changes are less damaging to efficiencythan others. An alternative approach to project flexibil-ity is to identify areas or types of changes that are lesschallenging to accommodate in projects than otherchanges. Thus, at least two different strategies can bechosen to manage scope changes: (a) to avoid them or(b) to reduce the negative impact from changes that docome. A change requires that something already hasbeen decided. One key purpose of the flexibility strate-gies identified in Fig. 1 is to achieve flexibility withoutcreating scope changes in the project. In this way, scope
changes might be avoided or reduced by the use of latelocking of projects and by not taking decisions until onereally have to. Scope changes may also be avoided bythe use of flexibility in the product.
2.8. Contracting and incentives
Incentives for different project stakeholders arestrongly related to the contracting structure of a projectand other financial obligations. A common tool forachieving flexibility in projects is the use of option basedcontracts, which enables a continuous locking of theprojects. Mahmoud-Jouini et al. [20] discusses timemanagement in projects. Their discussion also includesflexibility aspects. They point out that a key factor increating win–win situations between the stakeholdersin Engineering, Procurement and Construction (EPS)contracts lies in flexibility of contracts and the implicitrelations that are created by the contracts. Garel andMidler [31] studied contractual structures that enablefront-loading and coherent incentives for manufacturersand suppliers in the automotive industry. Their analysisis based on a game theory approach, where dealing withflexibility can be a win–win or zero-sum game betweenthe stakeholders. In co-development of automotiveparts, the supplier gets no additional payments for lateidentification of need for modifications in the designphase. The supplier therefore has strong incentives toprovide engineering expertise to work closely with themanufacturer in order to understand the needs and theproduction process [31].
The users are a group of stakeholders that often donot have direct contracts related to the projects. Theirincentives are therefore less connected to the direct costof the project, and more often connected to the qualityand usability of the final result.
3. Empirical indications
A study was carried out to investigate to what extentthe results from the theoretical review of project flexibil-ity corresponds with observations from a number ofprojects. This section of the paper describes the datamaterial, discusses the applied methodology and pre-sents the results from the study.
3.1. Data collection and analysis
A qualitative case study research approach has beenused in this study. In the terminology of Yin [32], theanalysis is a multi-case study. The study is based on ananalysis of 18 Norwegian projects. Information relatedto the projects has been obtained from two main sources:third party evaluation reports and personal experiencefrom consulting and applied research engagements. The
N.O.E. Olsson / International Journal of Project Management 24 (2006) 66–74 69

third party reports usually have a high professional stan-dard and analyse the projects in depth as well as in abroad perspective. Of the projects, 15 are described pri-marily based on third part reports. For three of the pro-jects, information is based on both third part reports andpersonal experience. Case study reports have been estab-lished for the projects that have personal experience as adata source. The analysed projects have been carried outbetween 1986 and 2003, the majority between 1995 and2000. A wide variety of projects have purposely beenanalysed in order to capture different aspects of projectflexibility. The type of projects in the study is shown inTable 1.
On the basis of the descriptive information, an assess-ment was made of the project flexibility characteristics.
Due to the size of the projects, the analysis is based onthe strategies of the projects and major events.
To analyse the information related to the projects,codified data were entered into a database. Table 2shows the project attributes that were used in the study.The table also shows the alternatives and scales thatwere used. Some of the information relates to the projectitself, such as industry and project budget. The analysisincludes information related to approaches to flexibilitythat were planned for or observed, including scopechanges, delays and postponed decisions. In addition,the observed opinion on flexibility for different stake-holders is included in the analysis. In order to validatethe data, informants with experience from analysed pro-jects have reviewed the relative scores of the projects.
4. Results
In the following, the results from the study are pre-sented. The results are divided into different sections,in order to address key research questions.
4.1. What type of flexibility has been used and when?
Changes and extensions are commonly used, and areobserved in 11 projects, covering most types of projects.A late locking was applied in 4 projects. One defenceproject used a contract with predefined options as wayof achieving a continuous locking of the project. Contin-gency planning was the main flexibility approach in oneproject. In only one project, a college building construc-tion, flexibility was not applied.
Flexibility was used in all phases of the projects, butparticularly during the planning phase. Three projectshad need for flexibility in the execution phase, two ofthem being hospitals. One of these projects had exten-sive changes and extensions, followed by large cost over-runs. The other project applied a late locking of thespecification related to key medical equipment. Latelocking was related only to a limited part of the project.This project was delivered on time and budget. The thirdproject with flexibility need in the execution was a reno-vation of an old public building. Requirements relatedto preservation of cultural and historical features ofthe building proved to be challenging to specify beforethe work was started. These results are summarised inTable 3.
4.2. Stakeholder perspective on project flexibility
As shown in Table 4, the project owners and the usersappear to look favourably upon flexibility. In only oneproject, the users were negative to flexibility. This wasa school building project, where the users (primarilyteachers and parents) wanted predictability in the
Table 1The studied projects by industry and size of project
Number
Type of project (n = 18)
Offshore 1Hospitals 3Transportation infrastructure 7Defence 3Public buildings 4
Project size (n = 17)
<15 mill euros (100 mill NOK) 315–60 mill euros (100–500 mill NOK) 860–250 mill euros (500–2000 mill NOK) 3>250 mill euros (2.000 mill NOK) 3
Table 2The parameters used in the analysis
Dimension Scale/alternatives
Type of project/industry Transportation infrastructure;public buildings; hospitals;defence; offshore (oil and gas)
Size of project Actual cost for finished projects,latest known budget for on-goingprojects
Specific type of flexibility Change; extension; contingencyplanning; late locking;continuous locking, none
Project phase Front-end; planning; execution;none
Flexibility in the product Low; medium; highFlexibility in the decisionprocess (planned and actual)
Low; medium; high
Degree of modularity Low; medium; highStakeholder who initiatedthe use of flexibility
Users; owner; projectmanagement; contractor; none;N/A
Stakeholder attitudeto flexibility(project owner, user,project managementand contractor)
Negative; neutral; positive; N/A
70 N.O.E. Olsson / International Journal of Project Management 24 (2006) 66–74

front-end phase regarding the time and scope of theschool building refurbishing. The study indicates amixed opinion on flexibility among project manage-ment. Contractors were overall negative (even thoughthe contractor�s opinion is based on fewer observationsthan the other categories).
Regarding project management, there are indicationsthat they look favourably upon flexibility use in thefront-end or planning phase, but not in the executionphase. Furthermore, project management appear to bepositive to flexibility in projects where they and the pro-ject owner are found in the same or closely relatedorganisations. This was usually the case in transporta-tion infrastructure projects. When the project manage-ment and the project owner are in differentorganisations, project management had a negative viewon flexibility. This was typically the case for publicbuilding construction.
Table 4 also illustrates that the stakeholders thatmost often initiate the use of flexibility, are also mostpositive to flexibility. Among the studied projects, itwas mostly project owners and users who initiated theuse of flexibility in the projects.
4.3. Modularity, flexibility in the decision process and in
the product
As seen in Table 5, the majority of the projectsplanned for low flexibility in the decision process. Table
5 also shows that many projects had a high actual flex-ibility in the decision process. A high degree of plannedflexibility in the decision process indicates that the pro-jects were prepared for an iterative decision, planning orexecution process. Projects that clearly illustrated thatflexibility, or related terms, in the product was intendedare rated as having a high flexibility in the product. Pro-jects that are registered as having a low flexibility had nostated or observed intentions of flexibility. Medium flex-ibility indicates that the projects planned for flexibility insome phases or some areas, but not as a key issue.
A technical analysis of how different changes have af-fected the flexibility in the product was beyond the scopeof the present analysis. In Table 5, flexibility in the prod-uct is therefore not divided into planned and actual, buttreated as a characteristic of each project as a whole.
Most projects had a low modularity, particularlypublic buildings. To achieve a high modularity, twotransportation infrastructure projects (one road con-struction and one railway line) were divided into sec-tions, which could be built fairly independently. Thetwo defence projects with a high modularity were relatedto system development and acquisition, were the systemswere possible to divide into modules, both from a tech-nical and a contractual point of view. Finally, oneschool building project had a high modularity becausethe project actually consisted of upgrading of a fairlylarge number of school buildings. Even if the plans foreach school had consequences for the other schoolsand the decision process addressed the whole upgradingplan, each school building could be managed as a sub-project (and some would argue that this ‘‘project’’ wasa ‘‘programme’’, and each school was a project).
An attempt was made to investigate the relation be-tween modularity and flexibility in the decision process.If a project was highly modular, flexibility in the decision
Table 3Flexibility use by type and project phase
Number
Type of flexibility applied in the projects (n = 18)
Late locking 5Continuous locking 1Extensions 4Changes 6Contingency planning 1None 1
Project phase for main use of flexibility (n = 18)
Front-end 4Planning 10Execution 3None 1
Table 4Different perspectives on project flexibility hold by project stakeholders
Project owner Users Project management Contractor None
Stakeholder opinion on flexibility Positive 12 9 6 0 0Neutral 4 3 5 3 0Negative 0 1 7 4 0n = 16 13 18 7 0
Stakeholder who initiated the use of flexibility(n = 16)
8 5 2 0 1
Table 5The analysed attributes related to flexibility in the projects
Low Medium High N total
Flexibility in the product 8 8 2 18Flexibility in the process, planned 13 2 3 18Flexibility in the process, actual 2 6 10 18Modularity 8 5 5 18
N.O.E. Olsson / International Journal of Project Management 24 (2006) 66–74 71

process was likely to be utilised. A high modularity ap-pears also to be the major way of achieving a highplanned flexibility in the process, which frequently re-sulted in a high actual flexibility in the process. The com-bination of high modularity and low actual flexibility inthe decision process was not observed.
5. Discussion
In the following, the results are discussed in relationto the theoretical overview of project flexibility. At theend of the section, some implications for project man-agement practice are listed.
5.1. Different stakeholders have different perspectives to
project flexibility
It was expected that project owners and users weremore likely to be interested in flexibility than the projectmanagement and contractors. On average across the 18projects, this study supports this assumption.
In the studied projects, users were generally positiveto flexibility. However, one case showed that the usersdid not uniformly favour flexibility in the front-endphase, because they wanted to know what they could ex-pect from the project. Fig. 2 gives a summary of the ob-served opinion on flexibility seen in a time perspective.Owners of the studied projects appear to be clear in theirsupport of flexibility, and contractors in their dislike.
Most authors agree on the value of flexibility in thefront-end phase of projects, and on the undesired effectsof flexibility in the execution phase. In this study, projectmanagement appeared to be the only type of stake-holder that showed the expected shift from being posi-tive to flexibility in the front-end, less positive in theplanning phase and finally negative in the executionphase. As a possible explanation, project managementmight be the stakeholder that is most likely to see the ef-fects of flexibility, both on the benefit and cost side.
Fig. 2 indicates that users and project managementhave different needs for flexibility in different project
phases. As long as the funding model for a projectmeans that the users have nothing to lose from demand-ing changes and extensions, they have incentive to pushfor scope changes. This is typically, though not always,the case in the Norwegian public sector from which themajority of the projects in the study come.
Kreiner [2] termed project management ‘‘the guard-ian of efficiency’’. Results from the studied cases showthat this guardian role is depending on the organisa-tional connection to the project owner. In cases wherethe project management was found in the same organi-sation as the owner, project management was morelikely to be positive to flexibility, compared to caseswhere project management had a weaker organisationalconnection to the project owner and the guardian rolecould be exercised more freely.
The opinion on flexibility held by the different stake-holders can also be explained based on the incentivesfaced by the stakeholders. Flexibility has a value forthe stakeholders that benefit from changes and latelocking of projects. In this study, the stakeholders thathave their incentives related to achieving the project�spurpose were the advocates of flexibility. Stakeholdersthat have their incentives related to delivering the pro-ject on time and within budget saw flexibility as athreat. Flexibility usually means that the contractorshave to spend resources to adopt. This disturbs the effi-ciency of their organisations and typically causes wait-ing or rework. Note that this study has been carriedout on rather strategic level. Garel and Midler [31]show that the contractors, depending on the contractstructure, may have incentives to embrace changes be-cause this gives them room to ask for additionalpayments.
5.2. If flexibility is prepared for, it will be used. It will
often be used even if it is not prepared for
In the analysed projects, changes and extensions werefound in more than half of the projects, in spite of thewell-known risk for cost overruns in such occasions.This may be characterised as a traditional type of flexi-bility. The structured approaches to project flexibilitythat are discussed in the literature are also found, butin a minority of the projects.
It appears to be a strong desire to use flexibility in thestudied projects. This was particularly the case when itwas prepared for, but also when it was not. Most pro-jects did not plan for flexibility in the decision process,but used flexible approaches anyway. All projects witha high planned flexibility in the decision process alsohad a high actual flexibility in the decision process. Flex-ibility in the product could only to a limited extent resultin less use of flexibility in the decision process. This indi-cates that if there is a possibility for flexibility in a pro-ject, it will probably be utilised.
Front-end Planning Execution
Owner + + +
Users +/- + +
Projectmanagement + +/- -
Contractor N/A - -
+ = Positive opinion on project flexibility- = Negative opinion
+/- = Mixed opinion
Fig. 2. Stakeholders� opinion on flexibility in different project phases.
72 N.O.E. Olsson / International Journal of Project Management 24 (2006) 66–74

5.3. Implications for project management practice
In the studied projects, flexibility was often managedin a traditional way. It appears to be a potential formore frequent use of structured approaches to manage-ment of project flexibility.
Flexibility in the front-end phase is the least contro-versial part of project flexibility. The study indicates thatafter the front-end phase, flexibility in well-defined partsof the projects can be managed without major reduc-tions in efficiency. To manage flexibility, it is beneficialto identify critical part of projects where flexibility isneeded. It is likely that these parts of the projects aresimilar to the critical parts that are identified in projectuncertainty analyses. In the next step, appropriate strat-egies for project flexibility of the identified areas are cho-sen. In this way, project flexibility can enable utilisationof the often neglected opportunity side of uncertaintymanagement.
Note that flexibility as discussed here is not seen as analternative to strategic management, but as a means tohelp realising a strategy. This is in accordance with Sam-set [28] who argues that successful projects are charac-terised by a distinct strategy in combination withsufficient tactical flexibility.
The observed tendency for users to advocate flexibil-ity in late phases of projects indicates that projects witha high user influence should have a higher need for anactive approach to project flexibility than other projects.Even though it is not a recommended situation, projectsthat for political or other reasons are pushed to a prema-ture go-ahead decision also need an active approach toproject flexibility.
6. Conclusions
This study indicates a paradoxical approach to pro-ject flexibility: flexibility is frequently used but rarelyprepared for. As Engwall [33] and Jugdev [34] pointout, current project management knowledge is a prac-titioner-driven theory focusing on supporting advicesto the project manager. In this perspective, efficiencyis the prime focus and flexibility should de minimisedonce the front-end phase is over.
Projects in this study often had need to be flexibleeven after this point, usually based on initiatives formthe project owners or users. Current project manage-ment theory then proposes a stronger emphasis onthe front-end phase in order to prepare the projectsas well as possible. Given the volume of flexibilityuse in the studied projects and generally changing envi-ronments of projects, it seems unrealistic to strive foran elimination of project flexibility. Flexibility appearsto be so commonly used that it must be addressedseriously.
The opinion on flexibility held by the differentstakeholders appears to be related to the incentivesfaced by the stakeholders. In general, flexibility has avalue for the stakeholders that benefit from changesand late locking of projects, and it is a cost for thosewho have to adopt. In this study, the project ownersand users had their incentives related to achievingthe project�s purpose and they were often the advo-cates of flexibility. The stakeholders that have toadapt to different forms of flexibility were primarilythe project management and contractors. Changes,late locking and other forms of flexibility usually dis-turb the efficiency of their organisations and typicallycause waiting or rework. Project management hadtheir incentives either primarily related to the projectpurpose, or the delivering the project according tospecification, on time and within budget. The opinionon flexibility among project management appears tovary accordingly. Incentives related to project purposeincreases the likeliness that flexibility is look favour-ably upon. Stakeholder incentives related to directproject outcome increases the likeliness that flexibilityis looked negatively upon.
Interesting areas for further research include studiesof actual use of different approaches for flexibility in dif-ferent types of projects. In addition, analysis of whichtypes of scope changes that can be managed without se-vere reductions in project efficiency is proposed.
Acknowledgements
The author thanks two anonymous referees fortheir valuable comments on a previous version of thispaper.
References
[1] Midler C. ‘‘Projectification’’ of the firm: the renault case. Scand JManage 1995;11(4):363–75.
[2] Kreiner K. In search of relevance: project management in driftingenvironments. Scand J Manage 1995;11(4):335–46.
[3] Hall P. Great planning disasters. London: Weidenfeld andNicolson; 1980.
[4] Morris PWG, Hough GH. The anatomy of major projects. Astudy of the reality of project management. Chichester, UK: Wi-ley; 1991.
[5] Miller R, Lessard D. The strategic management of largeengineering projects, shaping institutions, risks and gover-nance. USA: Massachusetts Institute of Technology; 2000.
[6] Sager T. Notions of flexibility in planning-related literature,Nordic Institute for Studies in Urban and Regional Planning,Publication No. 1990:5; 1990.
[7] Karlsen JT. Mestring av omgivelsesusikkerhet. Ph.D. thesis, TheNorwegian University of Science and Technology; 1998.
[8] Brennan ML, Trigeorgis L. Project flexibility, agency, andcompetition: new developments in the theory and application ofreal options. Oxford: Oxford University Press; 2000.
N.O.E. Olsson / International Journal of Project Management 24 (2006) 66–74 73

[9] Amram M, Kulatilaka N. Real options: managing strategicinvestment in an uncertain world. Financial managementassociation survey and synthesis series. Boston: Harvard Busi-ness School Press; 1999.
[10] Mandelbaum M, Buzacott J. Flexibility in decision making. Eur JOper Res 1990;44:17–27.
[11] Eikeland PT. Teoretisk analyse av byggeprosesser, Samspill ibyggeprosessen, prosjektnr. 10602 (Title in English: ‘‘Theoreticalanalaysis of the construction process’’); 2001.
[12] Husby O, Kilde HS, Klakegg OJ, Torp O, Berntsen SR, SamsetK. 1999. Usikkerhet som gevinst. Styring av usikkerhet iprosjekter: mulighet, risiko, beslutning, handling, The NorwegianCentre for Project Management at the Norwegian University ofScience and Technology, Trondheim, Norway. Report No.NTNU 99006 (Title in English: ‘‘Uncertainty as benefit. Manag-ing project uncertainty: possibility, risk, decision, action’’); 1999.
[13] Eskerod P, Ostergren K. Why do companies standardize projectswork? Proj Manage 2000;6(1).
[14] Genus A. Managing large-scale technology and inter-organisa-tional relations: the case of the channel tunnel. Res Policy1997;26(2):169–89.
[15] Chapman C, Ward S. Project risk management. processes,techniques and insights. West Sussex, UK: Wiley; 1997.
[16] Brand S. How buildings learn, what happens after they�rebuilt? NewYork: VikingPenguin, PenguinBooksUSAInc.; 1994.
[17] Blakstad SH. A strategic approach to adaptability in officebuildings. Ph.D. thesis, The Norwegian University of Science andTechnology; 2001.
[18] Agre K, Landstad K. Generalitet, fleksibilitet og elastisitet ibygninger. Prinsipper og egenskaper som gir tilpasningsdyktigekontorbygninger, Prosjektrapport 336, Norges byggforskningsin-stitutt, Oslo(Title in English: ‘‘Generality, flexibility and elasticityin buildings. Principles for adaptability of office buildings’’); 2002.
[19] Lundin RA, Soderholm A. A theory of the temporary organiza-tion. Scand J Manage 1995;11(4):437–55.
[20] Mahmoud-Jouini SB, Midler C, Garel G. Time-to-market vs.time-to-delivery managing speed in engineering, procurement andconstruction projects. Int J Proj Manage 2004;22(5):359–67.
[21] Samset K. Project evaluation: making investments suc-ceed. Trondheim: Tapir Academic Press; 2003.
[22] Olsson NOE. Flexibility in engineering projects: blessing or curse?Paper presented at the NORDNET 2004. In: International PMconference, Helsinki, Finland, 29.9.–1.10 2004.
[23] PMI, A guide to the project management body of knowledge,PMBOK Guide 2000 edition. Newton Square, PA: ProjectManagement Institute; 2000.
[24] Love PED, Irani Z, Edwards DJ. Learning to reduce rework inprojects: analysis of firm�s organizational learning and qualitypractices. Proj Manage J 2003;34(3):13–25.
[25] Christensen DS, Gordon JA. Does a rubber baseline guaranteecost overruns on defence acquisition contracts? Proj Manage J1998;29(3):43–51.
[26] Ibbs CW, Wong CK, Kwak YH. Project change managementsystems. J Manage Eng 2001;17(3):159–65.
[27] Dvir D, Lechler T. Plans are nothing, changing plans iseverything: the impact of changes on project success. Res Policy2004;33:1–15.
[28] Samset K. Prosjektvurdering i tidligfasen: Fokus pa konseptet.Tapir Akademisk Forlag, Trondheim (Title in English: ‘‘Projectevaluation in the front-end phase: focus on the concept’’); 2000.
[29] Poppendieck M, Poppendieck T. Lean software development: anagile toolkit. Reading, MA: Addison-Wesley; 2003.
[30] Hanna AS, Calimic R, Peterson PA, Nordheim EV. Quantitativedefinition of projects impacted by change orders. J Constr EngManage 2001;128(1):57–64.
[31] Garel G, Midler C. Front-loading problem-solving in co-development: managing the contractual, organisational andcognitive dimensions. Int J Automob Technol Manage2001;1(2/3):236–50.
[32] Yin RK. Case study research: design and methods. 3rd ed. Lon-don: Sage Publications; 2003.
[33] Engwall M. No project is an island: linking projects to history andcontext. Res Policy 2003;32:789–808.
[34] Jugdev K. Through the looking glass: examining theory develop-ment in project management with the resource-based view lens.Proj Manage J 2004;35(5):15–25.
74 N.O.E. Olsson / International Journal of Project Management 24 (2006) 66–74

Paper 2.
Magnussen, O.M. & Olsson, N.O.E. 2006. Comparative analysis of cost estimates of major public investment projects. International Journal of Project Management 24:4, 281–288.

Comparative analysis of cost estimates of major publicinvestment projects
Ole M. Magnussen a,*, Nils O.E. Olsson a,b,1
a The Norwegian University of Science and Technology, Department of Civil and Transport Engineering, N-7491 Trondheim, Norwayb SINTEF Technology and Society, N-7465 Trondheim, Norway
Received 24 May 2005; received in revised form 11 October 2005; accepted 11 November 2005
Abstract
This paper reports findings from a study of cost estimates of 31 major public investment projects in Norway. It is aimed at analysingthe development of cost estimates before the decision to execute the projects and in what way the scheme of mandatory quality assuranceinfluences this process. Two important results are highlighted and discussed: The differences in the proposed cost estimates appear tohave decreased systematically since the introduction of the quality assurance and the project owners rely to a large extent directly uponthe cost estimates from the quality assurance when the decision to execute the project is taken.� 2005 Elsevier Ltd and IPMA. All rights reserved.
Keywords: Managing projects; Design and appraisal
1. Introduction
To meet the demand for better management and controlof major public investment projects, an arrangement forexternal Quality-at-entry analyses of all public investmentsin Norway with an expected budget larger than NOK 500million (�EUR 60 million)2 has been established. This so-called Quality-at-entry Regime became operative from year2000 and was the result of an initiative from the NorwegianMinistry of Finance. The main factors leading to the estab-lishment of a mandatory external assessment of publicmulti-million projects were the poor performance of manysuch projects especially in terms of cost. The introduction
of the Regime was, among other factors, an attempt toavoid and control cost overruns [1].
This paper is the first attempt to analyse the develop-ment of cost estimates in the early stages of the qualityassured projects. Very few of the projects have yet reachedcompletion, which explains why studies of actual costs donot constitute a part of the present research. The objectiveis to develop an understanding of the current Quality-at-entry Regime and to point out its relevance and impacton the cost estimation process and how it could contributeto more realistic budgets. The paper is thus concerned withimpacts of quality assurance concerning the efficiency issue,i.e., focus on the cost criterion. In a broader perspective,however, it also concerns the more substantial issues ofproject viability and long term effects since the end resultof inaccurate estimates could be that nonviable projectsare prioritized (a central perspective in [2,3] for example).
2. The scope of the paper
The scope of this paper is to consider the relevance andsignificance of the current Quality-at-entry Regime on costestimation in major public projects. Our preconception is
0263-7863/$30.00 � 2005 Elsevier Ltd and IPMA. All rights reserved.
doi:10.1016/j.ijproman.2005.11.011
* Corresponding author. Tel.: +47 73 59 52 07/46 40; fax: +47 73 59 7021.
E-mail address: [email protected] (O.M. Magnussen).1 Tel.: +47 977 13 628/47 73 59 46 40; fax: +47 73 59 70 21.2 EUR 1 = NOK 8. Expected budget > NOK 500 million is the general
rule. This general rule does not prevent the possibility for a Quality-at-entry analysis carried out on projects with expected budget less than NOK500 million.
www.elsevier.com/locate/ijproman
International Journal of Project Management 24 (2006) 281–288
INTERNATIONAL JOURNAL OF
PROJECTMANAGEMENT

that studying the development of the cost estimates fromdifferent actors through the stage of quality assurancecan tell us something about how this affects the decision.In studying the divergence we are in effect studying theextent to which estimates may be biased.
3. Cost overrun and its causes
Nijkamp and Ubbels [4] point out the need for betterinsight into cost estimation. It is because cost estimationplay a major role in the decision-making process of thegovernment.
Studies of major projects show that cost overruns arenot uncommon. Morris and Hough [5] suggest that costoverruns in large projects are typically between 40% and200%. The study of large transportation infrastructure pro-jects reported in Flyvbjerg et al. [6] shows that 9 out of 10projects fall victim to cost escalation, actual costs are onaverage 28% higher than estimated costs, and it appearsto be a global phenomenon observed over a long periodof time. Kolltveit and Gronhaug [7] include an exampleof costs in Norwegian large-scale projects varying from6% saving to 160% overrun.3
The causes of the observed tendency seem to be con-nected to factors not only hard to predict but also difficultto manage. Morris and Hough [5] point out that overrunsare caused by circumstances outside the project�s area ofcontrol. According to them, many projects overrun becauseof factors like price escalation, government action, strikesand so on. A big issue is then related to the ability to pre-dict such factors and their potential impact.
Flyvbjerg et al. [8] attempt to explain the causes of costoverrun in projects. They found that cost escalation wasstrongly dependent on the length of the implementationphase. Delays and long implementation phases translateinto risks of substantial cost escalations. They also observethat projects grow larger over time, and for some projecttypes, larger projects have larger percentage cost escalation.That bigger projects having a larger risk of cost escalationthan smaller ones (for all project types) is not supported bytheir data, but they emphasize that the risk of substantialcost escalation is high for all project sizes and types. Sincethe same percentage cost escalation would typically causemore problems in terms of budgetary, fiscal, administrativeand political dilemmas in a large project than in a smallone, they conclude that an increase in project size translatesinto a need for improved planning processes.
Nijkamp and Ubbels [4] found on the basis of theirstudy that the influence of inflation was clearly large inthe projects they studied. Because of the length of planningand construction, price rises played a major role. Whatthey call incompleteness of the estimations, the practicethat some elements of costs are omitted or not included,
are also important. They argue that project changes alsois an important cause of underestimation, which lead to aconclusion that the estimates in their sample were ratherreliable.
The cost estimation process, which can be viewed as afactor more closely related to the project organization,has also received some attention among authors in this fieldof research. Flyvbjerg et al. [6] deliver an interesting contri-bution on this issue. First of all, it must be noted that theirstudy focuses on a certain category of projects, so-calledtransportation infrastructure projects, and secondly, thedata comes from projects all around the world from a per-iod of time stretching from 1910 to 1998. They study thedifferences between actual and estimated cost and arguethat ‘‘the cost estimates used to decide whether such projects
should be built are highly and systematically misleading.’’ [6,p. 279] This underestimation could, according to Flyvbjerget al. [6], best be explained by strategic misrepresentation.Olsson et al. [9] suggest that ‘‘strategic budgeting’’ is a com-monly used technique in major public projects. This tech-nique includes using a budget that only visualises part ofthe total cost in order to initiate the project, and thenexploit the fundamental logic that a project, when definedand planned, is less likely to be reversed or terminated.Nijkamp and Ubbels [4] discuss a similar explanation wheninvestigating the reliability of cost estimates in infrastruc-ture projects.4 They state that at the time of the decisionto build:
‘‘One may safely assume that the costs of the project at that
stage are as low as possible to ensure that the project will be
executed. This suggests that the cost may be somewhat
underestimated at the beginning of a project.’’ [4, p. 3]
They further state that there is some space for negotia-tions in the cost estimation process since estimators tendto take the demands of governmental institutions intoaccount.
Nijkamp and Ubbels [4] conclude that, since largechanges is a major cause of cost escalation, it is necessaryto increase the importance of the first planning phases. Inrecent years more authors seem to agree on the importanceof a better design process in order to create more successfulprojects [10–12].
4. Ensuring Quality-at-entry
The initiative to investigate the need for better manage-ment and control of major public investment projects inNorway was based on the understanding that a numberof large projects did not accomplish according to therequirements vital for the decision to execute the project.Additionally, large cost overruns and change of scope dur-ing implementation were observed. After a closer study of
3 The example included only 5 projects and was used to illustrate thechallenges of the construction and building industry.
4 It must be noted that the study in Nijkamp and Ubbels [4] includes atotal of only 8 projects and that they describe this cause of underestima-tion as less important.
282 O.M. Magnussen, N.O.E. Olsson / International Journal of Project Management 24 (2006) 281–288

11 projects, where 6 of them showed cost overrun, a gov-ernment committee concluded that failures in the initialphases of the projects were the main cause of the cost esca-lation during implementation [1].
4.1. Description of the current Quality-at-entry Regime
The Quality-at-entry Regime is in this paper a label forthe formal requirements that public investment projectsmust meet before the preparation of proposal for the Par-liament. The basic exercise connected to the presentRegime is mandatory quality assurance and uncertaintyanalysis of the project carried out by external consultantson behalf of the responsible ministry, the so-called qualityassurance 2 (QA2). In this paper the term ‘‘quality assur-ance’’ is used shorthand instead of referring to the ‘‘exer-cise under the present Quality-at-entry Regime’’. The aimof the Regime so far has been to evaluate the quality ofthe foundation for the chosen alternative. The more partic-ular focus regarding revision of cost estimates and identify-ing major risks must be seen in light of the specific goal forthe quality assurance. It is a tool for evaluating the qualityof information and for providing new information on thebasis of which the decision makers can judge the project.
4.2. The quality assurance – when and how
The quality assurance, which typically takes place at thepre-planning stage, and the cost estimates provide anopportunity to track how three main stakeholders; the pro-ject organisation, the external consultant, and the Parlia-ment,5 view the project cost at this stage.
An illustration of the process and how the cost estimatesrelate to a certain stakeholder and point in time is given inFig. 1.
The duration between the steps in the process variesfrom project to project, and it is not uncommon to observea time-span from several months up to a year between 1and 3 in the figure. A suitable question here is: As some ele-ments of the project may change in the course of its devel-opment, how is it possible to compare the cost estimatesconnected to the different points in the process? The ques-tion is a fundamental one, and a brief explanation is appro-priate. First of all, the formal requirement is that theproject does not proceed beyond the pre-planning stageuntil it is approved by the Parliament. Secondly, the qualityassurance does not take place until updated project docu-mentation exists, and the cost estimate is a central part ofthis information. This pertains to the situation between 1and 2 in the figure. Information concerning the expectedbudget of a project is crucial when deciding to go aheadwith the project. In this way it is safe to assume that therecommended budget from the external consultant andthe approved budget fundamentally refer to the same pro-ject, unless it would be explicitly stated. This pertains to thesituation between 2 and 3 in the figure.
The cost estimate connected to 1 in the figure stems fromthe uncertainty analysis conducted by the project organisa-tion. This is an expression of the project organisation�s viewconcerning the project cost. The consultants deliver anexternal evaluation of the project and give their recommen-dation of a budget for the project based on an independentuncertainty analysis (2 in the figure). The end of the pre-planning stage is the parliamentary approval of a budgetand permission to implement the project (3 in the figure).
4.3. The estimates and how they are prepared
The prevailing method among project organisations andconsultants in the projects studied here is the stochasticuncertainty analysis regarding the project cost. The estima-
5 Formally, the decision to go ahead with the project and the financinglies in the hands of the Parliament. In practice, however, the budgetdecided by the Parliament corresponds with that proposed by theresponsible ministry (the project owner).
Fig. 1. The estimates prepared in the QA-process – the arrow represents phases in the project life cycle.
O.M. Magnussen, N.O.E. Olsson / International Journal of Project Management 24 (2006) 281–288 283

tion technique is the so-called judgmental forecasting andthe forecast serves the purpose of predicting the future fac-tors that may influence project costs. A statistical modelwhere it is assumed that the uncertainty is normally distrib-uted is used [3]. The proposed budget for the project, pre-pared by the project organisation before the qualityassurance takes place, pertains in most cases to the 50%subjective probability, i.e., there is a 50% expected proba-bility that the project will be completed within this cost.The recommendation from the external consultant consistsof the expected cost and total budget, most often based on50% and 85% probability, respectively. The uncertaintyanalyses performed by the project organisation and theexternal consultant represent the basis when the projectowner decides upon the estimates that are to be presentedin the national budget or in a separate project-specific Gov-ernment white paper. Formally, the Parliament reacheswhatever conclusion on the matter it would find appropri-ate. In practice, however, the estimates presented in thenational budget or the project-specific white papers aresanctioned by Parliament without changes.
4.4. The new approach to project costs
Olsson et al. [9] describe the situation that, as a conse-quence of the Quality-at-entry Regime, a more sophisti-cated overview of the project cost is presented. Theexternal consultant recommends a total budget that isexpected to cover the consequences of the identified uncer-tainties. The reserves are, however, not expected to be used,and specific rules for the management of reserves have beenestablished. The budget allocated to the executing govern-ment agency is the basic budget plus expected extra costs(based on 50% subjective probability), which also was thetypical standard before the Quality-at-entry Regime wasestablished. Use of the reserves must be approved by theresponsible ministry. This implies that there is a bindingupper financial level for the projects and a new controlscheme for budget compliance. Olsson et al. [9] point outthe need for management of project reserves for portfoliosof projects since a project owner often deal with manymajor projects at the same time. If this succeeds, it isexpected that the new approach will reduce the need foradditional funding and result in increased reliability ofthe cost estimate. Attempts to summarise some of theeffects of quality assurance suggest that:
‘‘The involved ministries, being projects owners, have
expressed a general satisfaction with the analyses, since they
give a ‘‘second opinion’’ of the projects. They also feel that
they get a better basis to prepare the decision proposal forthe Norwegian parliament.’’ [9, p. 38]
The new approach also raises some concerns. Olssonet al. [9] refer to the situation that some projects maybecome more expensive as a result of the allocated reserves.Planned use of the reserves could occur, and this couldenhance the observed tendency that projects at least fill
their allocated budget. Some claim that costs might soarbecause of the situation that the external consultants haveno responsibility for the actual budget. They recommend abudget, but have no role in the execution of the project.This could lead to a situation where the external consul-tants systematically exaggerate the recommended totalbudget in order to reduce the risk that cost overruns couldoccur. On the other hand, if cost elements are omitted inthe initial estimates, quality assurance is designed to inter-vene, and in this respect have a rather direct impact on thecost estimation process.
5. Data collection and refinement
The quality assurance report, which is a compilation ofthe results from quality assurance, represents the funda-mental data source in our research. From the qualityassurance report it is possible to obtain cost estimates pre-pared by the project organisation/the executing govern-ment agency and of course the recommendation from theexternal consultant. The project budget approved by theParliament is obtainable from the national budget or pro-ject-specific Government white paper presented by theresponsible ministry. When it was deemed to be necessaryto ensure the quality of the data, projects were contactedseparately via e-mail.
To compare the cost estimates presented at the specificpoints in the process (cf. Fig. 1), cost data had to be cor-rected for inflation. This basically means that cost data ineach individual project are brought to the same price levelas the approved budget, either with the aid of specific meth-ods for the single project, or by appropriate indices fordiscounting.
Before a presentation of the important findings fromanalyses done on the existing material, it should be notedthat the aim of this paper is not to present a final evalua-tion of the effects of the quality assurance scheme, sincemost of the projects are still in the planning stages or inthe early stages of implementation.
6. Presentation of important findings
The collected data are stored in a research database.Proper storage and the possibilities for fast retrieval oflarge quantities of data seem to be the most importantcharacteristics of a database [13]. Fifty-two projects havebeen through the quality assurance procedure between2000 and 2004. On the basis of these projects a sample of31 projects representing a broad range of project typeswas established (cf. Table 1).
6.1. The external consultant�s recommended budget – project
reserves
In this section a closer look at the recommendation ofthe external consultant is presented. A special interest isconnected to the size of the reserve. The allocation of pro-
284 O.M. Magnussen, N.O.E. Olsson / International Journal of Project Management 24 (2006) 281–288

ject reserves in major public projects is a fundamentallynew approach in Norway [9].
Table 2 describes the size of the project reserves recom-mended by the external consultant with respect to projecttype (upper part of the table) and size (lower part of thetable). Since the reserves are not expected to be used, theyare here presented as a mark-up above the 50% probabilitybudget.
The fundamental information provided by Table 2 isthat the size of the typical project reserve lies in the areabetween 8% and 11%. The average reserve in this sampleis a 9% mark-up. An analysis based on a categorisationwith respect to project type (transportation infrastructure,building, defence procurement, and IT) shows that the sub-category mean values deviate little from the overall mean.
Table 2 also shows that there is no obvious connectionbetween the project size and the size of the reserveexpressed in per cent. The three sub-categories includingprojects from NOK 300–750 million, NOK 750–1500 mil-lion and projects larger than NOK 1500 million all showmean values close to the overall mean value. One mightexpect that it would be more difficult to predict all aspectsthat could have an impact on costs in large projects. Theintention with the allocated reserve is to mitigate projectrisks that can not be fully predicted [14]. Seen in relationto the literature referred to above, where it was stated thatmajor projects often suffer from cost overrun, one mightexpect that large projects would call for larger reserves.This is contradicted by the unsubstantiated notion that in
major projects there exist more alternative courses ofaction, i.e., there are more opportunities to influence costs.
The results here are nevertheless not surprising. The rec-ommended reserves basically reflect the uncertainty in theperformed calculations. As described above, the size ofthe reserve in most cases is the difference between the50% and the 85% subjective probability, which roughlyequals one standard deviation. The robustness of the resultfrom the uncertainty analysis depends on the ability to pre-dict possible factors and their influence on project cost.Table 2 indicates that there is a rather typical reserve per-centage, independent of project size or type. Building andinformation technology projects display a somewhat highermean reserve and standard deviation than transportationinfrastructure and defence procurement projects, but theexisting material does not allow us to draw sharp conclu-sions whether there is a pattern here. The results from ana-lyzing projects categorized by size, show even smallerdifferences between the sub-categories.
One of the major concerns has been the possibility thatactual costs will be higher with the new approach, wherereserves are allocated, compared to the old procedure.The point here is that it is questionable to assume anythingabout actual costs as long as the projects have not beencompleted yet, and adequate measures to obtain more real-istic budgets have been established. Many authors empha-size the importance of better planning in the early stages oflarge projects to increase the potential for project successand reduce the occurrence of cost overrun.
6.2. The difference between the proposed estimate from the
project organisation and the recommendation from the
external consultant
The main issue here is related to the significance of qual-ity assurance on the cost estimation process. This is thebackground for the attention paid to the comparisonbetween the initial estimate and the revised estimate.
When comparing the estimates, fixed prices are used,and the numbers describe the ‘‘same project’’, which meansthat it has been controlled whether fundamental elementsof the project have been changed between the proposedestimate and the recommended estimate (cf. the discussionabove concerning that a project could be subject to modi-fications over time). This is an important prerequisite,because when the cost focus and control aspect is dominat-ing, one must not only consider the different answers, i.e.,the numbers from the uncertainty analyses. One must alsoask whether they are answers to the same question.
To present an aggregate view of the data, the differenceshave been calculated in percent and divided into categoriesbased on the size of the difference.
Table 3 shows that the recommendation from the exter-nal consultant is lower or equal to the projects� proposal in8 out of 31 projects (26%). For the majority of the projects(74%), the external consultants recommend higher budgetlimits, in some cases up to 15% or more. On average the
Table 2Size of the recommended reserves (after project type and size)
Type of project Numberof projects
Mean reservepercentage(sub-category)
Standard deviationpercentage(sub-category)
Transportationinfrastructure
12 8 3
Building 9 11 6Defenceprocurement
8 7 4
Informationtechnology
2 11 5
Total 31 9 4
Size of project(million NOK)
300–750 13 8 4750–1500 12 9 41500– 6 10 6
Total 31 9 4
Table 1The sample
Type of project Number of projects Per cent
Transportation infrastructure 12 39Building 9 29Defence procurement 8 26Information technology 2 6
Total 31 100
O.M. Magnussen, N.O.E. Olsson / International Journal of Project Management 24 (2006) 281–288 285

external consultants recommended 5% higher budgets.Some might argue that the observed differences are rathersmall. Why should we deal with differences that in an ana-lytical sense equal the uncertainty in the results? First of all,even a 5% difference in projects of this scale could,expressed in money, be substantial. Secondly, it must bekept in mind that studies of initial estimates and actualcosts that show deviations up to several hundred percentcould include large distortions for instance with respectto inflationary backgrounds. This study is different, obvi-ously because initial estimates from two different actorsrather than initial estimates and actual costs are compared,but also because price escalations, project changes andother factors are not an issue or have been accountedfor. The compared figures are indeed ‘‘answers to the samequestion from two different actors’’. With this in mind, onequestion immediately arises: What could explain theobserved result? An exact explanation must be left openat this stage, but a closer look into the sources can be abasis for discussion. It could be that the external consul-tants apply a broader view and include more elementsassumed to have an impact on the cost of the project.The project organisation�s major concern is the implemen-tation of the project according to specific requirements.The external consultants must also consider the potentialimpact of factors that to the project organisation mayappear to be of a more unpredictable and unmanageablecharacter. These could be factors connected to the market,financing, and changes imposed by the government.
It must also be recognized that the prevailing methodsto calculate the estimates rely on subjective assessments.As described by Olsson et al. [9], in some cases differentestimates have been a source of discussion between the pro-ject organisation and the external consultant. In caseswhere there are fundamentally different subjective viewsconcerning central uncertainty elements, this will clearlybe manifested in the results. Still, this does not explainwhy the external consultants present a higher estimate inso many cases.
Some may claim that this indicates an exaggeration ofthe estimates from the external consultants. Since they donot have any responsibility for the actual budget compli-ance and it is claimed that nobody wants the label that theyunderestimate costs, this could lead to a situation where
extra costs are included just to be sure. It would be hardto establish data that could describe this issue, because thisfundamentally is an assumption about the intentions ofactors.6 It must otherwise not be forgotten that the founda-tion for the external consultants� recommendations areexplained in the reports from the quality assurance exer-cises. In this way the underlying premises for the recom-mended estimate can be verified.
The major question in this paper is the Quality-at-entryRegime�s influence on the initial decisions connected to theprojects. Does it lead to different practices and other meth-ods? In this perspective an analysis that maintains the timedimension is presented.
The difference between the proposal from the project andthe revised estimate is calculated in percent. A plot of thedifferences for all the projects in the sample against themonth of presented report and the result is shown in Fig. 2.
Visual inspection indicates that the largest differencesoccurred when the quality assurance scheme was new,and interestingly, no revised estimate substantially lowerthan the initial estimate is observed before late 2002.Another indication from Fig. 2 is the clear decrease inthe differences from the first quarter of 2002.
What explanations are there? A number of possible fac-tors spring to mind. One possibility might be that the focuson more realistic cost frames launched by the Regime hasled to an increase in the use of relevant methods by the pro-ject organisations to identify the uncertainties in the earlystages of the projects. Observations made during the collec-tion of the data suggest that more equal estimates coin-cided with a more consistent use of the most commonlyused terms. At the same time, the Ministry of Transportand Communications, which accounts for a large numberof the projects in the sample (cf. Table 1), specified howthe results from the quality assurance of projects in theirarea of responsibility should be employed. This indicatesthat a change in practice and learning has taken place.
The literature referred to above suggest that so-called‘‘strategic budgeting’’ could be a cause of underestimationin public projects. This is based on the assumption thatprojects that appear to be inexpensive have a greaterchance of being prioritized. It is easy to predict that theQuality-at-entry Regime could have a rather direct impacton strategic budgeting; assuming that such practice actu-ally has taken place. It is, however, impossible to answerthis question on the basis of this study. The differencesobserved here could just as much be explained by overesti-mation from the external consultant as underestimationfrom the project organisation, and a possible interpretationof the development towards more equal estimates couldalso be that an adjustment to the demands of governmentalinstitutions has taken place, either by external consultants,project organisations, or both.
Table 3External consultant�s revised estimate compared to the project organisa-tion�s initial estimate
Revised estimate is (compared toproposed estimate)
Number ofprojects
Per cent
Lower 5–10% lower 3 9.7 265% lower than or equal to 5 16.1
Higher Up to 5% higher 7 22.6 745–10% higher 8 25.810–15% higher 5 16.1More than 15% higher 3 9.7
Total 31 100.0
6 Flyvbjerg et al. [6, p. 289], face the same problem when trying toanswer the question whether project forecasts are intentionally biased.
286 O.M. Magnussen, N.O.E. Olsson / International Journal of Project Management 24 (2006) 281–288

6.3. The difference between the recommended budget fromthe external consultant and the final budget decided by the
Parliament
The formal approval and resolution on budget limits foreach single project is dealt with by the Parliament. In prac-tice, however, the Parliament accepts the Government�sproposal without changes. The project presented to theParliament is prepared by the responsible ministry basedon the information from the subordinate agency responsi-ble for the day-to-day activities in the project.
Table 4 shows that in 58% of the projects, the upperfinancial level decided for the project equals the total bud-get recommended by the external consultant. This meansthat in most cases, the project owners directly use the rec-ommendation from the external consultant when submit-ting the proposal. At least there is a strong tendencytoward this as reflected by the table. The table also clarifiesthat the recommendation can be disregarded. It must alsobe noted that in many cases new estimates are preparedfrom the project as a response to quality assurance. To givea closer illustration of how the recommendation is appliedby the project owner, i.e., the direct response to the resultsfrom quality assurance, descriptions from some of the pro-jects included in the sample are presented:
‘‘External quality assurance has taken place which gives an
estimate of NOK 738 million with 50% probability for budget
compliance, and NOK 788 Million with 85% probability.Based on the quality assurance the Norwegian Public Roads
Administration has reviewed the project and presented arevised estimate of NOK 718 million.’’ ([15, p. 117], author�stranslation)
Another example describes a case where the differencewas rather small:
‘‘The quality assurance shows recommended budget numbers
marginally lower than those proposed by the Norwegian Pub-
lic Roads Administration. In the Ministry of Transport andCommunications� opinion the quality assurance confirms that
the Norwegian Public Roads Administration�s estimate is on
an appropriate level.’’ ([16, p. 4], author�s translation)
The examples illustrate how the external consultant�srecommendation is used by the project owner to verifythe numbers proposed by the project organisation and thatthe quality assurance could result in updated cost estima-tions from the project organisation. It is shown that thereis no rule of thumb whether the final decision is based uponthe project organisation�s or the external consultant�s esti-mate. Each project is considered on an individual basisby the responsible ministry and the project organisation.
An explanation to the observations made here can beconnected to some of the results from Olsson et al. [9]where it was concluded that the project owner particularlyfinds the quality assurance useful. The study reported inOlsson et al. [9] was based on fewer projects and did notinclude analyses of the cost estimates. The study in thispaper is a quantitative one, but it supports the results inOlsson et al. [9] because it clearly states that the externalrecommendation, at least concerning the project cost, isfollowed up by the project owner. An important conclu-sion, drawn from the analysis presented here, is that theinvolved ministries, being the project owners, actively usethe information provided by the external analysis in thepreparation of the project. The cost estimates are a centralpart of this information, and the fact that the project own-ers in so many cases directly build upon the calculationsfrom the external consultants, is a strong indication con-cerning the significance of this contribution.
-15.0 %
-10.0 %
-5.0 %
0.0 %
5.0 %
10.0 %
15.0 %
20.0 %
25.0 %
30.0 %
Jan-99 Jan-00 Jan-01 Jan-02 Jan-03 Jan-04
Month of presented report
Dif
fere
nce
(%
) fr
om
th
e p
rop
ose
des
tim
ate
Fig. 2. The difference between the project�s proposal and the revised estimate from the external consultant.
Table 4The approved budget is often based on the recommendation from theexternal consultant
Sanctioned budget Number of projects Per cent
Lower than the revised estimate 7 23Equal to the revised estimate 18 58Higher than the revised estimate 6 19
Total 31 100
O.M. Magnussen, N.O.E. Olsson / International Journal of Project Management 24 (2006) 281–288 287

7. Concluding discussion
The performed analyses show that the recommendedproject reserves on average are 9%. It is furthermoreobserved that no matter the scale of the project, the sizeof the reserves measured in per cent appear to be rathertypical, which is rather surprising, when it is kept in mindthat existing studies report overrun up to several hundredper cent.
A discussion concerning the potential cost effect of thestochastic cost estimation and budgeting in public projectsis conducted. It is concluded that a final evaluation of thecost development must be done when the actual costs areavailable. Compliance to the approved budget rely to alarge extent on the management of the reserves and it isalso argued that it is questionable to judge projects notyet completed against past experience, which indicates thatprojects use at least their allocated budget, when adequatemeasures to reach realistic estimates at an early stage havebeen established.
It is possible to conclude from the present study thatthere is a difference between the numbers proposed bythe project organisation and the revised estimates fromthe external consultant. This is based on the observationthat the revised estimates were higher than the initial esti-mate in 74% of the projects studied here. This is a ratherstrong indication since the estimates compared here areanswers to the same question. The study also shows thatthe differences were higher in the early stages of theRegime. The observed differences have decreased systemat-ically since quality assurance was initiated in 2000. Somesuggestions based on empirical observations, the prevailingmethods and different views upon the analysed project arediscussed, but the most important result here is therevealed tendency in the existing material.
The study further shows that for many projects in thesample, the parliamentary decision directly rely on the esti-mates provided by the external consultant. This supportsthe claim that the involved ministries, i.e., the project own-ers, benefit from the external assessment of the project, andactively use the provided information when preparing thedecision proposal for the Parliament.
The observations here lead to the identification of impor-tant issues that need to be addressed in further research. Arethe differences in the estimates systematic and statisticallysignificant? Are the differences observed when the schemewas new cost underestimation by the projects or overesti-mation by the consultants? Does the systematic decrease
imply a learning curve, or does it indicate an adjustmentto external demands? A closer look at the historical recordswill help to cast light on these issues.
This paper is a report from the first analyses of cost esti-mates in major public investment projects after the initia-tion of the Quality-at-entry Regime. Some experienceshave been gained, but there are many questions that needto be answered to get a picture of the effect of this initiativenot only in terms of reduction of cost overrun but alsolong-term feasibility and profitability of public projects.
References
[1] Berg P, Andersen K, Ostby LE, Lilleby S, Styrvold S, Holand K, et al.Styring av statlige investeringer. Sluttrapport fra styringsgruppen.Oslo, Norway: The Ministry of Finance; 1999 [Title in English(author�s translation): Management of Governmental Investments].
[2] Flyvbjerg B, Bruzelius N, Rothengatter W. Megaprojects and risk:ananatomy of ambition. Cambridge: Cambridge University Press; 2003.
[3] Odeck J. Cost overruns in road construction – what are their sizes anddeterminants. Transport Policy 2004;11(1):43–53.
[4] Nijkamp P, Ubbels B. How reliable are estimates of infrastructurecosts? A comparative analysis. In: Serie research memoranda.Research memorandum 1998–29. Amsterdam: Vrije Universiteit;1998.
[5] Morris PWG, Hough GH. The anatomy of major projects: a study ofthe reality of project management. Chichester, UK: Wiley; 1991.
[6] Flyvbjerg B, Holm MS, Buhl S. Underestimating costs in publicworks projects. Error or lie? J Am Plann Assoc 2002;68(3):279–95.
[7] Kolltveit BJ, Gronhaug K. What is an effective project organisation?Project Manage 2002;8(1):40–7.
[8] Flyvbjerg B, Holm MKS, Buhl SL. What causes cost overrun intransportation infrastructure projects? Transport Rev 2004;24(1).
[9] Olsson N, Austeng K, Samset K, Ladre O. Ensuring quality-at-entry:challenges in front-end management of projects. Project Perspect2004;27(1):36–40.
[10] Miller R, Lessard DR. The strategic management of large engineeringprojects: shaping institutions, risks and governance. Cambridge,Mass.: MIT Press; 2000.
[11] Samset, K., Prosjektvurdering i tidligfasen. Fokus pa konseptet.Trondheim, Norway: Tapir Akademisk Forlag; 2001 [Title in English(author�s translation): Front-end Project Management].
[12] Kolltveit BJ, Gronhaug K. The importance of the early phase: thecase of construction and building projects. Int J Project Manage2004;22(7):545–51.
[13] Andersen V. Microsoft office access 2003: the complete reference.California, USA: McGrav Hill/Osborne; 2003.
[14] Project Management Institute. A guide to the project managementbody of knowledge (PMBOK Guide) 2000 Edition, Norwegiantranslation, Newton Square, Pennsylvania, USA: Project Manage-ment Institute; 2000.
[15] The Ministry of Transport and Communications, Governmentproposal to Parliament number 1 (2001–2002). Oslo, Norway; 2001.
[16] The Ministry of Transport and Communications, Governmentproposal to Parliament number 38 (2002–2003). Oslo, Norway; 2003.
288 O.M. Magnussen, N.O.E. Olsson / International Journal of Project Management 24 (2006) 281–288
Paper 3.
Olsson, N.O.E. & Magnussen, O.M. 2006. ‘Projects trapped in their freedom: Flexibility aspects of front-end quality assurance of major projects’. Paper submitted to Project Management Journal.
(This version includes minor proof reading adjustments, compared to the submitted version.)

Projects trapped in their freedom: Flexibility aspects on front-end quality assurance of major projects
Nils O.E. Olsson a b *, Ole M. Magnussen a
a The Norwegian University of Science and Technology, Department of Civil and Transport Engineering, Høgskoleringen 7A N-7491 Trondheim, Norway, Telephone +47 73594640, Fax +47 73597021
b SINTEF Technology and Society, 7465 Trondheim, Norway, Telephone +47 97713628, Fax +47 73597021
* Corresponding author. [email protected]
2
Projects trapped in their freedom: Flexibility aspects on front-end quality assurance of major projects
Abstract
This paper aims to use experiences from major governmental investment projects to illustrate aspects on project flexibility, both from a theoretical and empirical point of view. Projects appear to be trapped in their freedom. The potential freedom of projects as temporary organizations is so large that major management emphasis is directed towards reducing and controlling flexibility. The empirical study is partly prospective, in the meaning that the projects and parameters to be studied were selected prior to conducting the analyses. Based on empirical data, flexibility in different project phases is quantified for illustration.
Keywords: Projects, Front-end, Flexibility, Quality-at entry

3
1. Introduction The purpose of this paper is to use experiences from the Norwegian Quality-at-entry regime for major governmental investments to illustrate aspects on project flexibility. The paper is also an attempt to contribute with empirical results on some project management issues related to project flexibility.
To begin with, theoretical traditions in project management are discussed. Some models for illustration of project flexibility are also presented. Secondly, the nature of the Norwegian quality-at-entry regime for major governmental investments is analyzed in general. Project flexibility is chosen as a perspective to illustrate some aspects of the regime in more depth. An attempt is also made to quantify one aspect in the general project flexibility models based on empirical data. Finally, the results are discussed and some models for explanation of the results are proposed.
1.1 Project management Söderlund (2004) discusses two main theoretical traditions in project management research. The first tradition has its intellectual roots in engineering science. Planning techniques and methods of project management, including the recent emphasis on uncertainty quantification and risk management, have been the major focus. This is in accordance with Packendorff (1995), who claims that a number of writers trace the intellectual roots of project management research and knowledge to various types of planning techniques, such as PERT and CPM. The other tradition has its intellectual roots in the social sciences and is especially interested in the organizational and behavioral aspects of projects. Söderlund (2004) terms these “the engineering tradition” and “the social science tradition”, respectively. In a similar distinction between project management traditions, Crawford and Pollack (2004) uses the terms “hard” and “soft”. Crawford and Pollack (2004) relates “hard” project management approaches to objectivist, scientific approaches and has parallels to Söderlund’s (2004) engineering tradition. The “soft” project management approaches of Crawford and Pollack (2004) stem from an interpretivist and constructivist schools of thought, and share similarities with Söderlund’s (2004) social science tradition.
According to Engwall (2003), research on project management has been dominated by what he calls “the lonely project” perspective, with little emphasis on project context and organizational history. Engwall (2003) and Jugdev (2004) point out that current project management knowledge is a practitioner-driven theory focusing on supporting advices to the project manager, apparently referring to the engineering tradition.
The discussion on project management traditions can also be related to how “project management” is defined. One way is looking at it, is to consider the engineering tradition as a hard core of project management. This is not necessarily because it is the core competence in project management. The reason is that no or few other disciplines claim that this is also “their” area of competence, with the possible exception of operations research. As the perspective shift to the social science tradition, influence from other disciplines becomes stronger. In such a perspective, the social science tradition draws on experiences and research approaches from areas such as organizational science, planning, decision analysis and political science, all applied in a project context.
1.2 Flexibility and project management Flexibility is one approach to prepare projects for the effects of uncertainty. Terms like adaptability and robustness are often used when discussing issues related to what this paper calls flexibility. Flexibility may also be described as a way of making irreversible decision more reversible or postponing irreversible decisions until more information is available.
The uncertainty of a decision in a project can be described by the gap between the information needed to make a decision that is entirely consistent with the actual outcome, and the information available at the moment of decision making (Galbraith, 2001). Mikkelsen and Riis (2003) identify a fundamental dilemma in project planning: that the importance of decisions is at the highest at the same time as the available information is at its lowest. A common way of reducing this dilemma is to increase the available knowledge about the project. One key idea in project

4
flexibility is to postpone irreversible decisions in the front-end phase of projects, in addition to (or instead of) gathering more information.
The engineering tradition of project management, referred to by Söderlund (2004) and Crawford and Pollack (2004)is focused on stability for the project, particularly in the later phases of a project. The social science tradition has a greater understanding of the needs for flexibility and adaptability. Kreiner (1995) points out that the traditional focus on stability becomes challenged under uncertainty, which creates what he calls “drifting environments”. The drifting environments (or “context” as termed by Engwall, 2003) of a project are not necessarily caused by actual changes in the project context, but may also be the result when the project owners and users stakeholders get a better understanding of, and ability to express, their actual needs. According to Samset (2003), contextual uncertainty is associated with the surroundings or context of a project and usually considered beyond the scope and authority of the project. The project has limited possibility to influence the contextual uncertainty. Olsson (2004) indicate that flexibility is generally not desirable when the unit of analysis is limited to the project itself, but it can be rational when a wider context is included in the analysis.
Projects are traditionally seen as temporary organizations designed for unique tasks (Cleland, 2004), often in contrast to the mass producing core activities of organizations. At present, projects are initiated to solve tasks of almost any type (Engwall, 2003) to the extent that the Western society seems to be heading towards a “projectified society” (Lundin and Söderholm, 1998, Gareis, 2004). A major benefit of organizing a task as a project is the freedom to create an organization more or less from scratch. While uniqueness is the competitive advantage of projects as a way of organizing, changes and lack of predictability is commonly seen as the major pitfalls of projects. Successful projects are characterized by control and governance (Hall, 1980; Morris and Hough, 1991; Miller and Lessard, 2000).
Permanent organizations, on the other hand, are traditionally seen as repetitive tasks, suitable for permanent organizations (Taylor, 1912). Focus in manufacturing and supply chains has moved from mass production, via lean to agile production, (Asbjørnslett, 2003). As a part of this development, the emphasis on flexibility has increased, to the extent that “changeability” is listed on equal terms as effectiveness and efficiency when establishing performance measurement systems (Andersen et al., 1998).
We noted that the engineering tradition of project management is focused on stability while many other management sciences are focused on adaptability. Kaderfors (1995) illustrates a similar paradox regarding projects. Projects are on the one hand viewed as situation-specific organizations, designed to solve a specific and unique task. However, several project intensive industries, including construction, have a reputation of being conservative and slow to change. This indicates that the potential flexibility in projects is controlled by conformity in the working process, creating a conservative tradition.
So far, flexibility has been discussed in general terms. The empirical part of this paper includes an analysis of observed flexibility aspects of projects. Flexibility is used in a rather wide meaning in this paper, based on the definition of Husby et al. (1999): flexibility is "the capability to adjust the project to prospective consequences of uncertain circumstances within the context of the project". In such a wide definition, flexibility includes preparations to manage both internal and contextual uncertainty, such as: scope change management, iterative decision process, adjustments related to uncertain funding in general and budget reserves in particular.
1.3 Visualizing project flexibility Most authors agree on the value of flexibility in the front-end phase of projects while flexibility is commonly seen as undesirable in the execution phases of projects. Lundin and Söderholm (1998) describe how a project moves from relative openness in the beginning of the project, to relative closeness in the execution phase. In the execution phase the predetermined action is supposed to be carried out according to the plans, in a “planned isolation”. The concept of project flexibility in the execution phase disturbs this planned isolation. Midler (1995) describes a management strategy for modern concurrent engineering projects. First prevent early commitment while at the same time trying to gather as much information as possible on the project. In the second phase, the project is locked as precisely as possible. Finally, at the end of the project, speed is given maximum priority in order to solve the remaining technical obstacles. In a similar way, Mahmoud-Jouini et al. (2004) characterizes project management by the speed of three

5
project phases: preparation, freezing and implementation. A similar approach is discussed by Verganti (1999). He identifies two different approaches to achieve flexibility in product development projects; anticipating and reaction. Anticipating means that future requirements should be analyzed as early as possible in the front-end phase. In contrast, reaction is the capability to rapidly introduce changes late in the process. Using the untraditional reaction approach, choices are delayed until later in the projects, when information is available. Verganti (1999) shows that a combination of the two approaches typically are used by successful companies.
Many textbooks on project management present illustrations concerning the relative size of project attributes during different project phases. The attributes include uncertainty, significance of decisions, freedom to maneuver, accumulated cost and available information. Figure 1 is an attempt to summarize the different models. Even though the shapes of the curves vary between different authors, the models all have in common that the uncertainty, significance of decisions and the degree of freedom to maneuver are typically high in the beginning of the project, and low in the end. At the same time, variables such as the accumulated cost and available information begin at low levels and end up at a high level at the end of the project. Even though this type of figure is very common and appears to be logical, the models appears to primary serve as summaries and illustrations, and seems to a lesser extent to be based directly on empirical evidence. There are obvious challenges in quantifying and measuring the different variables. One study in Miller and Lessard (2000:34) shows that for one particular project, regulatory, political and financial risks were at there highest during the middle of the project. However, this type of models can be used to illustrate different issues related to project flexibility.
High
Low
Project time
Accumulated cost/Available information
Uncertainty/Significance ofdecisions/Degree of freedom
to manoeuvre
High
Low
Project time
Accumulated cost/Available information
Uncertainty/Significance ofdecisions/Degree of freedom
to manoeuvre
Figure 1. The uncertainty, significance of decisions and the degree of freedom to maneuver are typically high in the beginning of the project, and low in the end. The accumulated cost and available information have a
reverse development through the project, beginning at a low level and ending at a high level. (Based on Christensen and Kreiner, 1991:40; Mikkelsen and Riis, 2003:47; Midler, 1995:369, Samset, 2000:32).
The “high to low”-curve may have different direct meaning, but the underlying message is similar. Christensen and Kreiner (1991:40) uses Galbraith’s (1977) definition of uncertainty as the difference between the needed and the available information. As the available information increases the uncertainty also decreases through the project. Samset (2000) uses a similar definition of uncertainty. Eikeland (2001) on the other hand, equalizes “room for maneuvering” with the internal uncertainty of the project, related to internal decisions that will be, but are not yet taken. A decision is within the room for maneuvering if it does not violate the consequences of previous decisions.

6
Midler (1995) relates the decreasing degree of freedom to maneuver with a rising degree of irreversibility in project decisions. Mahmoud-Jouini et al. (2004:361) describes the descending curve as “possibilities of action in the project”. Mikkelsen and Riis, (2003:47) let the “high to low”-curve represents importance of decisions.
The “low to high”-curve usually represents either accumulated cost (Eikeland, 2001) or the relative amount of information or knowledge available related to the project (Mikkelsen and Riis, 2003; Midler, 1995; Samset, 2000 and Mahmoud-Jouini et al., 2004).
1.4 Stakeholder’s opinion on flexibility Olsson (2004) analyzed the expected opinion on project flexibility. Project owners and users were likely to be more positive towards changes aimed at increasing the benefit side of the projects, or related to effectiveness. Stakeholders whose main responsibility lie on the cost side of the project, such as project management and contractors, are less likely to embrace changes. According to Kreiner (1995), the project management is made the guardian of efficiency.
In manufacturing industry, it has long been established that task control is a key to achieve high efficiency and productivity. The theoretical foundation for this include scientific management theory (Taylor, 1912), administrative management theory (Fayol, 1949) and bureaucracy theory (Weber, 1922). These theories all have in common that they assume closed systems in order to minimize uncertainty and disturbance (Thompson, 1967). Stability, predictability and control are key elements. Project management techniques such as Work Breakdown Structure (WBS) and other elements of the engineering tradition in project management are descendants from these theories.
Samset (2001:116) discusses and illustrates the need for a division between the project itself and the strategic frame of the project. While the financing party has limited possibility to influence the execution of the project, they have incentives to define the strategic prerequisites as precisely as possible. This reduces the tactical room for maneuvering, and consequently the chances that the project will be carried out as planned. In a similar way, Müller (2003) claims that the owner should impose medium levels of structure on the projects manage. Too much structure will not give the project manager sufficient flexibility to deal with uncertainties that arise. Too little structure will lead to anarchy.
1.5 Flexibility as blessing and curse Project flexibility is part of a fundamental dilemma in project management. On one hand, projects need stability and control to be executed efficiently, typically measured by time, cost and meeting specifications. Thus, flexibility shall be minimized. On the other hand, important decisions in projects must be taken based on limited information in an unpredictable world, creating a need for flexibility. We briefly discussed different approaches to this dilemma from a theoretical standpoint. In the following, methodology and results from a study is presented in an attempt to illustrate some aspects of project flexibility. The empirical data are based on the preparation and execution of a Quality-at entry regime of Norwegian governmental investments. To begin with, this regime is presented.
2. The quality-at-entry regime The largest public investment projects in Norway amount to about 3 billion USD per year totally, mainly channeled through the Ministries of Labor and Government Administration, Finance, Defense, and Transport and Communications (St.prp 1 (2001-2002)). In 1998, the Norwegian ministry of finance initiated an analysis of a number of major governmental investments. Effective from 2000, the Norwegian Ministry of Finance initiated mandatory quality assurance and uncertainty analysis of all governmental investments in Norway exceeding NOK 500 millions (60 million USD), the so-called Quality-at-entry Regime. The regime was introduced in response to a situation with large overruns (Berg et al., 1999).
As a consequence, the responsible ministries are required to undertake assessments prior to the parliament's appropriation of the projects, with a particular aim to review cost estimates and major risks that might affect the projects when implemented. Such analyses are given the short name Quality Assurance 2 (QA2). The aim is to

7
establish realistic cost and time frames for the projects. Four consulting groups were commissioned to undertake the assessments. Related to the project phases, the quality-at-entry analyses are made in the end of the front-end phase.
Important elements in the QA2 Quality-at-entry assessments are (St.prp nr. 1. (1999-2000)): Verify the cost estimates in order to achieve commitment for realistic project budgets Establish a list that specifies how the cost can be reduced if the set budget cannot be met Advice on budget reserves that can cover unforeseen cost. The reserves should serve as a realistic tool to ensure that the projects could be carried out based on the allocated funds and, if need be, by also using the reduction list Advise on how the budget reserves should be managed, specifically who would have the authorization to use the funds.
The Quality-at-entry assessments shall also address issues such as important prerequisites, contract management and project organization.
The purpose of the QA2 assessments was to give the ministry of finance and other involved ministries an independent analysis of the project before approval in parliament. In the consultant’s mandates, it is clear that the controlling aspect is the main focus. Based on the chosen content of the Quality-at-Entry regime, it appears to have its roots in the engineering tradition of project management. Main attention is paid on securing that he projects can be carried out as planned, with a particular emphasis on the budget. An important part of the QA2 assessments has been on stochastic calculations of the expected cost. Dedicated software tools are used for such calculations. Even though organizational aspects of the projects are included in the Quality-at-entry assessments, this is done from a controlling perspective: how do we secure that the projects can be carried out as planned? The reasons for such a perspective are documented in the preparations for the regime, were cost overruns and varying treatment of uncertainty in project estimates were identified as major challenges.
Experiences from the quality-at entry QA2 regime have indicated a need to focus on the basic rationale of projects as to satisfy needs. The Quality-at-entry Regime has been revised and extended to include an external assessment of different project concepts. This new part of the regime is called Quality Assurance 1 (QA1). Quality assurance concerning the basic project concept has not yet taken place. Awarding of framework agreements to consultants was in progress at the time of writing.
3. Method and material The methodological terminology used in this paper is inspired by methodology used in medical research. In clinical research, two common research designs are cohort studies and cross-sectional studies (Hulley et al. 2001). In cohort studies, a group of subjects is followed over time. In cross-sectional studies, observations are made on a single occasion. Furthermore, two basic variations of cohort studies are possible: prospective and retrospective studies. In prospective studies, the investigator defines the sample and measures variables before any outcome have occurred. Studies in which the sample and data collections are made after the outcome have occurred are retrospective. While many studies in project management are of the retrospective type, the research material in this paper also includes prospective studies. The applied methodology is partly prospective, in the meaning that the results are generated from a trailing research were the projects and parameters to be studied were selected prior to conducting the analyses.
In the medical tradition, retrospective cohort studies have the advantage over prospective ones of being much less costly and time-consuming. Prospective studies give the investigator better control over the study (Hulley et al. 2001). The parallels between medical and project management research shall not be drawn too far, but the prospective design has contributed to a relatively consistent data material and overview of the data collection process.
Two data sets have been used. Table 1 gives an overview of some characteristics of the two data sets. The first data set describes the background for the Quality-at entry regime. This material includes 14 projects initiated between1986 and 1998. The prime source is reports written as a preparation of the quality-at entry-regime. Theses analyses are well documented and submitted to public inquiry before a summary of the results were included in a

8
parliamentary bill. In addition, public evaluation reports of governmental projects that have been submitted to the parliament have been used. Both types of reports are comprehensive and quality assured analyses of the projects.
The second source of information consists of 48 Quality-at entry reports carried out between 2000 and 2004. As a part of the Norwegian Quality-at-entry regime, a forum was established consisting of the involved consultants and ministries. A key issue if this forum was to ensure a uniform structure and terminology of the Quality-at entry reports. As a consequence, the research data used in this study has a uniform and quality assured structure. Both these data sets have been codified and entered into a research database. The purpose of the database was to provide proper storage of all relevant data regarding the projects.
Data set Background for the Quality-
at entry regime Projects under the Quality-
at entry regime (QA2) Number of projects (N) 14 48 Time if project initiation 1986-1998 2000 - Data source Evaluation reports Consultant reports Type of study Retrospective Prospective Project type Number Per cent Number Per cent Hospitals 2 14 % 1 2 % Transportation infrastructure 6 43 % 25 52 % Defense 3 21 % 16 33 % Public buildings 3 21 % 6 13 % Total 14 100% 48 100% Project size (final or last known) <15 mill USD (100 mill NOK) 2 14 % 0 0 % 15 - 60 mill USD (100-500 mill NOK) 4 28.6 % 5 10 % 60 - 250 mill USD (500-2000 mill NOK) 4 28.6 % 34 71 % >250 mill USD (2 mrd NOK) 4 28.6 % 9 19 % Total 14 100% 48 100%
Table 1. An overview of the two used datasets.
As Table 1 shows, the material related to the preparations for the Quality-at entry regime is of a retrospective type. The data related to projects that were subject to analysis under the Quality-at entry regime is of a prospective type. A research program, CONCEPT, was established to do research on the effects of the new regime and to follow the projects that were subject to analysis. The projects to be studied were therefore defined before the data collection took place. The variables to be studied were also defined prior to the data collection based on the format of the Quality-at entry analyses.
In addition to the written material, structured interviews are carried out with key stakeholders in many of the projects, including the ministries, government agencies and project organizations. The ministries and project organizations in eight of the first 20 projects were interview and the results are presented in Olsson et al. (2003). Further interviews of agencies and project managers in the Defense, the Public Roads Administration and the Directorate of Public Construction and Property were carried out and presented by Langlo and Olsson (2003). In relation to the mentioned previous studies, this paper aims to add results from a quantitative study to the previous qualitative studies and present an overview based on multiple data sources.
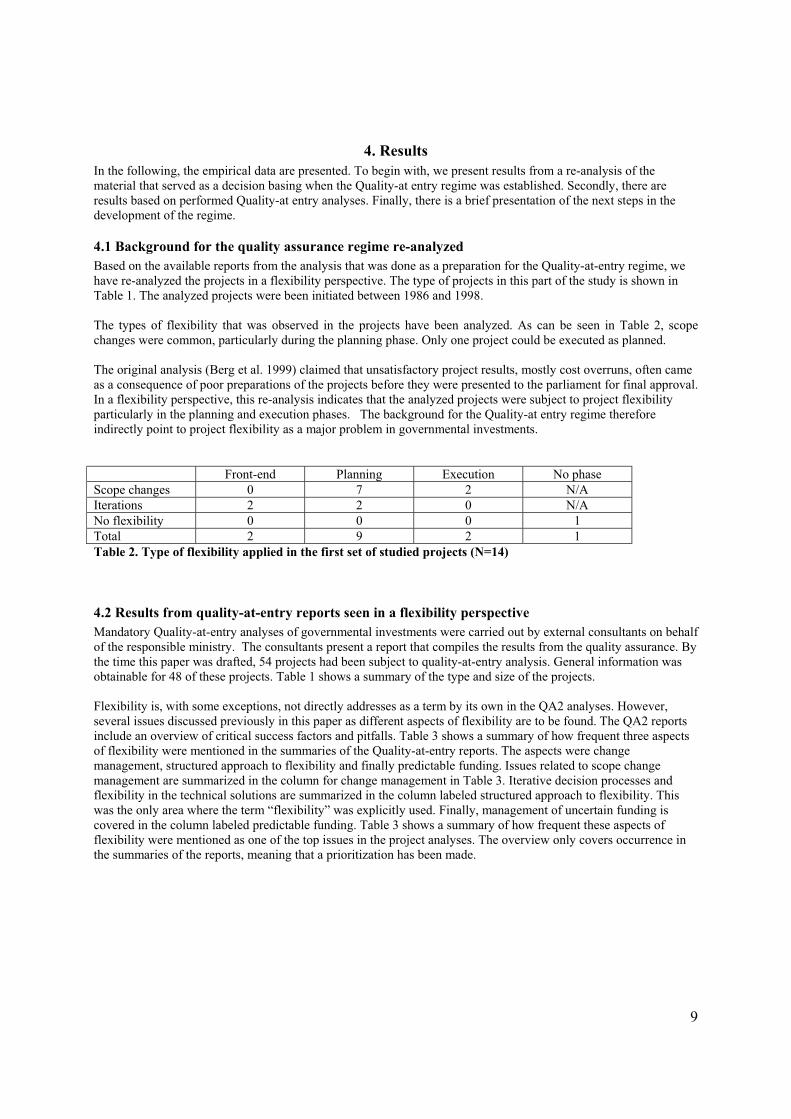
9
4. Results In the following, the empirical data are presented. To begin with, we present results from a re-analysis of the material that served as a decision basing when the Quality-at entry regime was established. Secondly, there are results based on performed Quality-at entry analyses. Finally, there is a brief presentation of the next steps in the development of the regime.
4.1 Background for the quality assurance regime re-analyzed Based on the available reports from the analysis that was done as a preparation for the Quality-at-entry regime, we have re-analyzed the projects in a flexibility perspective. The type of projects in this part of the study is shown in Table 1. The analyzed projects were been initiated between 1986 and 1998.
The types of flexibility that was observed in the projects have been analyzed. As can be seen in Table 2, scope changes were common, particularly during the planning phase. Only one project could be executed as planned.
The original analysis (Berg et al. 1999) claimed that unsatisfactory project results, mostly cost overruns, often came as a consequence of poor preparations of the projects before they were presented to the parliament for final approval. In a flexibility perspective, this re-analysis indicates that the analyzed projects were subject to project flexibility particularly in the planning and execution phases. The background for the Quality-at entry regime therefore indirectly point to project flexibility as a major problem in governmental investments.
Front-end Planning Execution No phase Scope changes 0 7 2 N/A Iterations 2 2 0 N/A No flexibility 0 0 0 1 Total 2 9 2 1 Table 2. Type of flexibility applied in the first set of studied projects (N=14)
4.2 Results from quality-at-entry reports seen in a flexibility perspective Mandatory Quality-at-entry analyses of governmental investments were carried out by external consultants on behalf of the responsible ministry. The consultants present a report that compiles the results from the quality assurance. By the time this paper was drafted, 54 projects had been subject to quality-at-entry analysis. General information was obtainable for 48 of these projects. Table 1 shows a summary of the type and size of the projects.
Flexibility is, with some exceptions, not directly addresses as a term by its own in the QA2 analyses. However, several issues discussed previously in this paper as different aspects of flexibility are to be found. The QA2 reports include an overview of critical success factors and pitfalls. Table 3 shows a summary of how frequent three aspects of flexibility were mentioned in the summaries of the Quality-at-entry reports. The aspects were change management, structured approach to flexibility and finally predictable funding. Issues related to scope change management are summarized in the column for change management in Table 3. Iterative decision processes and flexibility in the technical solutions are summarized in the column labeled structured approach to flexibility. This was the only area where the term “flexibility” was explicitly used. Finally, management of uncertain funding is covered in the column labeled predictable funding. Table 3 shows a summary of how frequent these aspects of flexibility were mentioned as one of the top issues in the project analyses. The overview only covers occurrence in the summaries of the reports, meaning that a prioritization has been made.

10
Change management Structured approach to
flexibility Predictable funding Pit fall 16 2 2
Key success factor 13 3 1 Pit fall or key success factor 24 5 3
Table 3. Key project aspects related to project flexibility as mentioned in the summaries of the Quality-at-entry reports (QA2). N=48
Management of changes was the most frequent issue. It was mentioned as a top issue in 24 of the projects, or 50%. In most cases the purpose was to establish a structured management of scope changes in order to minimize the amount and the size of the changes. For five projects, change management was mentioned as both as success factor and pit fall, usually addressing the same issue, in essence an emphasis of the importance of change management. The apparent “double counting” in five projects means that the total number of projects addressing change management are not equal to the sum of each issue individually in Table 3. Flexibility in the product or decision process was mentioned in 10% of the projects. The availability of predictable funding often was frequently mentioned in the text of the reports. However, it was only in three projects that it was listed among the top pit falls or key success factors in the summaries of the reports.
4.3 Reduction lists It is a part of the consultants’ assignment to assess the possibility for potential reductions that can be carried out if other parts of the project turn out to be more costly than planned. These possible reductions are summarized as reduction lists. Reduction lists are the most explicit use of project flexibility in the Quality-at entry regime. These reduction lists cover parts of the project scope that are planned to be part of the projects. However, if necessary, these parts of the scope can be taken out of the projects without threatening the fundamental functionality of the delivery. The scope reductions shall be described, the cost reduction shall be estimated and a priority list shall be presented. Prerequisites and consequences shall also be described. Even though it was not a formal requirement, many of the consultants chose to add due dates for the scope reductions, to indicate when decisions have to be made to realize any cost saving from the reductions.
Information on reduction lists was possible to obtain from 42 of the projects. As shown in Table 4, reduction lists were used in 30 of these projects. For 23 of the projects, the reduction lists also included due dates to define when the window of opportunity closes for each item on the reduction list. The total value of all mentioned possible reductions was 7% if only the projects with reduction lists are used as basis for percentage calculation, and 5% if all projects are included, i.e. also those project without reductions lists.
Number
Percentage (based on 47
projects) Projects with reduction lists 33 70 % Projects that subtracted reductions in the recommended budget 18 38 % Projects with due dates in the reduction lists 24 51 %
Table 4. Occurrence of reduction lists (N=47)
Table 5 shows a categorization of the reductions, their frequency and total amount. Flexibility in the product represents primarily preparations for alternative use of for future projects. Reductions in quality or functionality

11
lowered the quality but the volume remained the same as planned. A common type of reduction for roads was related to planned actions on existing roads in connection to the new construction. These occasions are registered as reductions in quality. Adjustments of the ambitions related to the visual impression of the project delivery might be seen as a subgroup of quality reductions. Due to its frequency in transportation infrastructure projects in particular, it is presented as a separate category. Common examples of this category include planting fewer trees, lower ambition as to establishing lawn and lower ambitions for the esthetic appearance of concrete walls. Reductions in volume relate to number of items delivered, fewer kilometers of road etc. The dependencies between different projects were typically of the type that “if another project includes this particular delivery in their scope, we can take it out of our scope”. Finally, any type of reduction that did not match the identified categories is listed as “other”. As can be seen in Table 5, quality and volume issues were most frequent and represented the largest monetary value.
Total observations Amount Type of reduction Number Percent Mill. NOK Percent Flexibility in the product 9 5 % 70 3 % Quality, functionality 71 42 % 804 36 % Visual impression 22 13 % 239 11 % Volume 48 28 % 864 39 % Dependencies between projects 4 2 % 41 2 % Other 15 9 % 221 10 % Total 169 100% 2 239 100%
Table 5. Reductions by type, frequency and size. Based on data from 37 projects.
Several concerns regarding the scope reductions are raised. One issue is related to cost sharing between stake holders in the projects, for example between the government represented by the Public Roads Administration on the one hand, and the local counties on the other hand. Some type of scope reductions may only represent a relocation of the cost.
A similar discussion related to weighing investments versus maintenance cost is also present for many projects. In some cases, it is commented that future maintenance cost becomes neglected by the use of a fairly high discount rate in cost/benefit calculations.
In many cases, reductions are claimed to only be possible by reducing the volume of the projects, for example in terms of highway meters or defense equipment units. A common comment is that by reducing the volume, the unit cost will increase in the projects because of fixed costs. There is also a tendency towards frustration because the projects have been through several rounds of reductions to focus the scope prior to the external quality-at entry analysis, where a new round of reductions is asked for.
The need for fast decisions regarding possible reductions is very common. According to one consultant, reductions in system architecture and quality standards have to be made early in the projects. Reductions in volume are possible to make at later stages, depending on the contract structure. Another common comment is that the potential volume of the reductions is so small that it is not justified to set up a system to manage reductions.
The purpose of the reduction lists is to have possibilities to reduce the scope in response to cost overruns. A major challenge is that the due dates for the reductions typically comes before one can expect that project management have updated cost estimates that may indicate potential overruns.

12
4.4 Calculating the remaining flexibility of projects Based on the reduction lists and due dates, it was possible to illustrate how the due dates of the items on the reduction list expire on a time scale. Quality assurance reports were typically delivered a few months prior to the final decision in parliament to go ahead with the projects. The time span of the projects are equal to the time from the date of the quality assurance report, until the planned delivery date of the final project result. To perform the calculations, the time span of each of the projects was divided into quarters of years. For each quarter, the value of the still open items on the reduction list was calculated as percentage of the total project budget. Remaining flexibility of the project decreased each time a due date for an item on the reduction list passed. This value can be seen as an indication of the remaining flexibility, or room to maneuver. It was possible to perform such calculations for 19 of the projects. The shortest of these projects had duration of 1 year, the longest 10 years and average was 4.1 years.
Table 6 shows values of the remaining flexibility for each quarter of the projects. The value is presented as average, maximum, minimum and standard deviation, for each quarter. In this table, all projects are analyzed (and usually approved by parliament) at year number 0. In reality, all projects did not begin at the same time, but in a sequence, usually independent of each other. As the number of projects decrease in the right column, this indicates that the projects reach their completion. When the number of projects drops from 19 to 16 between year one and two, this means that the three shortest of the projects only had duration of less than two years. Only one project had duration over 7 years. The average remaining flexibility drops sharply during the first year of the projects, from almost six to less than two percent. After 6 years, none of the projects had any remaining items on their reduction lists. Only three projects had such long duration.
Year Average St.dev Max Min N 0 5,9 % 5,0 % 18,2 % 0,2 % 19 1 1,8 % 2,1 % 7,4 % 0,0 % 19 2 1,2 % 2,1 % 7,4 % 0,0 % 16 3 1,0 % 1,7 % 5,2 % 0,0 % 12 4 1,0 % 1,5 % 3,8 % 0,0 % 10 5 0,3 % 0,5 % 1,2 % 0,0 % 7 6 0,0 % 0,0 % 0,0 % 0,0 % 3 7 0,0 % 0,0 % 0,0 % 0,0 % 1 8 0,0 % 0,0 % 0,0 % 0,0 % 1 9 0,0 % 0,0 % 0,0 % 0,0 % 1 10 0,0 % 0,0 % 0,0 % 0,0 % 1
Table 6. The size of the reduction lists as percentage of total budget at the end of each year of the project tine span, beginning from the date when consultants supplied their reports, and ending when the projects are
delivered.
To achieve a uniform presentation of the projects, regardless of their duration, the time scale was then converted to percentages of time span. Thus, all projects begin at 0% on the time scale. At this point, the initial remaining flexibility is represented by a full reduction list (on average 5.9%, the same as for year 0). The projects were completed at the 100% mark on the time scale, which in reality varied from a little more than one year to ten years, with an average of 4.1 years. At 50%, all projects were halfway between the delivery of the quality assurance report and their planned finish date. At this stage, the average project had open items on the reduction list equivalent to 0.8% (and 3,4% at the most) of the total budget. Table 7 shows remaining flexibility presented as average, maximum, minimum and standard deviation on the uniform time scale.

13
Size of remaining items on reduction lists Percent of project on time scale Average St.dev Max Min
0 % 5,9 % 5,0 % 18,2 % 0,2 % 10 % 5,2 % 4,9 % 18,2 % 0,0 % 20 % 2,9 % 4,0 % 17,2 % 0,0 % 30 % 1,7 % 1,8 % 5,7 % 0,0 % 40 % 1,5 % 1,7 % 5,4 % 0,0 % 50 % 0,8 % 1,2 % 3,4 % 0,0 % 60 % 0,4 % 0,9 % 3,4 % 0,0 % 70 % 0,3 % 0,8 % 3,4 % 0,0 % 80 % 0,2 % 0,8 % 3,4 % 0,0 % 90 % 0,1 % 0,3 % 1,2 % 0,0 %
100 % 0,0 % 0,0 % 0,0 % 0,0 %
Table 7. The size of the reduction lists as percentage of total budget at different phases of the projects, beginning from the date when consultants supplied their reports, and ending when the projects are delivered.
N=19
4.5 Reserves It is also a part of the consultants’ assignment to recommend a budget for the project. The projects are typically assigned a budget which consists of the expected cost including expected extras. In addition, reserves were allocated to the investments in order to avoid the need for additional funding. The intention with the allocated reserves was to mitigate project risks that could not be fully predicted
Basicbudget
Expectedadditionalcost
Reserves
Reductionlists
Percentage of total allocated budget
Cost
Managed by PM
Managed by agency
P50
P85100%
92%(N=30)
8%(N=45)
94%(N=30)
85%(N=20)
Subjectiveprobability
Figure 2. Project budget and reserves

14
As Figure 2 illustrates, the external consultant recommends a total budget that is expected to cover the consequences of the identified uncertainties. The allocated budget shall represent the cost that has 85% probability of being met (referred to as “P85”), minus the identified potential for reductions. The reserves are, however, not expected to be used, and specific rules for the management of reserves have been established. The budget allocated to the projects, or the executing government agency is usually the most probable final cost (P50). The reserves were not managed by the project manager, and usually not even by the executing government agency. Use of the reserves must be approved by the responsible ministry. Reserves are not intended for expanding the scope of the projects, but solely to cover unexpected expenses.
The size of the reserves recommended by the external consultants could be established for 45 of the projects. On average the external consultants recommended a 9 % reserve (interpreted as a mark-up above the expected cost). Viewed as a share of the total allocated budget the recommended reserve is 8 % on average. In 30 projects the external consultants directly recommended a budget managed by the subordinate agency, and in 20 projects a project manager cost target.
A closer look upon the recommendation on how the reserves should be managed reveals that the subordinate agency on average is pointed out as responsible for 94 % of the total allocated budget. The recommended expected cost is on average 92 % of the total budget, which means that the subordinate agency is granted somewhat more than the expected cost. In the 20 projects where a project manager cost target was recommended, the analysis shows that the project manager is pointed out to manage less than the expected cost (85 % on average). This is supported by the fact that during the collection of the data it was observed that in many cases where a specific project manager cost target was not directly recommended. Instead, it was frequently mentioned that a reasonable level would be in the P45-P50 area. This was expected to launch a cost focus that ultimately would result in cheaper projects.
4.6 QA1 - societal and stakeholder perspectives After presenting empirical results related to the preparations and execution of the Quality-at-entry regime, we now continue to a brief analysis of a new aspect of the regime. After the first round of four years, the Quality-at-entry Regime has been revised and new consultant contracts were awarded in June 2005. In the revision of the regime, a new part has been added that includes an external assessment of different project concepts, termed Quality Assurance 1 (QA1). Five years of trailing research served as input to the revision of the Quality-at-entry regime. Results from this research are presented by Olsson et al (2004) as well as Magnussen and Samset (2005). According to Magnussen and Samset (2005), QA1 is established based on a belief that in order to achieve substantial improvements of project performance, the basic concepts of projects shall be analyzed, not only the final proposal, as is done in QA2.
At the time of writing this paper, no QA1 have been carried out and this short description is based on the description of the intentions of QA1. QA1 include an analysis of the prerequisites for a proposed project, a need analysis, analyses of the documented strategy and requirements and finally, a comparison of alternative concepts. An important element of QA1 is that at least three alternatives shall be analyzed, including a reference alternative which only includes maintenance and other actions needed to continue to use existing resources. QA1 has a wide perspective and focuses on the future users and society as a whole. The purpose is to identify the right project. The societal effects and the interest of different stakeholders are key criteria in the comparison of project alternatives to be carried out in QA1.
5. Discussion The analysis indicates that flexibility was seen as one of the major problems with the governmental projects prior to the Quality-at entry regime. As discussed in the introduction section, the engineering tradition in project management theory then proposes a stronger emphasis on the front-end phase in order to prepare the projects as well as possible. In this perspective, one of the objectives of the Quality-at-entry regime was to reduce the flexibility of the projects. The purpose was to make sure that the project is well defined, both in terms of project scope and organization.
The strong emphasis on scope change management in the QA2 reports indicates that changes and flexibility primarily are treated as something to be minimized, or at least to have a strict regime for. A structured approach to

15
flexibility is introduced by the use of reduction lists. However, the sole purpose of the reduction lists is to keep the project within budget. This might be described as a “negative” or internal freedom to maneuver. There is no intention to use the freedom to maneuver to increase the effectiveness, or the benefit side of the projects. In contrast, a “positive” or external freedom to maneuver would include options for increased user satisfaction with the projects. This can be explained by the background to the Quality-at entry regime, where the observed flexibility of the projects often was aimed at increasing the benefit from the projects for the involved stakeholders. This frequently resulted in cost increases. A key purpose of the Quality-at entry regime was to stop this development.
We noted that the possibility to establish a more or less customized organization for a unique task is one of the main reasons that projects are set up. As a contrast, control is a key issue in the Quality-at entry regime. Once established to have freedom and adaptability, project management, or at least the engineering tradition of project management, is focused on reducing or controlling this freedom of the projects. Projects appear to be trapped in their freedom. The potential freedom of projects is so large that major management emphasis is directed towards reducing and controlling flexibility. Permanent organizations have a different perspective. Repetitive tasks are traditionally organized in ways that utilize economies of scale and to utilize the learning curve. This has usually meant rigid processes and high investment. Coming from a tradition of repetitive tasks, successful permanent organizations are characterized by adaptability (Mintzberg, 1994).
Permanent organization Project Strength Repeatability Flexibility Success criteria Flexibility Focus
Table 8. Flexibility is a success criterion of permanent organizations and strength of projects.
Table 8 illustrates, with the lack of nuances that comes with such matrixes, that flexibility is not the inherent strength, but a success criteria of permanent organizations. As a contrast, flexibility is the inherent strength of projects or temporary organizations, and controlling this flexibility by focus is a key success criterion of this type of organizations. The lack of nuances in Table 8 includes the fact pointed to by Engwall (2003) that many organizations are neither purely projects nor permanent. Reality is therefore more like a continuum of gray scales, where the degree of “permanent” or “project” character of organizations varies. The discussion above then relates to organizations with a high degree of repetitive tasks and “permanent” and similar for “projects”.
It is claimed that QA2 aims to reduce flexibility, at least in the planning and execution phases of projects. Seen in isolation, this means a reduction of flexibility. However, the introduction of QA1 means a stronger emphasis on analyzing alternatives in the front-end phase than has previously been required in this manner. By seeing QA2 and QA1 in combination, the Quality at-entry regime is an opportunity to reduce flexibility options in the planning and execution phases, and to increase and structure these options in the front-end phase.
Different aspects on the Quality at-entry regime have been presented from a flexibility perspective. This paper argues that QA2 to a large extent has its foundation in the engineering tradition, with its focus on control. Using the categorization of projects management perspectives, the intentions of QA1 are different from QA2 and bring associations to the social science tradition in project management.
Some authors on project management, including Söderlund (2004), argue that the engineering and social science tradition are incompatible from a theoretical standpoint. The discussion about QA1 and QA2 indicate that the two perspectives might be practically compatible when analyzing one particular project, but with a displacement in time. The Norwegian Quality-at entry regime strives to utilize the best of the two perspectives, drawing on the social science perspective in the early phase (represented by QA1), and then switching focus to the engineering perspective in the execution phase (represented by QA2). The engineering tradition appears to have its strengths in the execution phases and the social science tradition in the front-end phase, as illustrated in Figure 2. The fact that these traditions co-exist in the minds of different actors involved in a project does not contradict Söderlund’s (2004) notion about the mutual incompatibility from a theoretical standpoint.

16
Social science tradition
Engineering tradition
Time
Front-end ExecutionFigure 3. The relative impact of the social science and engineering traditions over time in a project
In accordance with the engineering tradition in project management, the Quality-at entry regime strives to provide the project owner and project management control over the environments related to the project, or a type of “framing” of the projects. To achieve a high efficiency in the projects, the stakeholders appear to strive for control of the prerequisites for their tasks. It is in accordance with the engineering tradition, with its roots in project planning, that project management shall strive for control of the environments related to the project. In the QA2 reports, this is represented by the high priority given to change management, as shown in table 3. As shown by the use of project reserves and reduction lists, stakeholders also strive for freedom to maneuver within the defined prerequisites. The QA2 aims at defining the projects as precisely as possible, but still provide project management with the freedom to decide how the specifications shall be met, work carried out and budgets to be held. In a similar way, Turner (2004) claims that one of four necessary conditions for project success is that the project manager is empowered. The project owner should give guidance on how the project can be best achieved, but allow the project manager flexibility to handle unforeseen circumstances as they chose.
One purpose of this paper was to contribute with empirical data on some issues related to project flexibility. By using the results presented in Table 7, a part of the curve for the freedom to maneuver in Figure 1 can be drawn based on empirical data. The relative size of the remaining open reductions can be seen as an empirical illustration of the “room for maneuvering”. Figure 4 shows the curve generated from the reduction lists placed into the whole project time span. To do so, another reference point on the scale of the room for maneuvering was calculated based on information from eight of the 48 projects. This reference point is located earlier in the front-end phase and is related to the first budget estimated budget of projects to be found in official documentation. This first estimate is on average 3.4 years before the final approval. As an illustration of the room for maneuvering at this point, the first budget is compared to the final approved. An average of 42% of the final budget was not locked at this point. Because all differences were positive, the final approved budget was on average 42% higher than the first estimate, with a standard deviation of 17%. The reference point in Figure 4 represents the average plus one standard deviation, in a similar way as for the curve based on the reduction lists. The position of the first estimate point in relation to the zero-point on the time scale raises questions – when does a project start? Previous experience indicates that this time span may vary from about 30 years to one or two. As an indication, this point is located at the equivalent to four years after project initiation in Figure 4. This was done because more than 50% of the projects are related to transportation infrastructure, and the strategic planning of such projects is repeated every four years in Norway.
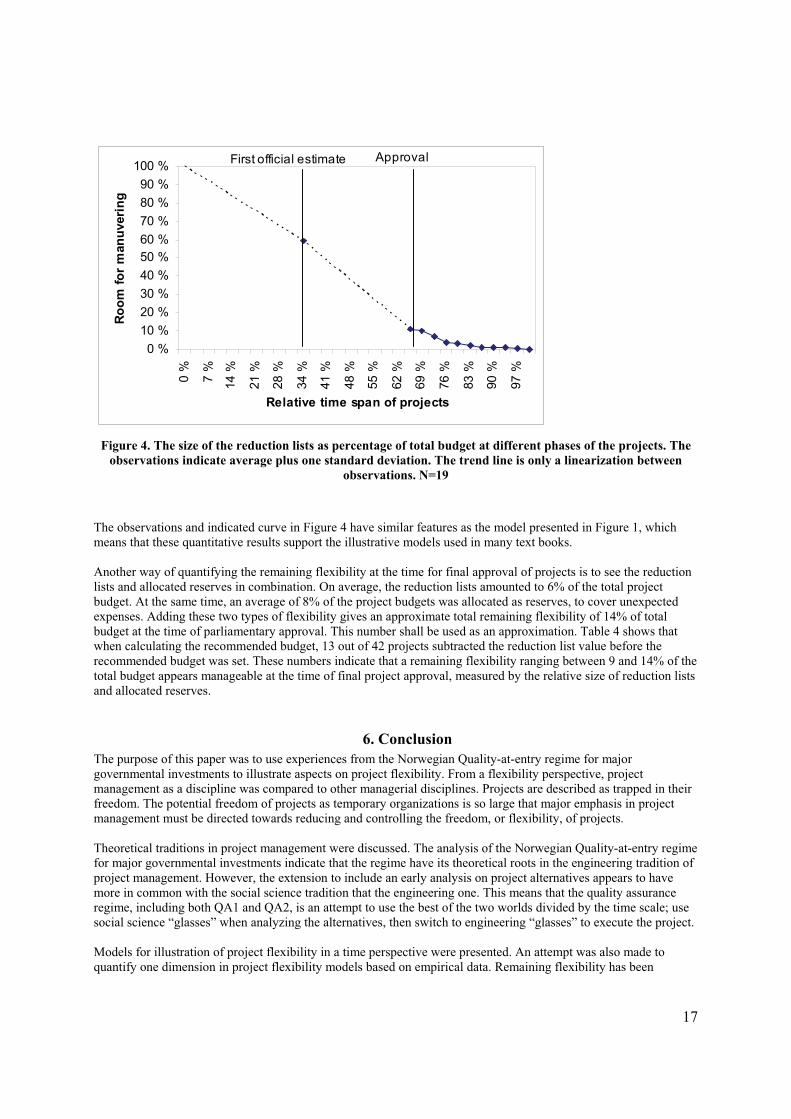
17
0 %10 %20 %30 %40 %50 %60 %70 %80 %90 %
100 %0
%
7%
14%
21%
28%
34%
41%
48%
55%
62%
69%
76%
83%
90%
97%
Relative time span of projects
Room
for
man
uver
ing
First official estimate Approval
Figure 4. The size of the reduction lists as percentage of total budget at different phases of the projects. The observations indicate average plus one standard deviation. The trend line is only a linearization between
observations. N=19
The observations and indicated curve in Figure 4 have similar features as the model presented in Figure 1, which means that these quantitative results support the illustrative models used in many text books.
Another way of quantifying the remaining flexibility at the time for final approval of projects is to see the reduction lists and allocated reserves in combination. On average, the reduction lists amounted to 6% of the total project budget. At the same time, an average of 8% of the project budgets was allocated as reserves, to cover unexpected expenses. Adding these two types of flexibility gives an approximate total remaining flexibility of 14% of total budget at the time of parliamentary approval. This number shall be used as an approximation. Table 4 shows that when calculating the recommended budget, 13 out of 42 projects subtracted the reduction list value before the recommended budget was set. These numbers indicate that a remaining flexibility ranging between 9 and 14% of the total budget appears manageable at the time of final project approval, measured by the relative size of reduction lists and allocated reserves.
6. Conclusion The purpose of this paper was to use experiences from the Norwegian Quality-at-entry regime for major governmental investments to illustrate aspects on project flexibility. From a flexibility perspective, project management as a discipline was compared to other managerial disciplines. Projects are described as trapped in their freedom. The potential freedom of projects as temporary organizations is so large that major emphasis in project management must be directed towards reducing and controlling the freedom, or flexibility, of projects.
Theoretical traditions in project management were discussed. The analysis of the Norwegian Quality-at-entry regime for major governmental investments indicate that the regime have its theoretical roots in the engineering tradition of project management. However, the extension to include an early analysis on project alternatives appears to have more in common with the social science tradition that the engineering one. This means that the quality assurance regime, including both QA1 and QA2, is an attempt to use the best of the two worlds divided by the time scale; use social science “glasses” when analyzing the alternatives, then switch to engineering “glasses” to execute the project.
Models for illustration of project flexibility in a time perspective were presented. An attempt was also made to quantify one dimension in project flexibility models based on empirical data. Remaining flexibility has been

18
quantified during the life cycle of projects and the result is a curve similar to the illustrative models used in many text books on project management. Around the time for final approval, the project management consultants saw it manageable to have an average of 6% of the total project budget still open, with a standard deviation of 5%, maximum 18% and minimum 0.2%. These numbers are based on the 23 projects that did use reduction list with due dates. Another representation of the remaining flexibility at the time of final approval is the fact that 8% of the project budgets were allocated as reserves, to cover unexpected expenses. An approximation of the manageable total remaining flexibility at the time of parliamentary approval is therefore estimated to be in the range between 9 and 14% of total budgets.
The applied methodology is partly prospective in the meaning that the projects and parameters to be studied were selected prior to conducting the analyses. The methodological discussion in the paper on prospective and retrospective research designs is inspired by medical research. Regarding future research, continued use of prospective research designs in project management is interesting and desired. Such designs have the possibility to contribute to enhancing the credibility of project management as a research field.

19
References Andersen, B., Fagerhaug, T., Rolstadås, A. (1998). Practical Productivity Measurement, Proceedings of the 10th
Working Seminar on Production Economics, Innsbruck/Igls, Austria Asbjørnslett, B.E. (2003). From Agile to Lean. PhD Thesis 2003:2, Trondheim, Norway: The Norwegian University
of Science and Technology Berg, P, Andersen, K., Østby, L-E, Lilleby, S., Stryvold, S., Holand, K., Korsnes, U., Rønning, K., Johansen, F.,
Kvarsvik, T. (1999). "Styring av statlige investeringer", Prosjektet for styring av statlige investeringer”, Finans- og tolldepartementet, the Departement of Finance, Oslo, Norway (Title in English: Management of Governmental Investments)
Blakstad, S. H,. (2001), A Strategic Approach to Adaptability in Office Buildings, Ph.D. Thesis, the Norwegian University of Science and Technology
Brand, S., (1994). How Buildings Learn, What happens After They’re Built, Viking Penguin, NY: Penguin Books USA Inc.,
Brennan, M.L., Trigeorgis, L., (2000) Project Flexibility, Agency, and Competition: New Developments in the Theory and Application of Real Options, Oxford University Press
Christensen, S., Kreiner, K., (1991). Prosjektledelse under usikkerhet, Universitetsforlaget A/S, Oslo (Title in english: "Project Management under Uncertainty")
Cleland, D.I. (2004). The Evolution of Project Management, IEEE Transactions on Engineering Management, Vol 51, No. 4., pp 396-397
Crawford, L., Pollock, J (2004). Hard and soft projects: a framework for analysis. International Journal of Project Management, Vol. 22., No. 8, pp 645-653
Eikeland, P.T. (2000). Teoretisk Analyse av Byggeprosesser, Samspill i byggeprosessen, prosjektnr. 10602 (Title in english: "Theoretical Analaysis of the Construction Process")
Engwall, M., (2003). No project is an island: linking projects to history and context, Research Policy, Vol 32, pp 789-808
Fayol, H. (1949). General and industrial management (translated from the French edition) London : Sir Isaac Pitman & Sons
Galbraith J.R. (2001). Designing Organizations: An Executive Guide to Strategy, Structure, and Process. San Francisco: Jossey-Bass, 2nd ed.,
Galbraith J.R. (1977). Organization design Reading, Mass.: Addison-Wesley. Gareis R. (2000). Managing the Project Start. In: Turner J.R. and S.J. Simister (editors) (2000). The Gower
Handbook of Project Management. UK: Gower Pub Co,. Gareis R. (2004). Maturity of the Project-oriented Organization, Nordnet International project management
conference, 29.9-2.10. 2004, Helsinki, Finland Hall, P., (1980): Great Planning Disasters, London: Weidenfeld and Nicolson, Hulley, S.B., Cummings, S.R., Browner, W.S., Grady, D., Hearst, N., Newman, T.B (2001). Designing Clinical
research: An Episemologic Approach. Philadelphia, PA: Lippincott Williams & Wilkins, Husby, O., Kilde, H. S., Klakegg, O. J., Torp, O., Berntsen, S. R., Samset, K., (1999). Usikkerhet som gevinst.
Styring av usikkerhet i prosjekter: mulighet, risiko, beslutning, handling, Trondheim, Norway: The Norwegian Centre for Project Management at the Norwegian University of Science and Technology,. Report no. NTNU 99006 (Title in English: "Uncertainty as Benefit. Managing Project Uncertainty: Possibility, Risk, Decision, Action")
Jugdev, K. (2004) Through the Looking Glass: Examining Theory development in Project Management with the Resource-based View Lens, Project Management Journal, Vol. 35., No. 3, pp 15-26.
Kreiner, K., (1995): In Search of Relevance: Project Management in Drifting Environments, Scandinavian Journal of Management, Vol. 11., No. 4, pp 335-346.
Lundin, R.A., Söderholm, A., (1995). A Theory of the Temporary Organization, Scandinavian Journal of Management, Vol. 11., No. 4, pp 437-455
Kaderfors, A., (1995). Institutions in building projects: Implications for flexibility and change, Scandinavian Journal of Management, Vol. 11., No. 4, pp 363-375
Magnussen, O.M., Samset, K. (2005) Successful Mega projects: Ensuring quality at entry, EURAM 2005 conference, May 4-7th 2005, Munich, Germany

20
Mahmoud-Jouini, S.B., Midler, C., Garel, G. (2004). Time-to-market vs.time-to-delivery Managing speed in Engineering, Procurement and Construction projects, International Journal of Project Management, Vol 22, No 5, pp 359-367
Mikkelsen, H., Riis, J. O.(2003): "Grunnbog i prosjektledelse" (title in english: "Text book in project management"), 7th edition, Rungsted, Denmark: PRODEVO ApS
Midler, C., (1995). “Projectification” of the firm: The Renault case, Scandinavian Journal of Management, Vol. 11., No. 4, pp 363-375
Miller, R., Lessard, D., (2000). The Strategic Management of Large Engineering Projects, Shaping institutions, Risks and Governance, USA: Massachusetts Institute of Technology,
Mintzberg, H., (1994): The Rise and Fall of Strategic Planning, Prentice Hall International. Morris, P.W.G., Hough, G.H. (1991). “The Anatomy of Major Projects. A Study of the Reality of Project
Management”, Chichester, UK: John Wiley and Sons, Müller. R. (2003). Communication of information technology project sponsors and sellers in buyer-seller
relationships. DBA Thesis. UK: Henley Management College,Henley-an-Themes Olsson, N.O.E. (2004):”Flexibility in Engineering Projects: Blessing or Curse?”, Nordnet International project
management conference, 29.9-2.10. 2004, Helsinki, Finland Packendorff (1995) Inquiring into the temporary organisation: new directions for project management research.
Scandinavian Journal of management, 1995:11 (4): 319-34 Samset, K., (2003). Project Evaluation: Making Investments Succeed. Trondheim, Norway: Tapir Academic Press, Samset, K., 2001. “Prosjektvurdering i tidligfasen - Fokus på konseptet”, Trondheim, Norway: Tapir akademisk
forlag, Samset, K., 1998. Project management in a high-uncertainty situation: Understanding risk and project management
in international development projects. Ph.D. Thesis 1998:79, Trondheim, Norway: The Norwegian University of Science and Technology
St.prp nr. 1. (1999-2000). The Norwegian National Budget 2000. Oslo: The Ministry of Finance St.prp nr. 1. (2001-2002). The Norwegian National Budget 2002. Oslo: The Ministry of Finance Söderlund, J. (2004). Building theories of project management: past research, questions for the future, International
Journal of Project Management, Vol. 22. pp 183-191 Turner, J.R (2004). Five necessary conditions for project success (Editorial). International Journal of Project
Management, Vol. 22. pp 349-350 Taylor, F.W (1912) Scientific Management, New York, NY: Harper & Row Publishers, 1964 (reprint of the 1912
edition) Thompson, J.D. (1967). Organisations in Action. New York: McGraw-Hill Verganti, R., 1999. Planned Flexibility: Linking Anticipation and Reaction in Product Development Projects,
Journal of Product Innovation Management, Vol. 16., No. 4, pp 363-376 Weber, M. (1922). Makt og byråkrati. Gyldendal Norsk Forlag, Oslo. (Norwegian translation, from Wirtschaft und
Gesellschaft, part III, J.C.B. Mohr [Paul Siebeck] Tübringen, Germany)

Paper 4.
Olsson, N.O.E. 2004. ‘Flexibility in Engineering Projects: Blessing or Curse?’ Paper presented at the NORDNET 2004 International PM Conference, 29.9. – 1.10. 2004, Helsinki, Finland.
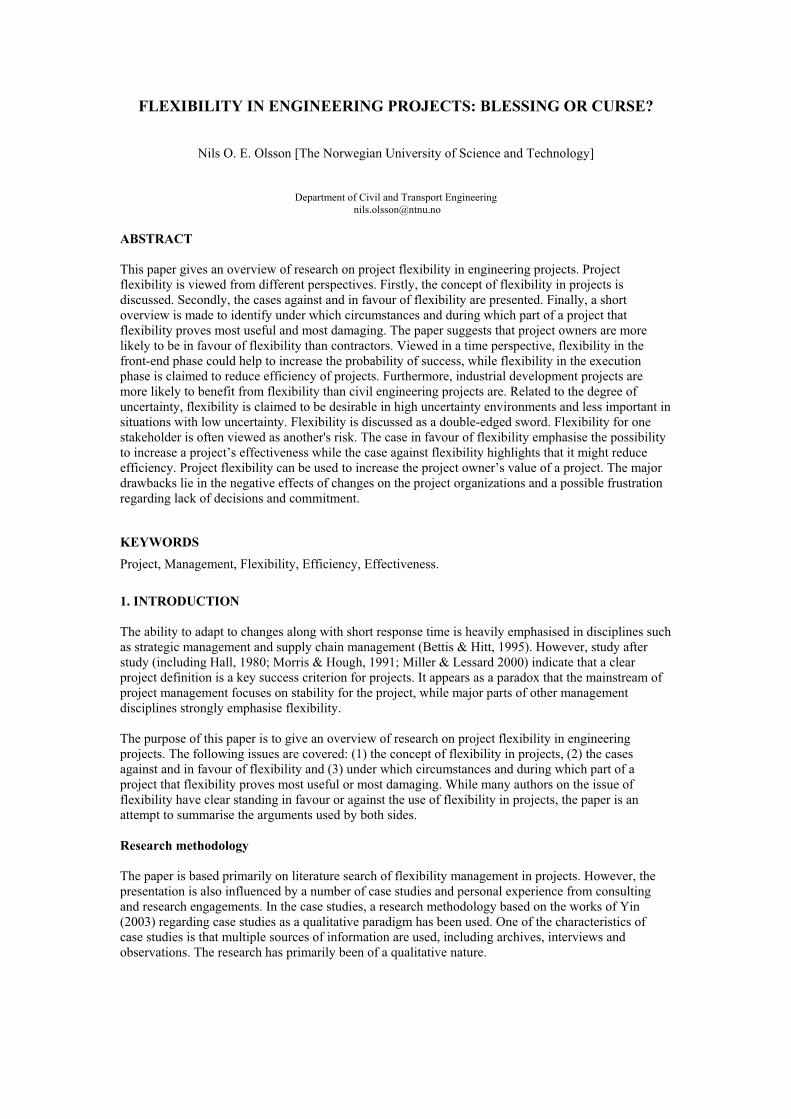
FLEXIBILITY IN ENGINEERING PROJECTS: BLESSING OR CURSE?
Nils O. E. Olsson [The Norwegian University of Science and Technology]
Department of Civil and Transport Engineering [email protected]
ABSTRACT
This paper gives an overview of research on project flexibility in engineering projects. Project flexibility is viewed from different perspectives. Firstly, the concept of flexibility in projects is discussed. Secondly, the cases against and in favour of flexibility are presented. Finally, a short overview is made to identify under which circumstances and during which part of a project that flexibility proves most useful and most damaging. The paper suggests that project owners are more likely to be in favour of flexibility than contractors. Viewed in a time perspective, flexibility in the front-end phase could help to increase the probability of success, while flexibility in the execution phase is claimed to reduce efficiency of projects. Furthermore, industrial development projects are more likely to benefit from flexibility than civil engineering projects are. Related to the degree of uncertainty, flexibility is claimed to be desirable in high uncertainty environments and less important in situations with low uncertainty. Flexibility is discussed as a double-edged sword. Flexibility for one stakeholder is often viewed as another's risk. The case in favour of flexibility emphasise the possibility to increase a project’s effectiveness while the case against flexibility highlights that it might reduce efficiency. Project flexibility can be used to increase the project owner’s value of a project. The major drawbacks lie in the negative effects of changes on the project organizations and a possible frustration regarding lack of decisions and commitment.
KEYWORDS Project, Management, Flexibility, Efficiency, Effectiveness.
1. INTRODUCTION
The ability to adapt to changes along with short response time is heavily emphasised in disciplines such as strategic management and supply chain management (Bettis & Hitt, 1995). However, study after study (including Hall, 1980; Morris & Hough, 1991; Miller & Lessard 2000) indicate that a clear project definition is a key success criterion for projects. It appears as a paradox that the mainstream of project management focuses on stability for the project, while major parts of other management disciplines strongly emphasise flexibility.
The purpose of this paper is to give an overview of research on project flexibility in engineering projects. The following issues are covered: (1) the concept of flexibility in projects, (2) the cases against and in favour of flexibility and (3) under which circumstances and during which part of a project that flexibility proves most useful or most damaging. While many authors on the issue of flexibility have clear standing in favour or against the use of flexibility in projects, the paper is an attempt to summarise the arguments used by both sides.
Research methodology
The paper is based primarily on literature search of flexibility management in projects. However, the presentation is also influenced by a number of case studies and personal experience from consulting and research engagements. In the case studies, a research methodology based on the works of Yin (2003) regarding case studies as a qualitative paradigm has been used. One of the characteristics of case studies is that multiple sources of information are used, including archives, interviews and observations. The research has primarily been of a qualitative nature.

2
The concept of project flexibility
Flexibility management as a systematic approach is not a new concept. Sager (1990) found several examples of flexibility as one approach to prepare for the effects of uncertainty in planning. However, Sager also points out that flexibility is an important term very often used by planners but rarely scrutinized theoretically.
One approach to project flexibility is based on theory related to financial options, referred to by Brennan & Trigeoris (2000) as the real options paradigm. In this paradigm, flexibility is compared to owning an option - the right, but not the obligation to take an action in the future (Amram & Kulatlaka, 1999).
Koskela (2000) describes how production principles such as just-in-time has been adopted in a theoretical framework aimed at the construction industry under the term lean construction. In this framework, the term “last responsive moment” is used to achieve flexibility in projects (Ballard & Howell, 2003). According to Ballard & Howell (2003), the last responsive moment means that decisions must be made within the lead time for realizing alternatives and that a decision should not be made until it has to be made.
Mandelbaum & Buzacott (1990) uses the number of the remaining alternatives after a decision has been taken as a measure of flexibility. Eikeland (2001) discusses “room for manoeuvring” related to project flexibility. He relates “room for manoeuvring” to the internal uncertainty of the project, represented by future yet undetermined internal decisions. According to Eikeland (2001), a decision is within the room for manoeuvring if it does not violate the consequences of previous decisions. Terms like adaptability and robustness are often used when discussing issues related to what this paper calls flexibility. Flexibility may also be described as a way of making irreversible decision more reversible or postponing irreversible decisions until more information is available.
Note that flexibility as discussed in this paper is not seen as an alternative to strategic management, but as a means to help realising a strategy, in the way that Samset (1998) argues that successful projects are characterised by a distinct strategy in combination with sufficient tactical flexibility.
Flexibility in the process and the product
Flexibility in a project can be associated with the process or the product. The former refers to flexibility in the project’s decision process. The real-options paradigm recognises that decisions are made sequentially over episodes. The use of decision gate models provides a successive commitment to a project, including the possibility of iterations, as shown by Eskerod & Östergren (2000). The philosophy of not taking decisions until the last responsible moment, as shown by Ballard & Howell (2003) is also an example of flexibility in the decision process. The latter refers to the effects of a project, in the sense that the final product of the project is prepared for alternative use. This approach to flexibility is used in office building construction, as described in Brand (1994) and Blakkstad (2001), where the need for adaptability is well known.
Efficiency and effectiveness
In this paper, the term efficiency is linked to the immediate outcome of a project. It is a question of doing things right and producing project outputs in terms of the agreed scope, quality, cost and time. It is an internal measure related to what Samset (1998) refers to as the project or contractor perspective. The term effectiveness is linked to the longer-term effects of the project, or in other words, to do the right things. It is an external measure. Eikeland (2001) relates effectiveness to how the results of a project contribute to value added for owners and users. According to Samset (1998), effectiveness measures the realization of the project’s purpose, or the project’s long-term consequences. This is the perspective of the project owner or financing party, who to a large extent have a similar perspective as the users.
3
2. RESULTS
The arguments against and in favour of project flexibility are summarised in the following. Different stakeholders in a project have different perspectives on flexibility. Flexibility is also seen differently depending upon the different phases of a project. The context and type of a project also influence the attitudes toward and benefits of flexibility.
The case against project flexibility
A wide range of studies and authors (including Morris & Hough, 1984; Eikeland, 2001 and Love et al. 2003) have pointed to changes in specifications as a key driver in cost overruns of projects. Change orders are widely seen as undesirable, even if contractors do see them a possibility to improve the profit from the projects (Christensen & Gordon, 1998). Once a project has been decided upon and the planning and execution has begun, changes will often reduce the efficiency of the project. Change orders are also a source of major disagreements between different actors in projects.
Morris & Hough (1991) specifically argue against concurrency between development and production. Miller & Lessard (2000) point out the irreversibility of large engineering projects and the importance of bold commitment from key stakeholders, arguing against flexibility once the front-end phase is over.
Flexibility commonly is seen as undesirable in the execution phases of projects. The high and unpredictable cost of change orders is the key argument against flexibility. The negative consequences of the use of flexibility in projects are also emphasised by project stakeholders that are responsible for the execution of projects, such as contractors. The potential for utilising flexibility in civil engineering projects is seen as limited, due to their indivisibility and irreversibility. Arguments such as “we do not build half a bridge” are used. There is also the possibility that visualising flexibility in a project, such as the openings for later adjustments or even cancellation, will reduce the likelihood that the project will be approved and carried out as planned. In such a perspective, commitments, not adjustability, are required to communicate credibility to affected parties.
The case in favour of project flexibility
Kreiner (1995) points out that the traditional focus on stability in project management becomes challenged under uncertainty, which creates what he calls “drifting environments”. A number of scholars, including Mintzberg (1994) and Bettis & Hitt (1995), argue that flexibility is necessary in order to face the changes, uncertainty and turbulence in the business environment.
The real options paradigm (for example Amram & Kulatlaka, 1999) illustrates that uncertainty can increase the owner’s value of a project, as long as flexibility is preserved and resources are not irreversibly committed.
Miller & Lessard (2001) lists "late locking" as a key success criterion for large engineering projects, along with an exploring, iterative front-end process. Hall (1980) suggests a risk-avoiding strategy, based on minimal commitments at each stage where decisions are necessary. He argues for an incremental or adaptive approach, rather than creating new projects. He suggests enlargements and adaptation of existing projects rather than building new ones, whenever possible.
Modern approaches to development of IT-systems include functional specifications and iterative development. This is described by authors such as Poppendieck & Poppendieck (2003) and Boehm & Turner (2003).
Most authors agree on the value of flexibility in the front-end phase of projects. Flexibility is also generally seen as an advantage in industrial development project (Verganti, 1999). Clark & Fujimoto (1991) and Midler (1995) illustrate this based on the automotive industry. The benefits of flexibility are easier to visualise and implement in industrial development projects than in more standardised civil engineering projects. Flexibility is more valued by the stakeholders that have a responsibility for the overall profitability or societal benefit of a project, compared to those who are only responsible for the cost side of the project.
4
3. CONCLUSIONS
What seems to be implied by authors quoted above is that flexibility is primarily useful to improve effectiveness of projects rather than efficiency. The arguments in favour of flexibility emphasise the possibility for increased effectiveness while the arguments against highlight the problem of reduced efficiency. Flexibility is often seen as a threat to delivering the project on time and within budget. In such a perspective, a project needs to be clearly defined in the front-end phase and executed according to the plans with as few adjustments or remaining decisions as possible, in order to maximise efficiency. On the other hand, flexibility is also seen as a help to achieve the project’s purpose. A project with sufficient flexibility to utilize opportunities to increase the value for owners and users might in the end prove to be more effective.
The literature gives indications as to whom and when flexibility is beneficial or harmful: The financing party or owner is more likely to be interested in flexibility than the contractor On average, flexibility in the front-end phase increases the probability of success The active use of flexibility in the execution phase is likely to reduce efficiency Industrial development projects, including IT system development, are more likely to benefit from flexibility than civil engineering projects are Flexibility appears desirable in high uncertainty environments and less important in situations with low uncertainty
Change orders are not popular and flexibility may increase the probability of changes. However, a change requires that something already has been decided. The logic behind late locking of projects and that a decision shall not be taken until it really has to means that changes should be reduced by locking solutions as late as possible.
Flexibility appears as a double-edged sword: the flexibility for one project stakeholder can be another's risk. The case against project flexibility highlights the negative effects of changes along with the possibilities for frustration due a lack of decisions and commitment. Flexibility can thus be used to justify the opinion that decisions do not need to be taken or can always be revised. On the other hand, the case for project flexibility emphasises the possibility to utilise opportunities that arise and to manage the uncertainty, particularly in the front-end phase of projects.
Finally, project flexibility is found to not necessarily be a question of good or bad, right or wrong. With proper precaution and knowledge, the drawbacks of flexibility might be avoided or reduced and the benefits utilised.
REFERENCES
Amram, M., Kulatlaka, N., 1999. Real Options : Managing Strategic Investment in an Uncertain World, Financial Management Association Survey and Synthesis Series, Harvard Business School Press, Boston.
Ballard, G., Howell, G.A., 2003. Lean project management, Building Research & Information, Vol 31, issue 2, pp 119-133.
Bettis, R. A., Hitt, M. A., 1995. The New Competitive Landscape, Strategic Management Journal, Vol. 16, 7-19.
Blakstad, S. H,. 2001, A Strategic Approach to Adaptability in Office Buildings, Ph.D. Thesis, the Norwegian University of Science and Technology.
Boehm, B., Turner, R., 2003, Observations on Balancing Discipline and Agility, Proceedings of the Agile Development Conference ADC’03, IEEE Computer Society.
Brand, S., 1994. How Buildings Learn, What happens After They’re Built, Viking Penguin, Penguin Books USA Inc., NY.

5
Brennan, M.L., Trigeorgis, L., 2000. Project Flexibility, Agency, and Competition: New Developments in the Theory and Application of Real Options, Oxford University Press
Christensen, S., Kreiner, K., 1991. Prosjektledelse under usikkerhet, Universitetsforlaget A/S, Oslo (Title in english: "Project Management under Uncertainty").
Clark, K. B., Fujimoto, T., 1991. Product Development Performance: Strategy, Organisation, and Management in the World Auto Industry, Harvard Business School Press, Boston, Massachusetts.
Eikeland, P.T. 2001. Teoretisk Analyse av Byggeprosesser, Samspill i byggeprosessen, prosjektnr. 10602 (Title in english: "Theoretical Analaysis of the Construction Process")
Eskerod, P., Östergren K., 2000. Why do Companies Standardize Projects Work?, Project Management, Vol. 6, No 1, 2000.
Hall, P., 1980. Great Planning Disasters, Weidenfeld and Nicolson, London.
Kreiner, K., 1995. In Search of Relevance: Project Management in Drifting Environments, Scandinavian Journal of Management, Vol. 11., No. 4, pp 335-346.
Love, P. E.D., Irani, Z., Edwards, D. J., 2003. Learning to Reduce Rework in Projects: Analysis of Firm’s Organizational Learning and Quality Practices, Project Management Journal, Vol 34, no 3, 13-25.
Mandelbaum, M., Buzacott, J., 1990. Flexibility in decision making, European Journal of Operational Reserach, Vol. 44., pp 17-27.
Midler, C., 1995. “Projectification” of the firm: The Renault case, Scandinavian Journal of Management, Vol. 11., No. 4, pp 363-375.
Miller, R., Lessard, D., 2000. The Strategic Management of Large Engineering Projects, Shaping institutions, Risks and Governance, Massachusetts Institute of Technology, USA.
Mintzberg, H., 1994. The Rise and Fall of Strategic Planning, Prentice Hall International.
Morris, P.W.G., Hough, G.H., 1991. The Anatomy of Major Projects. A Study of the Reality of Project Management, John Wiley and Sons, Chichester, UK.
Poppendieck, M,. Poppendieck, T., 2003. Lean Software Development: An Agile Toolkit. Addison-Wesley.
Sager, T., 1990. Notions of Flexibility in Planning-Related Literature, Nordic Institute for Studies in Urban and Regional Planning, publication no. 1990:5.
Samset, K., 1998. Project management in a high-uncertainty situation: Understanding risk and project management in international development projects. Ph.D. Thesis 1998:79, the Norwegian University of Science and Technology.
Verganti, R., 1999. Planned Flexibility: Linking Anticipation and Reaction in Product Development Projects, Journal of Product Innovation Management, Vol. 16., No. 4, pp 363-376.
Yin, R.K., 2003. Case Study Research: Design and Methods, 3rd edition, Sage Publications.

Paper 5.
Olsson, N.O.E. 2006. ‘Impact analysis of railway projects in a flexibility perspective’. Transport Reviews 26:5, 557-569.

Transport Reviews, Vol. 26, No. 5, 557–569, September 2006
0144-1647 print/1464-5327 online/06/050557-13 © 2006 Taylor & FrancisDOI: 10.1080/01441640600558231
Impact Analysis of Railway Projects in a Flexibility Perspective
NILS O. E. OLSSON
Department of Civil and Transport Engineering, Norwegian University of Science and Technology, Trondheim, NorwayTaylor and Francis LtdTTRV_A_155806.sgm
(Received 31 August 2005; revised 21 November 2005; accepted 5 January 2006)10.1080/01441640600558231Transport Reviews0144-1647 (print)/1464-5327 (online)Original Article2006Taylor & [email protected]
ABSTRACT In a multiple case study, using both quantitative and qualitative data, thetraffic impact of four Norwegian railway investment projects was analysed, focusing on thedevelopment of punctuality, frequency, travel time, number of travellers and constructioncost. Front-end ex-ante predictions are compared with observed ex-post outcome. Keysuccess criteria for realization of planned benefits in the studied railway investmentprojects have been a combination of infrastructure development and acceptance for timeta-ble adjustments. Investments that are executed in a large-scale continuous constructionprocess appear to be more likely to achieve such acceptance compared with investments builtand decided upon section by section. Of the studied projects, section-by-section commit-ment to investments provided a better cost control than what was the case for continuousconstruction projects. In addition, this study points to challenges in realizing travel timereductions in a system with a combination of single tracks and high capacity utilization ofdouble tracks. It is advised to clarify in appraisal documentation that benefits related torailway infrastructure investments are depending on appropriate timetable adjustments.The results indicate that a flexibility option (to sequence a decision process) may actuallyreduce the benefit potential of an investment.
Introduction
The purpose of this paper is to analyse the impact on the railway traffic of fourrailway investment projects. The study includes a comparison between the front-end ex-ante predictions and the observed ex-post outcome, with an emphasis onpunctuality, frequency, travel time and the number of travellers. According toSmall (1999), reductions in travel time typically represent the dominant compo-nent of benefits from transportation investments, and the choice to focus on sched-uled travel time, frequency and punctuality was made with this in mind. Ananalysis of project costs is also included. By comparing the ex-ante, expected and
Correspondence Address: Nils O. E. Olsson, Department of Civil and Transport Engineering, NorwegianUniversity of Science and Technology, Høgskoleringen 7A, N-7491 Trondheim, Norway. Email: [email protected]
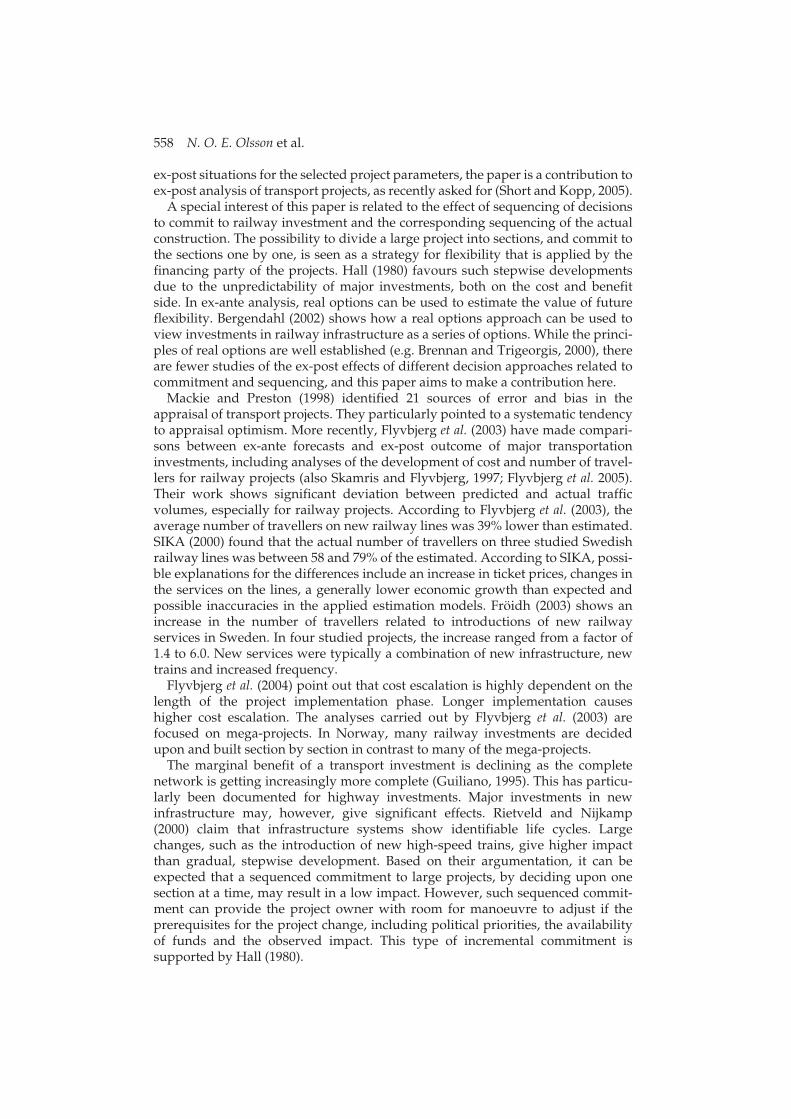
558 N. O. E. Olsson et al.
ex-post situations for the selected project parameters, the paper is a contribution toex-post analysis of transport projects, as recently asked for (Short and Kopp, 2005).
A special interest of this paper is related to the effect of sequencing of decisionsto commit to railway investment and the corresponding sequencing of the actualconstruction. The possibility to divide a large project into sections, and commit tothe sections one by one, is seen as a strategy for flexibility that is applied by thefinancing party of the projects. Hall (1980) favours such stepwise developmentsdue to the unpredictability of major investments, both on the cost and benefitside. In ex-ante analysis, real options can be used to estimate the value of futureflexibility. Bergendahl (2002) shows how a real options approach can be used toview investments in railway infrastructure as a series of options. While the princi-ples of real options are well established (e.g. Brennan and Trigeorgis, 2000), thereare fewer studies of the ex-post effects of different decision approaches related tocommitment and sequencing, and this paper aims to make a contribution here.
Mackie and Preston (1998) identified 21 sources of error and bias in theappraisal of transport projects. They particularly pointed to a systematic tendencyto appraisal optimism. More recently, Flyvbjerg et al. (2003) have made compari-sons between ex-ante forecasts and ex-post outcome of major transportationinvestments, including analyses of the development of cost and number of travel-lers for railway projects (also Skamris and Flyvbjerg, 1997; Flyvbjerg et al. 2005).Their work shows significant deviation between predicted and actual trafficvolumes, especially for railway projects. According to Flyvbjerg et al. (2003), theaverage number of travellers on new railway lines was 39% lower than estimated.SIKA (2000) found that the actual number of travellers on three studied Swedishrailway lines was between 58 and 79% of the estimated. According to SIKA, possi-ble explanations for the differences include an increase in ticket prices, changes inthe services on the lines, a generally lower economic growth than expected andpossible inaccuracies in the applied estimation models. Fröidh (2003) shows anincrease in the number of travellers related to introductions of new railwayservices in Sweden. In four studied projects, the increase ranged from a factor of1.4 to 6.0. New services were typically a combination of new infrastructure, newtrains and increased frequency.
Flyvbjerg et al. (2004) point out that cost escalation is highly dependent on thelength of the project implementation phase. Longer implementation causeshigher cost escalation. The analyses carried out by Flyvbjerg et al. (2003) arefocused on mega-projects. In Norway, many railway investments are decidedupon and built section by section in contrast to many of the mega-projects.
The marginal benefit of a transport investment is declining as the completenetwork is getting increasingly more complete (Guiliano, 1995). This has particu-larly been documented for highway investments. Major investments in newinfrastructure may, however, give significant effects. Rietveld and Nijkamp(2000) claim that infrastructure systems show identifiable life cycles. Largechanges, such as the introduction of new high-speed trains, give higher impactthan gradual, stepwise development. Based on their argumentation, it can beexpected that a sequenced commitment to large projects, by deciding upon onesection at a time, may result in a low impact. However, such sequenced commit-ment can provide the project owner with room for manoeuvre to adjust if theprerequisites for the project change, including political priorities, the availabilityof funds and the observed impact. This type of incremental commitment issupported by Hall (1980).
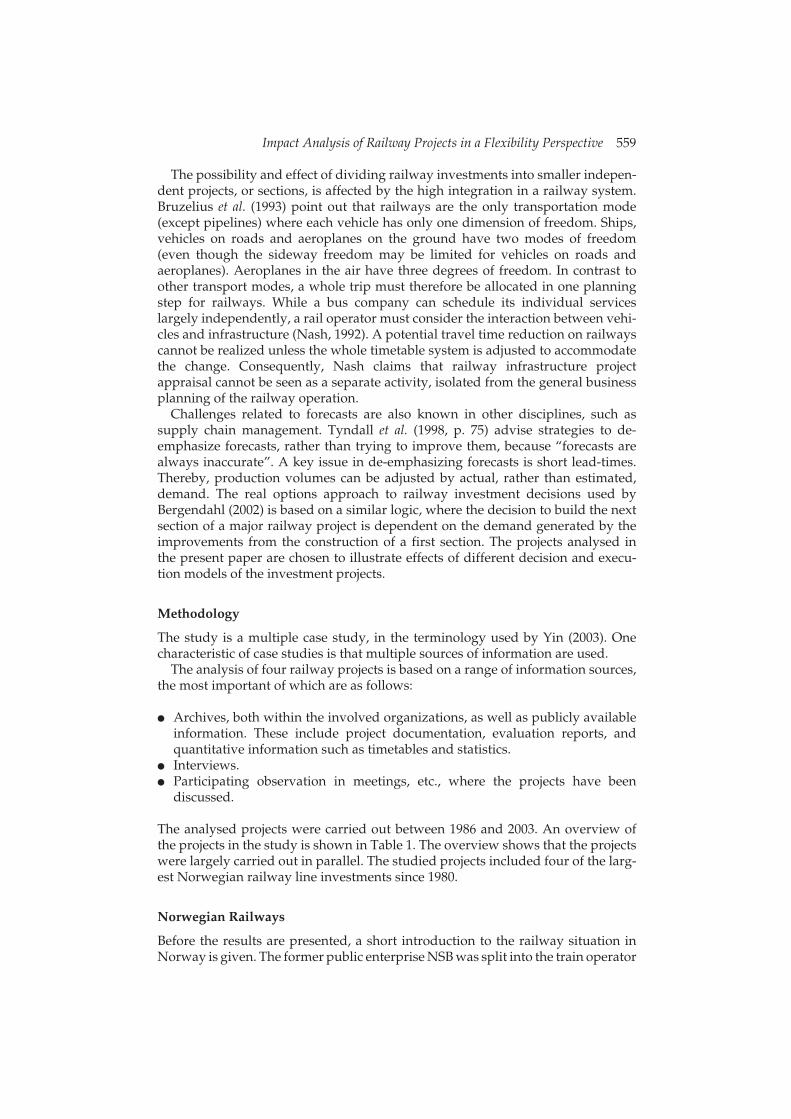
Impact Analysis of Railway Projects in a Flexibility Perspective 559
The possibility and effect of dividing railway investments into smaller indepen-dent projects, or sections, is affected by the high integration in a railway system.Bruzelius et al. (1993) point out that railways are the only transportation mode(except pipelines) where each vehicle has only one dimension of freedom. Ships,vehicles on roads and aeroplanes on the ground have two modes of freedom(even though the sideway freedom may be limited for vehicles on roads andaeroplanes). Aeroplanes in the air have three degrees of freedom. In contrast toother transport modes, a whole trip must therefore be allocated in one planningstep for railways. While a bus company can schedule its individual serviceslargely independently, a rail operator must consider the interaction between vehi-cles and infrastructure (Nash, 1992). A potential travel time reduction on railwayscannot be realized unless the whole timetable system is adjusted to accommodatethe change. Consequently, Nash claims that railway infrastructure projectappraisal cannot be seen as a separate activity, isolated from the general businessplanning of the railway operation.
Challenges related to forecasts are also known in other disciplines, such assupply chain management. Tyndall et al. (1998, p. 75) advise strategies to de-emphasize forecasts, rather than trying to improve them, because “forecasts arealways inaccurate”. A key issue in de-emphasizing forecasts is short lead-times.Thereby, production volumes can be adjusted by actual, rather than estimated,demand. The real options approach to railway investment decisions used byBergendahl (2002) is based on a similar logic, where the decision to build the nextsection of a major railway project is dependent on the demand generated by theimprovements from the construction of a first section. The projects analysed inthe present paper are chosen to illustrate effects of different decision and execu-tion models of the investment projects.
Methodology
The study is a multiple case study, in the terminology used by Yin (2003). Onecharacteristic of case studies is that multiple sources of information are used.
The analysis of four railway projects is based on a range of information sources,the most important of which are as follows:
● Archives, both within the involved organizations, as well as publicly availableinformation. These include project documentation, evaluation reports, andquantitative information such as timetables and statistics.
● Interviews.● Participating observation in meetings, etc., where the projects have been
discussed.
The analysed projects were carried out between 1986 and 2003. An overview ofthe projects in the study is shown in Table 1. The overview shows that the projectswere largely carried out in parallel. The studied projects included four of the larg-est Norwegian railway line investments since 1980.
Norwegian Railways
Before the results are presented, a short introduction to the railway situation inNorway is given. The former public enterprise NSB was split into the train operator

560 N. O. E. Olsson et al.
NSB BA (now NSB AS), The Norwegian Railway Inspectorate and the NorwegianNational Rail Administration in 1996. Competitive bidding for subsidized traffic isunder introduction and new train operators have entered the freight market.
The Norwegian railway network consists of 4077 km of railway line, of which38% is not electrified (based on information given at http://www.jernbanever-ket.no). A special characteristic of the Norwegian rail network is the relativelylow share of double tracks. Only 5% of the network consists of double tracks. Alldouble tracks are close to Oslo. All long-distance, regional and freight trainsmainly run on single tracks. Many commuter trains in the Oslo region are run onboth single and double tracks. Figure 1 shows an overview of the Norwegian railnetwork along with the location of the studied projects.Figure 1. Norwegian rail network and location of studied projects (in grey). The relative size and location of the new built rail lines are only indicativeBetween 1975 and 1991, the number of passengers on Norwegian railways wasfairly stable at around 33 and 38 million passengers per annum, respectively, witha declining tendency from 1981. From 1991 to 2000, there was an increase innumbers. In 1991, the total number of passengers was 33.4 million, while thenumber was 55.3 millions in 2000 (data from http://www.ssb.no). Beginning in2001, there was a downward trend in the numbers of passengers, which at thetime of writing have levelled out and show signs of improvements. Buses haverepresented a fairly constant transport volume for most of the last 30 years, withan increase during the last few years, when express coach traffic has been deregu-lated (JBV Utredning, 2004). Air traffic volumes affect rail ridership in two ways:first, as competition to long-distance trains; and second, related to train traffic toand from airports, and Oslo Airport Gardermoen in particular. Norwegian airtraffic has been growing for a number of years, until 2000. After a few years ofdecline and fierce price completion, air travel is now growing again.
Results from an Analysis of the Projects
Figure 2 shows that the four projects all had different characteristics about how theywere planned to be executed, and how they actually were carried out. In Figure 2,a ‘planned approach’ relates to how a project was intended to be decided upon andexecuted in the front-end phase, typically described in a ‘main report’ for the project,dated at least 1 year before final approval of the project in parliament. An ‘actualapproach’ describes how the projects were finally decided upon and executed.Figure 2. Model for the planning and execution of railway investment projects, and how the studied projects fit into the modelAll the studied projects were divided into sections for practical purposes. Thedistinctions between an ‘integrated’ and ‘section-by-section’ approach in Figure 2relate primarily to the decision process. Projects that actually were executed as
Table 1. Overview of the studied projects
Final cost ( millions) Type of project
Constructionbegun
Constructionended
Gardermoen line 968 new line (double track) 1994 1999Vestfold line 159 from a single to a double
track 1993 2002Østfold line (Ski–Sandbukta) 195 from a single to a double
track 1987 1996Bergen line (Finse-Gråskallen) 101 major improvements of the
existing single-track line 1990 1999

Impact Analysis of Railway Projects in a Flexibility Perspective 561
integrated projects were decided upon at one point. Actual construction wasdivided into sections, but each section did not require new approval by parlia-ment. Projects that were decided upon section by section did require a newapproval before each new section was funded. A distinction between the planned
Figure 1. Norwegian rail network and location of studied projects (in grey). The relative size and location of the new built rail lines are only indicative
Figure 2. Model for the planning and execution of railway investment projects, and how the studied projects fit into the model

562 N. O. E. Olsson et al.
and actual approach has parallels to the distinction between a rational/analyticalmodel and a ‘muddling through’ model, as discussed by Mackie and Nellthorp(2003) in a transport appraisal context. In the following, the results for each of thestudied projects are presented.
Table 2 shows a comparison between the forecast and actual outcomes ofselected variables. Negative values for travel time means that travel time isshorter than planned, while negative values for punctuality means that punctual-ity is lower than planned, meaning that more trains are delayed. Costs areadjusted for inflation. The first cost estimates presented to the Norwegian parlia-ment are used as references.
The forecasts for the Vestfold line are related to the initial plans of an integratedproject. Compared with the cost estimates of the individual sections, the Vestfoldline had a 33% cost overrun.
In a similar way, Table 3 shows the difference between the situation before andafter the investments, not taking the forecasts into account. Negative values fortravel time mean shorter travel time after the investments than before. Positivevalues for the number of trains means increased traffic, and positive values forpunctuality means fewer delays trains. For the number of passengers, a negativevalue means fewer passengers before the investment than after.
In the following, the results for each project are presented, along with somebackground of the traffic patterns along each route.
Vestfold Line
Table 4 shows some selected characteristics for the Vestfold line before and afterthe construction, along with the expected situation after full development of the line.
After 1999, only regional trains are run on the Vestfold line. Key customers arelong-distance commuters living in Vestfold who commute to Oslo. The plannedincrease in frequency is to a large extent carried out, even though only 12% of theplanned double track is built. No freight trains have run on the line since 1999,and a more uniform train mix provides increased capacity on the line. A sharpdrop in the number of travellers on the Vestfold line occurred after 2000. Accord-ing to JBV Utredning (2004), the main reasons include improvements of themotorway running in parallel to the railway, increased competition from motor-way buses, increased ticket prices along with reduced access to ticket distributionand, finally, relatively poor punctuality.
Gardermoen Line
The Gardermoen line was an integrated part of the decision to build Oslo’s newairport Gardermoen. The line runs from central Oslo to the airport. Major parts ofthe railway traffic in the greater Oslo area changed when the Gardermoen lineopened, making it an integrated part of the railway network. The Oslo–Garder-moen line handles not only the Airport Express trains, but also regional, long-distance and some local trains. The old line, running more or less in parallel to thenew one but taking a longer and slower route, handles mainly local and freighttrains. The number of passengers on Airport Express trains was based on a year2000 forecast of 50% market share for the Airport Express train, and 11.7 millionairline passengers at the airport (Ministry of Transport and Communications,1991–92). In 2000, the Airport Express train had a market share of 33% and the

Impact Analysis of Railway Projects in a Flexibility Perspective 563
Tab
le 2
.D
iffe
renc
e be
twee
n ac
tual
dev
elop
men
t and
fore
cast
(%)
Proj
ect c
hara
cter
isti
csV
aria
bles
Plan
ned
appr
oach
Exe
cute
dap
proa
chPr
ojec
t/lin
eT
rave
l tim
e,
built
sec
tion
Tra
vel t
ime,
w
hole
line
Num
ber
of tr
ains
Punc
tual
ity
Num
ber o
f tr
avel
lers
Cos
ts
Inte
grat
edSe
ctio
nV
estf
old
918
3−6
−53
−79
Sect
ion
Sect
ion
Ber
gen
104
0−4
−22
1In
tegr
ated
Inte
grat
edG
ard
erm
oen
−32
110*
*−3
8**
55Se
ctio
nIn
tegr
ated
Øst
fold
123
*2
*26
2
Dif
fere
nces
are
giv
en a
s a
perc
enta
ge =
(act
ual –
fore
cast
)/fo
reca
st. C
osts
are
ad
just
ed fo
r in
flat
ion.
*No
fore
cast
in th
e av
aila
ble
doc
umen
tati
on. G
ard
erm
oen
dat
a re
late
to r
egio
nal t
rain
s, e
xcep
t for
**,
whi
ch r
elat
es to
Air
port
Exp
ress
trai
ns.
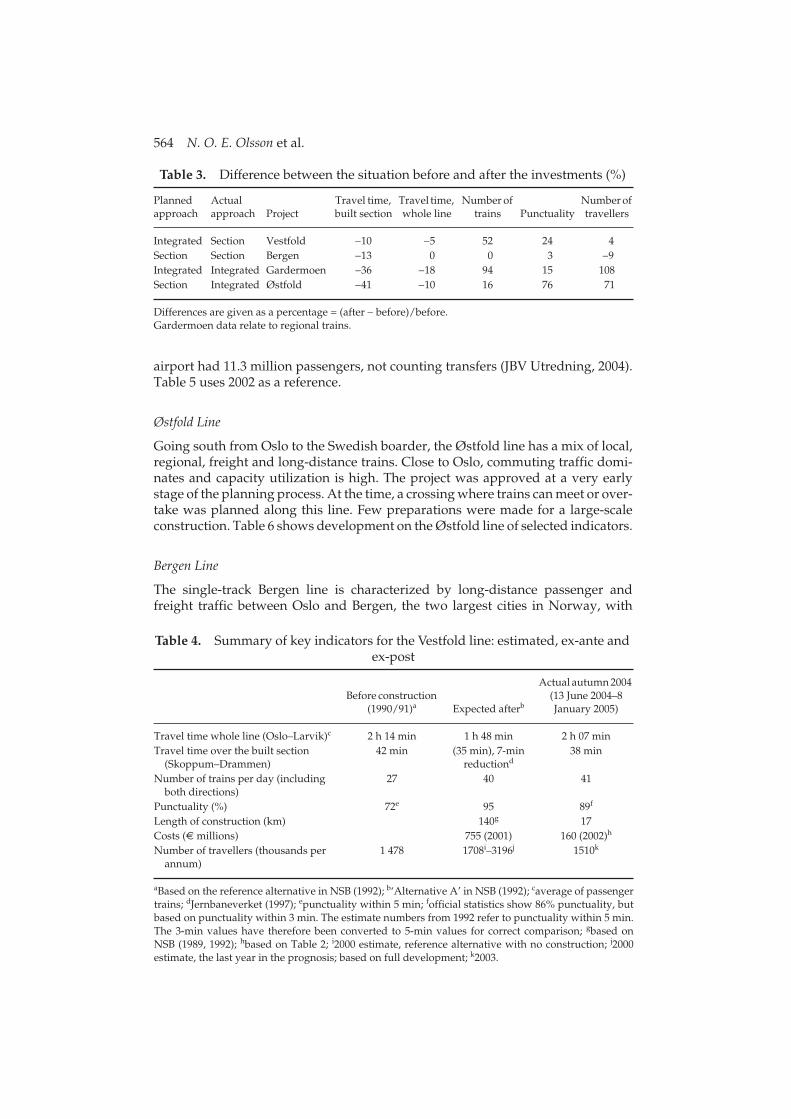
564 N. O. E. Olsson et al.
airport had 11.3 million passengers, not counting transfers (JBV Utredning, 2004).Table 5 uses 2002 as a reference.
Østfold Line
Going south from Oslo to the Swedish boarder, the Østfold line has a mix of local,regional, freight and long-distance trains. Close to Oslo, commuting traffic domi-nates and capacity utilization is high. The project was approved at a very earlystage of the planning process. At the time, a crossing where trains can meet or over-take was planned along this line. Few preparations were made for a large-scaleconstruction. Table 6 shows development on the Østfold line of selected indicators.
Bergen Line
The single-track Bergen line is characterized by long-distance passenger andfreight traffic between Oslo and Bergen, the two largest cities in Norway, with
Table 3. Difference between the situation before and after the investments (%)
Plannedapproach
Actualapproach Project
Travel time, built section
Travel time, whole line
Number of trains Punctuality
Number of travellers
Integrated Section Vestfold −10 −5 52 24 4Section Section Bergen −13 0 0 3 −9Integrated Integrated Gardermoen −36 −18 94 15 108Section Integrated Østfold −41 −10 16 76 71
Differences are given as a percentage = (after − before)/before.Gardermoen data relate to regional trains.
Table 4. Summary of key indicators for the Vestfold line: estimated, ex-ante and ex-post
Before construction (1990/91)a Expected afterb
Actual autumn 2004 (13 June 2004–8 January 2005)
Travel time whole line (Oslo–Larvik)c 2 h 14 min 1 h 48 min 2 h 07 minTravel time over the built section
(Skoppum–Drammen)42 min (35 min), 7-min
reductiond38 min
Number of trains per day (including both directions)
27 40 41
Punctuality (%) 72e 95 89f
Length of construction (km) 140g 17Costs (€ millions) 755 (2001) 160 (2002)h
Number of travellers (thousands per annum)
1 478 1708i–3196j 1510k
aBased on the reference alternative in NSB (1992); b‘Alternative A’ in NSB (1992); caverage of passengertrains; dJernbaneverket (1997); epunctuality within 5 min; fofficial statistics show 86% punctuality, butbased on punctuality within 3 min. The estimate numbers from 1992 refer to punctuality within 5 min.The 3-min values have therefore been converted to 5-min values for correct comparison; gbased onNSB (1989, 1992); hbased on Table 2; i2000 estimate, reference alternative with no construction; j2000estimate, the last year in the prognosis; based on full development; k2003.

Impact Analysis of Railway Projects in a Flexibility Perspective 565
local trains in addition closer to the two cities. The new sections on the Bergen linewere built not only for increased capacity and reduced travel time, which werethe main justification of the other investments in this paper. The main objectiveswere also to reduce operations and maintenance costs as well as the number of
Table 5. Summary of the key indicators for the Gardermoen line: estimated, ex-ante and ex-post
Beforeconstruction (1991) Expected after Actual 2002
Airport Express:Travel time 19 mina 19 minNumber of travellers (thousands per
annum)6360b 3961
Punctuality 95% (2 min) 95% (3 min)Frequency (each direction) 0 6 trains/h 6 trains/h
Regional trains:Travel time, whole line (Oslo–Hamar) 1 h 41 min (1 h 21 min) 20-min
reduction1 h 23 min
Travel time over the built section (Oslo–Eidsvoll)
59 min (39 min) 20-min reduction
38 min
Number of trains per day (including both directions)
22 (22) no stated change 42
Punctuality (%) 71 improvement 82Number of travellers (thousands per
annum)410 not stated 851c
General:Number of trains per day (at Lillestrøm,
including both directions)262 460 509
Length of construction (km) 64 64Costs (€ millions) 625 (1998) 970 (1998)
aNSB (1991a); bbased on Ministry of Transport and Communications (1991–92); c2003.
Table 6. Summary of the key indicators for the Østfold line: estimated, ex-ante and ex-post
Beforeconstruction (1986) Expected aftera Actual, spring 1998
Travel time whole lineb
(Oslo–Halden)2 h 01 min (1 h 46 min) reduction
by 15 min1 h 49 min
Travel time over the built section (Ski–Moss)
32 min 17 min 40 s 19 min 45 s
Number of trains per day (including both directions)
88 increase 102
Punctuality (%) 50 88Length of construction (km) 35.3 32.69 (double-track
Ski–Sandbukta)Costs (€ millions) 54 (1986)c 195 (1996)d
Number of travellers (thousands per annum)
458 783
aBased on NSB (1986); bregional trains; cBerg et al. (1998); dbased on Hoff and Moen (2000).

566 N. O. E. Olsson et al.
cancellations due to severe weather conditions. As a consequence of the construc-tion, a maintenance and snow clearing base in the alpine region was not neededand line operational costs were reduced (Aspengren, 1999). As for the otherprojects, Table 7 shows development on the Bergen line of selected indicators.
Discussion
The analysed projects were either intended to be built one section at a time orintegrated in one project, and the same categorization can be made for the actualexecution of the projects. This study indicates that new infrastructure alonecannot provide the anticipated effects of investments.
The section-by-section projects in this study, the Vestfold and the Bergen lines,have prepared for travel time reductions that have not been realized. One reasonis that the timetable system in Oslo has not been adjusted to accommodate trainpaths at desired times. Due to the complexity of the system and high-capacityutilization, it is not realistic to make major timetable adjustments for every minornew rail section that is taken into use. An increase in frequency on the Vestfoldline was related to the introduction of the Gardermoen line, and not primarily tothe infrastructure development on the Vestfold line itself. Challenges related totimetable adjustments as a result of infrastructure extensions in railway networkswith high complexity and capacity utilization is addressed by Fransso andBertrand (2000) using the Netherlands as a case study. Compared with manyother railway networks, the Norwegian network has a relatively large share ofsingle tracks. The two projects that have had the smallest improvements in traveltime (the Vestfold and Bergen lines) are the two that are most influenced bysingle-track traffic. The Vestfold line has single tracks on both sides of the newdouble track. The Bergen line project is an upgrade from old to a new single-trackline. A main obstacle to the realization of travel time reductions on the Vestfoldand Bergen lines lies in finding train paths that match both new crossing possibil-ities and the traffic pattern in the Oslo area, with very high-capacity utilization.Single-track restrictions are therefore an explanation factor, in addition to thesequencing of the construction, for limited realization of potential travel time
Table 7. Summary of the key indicators for the Bergen line: estimated, ex-ante and ex-post
Beforeconstruction (1989) Expected aftera Actual 2002
Travel time whole line (Oslo–Bergen)c 6 h 23 min (6 h 10 min) reduction by 13 min
6 h 24 min
Travel time over the built section (Ustaoset–Myrdal)
63 min (50 min) reduction by 13 min
55 min
Number of trains per day (including both directions)
16 (16) no stated change 16
Punctuality (%) 73 78 75Length of construction (km) 22.7b 25.4Costs (€ millions) 100 (2000) 101 (2000)Number of travellers (thousands per
annum)684 799 623
aBased on NSB (1991b); bbased on NSB (1987); ctrain 61.

Impact Analysis of Railway Projects in a Flexibility Perspective 567
reductions for these two projects. This appears not to be a unique Norwegiansituation, but related to single-track traffic in general. Challenges related to partialdouble-track traffic in Sweden are documented by Lindfeldt (2001).
A major investment such as the Gardermoen line was given priority for acomplete redesign of timetables in order to utilize the new infrastructure. Timeta-bles on the other integrated investment, the Østfold line, have also been adjustedto utilize the new infrastructure. The two integrated projects achieved a momen-tum in construction, as well as in the timetabling to achieve desirable travel times.In addition, both the Gradermoen and Østfold projects consist of new doubletracks connected to the double-track network around Oslo, even though both arelocated on the present end of this double-track system, with single tracks continu-ing further away from Oslo. Note that the size of the investment also matters. Theintegrated investments are larger than the section-by-section investments.
If a section-by-section approach has disadvantages related to the realization ofbenefits, it appears to provide cost control. Even taking into account the 33%overrun for the individual sections on the Vestfold line, the integrated invest-ments have higher overruns that the section-by-section based ones. Cost overrunson mega-projects are documented by Flyvbjerg et al. (2003), showing that this isnot a unique Norwegian issue.
Table 8 summarizes the impressions from the case studies. This paper arguesthat major improvements of traffic-related benefits for integrated projects are aconsequence of investment size, adjusted timetables and location related to adouble-track system.
A real options approach to railway investment aims at maximizing the cost–benefit ratio by sequenced decisions, continuously using updated information.This study questions the possibilities to achieve reliable information related tobenefits. The effects of made investments are not materialized until the combinedinvestment on a line reaches a certain level. Dividing an investment into a seriesof sections, decided upon individually, may therefore result in lower benefits interms of, for example, travel time compared with an integrated project approach.As a consequence, a flexibility option (to sequence the decision process) mayreduce the benefit potential. A real options approach emphasizes the value offlexibility options. This study indicates that a cost, or a reduction of benefits,should be included in calculations of flexibility value. These results are alsocontrary to common understanding in the project management field, where flexi-bility usually is seen as a means of achieving increased benefit from a project, asdescribed by Olsson (2004).
One question that arises is if relatively limited investments shall be evaluatedbased on the actual reduction in travel time, or rather the potential travel time. Newsections by themselves cannot provide reduced travel time unless the new infra-structure is integrated in the complete timetable, which may include interaction
Table 8. Observed impact from the studied project strategies
Actual project approach
Development in number of travellers compared with before
Train traffic compared with before Cost
Section by section small changes moderate improvements controlIntegrated major increase major improvements overruns

568 N. O. E. Olsson et al.
with a wide range of train services and lines. As mentioned, this is a major differ-ence compared with road investments. As an alternative ex-post evaluation andcomparison between ex-ante and ex-post, all railways related investments in agiven part of the railway system could be evaluated as a whole with certainintervals, e.g. every 5 years.
Conclusions
Key success criteria for travel time reductions from railway investments appear tobe the combination of infrastructure development and acceptance for timetableadjustments. Investments executed as integrated projects appear to be more likelyto achieve such acceptance for timetable adjustments compared with investmentsbuilt and decided upon section by section. A critical mass of potential improve-ment is needed to justify a timetable change that uses new infrastructure. Incontrast, sequenced decisions appear to provide a better cost control comparedwith integrated projects. Regarding the location of railway constructions, thisstudy particularly points to difficulties in realizing travel time reductions whenthere are single tracks on both sides of the new lines, and the train traffic alsopasses through an area with high-capacity utilization. In such a situation, exten-sion of double tracks seems to be more likely to realize expected travel timereductions.
This study indicates a need to make it clear in the ex-ante project description offuture investment projects that the estimates for travel time, frequency, punctual-ity and number of travellers are dependent on appropriate timetable adjustments.Such a practice would give a higher accuracy of the project descriptions. To stateexplicitly the relation between timetable adjustments and the realization ofinvestment benefit can contribute to a tighter coordination between investmentand timetable planning.
Acknowledgements
The author thanks the Norwegian National Rail Administration and NSB AS forproviding access to staff and information related to the studied projects. Thevaluable comments of two anonymous referees are appreciated.
References
Aspengren, N. C. (1999) Fra Roa til Bergen Historien om Bergensbanen (Oslo: Baneforlaget).Berg, P., Stene, E. A., Fon, A. M., Kvarsvik, T., Bye, B., Aksnes, L., Hallquist, Ø. and Pedersen, P. (1998)
Gjennomgang av investeringer i samferdselssektorene, Rapport fra en arbeidsgruppe med deltakelse fraFinansdepartementet, Samferdselsdepartementet, Jernbaneverket, Vegdirektoratet og Luftfartsverket, Prosjek-tet for styring av statlige investeringer (Oslo: Department of Finance).
Bergendahl, G. (2002) Real optionsanalys för vägar och järnvägar—en tillämpning på projektet Citytunneln iMalmö. Available at: http://www.sika-institute.se
Brennan, M. L. and Trigeorgis, L. (2000) Project Flexibility, Agency, and Competition: New Developments inthe Theory and Application of Real Options (New York, NY: Oxford University Press).
Bruzelius, N., Jensen, A. and Sjöstedt, L. (1993) Svensk järnvägspolitik. En kritisk granskning (Stockholm:SNS).
Flyvbjerg, B., Bruzelius, N. and Rothengatter, W. (2003) Megaprojects and Risk. An Anatomy of Ambition(Cambridge: Cambridge University Press).
Flyvbjerg, B., Holm, M. K. S. and Buhl, S. L. (2004) What causes cost overrun in transport infrastruc-ture projects?, Transport Reviews, 24(1), pp. 3–18.
Impact Analysis of Railway Projects in a Flexibility Perspective 569
Flyvbjerg, B., Holm, M. S. and Buhl, S. L. (2005) How (in)accurate are demand forecasts in publicworks projects? The case of transportation, Journal of the American Planning Association, 71(2),pp. 131–146.
Fransso, J. C. and Bertrand, J. W. M. (2000) An aggregate capacity estimation model for the evaluationof railroad passing constructions, Transportation Research Part A, 34, pp. 34–49.
Fröidh, O. (2003) Introduction of Regional High Speed Trains. A Study of the Effects of the Svealand Line onthe Travel Market, Travel Behaviour and Accessibility. KTH TRITA-INFRA 03-041 (Stockholm: KunglTekniska Högskolan).
Guiliano, G. (1995) Land use impacts of transportation investments, highway and transit, in: S.Hanson (Ed.) The Geography of Urban Transportation, pp. 305–341 (New York, NY: Guilford).
Hall, P. (1980) Great Planning Disasters (London: Weidenfeld & Nicolson).Hoff, A. H. and Moen, T. (2000) Konsekvensanalyse av Dobbeltsporet Ski–Moss (Sandbukta) (Oslo: Jernban-
everket Region Øst).JBV Utredning (2004) Utviklingen i persontrafikken på jernbanen. En analyse av årsakene til nedgangen i
trafikken i perioden 2000–2003 (Oslo: Jernbaneverket).Jernbaneverket (1997) Modernisering av Vestfoldbanen Jernbaneteknisk rammeplan for Vestfoldbanen. Sør
06.05.1997 (Oslo: Jernbaneverket region).Lindfeldt, O. (2001) Tidtabellkonstruktion, trafikledning och rättidighet på Svealandsbanan. Examensarbete
Nr. 01-57 (Stockholm: Kungl Tekniska Högskolan, Institutionen för infrastruktur och samhälsplan-ering).
Mackie, P. and Nellthorp, J. (2003) Transport appraisal in a policy context, in: A. Pearman, P. Mackieand J. Nellthorp (Eds) Transport Projects, Programmes and Policies, pp. 3–16 (Aldershot: Ashgate).
Mackie, P. and Preston, J. (1998) Twenty-one sources of error and bias in transport project appraisal,Transport Policy, 5(1), pp. 1–7.
Ministry of Transport and Communications (1991–92) Utbygging og finansiering av hovedflyplass forOslo-området på Gardermoen med tilhørende tilbringersystem og konsekvenser for Forsvaret. St. prp. No. 90(Oslo: Ministry of Transport and Communications).
Nash, C. (1992) Appraisal of railway projects, Project Appraisal, 7(4), pp. 211–218.NSB (1986) Dobbelsporet Ski–Moss. Report Utredningsoppdrag No. 112 (Oslo: NSB).NSB (1987) Tunga–Finse–Høgheller linjeomlegging Hovudplan (Bergen: NSB).NSB (1989) Modernisering av Vestfoldbanen Planutredning. Bruer IKB Prosjekt 89125-2 (Oslo: NSB).NSB (1991a) Gardermobanen Hovedrapport (Oslo: NSB).NSB (1991b) Bergensbanen Finse-Tunga, Gråskallen samfunnsøkonomiske beregninger (Bergen: NSB).NSB (1992) Modernisert Vestfoldbane Jernbaneutredning Hovedrapport (Oslo: NSB).Olsson, N. O. E. (2004) Flexibility in engineering projects: blessing or curse?, in: Proceedings of the
Nordnet International Project Management Conference, 29 September–2 October 2004, Helsinki,Finland.
Rietveld, P. and Nijkamp, P. (2000) Transport infrastructure and regional development, in: J. B. Polakand A. Hertje (Eds) Analytical Transport Economics, pp. 208–232 (Cheltenham: Edward Elgar).
Short, J. and Kopp, A. (2005) Transport infrastructure: investment and planning. Policy and researchaspects, Transport Policy, 12(4), pp. 360–367.
SIKA (2000) Uppföljning av investeringar. Report No. 2000:11 (Stockholm: SIKA). Available at: http://www.sika-institute.se/
Skamris, M. K. and Flyvbjerg, B. (1997) Inaccuracy of traffic forecasts and cost estimates on large trans-port projects, Transport Policy, 4(3), pp. 141–146.
Small, K. A. (1999) Project evaluation, in: J. Gomez-Ibanez, W. B. Tye and C. Winston (Eds) Essays inTransportation Economics and Policy, A Handbook in Honour of John R. Meyer, pp. 137–177 (Washington,DC: Brookings Institution).
Tyndall, G., Gopal, C., Partsch, W. and Kamauff, J. (1998) Supercharging Supply Chains: New Ways toIncrease Value Through Global Operational Excellence (New York, NY: Wiley).
Yin, R. K. (2003) Case Study Research: Design and Methods, 3rd edn (Thousand Oaks, CA: Sage).

Paper 6.
Henriksen, B., Olsson, N. & Seim, A. 2006. ‘Adjustments, effectiveness and efficiency in Norwegian hospital construction projects’. Proceedings CIB W70 Trondheim International Symposium. Changing User Demands on Buildings, 12–14 June 2006, Trondheim, Norway.

Adjustments, effectiveness and efficiency in Norwegian hospital construction projects
Bjørnar Henriksen, SINTEF Technology and Society ([email protected]), Nils Olsson, NTNU ([email protected]) and Andreas Seim, NTNU ([email protected])
ABSTRACT
This paper presents a case study focusing on process analysis as input to the design of new buildings at a Norwegian university hospital. The process analysis was also intended to spur organizational change. We study whether the process analysis provided the necessary input to the design of the hospital while also facilitating organizational development. As a framework, four key success factors in hospital projects are identified: efficiency, effectiveness, user involvement and flexibility. Separate sets of research material have been used. The most important information sources are project documentation and quantitative information such as statistics along with participating observation. The process analysis appears to have been torn between different output needs. Other ongoing activities may also have reduced the impact of the process analyses.
KEY WORDS: Process analysis, Hospitals; Project Management
INTRODUCTION
Large hospital construction projects are planned up to ten to twenty years ahead and face the challenge of providing buildings for equipment, technology, activities and patient care that may be radically different in the future. High uncertainty and changing prerequisites, technology and treatment methods create a need for flexibility.
In 1993, the Norwegian government gave the go-ahead for the plan to replace the old regional hospital in Trondheim with a new one. The project was divided into two phases. On 28th of May 2002 the parliament decided to build the university hospital at it’s current location based on the plans for Phase 1 of the building programme. The first phase of the construction of the new hospital in Trondheim is almost finished at the time of writing.
To obtain background information about capacity needs at the hospital, St Olavs Hospital chose to initiate an Organisational development project along the lines of Business Process Reengineering (BPR). The initiative of St Olavs was dubbed a process analysis project, and was influenced by a Scandinavian management tradition developed through the works of Trist and Bamforth (1951) and Emery and Thorsrud (1976), among others. In this tradition, user involvement is commonly regarded as a key success factor in projects involving organisational change. The process analysis at St Olavs Hospital had the dual purpose of spurring organizational change, efficient work processes as well as providing background data and material about future capacity of the hospital. Keeping in line with the terminology of this specific project, we use the term process analysis for the whole initiative. This differs from traditional BPR literature where process analysis refers to one step in a BPR initiative.

In this paper we use the process analysis of the second phase of the St Olavs Hospital project as a case study to address two research questions:
1. Did the process analysis provide the necessary input regarding future capacity needs for the new hospital buildings?
2. Did the process analysis facilitate user involvement and organisational development?
We discuss these two research questions in light of four key success factors in hospital construction projects: efficiency, effectiveness, flexibility and user involvement. A project’s ability to produce its immediate outcome can be measured in terms of efficiency. It is a question of doing things right and producing project outputs in terms of the agreed scope, quality, cost and time. Hence, it is a measure internal to the project and restricted to the project management or contractor’s perspective. The longer-term effects of the project can be measured in terms of effectiveness - or in other words doing the right things. In relation to the construction project, it is an external measure. Eikeland (2001) relates effectiveness to how the results of a project contribute to value added for owners and users.
Flexibility in a project can be associated with the project’s decision process or the final product. The intention with flexibility in the decision process is to be able to incorporate new needs and prerequisites throughout the project. Flexibility in the product means that the physical design of the hospital facilitates changes in type of activity and required capacity, as well as other changes which might require changes in physical structures.
PROCESS ANALYSIS IN HOSPITALS
Like other enterprises, health care organisations such as hospitals can be viewed as a number of processes organised in many different process-hierarchies. Each process-hierarchy in an organisation has a specific purpose, with clear objectives, goals and methods, and may also have many variants, depending on the enterprise’s needs to characterise, categorise and classify knowledge (Browne and Doumeingts 1997). In health care, patients, professionals as well as managers increasingly value aspects of processes as much as final clinical outcomes (Calnan and Ferlie 2003).
There are a number of different definitions and meanings of process. Badiru and Ayeni (1993) choose to define a process as “a collection of interrelated activities that are designed to generate specific outputs based on the application of specific inputs”. A process can consist of only one task or a number of tasks in sequence. Such tasks are characterised by that people, tools, materials, and environment act together to perform one or more operations which cause one or more characteristics of a product to be altered or generated (Badiru et al.1993). Another distinctive feature of a process is that it is indifferent to departments and functional areas in that it may spread across several or be contained within one specific department.
With the development from the traditional focus on departments towards process-oriented organisations, process analysis has emerged as a tool for gaining organisational insight and for improving the performance of the organisation. Process analysis typically involves both quantitative and qualitative techniques. Visual graphical representations of process data are particularly useful in process analysis as they allow for simultaneous representation of a large

number of dimensions and are useful in showing precedence, parallel processes and the passage of time (Langley, 1999).
Enterprises embarking on process analysis need to strike a balance between quantitative and qualitative techniques in their approach. Moreover, they must choose to what extent the process analysis will be “bottom-up” and “top-down”. Badiru et al. (1993) suggested that underlying processes must be improved bottom-up. Others, such as Henriksen and Myrbostad (2004) emphasised the importance of both leadership and employee involvement, suggesting that a combination of the two approaches may be appropriate in health care organisations and that it is necessary to evaluate to what extent one should focus on either in each specific case. Badiru et al.’s (1993) approach seems somewhat categorical, yet employee involvement is clearly important, as is leadership involvement. However, it is possible to have a committed and involved leadership even when resorting to a bottom-up approach. It seems both top-down and bottom-up approaches may be suitable for process analysis purposes in health care.
METHODOLOGY
This study is a case study based on trailing research (Finne et al. 1995). In the terminology of Yin (2003), this is a single case study. Separate sets of research material have been used, particularly a combination of personal qualitative experience and quantitative decision support information. The most important information sources are:
Project documentation and quantitative information Participating observation during the process analysis
Participating observation was carried out during the process analysis, as two of the authors were involved as facilitators. Being involved as facilitators provided insight to the preparations, execution and the following use of results. The combined role as facilitator and researcher of the same phenomenon has strengths and weaknesses. The authors’ involvement was separated in time, which provides an opportunity to reflect on each other’s experiences, without the bias of direct personal involvement.
As facilitators for process analysis, the authors had access to a wide range of documentation, including presentations and minutes of meetings, formal reports, data that provided input to prognoses, aggregated decision support data and other types of supporting information. All this information was stored in a database, primarily to support the facilitation of process analysis. The database has also served as a reference database during the research, enabling the researchers to validate later claims against documentation from each phase of the process analysis. Such an approach was particularly important as personal experiences may be subject to judgmental subjectivity.

PROCESS ANALYSIS IN THE PLANNING OF THE NEW ST. OLAVS HOSPITAL
The new hospital in Trondheim was originally planned according to a clinical centre model. Capacities and functions in each of the six clinical centres were planned based on ICD-10 diagnostic groups. Each centre was to a large extent meant to be self supporting in terms of clinical support resources and competence. The implementation of the project New St. Olavs hospital has been divided in to two planning and construction phases. Our experience is based on involvement in the process analysis for one centre in the second phase. Figure 1 illustrates different steps in a construction project such as the New St. Olavs hospital.
Figure 1. Generic steps in a construction project
The construction project together with the initiatives for organizational change and improvement were intended to give significant gains in productivity (including quality improvement), and the process analysis had goals to (Myrbostad 2003):
Ensure a good quantitative and qualitative basis for hospital activity, capacity and organisation, as input for design and construction Identify improvement potential in work processes. Start up the planning and implementation of possible actions independent of the new buildings. Establish interaction between employees in the hospital, primary health care and the patient organizations. Process analysis was also intended as a tool for future improvements.
In the St. Olav hospital project, important premises were expressed in a conceptual design document, HFP (the Norwegian acronym). HFP documented activities, capacities, functional content and operational principles of the new hospital. During the process analysis of the second phase of the project, the HFP were under revision and main elements of the framework were still not finalised. This means that the process analysis was to a large extent carried out in parallel with the development of the conceptual design.
Enterprise- / organi-zation modelling
Conceptual
Detailed design
Construction
Move in / use
”Early phase”, Goals Framework conditions

A project such as the new St. Olavs hospital has a need for specific and detailed knowledge of today’s activities and capacities, as well as possible avenues towards improving conditions for the future. Obtaining such knowledge requires involvement of employees and specialists from different levels and places in the organization. This argues for a bottom-up approach to creating an enterprise map and to identifying areas for improvement.
On the other hand there is also a need to make decisions and priorities that trigger the relevant changes and ensure that the project is working towards common goals. Moreover, construction projects of the size of the St Olavs project (200.000 m2) involve important discussions on policy and strategy regarding e.g. the distribution of resources, implying the need for elements of a top-down approach.
In the process analysis of each of the clinical centres at St Olavs Hospital, different approaches were used. Initially, process analysis was largely along the lines of a bottom-up approach, where individuals from the higher organizational levels in the centres were engaged mainly at the early and the latest stages (stage 1 and 5 in Figure 2).
Figure 2 illustrates the plan for process analyses. As we see there were intensive group-work sessions where employees and experts on the relevant patient groups or patient pathways were the main resources.
Figure 2. Process analyses bottom-up
2Group work(patientpathways)- Todays
processes and activities
- Resources- Bottlenecks
3Group work(patientpathways)- Opportunities- Constraints- Alternative
prosesses
5Priorityconference- Collocation- Prioritizing- Goal
achievement
4Group work(patientpathways)- New future
processes- Future activity- Changes- Requirements- Future
resources
1Modellingconference- Vision- Goals- Common
”processpicture”
The modelling conference was a session assembling both leadership and employees at different levels in the organization aiming to get a common overall picture of the processes in the centre. Ambitions and goals related to the process analyses, and to some extent training/guiding in process approach, is also a part of the modelling conference.
The stages 2-4 represent much of “the traditional” BPR activities and produces much of the facts/basis for decisions in the future project work. In this model, the priority conference is the most important arena for decision making regarding new and/or improved processes
Our case was one of the first process analyses in the second phase and represented important learning for everybody involved. In the process analyses in this particular centre there were continuous discussions regarding the HFP that was under revision. The consequence of this was that the HFP was not regarded as an absolute constraint. The HFP 2 is regarded as the

final framework for expected patient volume for each centre as well as allocation of space. In the working groups, focus was on activities, functions, functional proximity requirements, other requirements and number of patients in the future. The translation into area, rooms and concrete specifications was mainly an exercise done by the facilitators as a part of the reporting from each group.
Table 1 illustrates the consequences in number of patients and area for some functions described at different stages of the process analysis:
PA 1= Results from the group work PA 2= Results from the priority conference HFP 1= functional strategic program from 1999 HFP 2= the revised strategic functional program from 2003
The figures in table 1 are indexed to the HFP from 1999. The main variables that influenced need for room and area in the new hospital were number of patients, lay time and whether the patients needed beds or could be treated at daytime, e.g policlinic. In the process analysis group work, a key issue was to identify enablers for reduced lay time and alternative pathways. Despite this the group reports all concluded in need for area that exceeded the HFP 1 by more than 78%. This was mainly caused by an increased estimate of number of future patients.
Table 1: Patients and needs for some functions expressed in the process analysis Number of patients Area
Functions
HFP1
PA1
PA2
HFP2 HFP
1PA1
PA2
HFP2
Beds 100 245 233 158 100 178 202 162 Day treatment 100 344 198 183 100 319 184 142 Policlinical rooms 100 211 92 220 100 - - 134
The priority conference represented an important arena for decisions regarding future activity in the hospital. The people involved has to focus on common goal and not only focus on own (short term) interests. There was naturally a need for facts and information of high quality from the earlier stages in the project (e.g the group reports).
As we see from Table 1, there was a reduction in need for beds and rooms during the priority conference despite an upward adjustment of the number of patients. This reduction was mainly a result of working with variables such as lay time and daytime treatment.
During this latter phase of the process analyses the revised HFP (HFP 2, from 2003) was presented. It represented a considerable upward adjustment of the number of patients and area compared to the previous HFP. Figure 3 illustrates that the conceptual design (HFP) were done in parallel to the process analysis. If we just study the number of beds and patients (hospitalization) we see that the number of patients increased by 58% in the revised HFP, but was still only 68% of the estimations from the priority conference. The priority conference was some extent was an arena for policy and strategy making, because both leadership and

employees at different levels in the organization were gathered. However, the conference was not intended as an arena for building consensus on quantifications of future hospital capacity.
Figure 3. Relation between conceptual design, process analysis, organisational development and the design of the hospital
Processanalysis
Buildingdesign
Organisationaldevelopment
Conceptualdesign (HFP)
The process analysis appears torn by different output needs. With reference to Figure 3, the process analysis should provide input to both building design and organisational development. To provide fruitful input to building design, results from process analysis were often too general. Efforts had to be made to quantify the output, using experience data and prognoses. As the results from process analysis were formatted to provide relevant input to the building design, they appear to have become less suitable to serve as a basis for organisational development. Finally, results from process analysis lost some of its edge when the conceptual design (HFP) were developed in parallel. Moreover, the HFP2 provided a more definitive output in terms of available area, standards and similar parameters.
CONCLUDING DISCUSSION
In this paper we discussed how the process analysis contributed to four key success factors in hospital projects: efficiency, effectiveness, user involvement and flexibility. The first research question was related to what extent the process analysis provided the necessary input to the hospital design. The second research question addressed to what extent process analysis facilitated user involvement and organisational development.
The process analysis should provide input to both building design and organisational development. Regarding input to building design, the conceptual design (HFP) delivered a more definitive output than the process analyse.
The process analysis did achieve user involvement. However, the experiences from the bottom-up approach pointed to the need to establish a strategic framework for the analysis.

User involvement also generated expectations. All desired features and volume of the new hospital building was not possible to combine within the allocated recourses. As a result of this the process analyses of the second phase had more elements of a top-down approach with more intensive involvement of leadership in the first steps to define goals, priorities etc, and an emphasis on providing more facts when starting the group work. The group work was also more focused due to a more defined mandate owing to focus on critical aspects and processes.
The learning curve for all parts involved in the process analyses in phase 2 was quite steep. One insight was that there was need of more defined direction, priorities and goals in the early steps of the process analyses. This also includes consensus related to facts and definitions such as in the HFP.
The transfer from analysis to decision making proved challenging for two reasons: Firstly, user involvement also generated user expectations. Secondly, the decision process required a higher level of detail, while the process analysis by nature was more conceptual. On a conceptual level, most stakeholders could agree on desirable solutions. As the level of detail increased, so did the awareness of different group interests. The pressure to summarise process analysis results into straight forward decision supporting facts was related to project efficiency. The design and construction project needed clarifications to be able to continue. Lack of clarifications meant delays and increased project-related costs. Project efficiency is a key issue when explaining why the process analysis was carried out as it was.
An overall objective of the process analysis was effectiveness in terms of a suitable future hospital building. One aspect of effectiveness of a hospital building project is the cost and quality level of the operation in the new building (the processes within a new hospital). The same cost and quality measures will be related to efficiency of the hospital, when the new buildings are taken into use. In other words, the efficiency in the hospital (once it is built and taken into use) is one dimension of effectiveness of the construction.
Effectiveness in the future hospital was measured and interpreted in many ways by the different involved stakeholders. Future cost of operation was one aspect. Ability to accommodate future patient volumes was another key issue. Suitable working conditions for hospital staff was yet a concern. Given the long time frame and present rate of change in health care, flexibility is another aspect of effectiveness in hospital buildings. Regarding flexibility, our experience is that extensive user involvement does not necessarily ensure future flexibility. Especially in the “locking phase” when the results from the process analysis were converted to hard facts for decision support, the reference point to most stakeholders was the present situation; do we get more or less than we have now; are present trends taken into consideration?
ACKNOWLEDGEMENTS
The authors want to thank Asmund Myrbostad for valuable discussions related to the paper.

REFERENCES
Badiru, A. B. and Ayeni, B.J. (1993). Practitioner's Guide to Quality and Process Improvement. London, Chapman & Hall
van der Bij, J. D., Dijkstra, L., de Vries, G. and Walburg, J. (1999). "Improvement and renewal of healthcare processes: results of an empirical research project." Health Policy48(2): 135-52.
Browne, J. and Doumeingts, G. (1997). “Modelling techniques for business process re-engineering and benchmarking”: IFIP TC5 WG5.7 International Workshop on Modelling Techniques for Business Process Re-engineering and Benchmarking, 18-19 April 96, Bordeaux, France. London, Published by Chapman & Hall on behalf of the International Federation for Information Processing.
Calnan, M. and Ferlie, E. (2003). "Analysing process in healthcare: the methodological and theoretical challenges." Policy and Politics 31(2): 185-193.
Eikeland, P.T. (2000). Teoretisk Analyse av Byggeprosesser, Samspill i byggeprosessen, prosjektnr. 10602 (In Norwegian)
Emery, F. and Thorsrud, E. (1976) Democracy at work, The Report of the Norwegian Industrial Democracy Program. Leiden: Martinius Nijhoff Social Sciences Division
Felles Utviklingsenhet ”Nytt universitetssykehus i Trondheim”: Reviderthovedfunksjonsprogram. http://www.sykehusplan.no/
Finne, H., Levin, M. and Nilsen T. (1995). ”Trailing research A model for useful program evaluation”, IFIM-paper 4/95, Trondheim: SINTEF IFIM
Henriksen, B. and Myrbostad, A. (2004) “Prosessanalyser i sykehus”. Prosjektledelse Nr 1-2004
Myrbostad, A. (2003) Bruk av prosessanalyser i sykehusplanlegging. HMT-Helse/Medisin/Teknikk. Nr 5-2003
Sør-Trøndelag Flykeskommune (1991) Utviklingsplan for regionsykehuset I Trondheim, Forprosjekt, premisser – hovedlinjer –prinsipper, November 1991
Trist, E. and Bamforth, K.W. (1951) ”Some Consequences of the Longwall Method of Coal Getting”, Human Relations, 4(1): 3-33
Yin, R.K., 2003b. Applications of Case Study Research, 2nd edition, Sage Publications

Paper 7.
Olsson, N.O.E. & Samset, K. 2006. ‘Front-End Management, Flexibility and Project Success’. Paper presented at PMI Conference, 17-19 July 2006, Montreal, Canada.
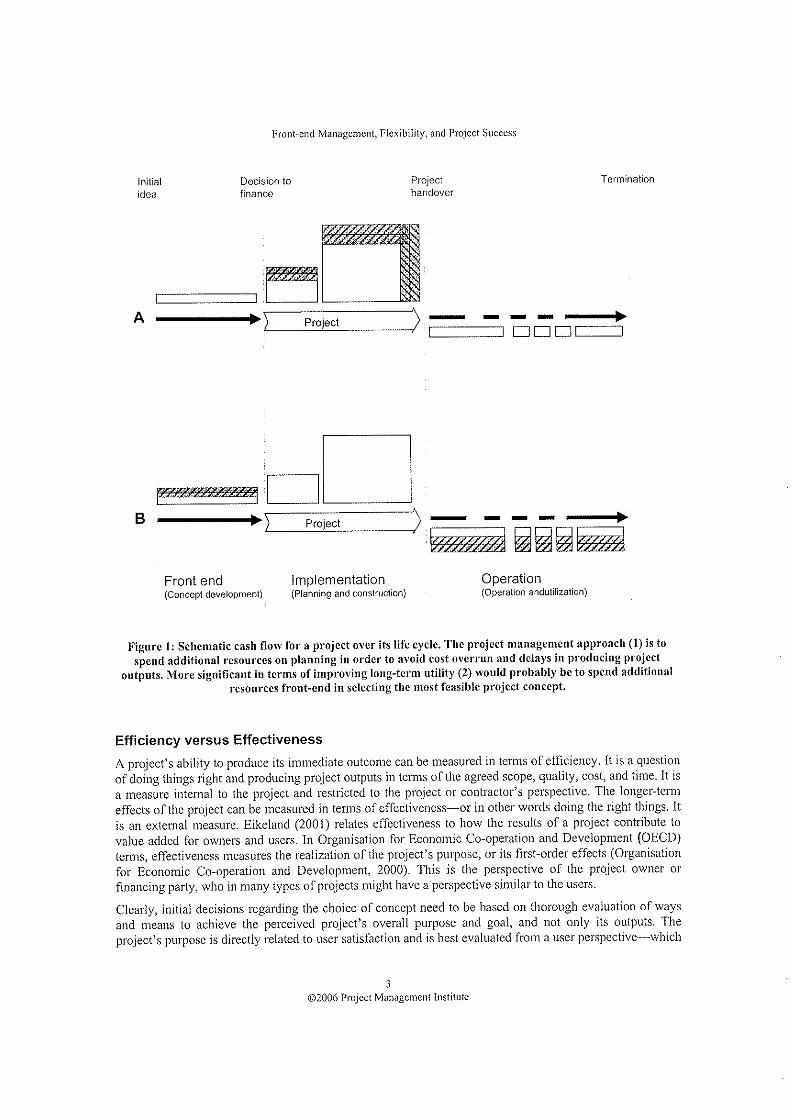


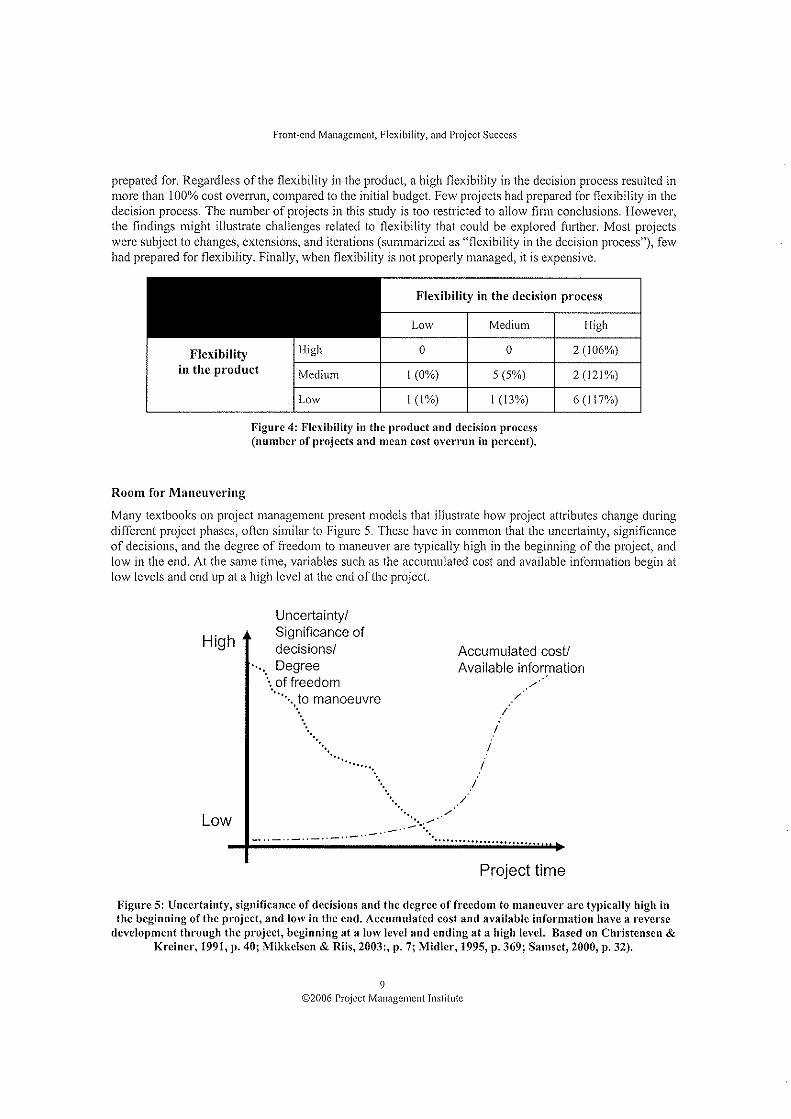


Paper 8.
Olsson, N.O.E. 2006.‘Flexibility and Front-End Management; Key to Project Success and failure’ Paper accepted for presentation by ProMAC International Conference on Project Management, 27-29 September 2006, Sydney, Australia.

Project flexibility and front-end management: Keys to project success and failure
Olsson N O E Norwegian University of Science and Technology, Trondheim, Norway
AbstractProject flexibility means a capability to adapt to new, different or changing requirements. The paper proposes a framework for understanding project flexibility. The framework for analysis consists of project flexibility categorisations, perspectives of analysis, flexibility drivers and enablers. The proposed framework can serve at least two purposes. First, it can work as a checklist for aspects that are to be included in an analysis of project flexibility. Such analyses may be carried out as a part of ex-ante project preparations, ex-post project evaluations or during projects. Second, the relation between different aspects in the framework can be analysed to gain an understanding of interaction between the aspects.
1. Focused and flexible - a project management dilemma Traditionally, projects tend to strive for increased predictability and robustness, by managing details and attempting to bring all variables under control. However, experience shows that the chance of realizing a plan without major amendments decreases with increasing time horizon, which point to a need for flexibility, or adaptability. A key message in this paper is that successful projects are characterized by a firm and realistic strategy in combination with sufficient tactical flexibility. Strategy and tactical flexibility need to be carefully addressed in front-end management of projects.
Project flexibility is part of a fundamental dilemma in project management. On one hand, projects need stability and control to be executed efficiently, typically measured by time, cost and meeting specifications. In this perspective, flexibility shall be minimized. On the other hand, important decisions in projects must be taken based on limited information in an unpredictable world, creating a need for flexibility options.
The results presented in the paper are based on a diverse sample of large public investment projects. Several different information sources have been used and analysed, including both quantitative and qualitative information. The main data set used in this paper covers 18 Norwegian large engineering projects, which have been analyzed regarding project flexibility.
The paper proposes a framework for understanding project flexibility. Like previous researchers, this research has documented that the potential drawbacks of flexibility, both on efficiency and effectiveness, are substantial. However, the main drawback of project flexibility that has been observed in our research is not flexibility itself, but flexibility applications in projects that lacked structure and preparation for flexibility. This indicates that if a structural framework for a project is established, flexibility options could be utilised without destabilising the project organisation.
2. Project flexibility According to the Merriam-Webster dictionary, being flexible is “characterised by a ready capability to adapt to new, different or changing requirements". This means that project flexibility includes preparations to manage both internal and contextual uncertainty, such as: scope change management, iterative decision process, adjustments related to uncertain funding in general and budget reserves in particular. This paper does not aim at covering the issue of uncertainty in a broad perspective. However, the distinction between the two types of uncertainty that Karlsen [1] and Christensen & Kreiner [2], among others, discuss has implications on the analysis of project flexibility. This paper will use the terms contextual uncertainty and internal uncertainty. Internal uncertainty is related to operational uncertainty [2] or task uncertainty [1].
Real options represent one approach to project flexibility [3], [4]. Real options illustrate the value of flexibility based on theory related to financial options. Flexibility is compared to owning an option - the right, but not the obligation to take an action in the future [3].
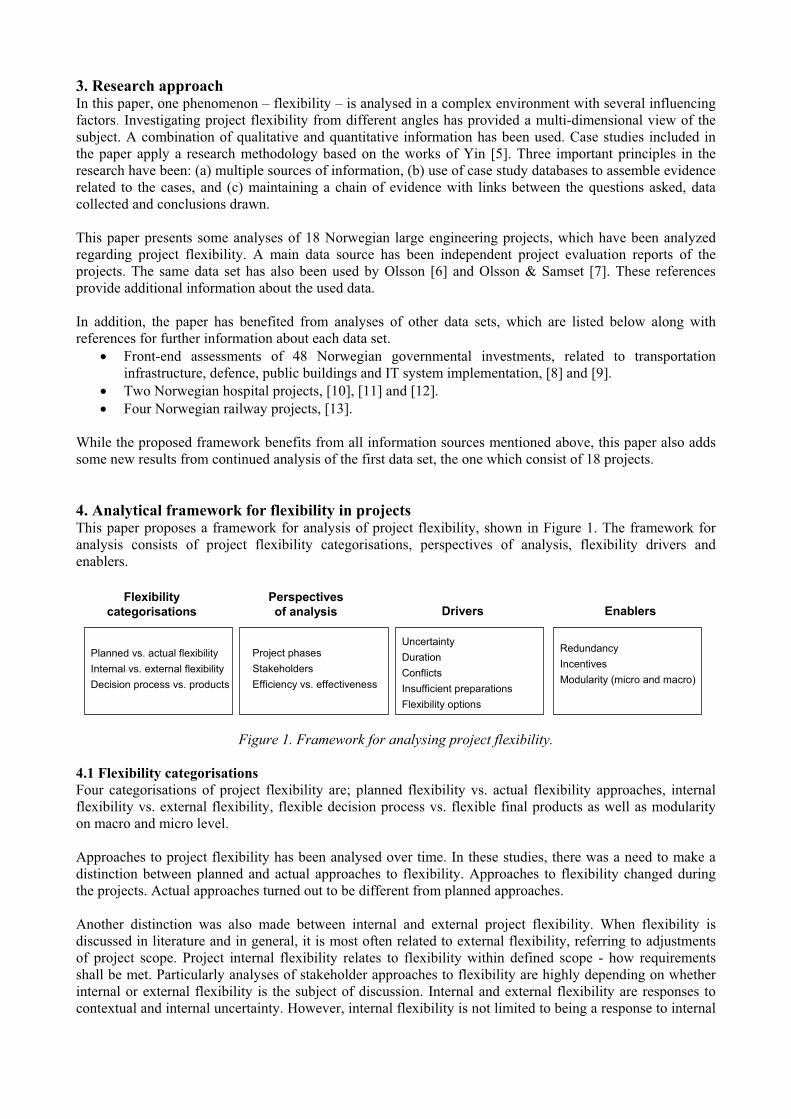
3. Research approach In this paper, one phenomenon – flexibility – is analysed in a complex environment with several influencing factors. Investigating project flexibility from different angles has provided a multi-dimensional view of the subject. A combination of qualitative and quantitative information has been used. Case studies included in the paper apply a research methodology based on the works of Yin [5]. Three important principles in the research have been: (a) multiple sources of information, (b) use of case study databases to assemble evidence related to the cases, and (c) maintaining a chain of evidence with links between the questions asked, data collected and conclusions drawn.
This paper presents some analyses of 18 Norwegian large engineering projects, which have been analyzed regarding project flexibility. A main data source has been independent project evaluation reports of the projects. The same data set has also been used by Olsson [6] and Olsson & Samset [7]. These references provide additional information about the used data.
In addition, the paper has benefited from analyses of other data sets, which are listed below along with references for further information about each data set.
Front-end assessments of 48 Norwegian governmental investments, related to transportation infrastructure, defence, public buildings and IT system implementation, [8] and [9]. Two Norwegian hospital projects, [10], [11] and [12]. Four Norwegian railway projects, [13].
While the proposed framework benefits from all information sources mentioned above, this paper also adds some new results from continued analysis of the first data set, the one which consist of 18 projects.
4. Analytical framework for flexibility in projects This paper proposes a framework for analysis of project flexibility, shown in Figure 1. The framework for analysis consists of project flexibility categorisations, perspectives of analysis, flexibility drivers and enablers.
Flexibilitycategorisations
Planned vs. actual flexibilityInternal vs. external flexibilityDecision process vs. products
Enablers
RedundancyIncentivesModularity (micro and macro)
Project phasesStakeholdersEfficiency vs. effectiveness
Perspectivesof analysis Drivers
UncertaintyDurationConflictsInsufficient preparationsFlexibility options
Figure 1. Framework for analysing project flexibility.
4.1 Flexibility categorisations Four categorisations of project flexibility are; planned flexibility vs. actual flexibility approaches, internal flexibility vs. external flexibility, flexible decision process vs. flexible final products as well as modularity on macro and micro level.
Approaches to project flexibility has been analysed over time. In these studies, there was a need to make a distinction between planned and actual approaches to flexibility. Approaches to flexibility changed during the projects. Actual approaches turned out to be different from planned approaches.
Another distinction was also made between internal and external project flexibility. When flexibility is discussed in literature and in general, it is most often related to external flexibility, referring to adjustments of project scope. Project internal flexibility relates to flexibility within defined scope - how requirements shall be met. Particularly analyses of stakeholder approaches to flexibility are highly depending on whether internal or external flexibility is the subject of discussion. Internal and external flexibility are responses to contextual and internal uncertainty. However, internal flexibility is not limited to being a response to internal

uncertainty. External flexibility can be a response to contextual uncertainty, but all combinations of internal and external flexibility versus internal and contextual uncertainty can be found.
Project flexibility was divided into flexibility in the decision process and the product. Flexibility in the decision process is based on an approach where decisions and commitments in the projects are made sequentially over episodes. The use of decision gate models provides a successive commitment to a project, as shown by Eskerod & Östergren [14]. Flexibility in the product means that the design of the final product (what the project shall produce) has taken into consideration possible future changes in use or requirements.
4.2 Perspectives of analysis Project flexibility is seen from the perspective of different stakeholders, in different project phases and related to efficiency and effectiveness.
The flexibility for one project stakeholder can be another's risk. According to McElroy & Mills [15], project stakeholders are persons or groups of people who have a vested interest in the success of a project and the environment within which the project operates. In a study of large engineering projects, Olander & Landin [16] found that it is important for a project management team to identify stakeholders that can affect a project, and then manage their differing demands throughout the project stages. Stakeholders may be organisations or individuals.
Project flexibility can be studied from both efficiency and effectiveness perspectives. A case in favour of flexibility emphasise the possibility to increase a project’s effectiveness. Effectiveness is primarily addressed by external flexibility. Project scope is adjusted to utilise benefit opportunities. Regarding efficiency, such adjustment of project scope typically causes change costs. The net effect come form a balance between the values of benefit opportunities and incurred change cost.
4.3 Project flexibility drivers In this context, drivers are factors that create needs or pressure on projects to be flexible. Uncertainty is the key driver for project flexibility, and arguable the only one. The other drivers mentioned below are in fact only highlights of selected types of uncertainty. In this paper uncertainty is defined as a gap between the amount of information needed to make a decision the amount of information available (based on Galbraith [17]). In order to manage this information gap, flexibility is primarily a way of reducing the amount of information needed. Other project management approaches may focus on increasing the available amount of information.
The longer duration a project has, the more likely it is that some pre-requisites are not longer valid. Long duration is likely to result in more or less suppressed need for scope changes. Both cost and demand estimates are more uncertain the longer the time perspective is. What is “long” duration is highly depending of the type of project. Experiences from previous projects of the same type provide indications of for how long prerequisites are likely to stay stable enough.
Flexible projects can contribute to conflict solutions. However, conflicts that arise during the preparation or execution of a project have also created a need for projects to be flexible, as a response to conflicts. Project flexibility can also be an issue of conflict. Stakeholders who benefit from the initial decisions are less likely to favour a continued flexible decision process. Flexible decision processes are likely to be valued by those who do not prefer an initial decision. In this way, availability of flexibility options and redundant resources can serve as an invitation to adjustments.
4.4 Project flexibility enablers This paper refers to ‘enablers’ as factors that contribute to making it possible for projects to be flexible. Sager [18] presents redundancy as an enabler for flexibility. According to Landau [19], redundancy is created by repetition, duplication and overlap. Galbraith [17] points out that slack resources constitute an additional cost to an organisation. In a project perspective, redundancy can be applied for flexibility in both the product and decision process. Flexibility in the product may be achieved by over-specification of future functionality. A flexible decision process calls for redundant recourses and time to perform analyses of alternative project concepts. The rationality behind the use of redundancy is that this use of resources is cost effective compared to later major changes.
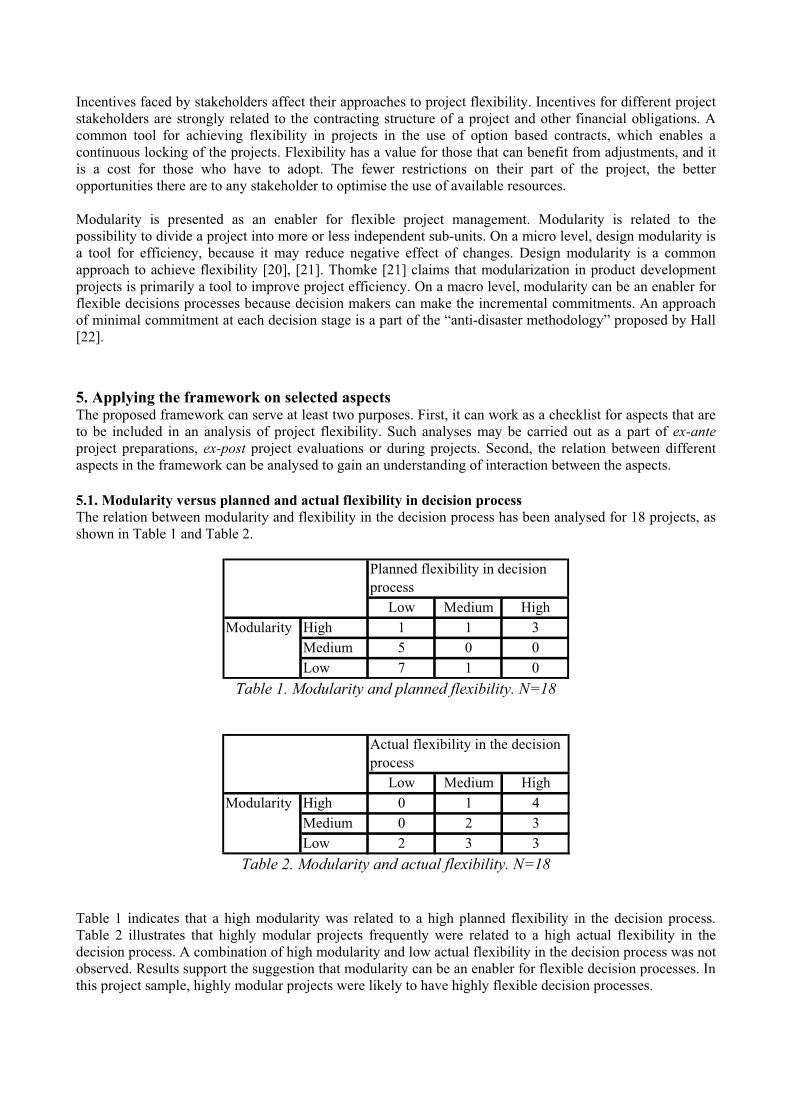
Incentives faced by stakeholders affect their approaches to project flexibility. Incentives for different project stakeholders are strongly related to the contracting structure of a project and other financial obligations. A common tool for achieving flexibility in projects in the use of option based contracts, which enables a continuous locking of the projects. Flexibility has a value for those that can benefit from adjustments, and it is a cost for those who have to adopt. The fewer restrictions on their part of the project, the better opportunities there are to any stakeholder to optimise the use of available resources.
Modularity is presented as an enabler for flexible project management. Modularity is related to the possibility to divide a project into more or less independent sub-units. On a micro level, design modularity is a tool for efficiency, because it may reduce negative effect of changes. Design modularity is a common approach to achieve flexibility [20], [21]. Thomke [21] claims that modularization in product development projects is primarily a tool to improve project efficiency. On a macro level, modularity can be an enabler for flexible decisions processes because decision makers can make the incremental commitments. An approach of minimal commitment at each decision stage is a part of the “anti-disaster methodology” proposed by Hall [22].
5. Applying the framework on selected aspects The proposed framework can serve at least two purposes. First, it can work as a checklist for aspects that are to be included in an analysis of project flexibility. Such analyses may be carried out as a part of ex-anteproject preparations, ex-post project evaluations or during projects. Second, the relation between different aspects in the framework can be analysed to gain an understanding of interaction between the aspects.
5.1. Modularity versus planned and actual flexibility in decision process The relation between modularity and flexibility in the decision process has been analysed for 18 projects, as shown in Table 1 and Table 2.
Low Medium HighHigh 1 1 3Medium 5 0 0Low 7 1 0
Planned flexibility in decision process
Modularity
Table 1. Modularity and planned flexibility. N=18
Low Medium HighHigh 0 1 4Medium 0 2 3Low 2 3 3
Modularity
Actual flexibility in the decision process
Table 2. Modularity and actual flexibility. N=18
Table 1 indicates that a high modularity was related to a high planned flexibility in the decision process. Table 2 illustrates that highly modular projects frequently were related to a high actual flexibility in the decision process. A combination of high modularity and low actual flexibility in the decision process was not observed. Results support the suggestion that modularity can be an enabler for flexible decision processes. In this project sample, highly modular projects were likely to have highly flexible decision processes.
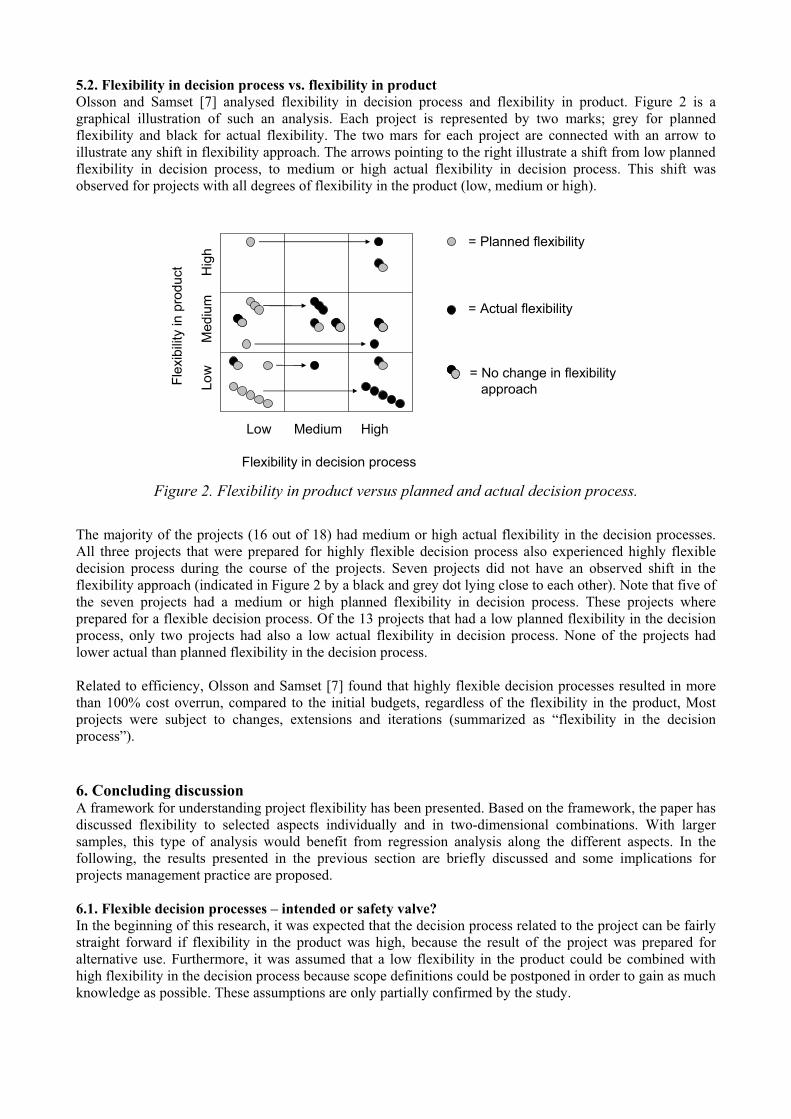
5.2. Flexibility in decision process vs. flexibility in product Olsson and Samset [7] analysed flexibility in decision process and flexibility in product. Figure 2 is a graphical illustration of such an analysis. Each project is represented by two marks; grey for planned flexibility and black for actual flexibility. The two mars for each project are connected with an arrow to illustrate any shift in flexibility approach. The arrows pointing to the right illustrate a shift from low planned flexibility in decision process, to medium or high actual flexibility in decision process. This shift was observed for projects with all degrees of flexibility in the product (low, medium or high).
Flexibility in decision process
Low Medium High
Low
Med
ium
H
igh
Flex
ibili
tyin
pro
duct
= Planned flexibility
= Actual flexibility
= No change in flexibilityapproach
Figure 2. Flexibility in product versus planned and actual decision process.
The majority of the projects (16 out of 18) had medium or high actual flexibility in the decision processes. All three projects that were prepared for highly flexible decision process also experienced highly flexible decision process during the course of the projects. Seven projects did not have an observed shift in the flexibility approach (indicated in Figure 2 by a black and grey dot lying close to each other). Note that five of the seven projects had a medium or high planned flexibility in decision process. These projects where prepared for a flexible decision process. Of the 13 projects that had a low planned flexibility in the decision process, only two projects had also a low actual flexibility in decision process. None of the projects had lower actual than planned flexibility in the decision process.
Related to efficiency, Olsson and Samset [7] found that highly flexible decision processes resulted in more than 100% cost overrun, compared to the initial budgets, regardless of the flexibility in the product, Most projects were subject to changes, extensions and iterations (summarized as “flexibility in the decision process”).
6. Concluding discussion A framework for understanding project flexibility has been presented. Based on the framework, the paper has discussed flexibility to selected aspects individually and in two-dimensional combinations. With larger samples, this type of analysis would benefit from regression analysis along the different aspects. In the following, the results presented in the previous section are briefly discussed and some implications for projects management practice are proposed.
6.1. Flexible decision processes – intended or safety valve? In the beginning of this research, it was expected that the decision process related to the project can be fairly straight forward if flexibility in the product was high, because the result of the project was prepared for alternative use. Furthermore, it was assumed that a low flexibility in the product could be combined with high flexibility in the decision process because scope definitions could be postponed in order to gain as much knowledge as possible. These assumptions are only partially confirmed by the study.
Two explanations are proposed to this result: 1. If there are possibilities for flexible decision processes, they are highly likely to be utilised 2. Flexible decision processes can always be applied in response to unforeseen events
Regarding the first alternative explanation, possibilities for flexible decision processes may come from planned flexible decision processes. There are indications that flexible product designs also serve as enablers for flexible decision processes, not a substitute for.
The second alternative explanation means that even though it comes at a cost, and frequently at a high cost, plans can be changed. While the degree of flexibility in the product generally must be established at an early stage in a project, a flexible decision process may either be indented or ad hoc. Flexibility in the product is to a large extent an attribute that is designed into a delivery in the front-end of a project. On the other hand, a highly flexible decision process can be achieved even if it not prepared for. It may therefore work as a kind of “security valve” for unforeseen development. This is similar to Galbraith’s [17] notion that if a firm fails to actively create other strategies to address uncertainty, a slack resources strategy will occur by default.
Even if Figure 2 indicates that projects are likely to apply both flexible product designs as well as flexible decision processes, the two dimensions of flexibility are of a different nature. This distinction can be valuable to have in mind when preparing a project.
6.2. Flexibility preparations Several of the projects in Figure 2 experienced a shift from low to medium or high actual flexibility in the decision process. Projects frequently need to be more flexible than they have prepared for. This means that projects either cannot isolate themselves from contextual uncertainty in order to avoid iterations and changes, or have not mange to prepare for proper flexibility. As a response to uncertainty, projects can either isolate themselves in order to execute the defined task efficiently, or prepare the project to manage flexibility. A third, often unintended strategy occurs when projects plan for isolation, but cannot maintain the isolation. Projects are then forced to be more flexible than they have prepared for. Both of the first mentioned strategies have advantages and disadvantages. The research that this paper is based on indicates that this third strategy (“plan for isolation – experience forced flexibility”) mainly is has disadvantages. The choices of flexibility strategy are to a large extent made during the front-end phase. This discussion points to both project flexibility and project front-end as key success factors for projects.
One indication from the analyses is that project flexibility requires a structure. In the referred studies, the potential drawbacks of flexible projects are substantial both on efficiency and effectiveness. It has also been shown that the drawbacks are the largest when projects did not prepare for flexibility. To avoid cost overruns, but also to obtain desirable benefit from a project, it is advised that flexible decisions are supported by a structural framework of strategies and guidelines. Such framework is preferably established in the front-end of projects. Related to the framework proposed in Figure 1, this means that the flexibility drivers shall be identified in order to judge the need, or likelihood, for flexibility.
The enablers proposed in Figure 1 are key elements in a structural framework for project flexibility. Figure 3 shows how one of these enablers; redundancy, can be seen in relation to either prepared for isolation and thus to avoid changes, or to prepare to manage changes. In Figure 3, ‘precision’ is used to indicate low redundancy and ‘slack’ to indicate high redundancy.

Slack Precision
Avoidchanges
Managechanges
Capacity to handle changes
Flexibility in product or decision process
Hedge areas of expected changes
Agreement on scope
Degree of redundancy
Cha
nge
man
agem
ents
trat
egy
Figure 3. Flexibility strategies in relation to redundancy and change management.
Changes can be avoided by having slack resources in a project. Redundancy can be achieved by over-specification of future functionality, so that future needs may be met without physical changes. Such needs may emerge during the project execution, or after the project has been delivered. Redundancy can also enable front-end analyses of alternative project concepts, which require recourses and time but may avoid later changes.
Changes can also be avoided by precision in the project preparations, thus reducing the need for slack. Aiming at a clear agreement on scope represents a traditional project management approach – to zoom in on project scope and then execute. After establishing the scope, project management aims at minimising external flexibility.
Changes can be managed if there is slack in a project organisation. High redundancy indicates a general capacity to manage a wide range of changes. Such slack can include budget reserves, time slack in plans and organisation capacity to manage changes. On average, this increases project cost. However, it may still prove cost effective if the alternative is that the project will face changes which it does not have the resources to manage.
Finally, changes can be managed even with low redundancy, but it requires precision. In the process of locking specifications, certain parts are locked later than others. Low redundancy requires an ability to identify and hedge areas exposed to changes. The late locking items must therefore be well defined and of a limited relative size.
6.3. Flexibility options as flexibility drivers In the framework proposed in Figure 1, flexibility options where listed as flexibility drivers. This is supported by the discussion above. Of the studied projects, projects with a high planned flexibility in the decision process also had a high actual flexibility in the decision process. Availability of flexibility options and redundant resources can serve as an invitation to adjustments. If there are possibilities for adjustments and iterations, it is likely that flexibility options will be utilised. This means that the presence (or knowledge) of flexibility enablers can work as a flexibility driver.
6.4. Front-end as a key phase Flexible the front-end phases are the least controversial aspect of project flexibility. This is particularly related to external flexibility. Results presented in [7] indicates that minimizing external flexibility after the front-end phase increases the likelihood to deliver projects on time and budget and according to specifications. One objective of front-end management is to provide a well defined framework for efficient project implementation, including the identification of flexibility drivers, and appropriate introduction of flexibility enablers.

References
[1] Karlsen, J. T, (1998), Mestring av omgivelsesusikkerhet Ph.D. Thesis, the Norwegian University of Science and Technology.
[2] Christensen, S. & Kreiner, K. 1991. Prosjektledelse under usikkerhet. [Project Management under Uncertainty.] Universitetsforlaget, Oslo.
[3] Amram, M. & Kulatlaka, N. 1999. Real Options: Managing Strategic Investment in an Uncertain World. Financial Management Association Survey and Synthesis Series, Harvard Business School Press, Boston.
[4] Brennan, M.L. & Trigeorgis, L. 2000. Project Flexibility, Agency, and Competition: New Developments in the Theory and Application of Real Options. Oxford University Press, New York.
[5] Yin, R.K., 2003a. Case Study Research: Design and Methods, 3rd edition, Sage Publications. [6] Olsson, N.O.E. 2006. Management of flexibility in projects. International Journal of Project
Management 24:1, 66–74. [7] Olsson, N.O.E. & Samset, K. 2006. ‘Front-End Management, Flexibility and Project Success’. Paper
accepted for presentation at PMI Conference, 17-19 July 2006, Montreal, Canada.[8] Magnussen, O.M. & Olsson, N.O.E. 2006. Comparative analysis of cost estimates of major public
investment projects. International Journal of Project Management 24:4, 281–288. [9] Olsson, N.O.E. & Magnussen, O.M. 2006. ‘Projects trapped in their freedom: Flexibility aspects of
front-end quality assurance of major projects’. Paper submitted to Project Management Journal. [10] Henriksen, B., Olsson, N. & Seim, A. 2006. ‘Adjustments, effectiveness and efficiency in
Norwegian hospital construction projects’. Paper accepted for presentation at CIB W70 Trondheim International Symposium on Changing User Demands on Buildings, 12–14 June 2006, Trondheim, Norway.
[11] Løken, A. 2005. Endringshåndtering i prosjekt Nytt Rikshospital. [Change management in hospital development projects.] Project report. Norwegian University of Science and Technology, Trondheim.
[12] Bergsland, K. (2004) ’Nytt Rikshospital tre år etter – Hva har nytt bygg betydd for driften?’, SINTEF Unimed, Trondheim, Norway.
[13] Olsson, N.O.E. 2006. ‘Impact analysis of railway projects in a flexibility perspective’. Accepted for publication in Transport Reviews.
[14] Eskerod, P. & Östergren, K. 2000. Why do companies standardize projects work? ProjectManagement 6:1, 34–39.
[15] McElroy, B. & Mills, C. 2000. Managing stakeholders. In: Turner, R.J. & Simister, S.J. (eds.) Gower Handbook of Project Management. Gower, Aldershot.
[16] Olander, S. & Landin, A. 2005. Evaluation of stakeholder influence in the implementation of construction projects. International Journal of Project Management 23:4, 321–328.
[17] Galbraith, J.R. 1973. Designing Complex Organizations. Adison-Wesley, Reading, MA. [18] Sager, T. 1994. Communicative Planning Theory. Ashgate Publishing Company, Brookfield,
Vermont. [19] Landau, M. 1969. Redundancy, rationality and the problem of duplication and overlap Public
Administration Review 29:July-August, 346–358. [20] Hellström, M. & Wikström, K. 2005. Project business concepts based on modularity – Improved
maneuverability through unstable structures. International Journal of Project Management 23:5, 392–397.
[21] Thomke, S.H. 1997. The role of flexibility in the development of new products: An empirical study. Research Policy 26:1, 105–119.
[22] Hall, P. 1980. Great Planning Disasters. Weidenfeld and Nicolson, London.