Embed Size (px)
Citation preview
8/20/2019 Project Planning and Scheduling Using Pert and Cpm Techniques With Linear Programming Case Study
http://slidepdf.com/reader/full/project-planning-and-scheduling-using-pert-and-cpm-techniques-with-linear-programming 1/6
INTERNATIONAL JOURNAL OF SCIENTIFIC & TECHNOLOGY RESEARCH VOLUME 4, ISSUE 08, AUGUST 2015 ISSN 2277-8616
222IJSTR©2015www.ijstr.org
Project Planning And Scheduling Using PERTAnd CPM Techniques With Linear Programming:
Case StudyWallace Agyei
Abstract: Completing a project on time and within budget is not an easy task. Project planning and scheduling plays a central role in predicting both thetime and cost aspects of a project. This study is aimed at finding trade-off between the cost and minimum expected time that will be required to completethe building project. The data on the cost and duration of activities involved were obtained Angel Estates and Construction Ltd., a construction companybased in Ashanti region, Ghana. Both critical path method (CPM) and project evaluation and review technique (PERT) were used for the analysis. Theactivities underwent crashing of both the time and cost using linear programming, this paved way for the determination of critical path. Further analysisrevealed that the shortest possible time for the completion of the analyzed building project is 40 days instead of the expected duration of 79 days. Thismeans that through proper scheduling of activities, the expected completion time was reduced by 39 days. The additional cost associated with thereduction in timing is GH¢1,887.22 which increases the initial expected cost required to complete the project from GH¢57,156.35 to GH¢59,043.57.
Keywords: Construction planning, Critical Path Method, Project Evaluation and Review Technique, Linear programming, crashing. ————————————————————
1. INTRODUCTION
Completing a project on time and within budget is not aneasy task. In spite of advances in the field of projectmanagement today, most projects in Ghana today face costand time over-runs which increases with the increase incomplexity of the project involved. A large number of factorscontribute to delays that comprise primarily of contractordelays, client delays, consultant delays, labor related delaysand various other external delays. These delays in long runcauses time overrun, cost overrun, dispute, arbitration, totalabandonment and litigation. This is because some projectactivities are critical in the sense that delay in theircommencement will delay the overall project completiontime. Therefore proper planning and scheduling of project isimportant to overcome this problem. A project can be
defined as a set of a large number of activities or jobs thatare performed in a certain sequence determined logically ortechnologically and it has to be completed within a specifiedtime and cost whilst meeting the performance standards.The project could be the development of a softwareprogram, the building of a house or an office building,development of a new drug, a marketing campaign for anew product, and many others. Network models areconventional means of finding the most skilful way to link anumber of activities directly or indirectly in order to satisfysupply and demand requirements at different activitylocations and project scheduling. For many years, twoapproaches that have been proven to be useful forplanning, scheduling and controlling construction projects
have been the Critical Path Method (CPM) and the ProjectEvaluation and Review Technique (PERT).Thesetechniques enables project managers to evaluate the earlyand late times at which activities can start and finish,calculate activity float (slack), define critical activities, andevaluate the impact of changes in duration, logical relationsand cost on the overall project duration. Both CPM andPERT are network based techniques and therefore help inprogramming and monitoring the progress of the stagesinvolved so that the project is completed within thedeadline. In doing this, it specifies the part of the projectthat are crucial which if delayed beyond the normal timewould increase the completion time of the project as a
whole. It further assists in allocating resources, such as
labor and equipment and thus helps to make the total cosof the building project a minimum by finding the optimatrade-off between various costs and time involved [1]Although PERT and CPM differ to some extent interminology and in the construction of the network, theirobjectives are the same. Furthermore, the analysis used inboth techniques is very similar. The major difference is thatin CPM activity times are assumed proportional to theamount of resources allocated to them, and by changingthe level of resources the activity times and the projeccompletion time can be varied. Thus CPM assumes prioexperience with similar projects from which therelationships between resources and job times areavailable. On the other hand, PERT incorporates
uncertainties in activity times in its analysis. It determinesthe probabilities of completing various stages of the projecby specified deadlines. It also calculates the expected timeto complete the project. An important and extremely usefuby product of PERT analysis is its identification of various―bottlenecks‖ in a project. In other words, it identifies theactivities that have high potential for causing delays incompleting the project on schedule. Thus, even before theproject has started, the project manager knows where he orshe can expect delays. The manager can then take thenecessary preventive measures to reduce possible delaysso that the project schedule is maintained. Actually, bothtechniques, PERT and CPM, were developed almostsimultaneously. Project managers often encounter the
problem of having to shorten the scheduled completion timein order to expedite the execution of a project. Reducing theproject duration can be achieved by adding more resourcesto the performance of the activity in the form of overtimeresources or by assigning additional labor. This manageriadecision of additional resources, overtime and labor wilhowever increases the overall cost of the project thustrimming down the project duration of activities on criticapath. This concept of project management which involvesinvestment of extra budget in order to minimize the durationto meet the targeted date is known as crashing. Theobjective of expediting project by crashing total projectduration is helpful so that delays can be recovered andliquidated damages can be avoided. The aim is always to
8/20/2019 Project Planning and Scheduling Using Pert and Cpm Techniques With Linear Programming Case Study
http://slidepdf.com/reader/full/project-planning-and-scheduling-using-pert-and-cpm-techniques-with-linear-programming 2/6
INTERNATIONAL JOURNAL OF SCIENTIFIC & TECHNOLOGY RESEARCH VOLUME 4, ISSUE 08, AUGUST 2015 ISSN 2277-8616
223IJSTR©2015www.ijstr.org
strike balance between the cost and time and to obtain anoptimum schedule. This study is therefore aimed atexploring the time and cost of various activities involved in aprototype 3-bed room house project at Kumasi, Ghana inorder to determine the optimal completion time using CPMand PERT techniques with linear programming.
Basic Definitions
1.
Activity Time: The time to complete a particularactivity. The activity time can be deterministic oruncertain (probabilistic). When the activity time isdeterministic, the activity is completed in a constanttime. When the activity time is probabilistic, theactivity is completed in a random time value thatmay have a certain probability distribution.
2. Critical Path: A path that has the longest totalactivity time.
3. Critical Activity: Any activity on the critical path.4. Deterministic Project: A project that all activities
finish in constant times.5. End Activity: The activity that is not a predecessor
of any other activity is called an end activity of the
project.6. Earliest finish (EF): this is the earliest possible time
that an activity can be finished (= earliest start time+ activity completion time).
7. Earliest start (ES): this is the earliest possible timethat an activity can begin. All immediatepredecessors must be finished before an activitycan start.
8. Immediate Predecessor: The immediatepredecessors of an activity are the activities thatmust immediately precede the activity.
9. Latest finish (LF): this is the latest time that anactivity can be finished and not delay thecompletion time of the overall project (= latest start
time + activity completion time). As with start times,the activity is critical if the earliest finish and latestfinish times are the same.
10. Latest start (LS): this is the latest time that anactivity can begin and not delay the completiontime of the overall project. If the earliest start andlatest start times are the same then the activity iscritical.
11. Path: A sequence of activities in a project leadingfrom the start activity to the completion activity ofthe project.
12. Precedence Relation: It tells which activity must becompleted before another can be started.
13. Probabilistic Project: A project that has activitiesfinish in uncertain times.
14. Slack time: this is the difference between the
earliest start time and the latest start time (which inturn is equal to the difference between the lateststart time and the latest finish time), i.e. Slack =LS-ES = LF-EF
15. Start Activity: The activity that has no immediatepredecessor is called a start activity of the project.
16. Optimistic time: This is the shortest possible time inwhich the activity can be completed, and assumesthat everything has to go perfect.
17. Most-likely time: This is the most likely time inwhich the activity can be completed under normacircumstances.
18. Pessimistic time: This is the longest possible timethe activity might need, and assumes a worst-case
scenario.
2. MATERIALS AND METHOD
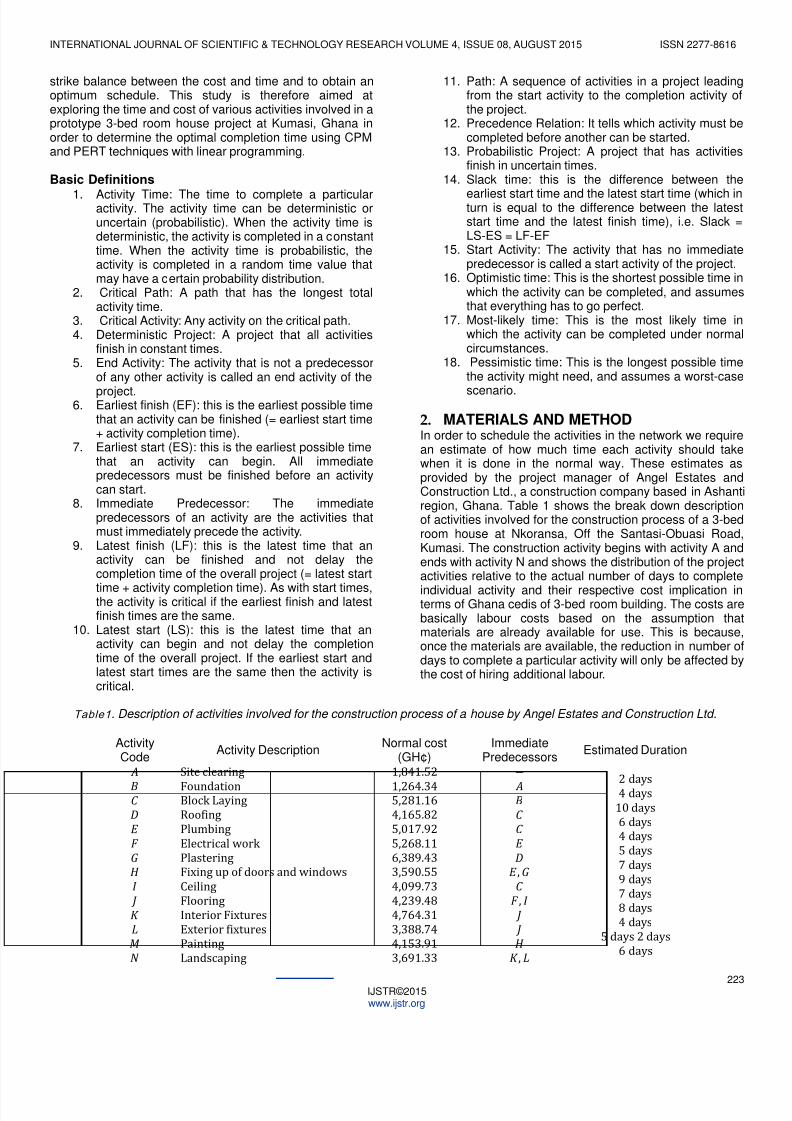
In order to schedule the activities in the network we requirean estimate of how much time each activity should takewhen it is done in the normal way. These estimates asprovided by the project manager of Angel Estates andConstruction Ltd., a construction company based in Ashantregion, Ghana. Table 1 shows the break down descriptionof activities involved for the construction process of a 3-bedroom house at Nkoransa, Off the Santasi-Obuasi RoadKumasi. The construction activity begins with activity A andends with activity N and shows the distribution of the projecactivities relative to the actual number of days to complete
individual activity and their respective cost implication interms of Ghana cedis of 3-bed room building. The costs arebasically labour costs based on the assumption thamaterials are already available for use. This is becauseonce the materials are available, the reduction in number odays to complete a particular activity will only be affected bythe cost of hiring additional labour.
Table1 . Description of activities involved for the construction process of a house by Angel Estates and Construction Ltd.
ActivityCode
Activity DescriptionNormal cost
(GH¢)Immediate
PredecessorsEstimated Duration
Site clearing
FoundationBlock Laying
Roofing
Plumbing
Electrical work PlasteringFixing up of doors and windows
Ceiling
Flooring
Interior Fixtures
Exterior fixtures Painting Landscaping
1,841.52
1,264.34 5,281.16 4,165.82 5,017.92 5,268.11 6,389.43 3,590.55 4,099.73 4,239.48 4,764.31
3,388.74
4,153.91
3,691.33
−
,
,
,
2 days
4 days
10 days
6 days4 days
5 days
7 days
9 days
7 days
8 days
4 days
5 days 2 days
6 days
8/20/2019 Project Planning and Scheduling Using Pert and Cpm Techniques With Linear Programming Case Study
http://slidepdf.com/reader/full/project-planning-and-scheduling-using-pert-and-cpm-techniques-with-linear-programming 3/6
INTERNATIONAL JOURNAL OF SCIENTIFIC & TECHNOLOGY RESEARCH VOLUME 4, ISSUE 08, AUGUST 2015 ISSN 2277-8616
224IJSTR©2015www.ijstr.org
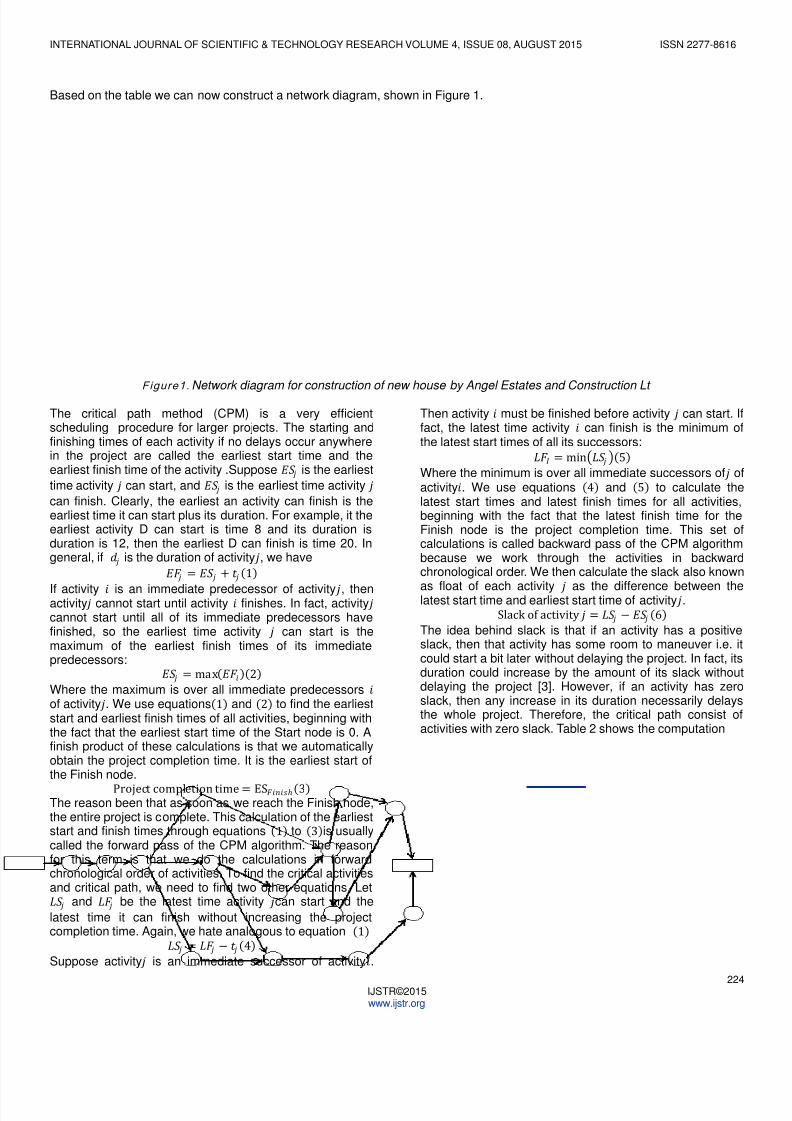
Based on the table we can now construct a network diagram, shown in Figure 1.
Figure1. Network diagram for construction of new house by Angel Estates and Construction Lt
The critical path method (CPM) is a very efficientscheduling procedure for larger projects. The starting andfinishing times of each activity if no delays occur anywherein the project are called the earliest start time and theearliest finish time of the activity .Suppose is the earliest
time activity can start, and is the earliest time activity can finish. Clearly, the earliest an activity can finish is theearliest time it can start plus its duration. For example, it theearliest activity D can start is time 8 and its duration isduration is 12, then the earliest D can finish is time 20. Ingeneral, if is the duration of activity , we have
= + 1 If activity is an immediate predecessor of activity , thenactivity cannot start until activity finishes. In fact, activity cannot start until all of its immediate predecessors havefinished, so the earliest time activity can start is themaximum of the earliest finish times of its immediatepredecessors:
= max2 Where the maximum is over all immediate predecessors of activity . We use equations1 and 2 to find the earlieststart and earliest finish times of all activities, beginning withthe fact that the earliest start time of the Start node is 0. Afinish product of these calculations is that we automaticallyobtain the project completion time. It is the earliest start ofthe Finish node.
Project completion time = ESℎ3 The reason been that as soon as we reach the Finish node,the entire project is complete. This calculation of the earlieststart and finish times through equations 1 to 3is usuallycalled the forward pass of the CPM algorithm. The reasonfor this term is that we do the calculations in forwardchronological order of activities. To find the critical activitiesand critical path, we need to find two other equations. Let and be the latest time activity can start and the
latest time it can finish without increasing the projectcompletion time. Again, we hate analogous to equation 1
= − 4 Suppose activity is an immediate successor of activity.
Then activity must be finished before activity can start. Ifact, the latest time activity can finish is the minimum othe latest start times of all its successors:
= min 5 Where the minimum is over all immediate successors of oactivity. We use equations 4 and 5 to calculate thelatest start times and latest finish times for all activitiesbeginning with the fact that the latest finish time for theFinish node is the project completion time. This set ocalculations is called backward pass of the CPM algorithmbecause we work through the activities in backwardchronological order. We then calculate the slack also known
as float of each activity as the difference between thelatest start time and earliest start time of activity .
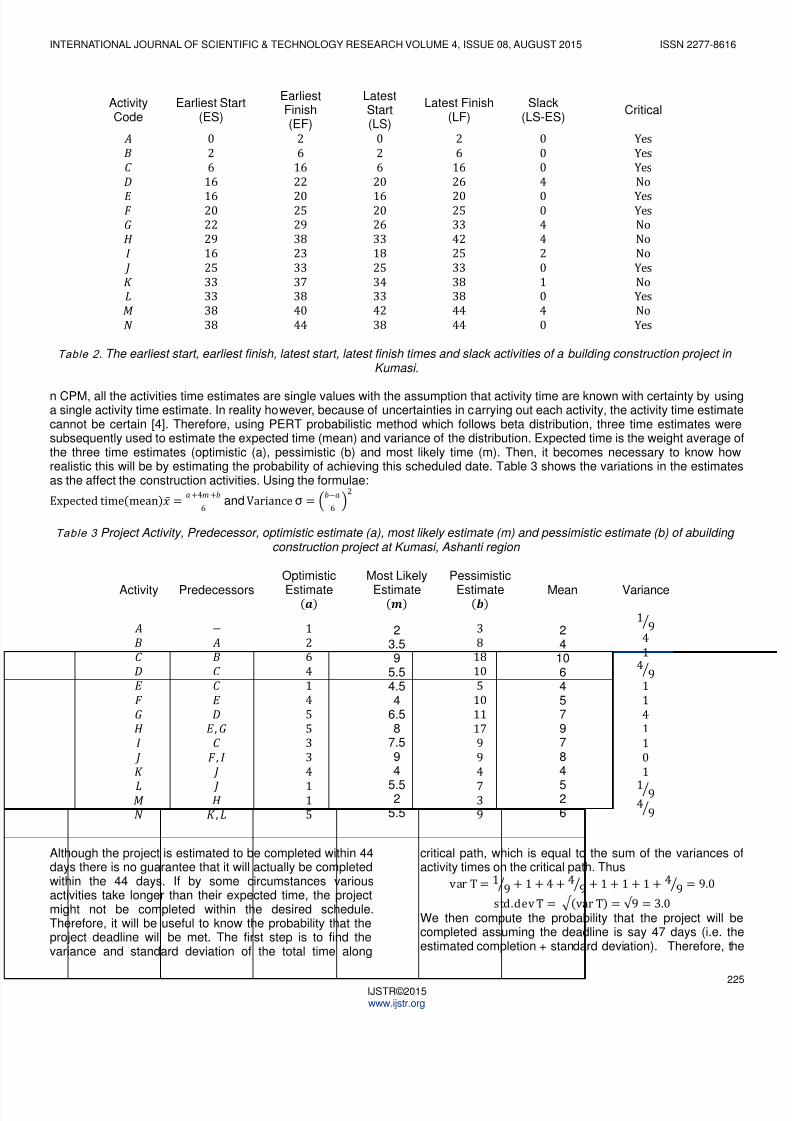
Slack of activity = − 6 The idea behind slack is that if an activity has a positiveslack, then that activity has some room to maneuver i.e. itcould start a bit later without delaying the project. In fact, itsduration could increase by the amount of its slack withoudelaying the project [3]. However, if an activity has zeroslack, then any increase in its duration necessarily delaysthe whole project. Therefore, the critical path consist ofactivities with zero slack. Table 2 shows the computation
8/20/2019 Project Planning and Scheduling Using Pert and Cpm Techniques With Linear Programming Case Study
http://slidepdf.com/reader/full/project-planning-and-scheduling-using-pert-and-cpm-techniques-with-linear-programming 4/6
INTERNATIONAL JOURNAL OF SCIENTIFIC & TECHNOLOGY RESEARCH VOLUME 4, ISSUE 08, AUGUST 2015 ISSN 2277-8616
225IJSTR©2015www.ijstr.org
ActivityCode
Earliest Start(ES)
EarliestFinish(EF)
LatestStart(LS)
Latest Finish(LF)
Slack(LS-ES)
Critical
0
2
6
16
162022
29
16
25
3333
38
38
2
6
16
22
202529
38
23
33
3738
40
44
0
2
6
20
162026
33
18
25
3433
42
38
2
6
16
26
202533
42
25
33
3838
44
44
0
0
0
4
004
4
2
0
10
4
0
Yes
Yes
Yes
No
YesYesNo
No
No
Yes
NoYes
No
Yes
Table 2 . The earliest start, earliest finish, latest start, latest finish times and slack activities of a building construction project inKumasi.
n CPM, all the activities time estimates are single values with the assumption that activity time are known with certainty by usinga single activity time estimate. In reality however, because of uncertainties in carrying out each activity, the activity time estimatecannot be certain [4]. Therefore, using PERT probabilistic method which follows beta distribution, three time estimates weresubsequently used to estimate the expected time (mean) and variance of the distribution. Expected time is the weight average othe three time estimates (optimistic (a), pessimistic (b) and most likely time (m). Then, it becomes necessary to know howrealistic this will be by estimating the probability of achieving this scheduled date. Table 3 shows the variations in the estimatesas the affect the construction activities. Using the formulae:
Expected timemean = +4+6
and Variance σ = −6
2
Table 3 Project Activity, Predecessor, optimistic estimate (a), most likely estimate (m) and pessimistic estimate (b) of abuildingconstruction project at Kumasi, Ashanti region
Activity Predecessors
Optimistic
Estimate Most Likely
Estimate Pessimistic
Estimate Mean Variance
−
,
,
,
1
26
4
1
4
5
5
3
3
4
115
23.59
5.54.54
6.58
7.594
5.52
5.5
3
818
10
5
10
11
17
9
9
4
739
24
1064579784
526
19
4
14
9
1
1
41
1
0
1
1 9 4
9
Although the project is estimated to be completed within 44days there is no guarantee that it will actually be completedwithin the 44 days. If by some circumstances variousactivities take longer than their expected time, the projectmight not be completed within the desired schedule.Therefore, it will be useful to know the probability that theproject deadline will be met. The first step is to find thevariance and standard deviation of the total time along
critical path, which is equal to the sum of the variances oactivity times on the critical path. Thus
var T = 19 + 1 + 4 + 4
9 + 1 + 1 + 1 + 49 = 9.0
std.dev T = var T = 9 = 3.0 We then compute the probability that the project will becompleted assuming the deadline is say 47 days (i.e. theestimated completion + standard deviation). Therefore, the
8/20/2019 Project Planning and Scheduling Using Pert and Cpm Techniques With Linear Programming Case Study
http://slidepdf.com/reader/full/project-planning-and-scheduling-using-pert-and-cpm-techniques-with-linear-programming 5/6
INTERNATIONAL JOURNAL OF SCIENTIFIC & TECHNOLOGY RESEARCH VOLUME 4, ISSUE 08, AUGUST 2015 ISSN 2277-8616
226IJSTR©2015www.ijstr.org
probability of meeting the deadline given the threesimplifying approximations using the normal distribution is:
Prob ≤ 47 = Prob − 44
3≤ 47 − 44
3
= Prob ≤ 1.0 = 1 − Prob > 1.0 = 1 − 0.1587 = 0.84
Thus, there is 84% chance to that the critical path will becompleted in less than 47 days.
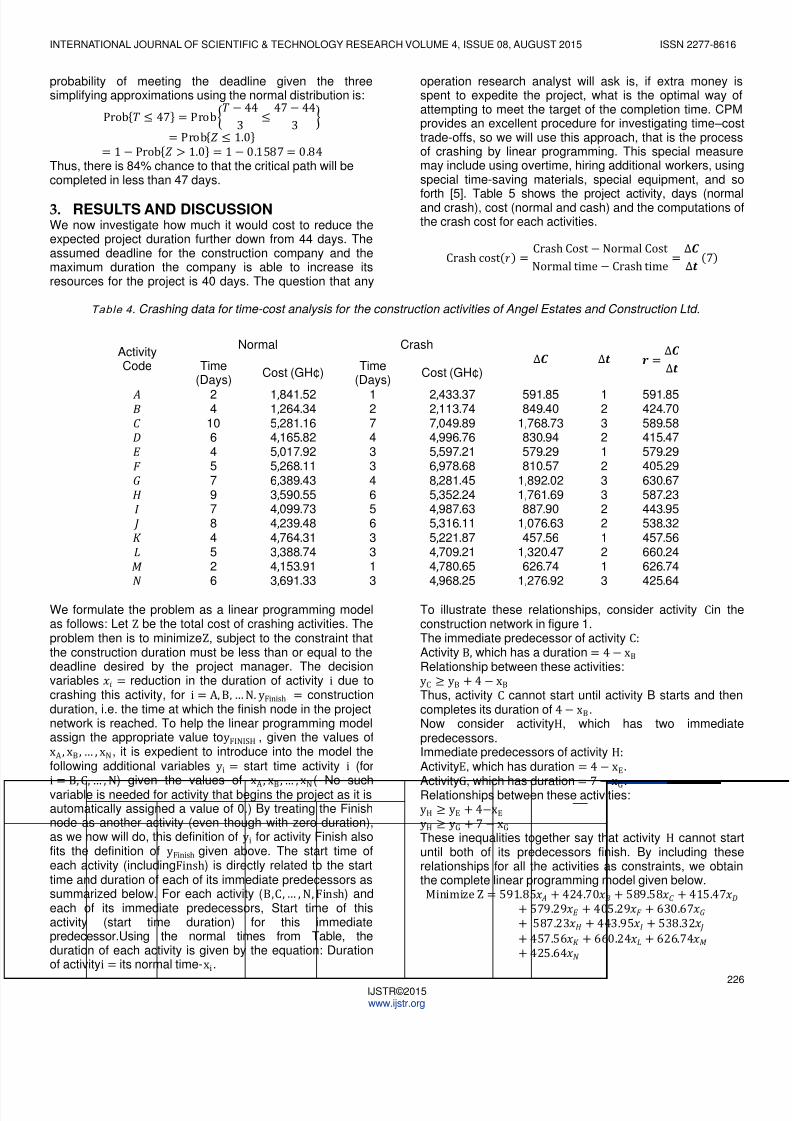
3. RESULTS AND DISCUSSIONWe now investigate how much it would cost to reduce theexpected project duration further down from 44 days. Theassumed deadline for the construction company and themaximum duration the company is able to increase itsresources for the project is 40 days. The question that any
operation research analyst will ask is, if extra money isspent to expedite the project, what is the optimal way ofattempting to meet the target of the completion time. CPMprovides an excellent procedure for investigating time –costrade-offs, so we will use this approach, that is the processof crashing by linear programming. This special measuremay include using overtime, hiring additional workers, usingspecial time-saving materials, special equipment, and so
forth [5]. Table 5 shows the project activity, days (normaand crash), cost (normal and cash) and the computations othe crash cost for each activities.
Crash cost =Crash Cost − Normal Cost
Normal time − Crash time=
∆∆ 7
Table 4 . Crashing data for time-cost analysis for the construction activities of Angel Estates and Construction Ltd.
ActivityCode
Normal Crash∆ ∆ =
∆∆
Time(Days)
Cost (GH¢)Time
(Days)Cost (GH¢)
24
1064579784526
1,841.521,264.345,281.164,165.825,017.925,268.116,389.433,590.554,099.734,239.484,764.313,388.744,153.913,691.33
12743346563313
2,433.372,113.747,049.894,996.765,597.216,978.688,281.455,352.244,987.635,316.115,221.874,709.214,780.654,968.25
591.85849.40
1,768.73830.94579.29810.57
1,892.021,761.69887.90
1,076.63457.56
1,320.47626.74
1,276.92
12321233221213
591.85424.70589.58415.47579.29405.29630.67587.23443.95538.32457.56660.24626.74425.64
We formulate the problem as a linear programming modelas follows: Let Z be the total cost of crashing activities. Theproblem then is to minimizeZ, subject to the constraint thatthe construction duration must be less than or equal to thedeadline desired by the project manager. The decisionvariables = reduction in the duration of activity i due tocrashing this activity, for i = A, B, …N. yFinish = constructionduration, i.e. the time at which the finish node in the projectnetwork is reached. To help the linear programming modelassign the appropriate value toyFINISH , given the values ofxA , xB , … , xN, it is expedient to introduce into the model thefollowing additional variables yi = start time activity i (for
i = B, C, … , N) given the values of xA , xB ,… , xN( No suchvariable is needed for activity that begins the project as it isautomatically assigned a value of 0.) By treating the Finishnode as another activity (even though with zero duration),as we now will do, this definition of yi for activity Finish alsofits the definition of yFinish given above. The start time ofeach activity (includingFinsh) is directly related to the starttime and duration of each of its immediate predecessors assummarized below. For each activity (B,C,… , N, Finsh) andeach of its immediate predecessors, Start time of thisactivity (start time duration) for this immediatepredecessor.Using the normal times from Table, theduration of each activity is given by the equation: Durationof activityi = its normal time-xi.
To illustrate these relationships, consider activity Cin theconstruction network in figure 1.The immediate predecessor of activity C: Activity B, which has a duration = 4 − xB Relationship between these activities:yC ≥ yB + 4 − xB Thus, activity C cannot start until activity B starts and thencompletes its duration of 4 − xB.Now consider activityH, which has two immediatepredecessors.Immediate predecessors of activity H: ActivityE, which has duration = 4 − xE .
ActivityG, which has duration = 7 − xG.Relationships between these activities:yH ≥ yE + 4−xE yH ≥ yG + 7 − xG These inequalities together say that activity H cannot staruntil both of its predecessors finish. By including theserelationships for all the activities as constraints, we obtainthe complete linear programming model given below.
Minimize Z = 591.85 + 424.70 + 589.58 + 415.47+ 579.29 + 405.29 + 630.67+ 587.23 + 443.95 + 538.32 + 457.56 + 660.24 + 626.74+ 425.64
8/20/2019 Project Planning and Scheduling Using Pert and Cpm Techniques With Linear Programming Case Study
http://slidepdf.com/reader/full/project-planning-and-scheduling-using-pert-and-cpm-techniques-with-linear-programming 6/6
INTERNATIONAL JOURNAL OF SCIENTIFIC & TECHNOLOGY RESEARCH VOLUME 4, ISSUE 08, AUGUST 2015 ISSN 2277-8616
227IJSTR©2015www ijstr org
Subject to: Maximum reduction constraints:
≤ 1, ≤ 2, ≤ 3, ≤ 2, ≤ 1, ≤ 2, ≤ 3,
≤ 3, ≤ 2, ≤ 2, ≤ 1, ≤ 2, ≤ 1, ≤ 3,
Non-negativity constraints: ≥ 0, ≥ 0, ≥ 0, ≥ 0, ≥ 0, ≥ 0,
≥ 0, ≥ 0, ≥ 0, ≥ 0, ≥ 0, ≥ 0, ≥0,≥0.
≥0,
≥0,
≥0,
≥0,
≥0,
≥0,
≥0,
≥ 0, ≥ 0, ≥ 0, ≥ 0, ≥ 0, ≥ 0. FINISH ≥ 0
Start time constraints: + ≥ 2 − + ≥ 4 − + ≥ 10 − + ≥ 10
− + ≥ 4 − + ≥ 6
− + ≥ 4 − + ≥ 7
− + ≥ 10 − + ≥ 3
− + ≥ 7 − + ≥ 6
− + ≥ 6 − + ≥ 9
− + ≥ 4 − + ≥ 5
FINISH − + ≥ 2 FINISH − + ≥ 6Projection duration constraint:FINISH ≤ 40`
Which means that the project manager need to crash theproject time by 4 days. Using LINDO optimization software,the solution of the mathematical model is show in Table 5.
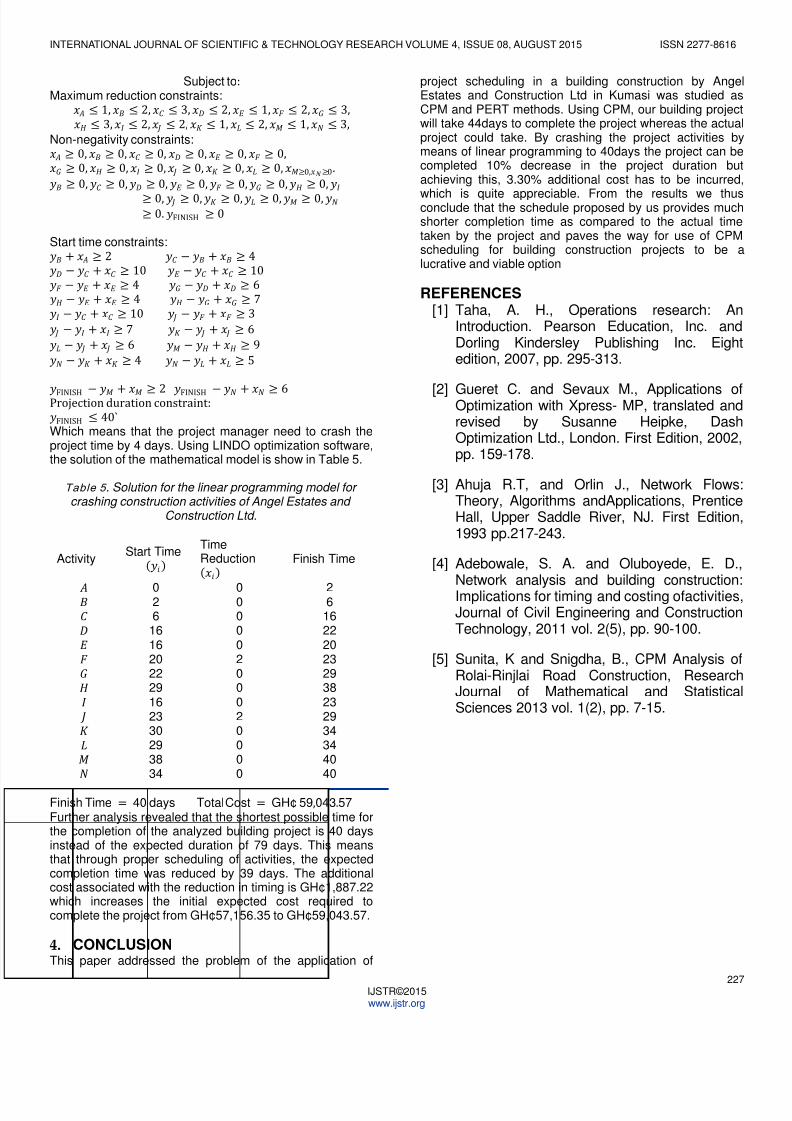
Table 5 . Solution for the linear programming model forcrashing construction activities of Angel Estates and
Construction Ltd.
ActivityStart Time
TimeReduction
Finish Time
026
1616202229162330293834
00000200020000
26
162220232938232934344040
Finish Time = 40 days Total Cost = GH¢ 59,043.57Further analysis revealed that the shortest possible time forthe completion of the analyzed building project is 40 daysinstead of the expected duration of 79 days. This meansthat through proper scheduling of activities, the expectedcompletion time was reduced by 39 days. The additionalcost associated with the reduction in timing is GH¢1,887.22which increases the initial expected cost required tocomplete the project from GH¢57,156.35 to GH¢59,043.57.
4. CONCLUSIONThis paper addressed the problem of the application of
project scheduling in a building construction by AngeEstates and Construction Ltd in Kumasi was studied asCPM and PERT methods. Using CPM, our building projectwill take 44days to complete the project whereas the actuaproject could take. By crashing the project activities bymeans of linear programming to 40days the project can becompleted 10% decrease in the project duration butachieving this, 3.30% additional cost has to be incurred
which is quite appreciable. From the results we thusconclude that the schedule proposed by us provides muchshorter completion time as compared to the actual timetaken by the project and paves the way for use of CPMscheduling for building construction projects to be alucrative and viable option
REFERENCES
[1] Taha, A. H., Operations research: AnIntroduction. Pearson Education, Inc. andDorling Kindersley Publishing Inc. Eighedition, 2007, pp. 295-313.
[2]
Gueret C. and Sevaux M., Applications ofOptimization with Xpress- MP, translated andrevised by Susanne Heipke, DashOptimization Ltd., London. First Edition, 2002pp. 159-178.
[3] Ahuja R.T, and Orlin J., Network FlowsTheory, Algorithms andApplications, PrenticeHall, Upper Saddle River, NJ. First Edition1993 pp.217-243.
[4] Adebowale, S. A. and Oluboyede, E. D.Network analysis and building constructionImplications for timing and costing ofactivitiesJournal of Civil Engineering and ConstructionTechnology, 2011 vol. 2(5), pp. 90-100.
[5] Sunita, K and Snigdha, B., CPM Analysis ofRolai-Rinjlai Road Construction, ResearchJournal of Mathematical and StatisticaSciences 2013 vol. 1(2), pp. 7-15.