Embed Size (px)
Citation preview
Ambient Fine Particulate Matter (PM2.5) Research Program –Upper Ohio River Valley Project: Data Management and Analysis
eport
Submitted to the Project Sponsor
Project R
NATIONAL ENERGY TECHNOLOGY LABORATORY UNITED STATES DEPARTMENT OF ENERGY
Project Manager: William Aljoe
thors
. or
sity s Ohio
Ph: (740) 593-2096 Email [email protected]
Au
Kevin Crist, Ph.DAssociate Profess
Ohio UniverAthen
Kuruvilla John, Ph.D. Associate Professor & Graduate Coordinator Department of Environmental Engineering
Texas A&M University - Kingsville Kingsville, Texas 78363
Table of Contents 1.0 Introduction ………………………………………………………………... 1
0 …………….. 1 3.0 …………..... 2
………….... 2
...................... 2
…………... 2
3.4 Pollution Rose Analysis …………………………………………........ 3
…………….. 3
………….... 3
4.0 ……..………3
4.1 Regional Analysis …………………………………………………….. 3
………………………………… 7
…………… 13
4.4 Back Trajectory Analysis …………………………………………….. 15
4.5 Cluster Analysis ………………………………………………………. 17
5.0 References …………………………………………………………………..22 6.0 Acknowledgements..…………………………………………………………22
2. Scope of Work ………………………………………………
Methodology …………………………………………………3.1 Monitoring Sites …………………………………………
3.2 Regional Analysis………................................................
3.3 High PM Episode Analysis ………………………………
3.5 Back Trajectory Analysis ………………………………
3.6 Cluster Analysis …………………………………………
Results and Discussion ………………………………………
4.2 High PM Episode Analysis …………
4.3 Polar Distribution Analysis ………………………………
1.0 INTRODUCTION
ate matter (PM2.5). designated PM2.5.)
2.5 its precursors ( e.g. coal fire power plants) in the Ohio River Valley. The United States Department of Energy,
research programs
ETL) is currently in the Upper Ohio anced Technology aigns supported by
two urban, and two rural monitoring sites onitoring campaign
evaluates a host of atmospheric species, including PM2.5 and PM10 (with speciation), SO2, O3, NH3, ch as temperature,
sure are included.
This project provided data management and analysis support for UORVP and included the following:
nd maintenance of a data management system for the Upper Ohio River Valley
2.0 SCOPE OF WORK
ere formatted and of the data were
ere then reviewed with ATS. A secure central server was The Department of Environmental
Engineering at Texas A&M University undertook a comprehensive analysis of the PM2.5 data generated from the continuous monitors. This report provides a preliminary review of the PM2.5 data collected to date from the UORVP. The discussion focuses on transport of PM2.5 with regard to meteorological parameters during high PM2.5 episodes. A description of the sampling methods with additional analyses of the UORVP data sets completed by ATS including data obtained from discrete filter samplers is presented in their semi-annual progress report and is posted on NETL’s web site (http://www.netl.doe.gov/coalpower/environment/air_q/am_monitor/uorvp.html
There has been increased attention on the potential health impacts of fine particul(Particles with an aerodynamic diameter equal to or less than 2.5-micron size are Recently this attention has been focused the anthropogenic sources of PM and
Environmental Protection Agency, and Ohio EPA have launched several extensive in the Ohio River Valley to measure and characterize ambient PM2.5. The U.S. Department of Energy’s National Energy Technology Laboratory (Nperforming/supporting extensive PM2.5 and priority pollutant monitoring campaignsRiver Valley. The Upper Ohio River Valley Project (UORVP), operated by AdvSystems, Inc. (ATS) under contract to DOE, is one of the major monitoring campNETL. The goal of this monitoring program, which includes is to provide a solid scientific foundation for PM2.5 regulatory decisions. This m
CO, HNO3, NOx, and NOy. In addition, pertinent meteorological parameters suwind speed, wind direction, UV flux, and barometric pres
1. Development aProject;
2. Provisions for quality control for the data management system; and 3. Support for data analysis for the Upper Ohio River Valley Project.
The data obtained from the continuous analyzers supporting the UORVP project wmaintained on a commercial data base system. Manual and automated reviewsconducted to screen anomalies. Anomalies westablished for data storage and retrieval at Ohio University.
).
1
3.0 METHODOLOGY
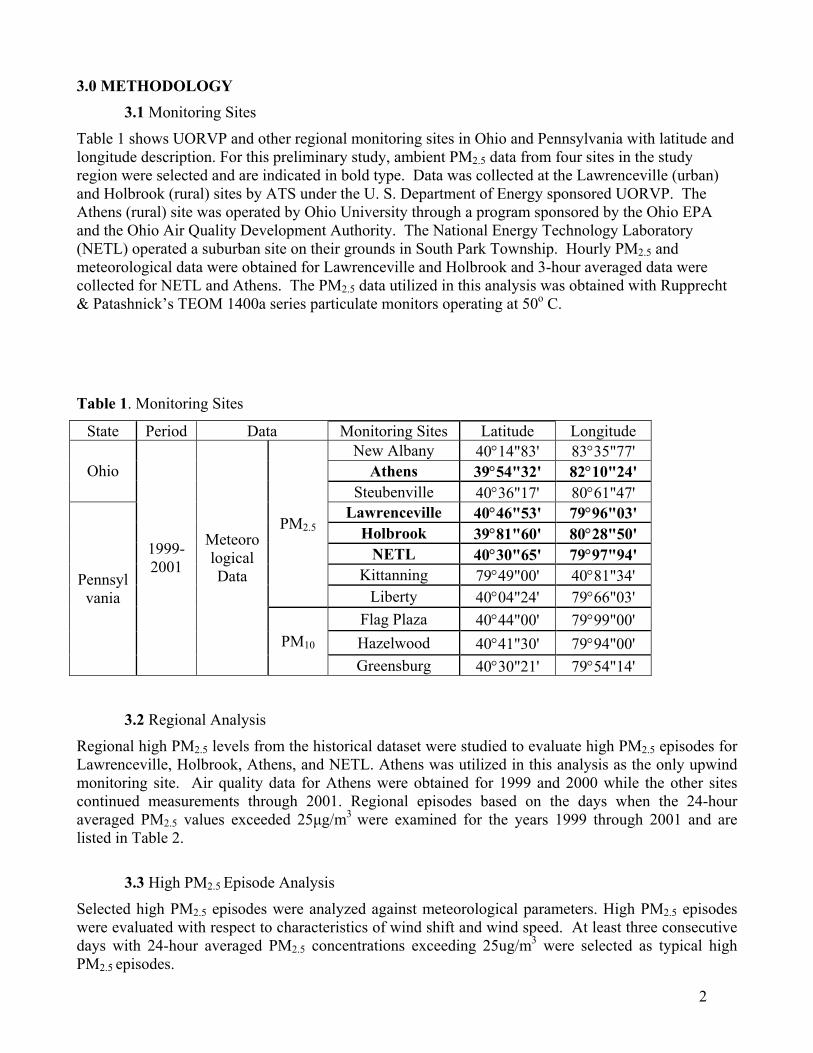
3.1 Monitoring Sites
Table 1 shows UORVP and other regional monitoring sites in Ohio and Pennsylvlongitude description. For this preliminary study, ambient PM2.5 data from four region were selected and are indicated in bold type. Data was collected at the Laand Holbrook (rural) sites by ATS under the U. S. Department of Energy sponAthens (rural) site was operated by Ohio University through a program sponsoreand the Ohio Air Quality Development Authority. The National Energy Technolog(NETL) operated a suburban site on their grounds in South Park Township. Hourly PM
ania with latitude and sites in the study wrenceville (urban)
sored UORVP. The d by the Ohio EPA
y Laboratory 2.5 and
meteorological data were obtained for Lawrenceville and Holbrook and 3-hour averaged data were collected for NETL and Athens. The PM2.5 data utilized in this analysis was obtained with Rupprecht & Patashnick’s TEOM 1400a series particulate monitors operating at 50o C.
Table 1. Monitoring Sites
State Period ta nito Longitude
Da Mo ring Sites LatitudeAlbany 40°14"8hens 39°54"3Ohio
Steub 7' 80°61"47'
enville 40°36"1Lawre 3' 79°96"03' nceville 40°46"5
brook 39°81"6TL 40°30"6
M2.5
New 3' 83°35"77' At 2' 82°10"24'
Hol 0' 80°28"50' NE 5' 79°97"94'
Kittanning 79°49"00' 40°81"34'
P
Liberty 40°04"24' 79°66"03' Flag Plaza 40°44"00' 79°99"00' Hazelwood 40°41"30' 79°94"PM10 Greensburg 40°30"21' 79°54"
00'
Pennsylva
1999-2001
Meteorological Data
14'
nia
3.2 Regional Analysis
Regional high PM2.5 levels from the historical dataset were studied to evaluate highLawrenceville, Holbrook, Athens, and NETL. Athens was utilized in this analysis monitoring site. Air quality data for Athens were obtained for 1999 and 2000 w
PM2.5 episodes for as the only upwind hile the other sites
continued measurements through 2001. Regional episodes based on the days when the 24-hour averaged PM2.5 values exceeded 25µg/m3 were examined for the years 1999 through 2001 and are listed in Table 2.
3.3 High PM2.5 Episode Analysis
Selected high PM2.5 episodes were analyzed against meteorological parameters. High PM2.5 episodes were evaluated with respect to characteristics of wind shift and wind speed. At least three consecutive days with 24-hour averaged PM2.5 concentrations exceeding 25ug/m3 were selected as typical high PM2.5 episodes.
2
3.4 Pollution Rose Analysis
Wind direction, wind speed and PM2.5 concentration on the days wh3
en the 24-hour averaged values exceeded 30 ug/m were plotted with polar charts to evaluate dominant wind speed, and direction dur s type of analysis is also called a pollution rose analysis.
rt pathways.1 This LIT4) model from boratory (ARL) to eric emergencies,
curacy of upper air cause of the lack of extensive upper air
monitoring sites in Ohio. However, if a large amount of trajectories are averaged, the errors are dec 4 udy, 24-hour back trajectories at 500 meters, which is generally in the middle of the mixed layer, were computed for days when the 24-hour averaged PM2.5 values exceeded 30 ug/m3.
t source region. This homogeneous and as
y, the clustering approach ack trajectory, six
y four-hour interval, gorithm generated a
ajectories are assigned to our interval
with each real ing two clusters whose
however, was slightly modified in this study. Each eral clusters in terms of the direction of the original source region. This
region was defined by the x-y coordinates for the starting point of the 24-hour back trajectory. Main clusters in this study were divided into eight directional components, North, Northwest, West,
alled “Close” was lculated by
averaging trajectories assigned to each cluster. Mercator projection was selected as a plotting projection of each cluster because this study involved a small region and this projection was more convenient to plot clusters than polar stereographic projection. 4.0 RESULTS AND DISCUSSION
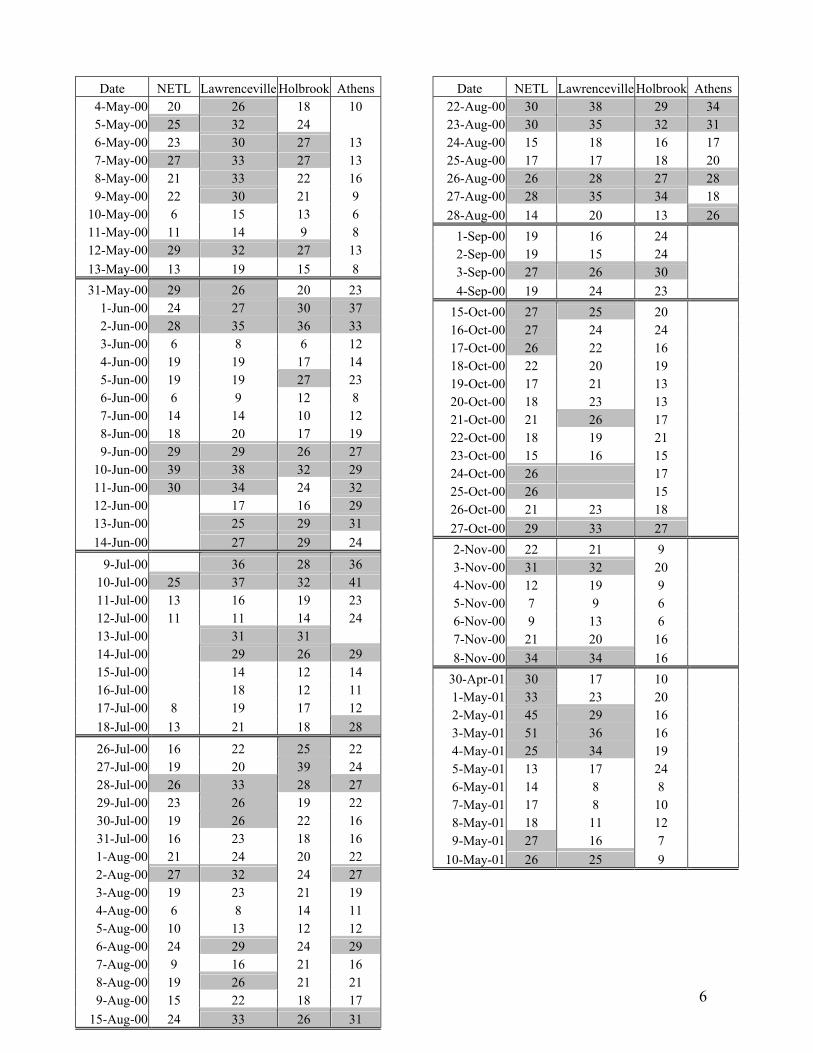
4.1 Regional Analysis
An analysis of the regional data shown in Table 2 reveals that most high PM2.5 episodes are typically observed over several consecutive days. The shaded values in the table indicate 24 hour averaged PM2.5 values exceeding 25 µg/m3 and the values in bold indicate exceedances of the NAAQS PM2.5
ing high PM2.5 days. Thi
3.5 Back Trajectory Analysis
Trajectories are used to aid in complex decisions regarding atmospheric transpoanalysis applied the hybrid single-particle lagrangian integrated trajectory (HYSPthe National Oceanic and Atmospheric Administration (NOAA)’s Air Resource Laestimate backward trajectories.2 The HYSPLIT4 model is used for atmosphdiagnostic case studies or climatological analyses.3 It should be noted that the acdata acquired from the HYSPLIT4 model is not ideal be
reased. For this st
This study adapted a start time of 16 UTC (noon Eastern Standard Time).
3.6 Cluster Analysis
Cluster analysis of backward trajectories allows for the identification of a pollutananalysis consists of splitting a data set into several dominant groups that are different from each other in some particular respect as possible. In this studproposed by Dorling et al.5 was chosen and modified. For each one-day (24-hour) bfour-hourly x-y coordinates, which are end points of the trajectory location at everare used as input variables for the clustering algorithm. The original clustering allarge number of clusters specified as the seed trajectories. Each of the real trthe seed that is closest in terms of the distance between their corresponding four hcoordinates. Then the seed or average trajectory of each cluster is recalculatedtrajectory. The number of clusters can be reduced by the same process of mergaverage trajectories are closest.4, 5 This algorithm,trajectory was assigned to sev
Southwest, South, Southeast, East, and Northeast. An additional cluster category calso added to highlight trajectories from close proximities. The transport path was ca
3

standard of 65 µg/m3. Usually high PM2.5 values during these episodes occur almost simall sites. This tendency is more prominent in 2001 than in 1999 and 2000. There data sets from the NETL site for 7/1/1999-9/30/1999, at the Athens site for the 9/1/2
ultaneously at were some missing 000-7/31/2001 and
8/12/1999-9/15/1999. During this period only the Lawrenceville site showed an exceedance day (July 17, 1999).
4
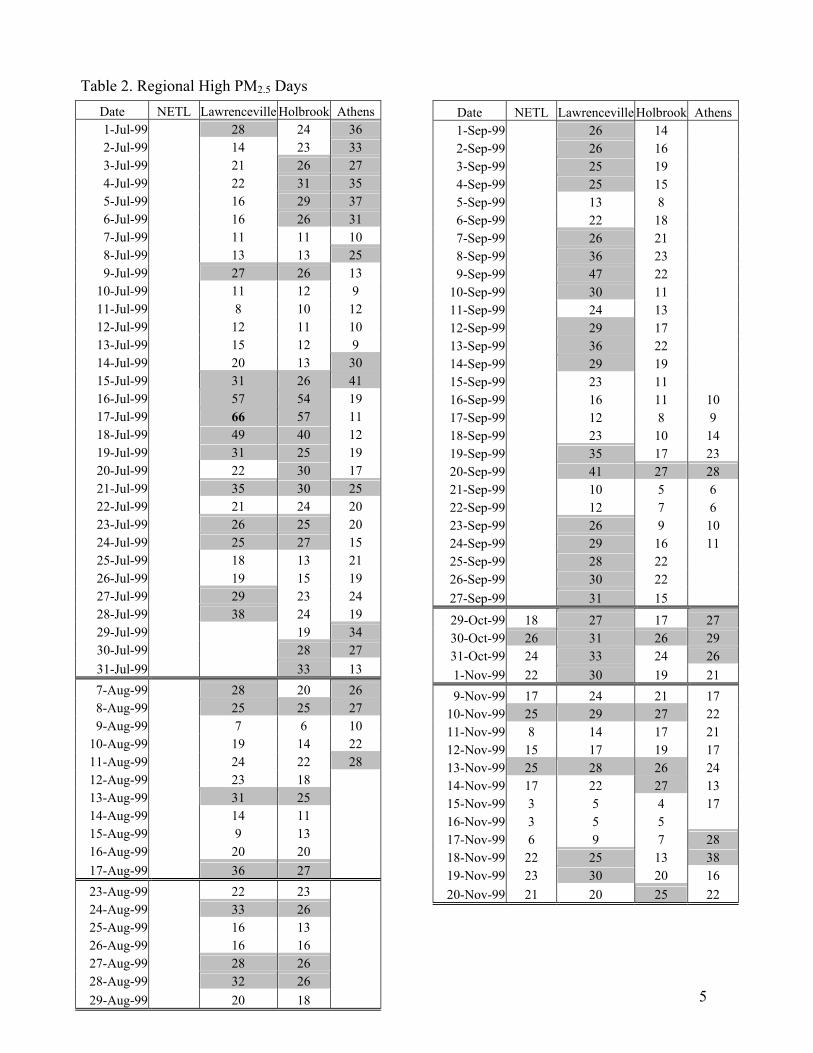
Table 2
NETL awren ille H roo Athens
. Regional High PM2.5 Days Date L cev olb 1-Jul-9 9 2-Jul-9 14 3 9 23-Jul-9 21 9 24-Jul-9 22 9 35-Jul-9 16 9 26-Jul-9 16 9 27-Jul-9 11 10 9 11 8-Jul-9 13 3 9 19-Jul-9 9 26 13
10-Jul-9 11 2 9 9 111-Jul-9 8 0 12 9 112-Jul-9 12 1 10 9 113-Jul-9 15 2 9 9 114-Jul-9 20 3 9 115-Jul-9 9 216-Jul-9 9 54 19 17-Jul-9 9 57 11 18-Jul-9 9 40 12 19-Jul-9 9 25 19 20-Jul-9 22 9 30 17 21-Jul-9 9 322-Jul-9 21 4 20 9 223-Jul-9 9 25 20 24-Jul-9 9 27 15 25-Jul-9 18 3 21 9 126-Jul-9 19 5 19 9 127-Jul-9 9 28-Jul-9 9 29-Jul-99 9 130-Jul-99 28 31-Jul-99 37-Aug-9 9 8-Aug-9 9 25 9-Aug-9 7 6 109
10-Aug-9 19 22 9 14 11-Aug-9 24 9 22 12-Aug-9 23 9 18 13-Aug-9 9 25 14-Aug-9 14 9 11
renp-99 26 14 p-99 26 16 p-99 25 19 p-99 25 15 p-99 13 p-99 22 p-99 26 21 p-99 36 23 p-99 47 22 p-99 30 11 p-99 24 p-99 29p-99 3p-99 29p-99 23p-99 1p-99 1p-99 23p-99 35 17 p-99 41 p-99 10 p-99 12p-99 26p-99 29p-99 28p-99 30p-99 31
t-99 27t-99 31-9 33-9 30 19
v-9910-Nov-99 2911-No 8 17 21 v-99 14
k
5
28 24 36 33
6 27 1 35 9 37 6 31
25 27
30 31 6 41 57664931
35 0 25
2625
29 23 2438 24 19
34 27
3 1328 20 26 25 27
28
31
15-Aug-99 9 13 16-Aug-99 20 20 17-Aug-99 36 27 23-Aug-99 22 23 24-Aug-99 33 26 25-Aug-99 16 13 26-Aug-99 16 16 27-Aug-99 28 26 28-Aug-99 32 26 29-Aug-99 20 18
Date NETL Law ceville Holbrook Athens1-Se 2-Se 3-Se 4-Se 5-Se 8 6-Se 18 7-Se 8-Se 9-Se
10-Se 11-Se 13 12-Se 17 13-Se 6 22 14-Se 19 15-Se 11 16-Se 6 11 10 17-Se 2 8 9 18-Se 10 14 19-Se 23 20-Se 27 28 21-Se 5 6 22-Se 7 6 23-Se 9 10 24-Se 16 11 25-Se 22 26-Se 22 27-Se 15
29-Oc 18 17 27 30-Oc 26 26 29 31-Oct 9 24 24 26 1-Nov 9 22 21 9-No 17 24 21 17
25 27 22
12-Nov-99 15 17 19 17 13-Nov-99 25 28 26 24 14-Nov-99 17 22 27 13 15-Nov-99 3 5 4 17 16-Nov-99 3 5 5 17-Nov-99 6 9 7 28 18-Nov-99 22 25 13 38 19-Nov-99 23 30 20 16 20-Nov-99 21 20 25 22
ns
ren22-Aug-00 3823-Aug-00 3524-Au 15 18 16 17 g-0025-Au 17 17 18 20 g-0026-Aug-00 2827-Aug-00 35 28-Au 14 20 13 g-00
p-00p-00p-00 26 p-00t-00 25 20 t-00t-00t-00t-00t-00t-00 26 17 t-00t-00t-00 28 17
31 15 t-00t-00 33 v-00v-00 32 20 v-00v-00v-00-0-0 34 16
r-01
NETL awren ille H roo AtheDate L cev olb4-May- 20 00 5-May-00 6-May- 23 00 27-May-00 28-May-0 21 0 9-May- 22 00
10-May- 6 15 6 00 13 11-May- 11 14 8 00 912-May-00 27 13 13-May- 13 19 5 8 00 131-May-00
1-Jun-00 32-Jun-00 36 3-Jun-00 6 8 12 6 4-Jun-00 19 19 7 14 15-Jun-00 19 19 27 23 6-Jun-00 6 9 2 8 17-Jun-0 14 14 0 12 0 18-Jun-0 18 20 7 19 0 19-Jun- 2
10-Jun-00 311-Jun-00 12-Jun- 17 6 00 113-Jun-0 0 29 14-Jun-0 0 29 24
9-Jul-0 0 210-Jul-00 311-Jul- 13 16 9 23 00 112-Jul- 11 11 4 24 00 113-Jul- 00 31 14-Jul- 00 215-Jul- 14 2 14 00 116-Jul- 18 2 11 00 117-Jul- 8 19 7 1200 118-Jul- 13 21 8 00 1
26-Jul-0 16 22 0 25 22 27-Jul- 19 20 00 39 24 28-Jul-00 229-Jul- 23 00 30-Jul- 19 00 31-Jul- 16 23 8 16 00 1
k
6
26 18 1025 32 24
30 7 1327 33 7 13
33 22 1630 21 9
29 32
29 26 20 23 24 27 0 37 28 35 33
00 29 29 6 27 39 38 2 29 30 34 24 32
29 25 31 27
36 8 36 25 37 2 41
3129 6 29
28
26 33 8 27 26 19 22 26 22 16
1-Aug-00 21 24 20 22 2-Aug-00 27 32 24 27 3-Aug-00 19 23 21 19 4-Aug-00 6 8 14 11 5-Aug-00 10 13 12 12 6-Aug-00 24 29 24 29 7-Aug-00 9 16 21 16 8-Aug-00 19 26 21 21 9-Aug-00 15 22 18 17
15-Aug-00 24 33 26 31
Date NETL Law ceville Holbrook Athens
26 27 28 28 34 18
26 1-Se 19 16 24 2-Se 19 15 24 3-Se 27 30 4-Se 19 24 23
15-Oc 27 16-Oc 27 24 24 17-Oc 26 22 16 18-Oc 22 20 19 19-Oc 17 21 13 20-Oc 18 23 13 21-Oc 21 22-Oc 18 19 21 23-Oc 15 16 15 24-Oc 26 25-Oct-00 26 26-Oc 21 23 18 27-Oc 29 27 2-No 22 21 9 3-No 31 4-No 12 19 9 5-No 7 9 6 6-No 9 13 6 7-Nov 0 21 20 16 8-Nov 0 34
30-Ap 30 17 10 1-May-01 33 23 20 2-May-01 45 29 16 3-May-01 51 36 16 4-May-01 25 34 19 5-May-01 13 17 24 6-May-01 14 8 8 7-May-01 17 8 10 8-May-01 18 11 12 9-May-01 27 16 7
10-May-01 26 25 9
30 29 34 30 32 31
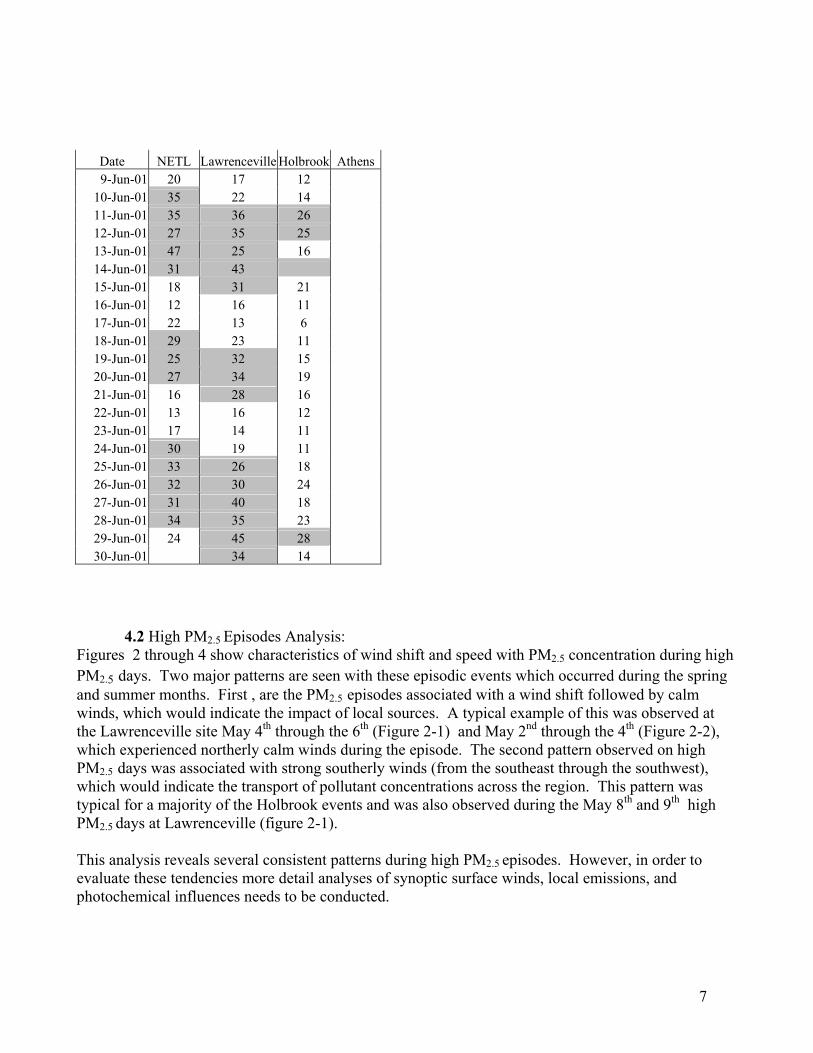
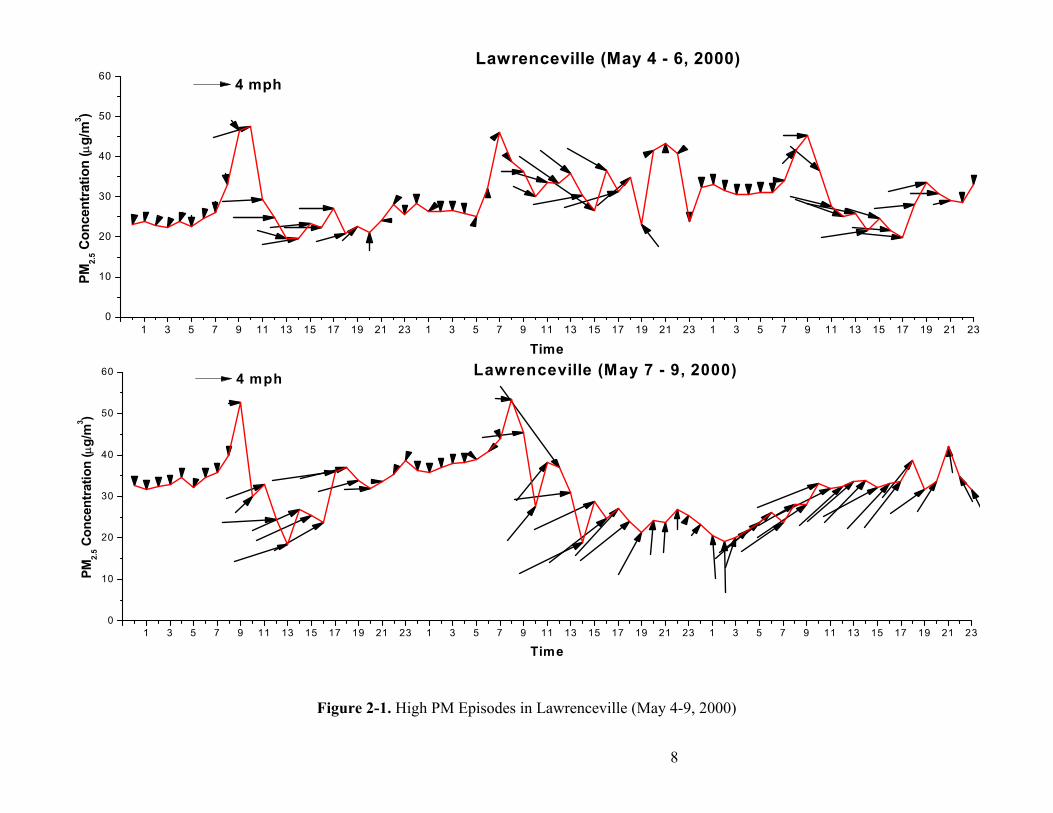
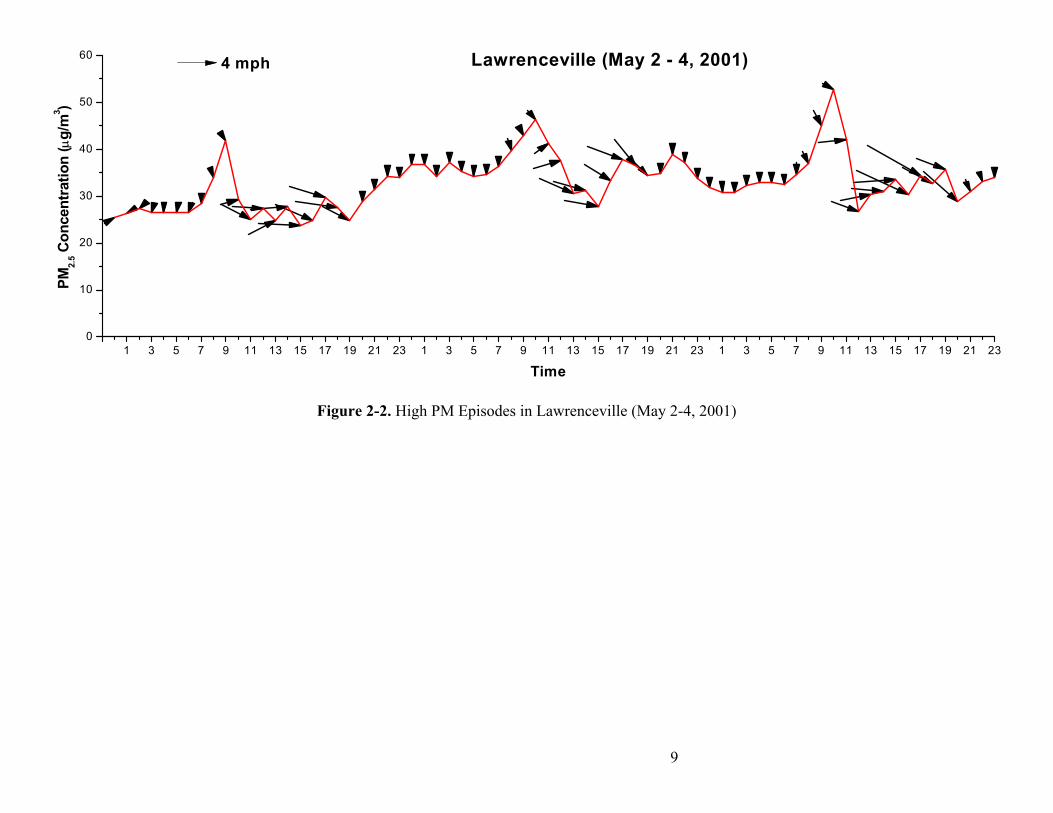
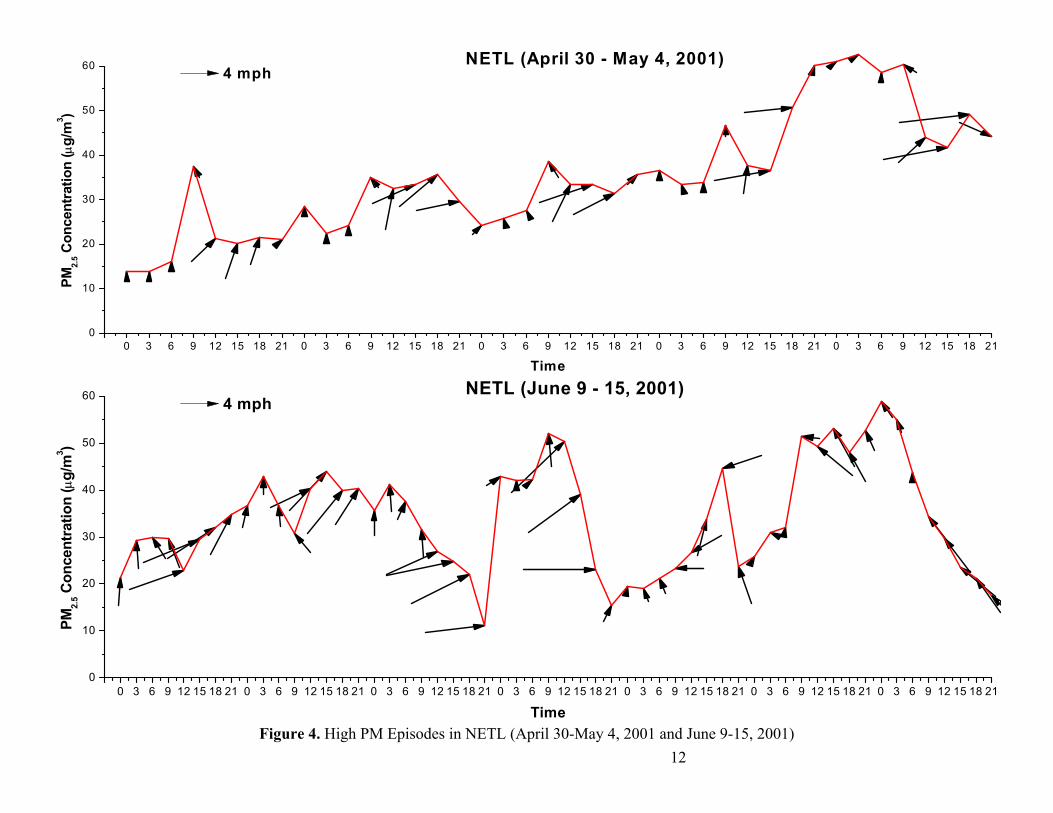
entration during high are seen with these episodic events which occurred during the spring
and summer months. First , are the PM episodes associated with a wind shift followed by calm this was observed at
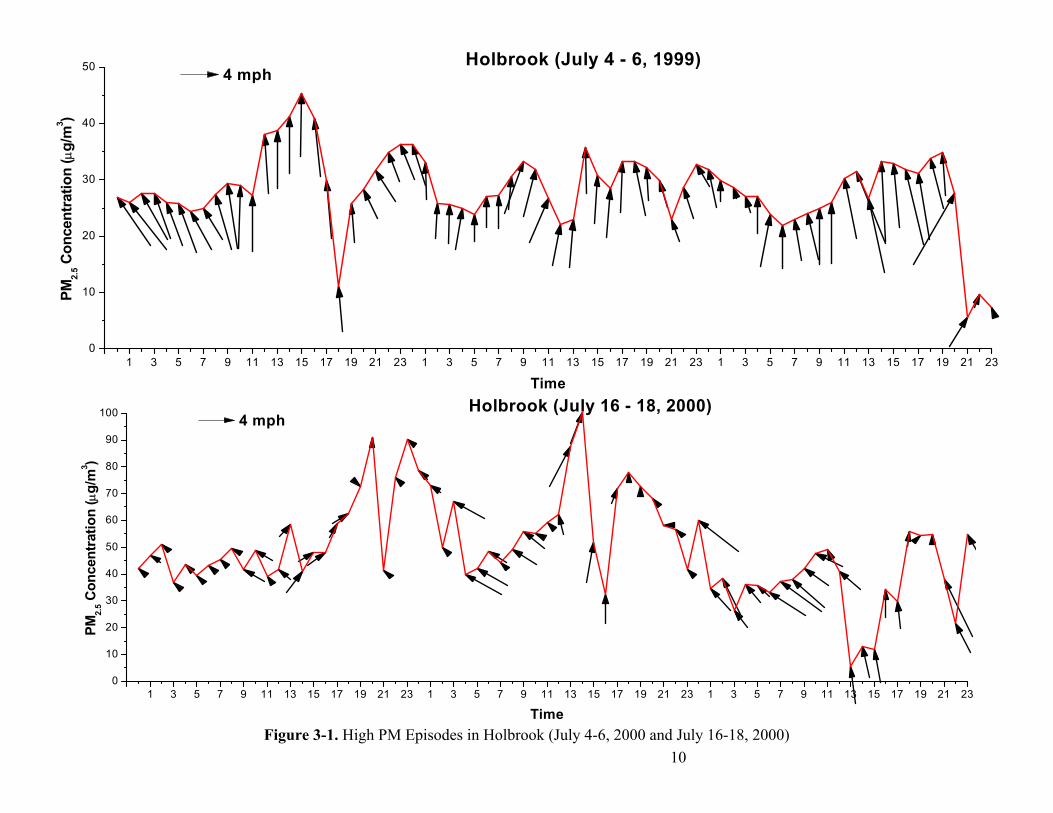
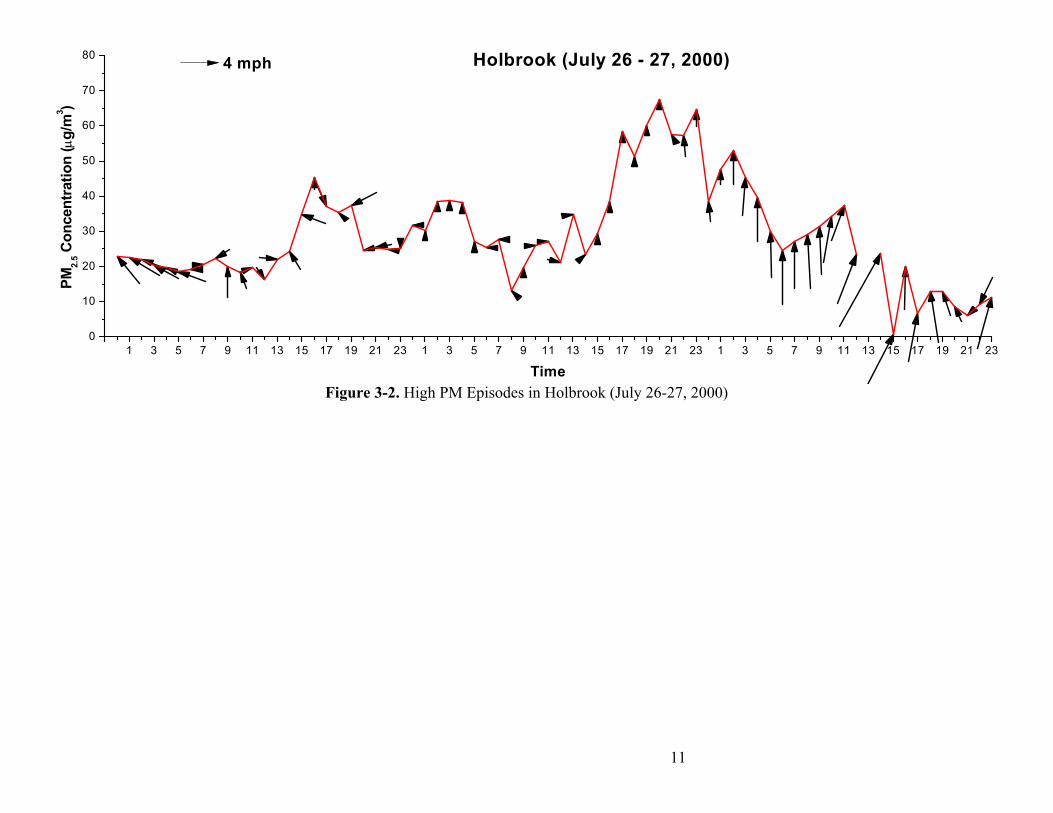
the 6 (Figure 2-1) and May 2 through the 4th (Figure 2-2), which experienced northerly calm winds during the episode. The second pattern observed on high PM2.5 days was associated with strong southerly winds (from the southeast through the southwest), which would indicate the transport of pollutant concentrations across the region. This pattern was typical for a majority of the Holbrook events and was also observed during the May 8th and 9th high PM2.5 days at Lawrenceville (figure 2-1). This analysis reveals several consistent patterns during high PM2.5 episodes. However, in order to evaluate these tendencies more detail analyses of synoptic surface winds, local emissions, and photochemical influences needs to be conducted.
NETL awren ille H broo AthensDate L cev ol9-Jun-01 20 17 12
10-Jun-01 14 11-Jun-01 26 12-Jun-01 25 13-Jun-01 14-Jun-01 29 15-Jun- 18 01 16-Jun- 12 16 01 11 17-Jun- 22 13 6 01 18-Jun-01 11 19-Jun-01 20-Jun-01 21-Jun- 16 01 22-Jun- 13 16 01 12 23-Jun- 17 14 01 11 24-Jun-0 1 11
k
35 22 35 3627 3547 25 16 31 43
31 21
29 23 25 32 15 27 34 19
28 16
30 19
4.2 High PM2.5 Episodes Analysis: Figures 2 through 4 show characteristics of wind shift and speed with PM2.5 concPM2.5 days. Two major patterns
29-Jun-01 24 45 28 30-Jun-01 34 14
25-Jun-01 33 26 18 26-Jun-01 32 30 24 27-Jun-01 31 40 18 28-Jun-01 34 35 23
2.5winds, which would indicate the impact of local sources. A typical example ofthe Lawrenceville site May 4th through th nd
7
1 3 5 7 9 11 13 15 17 19 21 23 1 3 5 7 9 11 13 5 17 19 21 23 1 3 5 7 9 11 13 15 17 19 21 230
10
20
30
40
50
60
Lawrenceville (May 4 - 6, 2000)PM
2.5 C
once
ntra
tion
(µg/
m3 )
4 mph
Time
1
(
1 3 5 7 9 11 13 15 17 19 21 23 1 3 5 7 9 11 13 15 17 19 21 23 1 3 5 7 9 11 13 15 17 19 21 230
10
20
30
40
50
60
Lawrenceville May 7 - 9, 2000)
PM2.
5 Con
cent
ratio
n (µ
g/m
3 )
4 mph
Time
Figure 2-1. High PM Episodes in Lawrenceville (May 4-9, 2000)
8
1 3 5 7 9 11 13 15 17 19 21 23 1 3 5 7 9 11 13 15 17 19 21 23 1 11 13 15 17 19 21 230
10
20
30
40
50
60
Lawrenceville (May 2 - 4, 2001)PM
2.5 C
once
ntra
tion
(µg/
m3 )
4 mph
Time
Figure 2-2. High PM Episodes in Lawrenceville (May 2-4, 2001)
3 5 7 9
9
1 3 5 7 9 11 13 15 17 19 21 23 1 3 5 7 9 11 15 17 19 21 23 1 3 5 7 9 11 13 15 17 19 21 230
10
20
30
40
50
Holbrook (July 4 - 6, 1999)PM
2.5 C
once
ntra
tion
(µg/
m3 )
4 mph
Time
1 3 5 7 9 11 13 15 17 19 21 23 1 3 5 7 9 11 13 15 17 19 21 23 1 3 5 7 9 11 13 15 17 19 21 230
10
20
30
40
50
60
70
80
90
100
Holbrook (J y 16 - 18, 2000)
PM2.
5 Con
cent
ratio
n (µ
g/m
3 )
4 mph
Time Figure 3-1. High PM Episodes in Holbrook (July 4-6, 2000 and July 16-18, 2000)
13
ul
10
1 3 5 7 9 11 13 15 17 19 21 23 1 3 5 7 9 11 13 15 17 19 21 23 9 11 13 15 17 19 21 230
10
20
30
40
50
60
70
80
Holbrook (July 26 - 27, 2000)PM
2.5 C
once
ntra
tion
(µg/
m3 )
4 mph
Time Figure 3-2. High PM Episodes in Holbrook (July 26-27, 2000)
1 3 5 7
11
0 3 6 9 12 15 18 21 0 3 6 9 12 15 18 21 0 3 6 9 1 15 18 21 0 3 6 9 12 15 18 21 0 3 6 9 12 15 18 210
10
20
30
40
50
60
NETL (April 30 - May 4, 2001)PM
2.5 C
once
ntra
tion
(µg/
m3 )
4 mph
Time
2
0 3 6 9 12 15 18 21 0 3 6 9 12 15 18 21 0 3 6 9 12 15 18 21 0 3 6 9 12 15 18 21 0 3 6 9 12 15 18 21 0 3 6 9 12 15 18 21 0 3 6 9 12 15 18 210
10
20
30
40
50
60
NETL (Jun 15, 2001)
PM2.
5 Con
cent
ratio
n (µ
g/m
3 )
e 9 - 4 mph
Time Figure 4. High PM Episodes in NETL (April 30-May 4, 2001 and June 9-15, 2001)
12
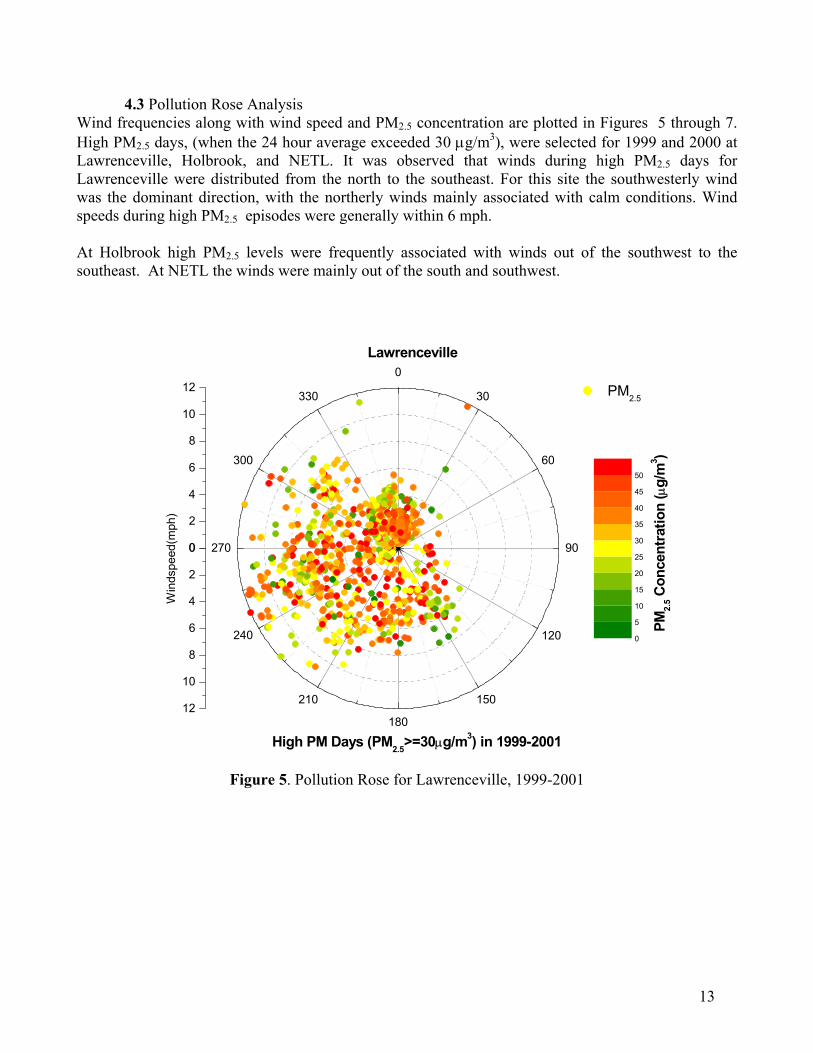
ures 5 through 7. r 1999 and 2000 at h PM2.5 days for
e southeast. For this site the southwesterly wind was the dominant direction, with the northerly winds mainly associated with calm conditions. Wind
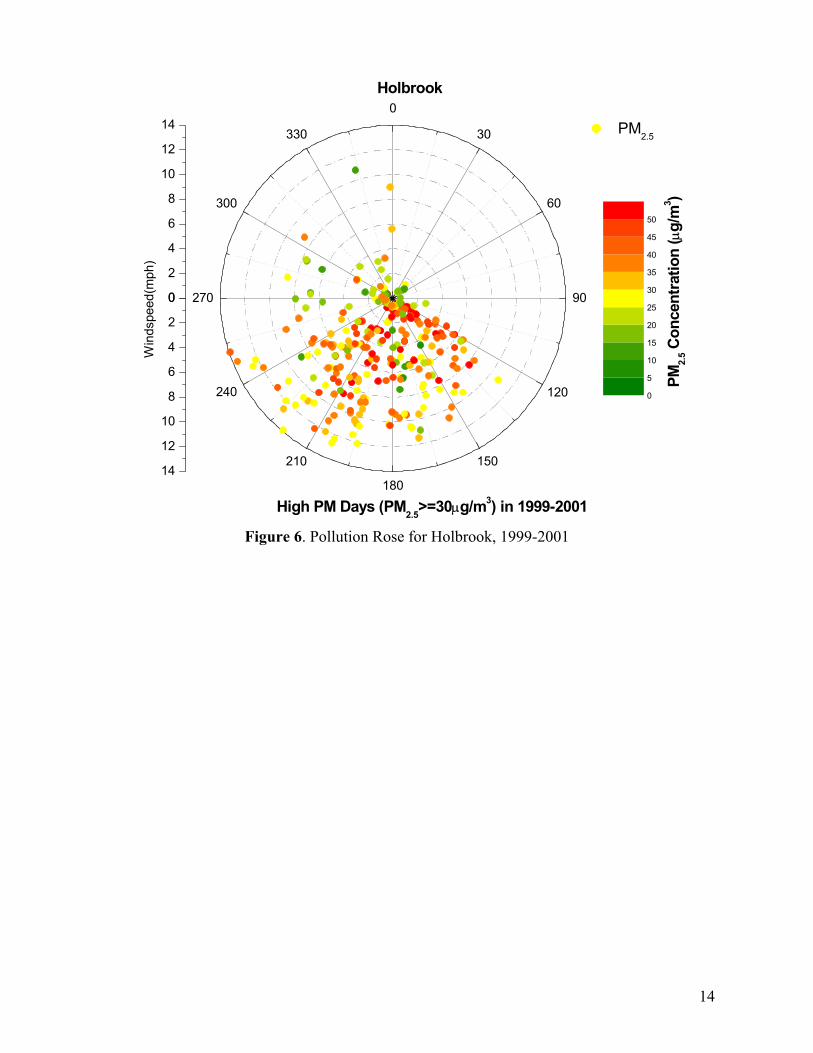
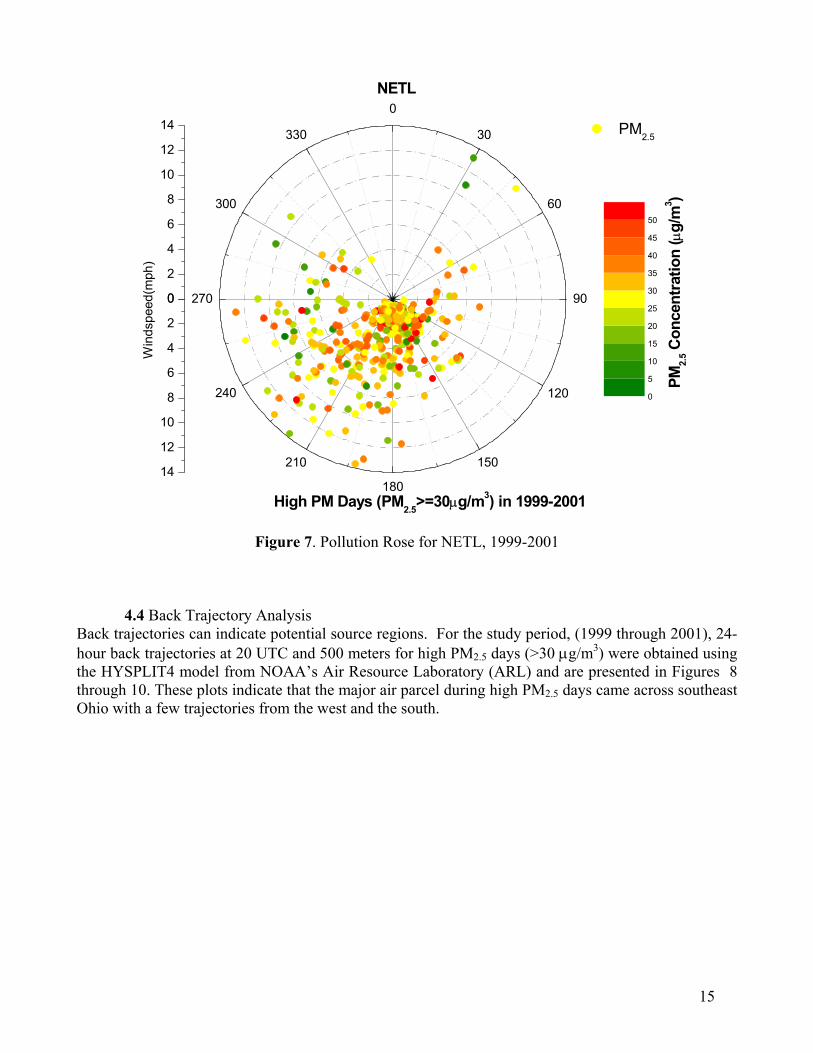
At Holbrook high PM2.5 levels were frequently associated with winds out of the southwest to the southeast. At NETL the winds were mainly out of the south and southwest.
4.3 Pollution Rose Analysis Wind frequencies along with wind speed and PM2.5 concentration are plotted in FigHigh PM2.5 days, (when the 24 hour average exceeded 30 µg/m3), were selected foLawrenceville, Holbrook, and NETL. It was observed that winds during higLawrenceville were distributed from the north to th
speeds during high PM2.5 episodes were generally within 6 mph.
0
2
4
6
8
10
120
30
60
90
120
150
180
210
270
300
330
0
2
4
6
8
10
12
PM
2.5 C
once
ntra
tion
(µg/
m3 )
High PM Days (PM2.5>=30µg/m3) in 1999-2001
Lawrenceville
Win
dspe
ed(m
ph)
PM2.5
0
5
10
15
20
25
30
35
40
45
50
Figure 5. Pollution Rose for Lawrenceville, 1999-2001
240
13
0
2
4
6
8
10
12
140
30
60
90
120
150
180
210
240
270
300
330
0
2
4
6
8
10
12
14
PM
2.5 C
once
ntra
tion
(µg/
m3 )
High PM Days (PM2.5>=30µg/m3) in 1999-2001
Holbrook
Win
dspe
ed(m
ph)
PM2.5
0
5
10
15
20
25
30
35
40
45
50
Figure 6. Pollution Rose for Holbrook, 1999-2001
14
0
2
4
6
8
10
12
140
30
60
90
120
150
180
210
240
270
300
330
0
2
4
6
8
10
12
14
PM
2.5 C
once
ntra
tion
(µg/
m3 )
High PM Days (PM2.5>=30µg/m3) in 1999-2001
NETL
Win
dspe
ed(m
ph)
PM2.5
0
5
10
15
20
25
30
35
40
45
50
Figure 7. Pollution Rose for NETL, 1999-2001
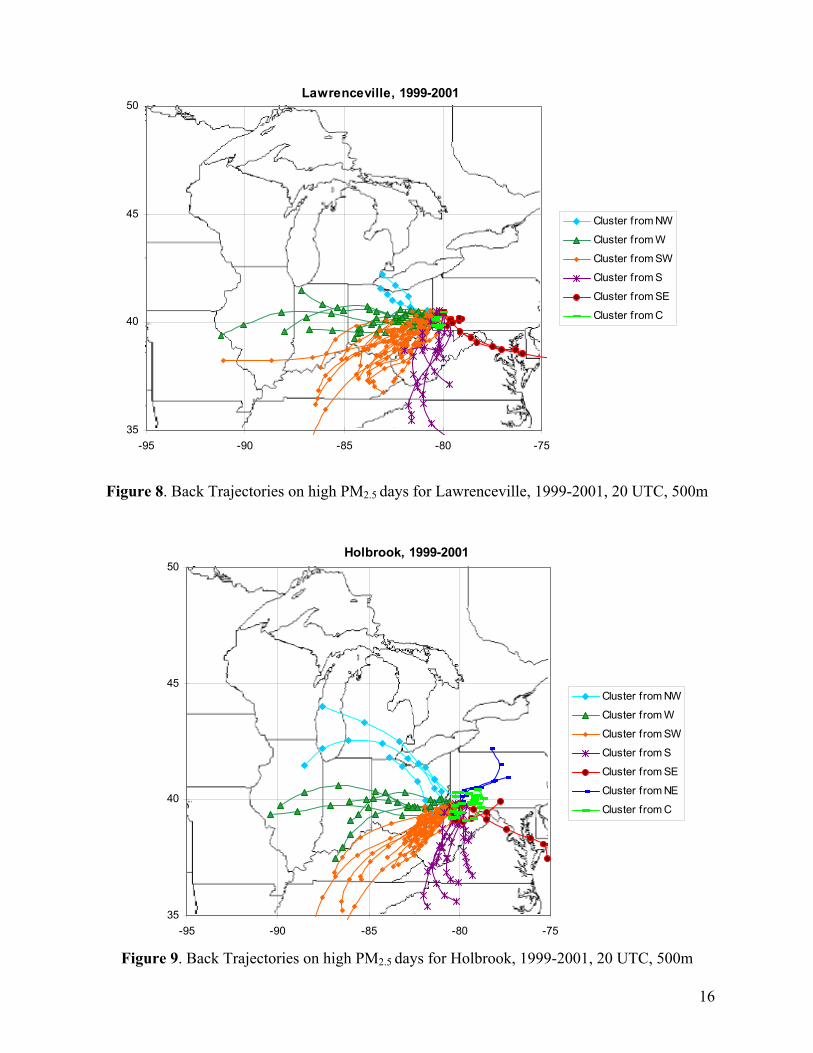
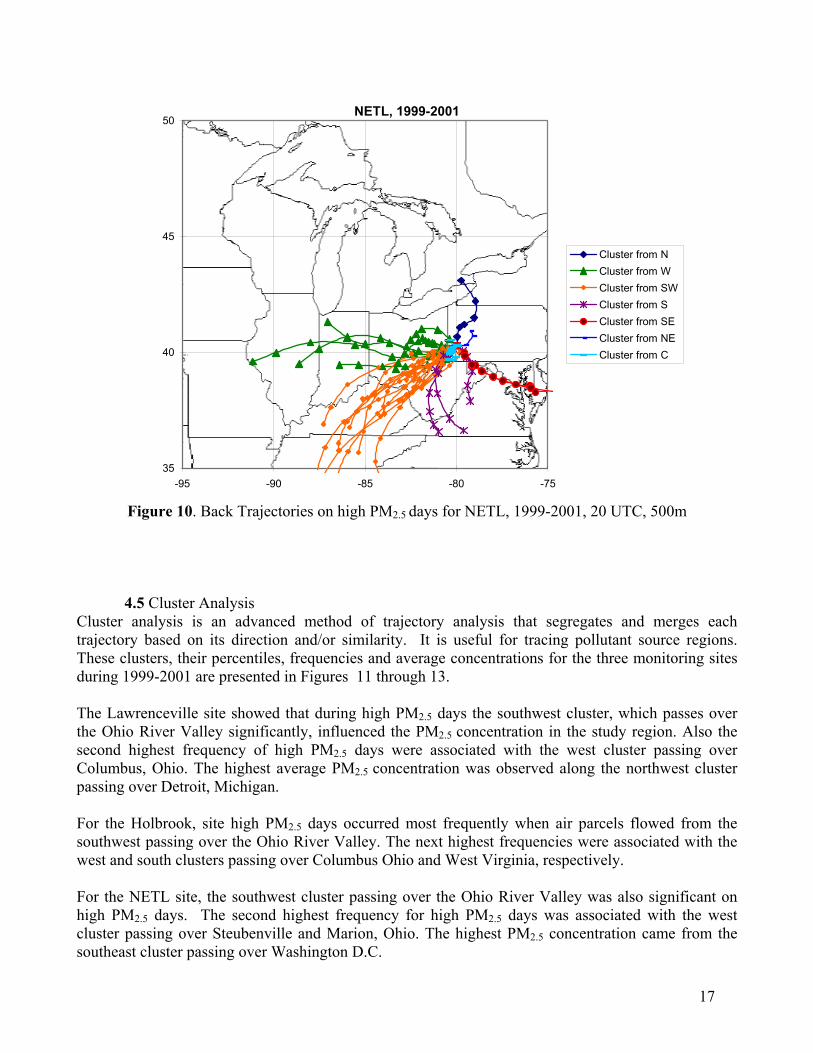
4.4 Back Trajectory Analysis Back trajectories can indicate potential source regions. For the study period, (1999 through 2001), 24-hour back trajectories at 20 UTC and 500 meters for high PM2.5 days (>30 µg/m3) were obtained using the HYSPLIT4 model from NOAA’s Air Resource Laboratory (ARL) and are presented in Figures 8 through 10. These plots indicate that the major air parcel during high PM2.5 days came across southeast Ohio with a few trajectories from the west and the south.
15
Lawrenceville, 1999-2001
35
40
45
50
-95 -90 -85 -80 -75
Cluster from NW
Cluster from W
Cluster from SW
Cluster from S
Cluster from SE
Cluster from C
Figure 8. Back Trajectories on high PM2.5 days for Lawrenceville, 1999-2001, 20 UTC, 500m
Holbrook, 1999-2001
35
40
45
50
-95 -90 -85 -80 -75
Cluster from NW
Cluster from W
Cluster from SW
Cluster from S
Cluster from SE
Cluster from NE
Cluster from C
Figure 9. Back Trajectories on high PM2.5 days for Holbrook, 1999-2001, 20 UTC, 500m
16
NETL, 1999-2001
35
40
45
50
-95 -90 -85 -80 -75
Cluster from NCluster from WCluster from SWCluster from SCluster from SECluster from NECluster from C
TC, 500m
and merges each ant source regions.
These clusters, their percentiles, frequencies and average concentrations for the three monitoring sites
2.5 west cluster, which passes over y region. Also the uster passing over e northwest cluster
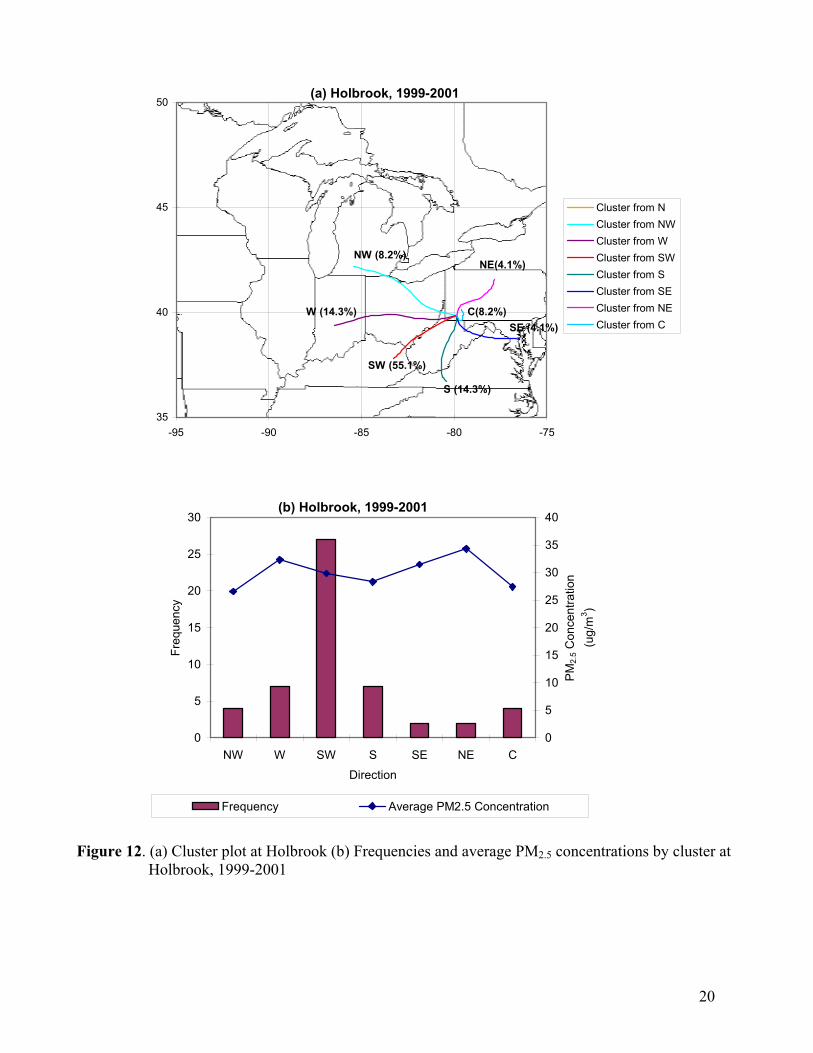
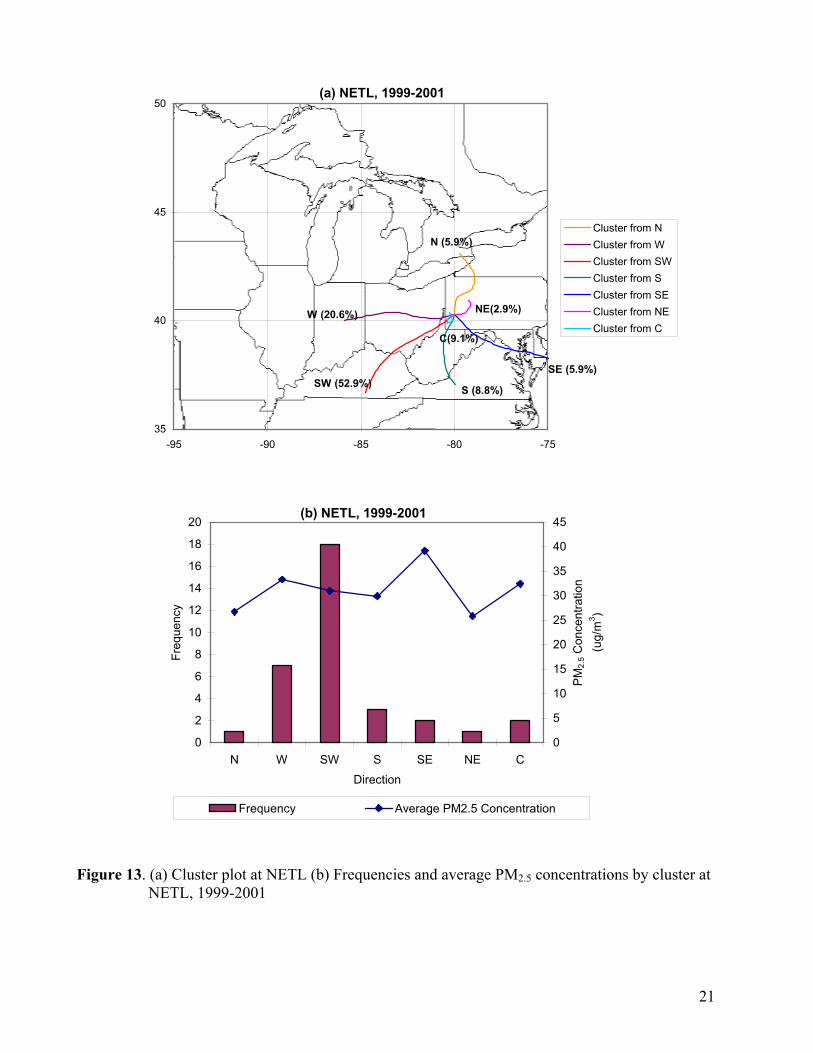
For the Holbrook, site high PM2.5 days occurred most frequently when air parcels flowed from the southwest passing over the Ohio River Valley. The next highest frequencies were associated with the west and south clusters passing over Columbus Ohio and West Virginia, respectively. For the NETL site, the southwest cluster passing over the Ohio River Valley was also significant on high PM2.5 days. The second highest frequency for high PM2.5 days was associated with the west cluster passing over Steubenville and Marion, Ohio. The highest PM2.5 concentration came from the southeast cluster passing over Washington D.C.
Figure 10. Back Trajectories on high PM2.5 days for NETL, 1999-2001, 20 U
4.5 Cluster Analysis
Cluster analysis is an advanced method of trajectory analysis that segregates trajectory based on its direction and/or similarity. It is useful for tracing pollut
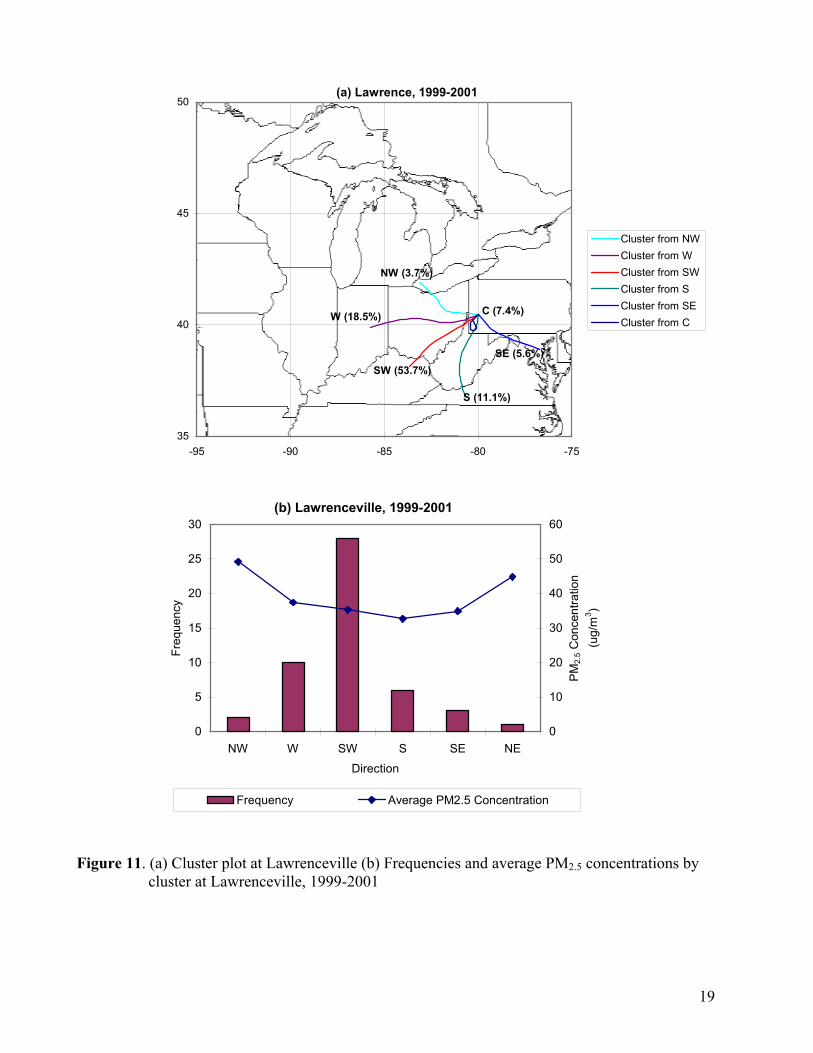
during 1999-2001 are presented in Figures 11 through 13. The Lawrenceville site showed that during high PM days the souththe Ohio River Valley significantly, influenced the PM2.5 concentration in the studsecond highest frequency of high PM2.5 days were associated with the west clColumbus, Ohio. The highest average PM2.5 concentration was observed along thpassing over Detroit, Michigan.
17

In general most of the clusters corresponded with metropolitan areas in neighboincluded Columbus and Steubenville in Ohio, Detroit, and Washington D.C. This urban centers may affect the PM levels in the UORVP region. Also, since a largeclusters d
ring states, which suggests that these percentage of the
uring high PM2.5 days passed over the Ohio River Valley, it would indicate that this area is one of the main source regions of PM2.5 and PM2.5 precursors affecting pollution levels within the study region.
18
(a) Lawrence, 1999-2001
35
40
45
50
-95 -90 -85 -80 -75
Cluster from NWCluster from WCluster from SWCluster from SCluster from SECluster from C
SE (5.6%)
S (11.1%)
SW (53.7%)
W (18.5%)
NW (3.7%)
C (7.4%)
(b) Lawrenceville, 1999-2001
5
10
15
20
25
30
NW W SW S SE NE
Direction
Freq
uenc
y
0
10
20
30
40
50
60
PM
2.5 C
once
ntra
tion
(ug/
m3 )
Frequency Average PM2.5 Concentration
Figure 11. (a) Cluster plot at Lawrenceville (b) Frequencies and average PM2.5 concentrations by
cluster at Lawrenceville, 1999-2001
0
19
(a) Holbrook, 1999-2001
35
40
45
50
-95 -90 -85 -80 -75
Cluster from NCluster from NWCluster from WCluster from SWCluster from SCluster from SECluster from NECluster from CSE (4.1%)
S (14.3%)
SW (55.1%)
W (14.3%) C(8.2%)
NW (8.2%)NE(4.1%)
(b) Holbrook, 1999-2001
0
10
15
20
25
30
NW W SW S SE NE C
Direction
Freq
uenc
y
0
5
10
15
20
25
30
35
40
PM
2.5 C
once
ntra
tion
(ug/
m3 )
Frequency Average PM2.5 Concentration
Figure 12. (a) Cluster plot at Holbrook (b) Frequencies and average PM2.5 concentrations by cluster at
Holbrook, 1999-2001
5
20
(a) NETL, 1999-2001
35
40
45
50
-95 -90 -85 -80 -75
Cluster from NCluster from WCluster from SWCluster from SCluster from SECluster from NECluster from C
N (5.9%)
SE 5.9%)
S (8.8%)SW (52.9%)
W (20.6%)
C(9.1%)
NE(2.9%)
(
(b) NETL, 1999-2001
0
4
6
8
10
12
14
16
18
20
N W SW S SE NE C
Direction
Freq
uenc
y
0
10
15
20
25
30
35
40
45
PM
2.5 C
once
ntra
tion
(ug/
m3 )
Frequency Average PM2.5 Concentration
Figure 13. (a) Cluster plot at NETL (b) Frequencies and average PM2.5 concentrations by cluster at
NETL, 1999-2001
2 5
21

22
2. Draxler, R.R.; Hess, G.D. Description of the HYSPLIT4 Modeling System, NOAA Tech Memo:
m for Trajectories, Dispersion, and Deposition; Australian Meteorological Magazine, 1998, 47, 295-508.
4. Rao, S.T.; Brankov, E.B.; Porter, P.S. Atmospheric Environment, 1998, 32(9), 1525-1534.
.D.; Pierce, C.E. Atmospheric Environment, 1992, 26A(14), 2575-2581.
ect and support from ATS who is managing the UROVP project. We would also like to acknowledge Richard Anderson from NETL who supplied PM2.5 and meteorological data from the NETL monitoring program and Ohio EPA and the Ohio Air Quality Development Authority for funding the monitoring campaign in Athens Ohio. Finally the authors would like to acknowledge the graduate students who worked on this project including Myoung Kim, Texas A&M – Kingsville and Li Sujuan, Ohio University.
5.0 REFERENCES
1. Draxler, R.R. Weather and Forecasting, 1996, 11, 111-114.
1997; ERL ARL-224.
3. Draxler, R.R.; Hess, G.D. An Overview of the HYSPLIT4 Modeling Syste
5. Dorling, S.R.; Davies, T
6.0 ACKNOWLEDGEMENTS The authors would like to acknowledge NETL for funding this proj