Embed Size (px)
Citation preview

Detailed Project Report (Year 2011-12)
District Watershed Development UnitGandhiagar
IWMP-9 (Dabhoda)
1.1 Project Background ................................................................................................................................................................................................................ 5
Table no.1: Basic project information ........................................................................................................................................................................................... 5
1.2 Need of Watershed Development Programme ..................................................................................................................................................................... 6
Table no. 2.1 Criteria and weightage for selection of watershed ............................................................................................................................................ 7
Table no.4: Developmental programmes running in the project area ....................................................................................................................................... 9
Table no. 5: Previous Watershed programmes in the project area .......................................................................................................................................... 10
Table no. 6: PIA ............................................................................................................................................................................................................................. 14
Table no. 7: Staff at PIA level ....................................................................................................................................................................................................... 15
Table no. 8: Land use pattern ...................................................................................................................................................................................................... 17
Table no. 9: Soil type and topography ........................................................................................................................................................................................ 18
Table no. 10: Flood and drought condition ................................................................................................................................................................................ 18
11. Edaphic Factors ...................................................................................................................................................................................................................... 19
Table no. 11.2: Soil Salinity/Alkalinity (Salinity ingress) ......................................................................................................................................................... 19
Table no. 11.3: Water logging Conditions .................................................................................................................................................................................. 20
Table no. 12: Climatic conditions ................................................................................................................................................................................................ 20
Table no. 13: Physiographic and relief ....................................................................................................................................................................................... 20
Table no. 14: Land ownership details ......................................................................................................................................................................................... 21
Table no. 15: Agriculture ............................................................................................................................................................................................................. 21
Table no. 16: Irrigation ................................................................................................................................................................................................................ 22
Table no. 17: Crop details (In Kgs) .............................................................................................................................................................................................. 22
Table no. 19: Drinking water ....................................................................................................................................................................................................... 23
Table no. 20: Details of Common Property Resources .............................................................................................................................................................. 23
Table no. 21: Demographic information ..................................................................................................................................................................................... 24
Table no. 22: Literacy rate ........................................................................................................................................................................................................... 24
Table no. 23: Migration details<.................................................................................................................................................................................................. 25
Table no. 24: Poverty ................................................................................................................................................................................................................... 25

Table no. 26: Facilities / HH assets ............................................................................................................................................................................................. 26
Table No 27: Income: ................................................................................................................................................................................................................... 27
Table no.28: Dependence on Forest/CPR ................................................................................................................................................................................... 27
Table No: 29: Work Force Details ............................................................................................................................................................................................... 27
Table no. 30: Details of Scientific Planning and Inputs in IWMP projects ............................................................................................................................... 33
Table no. 31: Watershed Committee details ............................................................................................................................................................................. 35
Table no. 32: SHG detail ............................................................................................................................................................................................................... 37
Table no. 33: UG detail ................................................................................................................................................................................................................. 38
Table no.34: Entry point activities (EPA) (All financial figures in lakh Rs.) ............................................................................................................................ 40
............................................................................................................................................................................................................................................... 41
4.3.2. Watershed Development Works: ................................................................................................................................................................................ 43
Table no.35: Details of activities of preparatory phase (All financial figures in lakh Rs.) ..................................................................................................... 43
Table no.36: Activities related to Surface water resources in the project areas (all financial figures in lakh Rs.) .............................................................. 45
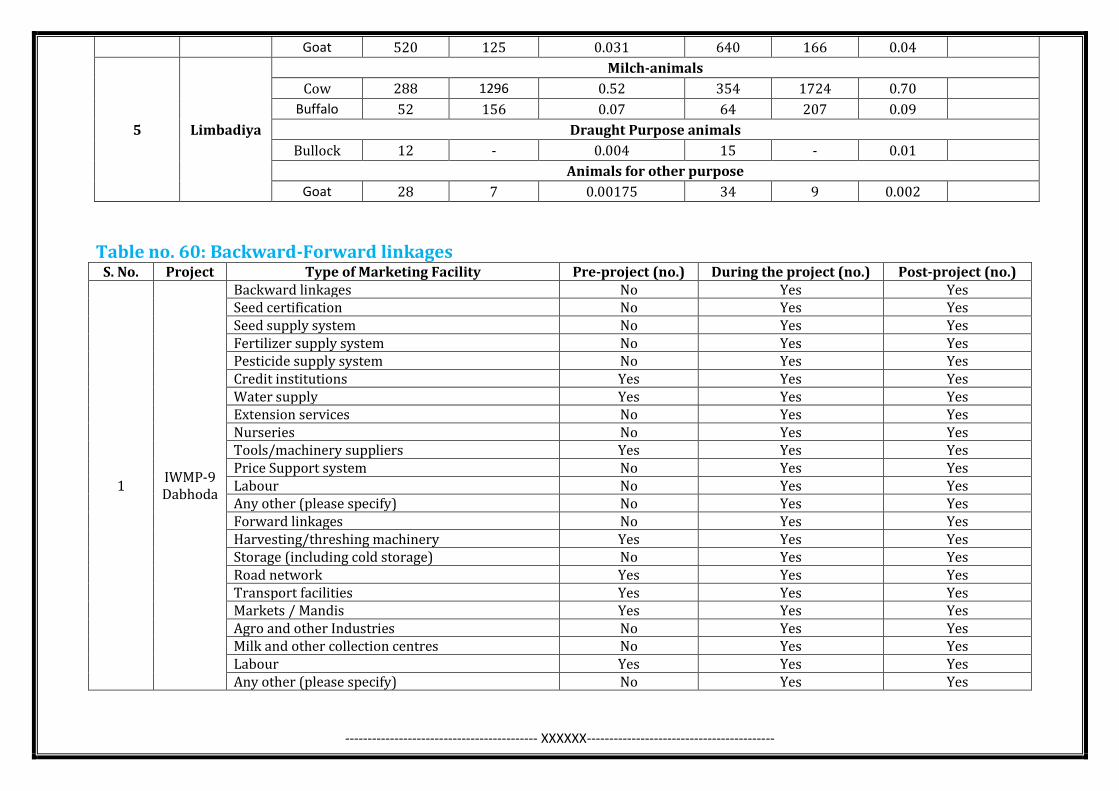
Table no. 60: Backward-Forward linkages ................................................................................................................................................................................ 72
CHAPTER – 1
PROJECT BACKGROUND
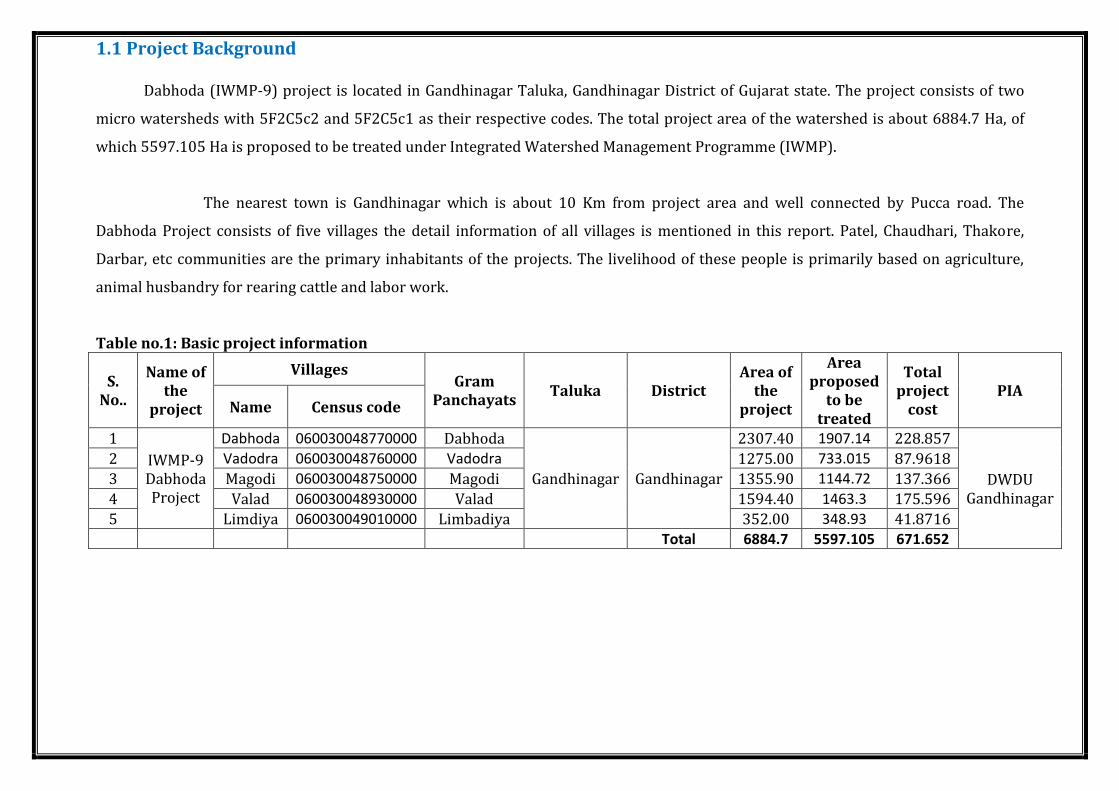
1.1 Project Background
Dabhoda (IWMP-9) project is located in Gandhinagar Taluka, Gandhinagar District of Gujarat state. The project consists of two
micro watersheds with 5F2C5c2 and 5F2C5c1 as their respective codes. The total project area of the watershed is about 6884.7 Ha, of
which 5597.105 Ha is proposed to be treated under Integrated Watershed Management Programme (IWMP).
The nearest town is Gandhinagar which is about 10 Km from project area and well connected by Pucca road. The
Dabhoda Project consists of five villages the detail information of all villages is mentioned in this report. Patel, Chaudhari, Thakore,
Darbar, etc communities are the primary inhabitants of the projects. The livelihood of these people is primarily based on agriculture,
animal husbandry for rearing cattle and labor work.
Table no.1: Basic project information
S. No..
Name of the
project
Villages Gram
Panchayats Taluka District
Area of the
project
Area proposed
to be treated
Total project
cost PIA
Name Census code
1
IWMP-9 Dabhoda Project
Dabhoda 060030048770000 Dabhoda
Gandhinagar Gandhinagar
2307.40 1907.14 228.857
DWDU Gandhinagar
2 Vadodra 060030048760000 Vadodra 1275.00 733.015 87.9618
3 Magodi 060030048750000 Magodi 1355.90 1144.72 137.366
4 Valad 060030048930000 Valad 1594.40 1463.3 175.596
5 Limdiya 060030049010000 Limbadiya 352.00 348.93 41.8716
Total 6884.7 5597.105 671.652

PRIORITY MAP
DABHODACLUSTER

1.2 Need of Watershed Development Programme
Watershed Development Programme is selected on the basis of thirteen parameter namely Poverty index, Percentage of SC/ST,
Actual wages, Percentage of small and marginal farmers, Ground water status, Moisture Index, Area under rain fed agriculture, Drinking
water situation in the area, Percentage of degraded land, Productivity potential of the land, Continuity of another watershed that has
already been developed/treated, Cluster approach for plain or for hilly terrain. Based on these thirteen parameters, a composite ranking
has been given to Watershed project as given in table no.3.
All the parameters taken together give a cumulative score of 73.5 to the watershed.
Table no.2: Weight-age of the project
Project name
Project type
Weight age
i ii Iii iv v Vi vii viii ix x xi xii Xiii TOTAL
IWMP 9 Others 7.5 3 0 5 3 0 5 5 10 10 10 15 0 73.5
Table no. 2.1 Criteria and weightage for selection of watershed Parameters include components related to Natural Resources and Socio Economic conditions
S. No Criteria Maximum
score Ranges & Scores
1 Poverty Index 10 Above 80% (10) 80 to 50% (7.5) 50 to 20% (5) Below 20% (2.5)
2 % of SC/ST population 10 >40% (10) 20 to 40% (5) <20% (3)
3 Actual Wages 5 <min wages (5) >= min wages (0)
4 % of Small Farmer &
Marginal Farmer
10 >80% (10) 50 to 80% (5) <50% (3)

5 Ground water Status 15 Over Exploited (15) Critical (10) Subcritical (5) Safe (0)
6 Moisture index 10 DDP block (10) DP Alluvial Plain (5) Non DDP or DPAP (0)
7 Assured irrigation area 15 <10% (15) 10 to 20% (10) 20 to 30% (5) >30% (reject)
8 Drinking water 10 No source (10) Problematic village
(7.5) partially covered (5) fully covered (0)
9 Degraded land 15 >20% (15) 10 to 20% (10) <10% (5)
10
Productivity potential 10 low production & high potential (10)
moderate production & moderate potential
(5)
High production & low potential (0)
11
Contiguity to watershed 10 Contiguous to previous and
contiguity within the micro WS (10)
Contiguity within micro WS but not to
previous (5)
neither both (0)
Table no.3: Watershed information
Name of the project No. Of watersheds to be treated Watershed code Watershed regime/type/order
IWMP-9 Dabhoda Project 2 5F2C5c1c 5F2C5c2f -

Table no.4: Developmental programmes running in the project area S.
No. Village Name
Name of the programme/scheme
Sponsoring agency
Objectives of the programme/scheme
Year of commencement
Estimated number of beneficiaries
1 Dabhoda
MGNREGA DRDA Employment Generation 2007-08 809
SARDAR AVAS YOJNA DRDA Housing Facility 2005-06 160
INDIRA AVAS YOJNA DRDA Housing Facility 2005-06 130
T.S.C DRDA Toilet Facility 2009-12 621
MISSION MANGALAM GLPC SHG's 2010-11 1121
2 Vadodra
MGNREGA DRDA Employment Generation 2007-08 211
SARDAR AVAS YOJNA DRDA Housing Facility 2005-06 54
INDIRA AVAS YOJNA DRDA Housing Facility 2005-06 38
T.S.C DRDA Toilet Facility 2009-12 298
MISSION MANGALAM GLPC 2010-11 395
3 Magodi
MGNREGA DRDA Employment Generation 2007-08 204
SARDAR AVAS YOJNA DRDA Housing Facility 2005-06 21
INDIRA AVAS YOJNA DRDA Housing Facility 2005-06 19
T.S.C DRDA Toilet Facility 2009-12 275
MISSION MANGALAM GLPC 2010-11 302
4 Valad
MGNREGA DRDA Employment Generation 2007-08 402
SARDAR AVAS YOJNA DRDA Housing Facility 2005-06 698
INDIRA AVAS YOJNA DRDA Housing Facility 2005-06 45
T.S.C DRDA Toilet Facility 2009-12 398
MISSION MANGALAM GLPC 2010-11 275
5 Limdiya
MGNREGA DRDA Employment Generation 2007-08 121
SARDAR AVAS YOJNA DRDA Housing Facility 2005-06 9
INDIRA AVAS YOJNA DRDA Housing Facility 2005-06 16
T.S.C DRDA Toilet Facility 2009-12 115
MISSION MANGALAM GLPC 2010-11 154

Table no. 5: Previous Watershed programmes in the project area
Sl no
Project name
Year starts
Name of villages
No. Of micro
watershed
Watershed
codes
Area under
treatment
Funding
source
Nodal agenc
y PIA
Total cost
Expenditure
incurred up to start of IWMP
% financial completi
on
% physical completi
on
- - - - - - - - - - - - - -
CHAPTER – 2
PROJECT IMPLEMENTING AGENCY
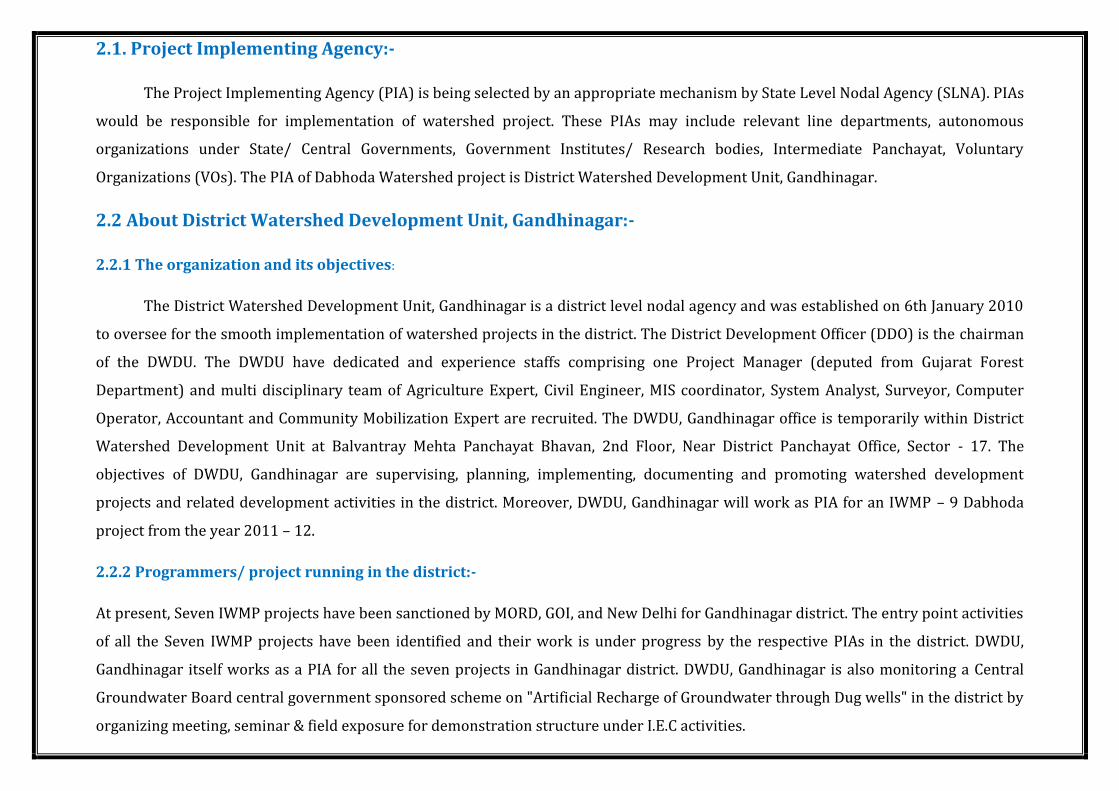
2.1. Project Implementing Agency:-
The Project Implementing Agency (PIA) is being selected by an appropriate mechanism by State Level Nodal Agency (SLNA). PIAs
would be responsible for implementation of watershed project. These PIAs may include relevant line departments, autonomous
organizations under State/ Central Governments, Government Institutes/ Research bodies, Intermediate Panchayat, Voluntary
Organizations (VOs). The PIA of Dabhoda Watershed project is District Watershed Development Unit, Gandhinagar.
2.2 About District Watershed Development Unit, Gandhinagar:-
2.2.1 The organization and its objectives:
The District Watershed Development Unit, Gandhinagar is a district level nodal agency and was established on 6th January 2010
to oversee for the smooth implementation of watershed projects in the district. The District Development Officer (DDO) is the chairman
of the DWDU. The DWDU have dedicated and experience staffs comprising one Project Manager (deputed from Gujarat Forest
Department) and multi disciplinary team of Agriculture Expert, Civil Engineer, MIS coordinator, System Analyst, Surveyor, Computer
Operator, Accountant and Community Mobilization Expert are recruited. The DWDU, Gandhinagar office is temporarily within District
Watershed Development Unit at Balvantray Mehta Panchayat Bhavan, 2nd Floor, Near District Panchayat Office, Sector - 17. The
objectives of DWDU, Gandhinagar are supervising, planning, implementing, documenting and promoting watershed development
projects and related development activities in the district. Moreover, DWDU, Gandhinagar will work as PIA for an IWMP – 9 Dabhoda
project from the year 2011 – 12.
2.2.2 Programmers/ project running in the district:-
At present, Seven IWMP projects have been sanctioned by MORD, GOI, and New Delhi for Gandhinagar district. The entry point activities
of all the Seven IWMP projects have been identified and their work is under progress by the respective PIAs in the district. DWDU,
Gandhinagar itself works as a PIA for all the seven projects in Gandhinagar district. DWDU, Gandhinagar is also monitoring a Central
Groundwater Board central government sponsored scheme on "Artificial Recharge of Groundwater through Dug wells" in the district by
organizing meeting, seminar & field exposure for demonstration structure under I.E.C activities.

2.2.3 SWOT (Strength, Weakness, Opportunities & Threats) Analysis of the DWDU
Strength:
(1) Dedicated and experience staff
(2) Independent District Level Nodal Agency with separate office
(3) Strong linkages with national and state level institutions, agricultural universities, North Gujarat University and NGOs for capacity
building and technical guidance
(4) Scientific planning in watershed projects with the help of BISAG, Gandhinagar
(5) District level monitoring, coordination and cooperation committee
(6) Well establishment of PRIs for social audits
Weakness:
(1) Insufficient funds for complete watershed projects per hectare
(2) No permanent staff
(3) No permanent office building
Opportunities:
(1) Sustainable livelihood generation by landless and asset less
(2) Improvement of socio economic status of poor
(3) Awareness generation among the illiterates through IEC activities by usage of new ICT activities.
(4) Usage of new technologies of watershed modelling and GPS for monitoring the watershed activities.

(5) Continuous learning
Threats:
(1) Lack of sustainable agriculture development
(2)Lack of contribution and cooperation from local peoples
(3) Lack of contribution and cooperation from local peoples
Table no. 6: PIA
Sl. No. Names of project Details of PIA
1 IWMP-9 Dabhoda Project
(i) Type of organization Government
(ii) Name of organization DWDU, Gandhinagar
(iii) Designation & Address Project Manager
(iv)Telephone 079 – 23247442
(v) Fax 079 – 23247442
(vi) E-mail [email protected]

Table no. 7: Staff at PIA level
S. No
. Name
Age
Sex
Designation Qualification Experien
ce Job assigned
Monthly remunerati
on
1 Mr. P C. Pathak 55 M Project
Director B Sc. 33 Yrs. Project Management 54,483/-
2 Ms. Ankita
Singh 26 F
Technical Expert
B. Tech(ECE), PGDFM(Environme
nt) 6 Months
Monitoring & to assist in project management
25,000/-
3 Mrs.Jignaben
Bhatt 34 F
MDT-Agriculture
BRS,M.R.S 15Yrs Agriculture activity & supervision 9,000/-
4 Mr.Kalpesh R.
Chauhan 20 M WDT-Engineer Diploma Engineer 4 Months Engineering Related Works 12,000/-
5 Mrs.Rekhaben
Rathod 32 F
WDT-Community
Mobiliser M.S.W 10Yrs. SHG & Social Awareness programmes 8,000/-
6 Mr.Rahul A.
Raval 23 M
MDT-Agriculture
BRS, M.S.W. 2Yrs. Agriculture activity 8,000/-
7 Mr.Mithun A.
Kalet 24 M WDT-Surveyor I.T.I. Surveyor 4Yrs. Surveying 6,000/-
8 Mr.Sagar Bhojak 25 M WDT-
Accountant B.com 5Yrs. Accounts 7,000/-
9 Mrs.Jyotiben
Naik 36 F WDT-DEO M.A,D.E.O,CCC 6.5Yrs. Maintain Data Cell 6,250/-

CHAPTER – 3
BASIC INFORMATION OF THE PROJECT AREA
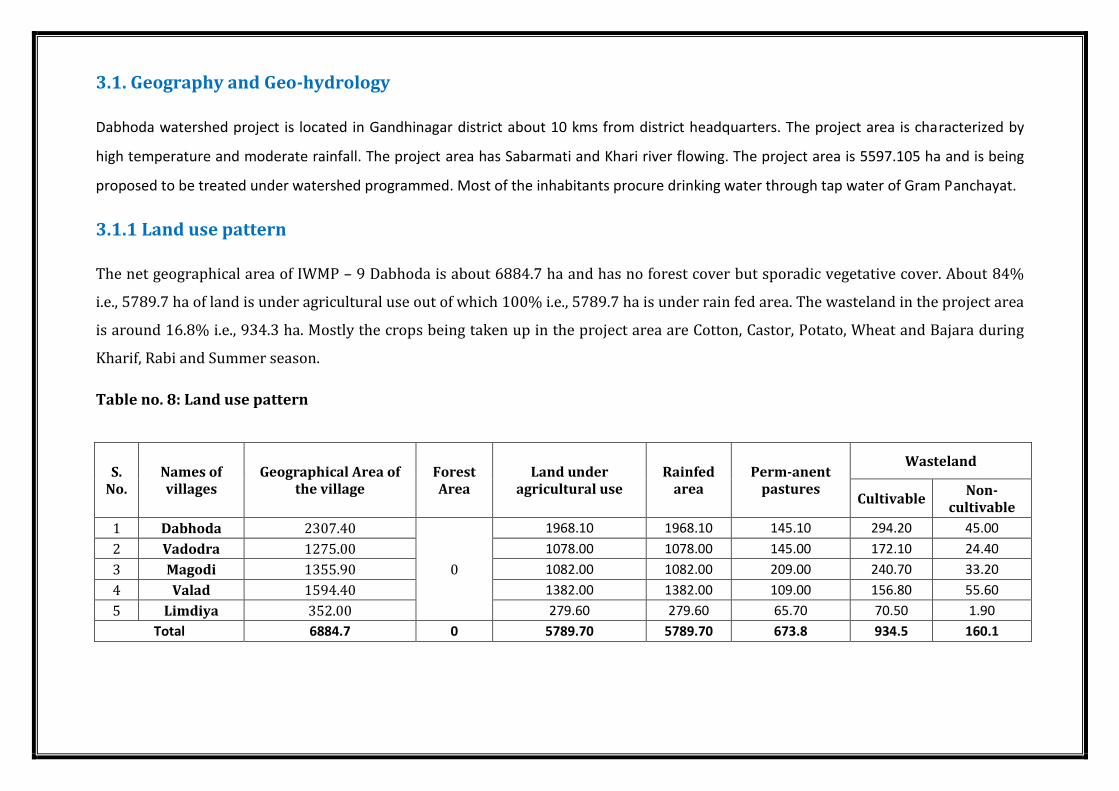
3.1. Geography and Geo-hydrology
Dabhoda watershed project is located in Gandhinagar district about 10 kms from district headquarters. The project area is characterized by
high temperature and moderate rainfall. The project area has Sabarmati and Khari river flowing. The project area is 5597.105 ha and is being
proposed to be treated under watershed programmed. Most of the inhabitants procure drinking water through tap water of Gram Panchayat.
3.1.1 Land use pattern
The net geographical area of IWMP – 9 Dabhoda is about 6884.7 ha and has no forest cover but sporadic vegetative cover. About 84%
i.e., 5789.7 ha of land is under agricultural use out of which 100% i.e., 5789.7 ha is under rain fed area. The wasteland in the project area
is around 16.8% i.e., 934.3 ha. Mostly the crops being taken up in the project area are Cotton, Castor, Potato, Wheat and Bajara during
Kharif, Rabi and Summer season.
Table no. 8: Land use pattern
S. No.
Names of villages
Geographical Area of the village
Forest Area
Land under agricultural use
Rainfed area
Perm-anent pastures
Wasteland
Cultivable Non-
cultivable
1 Dabhoda 2307.40
0
1968.10 1968.10 145.10 294.20 45.00
2 Vadodra 1275.00 1078.00 1078.00 145.00 172.10 24.40
3 Magodi 1355.90 1082.00 1082.00 209.00 240.70 33.20
4 Valad 1594.40 1382.00 1382.00 109.00 156.80 55.60
5 Limdiya 352.00 279.60 279.60 65.70 70.50 1.90
Total 6884.7 0 5789.70 5789.70 673.8 934.5 160.1
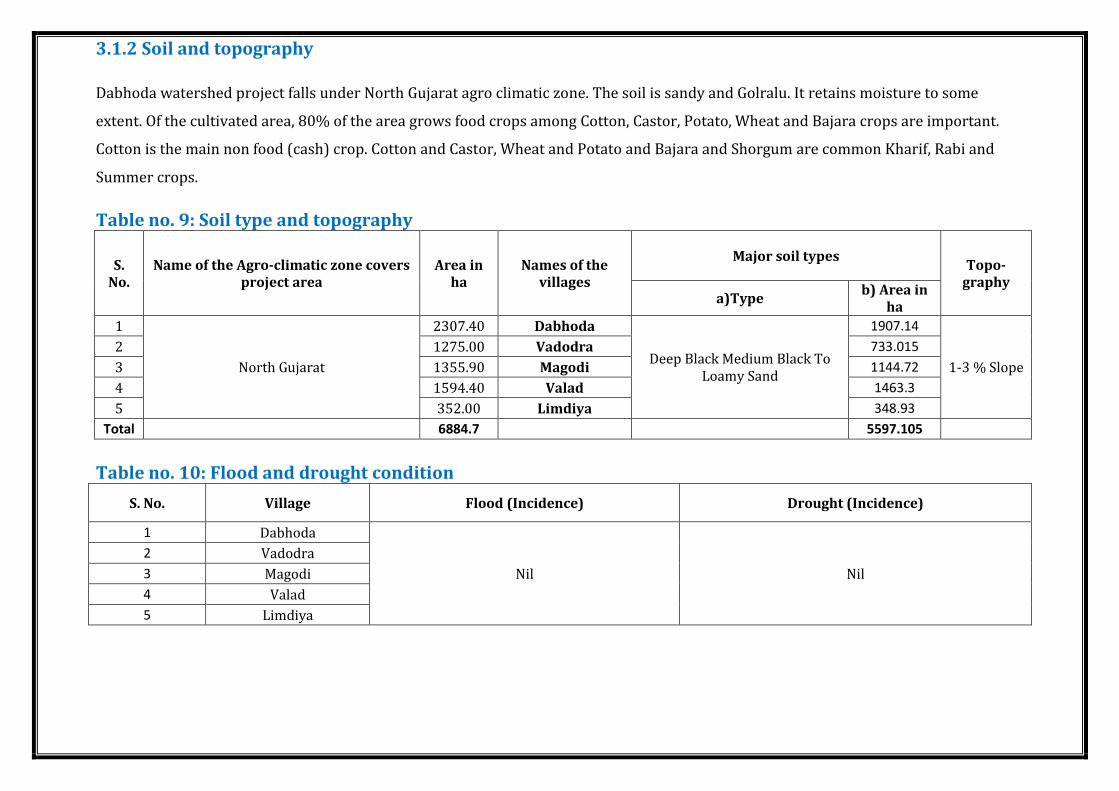
3.1.2 Soil and topography
Dabhoda watershed project falls under North Gujarat agro climatic zone. The soil is sandy and Golralu. It retains moisture to some
extent. Of the cultivated area, 80% of the area grows food crops among Cotton, Castor, Potato, Wheat and Bajara crops are important.
Cotton is the main non food (cash) crop. Cotton and Castor, Wheat and Potato and Bajara and Shorgum are common Kharif, Rabi and
Summer crops.
Table no. 9: Soil type and topography
S. No.
Name of the Agro-climatic zone covers project area
Area in ha
Names of the villages
Major soil types Topo-
graphy a)Type
b) Area in ha
1
North Gujarat
2307.40 Dabhoda
Deep Black Medium Black To Loamy Sand
1907.14
1-3 % Slope
2 1275.00 Vadodra 733.015
3 1355.90 Magodi 1144.72
4 1594.40 Valad 1463.3
5 352.00 Limdiya 348.93
Total 6884.7 5597.105
Table no. 10: Flood and drought condition
S. No. Village Flood (Incidence) Drought (Incidence)
1 Dabhoda
Nil Nil
2 Vadodra
3 Magodi
4 Valad
5 Limdiya
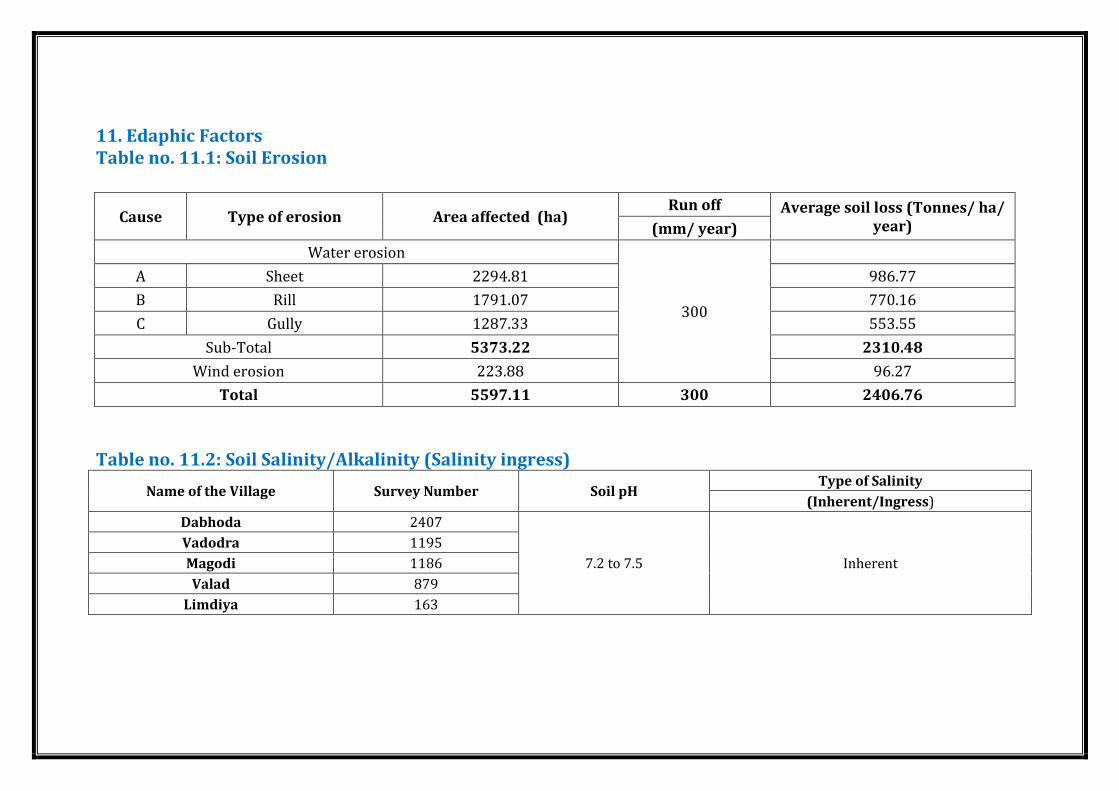
11. Edaphic Factors
Table no. 11.1: Soil Erosion
Cause Type of erosion Area affected (ha) Run off Average soil loss (Tonnes/ ha/
year) (mm/ year)
Water erosion
300
A Sheet 2294.81 986.77
B Rill 1791.07 770.16
C Gully 1287.33 553.55
Sub-Total 5373.22 2310.48
Wind erosion 223.88 96.27
Total 5597.11 300 2406.76
Table no. 11.2: Soil Salinity/Alkalinity (Salinity ingress)
Name of the Village Survey Number Soil pH Type of Salinity
(Inherent/Ingress)
Dabhoda 2407
7.2 to 7.5 Inherent
Vadodra 1195
Magodi 1186
Valad 879
Limdiya 163

Table no. 11.3: Water logging Conditions
Name of the Village Survey Number Reasons
Dabhoda
Nil Nil
Vadodra
Magodi
Valad
Limdiya
Table no. 12: Climatic conditions
Name of project Average rainfall- last 5 years Average temperature
IWMP-9 800-1000 mm
Summer Winter
Max Min Max Min
45 35 22 15
Table no. 13: Physiographic and relief
Project name Elevation (MSL) Slope range (%) Major streams
IWMP-9 82 1-3% Shabarmati, Khari

3.1.3 Land and Agriculture
The land of Gandhinagar district is fertile and agriculture can be taken up in the area. The ground water depth is around 150 –
200 m and runoff of the soil is not conspicuous. The temperature lies between 15-45 0C and rainfall ranges from 800-1000 mm.
The indiscriminate exploitation of land, water & vegetation has degraded and reduced the productivity. Ground water has
become the major source of drinking water as well as irrigation purpose due to its ubiquitous occurrence, easy availability & reliability.
Although chronologically it is fewer droughts prone compared to Saurashtra & Kutch regions.
The average land holding is about 0.18 ha. Migration ratio of farmers in the region is 0.8% them to ensure their livelihood without much
affecting the demographic profile of the village.
Table no. 14: Land ownership details
S. No. Village Total owned land
HHs giving land on lease HHs taking land on lease Gen OBC SC ST
1 Dabhoda 697.1 1348.3 262 - - -
2 Vadodra 347 732 196 - - -
3 Magodi 269.6 928.1 159.2 - - -
4 Valad 561 897.2 136.2 - - -
5 Limdiya 213 92 47 - - -
TOTAL 2087.7 3997.6 800.4 - - -
Table no. 15: Agriculture
S. No. Village
Net sown area
One time Two times Three times
1 Dabhoda 1915 930 595
2 Vadodra 1020 528 289
3 Magodi 1030 553 298
4 Valad 1345 665 345
5 Limdiya 252 136 76
TOTAL 5562 2812 1603
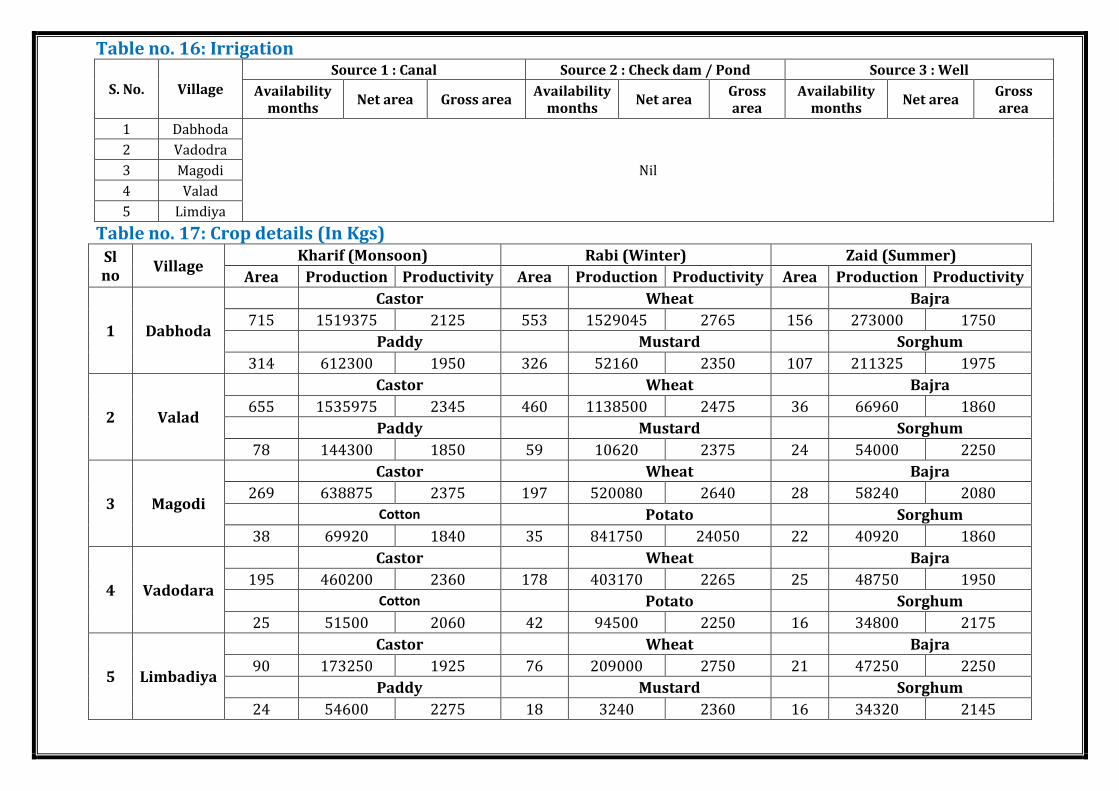
Table no. 16: Irrigation
S. No. Village
Source 1 : Canal Source 2 : Check dam / Pond Source 3 : Well
Availability months
Net area Gross area Availability
months Net area
Gross area
Availability months
Net area Gross area
1 Dabhoda
Nil
2 Vadodra
3 Magodi
4 Valad
5 Limdiya
Table no. 17: Crop details (In Kgs) Sl no
Village Kharif (Monsoon) Rabi (Winter) Zaid (Summer)
Area Production Productivity Area Production Productivity Area Production Productivity
1 Dabhoda
Castor Wheat Bajra
715 1519375 2125 553 1529045 2765 156 273000 1750
Paddy Mustard Sorghum
314 612300 1950 326 52160 2350 107 211325 1975
2 Valad
Castor Wheat Bajra
655 1535975 2345 460 1138500 2475 36 66960 1860
Paddy Mustard Sorghum
78 144300 1850 59 10620 2375 24 54000 2250
3 Magodi
Castor Wheat Bajra
269 638875 2375 197 520080 2640 28 58240 2080
Cotton Potato Sorghum
38 69920 1840 35 841750 24050 22 40920 1860
4 Vadodara
Castor Wheat Bajra
195 460200 2360 178 403170 2265 25 48750 1950
Cotton Potato Sorghum
25 51500 2060 42 94500 2250 16 34800 2175
5 Limbadiya
Castor Wheat Bajra
90 173250 1925 76 209000 2750 21 47250 2250
Paddy Mustard Sorghum
24 54600 2275 18 3240 2360 16 34320 2145

Table no. 18: Livestock
S. No. Village Buffalo Cow Total Milk
(Buffalo+Cow) Goat Sheep Bullock Hen Others
No milk No Milk Lit/Day No Milk No No No No
1 Dabhoda 2003 6009 1057 4756.5 10765.5 131 32.75 - 86 55 9
2 Vadodra 61 183 820 3690 3873 68 17 830 39 40 7
3 Magodi 110 330 950 4275 4605 325 81.25 - 45 25 5
4 Valad 1505 4515 1595 1777.5 6292.5 410 102.5 110 100 49 8
5 Limdiya 52 156 288 1296 1452 28 7 - 12 - 2
Table no. 19: Drinking water
S. No. Village Ground water table
(mt) Source of drinking water Availability in months Quality
1 Dabhoda 398m
Panchayat Tap Water / Bore Well 12 Months Potable
2 Vadodra 385m
3 Magodi 350m
4 Valad 389m
5 Limdiya 350m
Table no. 20: Details of Common Property Resources
S. No. Names of
project
CPR Total Area (ha) Area available for treatment (ha)
Particulars Area owned/ In possession of
Pvt.
persons
Govt.
PRI Any other
(Pl. Specify)
Pvt. persons
Govt.
PRI Any other
(Pl. Specify) (specify deptt.)
(specify deptt.)
1 Dabhoda project
Wasteland/ degraded land
1094.40 44.95
Pastures 4.00 1
Village Ponds/ Tanks
52.5 35.2

3.2 Socio-Economic Profile
3.2.1 Demographic Status
Dabhoda watershed project mainly covers five villages namely Dabhoda, Vadodara, Magodi, Valad and Limbadia which has total
6193 household with a net population (as per base-line survey) of 31324 with 16041 males and 15303 females. The sex ratio is about
953 females to 1000 males. There are about 137 BPL families. The average family size is of five members. The literacy rate is 59.82
percent with male literacy rate of 61.29 percent and a female literacy rate 38.71 percent.
The major castes in these villages are Patel, Chaudhari, Thakore, Darbar and others. Majority of population is involved in
agriculture and animal husbandry.
Table no. 21: Demographic information
S. No. Village Population SC ST
Total Male Female Total Male Female % Total Male Female %
1 Dabhoda 12400 6339 6061 555 291 264 4.48 50 29 21 0.40
2 Vadodra 5635 2886 2749 335 175 160 5.94 7 4 3 0.12
3 Magodi 4616 2389 2227 457 251 206 9.90 19 11 8 0.41
4 Valad 7508 3827 3681 155 75 80 2.06 301 156 145 4.01
5 Limdiya 1165 600 585 10 5 5 0.86 10 5 5 0.86
TOTAL 31324 16041 15303 1512 797 715 4.64 387 205 182 1.16
Table no. 22: Literacy rate
S. No. Village Literacy Literacy
% above age 14
Literacy % below
age 14 Total population
Total % Male % Female %
1 Dabhoda 7178 57.89 4517 62.93 2661 37.07 70 30 12400
2 Vadodra 3071 54.50 1928 62.78 1143 37.22 65 35 5635
3 Magodi 2691 58.30 1628 60.50 1063 39.50 77 23 4616
4 Valad 4336 57.75 2722 62.78 1614 37.22 80 20 7508
5 Limdiya 823 70.64 473 57.47 350 42.53 66 34 1165
TOTAL 18099 59.82 11268 61.29 6831 38.71 72 28 31324

Table no. 23: Migration details<
S. No. Village Total population
Migration Migration by months Main
reason for migration
Income during migration /
month Total Male Female Up to 3 months
3-6 months
More than 6
months
1 Dabhoda 12400 58 51 7 30 24 6
job 6500-8000
2 Vadodra 5635 41 35 6 27 22 5
3 Magodi 4616 35 33 2 20 17 3
4 Valad 7508 53 49 4 28 23 5
5 Limdiya 1165 19 18 1 13 12 1
TOTAL 31324 206 186 20 118 98 20
Table no. 24: Poverty
S. No. Village Total Household BPL
% of BPL HH Total Land
less HH % of land
less HH 0-16 16-20 Total
1 Dabhoda 2403 272 460 732 30.36 1155 48.06
2 Vadodra 1107 29 112 141 12.74 367 33.15
3 Magodi 935 101 197 298 31.87 275 29.41
4 Valad 1511 56 246 302 19.99 589 38.98
5 Limdiya 237 71 17 88 42.51 109 45.99
Total 6193 529 1032 1561 27.494 2495 39.12
Infrastructure facilities
Dabhoda project villages are well connected to Gandhinagar headquarters with pucca roads. The villages have electricity connection. All
villages have primary school and only Dabhoda and Valad villages is having higher secondary education, which is where students of
nearby villages including the other three project village students go for the secondary education.
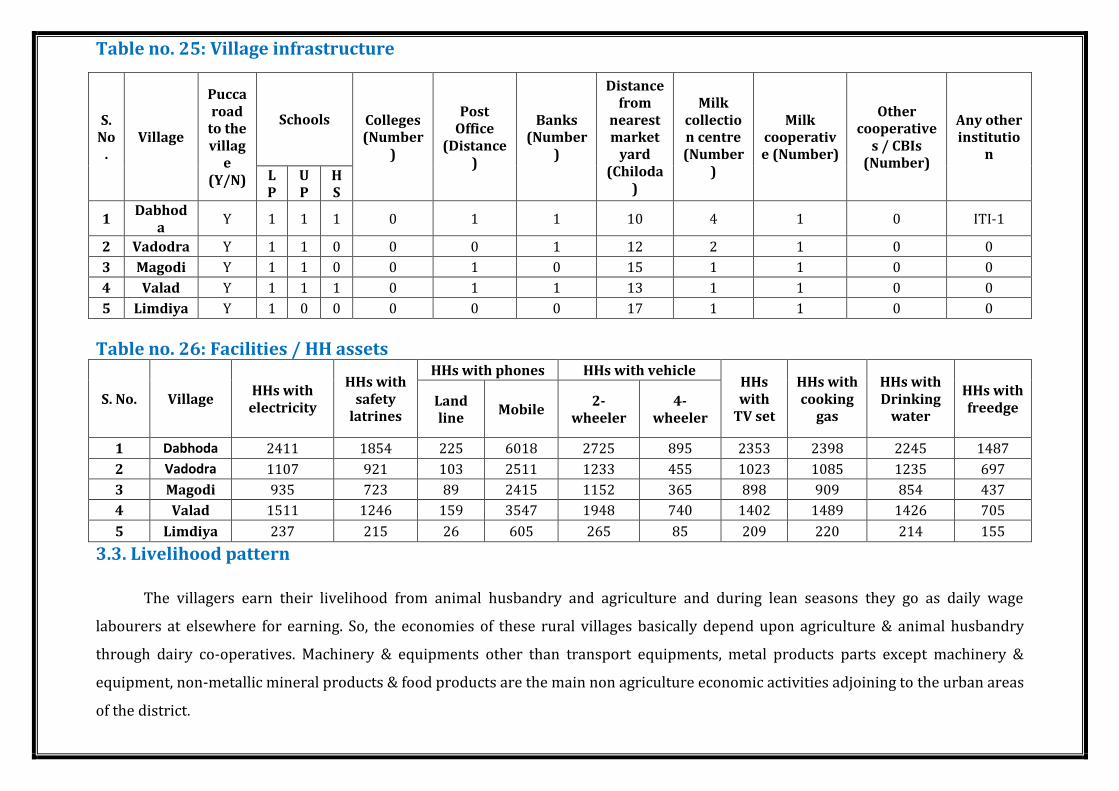
Table no. 25: Village infrastructure
S. No
. Village
Pucca road
to the villag
e (Y/N)
Schools Colleges (Number
)
Post Office
(Distance)
Banks (Number
)
Distance from
nearest market
yard (Chiloda
)
Milk collection centre (Number
)
Milk cooperative (Number)
Other cooperative
s / CBIs (Number)
Any other institutio
n
LP
UP
HS
1 Dabhod
a Y 1 1 1 0 1 1 10 4 1 0 ITI-1
2 Vadodra Y 1 1 0 0 0 1 12 2 1 0 0
3 Magodi Y 1 1 0 0 1 0 15 1 1 0 0
4 Valad Y 1 1 1 0 1 1 13 1 1 0 0
5 Limdiya Y 1 0 0 0 0 0 17 1 1 0 0
Table no. 26: Facilities / HH assets
S. No. Village HHs with
electricity
HHs with safety
latrines
HHs with phones HHs with vehicle HHs with
TV set
HHs with cooking
gas
HHs with Drinking
water
HHs with freedge Land
line Mobile
2-wheeler
4-wheeler
1 Dabhoda 2411 1854 225 6018 2725 895 2353 2398 2245 1487
2 Vadodra 1107 921 103 2511 1233 455 1023 1085 1235 697
3 Magodi 935 723 89 2415 1152 365 898 909 854 437
4 Valad 1511 1246 159 3547 1948 740 1402 1489 1426 705
5 Limdiya 237 215 26 605 265 85 209 220 214 155
3.3. Livelihood pattern
The villagers earn their livelihood from animal husbandry and agriculture and during lean seasons they go as daily wage
labourers at elsewhere for earning. So, the economies of these rural villages basically depend upon agriculture & animal husbandry
through dairy co-operatives. Machinery & equipments other than transport equipments, metal products parts except machinery &
equipment, non-metallic mineral products & food products are the main non agriculture economic activities adjoining to the urban areas
of the district.

Table No 27: Income:
S. No. Village Agriculture
(Lakhs) Animal Husbandry Casual labour Others Total
1 Dabhoda 321.51 302.45 41.55 35.14 700.65
2 Vadodra 102.46 85.48 14.69 9.45 212.08
3 Magodi 235.68 198.75 21.84 16.81 473.08
4 Valad 291.78 227.25 30.21 21.76 571
5 Limdiya 51.08 33.15 7.05 4.29 95.57
TOTAL 1002.51 847.08 115.34 87.45 2052.38
Table no.28: Dependence on Forest/CPR
S. No. Village
Benefit type 1
Benefit type
2
Benefit type 3
Total income
% sells Income % sells Income % sells Income
1 Dabhoda
Nil
2 Vadodra
3 Magodi
4 Valad
5 Limdiya
Table No: 29: Work Force Details
S. No. Village Total workforce Agriculture Animal
husbandry (AH)
Agriculture + AH
Casual labour
Services Handicraft Others
1 DABHODA 2715 1113 950 733 326 190 0 136
2 VADODARA 1251 513 438 338 150 88 0 63
3 MAGODI 1057 433 370 285 127 74 0 53
4 VALAD 1707 700 598 461 205 120 0 85
5 LIMBADIYA 268 110 94 72 32 19 0 13
TOTAL 6998 2869 2449 1889 840 490 0 350

Problems faced in Agriculture
1. Urbanization of existing land:
As Gandhinagar district is the capital of Gujarat state, the villages situated in and around the area are being urbanized. Most of the
agricultural land is being made into residential area and construction made for commercial purpose. Due to this, the agricultural
production is also decreasing.
2. Degradation of land by high use of fertilizers:
With high of chemical fertilizers, the fertile agricultural land is getting degraded and as a result it leads to soil pollution. The farmers
should be made aware of the use of bio – fertilizers instead of chemical fertilizers.
3. Traditional farming methods:
This is the factor that leads low productivity. There is lot of ignorance about the use of new farming methods and technologies such as
multiple cropping. They use less FYM and other input in a proper way that is why they don’t get 100% output.
4. Lack of adequate machinery:
Even today a large number of farmers use wooden ploughs and bullocks. They don’t have adequate machinery like seed drill etc. The old
machinery takes more time in tillage practices. So it leads to low productivity.
5. Lack of good quality seeds and fertilizers:
Good quality seed, fertilizer and pesticide are important factor in agriculture productivity. The use of good quality leads to higher land
productivity. The farmers should be made aware and must be encouraged to go for good quality seeds, fertilizers and pesticides when
necessary.
6. Lack of rural credit:
Farmers face so many problems for rural credit and it leads to low agricultural productivity. Farmers need credit mainly for the
purchase of various inputs such as seed, fertilizers, and pesticides and for repair of implements. They use long term credit for buying
land, and for investment to improve the quality of land, buying the new implements and improving irrigation facilities.

CHAPTER – 4
WATERSHED ACTIVITIES

Watershed Activities
Watershed management as a strategy is been adapted by Government of India especially in the rain fed regions of semi-arid
tropics. These regions are characterized by low and undependable rain, low soil fertility, poor infrastructure development, low literacy
and less incidence of migration. The inherent low fertility of crops results in high productivity of crops which have a very low biological
efficiency.
Several studies have identified that there is a need of a systematic and scientific approach to deal with watershed development.
The common guidelines generate a fresh and flexible framework for the next generation in enhancing the watershed developmental
agro – horti based, forestry based & dairy developmental activities for livelihood interventions.
4.1. Scientific Planning
1. Cluster Approach
This envisages a broader vision of Geo-hydrological unit which involves treating a cluster of micro-watershed. The
Dabhoda Watershed Project consists of four micro- watersheds. Further Dabhoda watershed project is in continuation with other
past watershed projects. This gives an element of continuation of the programme.
2. Base line Survey (Holistic Approach)
To access the impact of any watershed development programme, a detailed baseline survey has to be conducted. This acts
a benchmark for any intervention during and post implementation of any development programme. A detailed baseline survey
has been undertaken which involved household census survey, Bio-physical survey and Village level data collection from Village
Panchayat Talati –cum mantri. Household census survey includes a detailed questionnaire which has been filled by visiting each
and every house-hold in the village. This gave in the details of the demographic profile of the village, the literacy percentage,
SC/ST population, number of BPL household, livestock population, and Net consumption rate in the village, average milk
production of the cattle’s and various schemes running and their benefits to be accrued. Bio-physical survey has been undertaken
to identify various natural resources available in the village. It included the soil typology, various irrigation networks in the area,
crop taken in the field, Cropping pattern, bio fertilizer, fertilizer used and various sources of irrigation in the field.
3. Participatory Rural Appraisal (PRA)
The past experience of watershed has given tremendous input to focus on creating accountability of the 44 Stake – holders
towards the programme. This has created an emphasis to include all the stakeholders’ communities and their local and
indigenous Technological Knowledge (ITK) while planning for any activity. Participatory approach provides a new path for
planning, implementing, and monitoring and post- withdrawal activities with a complete accountability of the stakeholders. This
decrease the effort of the ground staff i.e. WDT members and involves more of villagers as implementers. Various PRA techniques
like resource mapping, social mapping, and seasonal calendars were used to understand the physical and social orientation of the
village in general and in watershed specifically. These tools put the villagers in ease than the complicated questionnaires. Various
tools like Matrix ranking, Venn diagram were used to identify various local vegetations (apt for afforestation), introduction of
economically viable plant species, Fodders crops, various active institutions and their significance in the life of the rural farmers.
4. Use of GIS and Remote sensing for Cartographic planning
Use of various high scientific tools has been promoted extensively at various stages of watershed development.
a) Prioritization
Geographical Information System (GIS) has been used for prioritization process. Various layer maps like topographical maps,
geographical map, cadastral map, thematic maps i.e., vegetation, density, & Sr.ope maps for collecting coordinates & altitude of
ware points were created. For Geo-morphological, Soil, BPL Population, SC/ST population, Canal, Roads, Rivers, Ground water
Status, Nurseries, Check dams, Boribund, Cross bund, Drinking water situation Sr.ope percent. These were all given proper
weightages according to the DoLR specification. This helped in prioritization of various watershed areas.
b) Planning
A action plan matrix was been formulated by State Level Nodal Agency(SR.NA) taking into account various features like the
Sr.ope percent, soil Depth, Soil Texture, Soil erosion in the area for wasteland, forest land and agricultural land.
Global positioning System (GPS) was used to identify each and every water conservation structures available in the project
area. This will be used to create a map. Contour Map of vertical interval of 1 meter at a scale of 1:8000 was used for identifying
various location specific for soil and water conservation structures.
c) Hydrological modelling
Hydrology modelling technique has been used for locating drainage, stream length, flow direction, sink, and Flow
accumulation. This model overlaid over cadastral map Hel to calculate the catchment area of each structures like the check dam
etc. This has helped to remove the human error which generally occurring while calculating the catchment area of a check dam
precisely.
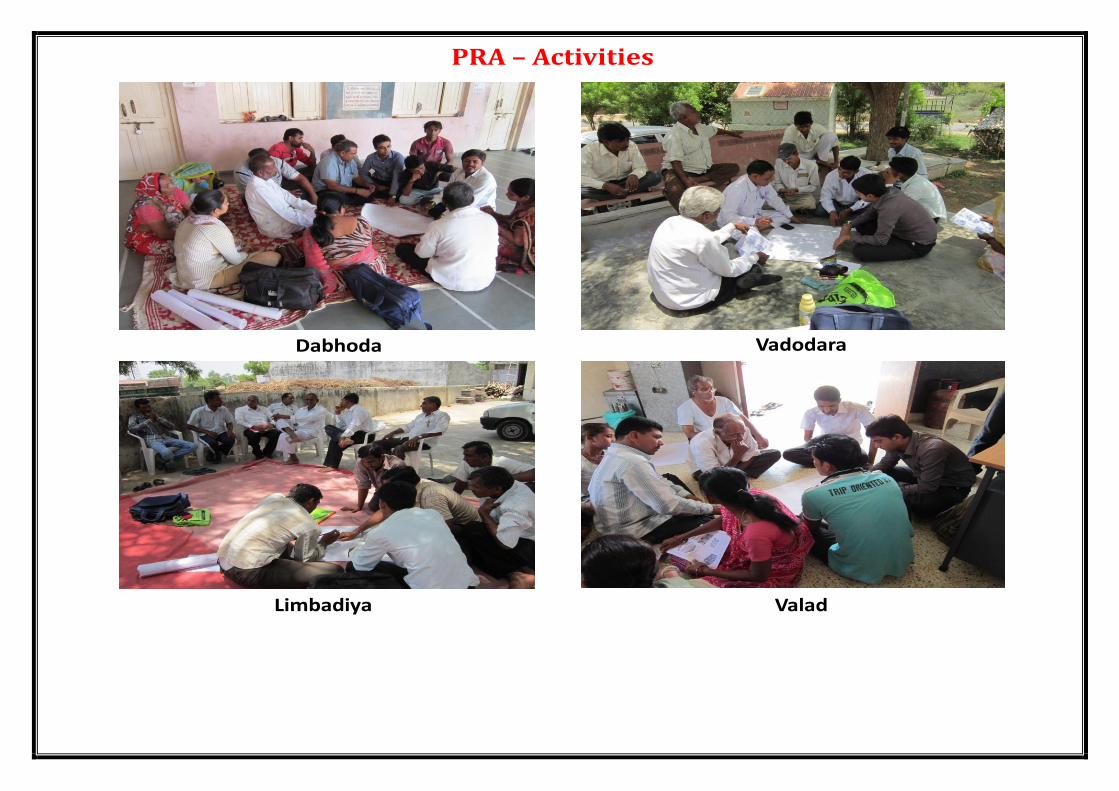
PRA – Activities
Dabhoda Vadodara
Limbadiya Valad

Table no. 30: Details of Scientific Planning and Inputs in IWMP projects
S. No.
Scientific criteria/ inputs used Whether scientific criteria was used
(A) Planning Cluster approach Yes Whether technical back-stopping for the project has been arranged? If yes, mention the name of the Institute Baseline survey Yes Hydro-geological survey Yes Contour mapping Yes Participatory Net Planning (PNP) Yes Remote sensing data-especially soil/ crop/run-off cover Yes Ridge to Valley treatment Yes Online IT connectivity between (1) Project and DRDA cell/ZP Yes (2) DRDA and SLNA Yes (3) SLNA and DoLR Yes Availability of GIS layers 1. Cadastral map Yes 2. Village boundaries Yes 3. Drainage Yes 4. Soil (Soil nutrient status) Yes 5. Land use Yes 6. Ground water status Yes 7. Watershed boundaries Yes 8. Activity Yes
Crop simulation models
Integrated coupled analyzer/ near infrared visible spectroscopy/ medium spectroscopy for high speed soil nutrient analysis
Normalized difference vegetation index (NDVI)
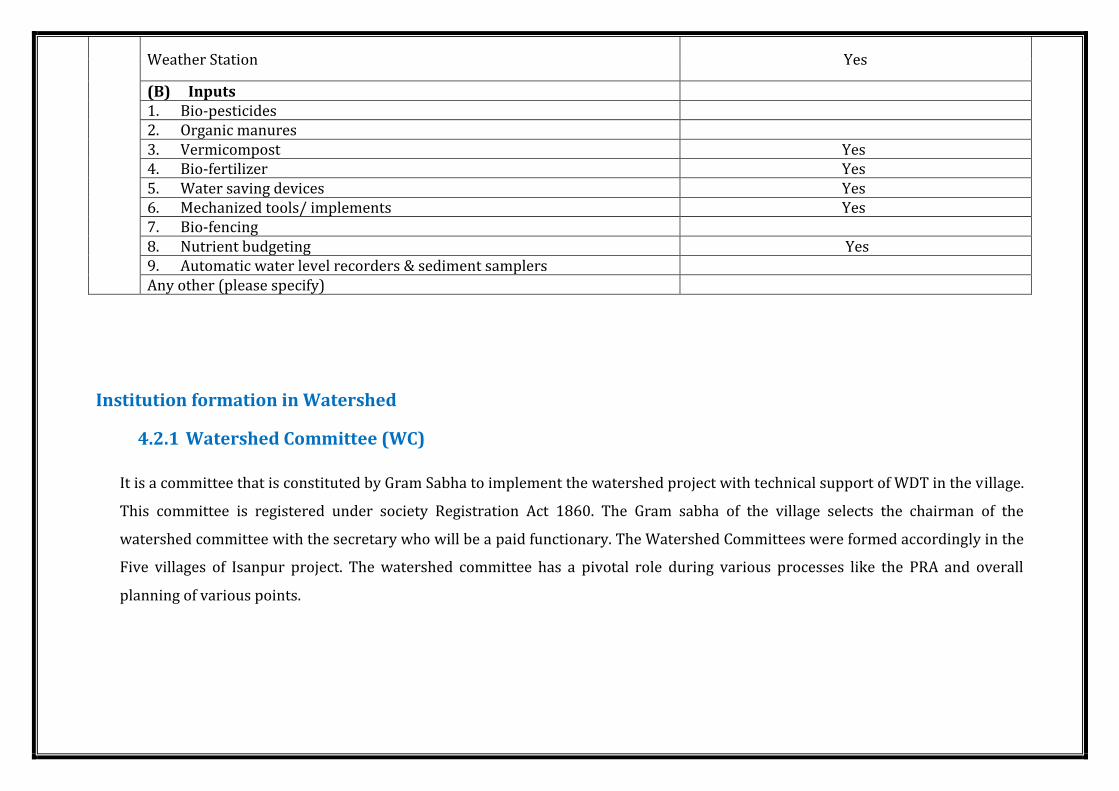
Weather Station Yes
(B) Inputs 1. Bio-pesticides 2. Organic manures 3. Vermicompost Yes 4. Bio-fertilizer Yes 5. Water saving devices Yes 6. Mechanized tools/ implements Yes 7. Bio-fencing 8. Nutrient budgeting Yes 9. Automatic water level recorders & sediment samplers Any other (please specify)
Institution formation in Watershed
4.2.1 Watershed Committee (WC)
It is a committee that is constituted by Gram Sabha to implement the watershed project with technical support of WDT in the village.
This committee is registered under society Registration Act 1860. The Gram sabha of the village selects the chairman of the
watershed committee with the secretary who will be a paid functionary. The Watershed Committees were formed accordingly in the
Five villages of Isanpur project. The watershed committee has a pivotal role during various processes like the PRA and overall
planning of various points.
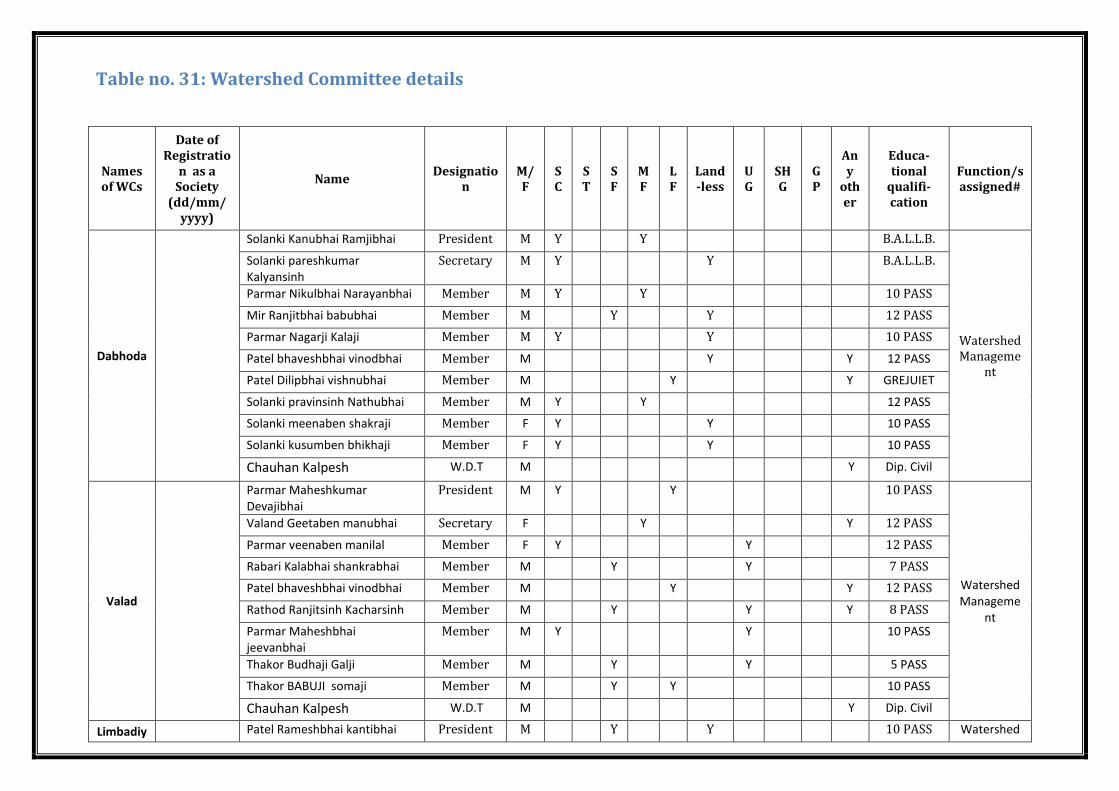
Table no. 31: Watershed Committee details
Names of WCs
Date of Registratio
n as a Society
(dd/mm/ yyyy)
Name Designatio
n M/F
SC
ST
SF
MF
LF
Land-less
UG
SHG
GP
Any
other
Educa-tional
qualifi-cation
Function/s assigned#
Dabhoda
Solanki Kanubhai Ramjibhai President M Y Y B.A.L.L.B.
Watershed Manageme
nt
Solanki pareshkumar Kalyansinh
Secretary M Y Y B.A.L.L.B.
Parmar Nikulbhai Narayanbhai Member M Y Y 10 PASS
Mir Ranjitbhai babubhai Member M Y Y 12 PASS
Parmar Nagarji Kalaji Member M Y Y 10 PASS
Patel bhaveshbhai vinodbhai Member M Y Y 12 PASS
Patel Dilipbhai vishnubhai Member M Y Y GREJUIET
Solanki pravinsinh Nathubhai Member M Y Y 12 PASS
Solanki meenaben shakraji Member F Y Y 10 PASS
Solanki kusumben bhikhaji Member F Y Y 10 PASS
Chauhan Kalpesh W.D.T M Y Dip. Civil
Valad
Parmar Maheshkumar Devajibhai
President M Y Y 10 PASS
Watershed Manageme
nt
Valand Geetaben manubhai Secretary F Y Y 12 PASS
Parmar veenaben manilal Member F Y Y 12 PASS
Rabari Kalabhai shankrabhai Member M Y Y 7 PASS
Patel bhaveshbhai vinodbhai Member M Y Y 12 PASS
Rathod Ranjitsinh Kacharsinh Member M Y Y Y 8 PASS
Parmar Maheshbhai jeevanbhai
Member M Y Y 10 PASS
Thakor Budhaji Galji Member M Y Y 5 PASS
Thakor BABUJI somaji Member M Y Y 10 PASS
Chauhan Kalpesh W.D.T M Y Dip. Civil
Limbadiy Patel Rameshbhai kantibhai President M Y Y 10 PASS Watershed

a Patel Harsadbhai Babubhai Secretary M Y Y 10 PASS Management Patel Sakarben Ranchhodbhai Member F Y Y 7 PASS
Patel Hansaben Babulal Member F Y Y 7 PASS
Patel Rinkuben Harsadbhai Member F Y Y 8 PASS
Patel Rashikbhai Maganbhai Member M Y Y 10 PASS
Thakor Arjanji Shanaji Member M Y Y GREJUIET
Patani Gangaben Nenaji Member F Y Y 12 PASS
Thakor Reekhaben Raguji Member F Y Y 12 PASS
Parmar Madhuben Poonabhai Member F Y Y 7 PASS
Rathod Rekhaben Devjibhai W.D.T F Y MSW
Magodi
Patel Govindbhai Bababhai President M Y Y 10 PASS
Watershed Manageme
nt
Patel Kishorbhai Kantibhai Secretary M Y Y Y FYBA
Thakor Dahyaji Ramsangji Member M Y Y Y 10 PASS
Patel Palakbhai Amrutbhai Member M Y Y 10 PASS
Thakor vikramji Ramaji Member M Y Y Y 7 PASS
Patel jeeviben Poonambhai Member F Y Y Y Y 5 PASS
Patel Madhuben Chhotabhai Member F Y Y Y 5 PASS
Vaghela Hansaben Bhamarsinh Member F Y Y 10 PASS
Parmar poonajabhai Ramabhai Member M Y Y Y 5 PASS
Raval Kanabhai Laxmanbhai Member M Y Y Y 5 PASS
Chauhan Kalpesh W.D.T M Y Dip. Civil
Vadodara
Thakor Melaji Kalaji President M Y Y S.Y B.COM
Watershed Manageme
nt
Thakor Prahaladji Amaji Secretary M Y Y Y S.Y B.A
Parmar Ajanaben Rameshbhai Member M Y Y Y 12 PASS
Pandya Jayshreeben Rakeshkumar
Member M Y Y 12 PASS
Thakor Dinaji Fataji Member F Y Y 10 PASS
Parmar Arvindbhai Muljibhai Member F Y Y 10 PASS
Rabari Ramjibhai Hartanbhai Member F Y Y 10 PASS
Thakor Rameshji somaji Member M Y Y 8 PASS
Thakor Kanuji saburji Member M Y Y GREJUIET
Thakor Arjunji Bhikhaji Member M Y Y 7 PASS
Raval Rahulkumar Arjanbhai W.D.T M Y

Table no. 32: SHG detail
S. No. Village Name
Total no.shgs No. of members No. of SC/ST in each
category No. of BPL in each
category
Men Women Both Total Categories M F Total M F Total M F Total
1 DABHODA 2 2 3 7
(i)Landless 13 27 40 0 17 17 13 11 24
(ii) SF 20 13 33 5 12 17 14 3 17
(iii) MF 3 0 3 0 0 0 0 0 0
(iv) LF 0 0 0 0 0 0 0 0 0
Total 2 2 3 7 36 40 76 5 29 34 27 14 41
2 VALAD 3 2 2 7
(i)Landless 18 33 51 8 17 25 7 6 13
(ii) SF 17 12 29 3 0 3 5 4 9
(iii) MF 7 8 15 12 3 15 0 0 0
(iv) LF 0 0 0 0 0 0 0 0 0
Total 3 2 2 7 42 53 95 23 20 43 12 10 22
3 VADODARA 3 2 0 5
(i)Landless 17 23 40 11 23 23 7 6 13
(ii) SF 12 16 28 0 0 0 0 0 0
(iii) MF 5 0 5 0 0 0 0 0 0
(iv) LF 0 0 0 0 0 0 0 0 0
Total 3 2 0 5 34 39 73 11 23 23 7 6 13
4 MAGODI 3 2 2 7
(i)Landless 7 13 20 5 3 8 0 0 0
(ii) SF 23 21 44 6 3 9 0 0 0
(iii) MF 15 0 15 0 0 0 0 0 0
(iv) LF 0 0 0 0 0 0 0 0 0
Total 3 2 2 7 45 34 79 11 6 17 0 0 0
5 LIMBADIYA 2 2 0 4
(i)Landless 11 23 34 1 13 14 11 12 23
(ii) SF 5 0 5 0 0 0 0 0 0
(iii) MF 5 0 5 0 0 0 0 0 0
(iv) LF 1 0 1 0 0 0 0 0 0
Total 2 2 0 4 22 23 45 1 13 14 11 12 23
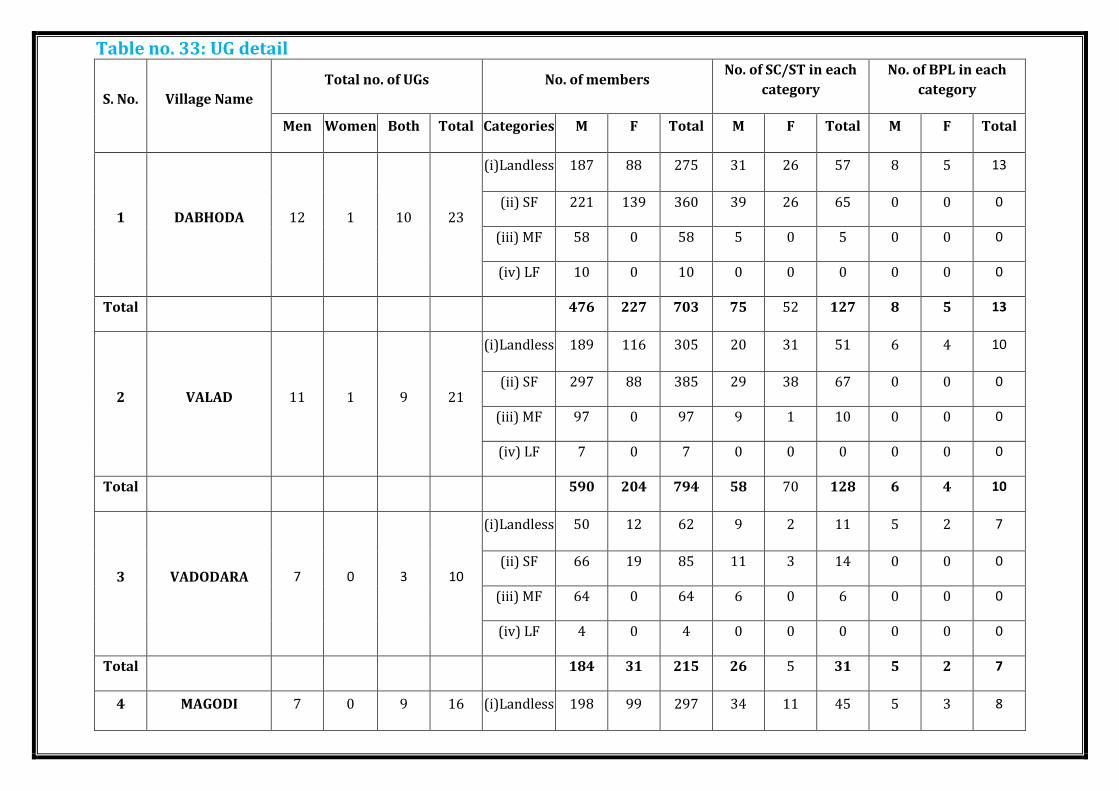
Table no. 33: UG detail
S. No. Village Name
Total no. of UGs No. of members No. of SC/ST in each
category
No. of BPL in each
category
Men Women Both Total Categories M F Total M F Total M F Total
1 DABHODA 12 1 10 23
(i)Landless 187 88 275 31 26 57 8 5 13
(ii) SF 221 139 360 39 26 65 0 0 0
(iii) MF 58 0 58 5 0 5 0 0 0
(iv) LF 10 0 10 0 0 0 0 0 0
Total 476 227 703 75 52 127 8 5 13
2 VALAD 11 1 9 21
(i)Landless 189 116 305 20 31 51 6 4 10
(ii) SF 297 88 385 29 38 67 0 0 0
(iii) MF 97 0 97 9 1 10 0 0 0
(iv) LF 7 0 7 0 0 0 0 0 0
Total 590 204 794 58 70 128 6 4 10
3 VADODARA 7 0 3 10
(i)Landless 50 12 62 9 2 11 5 2 7
(ii) SF 66 19 85 11 3 14 0 0 0
(iii) MF 64 0 64 6 0 6 0 0 0
(iv) LF 4 0 4 0 0 0 0 0 0
Total 184 31 215 26 5 31 5 2 7
4 MAGODI 7 0 9 16 (i)Landless 198 99 297 34 11 45 5 3 8

(ii) SF 256 89 345 45 29 74 0 0 0
(iii) MF 99 0 99 12 2 14 0 0 0
(iv) LF 6 0 6 0 0 0 0 0 0
Total 559 188 747 91 42 133 5 3 8
5 LIMBADIYA 1 0 1 2
(i)Landless 16 12 28 4 1 5 3 0 3
(ii) SF 28 8 36 7 0 7 0 0 0
(iii) MF 19 0 19 0 0 0 0 0 0
(iv) LF 3 0 3 0 0 0 0 0 0
Total 66 20 86 11 1 12 3 0 3

Table no.34: Entry point activities (EPA) (All financial figures in lakh Rs.)
S. No. Names of Villages
Amount earmarked for
EPA Entry Point Activities planned Estimated cost Expected outcome
1 Dabhoda 9.15
Drinking Water Pipeline 1.49
Drinking Water Facility Drinking Water Pipeline 2.24
Drinking Water Pipeline 1.58
Radi 1.58 Protection from Soil Erosion
Radi 2.07
Total 9.15
2 Magodi 5.49
Pipeline For Havada 2.79 Drinking Water Facility for Cattles
Dhobighaat with shed 2.68 Cloths Washing facility for
Women
Total 5.49
3 Vadodara 3.51
Radi 1.95 Protection from Soil Erosion
Radi 1.57
Total 3.51
4 Limbadiya 1.67 Drinking Water Pipeline 1.67 Drinking Water Facility
Total 1.67
5 Valad 7.04
Radi 2.49 Protection from Soil Erosion
Dhobighaat with Shade 1.19 Cloths Washing facility for
Women
Protection Wall 3.36 Protection from Soil Erosion
Total 7.02
Total 26.84 - 26.84 -

Village : VadodaraRuddey Repairing
For ease in Transportation during Monsoon and Prevention of Soil Erosion
Identified EPA Photos of cluster with complete information
Village : VadodaraRuddey Repairing
For ease in Transportation during Monsoon and Prevention of Soil Erosion

Village Name: Dabhoda (Ruddey)
Village Name : LimbadiaProposed EPA- Drinking Water Pipeline
Length: 350 Met
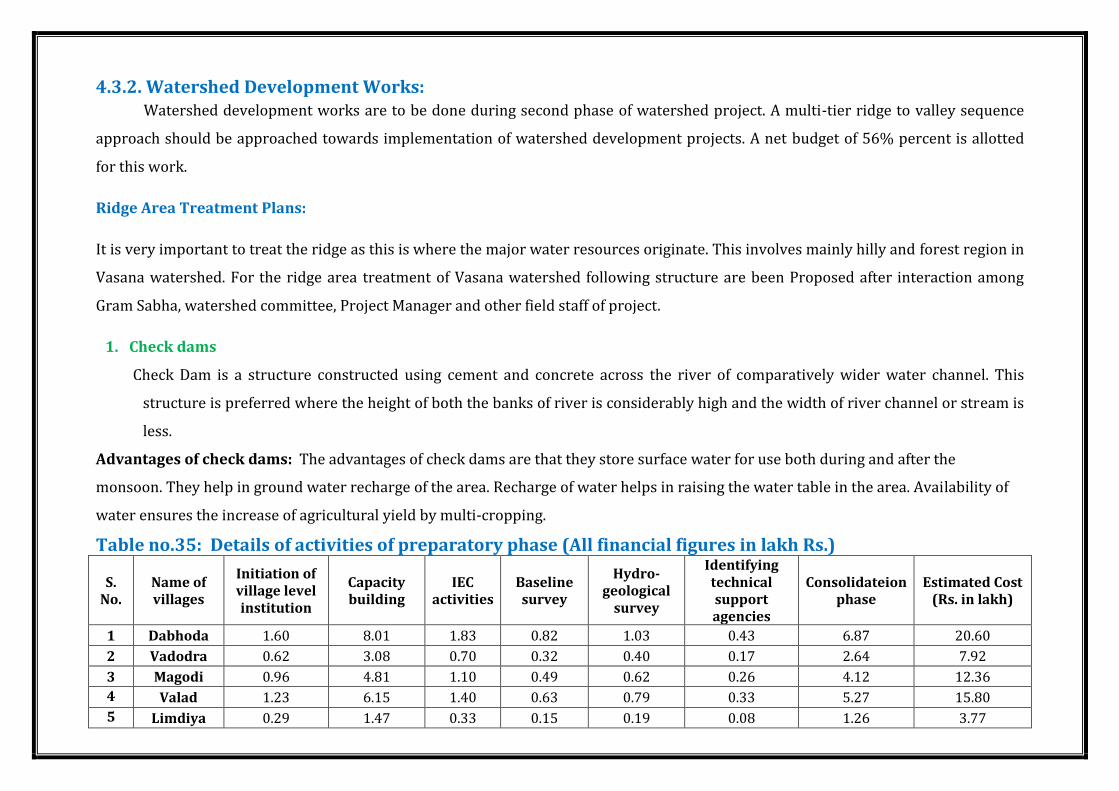
4.3.2. Watershed Development Works: Watershed development works are to be done during second phase of watershed project. A multi-tier ridge to valley sequence
approach should be approached towards implementation of watershed development projects. A net budget of 56% percent is allotted
for this work.
Ridge Area Treatment Plans:
It is very important to treat the ridge as this is where the major water resources originate. This involves mainly hilly and forest region in
Vasana watershed. For the ridge area treatment of Vasana watershed following structure are been Proposed after interaction among
Gram Sabha, watershed committee, Project Manager and other field staff of project.
1. Check dams
Check Dam is a structure constructed using cement and concrete across the river of comparatively wider water channel. This
structure is preferred where the height of both the banks of river is considerably high and the width of river channel or stream is
less.
Advantages of check dams: The advantages of check dams are that they store surface water for use both during and after the
monsoon. They help in ground water recharge of the area. Recharge of water helps in raising the water table in the area. Availability of
water ensures the increase of agricultural yield by multi-cropping.
Table no.35: Details of activities of preparatory phase (All financial figures in lakh Rs.)
S. No.
Name of villages
Initiation of village level institution
Capacity building
IEC activities
Baseline survey
Hydro-geological
survey
Identifying technical support agencies
Consolidateion phase
Estimated Cost (Rs. in lakh)
1 Dabhoda 1.60 8.01 1.83 0.82 1.03 0.43 6.87 20.60
2 Vadodra 0.62 3.08 0.70 0.32 0.40 0.17 2.64 7.92
3 Magodi 0.96 4.81 1.10 0.49 0.62 0.26 4.12 12.36
4 Valad 1.23 6.15 1.40 0.63 0.79 0.33 5.27 15.80
5 Limdiya 0.29 1.47 0.33 0.15 0.19 0.08 1.26 3.77

IEC Activity – Slogan Painting on Wall
(1). DABHODA - 35
(2). VADODARA - 15
(3). MAGODI - 30
(4). VALAD - 27
(5). LIMBADIYA - 15
TOTAL……- 122
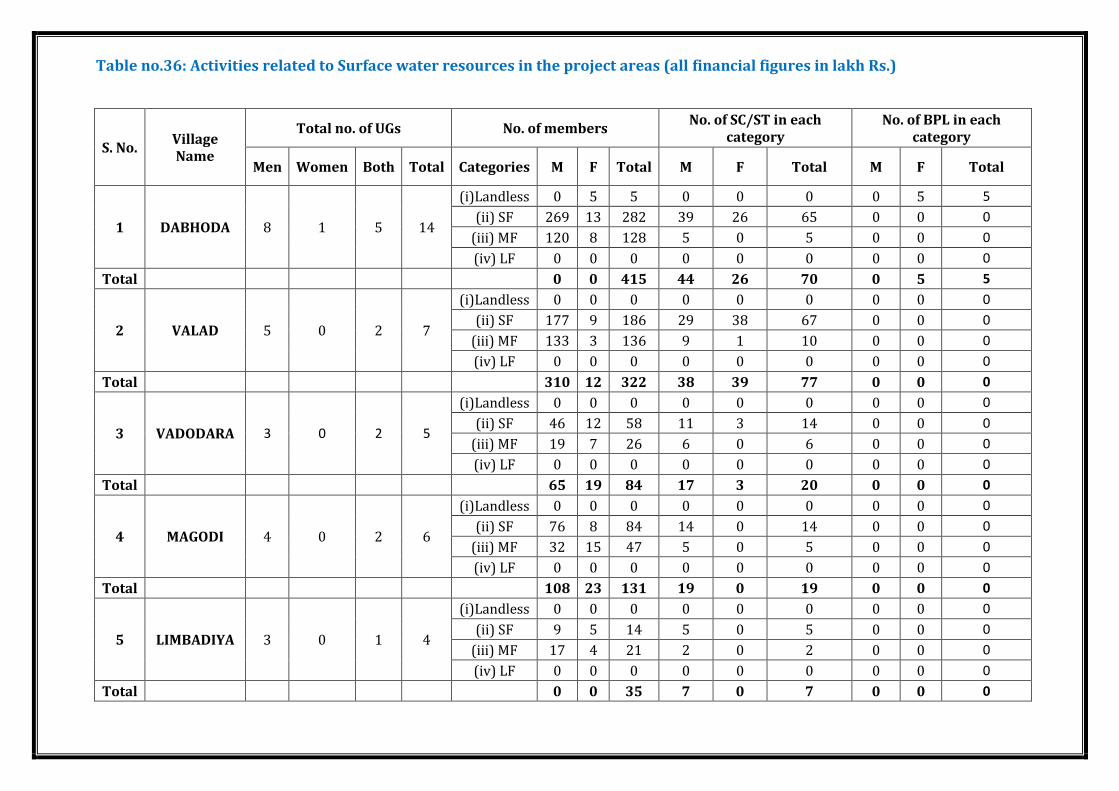
Table no.36: Activities related to Surface water resources in the project areas (all financial figures in lakh Rs.)
S. No. Village Name
Total no. of UGs No. of members No. of SC/ST in each
category No. of BPL in each
category
Men Women Both Total Categories M F Total M F Total M F Total
1 DABHODA 8 1 5 14
(i)Landless 0 5 5 0 0 0 0 5 5
(ii) SF 269 13 282 39 26 65 0 0 0
(iii) MF 120 8 128 5 0 5 0 0 0
(iv) LF 0 0 0 0 0 0 0 0 0
Total 0 0 415 44 26 70 0 5 5
2 VALAD 5 0 2 7
(i)Landless 0 0 0 0 0 0 0 0 0
(ii) SF 177 9 186 29 38 67 0 0 0
(iii) MF 133 3 136 9 1 10 0 0 0
(iv) LF 0 0 0 0 0 0 0 0 0
Total 310 12 322 38 39 77 0 0 0
3 VADODARA 3 0 2 5
(i)Landless 0 0 0 0 0 0 0 0 0
(ii) SF 46 12 58 11 3 14 0 0 0
(iii) MF 19 7 26 6 0 6 0 0 0
(iv) LF 0 0 0 0 0 0 0 0 0
Total 65 19 84 17 3 20 0 0 0
4 MAGODI 4 0 2 6
(i)Landless 0 0 0 0 0 0 0 0 0
(ii) SF 76 8 84 14 0 14 0 0 0
(iii) MF 32 15 47 5 0 5 0 0 0
(iv) LF 0 0 0 0 0 0 0 0 0
Total 108 23 131 19 0 19 0 0 0
5 LIMBADIYA 3 0 1 4
(i)Landless 0 0 0 0 0 0 0 0 0
(ii) SF 9 5 14 5 0 5 0 0 0
(iii) MF 17 4 21 2 0 2 0 0 0
(iv) LF 0 0 0 0 0 0 0 0 0
Total 0 0 35 7 0 7 0 0 0
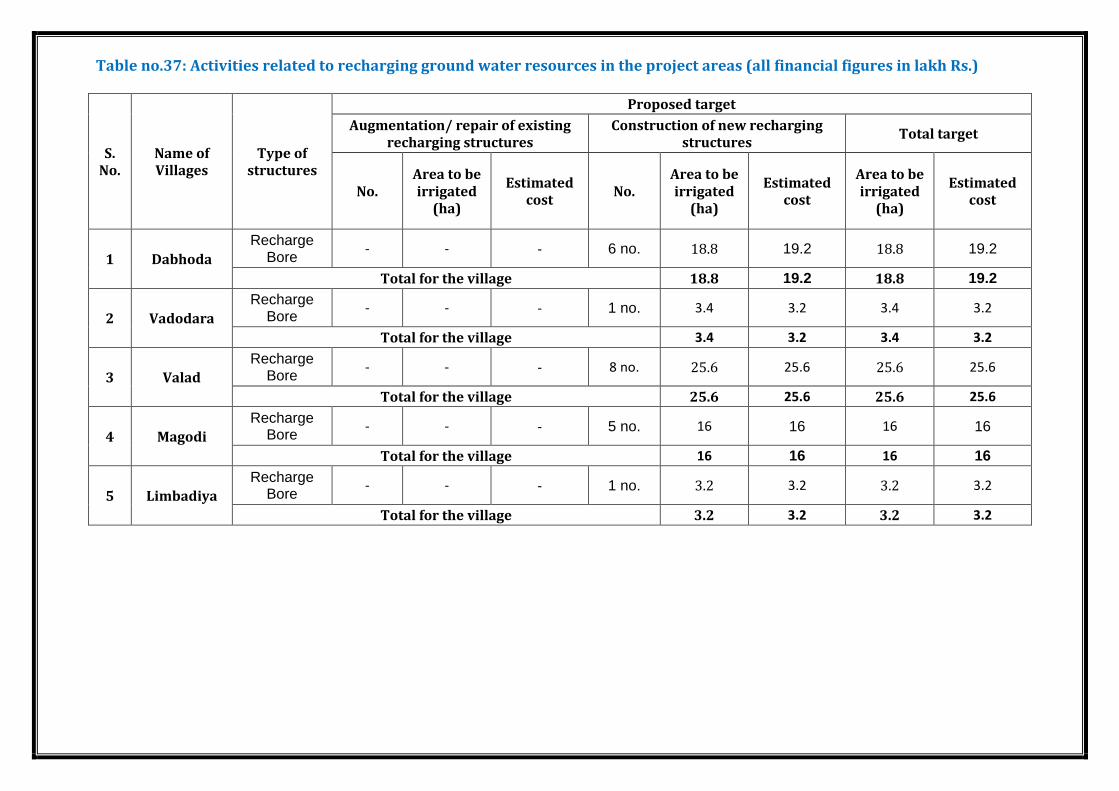
Table no.37: Activities related to recharging ground water resources in the project areas (all financial figures in lakh Rs.)
S. No.
Name of Villages
Type of structures
Proposed target
Augmentation/ repair of existing recharging structures
Construction of new recharging structures
Total target
No. Area to be irrigated
(ha)
Estimated cost
No. Area to be irrigated
(ha)
Estimated cost
Area to be irrigated
(ha)
Estimated cost
1 Dabhoda
Recharge Bore
- - - 6 no. 18.8 19.2 18.8 19.2
Total for the village 18.8 19.2 18.8 19.2
2 Vadodara
Recharge Bore
- - - 1 no. 3.4 3.2 3.4 3.2
Total for the village 3.4 3.2 3.4 3.2
3 Valad
Recharge Bore
- - - 8 no. 25.6 25.6 25.6 25.6
Total for the village 25.6 25.6 25.6 25.6
4 Magodi
Recharge Bore
- - - 5 no. 16 16 16 16
Total for the village 16 16 16 16
5 Limbadiya
Recharge Bore
- - - 1 no. 3.2 3.2 3.2 3.2
Total for the village 3.2 3.2 3.2 3.2

Village: Dabhoda (Check-Dam) Village: Dabhoda (Check-Wall)

Village Name: Dabhoda (Recharge Bore) Village: Magodi (Protection Wall)
Table no. 38: Activities related to livelihoods by Self Help Groups (SHGs) in the project areas
S. No.
Names of Villages
Major activities of the SHGs
Name of activity No. of SHGs
involved Average annual income from activity per
SHG
1 Dabhoda
Vermi compost to SHG 1
Agro Centre to SHG 2
Wheat Thresher to SHG 1
Rotavator to SHG 1
Sivan class(tailoring Activity) 2
2 VALAD
Cattle shade for Hiefers to SHG 1
Agro Centre to SHG 2
Wheat Thresher to SHG 1
Rotavator to SHG 1

Sivan class(tailoring Activity) 2
3 MAGODI
Wheat Thresher to SHG 1
Agro Centre to SHG 2
Ground Nuts Thresher 1
Rotavator to SHG 1
Sivan class(tailoring Activity) 2
4 VADODARA
Vermi compost to SHG 1
Agro Centre to SHG 2
Rotavator to SHG 1
Sivan class(tailoring Activity) 2
5 LIMBADIYA
Fodder Development (SHG) 1
Agro Centre to SHG 2
Sivan class(tailoring Activity) 1
Total 31
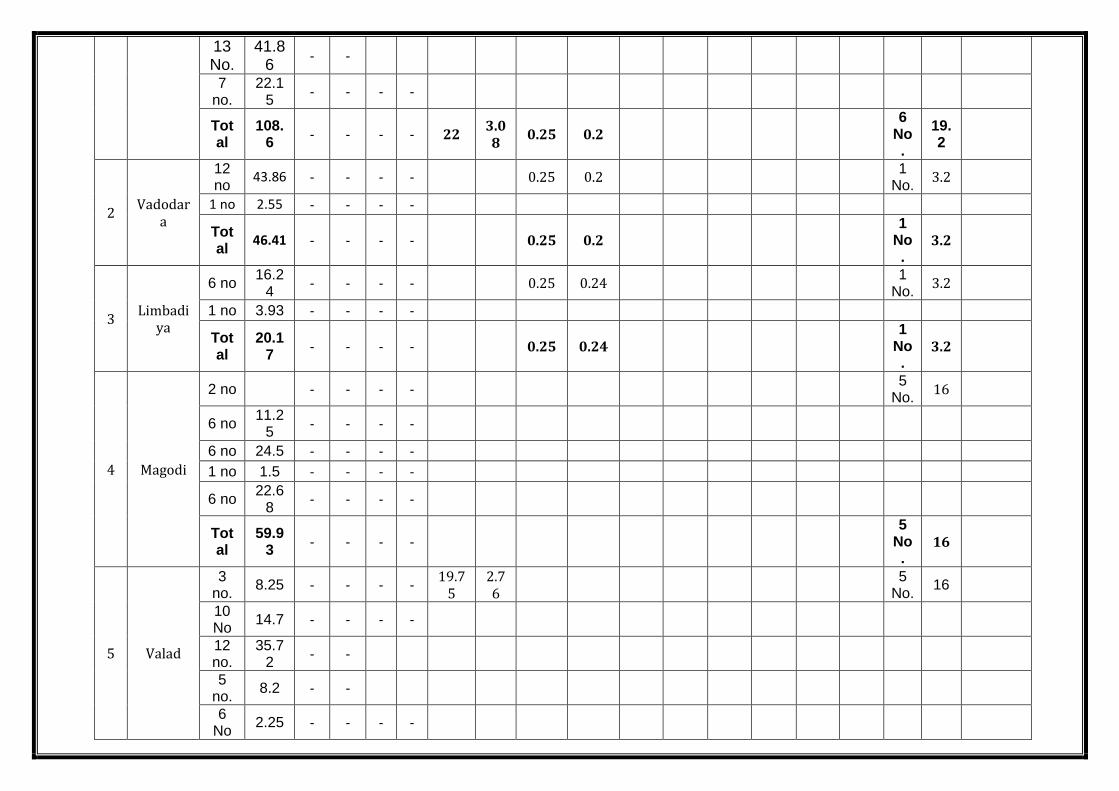
Table no. 39: Other activities of watershed works phase – Proposed target
S. No
.
Name of villages
Ridge area treatment
Drainage line
treatment
Nursery
raising
Land developme
nt
Crop demonstratio
ns
Pasture developme
nt
Fishery developme
nt
Non-conventional energy
Any other (Recharg
e)
Total Estimate
d cost (Rs. In lakhs) (a) (b) (a) (b)
(a)
(b)
(a) (b) (a) (b) (a) (b) (a) (b) (a) (b) (a) (b)
1 Dabhoda
3 no.
6.81 - - - - 22 3.08
0.25 0.2 6
No. 19.2
19 no.
26.38
- - - -
2 no.
6.3 - - - -
2 no.
3.1 - -
3 no.
1.1 - -
1 nos
0.9 - - - -
13 No.
41.86
- -
7 no.
22.15
- - - -
Total
108.6
- - - - 22 3.08
0.25 0.2 6
No.
19.2
2 Vadodar
a
12 no
43.86 - - - - 0.25 0.2 1
No. 3.2
1 no 2.55 - - - -
Total
46.41 - - - - 0.25 0.2 1
No.
3.2
3 Limbadi
ya
6 no 16.2
4 - - - - 0.25 0.24
1 No.
3.2
1 no 3.93 - - - -
Total
20.17
- - - - 0.25 0.24 1
No.
3.2
4 Magodi
2 no - - - - 5
No. 16
6 no 11.2
5 - - - -
6 no 24.5 - - - -
1 no 1.5 - - - -
6 no 22.6
8 - - - -
Total
59.93
- - - - 5
No.
16
5 Valad
3 no.
8.25 - - - - 19.7
5 2.76
5
No. 16
10 No
14.7 - - - -
12 no.
35.72
- -
5 no.
8.2 - -
6 No
2.25 - - - -

4 No
3.6 - -
4 No
9.6 - - - -
Total
82.32
- - - - 19.7
5 2.76
5
No.
16
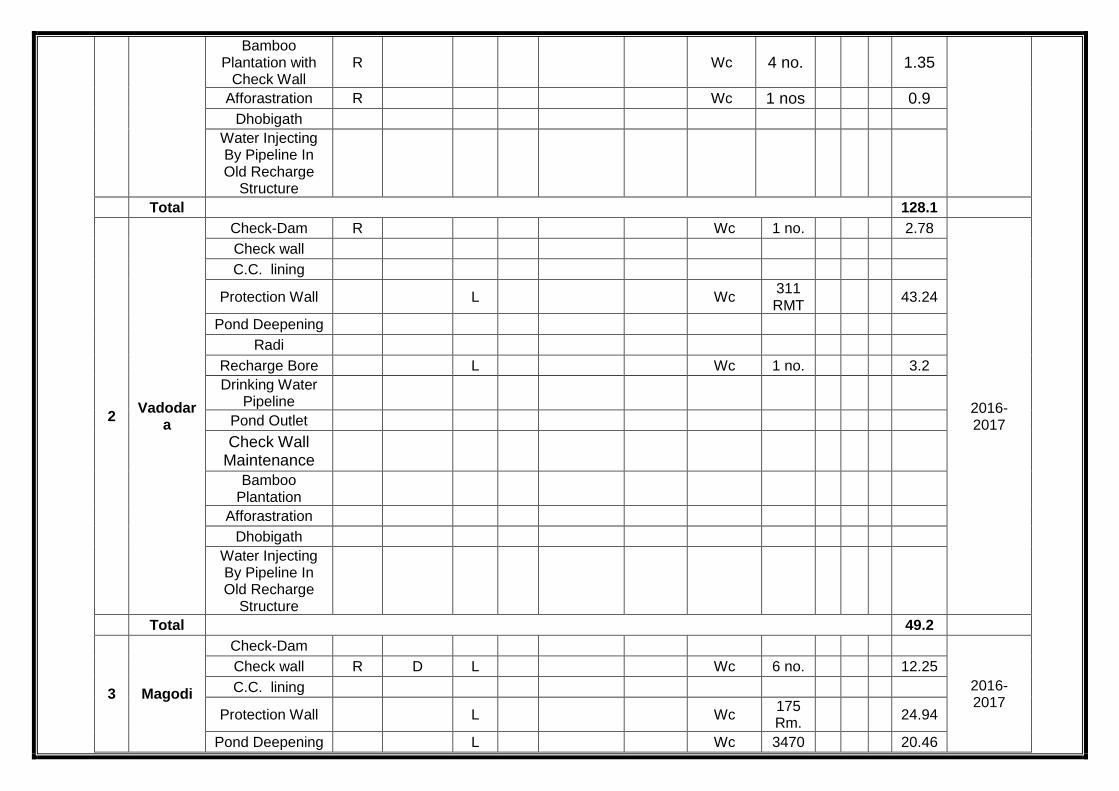
Table no.40: Details of engineering structures in watershed works*
S. No
.
Village name
Name of structures
Type of treatment Type of land Executi
ng agency
Target
(i) Ridg
e area (R)
(ii) Drainag
e line (iii) (i)
(ii) Communit
y
(iii) Others
(pl. specify
)
(i) UG
No. of units (No./
cu.m./ rmt)
Estimated cost (Rs. in lakh)
Expected month & year of
completion
(mm/yyyy)
(D)
Land
dev. (L)
Pri-vat
e
(ii)SHG
(iii) Others
(pl. specify)
M W O T
1 Dabhod
a
Check dam R L Wc 5 no. 7.43
2016-2017
Check wall R D L Wc 19 no. 26.38
C.C. lining R L Wc 45
Rm. 6.3
Protection Wall L Wc 299 Rm.
42.51
Pond Deepening L Wc 36774 Cmt.
22.98
Radi
Recharge Bore L C Wc 6 No. 19.2
Drinking Water Pipeline
Pond Outlet
Check Wall Maintenance
R Wc 2 no. 3.1
Bamboo Plantation with
Check Wall R Wc 4 no. 1.35
Afforastration R Wc 1 nos 0.9
Dhobigath
Water Injecting By Pipeline In Old Recharge
Structure
Total 128.1
2 Vadodar
a
Check-Dam R Wc 1 no. 2.78
2016-2017
Check wall
C.C. lining
Protection Wall L Wc 311 RMT
43.24
Pond Deepening
Radi
Recharge Bore L Wc 1 no. 3.2
Drinking Water Pipeline
Pond Outlet
Check Wall Maintenance
Bamboo Plantation
Afforastration
Dhobigath
Water Injecting By Pipeline In Old Recharge
Structure
Total 49.2
3 Magodi
Check-Dam
2016-2017
Check wall R D L Wc 6 no. 12.25
C.C. lining
Protection Wall L Wc 175 Rm.
24.94
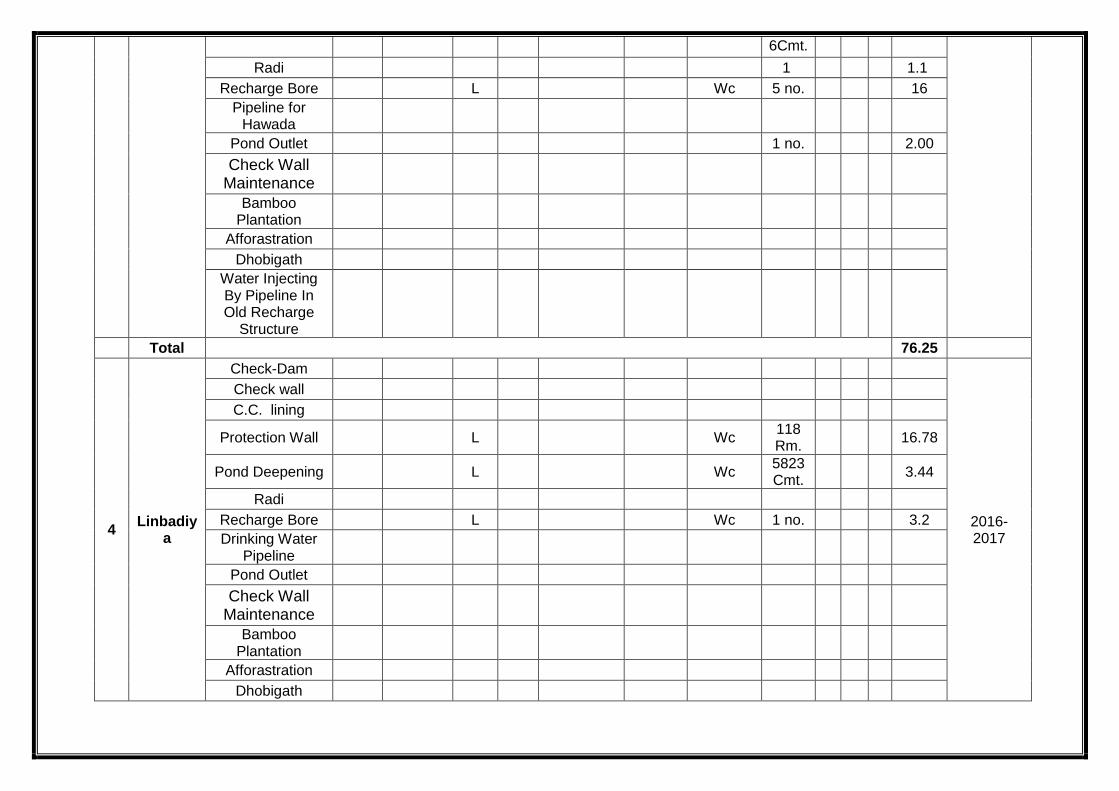
Pond Deepening L Wc 3470 20.46
6Cmt.
Radi 1 1.1
Recharge Bore L Wc 5 no. 16
Pipeline for Hawada
Pond Outlet 1 no. 2.00
Check Wall Maintenance
Bamboo Plantation
Afforastration
Dhobigath
Water Injecting By Pipeline In Old Recharge
Structure
Total 76.25
4 Linbadiy
a
Check-Dam
2016-2017
Check wall
C.C. lining
Protection Wall L Wc 118 Rm.
16.78
Pond Deepening L Wc 5823 Cmt.
3.44
Radi
Recharge Bore L Wc 1 no. 3.2
Drinking Water Pipeline
Pond Outlet
Check Wall Maintenance
Bamboo Plantation
Afforastration
Dhobigath

Water Injecting By Pipeline In Old Recharge
Structure
Total 23.37
5 Valad
Check-Dam R C WC 4 No 6.79
2016-2017
Check wall R D L C WC 10 No 14.59
C.C. lining
Protection Wall
Protection Wall L C WC 12 no.
35.96
Pond Deepening
Radi DWDU 3 no. 7.7
Radi
Recharge Bore L 8 no 25.6
Drinking Water Pipeline
C
Pond Outlet
Check Wall Maintenance
R Wc 5 no. 1.83
Bamboo Plantation
R Wc 6 No 2.25
Afforastration R Wc 4 No 3.6
Dhobigath
Water Injecting By Pipeline In Old Recharge
Structure
Total 98.32

Table no.41: Details of activities connected with vegetative cover in watershed works
S. No
.
Name of village
Name of structure/ work
Type of treatment Type of land Executing agency
Target
(i) Ridg
e area (R)
(ii) Drainag
e line (iii) Lan
d dev. (L)
(i) Privat
e
(ii) Communi
ty
(iii) Others
(pl. specify
)
(i) UG
Area
(ha)
No. of
plants
Estimated cost Expected
month & year of
completion (mm/
yyyy)
(D) (ii)SHG (Rs. in lakh)
(iii) Others
(pl. specify)
1 DABHOD
A
Green Manuring L P WC 31.5 - 4.41
2015-16
Bamboo Plantation
L L
WC 1
500 1.1
Afforastration L WC 1 1111 0.9
2 VALAD
Green Manuring L P WC 22 - 3.08
Bamboo Plantation L L
WC 2.5 1100 2.25
Afforastration L WC 3.5 4444 3.6
3 LIMBADIY
A Fodder
L C
SHG
1 1.39
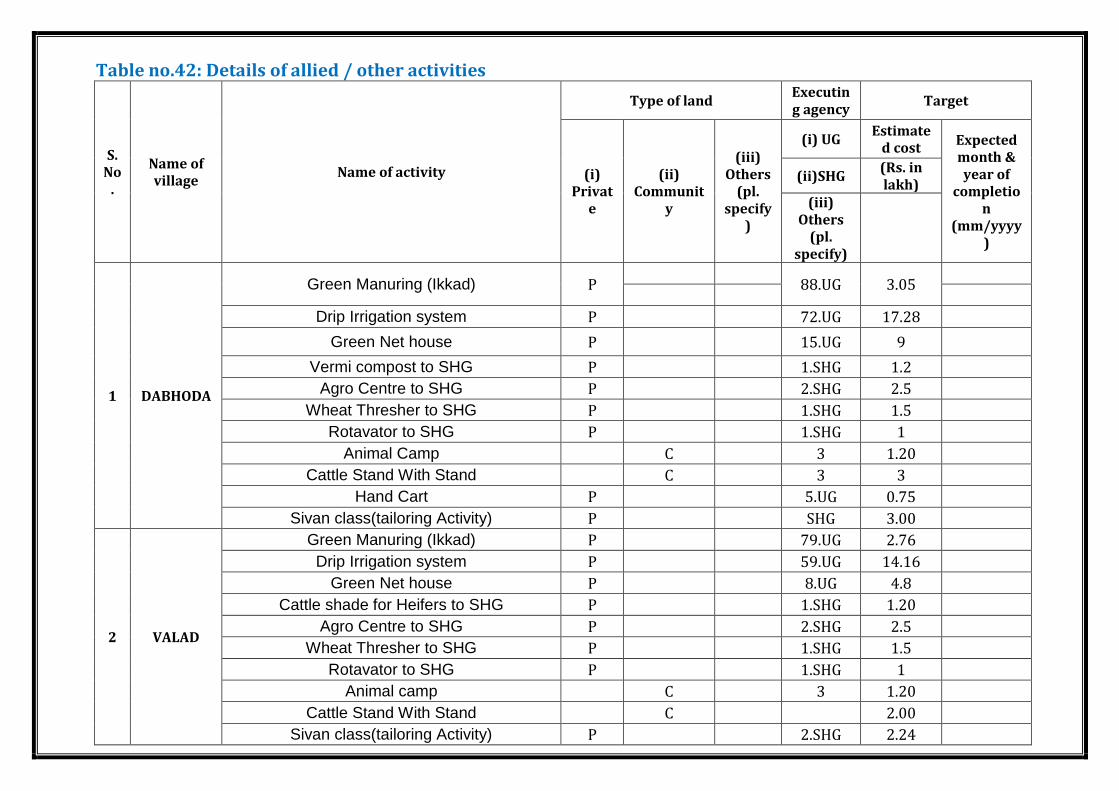
Table no.42: Details of allied / other activities
S. No
.
Name of village
Name of activity
Type of land Executing agency
Target
(i) Privat
e
(ii) Communit
y
(iii) Others
(pl. specify
)
(i) UG Estimate
d cost Expected month & year of
completion
(mm/yyyy)
(ii)SHG (Rs. in lakh)
(iii) Others
(pl. specify)
1 DABHODA
Green Manuring (Ikkad) P 88.UG 3.05
Drip Irrigation system P 72.UG 17.28
Green Net house P 15.UG 9
Vermi compost to SHG P 1.SHG 1.2
Agro Centre to SHG P 2.SHG 2.5
Wheat Thresher to SHG P 1.SHG 1.5
Rotavator to SHG P 1.SHG 1
Animal Camp
C
3 1.20
Cattle Stand With Stand C 3 3
Hand Cart P 5.UG 0.75
Sivan class(tailoring Activity) P SHG 3.00
2 VALAD
Green Manuring (Ikkad) P 79.UG 2.76
Drip Irrigation system P 59.UG 14.16
Green Net house P 8.UG 4.8
Cattle shade for Heifers to SHG P 1.SHG 1.20
Agro Centre to SHG P 2.SHG 2.5
Wheat Thresher to SHG P 1.SHG 1.5
Rotavator to SHG P 1.SHG 1
Animal camp
C
3 1.20
Cattle Stand With Stand C
2.00
Sivan class(tailoring Activity) P 2.SHG 2.24

3 MAGODI
Drip Irrigation system P 47.UG 11.28
Green Net house P 5.UG 3
Wheat Thresher to SHG P 1.SHG 1.5
Agro Centre to SHG P 2.SHG 2.5
Ground Nuts Thresher P 1.SHG 1.5
Rotavator to SHG P 1.SHG 1
Animal Camp
C
3 1.20
Cattle Stand With Stand C 4 2.00
Sivan class(tailoring Activity) P 2.SHG 2.11
4 VADODAR
A
Promotion of Floriculture P 2.UG 0.70
Drip Irrigation system P 20.UG 4.8
Green Net house P 4.UG 2.4
Vermi compost to SHG P 1.SHG 1.20
Agro Centre to SHG P 2.SHG 2.5
Rotavator to SHG P 1.SHG 1
Animal Camp
C
2 .80
Cattle Stand With Stand C 5 2.50
Sivan class(tailoring Activity) P SHG 1.31
5 LIMBADIY
A
Crop Demonstration (SRI Technique in Paddy)
P 1.UG 0.24
Drip Irrigation system P 13.UG 3.12
Fodder Development (SHG) C 1.SHG 1.39
Agro Centre to SHG P 2.SHG 2.5
Sivan class(tailoring Activity) P 1.SHG 0.7
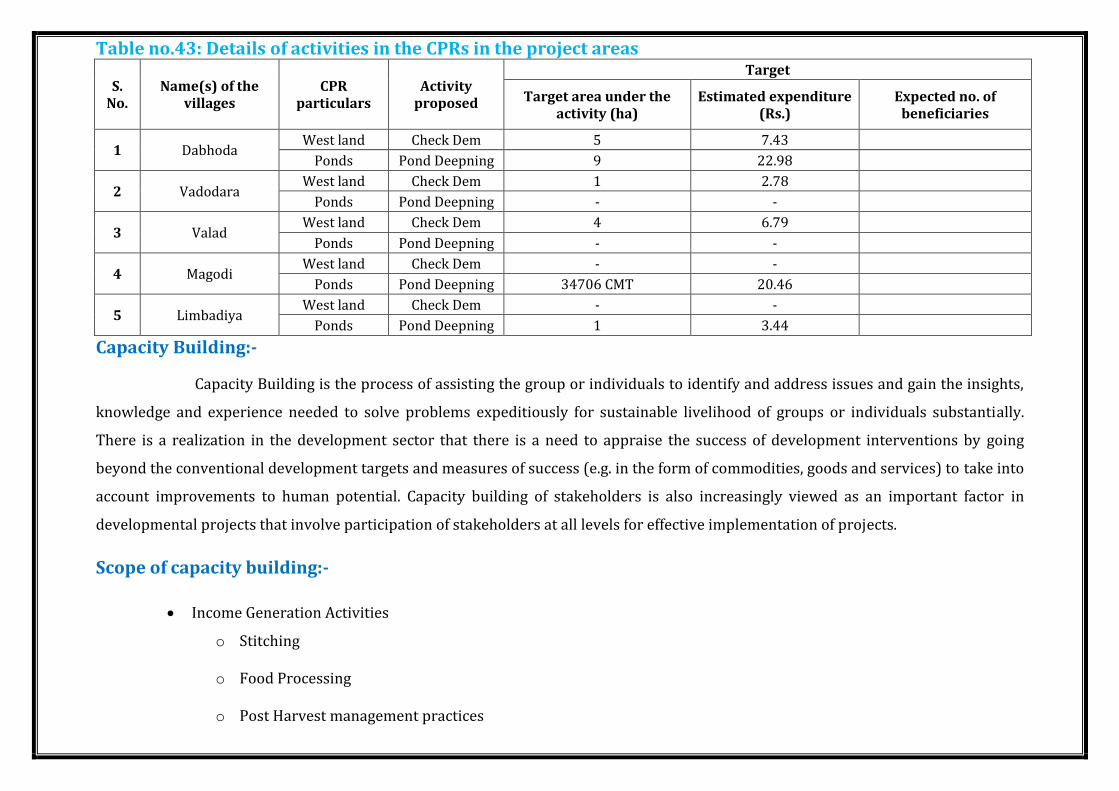
Table no.43: Details of activities in the CPRs in the project areas
S. No.
Name(s) of the villages
CPR particulars
Activity proposed
Target
Target area under the activity (ha)
Estimated expenditure (Rs.)
Expected no. of beneficiaries
1 Dabhoda West land Check Dem 5 7.43
Ponds Pond Deepning 9 22.98
2 Vadodara West land Check Dem 1 2.78
Ponds Pond Deepning - -
3 Valad West land Check Dem 4 6.79
Ponds Pond Deepning - -
4 Magodi West land Check Dem - -
Ponds Pond Deepning 34706 CMT 20.46
5 Limbadiya West land Check Dem - -
Ponds Pond Deepning 1 3.44
Capacity Building:-
Capacity Building is the process of assisting the group or individuals to identify and address issues and gain the insights,
knowledge and experience needed to solve problems expeditiously for sustainable livelihood of groups or individuals substantially.
There is a realization in the development sector that there is a need to appraise the success of development interventions by going
beyond the conventional development targets and measures of success (e.g. in the form of commodities, goods and services) to take into
account improvements to human potential. Capacity building of stakeholders is also increasingly viewed as an important factor in
developmental projects that involve participation of stakeholders at all levels for effective implementation of projects.
Scope of capacity building:-
Income Generation Activities
o Stitching
o Food Processing
o Post Harvest management practices

Fodder development and Management
Afforestation
Gram Vatika
Crop Information
Meteorological Information
Alternative Land Use Plan
Improved and Scientific agriculture practices
Scientific technique of Soil and Moisture conservation
Information Dishemination on Audio/Video
Dairy Development and Management
Rural Craft

Table no. 44: Capacity Building Institution:
Sr. No.
Name of the Training Institute
Full Address with contact
no., website & e-mail
Type of Institute#
Area(s) of speciali-zation$
Accredita-tion details
Trainings
Reference Year
No. of trainings assigned
No. of trainees
to be trained
1 Krishi Vigyan Kendra
Randheja, Gandhinagar
Research Institute
Agriculture/ Horticulture/
Animal Husbandry
Govt. 2012-16 2 29
2 Development Support Centre
Ahmedabad NGO Capacity building
Society Registration
Act
2012-16 18 370
3 BISAG Gandhinagar Space application
Remote sensing Govt. 2012-16 2 22
4 Dantiwada Agriculture University,
Dantiwada University Agriculture and Allied fields
Govt. 2012-16 2 120
Table no. 45: Capacity Building plan:
Sr. No. State Project Stakeholders Total no. of persons No. of persons to
be trained No. of training programmes
Estimated cost
1 Gujarat
PIA 2 2 1 4800
WDTs 6 6 15 216000
UGs 22 22 3 158400
SHGs 256 450 5 1152000
WCs 56 56 6 806400
GPs 5 5 1 12000
TOTAL 347 541 31 2349600

*As per Requirement modification will be made during implementation
Table no.46: Information, education and Communication Activities:
S. No. Activity Executing agency Estimated
expenditure (Rs.)
Outcome
(may quantify, wherever possible)
1 Pamphlets and posters DWDU, Gandhinagar 1.24
Awareness about watershed programmes
2 Wall Paintings DWDU, Gandhinagar 1.29
3 Banners and hoardings DWDU, Gandhinagar 1.40
4 Video Shows DWDU, Gandhinagar 1.45
CHAPTER – 5
BUDGETIN
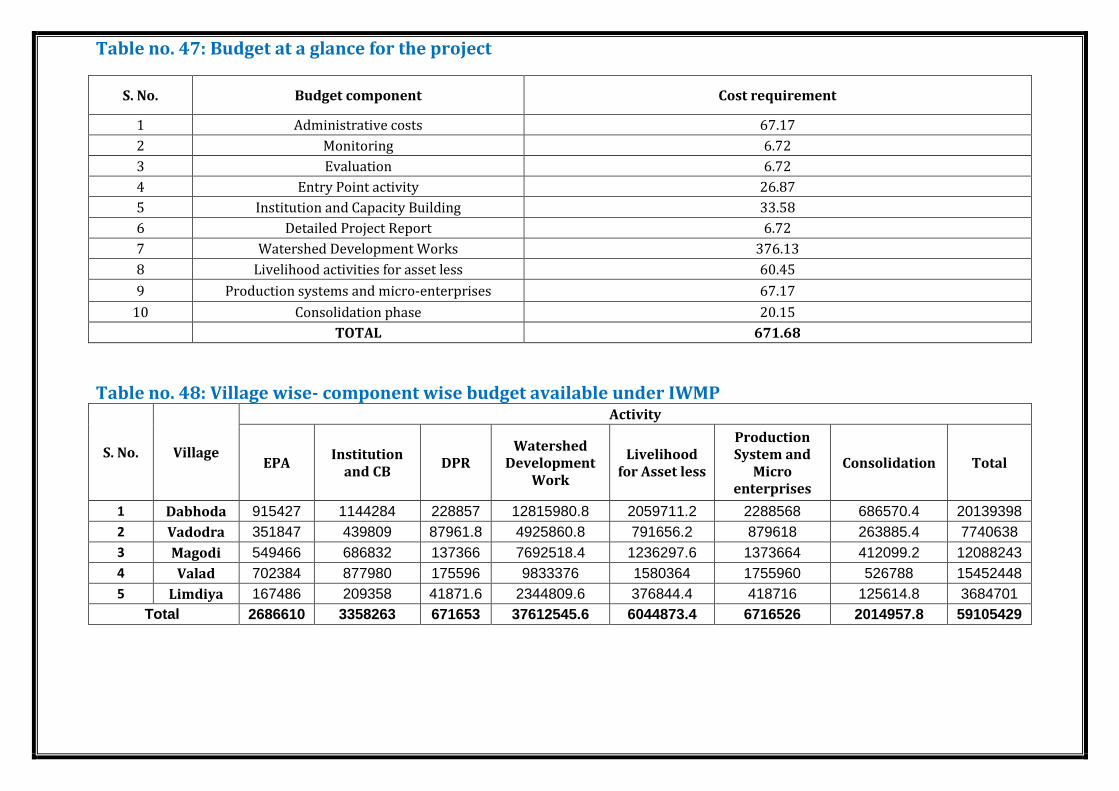
Table no. 47: Budget at a glance for the project
S. No. Budget component Cost requirement
1 Administrative costs 67.17
2 Monitoring 6.72
3 Evaluation 6.72
4 Entry Point activity 26.87
5 Institution and Capacity Building 33.58
6 Detailed Project Report 6.72
7 Watershed Development Works 376.13
8 Livelihood activities for asset less 60.45
9 Production systems and micro-enterprises 67.17
10 Consolidation phase 20.15
TOTAL 671.68
Table no. 48: Village wise- component wise budget available under IWMP
S. No. Village
Activity
EPA Institution
and CB DPR
Watershed Development
Work
Livelihood for Asset less
Production System and
Micro enterprises
Consolidation Total
1 Dabhoda 915427 1144284 228857 12815980.8 2059711.2 2288568 686570.4 20139398
2 Vadodra 351847 439809 87961.8 4925860.8 791656.2 879618 263885.4 7740638
3 Magodi 549466 686832 137366 7692518.4 1236297.6 1373664 412099.2 12088243
4 Valad 702384 877980 175596 9833376 1580364 1755960 526788 15452448
5 Limdiya 167486 209358 41871.6 2344809.6 376844.4 418716 125614.8 3684701
Total 2686610 3358263 671653 37612545.6 6044873.4 6716526 2014957.8 59105429

Table no. 49: Village wise gap in funds requirement
S. No. Village Total cost requirement Total funds
available under IWMP
Gap in funds requirement Work taken
1 Dabhoda 204.93 171.64 33.29 Pond deepening & GGRC and
RKVY
2 Vadodra 24.41 16.71 7.7 GGRC and RKVY
3 Magodi 37.99 26.09 11.9 GGRC and RKVY
4 Valad 48.76 33.36 15.4 GGRC and RKVY
TOTAL 316.09 247.8 68.29 -
Table no.50: Details of Convergence of IWMP with other Schemes
S. No. Village Activity to be
carried out
Fund made available to IWMP due to convergence
(Rs. in lakh)
Scheme with which convergence took place
Reference no. of activity/ task/
structure in DPR
Level at which decision for
convergence was taken
1 Dabhoda Pond Deepening 11.003 MGNREGS
Table-49 Vilage Level
2 Dabhoda Drip Irrigation 50.04 GGRC and RKVY
3 Vadodra Drip Irrigation 14 GGRC and RKVY
4 Magodi Drip Irrigation 32.9 GGRC and RKVY
5 Valad Drip Irrigation 41.3 GGRC and RKVY
6 Limbadiya Drip Irrigation 9.1 GGRC and RKVY
TOTAL 158.743 - - -
Table no. 51: Public-Private Partnership in the IWMP projects
S. No.
Name of Private Sector
Partner Agency
Type of agreement signed Financial contribution Partnership
Interventions Expected Outcomes
Comments a)MoU b)Contract
c) Any other (pl. specify)
IWMP Private sector
- - - - - - - -
CHAPTER – 6
OUTCOMES

Table no. 52: Employment in Project area:*
S. NO.
Names of
Villages
Wage employment Self employment
No. of mandays No. of beneficiaries No. of beneficiaries
SC ST Others Women Total SC ST Others Women Total SC ST Others Women Total
1 Dabhoda 5126 0 34307 11665 39434 62 0 446 152 659 17 0 76 27 120
2 Vadodra 1970 0 13186 4483 15156 24 0 171 58 253 7 0 29 10 46
3 Magodi 3077 0 20592 7001 23669 37 0 268 91 396 10 0 46 16 72
4 Valad 3933 0 26323 8950 30257 47 0 342 116 506 13 0 58 21 92
5 Limdiya 938 0 6277 2134 7215 11 0 82 28 121 3 0 14 5 22
TOTAL 15045 0 100686 34233 115731 181 0 1309 445 1934 51 0 223 80 353
Table no. 53: Details of seasonal migration from Project area
Sr. No. Names of villages
No. of persons migrating No. of days per year of
migration
Pre-project Expected post project Pre-project Expected post project
1 Dabhoda 58 31 65 52
2 Vadodara 41 22 54 43
3 Valad 35 19 56 45
4 Magodi 53 29 62 50
5 Limbadiya 19 10 51 41

Table no. 54: Details of average ground water table depth in the project areas (in meters)
S. No. Names of Villages Sources Pre-Project level (Meters) Expected Increase/decrease
(Post- Project)
1 Dabhoda Bore Well
150-170 Meters 115-145 Meters
2 Vadodara Bore Well
3 Valad Bore Well
4 Magodi Bore Well
5 Limbadiya Bore Well
Table no. 55: Status of Drinking water
S. No. Names of Villages
Availability of drinking water Quality of drinking water
Comments (No. of months in a year)
Pre-project Expected Post
project Pre-project
Expected Post-project
1 Dabhoda
12 12 Potable Potable -
2 Vadodara
3 Valad
4 Magodi
5 Limbadiya

Table no. 56: Details of crop area and yield in the project areas
Name of village Name of crops
Pre-project Expected Post-project
Area Average Yield (Qtl) per ha.
Area Average Yield per ha (qtl)
(ha) (ha)
DABHODA
Kharif
Castor 715.00 19.23 807.95 22.31
Paddy 314.00 21.80 342.26 24.42
Rabi
Wheat 553.00 22.36 635.95 26.38
Mustard 326.00 24.00 352.08 26.88
Zaid
Bajra 156.00 20.79 176.28 24.32
Sorghum 107.00 6.32 129.47 7.27
Village total 2171.00 114.50 2443.99 131.58
VALAD
Kharif
Castor 655.00 20.30 740.15 23.55
Paddy 78.00 20.36 85.02 22.80
Rabi
Wheat 460.00 23.12 529.00 27.28
Mustard 59.00 27.96 63.72 31.87
Zaid
Bajra 36.00 24.29 40.68 28.42
Sorghum 24.00 6.89 29.04 7.92
Village total 1312.00 122.92 1487.61 141.85
MAGODI
Kharif
Castor 269.00 19.78 303.97 22.94
Sorghum 38.00 34.00 45.98 39.10
Rabi
Wheat 197.00 22.37 226.55 26.40
Potato 35.00 270.00 39.55 297.00

Zaid
Bajra 28.00 21.56 31.64 25.23
Sorghum 22.00 7.12 24.42 8.19
Village total 589.00 374.83 672.11 418.85
VADODARA
Kharif
Castor 195.00 18.90 220.35 21.92
Sorghum 25.00 6.14 30.25 7.06
Cotton 38.00 6.10 43.70 7.50
Rabi
Wheat 178.00 23.10 204.70 27.26
Potato 42.00 265.00 47.46 291.50
Zaid
Bajra 25.00 19.96 28.25 23.35
Sorghum 16.00 5.98 19.36 6.88
Village total 519.00 345.18 594.07 385.48
LIMBADIYA
Kharif
Castor 90.00 18.20 101.70 21.11
Paddy 24.00 18.30 26.16 20.50
Rabi
Wheat 76.00 20.39 87.40 24.06
Mustard 42.00 28.65 45.36 32.66
Zaid
Bajra 21.00 23.31 23.73 27.27
Sorghum 16.00 6.58 19.36 7.57
Village total 269.00 115.43 303.71 133.17
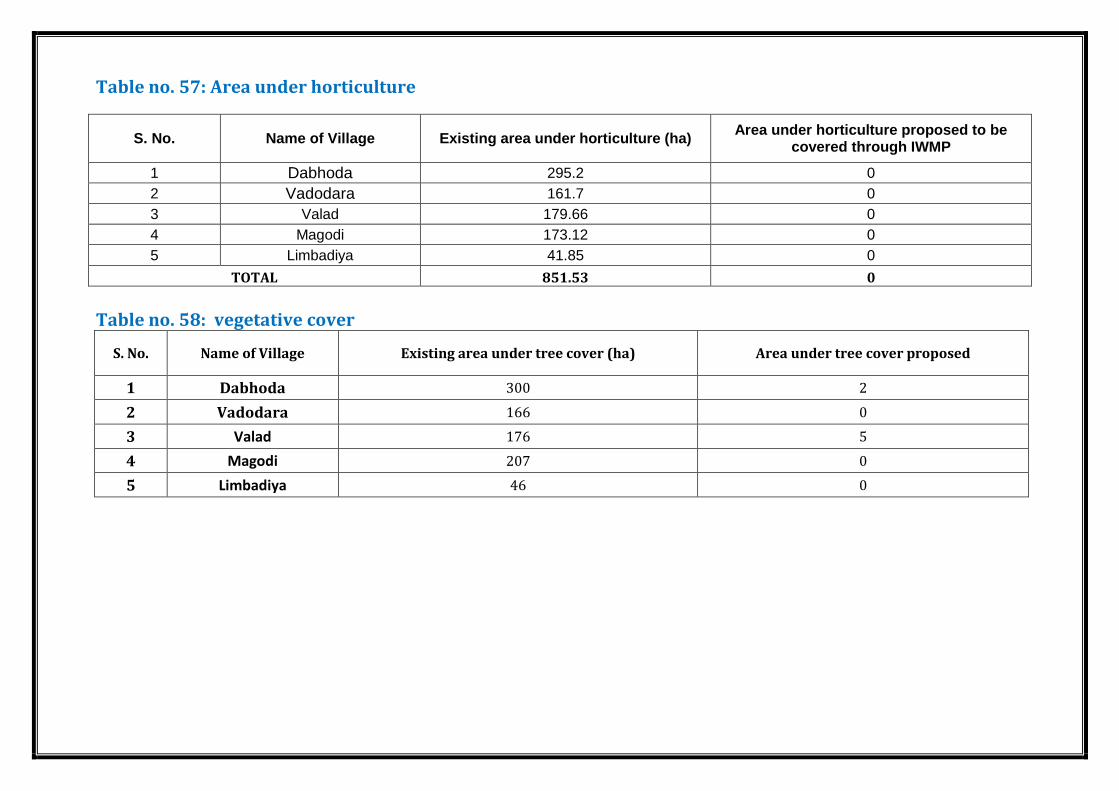
Table no. 57: Area under horticulture
S. No. Name of Village Existing area under horticulture (ha) Area under horticulture proposed to be
covered through IWMP
1 Dabhoda 295.2 0
2 Vadodara 161.7 0
3 Valad 179.66 0
4 Magodi 173.12 0
5 Limbadiya 41.85 0
TOTAL 851.53 0
Table no. 58: vegetative cover
S. No. Name of Village Existing area under tree cover (ha) Area under tree cover proposed
1 Dabhoda 300 2
2 Vadodara 166 0
3 Valad 176 5
4 Magodi 207 0
5 Limbadiya 46 0

Table no. 59: Details of livestock in the project areas (for fluids please mention in litres, for solids please mention in kgs. and income in Rs.)
S. No. Name of Village
Type of Animal
Pre-Project Expected Post-project
Remarks No. Yield Income(Lecks/day) No. Yield Income
1 Dabhoda
Milch-animals
Cow 1057 4756 1.9 1300 6325 2.55
Buffalo 2003 6009 2.7 2464 7992 3.62
Draught Purpose animals
Bullock 86 - 0.028 106 - 0.04
Animals for other purpose
Goat 131 33 0.0082 161 44 0.01
2 Vadodara
Milch-animals
Cow 820 3690 1.47 1009 4908 1.97
Buffalo 61 183 0.62 75 243 0.83
Draught Purpose animals
Bullock 39 - 0.13 48 - 0.17
Animals for other purpose
Goat 898 207 0.052 1105 275 0.07
3 Valad
Milch-animals
Cow 1595 4777.5 1.91 1962 6354 2.56
Buffalo 1505 4515 2.03 1851 6005 2.72
Draught Purpose animals
Bullock 45 - 0.015 55 - 0.02
Animals for other purpose
Sheep 123 25 0.01 151 33 0.01
Goat 202 57 0.19 248 76 0.25
4 Magodi
Milch-animals
Cow 950 4275 1.71 1169 5686 2.29
Buffalo 110 330 0.14 135 439 0.19
Draught Purpose animals
Bullock 100 - 0.033 123 - 0.04
Animals for other purpose
Goat 520 125 0.031 640 166 0.04
5 Limbadiya
Milch-animals
Cow 288 1296 0.52 354 1724 0.70
Buffalo 52 156 0.07 64 207 0.09
Draught Purpose animals
Bullock 12 - 0.004 15 - 0.01
Animals for other purpose
Goat 28 7 0.00175 34 9 0.002
Table no. 60: Backward-Forward linkages S. No. Project Type of Marketing Facility Pre-project (no.) During the project (no.) Post-project (no.)
1 IWMP-9 Dabhoda
Backward linkages No Yes Yes Seed certification No Yes Yes Seed supply system No Yes Yes Fertilizer supply system No Yes Yes Pesticide supply system No Yes Yes Credit institutions Yes Yes Yes Water supply Yes Yes Yes Extension services No Yes Yes Nurseries No Yes Yes Tools/machinery suppliers Yes Yes Yes Price Support system No Yes Yes Labour No Yes Yes Any other (please specify) No Yes Yes Forward linkages No Yes Yes Harvesting/threshing machinery Yes Yes Yes Storage (including cold storage) No Yes Yes Road network Yes Yes Yes Transport facilities Yes Yes Yes Markets / Mandis Yes Yes Yes Agro and other Industries No Yes Yes Milk and other collection centres No Yes Yes Labour Yes Yes Yes Any other (please specify) No Yes Yes
------------------------------------------- XXXXXX------------------------------------------