Embed Size (px)
Citation preview
Project Sea Dragon
Stage 1 Legune Grow-out Facility
Draft Environmental Impact Statement
Volume 1 - Project Overview Chapter 5 - Water Balance 1-1
VOLUME 1 - PROJECT OVERVIEW
CHAPTER 5 - WATER BALANCE
PROJECT SEA DRAGON
STAGE 1 LEGUNE GROW-OUT FACILITY
DRAFT ENVIRONMENTAL IMPACT STATEMENT
Project Sea Dragon
Stage 1 Legune Grow-out Facility
Draft Environmental Impact Statement
Volume 1 - Project Overview Chapter 5 - Water Balance 5 -ii
CONTENTS
1 Introduction ................................................................................................... 1
1.1 Approach ................................................................................................................ 1
2 Model Setup ................................................................................................... 1
2.1 Defining Water Exchange ....................................................................................... 7
2.2 Generation of Long Term Climate Sequences to Enable Probabilistic Modelling . 7
2.3 Assessing Freshwater Reliability ............................................................................ 8
3 Simulations ..................................................................................................... 9
4 Results .......................................................................................................... 10
4.1 Water Holding Capacity of the System ................................................................ 10
4.2 Steady-State Water Balance Scenario .................................................................. 10
4.3 Graphical Representation of a Steady-State Case ............................................... 12
4.4 Reliabilty of Freshwater Supply ............................................................................ 17
5 Conclusions .................................................................................................. 19
LIST OF TABLES
Table 1 Simulation Matrix for Testing Freshwater Supply ........................................................................... 9
Table 2 Design Capacity .............................................................................................................................. 10
Table 3 Water Flux Values for a Theoretical Steady-State Case ................................................................. 11
LIST OF FIGURES
Figure 1 Water Inputs/Outputs Flows, Losses and Storages ......................................................................... 2
Figure 2 Water Inputs/Outputs Flows and Losses at the Farm Level ............................................................ 3
Figure 3 Key Fluxes for a Pond Water Balance Within a Single Farm ............................................................ 4
Figure 4 Modelled Rainfall at Legune .......................................................................................................... 13
Figure 5 Modelled Evaporation at Legune ................................................................................................... 13
Figure 6 Simulated Evaporation at the Main Discharge Channel ................................................................ 14
Figure 7 Simulated Freshwater Demand from Forsyth Creek Dam ............................................................. 14
Figure 8 Total Estuarine Water Pumped Annually ....................................................................................... 15
Figure 9 Flow of Estuarine Water Into Farms .............................................................................................. 15
Figure 10 regular Release of Water Into the Main Discharge Channel ......................................................... 16
Figure 11 Release of Harvest Water Into the Main Discharge Channel......................................................... 16
Figure 12 Water Released into Alligator Creek (ML/Day) .............................................................................. 17
Figure 13 Simulated Forsyth Creek Dam Storage and Estimates From Satellite Imagery ............................. 18
Figure 14 Simulated Range of Forsyth Creek Dam Volumes for Stage 1 ....................................................... 18
Project Sea Dragon
Stage 1 Legune Grow-out Facility
Draft Environmental Impact Statement
Volume 1 - Project Overview Chapter 5 - Water Balance 5-1
1 INTRODUCTION
Section 4.4.2 of the Terms of Reference (ToR) for the Project Sea Dragon Stage 1 Legune Grow-out Facility (the
Project) outline the requirement for a water balance for the Project as follows:
A water balance (all inputs and outputs) based on long-term modelling using rainfall/runoff and
evaporation data for a period equivalent to the expected life of the Project should be included in the EIS.
This section outlines the proponent's response to this ToR.
1.1 APPROACH
Water balances within the project will be dynamic and are unlikely to be at steady state. Thus a 'single' or static
water balance would not capture key attributes of the system. For this reason, to develop a comprehensive
understanding of water balances within the project, the proponent commissioned Golder and Associates to
develop a project-specific version of GoldSim (see http://www.goldsim.com/Home/). GoldSim is a globally
accepted, well documented, water balance modelling software package capable of probabilistic (Monte Carlo)
simulation. Salt and salinity levels are determined within the model simulations since this is a key operating
constraint for the project. Golders has previously undertaken the work to support the development of the
Forsyth Creek Dam.
This approach has several benefits:
provides insight into the optimal engineering for the project based on water
enables a solid understanding of water requirements for the project based on a wide range of scenarios
enables investigations into a wide range of operating assumptions and constraints
can be used as a tool to understand the dynamics between operational decisions, environmental variations
and water balances.
2 MODEL SETUP
GoldSim is a daily-time-step model that enables a highly-resolved simulation of water balance. The model was
set-up as a Probabilistic Water Balance and Salt Model to provide insight into the system within a strict
hierarchy:
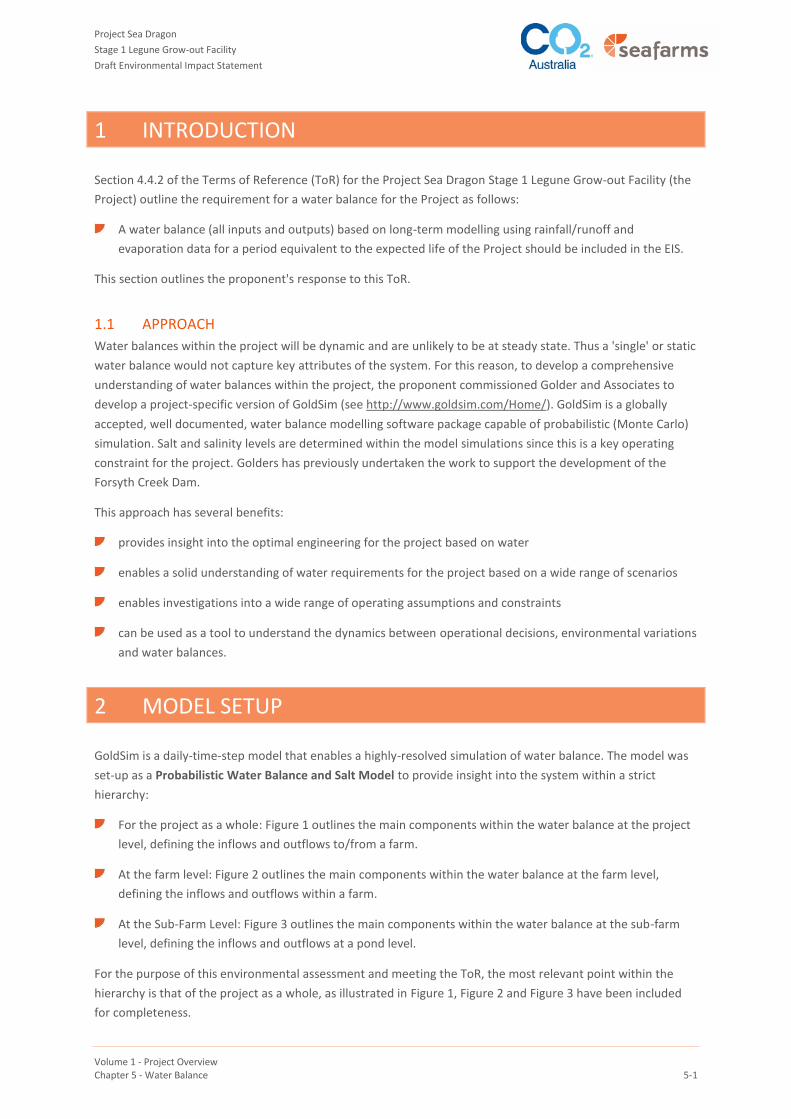
For the project as a whole: Figure 1 outlines the main components within the water balance at the project
level, defining the inflows and outflows to/from a farm.
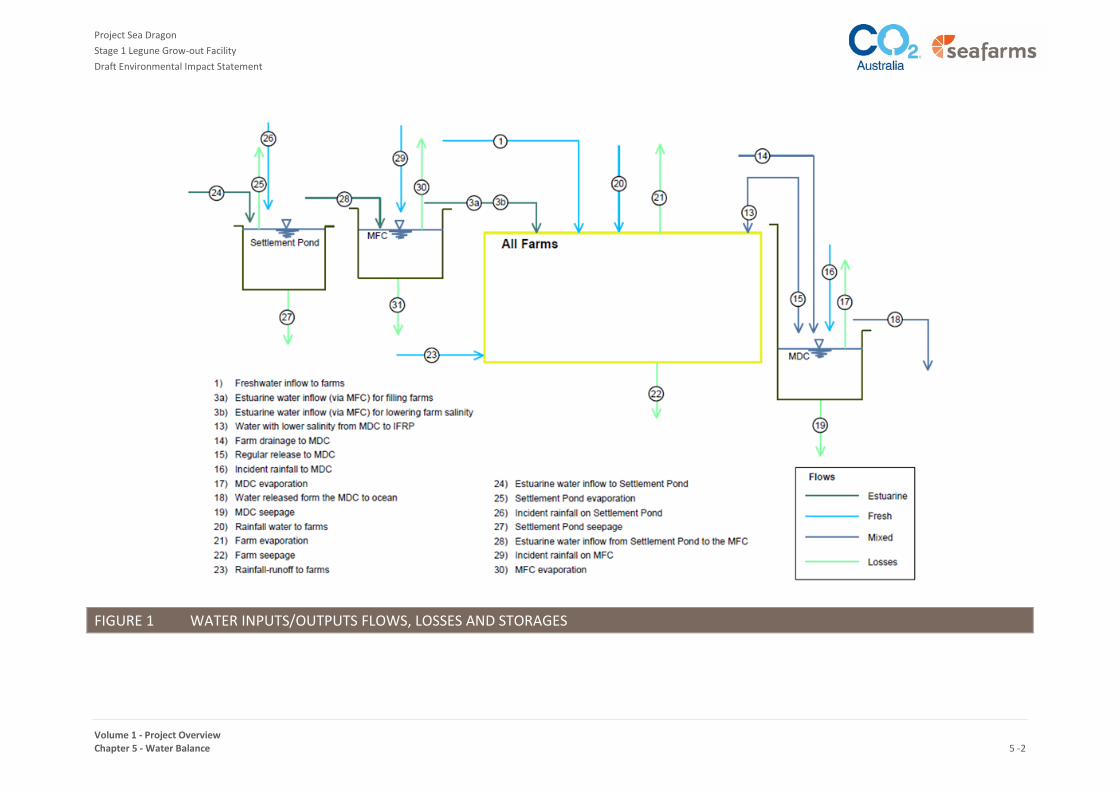
At the farm level: Figure 2 outlines the main components within the water balance at the farm level,
defining the inflows and outflows within a farm.
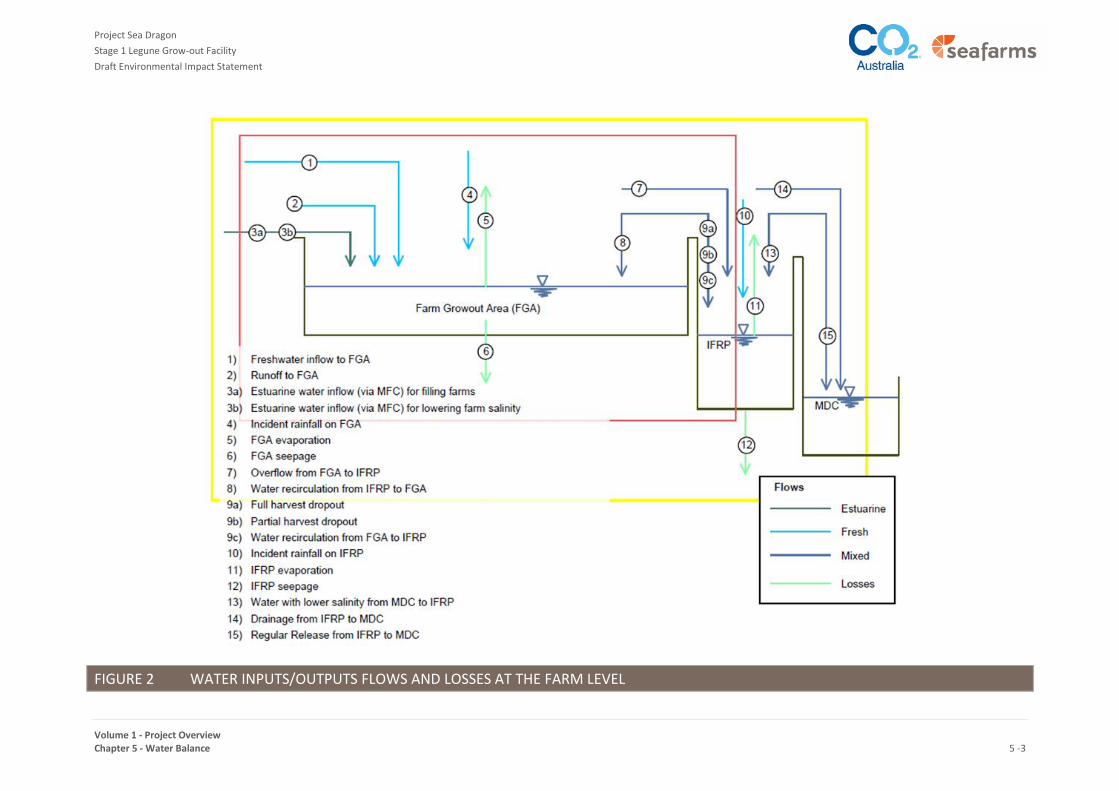
At the Sub-Farm Level: Figure 3 outlines the main components within the water balance at the sub-farm
level, defining the inflows and outflows at a pond level.
For the purpose of this environmental assessment and meeting the ToR, the most relevant point within the
hierarchy is that of the project as a whole, as illustrated in Figure 1, Figure 2 and Figure 3 have been included
for completeness.
Project Sea Dragon
Stage 1 Legune Grow-out Facility
Draft Environmental Impact Statement
Volume 1 - Project Overview Chapter 5 - Water Balance 5 -2
FIGURE 1 WATER INPUTS/OUTPUTS FLOWS, LOSSES AND STORAGES
Project Sea Dragon
Stage 1 Legune Grow-out Facility
Draft Environmental Impact Statement
Volume 1 - Project Overview Chapter 5 - Water Balance 5 -3
FIGURE 2 WATER INPUTS/OUTPUTS FLOWS AND LOSSES AT THE FARM LEVEL
Project Sea Dragon
Stage 1 Legune Grow-out Facility
Draft Environmental Impact Statement
Volume 1 - Project Overview Chapter 5 - Water Balance 5 -4
FIGURE 3 KEY FLUXES FOR A POND WATER BALANCE WITHIN A SINGLE FARM
Project Sea Dragon
Stage 1 Legune Grow-out Facility
Draft Environmental Impact Statement
Volume 1 - Project Overview Chapter 5 - Water Balance 5-5
It is essential to note that the model domain does not include the Environmental Protection Zone (EPZ). This
was a deliberate choice and is a conservative assumption. Note also that the model has been designed to
capture certain fluxes at the farm level or pond level as opposed to system level. Thus assumptions in relation
to run-off (flux 2) are tested at the 'farm level' in other cases some fluxes are partitioned according to scale -
thus flux 4 in Figure 2, for example is a partitioning of flux 20 in Figure 1.
The model contains a relatively large number of parameters and inputs that can be adjusted or modified. These
are:
Development stages including:
number of farms and ponds developed within Stage 1 and the commissioning date of the farms
reach of the Main Feeder Channel (MFC) from which estuarine water is abstracted (noting this is
used in the hydraulic channel analyses within the model)
timing of partial and terminal harvests for each farm
durations of farm production and periods required for pond dry-out.
Storage details including:
data to define the available storage volume and surface area for Forsyth Creek Dam
maximum storage capacity and minimum abstraction levels for Forsyth Creek Dam.
Channel characteristics including:
Main Feeder Channel (MFC) and Main Discharge Channel (MDC) widths, lengths and slopes
interconnection between the channels to be used in the hydraulic analyses within the model
(based on farm layout plan).
Design parameters defining:
pond dimensions
capacity of Internal Farm Recycling Ponds
partial harvest dropout rates
capacities of estuarine water inflow per farm
freshwater conveyance rate per farm,
pumping rate from MDC to Internal Farm Recycling Pond (IFRP), and drainage from IFRP to MDC
area of settlement ponds
seepage rates from ponds and channels
salinity thresholds in farms at which freshwater is provided from the storages.
Relevant environmental, climatic and streamflow data including:
monthly estuarine salinities
Project Sea Dragon
Stage 1 Legune Grow-out Facility
Draft Environmental Impact Statement
Volume 1 - Project Overview Chapter 5 - Water Balance 5-6
long-term rainfall and evaporation records for the project area, which were analysed and
parameters derived to stochastically generate both daily rainfall and evaporation. This was
required to allow the model to be operated probabilistically into the future. These generated
sequences have the same likelihood of occurrence as those observed as well as retaining
comparable seasonal and annual statistics to the historical data sets.
The Australian Water Balance Model was calibrated to the project site and is applied in the
Probabilistic Water Balance and Salt Model to predict inflows to the proposed reservoirs.
In considering the above it becomes clear that the parameters can be further grouped into three classes: (i)
design parameters; (ii) operational parameters; and (iii) environmental parameters.
The water balance model has been used iteratively to assist in the design of the facility, and the design
parameters have been varied as part of this process. However, once the facility is constructed (or final detailed
engineering design 'locked in') the design parameters within the model become fixed. By contrast operational
and environmental parameters will vary once the project is operating.
Examples of design parameters within the model are:
channel dimensions
pond dimensions
pump and conveyance plant and equipment.
Examples of operational parameters:
number of ponds in production
scheduling of ponds in production
harvest strategy within ponds (e.g. partial, or full harvest; growth of the crop; ability of processing plant to
accommodate incoming product)
amount of water being re-used (quality of water in recycling ponds, quality of water in production ponds)
amount of water being exchanged (taken into the system and discharged from the system)
pumping of estuarine water
pumping of freshwater
release of water.
Examples of environmental variables:
precipitation
evaporation
freshwater availability (storage)
temperature
estuarine salinity.
From a water-salt balance perspective the two key operational parameters that constrain the system are:
Project Sea Dragon
Stage 1 Legune Grow-out Facility
Draft Environmental Impact Statement
Volume 1 - Project Overview Chapter 5 - Water Balance 5-7
a requirement to maintain salinity within the biological tolerances of the animals (salinity must be
maintained at 10 to 45 g/L [10-45 parts per thousand])
availability of freshwater.
Freshwater is 'controllable' via rates and timing of water release from the dam, the design of channels,
pumping rates and the operation of the facility within the design. Other factors driving water flow
requirements are climatically-driven: precipitation, evaporation and to a smaller extent temperature.
Some of the parameters in the GoldSim model have been implemented for engineering design as opposed to
environmental assessment purposes. Thus in the list above it is possible to test the minimum abstraction of the
Forsyth Creek Dam for reliability purposes, but also in order to test whether engineering modifications to the
dam might be effective. In broad terms a decision was made to include as many conceivable parameters in the
model prior to engineering design. As discussed below the model allows for rainfall run-off into farms to test
whether this might be a desirable design attribute.
2.1 DEFINING WATER EXCHANGE
To support pond biota, water quality within the system needs to be managed. Water quality management
includes the exchange of water through the system by pumping water in (estuarine water and freshwater), and
regularly releasing water from the system. Water exchange can thus be defined as water released from the
system in ‘exchange’ for new water. This is the most relevant definition for the purposes of environmental
assessment.
However, it is important to note that water exchange actually occurs within the model at each level of the
system hierarchy as described in Figure 1, Figure 2 and Figure 3. Thus, in order of scale, water exchange can be
considered, and occurs:
between 'the system' and the environment (that is, from water acquisition through to water release).
between farms (that is, between the IFRP and the MDC).
between ponds and the farm.
From an environmental perspective, exchange between farms and between ponds can be considered as
'recirculation' and therefore water exchange in this water balance is considered to be between the entire grow-
out operations and the environment (e.g. Figure 1). At a seasonal scale, water exchange can be considered as
the percentage of the water held within the system that is exchanged with the environment over the course of
an 'average' season.
2.2 GENERATION OF LONG TERM CLIMATE SEQUENCES TO ENABLE PROBABILISTIC MODELLING
During simulations the period of modelling was selected to reflect the duration of operations, which for the
purposes of this Environmental Impact Statement (EIS) is a period notionally for 30 years. However, depending
on the phenomenon being investigated (for example harvesting) the simulation can be made shorter. The key
point is that a single simulation therefore provides one set of model outputs.
When considering how the facility will operate over a number of years it is necessary to account for climatic
variability, in particular precipitation and evaporation. In order to do this it is necessary to generate climate
scenarios in which daily patterns of rainfall and evaporation differ (vary), but the seasonal trends (or statistics)
are comparable to those which have been observed. Given that these are generated at a minimum of daily
Project Sea Dragon
Stage 1 Legune Grow-out Facility
Draft Environmental Impact Statement
Volume 1 - Project Overview Chapter 5 - Water Balance 5-8
time-steps; the synthetic data sequences are also known as weather sequences. In this way it is possible to
undertake comparable simulations, in which there are multiple realisations of climatic parameters.
This is a more robust approach than simply applying time-series of 'observed' data in a geography that is either
data-sparse or where the length of the time-series might be limited.
The water balance and salt model was therefore operated probabilistically to enable the full range of variability
in model outputs (based on multiple stochastically generated model runs) to be assessed.
Golders developed a synthetic data-set based on stochastic generation of both daily rainfalls and evaporations.
The sequences were derived using the stochastic generator developed by the Catchment Research Centre
(CRC) for Catchment Hydrology (Boughton 2005).
The generator uses a transitional probability matrix to provide a representation of the probabilities of the
historic daily rainfall (or evaporation) falling within defined ranges. This approach also takes into consideration
the magnitude of the preceding day’s rainfall and therefore preserves the historic daily climatic patterns as well
as the frequency and magnitude of the daily values including the more extreme observations.
The benefits of the stochastic generator are:
Stochastically generated data are able to reproduce observed statistics (monthly and annual means and
standard deviations) and therefore provides alternative yet statistically equally likely sequences.
Stochastic generation for rainfall results in more extreme high values than have been recorded, if the
sequences to be generated are longer than the observed record. This approach allows for future planning
based on more extreme rainfall events than have occurred in the observed record.
The inclusion of 'more extreme' values being included via this approach increases confidence that the design of
the system can operate within the envelope of extremes likely to be encountered, even if such extremes have
not been historically observed.
By undertaking the modelling for a large number of realisations (typically 30 - 100) the combined set of output
results can be evaluated to define probabilities of exceedance, and hence the probability that various
parameter estimates will be exceeded. This could include parameters such as salinities within the farms,
storage volumes with the various freshwater storages, and any shortfalls in freshwater supply.
A further benefit of this approach is that the risks associated with various operating strategies and design
criteria during the feasibility study such as: salinity threshold levels in the farms for release of freshwater;
conveyance capacities for transfer of freshwater from the storages; and timing of the introduction of new
freshwater storages and their associated capacities, can be evaluated.
2.3 ASSESSING FRESHWATER RELIABILITY
Project Sea Dragon has used three lines of evidence to assess the reliability of freshwater storage at Forsyth
Creek Dam. These are:
i. anecdotal information
ii. historic satellite imagery
iii. rainfall-runoff modelling.
Project Sea Dragon
Stage 1 Legune Grow-out Facility
Draft Environmental Impact Statement
Volume 1 - Project Overview Chapter 5 - Water Balance 5-9
Anecdotally the Legune Station Manager reported that the dam has overflowed (via the spillway) on 8 out of
the 10 years of operation.
A review of satellite imagery (Landsat) over the past ten years was undertaken for the period January 2005 to
December 2015. Recognised limitations with Landsat imagery include:
scenes are limited to about 16 days between images
the utility of scenes may be compromised by image clarity, resolution constraints, or excessive cloud cover
Landsat has a 30 m spatial resolution, as a result storage volumes inferred from the images were limited to
a resolution of 0.5 m storage.
Nonetheless satellite images were able to be used to assess past reliability of inflows into the dam.
The Australian Water Balance Model is one of several available rainfall-runoff models commonly used in
Australia (Sacremento and Simhyd are others, see Boughton 2005 for a review).
The rainfall-runoff model was calibrated using Bureau of Meteorological data validated against meteorological
observations taken at Legune and hydrologic data from the Elizabeth River Catchment. The Elizabeth River
Catchment was selected as being the most appropriate surrogate for the Forsyth Creek catchment. The Forsyth
Creek catchment is not instrumented and therefore could not provide any data for this modelling. The
parameters in the rainfall-runoff model were set to simulate observed run-off in the Elizabeth River catchment
over a period of 10 years. The capacity of water storage parameters were then adjusted to reflect the size and
conditions of Forsyth Creek assuming a similar catchment yield of approximately 40%.
3 SIMULATIONS
A very large number of simulations has been undertaken with the water balance model. The simulations have
explored important key elements of the system as follows:
System sensitivities to water exchange (up to 1.4% of maximum dry-season total system volume).
Time taken to fill farms (3 days and 18 days) and days between farm fills (56 days and 70 days).
Freshwater demand and supply (see Table 1).
Implications for volumes of water leaving the system (see Volume 2, Chapter 2).
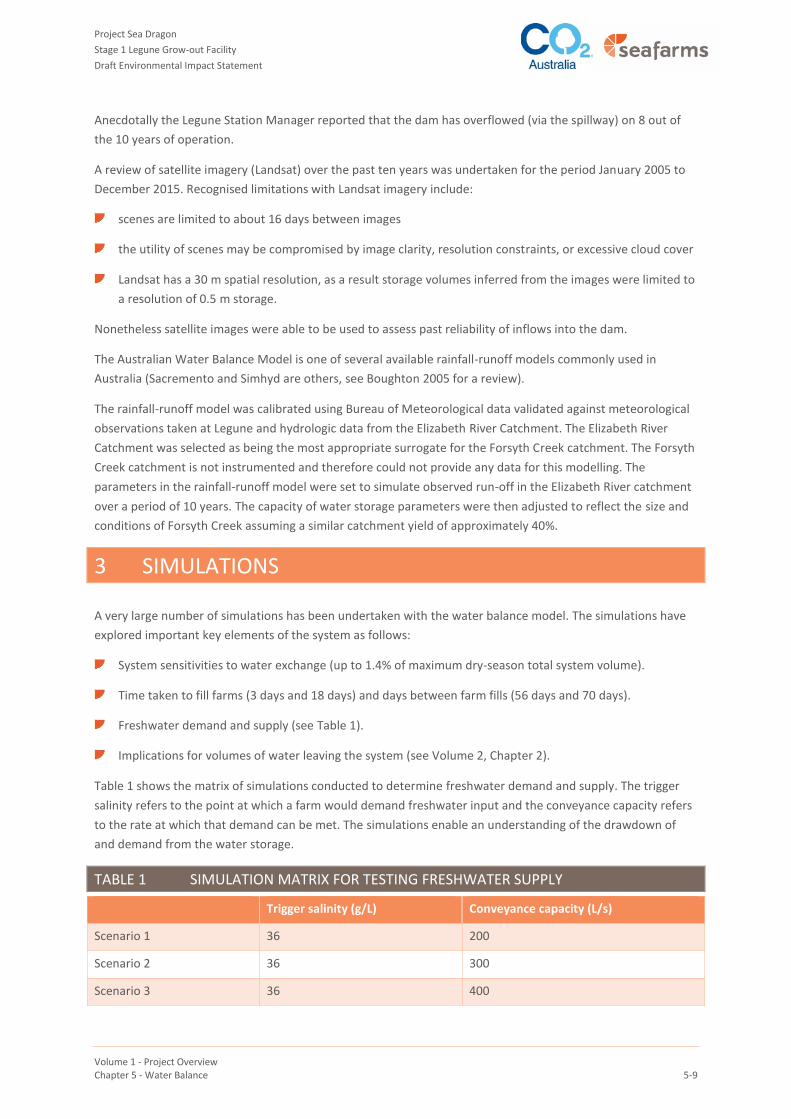
Table 1 shows the matrix of simulations conducted to determine freshwater demand and supply. The trigger
salinity refers to the point at which a farm would demand freshwater input and the conveyance capacity refers
to the rate at which that demand can be met. The simulations enable an understanding of the drawdown of
and demand from the water storage.
TABLE 1 SIMULATION MATRIX FOR TESTING FRESHWATER SUPPLY
Trigger salinity (g/L) Conveyance capacity (L/s)
Scenario 1 36 200
Scenario 2 36 300
Scenario 3 36 400
Project Sea Dragon
Stage 1 Legune Grow-out Facility
Draft Environmental Impact Statement
Volume 1 - Project Overview Chapter 5 - Water Balance 5-10
Trigger salinity (g/L) Conveyance capacity (L/s)
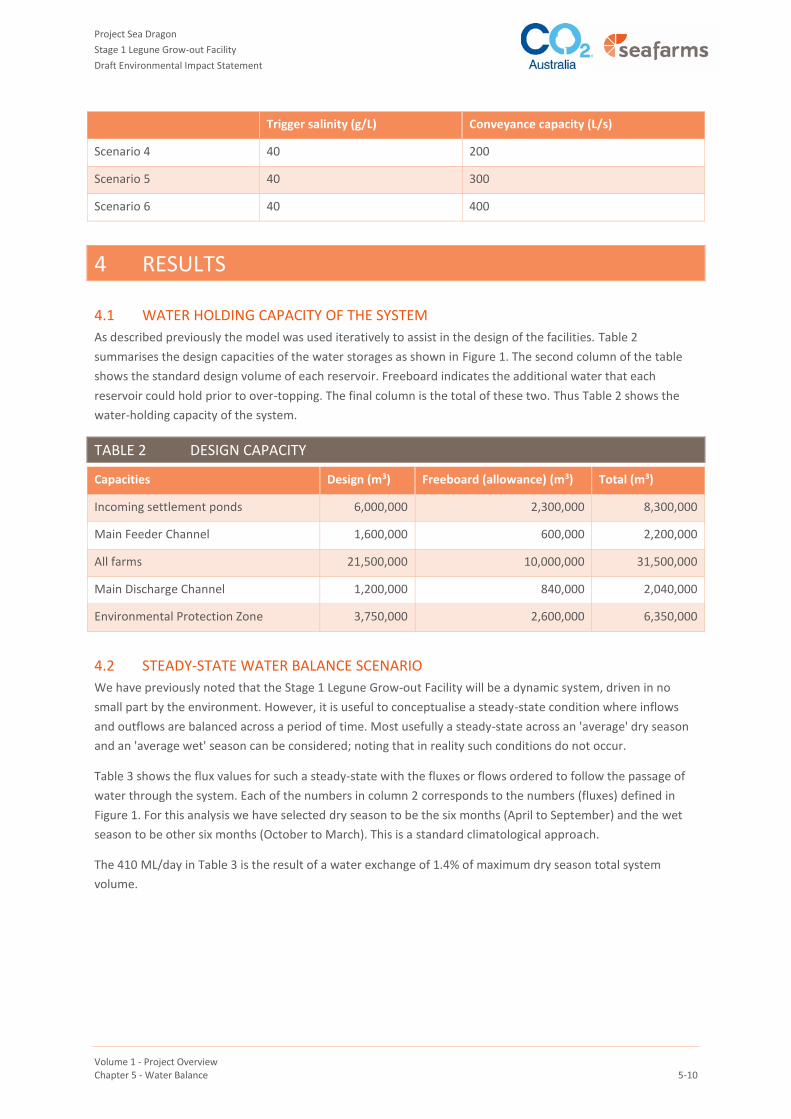
Scenario 4 40 200
Scenario 5 40 300
Scenario 6 40 400
4 RESULTS
4.1 WATER HOLDING CAPACITY OF THE SYSTEM
As described previously the model was used iteratively to assist in the design of the facilities. Table 2
summarises the design capacities of the water storages as shown in Figure 1. The second column of the table
shows the standard design volume of each reservoir. Freeboard indicates the additional water that each
reservoir could hold prior to over-topping. The final column is the total of these two. Thus Table 2 shows the
water-holding capacity of the system.
TABLE 2 DESIGN CAPACITY
Capacities Design (m3) Freeboard (allowance) (m3) Total (m3)
Incoming settlement ponds 6,000,000 2,300,000 8,300,000
Main Feeder Channel 1,600,000 600,000 2,200,000
All farms 21,500,000 10,000,000 31,500,000
Main Discharge Channel 1,200,000 840,000 2,040,000
Environmental Protection Zone 3,750,000 2,600,000 6,350,000
4.2 STEADY-STATE WATER BALANCE SCENARIO
We have previously noted that the Stage 1 Legune Grow-out Facility will be a dynamic system, driven in no
small part by the environment. However, it is useful to conceptualise a steady-state condition where inflows
and outflows are balanced across a period of time. Most usefully a steady-state across an 'average' dry season
and an 'average wet' season can be considered; noting that in reality such conditions do not occur.
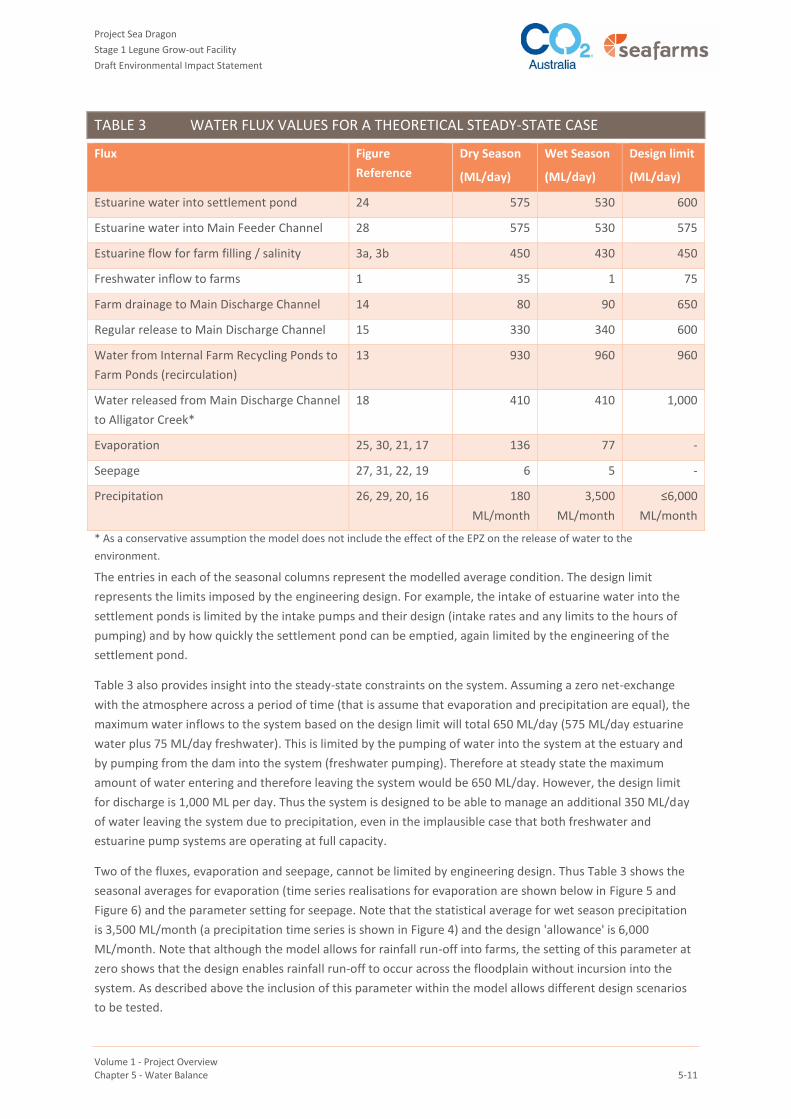
Table 3 shows the flux values for such a steady-state with the fluxes or flows ordered to follow the passage of
water through the system. Each of the numbers in column 2 corresponds to the numbers (fluxes) defined in
Figure 1. For this analysis we have selected dry season to be the six months (April to September) and the wet
season to be other six months (October to March). This is a standard climatological approach.
The 410 ML/day in Table 3 is the result of a water exchange of 1.4% of maximum dry season total system
volume.
Project Sea Dragon
Stage 1 Legune Grow-out Facility
Draft Environmental Impact Statement
Volume 1 - Project Overview Chapter 5 - Water Balance 5-11
TABLE 3 WATER FLUX VALUES FOR A THEORETICAL STEADY-STATE CASE
Flux Figure
Reference
Dry Season
(ML/day)
Wet Season
(ML/day)
Design limit
(ML/day)
Estuarine water into settlement pond 24 575 530 600
Estuarine water into Main Feeder Channel 28 575 530 575
Estuarine flow for farm filling / salinity 3a, 3b 450 430 450
Freshwater inflow to farms 1 35 1 75
Farm drainage to Main Discharge Channel 14 80 90 650
Regular release to Main Discharge Channel 15 330 340 600
Water from Internal Farm Recycling Ponds to
Farm Ponds (recirculation)
13 930 960 960
Water released from Main Discharge Channel
to Alligator Creek*
18 410 410 1,000
Evaporation 25, 30, 21, 17 136 77 -
Seepage 27, 31, 22, 19 6 5 -
Precipitation 26, 29, 20, 16 180
ML/month
3,500
ML/month
≤6,000
ML/month
* As a conservative assumption the model does not include the effect of the EPZ on the release of water to the
environment.
The entries in each of the seasonal columns represent the modelled average condition. The design limit
represents the limits imposed by the engineering design. For example, the intake of estuarine water into the
settlement ponds is limited by the intake pumps and their design (intake rates and any limits to the hours of
pumping) and by how quickly the settlement pond can be emptied, again limited by the engineering of the
settlement pond.
Table 3 also provides insight into the steady-state constraints on the system. Assuming a zero net-exchange
with the atmosphere across a period of time (that is assume that evaporation and precipitation are equal), the
maximum water inflows to the system based on the design limit will total 650 ML/day (575 ML/day estuarine
water plus 75 ML/day freshwater). This is limited by the pumping of water into the system at the estuary and
by pumping from the dam into the system (freshwater pumping). Therefore at steady state the maximum
amount of water entering and therefore leaving the system would be 650 ML/day. However, the design limit
for discharge is 1,000 ML per day. Thus the system is designed to be able to manage an additional 350 ML/day
of water leaving the system due to precipitation, even in the implausible case that both freshwater and
estuarine pump systems are operating at full capacity.
Two of the fluxes, evaporation and seepage, cannot be limited by engineering design. Thus Table 3 shows the
seasonal averages for evaporation (time series realisations for evaporation are shown below in Figure 5 and
Figure 6) and the parameter setting for seepage. Note that the statistical average for wet season precipitation
is 3,500 ML/month (a precipitation time series is shown in Figure 4) and the design 'allowance' is 6,000
ML/month. Note that although the model allows for rainfall run-off into farms, the setting of this parameter at
zero shows that the design enables rainfall run-off to occur across the floodplain without incursion into the
system. As described above the inclusion of this parameter within the model allows different design scenarios
to be tested.
Project Sea Dragon
Stage 1 Legune Grow-out Facility
Draft Environmental Impact Statement
Volume 1 - Project Overview Chapter 5 - Water Balance 5-12
4.3 GRAPHICAL REPRESENTATION OF A STEADY-STATE CASE
The figures presented below relate to the dry season steady-state scenario described in Table 3 which
represents a water exchange of 1.4% of maximum dry season total system volume. The key outputs are shown
below.
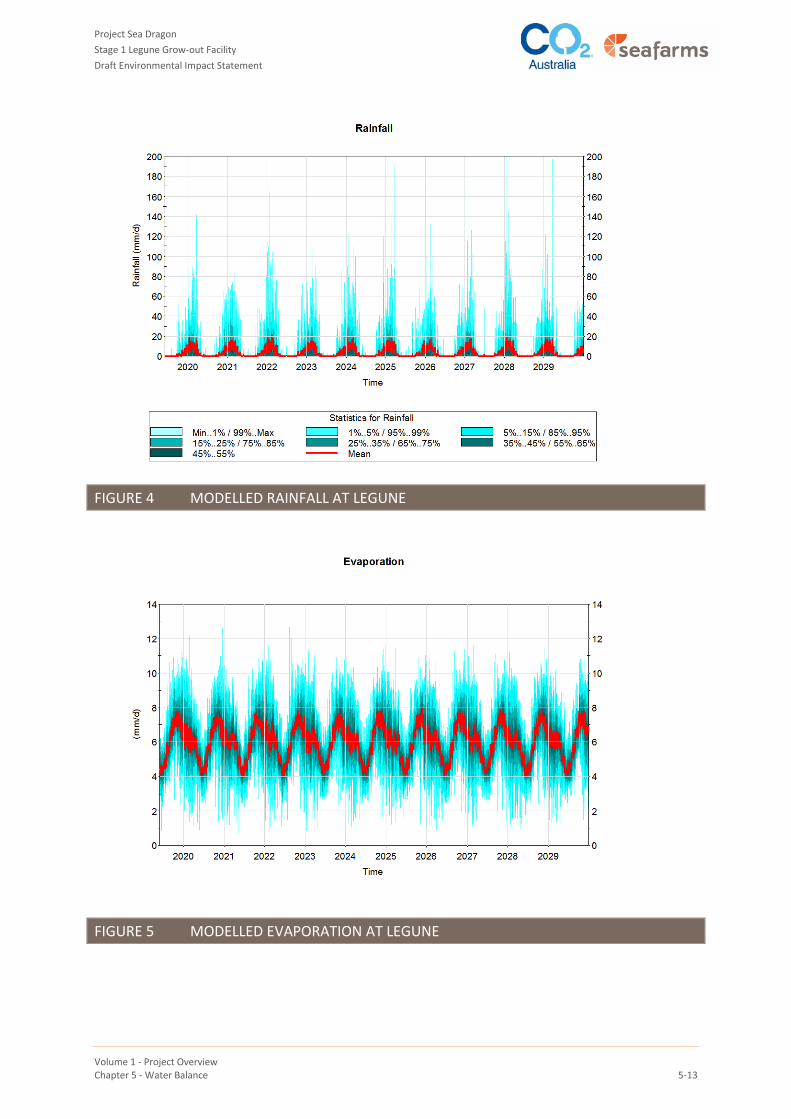
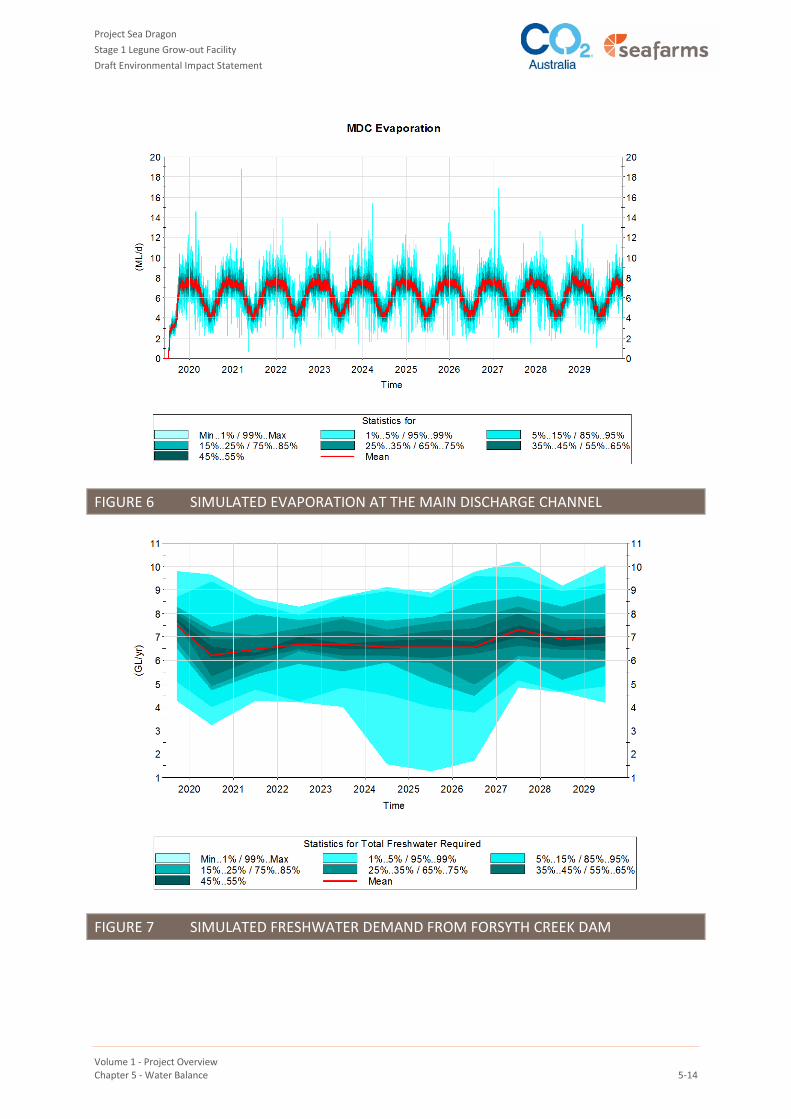
Figure 4 shows the modelled incident rainfall at Legune Station. Figure 5 shows the modelled evaporation at
Legune Station. Figure 6 shows the output from the model for evaporation at the MDC.
Figure 7 shows the estimated freshwater demand from Forsyth Creek Dam, based on an assumption that the
demand for freshwater is triggered when the salinity within farm hits 36 g/L and that the engineering
conveyance permits a draw-down of 300 L/s.
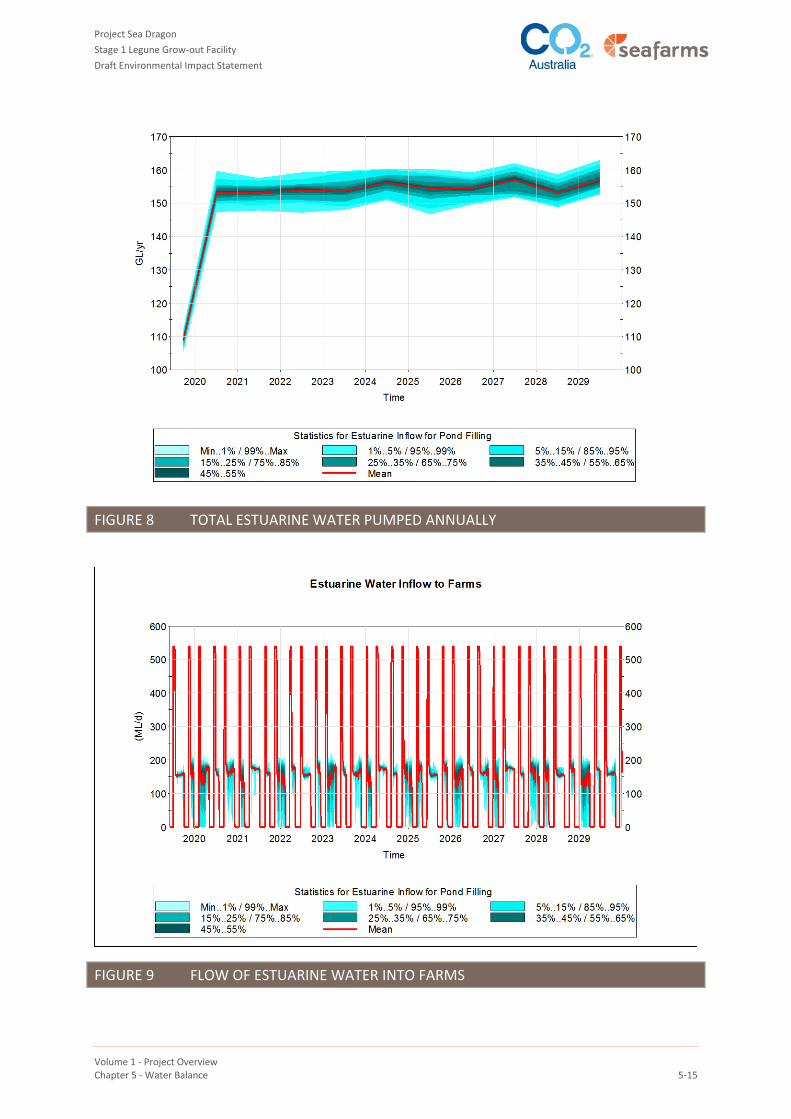
Figure 8 shows the total amount of water from the estuary pumped into the system on an annual average basis
assuming a farm being filled every 70 days. The corresponding daily pumping from the estuary is shown in
Figure 9. Note that pumping is not continuous and the pumps are designed to pump only at mid-tide and
higher.
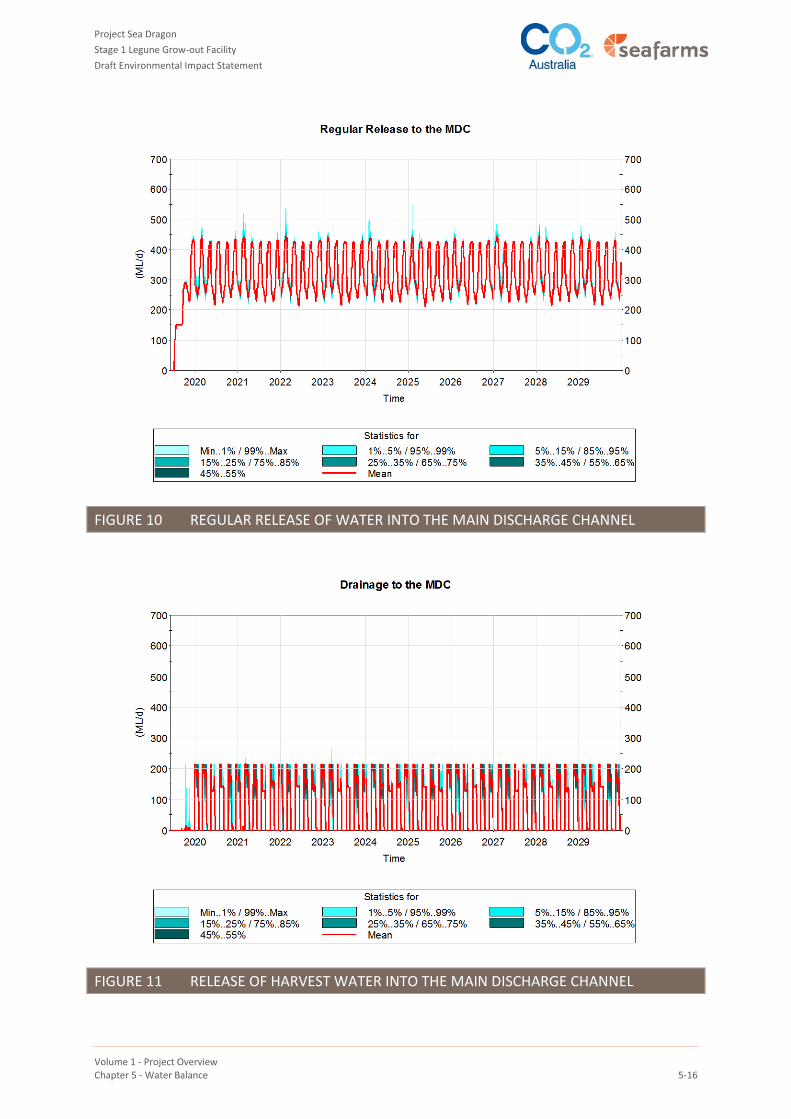
In order to achieve the water exchange, Figure 10 shows the regular release of water from the farms to the
MDC.
Figure 11 shows the release of water associated with the harvest from the farms to the MDC.
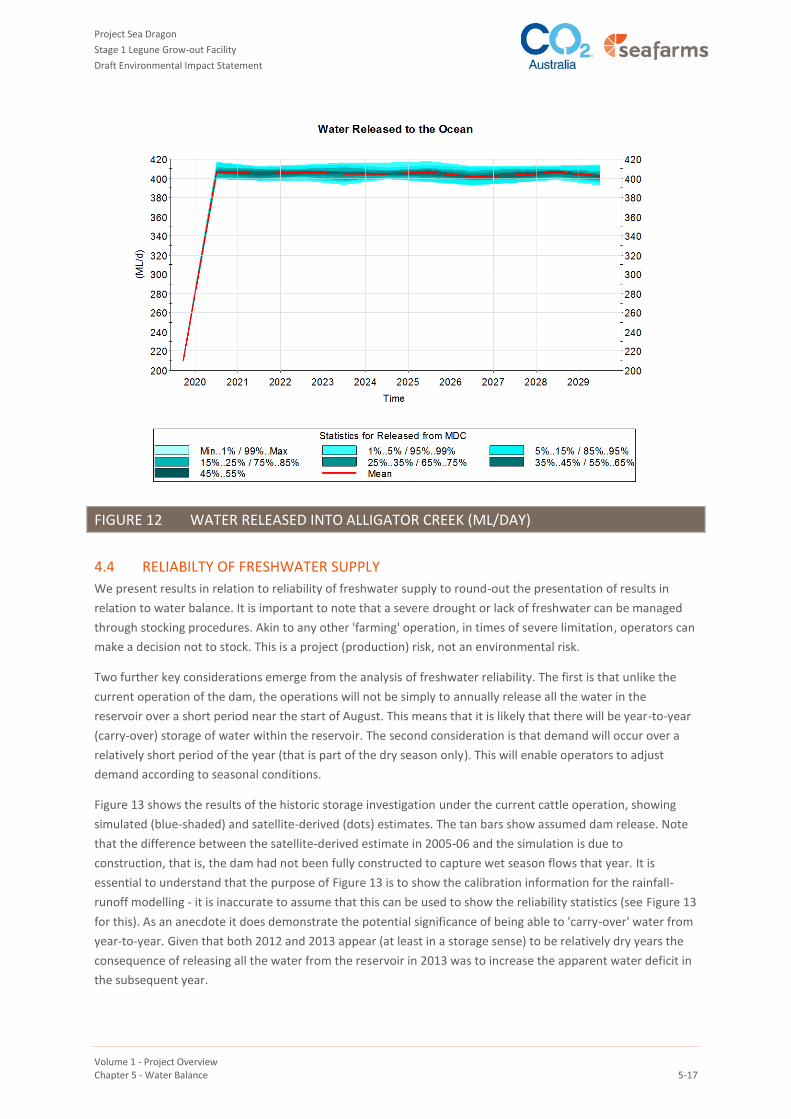
Finally, Figure 12 shows the simulated release of water back to Alligator Creek. The figure is plotted as an
annual average in ML/day.
The figures comprise statistics from a Monte Carlo simulation of 30 realisations, and plot the results for a
notional period 2019 - 2029. The red line plots daily average values. Reading across the legend, the colour
bands represent the statistics of the realisations as follows:
Light blue labelled 'Min..1% /99%..Max' represents the range of results ≥1% and ≤99%, thus the shading
shown excludes the lowest 1% and highest 1% of results. This represents the 98% confidence interval for
both low and high events.
The next label '1%..5% /95%..99%' represents the range of results ≥5% and ≤95% (that is the plot excludes
the lowest 5% and highest 5% of results), and so on.
In terms of considering the probability of exceeding an upper threshold, there is a less than 1% probability that
upper values will exceed the range shown.
An alternate way of thinking about the presentation of these plots is as a range:
mean ±5% (a 10% range)
mean ±10% (a 20% range)
mean ±15% (a 30% range)
mean ±25% (a 50% range)
mean ±35% (a 70% range)
mean ±45% (a 90% range)
mean ±49% (a 98% range).
Project Sea Dragon
Stage 1 Legune Grow-out Facility
Draft Environmental Impact Statement
Volume 1 - Project Overview Chapter 5 - Water Balance 5-13
FIGURE 4 MODELLED RAINFALL AT LEGUNE
FIGURE 5 MODELLED EVAPORATION AT LEGUNE
Project Sea Dragon
Stage 1 Legune Grow-out Facility
Draft Environmental Impact Statement
Volume 1 - Project Overview Chapter 5 - Water Balance 5-14
FIGURE 6 SIMULATED EVAPORATION AT THE MAIN DISCHARGE CHANNEL
FIGURE 7 SIMULATED FRESHWATER DEMAND FROM FORSYTH CREEK DAM
Project Sea Dragon
Stage 1 Legune Grow-out Facility
Draft Environmental Impact Statement
Volume 1 - Project Overview Chapter 5 - Water Balance 5-15
FIGURE 8 TOTAL ESTUARINE WATER PUMPED ANNUALLY
FIGURE 9 FLOW OF ESTUARINE WATER INTO FARMS
Project Sea Dragon
Stage 1 Legune Grow-out Facility
Draft Environmental Impact Statement
Volume 1 - Project Overview Chapter 5 - Water Balance 5-16
FIGURE 10 REGULAR RELEASE OF WATER INTO THE MAIN DISCHARGE CHANNEL
FIGURE 11 RELEASE OF HARVEST WATER INTO THE MAIN DISCHARGE CHANNEL
Project Sea Dragon
Stage 1 Legune Grow-out Facility
Draft Environmental Impact Statement
Volume 1 - Project Overview Chapter 5 - Water Balance 5-17
FIGURE 12 WATER RELEASED INTO ALLIGATOR CREEK (ML/DAY)
4.4 RELIABILTY OF FRESHWATER SUPPLY
We present results in relation to reliability of freshwater supply to round-out the presentation of results in
relation to water balance. It is important to note that a severe drought or lack of freshwater can be managed
through stocking procedures. Akin to any other 'farming' operation, in times of severe limitation, operators can
make a decision not to stock. This is a project (production) risk, not an environmental risk.
Two further key considerations emerge from the analysis of freshwater reliability. The first is that unlike the
current operation of the dam, the operations will not be simply to annually release all the water in the
reservoir over a short period near the start of August. This means that it is likely that there will be year-to-year
(carry-over) storage of water within the reservoir. The second consideration is that demand will occur over a
relatively short period of the year (that is part of the dry season only). This will enable operators to adjust
demand according to seasonal conditions.
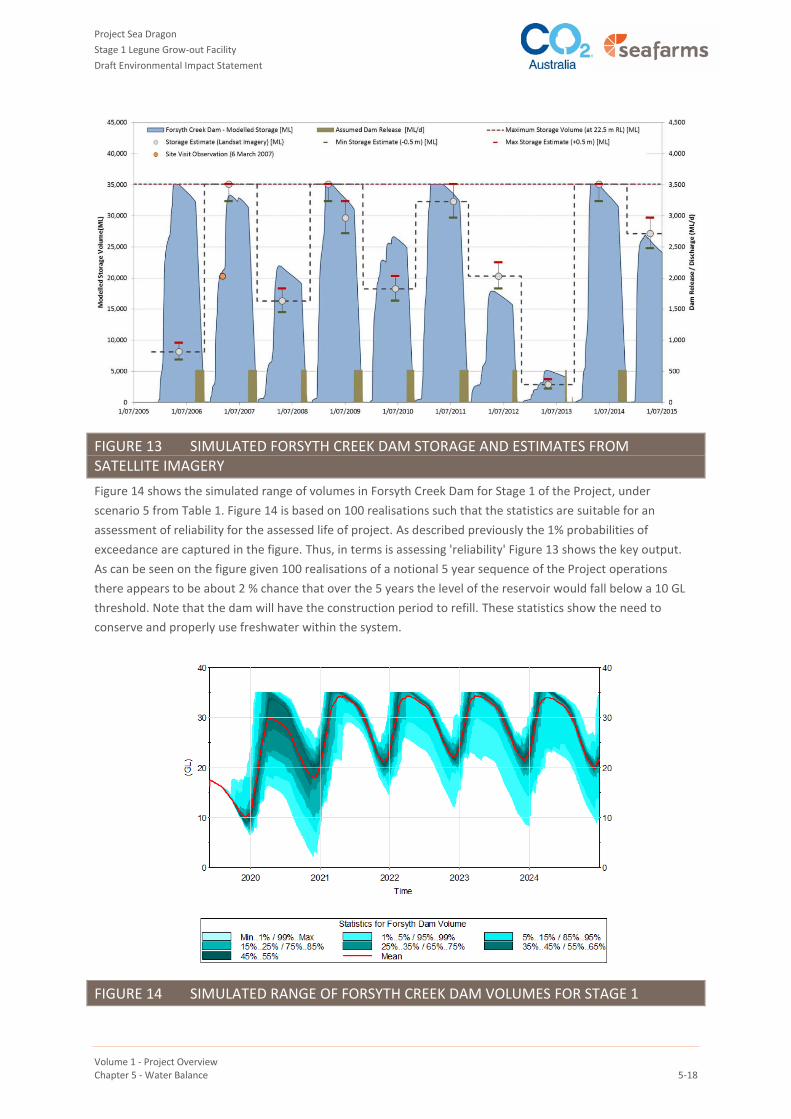
Figure 13 shows the results of the historic storage investigation under the current cattle operation, showing
simulated (blue-shaded) and satellite-derived (dots) estimates. The tan bars show assumed dam release. Note
that the difference between the satellite-derived estimate in 2005-06 and the simulation is due to
construction, that is, the dam had not been fully constructed to capture wet season flows that year. It is
essential to understand that the purpose of Figure 13 is to show the calibration information for the rainfall-
runoff modelling - it is inaccurate to assume that this can be used to show the reliability statistics (see Figure 13
for this). As an anecdote it does demonstrate the potential significance of being able to 'carry-over' water from
year-to-year. Given that both 2012 and 2013 appear (at least in a storage sense) to be relatively dry years the
consequence of releasing all the water from the reservoir in 2013 was to increase the apparent water deficit in
the subsequent year.
Project Sea Dragon
Stage 1 Legune Grow-out Facility
Draft Environmental Impact Statement
Volume 1 - Project Overview Chapter 5 - Water Balance 5-18
FIGURE 13 SIMULATED FORSYTH CREEK DAM STORAGE AND ESTIMATES FROM SATELLITE IMAGERY
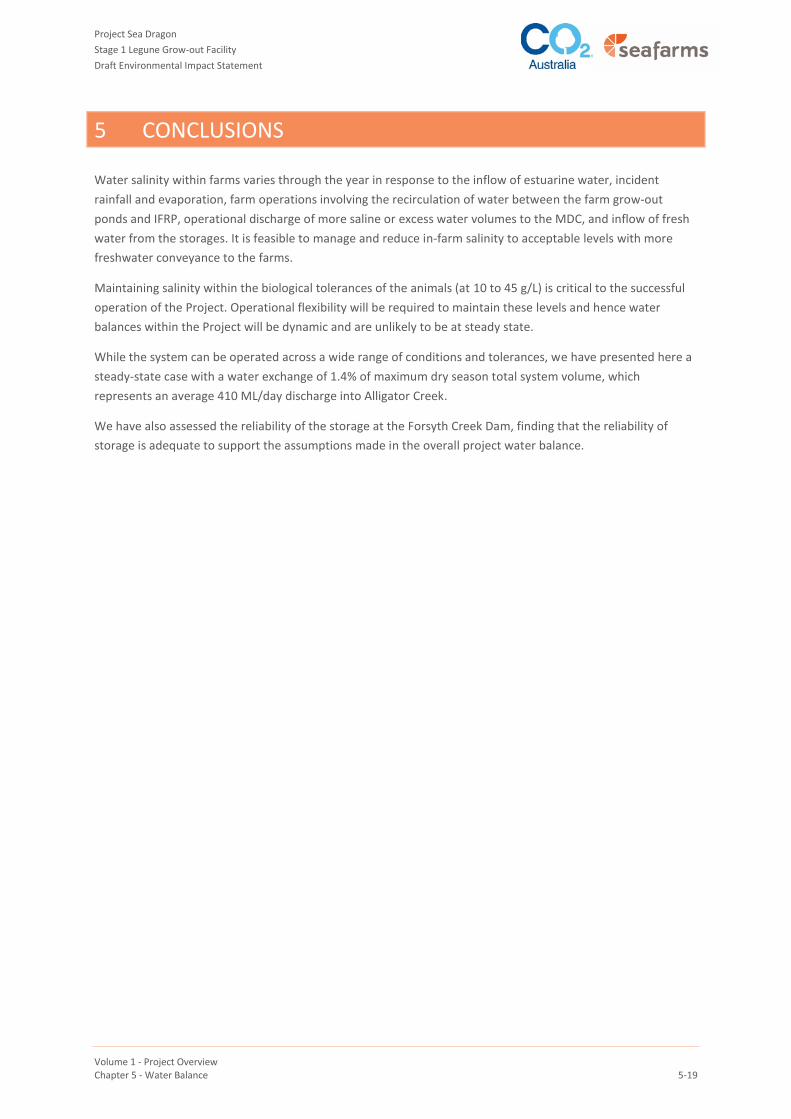
Figure 14 shows the simulated range of volumes in Forsyth Creek Dam for Stage 1 of the Project, under
scenario 5 from Table 1. Figure 14 is based on 100 realisations such that the statistics are suitable for an
assessment of reliability for the assessed life of project. As described previously the 1% probabilities of
exceedance are captured in the figure. Thus, in terms is assessing 'reliability' Figure 13 shows the key output.
As can be seen on the figure given 100 realisations of a notional 5 year sequence of the Project operations
there appears to be about 2 % chance that over the 5 years the level of the reservoir would fall below a 10 GL
threshold. Note that the dam will have the construction period to refill. These statistics show the need to
conserve and properly use freshwater within the system.
FIGURE 14 SIMULATED RANGE OF FORSYTH CREEK DAM VOLUMES FOR STAGE 1
Project Sea Dragon
Stage 1 Legune Grow-out Facility
Draft Environmental Impact Statement
Volume 1 - Project Overview Chapter 5 - Water Balance 5-19
5 CONCLUSIONS
Water salinity within farms varies through the year in response to the inflow of estuarine water, incident
rainfall and evaporation, farm operations involving the recirculation of water between the farm grow-out
ponds and IFRP, operational discharge of more saline or excess water volumes to the MDC, and inflow of fresh
water from the storages. It is feasible to manage and reduce in-farm salinity to acceptable levels with more
freshwater conveyance to the farms.
Maintaining salinity within the biological tolerances of the animals (at 10 to 45 g/L) is critical to the successful
operation of the Project. Operational flexibility will be required to maintain these levels and hence water
balances within the Project will be dynamic and are unlikely to be at steady state.
While the system can be operated across a wide range of conditions and tolerances, we have presented here a
steady-state case with a water exchange of 1.4% of maximum dry season total system volume, which
represents an average 410 ML/day discharge into Alligator Creek.
We have also assessed the reliability of the storage at the Forsyth Creek Dam, finding that the reliability of
storage is adequate to support the assumptions made in the overall project water balance.