Embed Size (px)
Citation preview
HAL Id: hal-00559492https://hal.archives-ouvertes.fr/hal-00559492
Submitted on 25 Jan 2011
HAL is a multi-disciplinary open accessarchive for the deposit and dissemination of sci-entific research documents, whether they are pub-lished or not. The documents may come fromteaching and research institutions in France orabroad, or from public or private research centers.
L’archive ouverte pluridisciplinaire HAL, estdestinée au dépôt et à la diffusion de documentsscientifiques de niveau recherche, publiés ou non,émanant des établissements d’enseignement et derecherche français ou étrangers, des laboratoirespublics ou privés.
Projection of the daily travel of an ageing population:The Paris and Montreal case, 1975-2020
Virginie Dejoux, Yves Bussiere, Jean-Loup Madre, Jimmy Armoogum
To cite this version:Virginie Dejoux, Yves Bussiere, Jean-Loup Madre, Jimmy Armoogum. Projection of the daily travel ofan ageing population: The Paris and Montreal case, 1975-2020. Transport Reviews, Taylor & Francis(Routledge), 2010, vol30 (n.4), pp 495-515. �10.1080/01441640903166724�. �hal-00559492�
1
Projection of the daily travel of an ageing populat ion: The Paris and Montreal case, 1975-2020.
Virginie Dejoux ◊, Yves D. Bussière ◊◊, Jean-Loup Madre ◊ and Jimmy Armoogum ◊ ◊INRETS–DEST (Paris, France)
◊◊ Facultad de Economía, BUAP (Puebla, Mexico) Virginie Dejoux
INRETS – DEST
Site de Marne-la-Vallée. « Le Descartes 2 »
2 rue de la Butte Verte
93166 Noisy le grand cedex
Phone : 33 1 45 92 55 88
Email : [email protected]
Yves Bussière
Fac of Economics, BUAP
Ciudad Universitaria, Puebla, Mexico 72570
Phone : 52 222 570 8075
Email : [email protected]
Jean-Loup Madre
INRETS – DEST
Site de Marne-la-Vallée. « Le Descartes 2 »
2 rue de la Butte Verte
93166 Noisy le grand cedex
Phone : 33 1 45 92 55 53
Email : [email protected]
Jimmy Armoogum
INRETS – DEST
Site de Marne-la-Vallée. « Le Descartes 2 »
2 rue de la Butte Verte
93166 Noisy le grand cedex
Phone : 33 1 45 92 55 79
Email : [email protected]
2
Abstract:
Ageing of the population, urban sprawl and car dependency will change travel patterns. The main
objective of this paper is to give elements for a better understanding of the impact of changing
demographics on the long term evolution of daily mobility using demographic-based models to
forecast, for the elderly population, car-ownership, trip frequency, distance traveled, average trip
distance. A second objective is to measure the impact of the long term tendencies observed on the
appearance of new needs of travel demand such as a rapid increase of demand-responsive transport.
The paper compares two agglomerations, both in a strong ageing process, but in quite different socio-
cultural contexts: a large European metropolis: Paris, and a medium sized north-american city:
Montreal. Many common conclusions derived from the two different cases studies reinforce the
possibility of generalizing the conclusions to other situations.
3
1. INTRODUCTION
This paper has two main objectives: The first objective is to give elements for a better
understanding of the impact of changing demographics, focusing on the elderly population, on the long
term evolution of daily mobility using demographic-based models to forecast mobility patterns such as
car-ownership, trip frequency, distance traveled, average trip distance. A second objective is to
measure the impact of the long term tendencies observed on the appearance of new needs of travel
demand such as a rapid increase of demand-responsive transport.
The analysis is based on two case studies both in a strong ageing process, but in quite
different socio-cultural contexts: a large European metropolis: Paris, and a medium-sized north-
american city: Montreal. The interest of comparing two quite different case studies is that common
conclusions may reinforce the possibility of generalizing the results to other situations and different
conclusions may help to understand the impact of the ageing process on urban mobility:
-The first case study is in North America, the Metropolitan Region of Montreal (MRM), with a
population of 3,3 million, characterised by low population density with urban sprawl where car use
started to expand earlier than in Europe (in the 1930s), with low fertility rates and high immigration and
where ageing is accelerating and will soon surpass what is observed in European cities,
-The second case study is in Europe, the Greater Paris Region (GPR) or Ile-de-France (IDF),
with a population of 11 million, characterised by much higher urban densities at least in the central
city, where the average age of individuals is currently higher than in Montreal, and where the
demographic dynamism is based more on fertility than immigration.
These two case studies were chosen for three main reasons: their representativeness of a
relatively low density North American city and a high density European city, both with a good supply of
public transport, the presence of strong ageing in a context of urban sprawl and, finally, the availability
of comparable data from O-D surveys over a long period.
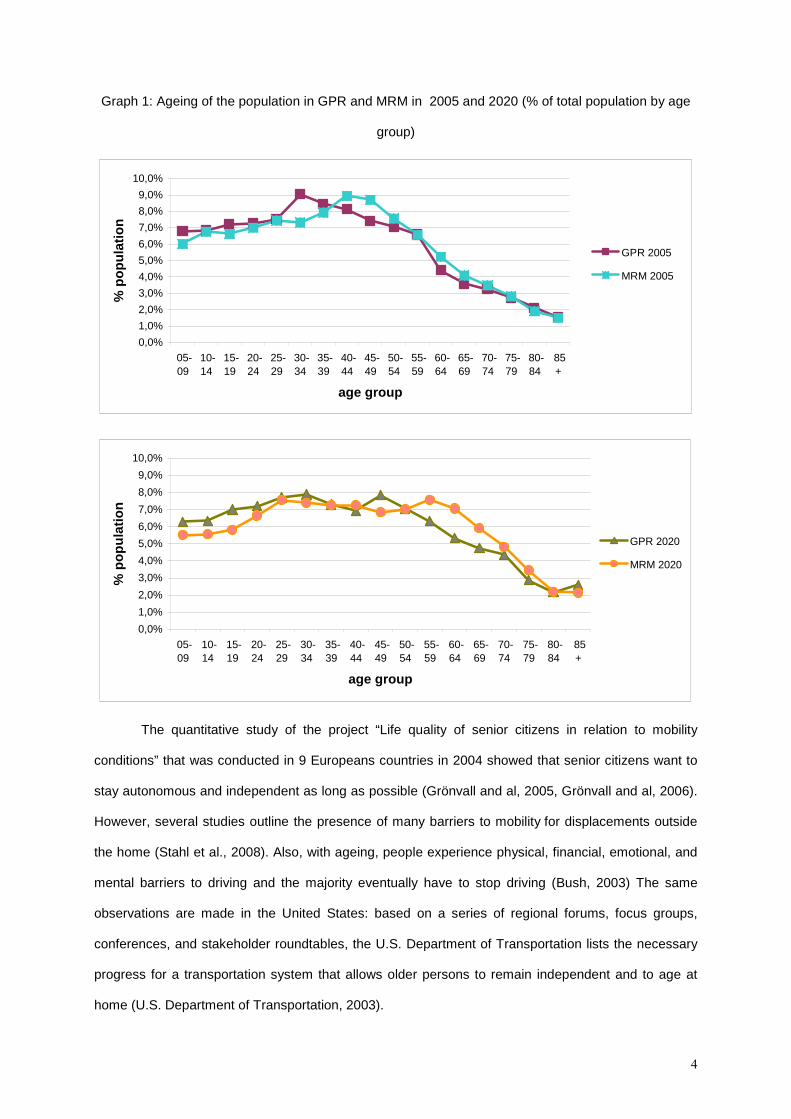
In fact, in both regions of study ageing has already started and should continue as we can see in the
graph 1 showing the evolution between 2005 and 2020. This ageing process is more pronounced in
MRM than in IDF in 2005 and at the horizon 2025 the trend continues with a time- lag of roughly 10
years.
4
Graph 1: Ageing of the population in GPR and MRM in 2005 and 2020 (% of total population by age
group)
0,0%
1,0%
2,0%
3,0%
4,0%
5,0%
6,0%
7,0%
8,0%
9,0%
10,0%
05-09
10-14
15-19
20-24
25-29
30-34
35-39
40-44
45-49
50-54
55-59
60-64
65-69
70-74
75-79
80-84
85+
age group
% p
opul
atio
n
GPR 2005
MRM 2005
0,0%
1,0%
2,0%
3,0%
4,0%
5,0%
6,0%
7,0%
8,0%
9,0%
10,0%
05-09
10-14
15-19
20-24
25-29
30-34
35-39
40-44
45-49
50-54
55-59
60-64
65-69
70-74
75-79
80-84
85+
age group
% p
opul
atio
n
GPR 2020
MRM 2020
The quantitative study of the project “Life quality of senior citizens in relation to mobility
conditions” that was conducted in 9 Europeans countries in 2004 showed that senior citizens want to
stay autonomous and independent as long as possible (Grönvall and al, 2005, Grönvall and al, 2006).
However, several studies outline the presence of many barriers to mobility for displacements outside
the home (Stahl et al., 2008). Also, with ageing, people experience physical, financial, emotional, and
mental barriers to driving and the majority eventually have to stop driving (Bush, 2003) The same
observations are made in the United States: based on a series of regional forums, focus groups,
conferences, and stakeholder roundtables, the U.S. Department of Transportation lists the necessary
progress for a transportation system that allows older persons to remain independent and to age at
home (U.S. Department of Transportation, 2003).
5
Ageing of the population, urban sprawl and car dependency will change travel patterns. To
illustrate this phenomenon, we applied a demographic-based projection model of travel behaviour for
the period 1975-2020 in Paris and 1976-2021 in Montreal, measuring various elements of daily
mobility such as car ownership, trip frequency, distance travelled, average trip distance. The model,
based on demographic trends in a longitudinal analysis reveals the complex role of the age factor
which, in a dated temporal context, consists of a combination of three interlinked dimensions:
- the stage in the life cycle, which expresses the influence of age on travel behaviour. By evaluating
the effects of the stage in the life cycle, it is possible to obtain a characteristic curve for those
changes which can be related to age (we shall refer to this as the standard life profile);
- the generation (or cohort), which takes into account travel behaviour on the basis of membership
of a group of individuals born during the same period, who therefore share a common "life
experience". Introducing this generation gap effect (which can be measured by means of
differentials) allows us to place this profile in a long term perspective;
- the Age-Cohort model supposes age and generation behaviours stable through time;
- a more complete Age-Cohort-Period model, which is not considered here, would take into account
the period effect, which expresses the influence of the overall economic context on behavioural
changes. In such a model the period effect expresses the importance of socio-economic factors
which affect all individuals and households simultaneously (e.g. changes in legislations, cost of
fuel).
Furthermore, ageing of the population in a context of continuing urban sprawl and car
dependency suggest that the need for demand-responsive transport may grow rapidly in future years
(Bush, 2003). Ageing will change travel patterns and may induce new needs in terms of demand-
responsive transport (ECMT, 2000). For example, with the disappearance of public transport, taxi use
has greatly increased in certain rural areas, where the elderly population is highly concentrated
(Bussière and Thouez, 2004).
Fortunately, in large metropolises, the disappearance of public transport is not on the agenda
but strong ageing will induce new needs and the long term trends that affect the daily travel of the
elderly population will likely affect demand-responsive transport.
6
2. Demographic changes in the Greater Paris Region and the Metropolitan Region of Montreal
The minimum age to be surveyed is slightly lower in Montreal than in Paris: OD surveys coverage are
persons 5 and over in the MRM and 6 and over in the GPR. The surveyed population in the Greater
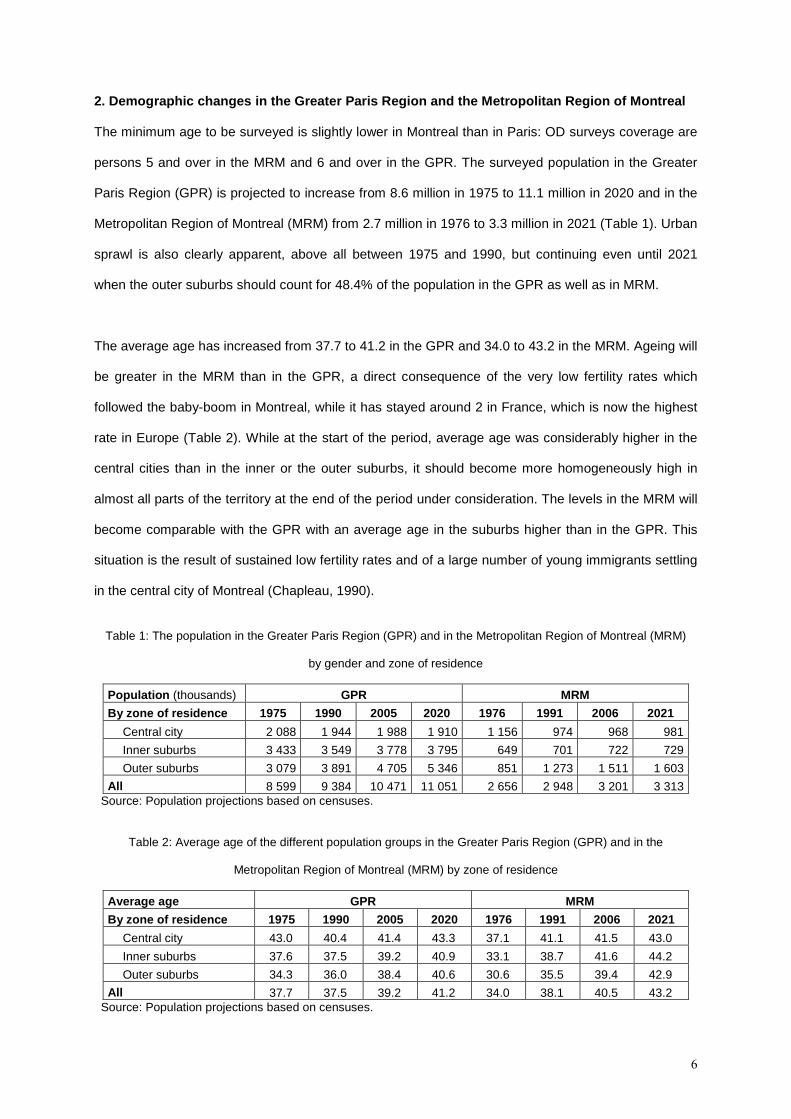
Paris Region (GPR) is projected to increase from 8.6 million in 1975 to 11.1 million in 2020 and in the
Metropolitan Region of Montreal (MRM) from 2.7 million in 1976 to 3.3 million in 2021 (Table 1). Urban
sprawl is also clearly apparent, above all between 1975 and 1990, but continuing even until 2021
when the outer suburbs should count for 48.4% of the population in the GPR as well as in MRM.
The average age has increased from 37.7 to 41.2 in the GPR and 34.0 to 43.2 in the MRM. Ageing will
be greater in the MRM than in the GPR, a direct consequence of the very low fertility rates which
followed the baby-boom in Montreal, while it has stayed around 2 in France, which is now the highest
rate in Europe (Table 2). While at the start of the period, average age was considerably higher in the
central cities than in the inner or the outer suburbs, it should become more homogeneously high in
almost all parts of the territory at the end of the period under consideration. The levels in the MRM will
become comparable with the GPR with an average age in the suburbs higher than in the GPR. This
situation is the result of sustained low fertility rates and of a large number of young immigrants settling
in the central city of Montreal (Chapleau, 1990).
Table 1: The population in the Greater Paris Region (GPR) and in the Metropolitan Region of Montreal (MRM)
by gender and zone of residence
Population (thousands) GPR MRM
By zone of residence 1975 1990 2005 2020 1976 1991 2006 2021
Central city 2 088 1 944 1 988 1 910 1 156 974 968 981
Inner suburbs 3 433 3 549 3 778 3 795 649 701 722 729
Outer suburbs 3 079 3 891 4 705 5 346 851 1 273 1 511 1 603
All 8 599 9 384 10 471 11 051 2 656 2 948 3 201 3 313 Source: Population projections based on censuses.
Table 2: Average age of the different population groups in the Greater Paris Region (GPR) and in the
Metropolitan Region of Montreal (MRM) by zone of residence
Average age GPR MRM
By zone of residence 1975 1990 2005 2020 1976 1991 2006 2021
Central city 43.0 40.4 41.4 43.3 37.1 41.1 41.5 43.0
Inner suburbs 37.6 37.5 39.2 40.9 33.1 38.7 41.6 44.2
Outer suburbs 34.3 36.0 38.4 40.6 30.6 35.5 39.4 42.9
All 37.7 37.5 39.2 41.2 34.0 38.1 40.5 43.2 Source: Population projections based on censuses.
7
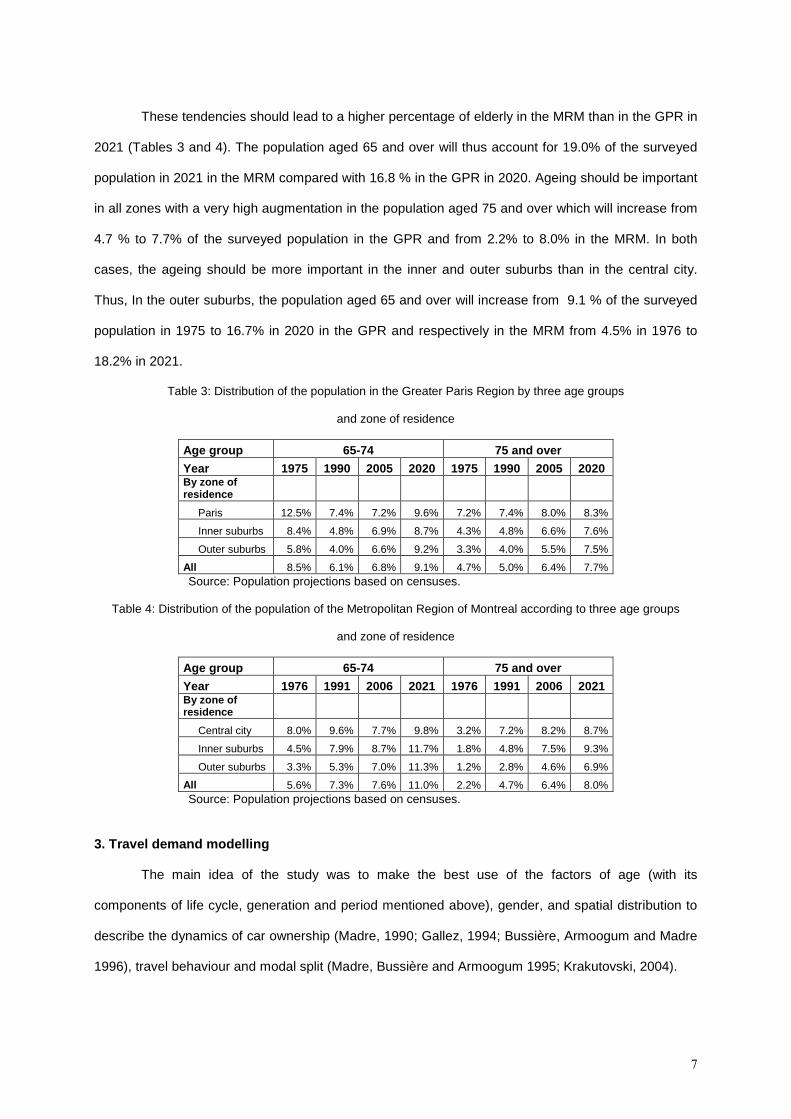
These tendencies should lead to a higher percentage of elderly in the MRM than in the GPR in
2021 (Tables 3 and 4). The population aged 65 and over will thus account for 19.0% of the surveyed
population in 2021 in the MRM compared with 16.8 % in the GPR in 2020. Ageing should be important
in all zones with a very high augmentation in the population aged 75 and over which will increase from
4.7 % to 7.7% of the surveyed population in the GPR and from 2.2% to 8.0% in the MRM. In both
cases, the ageing should be more important in the inner and outer suburbs than in the central city.
Thus, In the outer suburbs, the population aged 65 and over will increase from 9.1 % of the surveyed
population in 1975 to 16.7% in 2020 in the GPR and respectively in the MRM from 4.5% in 1976 to
18.2% in 2021.
Table 3: Distribution of the population in the Greater Paris Region by three age groups
and zone of residence
Age group 65-74 75 and over
Year 1975 1990 2005 2020 1975 1990 2005 2020 By zone of residence
Paris 12.5% 7.4% 7.2% 9.6% 7.2% 7.4% 8.0% 8.3%
Inner suburbs 8.4% 4.8% 6.9% 8.7% 4.3% 4.8% 6.6% 7.6%
Outer suburbs 5.8% 4.0% 6.6% 9.2% 3.3% 4.0% 5.5% 7.5%
All 8.5% 6.1% 6.8% 9.1% 4.7% 5.0% 6.4% 7.7% Source: Population projections based on censuses.
Table 4: Distribution of the population of the Metropolitan Region of Montreal according to three age groups
and zone of residence
Age group 65-74 75 and over
Year 1976 1991 2006 2021 1976 1991 2006 2021 By zone of residence
Central city 8.0% 9.6% 7.7% 9.8% 3.2% 7.2% 8.2% 8.7%
Inner suburbs 4.5% 7.9% 8.7% 11.7% 1.8% 4.8% 7.5% 9.3%
Outer suburbs 3.3% 5.3% 7.0% 11.3% 1.2% 2.8% 4.6% 6.9%
All 5.6% 7.3% 7.6% 11.0% 2.2% 4.7% 6.4% 8.0% Source: Population projections based on censuses.
3. Travel demand modelling
The main idea of the study was to make the best use of the factors of age (with its
components of life cycle, generation and period mentioned above), gender, and spatial distribution to
describe the dynamics of car ownership (Madre, 1990; Gallez, 1994; Bussière, Armoogum and Madre
1996), travel behaviour and modal split (Madre, Bussière and Armoogum 1995; Krakutovski, 2004).
8
Trip making is highly constrained by the available means of transport, particularly the
availability of a car (Bonnafous, 1992). Car ownership rate thus appears to be a "key" variable with
regard to travel behaviour. We shall therefore examine the car ownership of individuals in relation to
travel behaviour on the basis of trip frequency measurements and distances travelled, first, globally
and then by modal split.
3.1 Presentation of the age-cohort model
The model used is essentially based on an age-cohort approach taking into account the
impact of the life-cycle and generation effects through time on travel behavior, which permits to outline
the impact of age and generation combined with various structural variables: gender, spatial
distribution, motorization of the households …
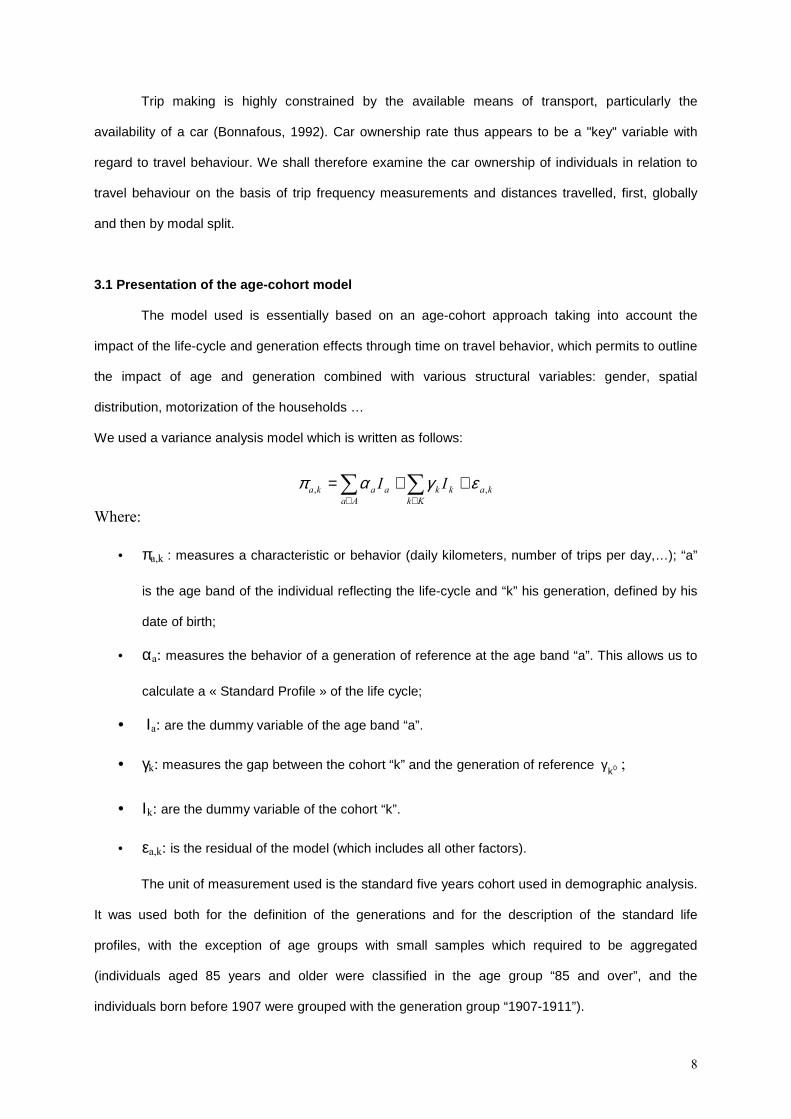
We used a variance analysis model which is written as follows:
ka
Kk
kk
Aa
aakaII
,,εγαπ ++= ∑∑
∈∈
Where:
• πa,k : measures a characteristic or behavior (daily kilometers, number of trips per day,…); “a”
is the age band of the individual reflecting the life-cycle and “k” his generation, defined by his
date of birth;
• αa: measures the behavior of a generation of reference at the age band “a”. This allows us to
calculate a « Standard Profile » of the life cycle;
• Ιa: are the dummy variable of the age band “a”.
• γk: measures the gap between the cohort “k” and the generation of reference 0kγ ;
• Ιk: are the dummy variable of the cohort “k”.
• εa,k: is the residual of the model (which includes all other factors).
The unit of measurement used is the standard five years cohort used in demographic analysis.
It was used both for the definition of the generations and for the description of the standard life
profiles, with the exception of age groups with small samples which required to be aggregated
(individuals aged 85 years and older were classified in the age group “85 and over”, and the
individuals born before 1907 were grouped with the generation group “1907-1911”).
9
In order to be able to distinguish between life-cycle and generation effects, the calibration of
an Age-Cohort model (based on the analysis of variance) requires data on the mobility behavior of
individuals for at least two observation periods. With only two observations, there is no residue. It is
preferable to have three or more observations to obtain a residual term taking into account factors not
included in the model (i.e. income or price effects). In the two case studies chosen more than three
surveys were used; Paris (Paris metropolitan region, or Ile-de-France, with 4 Global surveys, 1976-77,
1983-84, 1991-92, 1997-98) and Montreal (Montreal metropolitan region: with 6 origin-destination
surveys: 1974, 1978, 1982, 1987, 1993, 1998). The sample size for the Global surveys in Paris are
around 10 000 respondent households (except for 1998 with 3 500) and in the 50 000 to 60 000 range
for Montreal. The model for each case study was calibrated with these O-D surveys, which furnish
detailed data on travel behavior on a typical week-day, and detailed demographic data by quinquennal
age groups (observed and projected).
The following variables have been considered in the model’s specification:
- age (with its life cycle and generational components) and gender;
- zone of residence: we have identified 3 concentric zones with diminishing density from the center
to the outer suburbs. The densier zone is the central city (City of Paris - 200 pers./ha.; the central
zone of the Island of Montreal - 63 pers./ha.), the inner suburbs show less density (the inner
suburbs in Paris with 63 pers./ha., and the rest of the Island of Montreal with 22 pers./ha.) and the
outer suburbs with very low densities (the rest of the region) with approximately 5 pers./ha.;
- level of motorization of the households (0 car, 1 car, 2 cars or more). This criterion, a proxy for the
individual access to automobile, proves quite discriminatory relative to the zone of residence and
the distance travelled which increases with motorization.
In both case studies age and gender should have similar impacts on travel demand patterns as
well as the levels of motorization which rise as we get farther from the center. The main difference in
the two case studies is the population density which is much higher in Paris in the central city and in
the inner suburbs and the level of supply of public transport, which is much higher in Paris than in
Montreal.
We have run 18 models of variance analysis by crossing the following variables: three zones of
residence, three levels of motorization and two genders. Therefore, there is no direct evaluation of the
“goodness of fit” of the model on the overall population. It is a pseudo-panel, not a panel survey
10
approach; thus variability inside these categories is still important, but a great part of it is explained by
the 4 dimensions (age, gender, residence location, motorisation) taken into account.
Mobility is measured by two variables:
• global mobility or frequency of trips (average number of trips per person for a typical week day);
• distance travelled (number of kilometres travelled per person for a typical week day).
3.2 The model for Projection of Mobility
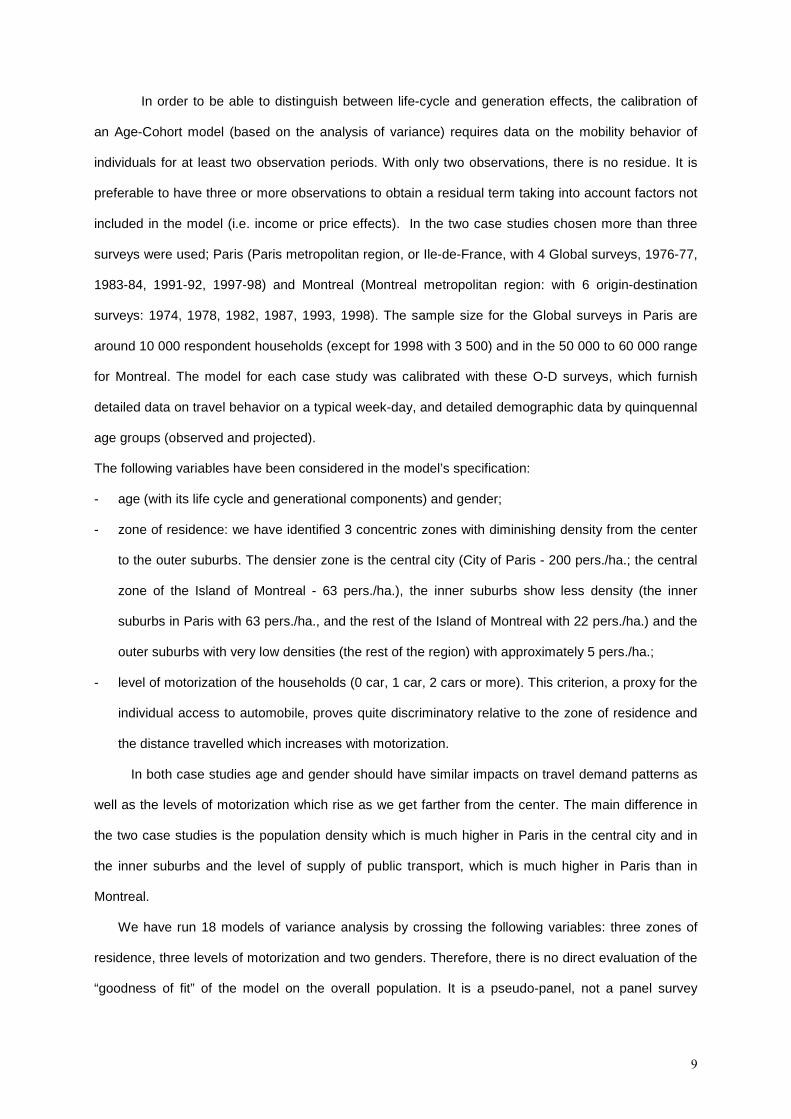
The projection of mobility (daily kilometres, number of trips per day…) for an individual of zone
of residence (z), level of motorization (v) and gender (s) at the date (t) is given by:
svz
k
svz
a
svz
ka
,,,,,,
, γαπ +=
Where:
• t=a+k (a is the age of the individual reflecting the life-cycle and k his generation, defined by
his date of birth);
• αa: measures the behavior of a generation of reference at the age a. This allows us to
calculate a « Standard Profile » of the life cycle;
• γk: measures the gap between the cohort k and the generation of reference 0kγ ;
Since the gaps in cohorts for recent generations tend to disappear we took the last observed cohorts
gap for future generation (Madre & al., 1995).
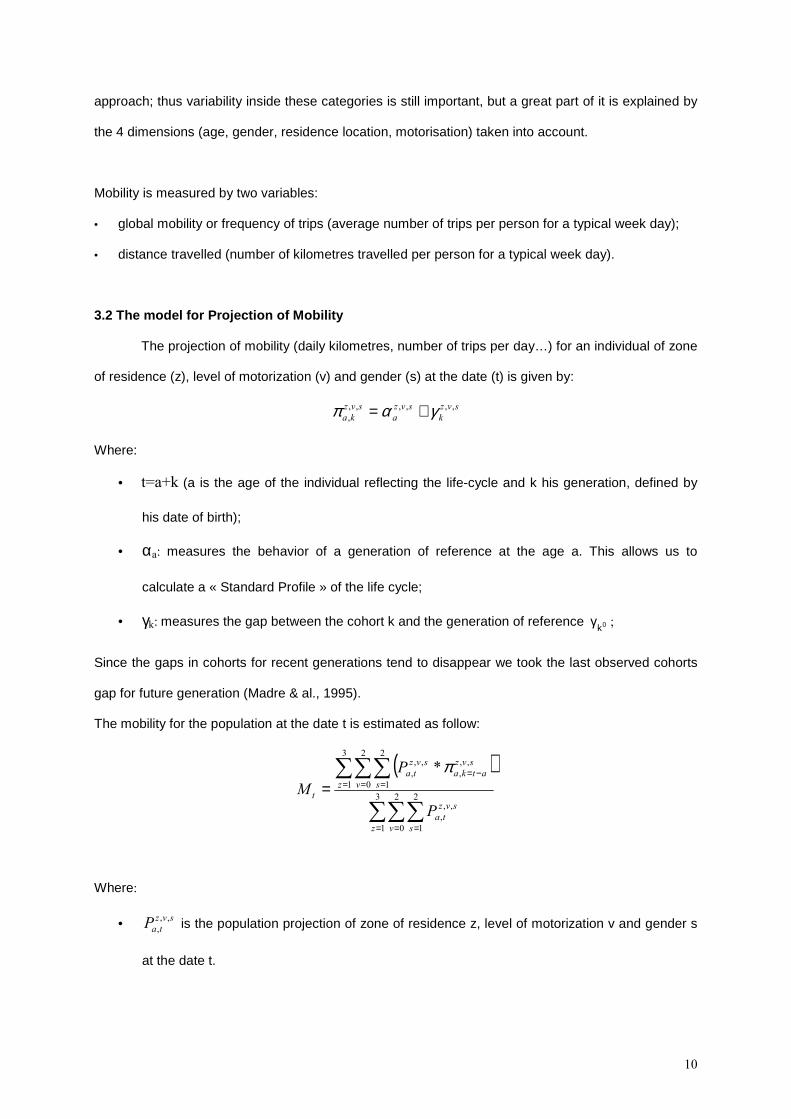
The mobility for the population at the date t is estimated as follow:
( )
∑∑∑
∑∑∑
= = =
= = =−=
=3
1
2
0
2
1
,,
,
3
1
2
0
2
1
,,
,
,,
, *
z v s
svz
ta
z v s
svz
atka
svz
ta
t
P
P
M
π
Where:
• svz
taP
,,
, is the population projection of zone of residence z, level of motorization v and gender s
at the date t.
11
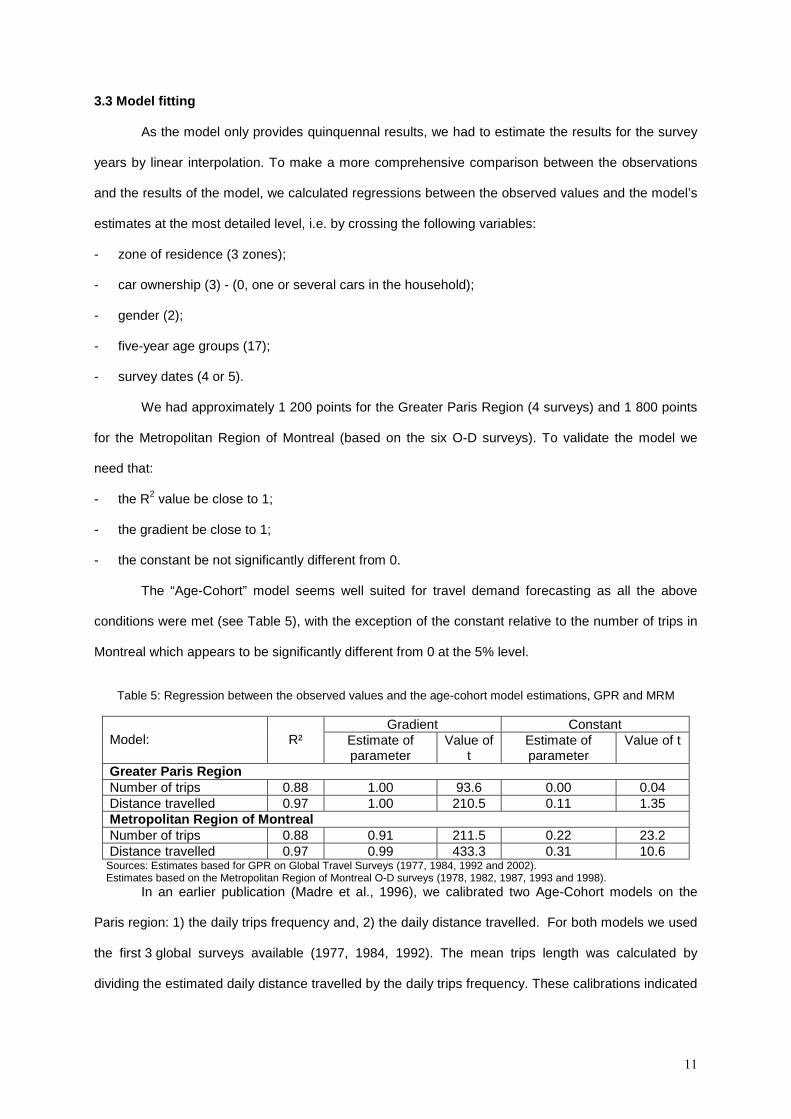
3.3 Model fitting
As the model only provides quinquennal results, we had to estimate the results for the survey
years by linear interpolation. To make a more comprehensive comparison between the observations
and the results of the model, we calculated regressions between the observed values and the model’s
estimates at the most detailed level, i.e. by crossing the following variables:
- zone of residence (3 zones);
- car ownership (3) - (0, one or several cars in the household);
- gender (2);
- five-year age groups (17);
- survey dates (4 or 5).
We had approximately 1 200 points for the Greater Paris Region (4 surveys) and 1 800 points
for the Metropolitan Region of Montreal (based on the six O-D surveys). To validate the model we
need that:
- the R2 value be close to 1;
- the gradient be close to 1;
- the constant be not significantly different from 0.
The “Age-Cohort” model seems well suited for travel demand forecasting as all the above
conditions were met (see Table 5), with the exception of the constant relative to the number of trips in
Montreal which appears to be significantly different from 0 at the 5% level.
Table 5: Regression between the observed values and the age-cohort model estimations, GPR and MRM
Gradient Constant Model:
R² Estimate of
parameter Value of
t Estimate of parameter
Value of t
Greater Paris Region Number of trips 0.88 1.00 93.6 0.00 0.04 Distance travelled 0.97 1.00 210.5 0.11 1.35 Metropolitan Region of Montreal Number of trips 0.88 0.91 211.5 0.22 23.2 Distance travelled 0.97 0.99 433.3 0.31 10.6
Sources: Estimates based for GPR on Global Travel Surveys (1977, 1984, 1992 and 2002). Estimates based on the Metropolitan Region of Montreal O-D surveys (1978, 1982, 1987, 1993 and 1998).
In an earlier publication (Madre et al., 1996), we calibrated two Age-Cohort models on the
Paris region: 1) the daily trips frequency and, 2) the daily distance travelled. For both models we used
the first 3 global surveys available (1977, 1984, 1992). The mean trips length was calculated by
dividing the estimated daily distance travelled by the daily trips frequency. These calibrations indicated
12
that there would be a rupture in the trend, a result which has been confirmed by recent data (1998 and
2002).
4. Estimation of car ownership and travel in the tw o regions 4.1 Projection of car ownership
Motorization is a determinant factor of the mobility of the elederly, and as far as we can
project, the private car is likely to remain the dominant mode of transport for the elderly in most OECD
countries, due especially to the expected increase in the number of licence holders among elderly
(Whelan et al., 2006). The 1975-2005 period was marked by a considerable increase in car ownership
in both cases under study: according to the results of the model, the number of households with one
or more cars in the GPR has grown by 61.8% between 1975 and 1990 and by 15.6% between 1990
and 2005. In the MRM, car ownership was higher than in the GPR, which may explain why the
respective rates of increase are lower: 12.0% and 8.3%. These considerable increases in car
ownership are principally due to the purchase of a second (or an additional) car.
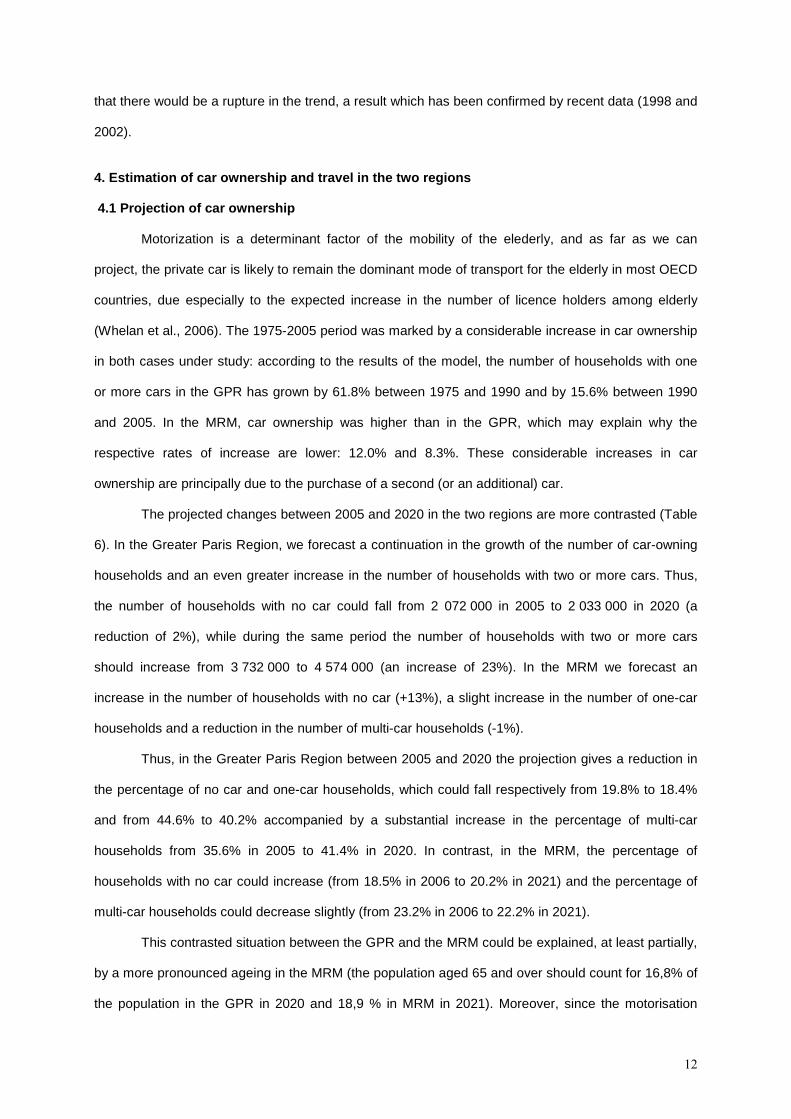
The projected changes between 2005 and 2020 in the two regions are more contrasted (Table
6). In the Greater Paris Region, we forecast a continuation in the growth of the number of car-owning
households and an even greater increase in the number of households with two or more cars. Thus,
the number of households with no car could fall from 2 072 000 in 2005 to 2 033 000 in 2020 (a
reduction of 2%), while during the same period the number of households with two or more cars
should increase from 3 732 000 to 4 574 000 (an increase of 23%). In the MRM we forecast an
increase in the number of households with no car (+13%), a slight increase in the number of one-car
households and a reduction in the number of multi-car households (-1%).
Thus, in the Greater Paris Region between 2005 and 2020 the projection gives a reduction in
the percentage of no car and one-car households, which could fall respectively from 19.8% to 18.4%
and from 44.6% to 40.2% accompanied by a substantial increase in the percentage of multi-car
households from 35.6% in 2005 to 41.4% in 2020. In contrast, in the MRM, the percentage of
households with no car could increase (from 18.5% in 2006 to 20.2% in 2021) and the percentage of
multi-car households could decrease slightly (from 23.2% in 2006 to 22.2% in 2021).
This contrasted situation between the GPR and the MRM could be explained, at least partially,
by a more pronounced ageing in the MRM (the population aged 65 and over should count for 16,8% of
the population in the GPR in 2020 and 18,9 % in MRM in 2021). Moreover, since the motorisation
13
process has started two decades earlier in North America than in Europe, it is nearer to saturation
(Berri, 2005).
Table 6: Population in the Greater Paris Region and in the Metropolitan Region of Montreal,
by car ownership
Population (thousands) GPR MRM
Projection year 1975 1990 2005 2020 1976 1991 2006 2021
Households with no car 2461 2121 2 072 2 033 505 538 592 670
One-car households 4510 4630 4 667 4 445 1578 1751 1 866 1 907
Multi-car households 1628 2633 3 732 4 574 572 659 743 737
All 8599 9384 10 471 11 051 2655 2948 3 201 3 313 Sources: Estimates based for GPR on Global Travel Surveys (1977, 1984, 1992 and 2002) and population projections according to censuses. Estimates based on the Metropolitan Region of Montreal O-D surveys (1978, 1982, 1987, 1993 and 1998) and population projections according to censuses.
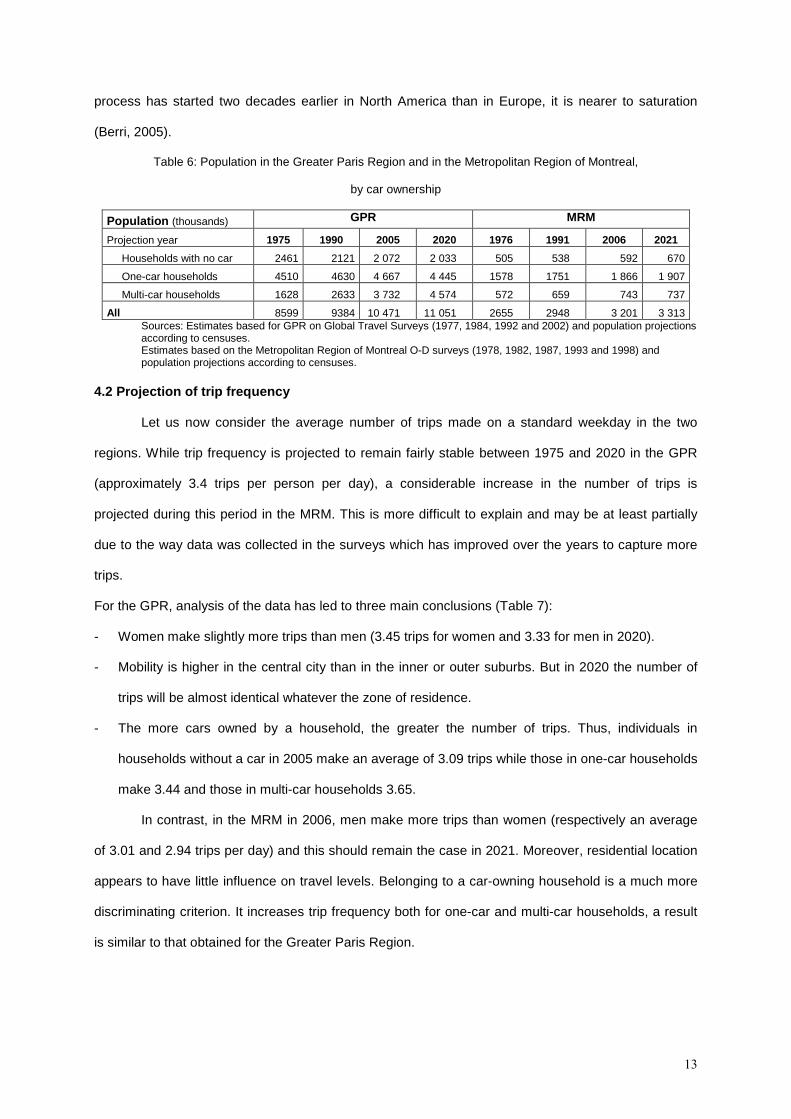
4.2 Projection of trip frequency
Let us now consider the average number of trips made on a standard weekday in the two
regions. While trip frequency is projected to remain fairly stable between 1975 and 2020 in the GPR
(approximately 3.4 trips per person per day), a considerable increase in the number of trips is
projected during this period in the MRM. This is more difficult to explain and may be at least partially
due to the way data was collected in the surveys which has improved over the years to capture more
trips.
For the GPR, analysis of the data has led to three main conclusions (Table 7):
- Women make slightly more trips than men (3.45 trips for women and 3.33 for men in 2020).
- Mobility is higher in the central city than in the inner or outer suburbs. But in 2020 the number of
trips will be almost identical whatever the zone of residence.
- The more cars owned by a household, the greater the number of trips. Thus, individuals in
households without a car in 2005 make an average of 3.09 trips while those in one-car households
make 3.44 and those in multi-car households 3.65.
In contrast, in the MRM in 2006, men make more trips than women (respectively an average
of 3.01 and 2.94 trips per day) and this should remain the case in 2021. Moreover, residential location
appears to have little influence on travel levels. Belonging to a car-owning household is a much more
discriminating criterion. It increases trip frequency both for one-car and multi-car households, a result
is similar to that obtained for the Greater Paris Region.
14
Thus, trip frequency seems to converge for women and men, despite of still specific constraints
(Krakutovski, 2004). In both cases, the level of motorization affects the travel levels but residential
location appears to have little influence on the number of trips.
Table 7: Projection of trip frequency in the Greater Paris Region (GPR) and in the Metropolitan
Region of Montreal (MRM) by gender, zone of residence and car ownership
Trip frequency (per day)
GPR MRM
Projection year 2005 2020 2006 2021
Gender
Male 3.42 3.33 2.89 3.16
Female 3.46 3.45 2.74 3.11
Zone of residence
Central city 3.54 3.41 2.83 3.14
Inner suburbs 3.42 3.41 2.78 3.08
Outer suburbs 3.42 3.38 2.83 3.15
Level of car ownership
Households with no car 3.09 3.09 2.13 2.41
One-car households 3.44 3.39 2.98 3.33
Multi-car households 3.65 3.53 2.96 3.29
All 3.44 3.40 2.82 3.13 Sources: Estimates based for GPR on Global Travel Surveys (1977, 1984, 1992 and 2002) and population projections according to censuses.
Estimates based on the Metropolitan Region of Montreal O-D surveys (1978, 1982, 1987, 1993 and 1998) and population projections according to censuses.
4.3 Forecast of the distance travelled
A considerable increase in the total distances travelled in both regions is projected, with this
increase being more pronounced in the MRM than the GPR because of the presence of stronger
sprawl in the MRM (Table 8).
Table 8: Projected distances travelled in the Greater Paris Region and the Metropolitan Region of Montreal
by gender, zone of residence and car ownership
Distance travelled (per day in km)
GPR MRM
Projection year 1975 2005 2020 1976 2006 2021
Gender
Male 16.9 19.5 20.1 9.2 16.7 18.5
Female 9.2 13.6 14.5 7.3 15.6 18.0
Zone of residence
Central city 9.2 11.0 11.0 4.7 7.7 8.5
Inner suburbs 11.4 13.3 13.6 8.6 13.2 14.7
Outer suburbs 16.9 21.3 21.9 12.8 22.9 25.8
Level of car ownership
Households with no car 8.1 9.3 9.2 4.8 8.0 9.7
15
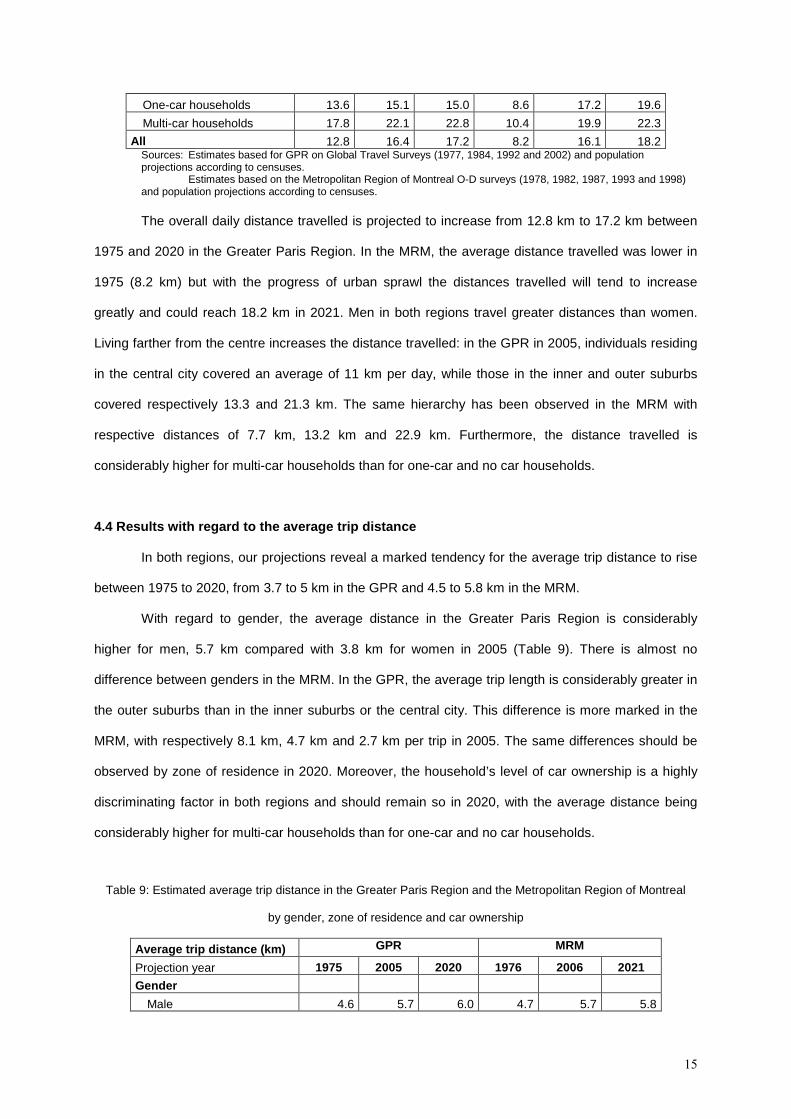
One-car households 13.6 15.1 15.0 8.6 17.2 19.6
Multi-car households 17.8 22.1 22.8 10.4 19.9 22.3
All 12.8 16.4 17.2 8.2 16.1 18.2 Sources: Estimates based for GPR on Global Travel Surveys (1977, 1984, 1992 and 2002) and population projections according to censuses. Estimates based on the Metropolitan Region of Montreal O-D surveys (1978, 1982, 1987, 1993 and 1998) and population projections according to censuses. The overall daily distance travelled is projected to increase from 12.8 km to 17.2 km between
1975 and 2020 in the Greater Paris Region. In the MRM, the average distance travelled was lower in
1975 (8.2 km) but with the progress of urban sprawl the distances travelled will tend to increase
greatly and could reach 18.2 km in 2021. Men in both regions travel greater distances than women.
Living farther from the centre increases the distance travelled: in the GPR in 2005, individuals residing
in the central city covered an average of 11 km per day, while those in the inner and outer suburbs
covered respectively 13.3 and 21.3 km. The same hierarchy has been observed in the MRM with
respective distances of 7.7 km, 13.2 km and 22.9 km. Furthermore, the distance travelled is
considerably higher for multi-car households than for one-car and no car households.
4.4 Results with regard to the average trip distanc e
In both regions, our projections reveal a marked tendency for the average trip distance to rise
between 1975 to 2020, from 3.7 to 5 km in the GPR and 4.5 to 5.8 km in the MRM.
With regard to gender, the average distance in the Greater Paris Region is considerably
higher for men, 5.7 km compared with 3.8 km for women in 2005 (Table 9). There is almost no
difference between genders in the MRM. In the GPR, the average trip length is considerably greater in
the outer suburbs than in the inner suburbs or the central city. This difference is more marked in the
MRM, with respectively 8.1 km, 4.7 km and 2.7 km per trip in 2005. The same differences should be
observed by zone of residence in 2020. Moreover, the household’s level of car ownership is a highly
discriminating factor in both regions and should remain so in 2020, with the average distance being
considerably higher for multi-car households than for one-car and no car households.
Table 9: Estimated average trip distance in the Greater Paris Region and the Metropolitan Region of Montreal
by gender, zone of residence and car ownership
Average trip distance (km) GPR MRM
Projection year 1975 2005 2020 1976 2006 2021
Gender
Male 4.6 5.7 6.0 4.7 5.7 5.8
16
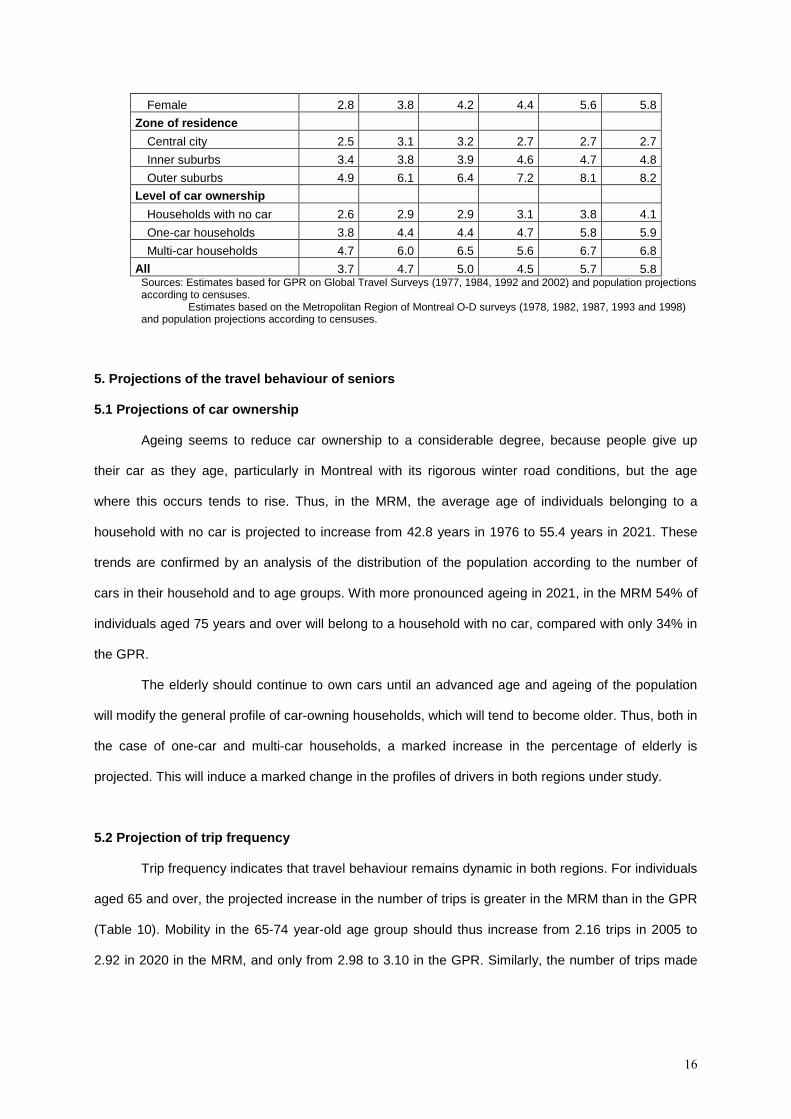
Female 2.8 3.8 4.2 4.4 5.6 5.8
Zone of residence
Central city 2.5 3.1 3.2 2.7 2.7 2.7
Inner suburbs 3.4 3.8 3.9 4.6 4.7 4.8
Outer suburbs 4.9 6.1 6.4 7.2 8.1 8.2
Level of car ownership
Households with no car 2.6 2.9 2.9 3.1 3.8 4.1
One-car households 3.8 4.4 4.4 4.7 5.8 5.9
Multi-car households 4.7 6.0 6.5 5.6 6.7 6.8
All 3.7 4.7 5.0 4.5 5.7 5.8 Sources: Estimates based for GPR on Global Travel Surveys (1977, 1984, 1992 and 2002) and population projections according to censuses.
Estimates based on the Metropolitan Region of Montreal O-D surveys (1978, 1982, 1987, 1993 and 1998) and population projections according to censuses.
5. Projections of the travel behaviour of seniors
5.1 Projections of car ownership
Ageing seems to reduce car ownership to a considerable degree, because people give up
their car as they age, particularly in Montreal with its rigorous winter road conditions, but the age
where this occurs tends to rise. Thus, in the MRM, the average age of individuals belonging to a
household with no car is projected to increase from 42.8 years in 1976 to 55.4 years in 2021. These
trends are confirmed by an analysis of the distribution of the population according to the number of
cars in their household and to age groups. With more pronounced ageing in 2021, in the MRM 54% of
individuals aged 75 years and over will belong to a household with no car, compared with only 34% in
the GPR.
The elderly should continue to own cars until an advanced age and ageing of the population
will modify the general profile of car-owning households, which will tend to become older. Thus, both in
the case of one-car and multi-car households, a marked increase in the percentage of elderly is
projected. This will induce a marked change in the profiles of drivers in both regions under study.
5.2 Projection of trip frequency
Trip frequency indicates that travel behaviour remains dynamic in both regions. For individuals
aged 65 and over, the projected increase in the number of trips is greater in the MRM than in the GPR
(Table 10). Mobility in the 65-74 year-old age group should thus increase from 2.16 trips in 2005 to
2.92 in 2020 in the MRM, and only from 2.98 to 3.10 in the GPR. Similarly, the number of trips made
17
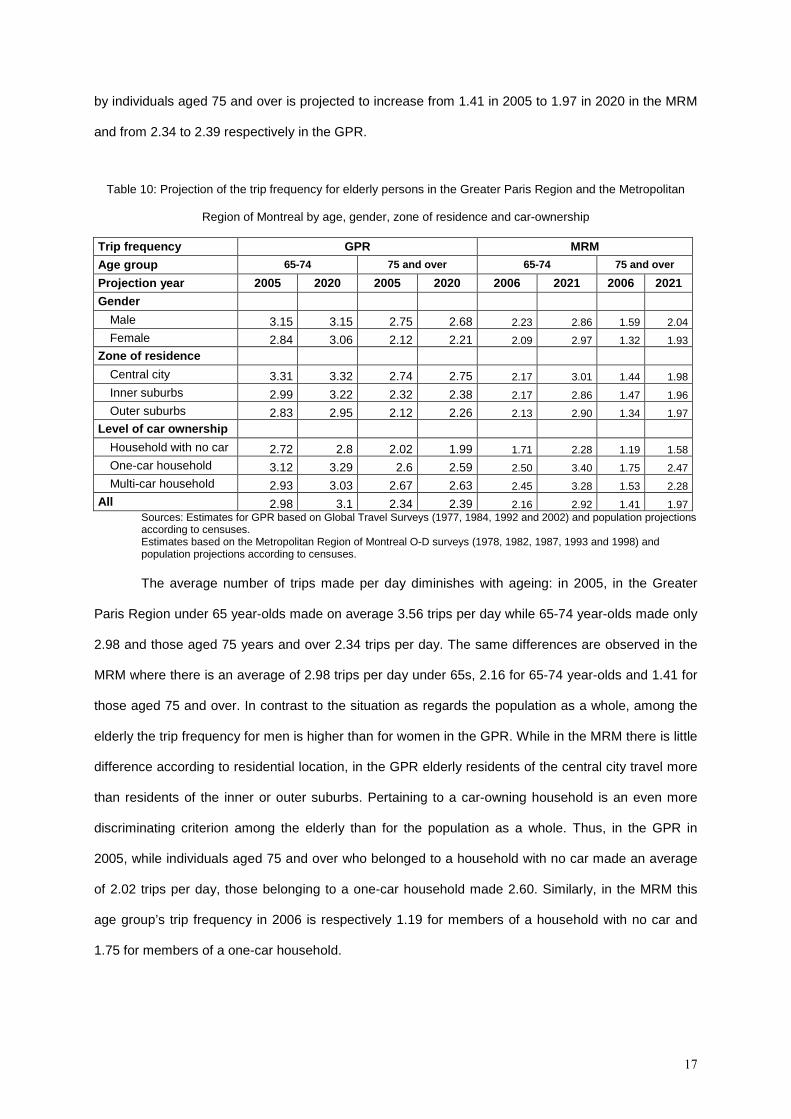
by individuals aged 75 and over is projected to increase from 1.41 in 2005 to 1.97 in 2020 in the MRM
and from 2.34 to 2.39 respectively in the GPR.
Table 10: Projection of the trip frequency for elderly persons in the Greater Paris Region and the Metropolitan
Region of Montreal by age, gender, zone of residence and car-ownership
Trip frequency GPR MRM
Age group 65-74 75 and over 65-74 75 and over
Projection year 2005 2020 2005 2020 2006 2021 2006 2 021
Gender
Male 3.15 3.15 2.75 2.68 2.23 2.86 1.59 2.04
Female 2.84 3.06 2.12 2.21 2.09 2.97 1.32 1.93
Zone of residence
Central city 3.31 3.32 2.74 2.75 2.17 3.01 1.44 1.98
Inner suburbs 2.99 3.22 2.32 2.38 2.17 2.86 1.47 1.96
Outer suburbs 2.83 2.95 2.12 2.26 2.13 2.90 1.34 1.97
Level of car ownership
Household with no car 2.72 2.8 2.02 1.99 1.71 2.28 1.19 1.58
One-car household 3.12 3.29 2.6 2.59 2.50 3.40 1.75 2.47
Multi-car household 2.93 3.03 2.67 2.63 2.45 3.28 1.53 2.28
All 2.98 3.1 2.34 2.39 2.16 2.92 1.41 1.97 Sources: Estimates for GPR based on Global Travel Surveys (1977, 1984, 1992 and 2002) and population projections according to censuses. Estimates based on the Metropolitan Region of Montreal O-D surveys (1978, 1982, 1987, 1993 and 1998) and population projections according to censuses.
The average number of trips made per day diminishes with ageing: in 2005, in the Greater
Paris Region under 65 year-olds made on average 3.56 trips per day while 65-74 year-olds made only
2.98 and those aged 75 years and over 2.34 trips per day. The same differences are observed in the
MRM where there is an average of 2.98 trips per day under 65s, 2.16 for 65-74 year-olds and 1.41 for
those aged 75 and over. In contrast to the situation as regards the population as a whole, among the
elderly the trip frequency for men is higher than for women in the GPR. While in the MRM there is little
difference according to residential location, in the GPR elderly residents of the central city travel more
than residents of the inner or outer suburbs. Pertaining to a car-owning household is an even more
discriminating criterion among the elderly than for the population as a whole. Thus, in the GPR in
2005, while individuals aged 75 and over who belonged to a household with no car made an average
of 2.02 trips per day, those belonging to a one-car household made 2.60. Similarly, in the MRM this
age group’s trip frequency in 2006 is respectively 1.19 for members of a household with no car and
1.75 for members of a one-car household.
18
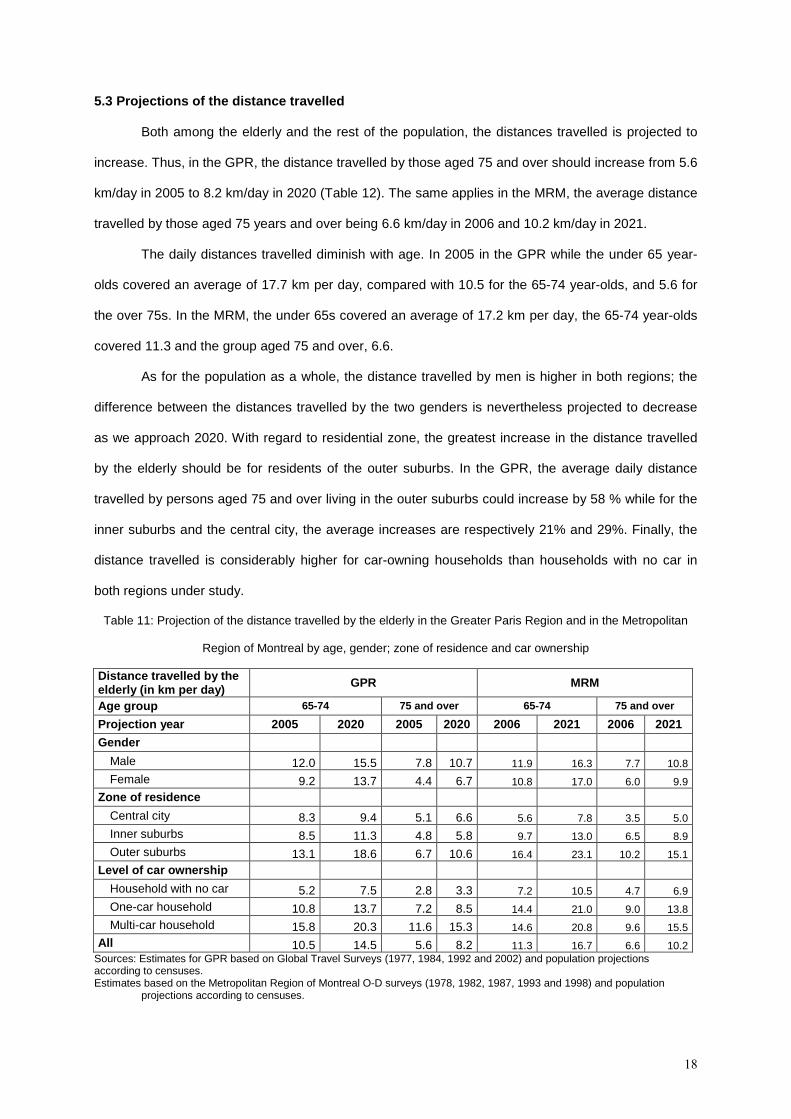
5.3 Projections of the distance travelled
Both among the elderly and the rest of the population, the distances travelled is projected to
increase. Thus, in the GPR, the distance travelled by those aged 75 and over should increase from 5.6
km/day in 2005 to 8.2 km/day in 2020 (Table 12). The same applies in the MRM, the average distance
travelled by those aged 75 years and over being 6.6 km/day in 2006 and 10.2 km/day in 2021.
The daily distances travelled diminish with age. In 2005 in the GPR while the under 65 year-
olds covered an average of 17.7 km per day, compared with 10.5 for the 65-74 year-olds, and 5.6 for
the over 75s. In the MRM, the under 65s covered an average of 17.2 km per day, the 65-74 year-olds
covered 11.3 and the group aged 75 and over, 6.6.
As for the population as a whole, the distance travelled by men is higher in both regions; the
difference between the distances travelled by the two genders is nevertheless projected to decrease
as we approach 2020. With regard to residential zone, the greatest increase in the distance travelled
by the elderly should be for residents of the outer suburbs. In the GPR, the average daily distance
travelled by persons aged 75 and over living in the outer suburbs could increase by 58 % while for the
inner suburbs and the central city, the average increases are respectively 21% and 29%. Finally, the
distance travelled is considerably higher for car-owning households than households with no car in
both regions under study.
Table 11: Projection of the distance travelled by the elderly in the Greater Paris Region and in the Metropolitan
Region of Montreal by age, gender; zone of residence and car ownership
Distance travelled by the elderly (in km per day) GPR MRM
Age group 65-74 75 and over 65-74 75 and over
Projection year 2005 2020 2005 2020 2006 2021 2006 2 021
Gender
Male 12.0 15.5 7.8 10.7 11.9 16.3 7.7 10.8
Female 9.2 13.7 4.4 6.7 10.8 17.0 6.0 9.9
Zone of residence
Central city 8.3 9.4 5.1 6.6 5.6 7.8 3.5 5.0
Inner suburbs 8.5 11.3 4.8 5.8 9.7 13.0 6.5 8.9
Outer suburbs 13.1 18.6 6.7 10.6 16.4 23.1 10.2 15.1
Level of car ownership
Household with no car 5.2 7.5 2.8 3.3 7.2 10.5 4.7 6.9
One-car household 10.8 13.7 7.2 8.5 14.4 21.0 9.0 13.8
Multi-car household 15.8 20.3 11.6 15.3 14.6 20.8 9.6 15.5
All 10.5 14.5 5.6 8.2 11.3 16.7 6.6 10.2 Sources: Estimates for GPR based on Global Travel Surveys (1977, 1984, 1992 and 2002) and population projections according to censuses. Estimates based on the Metropolitan Region of Montreal O-D surveys (1978, 1982, 1987, 1993 and 1998) and population
projections according to censuses.
19
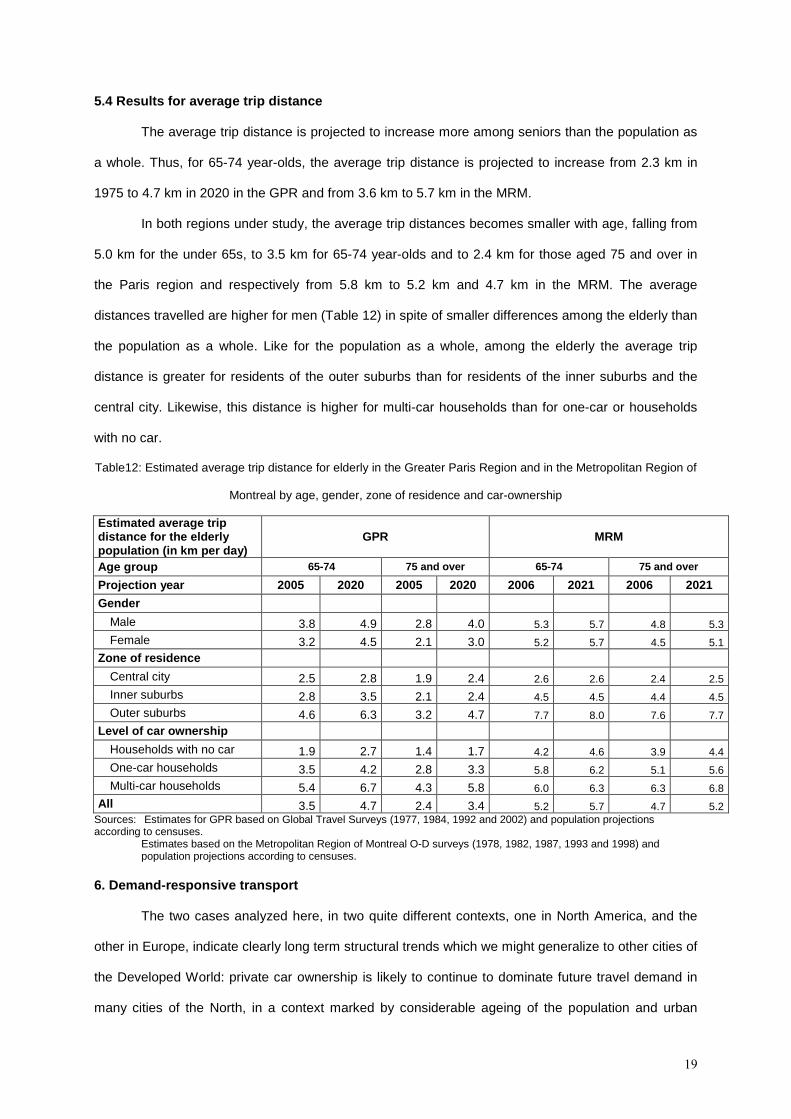
5.4 Results for average trip distance
The average trip distance is projected to increase more among seniors than the population as
a whole. Thus, for 65-74 year-olds, the average trip distance is projected to increase from 2.3 km in
1975 to 4.7 km in 2020 in the GPR and from 3.6 km to 5.7 km in the MRM.
In both regions under study, the average trip distances becomes smaller with age, falling from
5.0 km for the under 65s, to 3.5 km for 65-74 year-olds and to 2.4 km for those aged 75 and over in
the Paris region and respectively from 5.8 km to 5.2 km and 4.7 km in the MRM. The average
distances travelled are higher for men (Table 12) in spite of smaller differences among the elderly than
the population as a whole. Like for the population as a whole, among the elderly the average trip
distance is greater for residents of the outer suburbs than for residents of the inner suburbs and the
central city. Likewise, this distance is higher for multi-car households than for one-car or households
with no car.
Table12: Estimated average trip distance for elderly in the Greater Paris Region and in the Metropolitan Region of
Montreal by age, gender, zone of residence and car-ownership
Estimated average trip distance for the elderly population (in km per day)
GPR MRM
Age group 65-74 75 and over 65-74 75 and over
Projection year 2005 2020 2005 2020 2006 2021 2006 2 021
Gender
Male 3.8 4.9 2.8 4.0 5.3 5.7 4.8 5.3
Female 3.2 4.5 2.1 3.0 5.2 5.7 4.5 5.1
Zone of residence
Central city 2.5 2.8 1.9 2.4 2.6 2.6 2.4 2.5
Inner suburbs 2.8 3.5 2.1 2.4 4.5 4.5 4.4 4.5
Outer suburbs 4.6 6.3 3.2 4.7 7.7 8.0 7.6 7.7
Level of car ownership
Households with no car 1.9 2.7 1.4 1.7 4.2 4.6 3.9 4.4
One-car households 3.5 4.2 2.8 3.3 5.8 6.2 5.1 5.6
Multi-car households 5.4 6.7 4.3 5.8 6.0 6.3 6.3 6.8
All 3.5 4.7 2.4 3.4 5.2 5.7 4.7 5.2 Sources: Estimates for GPR based on Global Travel Surveys (1977, 1984, 1992 and 2002) and population projections according to censuses. Estimates based on the Metropolitan Region of Montreal O-D surveys (1978, 1982, 1987, 1993 and 1998) and
population projections according to censuses. 6. Demand-responsive transport
The two cases analyzed here, in two quite different contexts, one in North America, and the
other in Europe, indicate clearly long term structural trends which we might generalize to other cities of
the Developed World: private car ownership is likely to continue to dominate future travel demand in
many cities of the North, in a context marked by considerable ageing of the population and urban
20
sprawl. In both case studies we observed a relation between motorization and high mobility, sprawl
and higher distances travelled, ageing and diminishing mobility and car ownership, and longer
distances travelled by men. It seems however, that in spite of ageing, in both case studies travel
demand will increase in relative terms for the aged population (number of trips per day and distances
travelled) and in absolute terms when measured in number of trips or in terms of passenger-kilometres
travelled (rising from 1,4 million passenger-kilometres in 1975 to 6,9 million in 2020 in GPR and
respectively from 0,2 to 2,7 million passenger-kilometres in MRM for persons aged 75 and over).
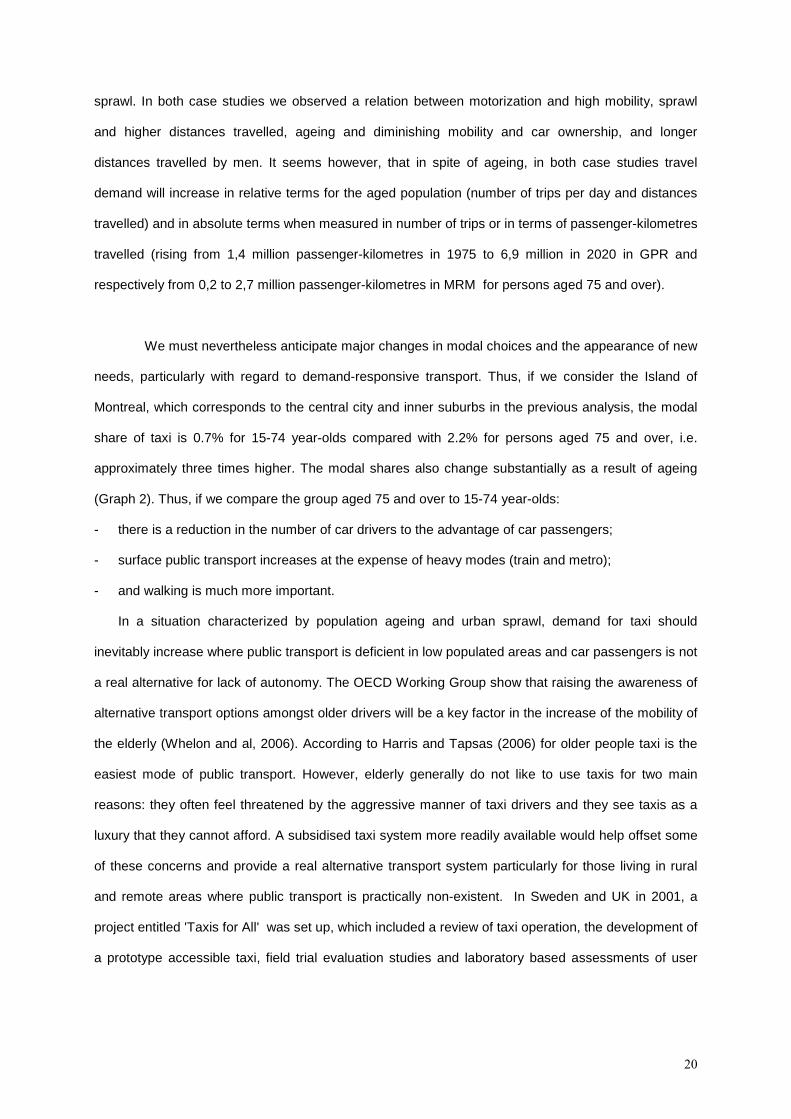
We must nevertheless anticipate major changes in modal choices and the appearance of new
needs, particularly with regard to demand-responsive transport. Thus, if we consider the Island of
Montreal, which corresponds to the central city and inner suburbs in the previous analysis, the modal
share of taxi is 0.7% for 15-74 year-olds compared with 2.2% for persons aged 75 and over, i.e.
approximately three times higher. The modal shares also change substantially as a result of ageing
(Graph 2). Thus, if we compare the group aged 75 and over to 15-74 year-olds:
- there is a reduction in the number of car drivers to the advantage of car passengers;
- surface public transport increases at the expense of heavy modes (train and metro);
- and walking is much more important.
In a situation characterized by population ageing and urban sprawl, demand for taxi should
inevitably increase where public transport is deficient in low populated areas and car passengers is not
a real alternative for lack of autonomy. The OECD Working Group show that raising the awareness of
alternative transport options amongst older drivers will be a key factor in the increase of the mobility of
the elderly (Whelon and al, 2006). According to Harris and Tapsas (2006) for older people taxi is the
easiest mode of public transport. However, elderly generally do not like to use taxis for two main
reasons: they often feel threatened by the aggressive manner of taxi drivers and they see taxis as a
luxury that they cannot afford. A subsidised taxi system more readily available would help offset some
of these concerns and provide a real alternative transport system particularly for those living in rural
and remote areas where public transport is practically non-existent. In Sweden and UK in 2001, a
project entitled 'Taxis for All' was set up, which included a review of taxi operation, the development of
a prototype accessible taxi, field trial evaluation studies and laboratory based assessments of user
21
requirements. The objective was to detect the parameters allowing the accessibility of all the taxis
(Oxley and Stahl, 2001).
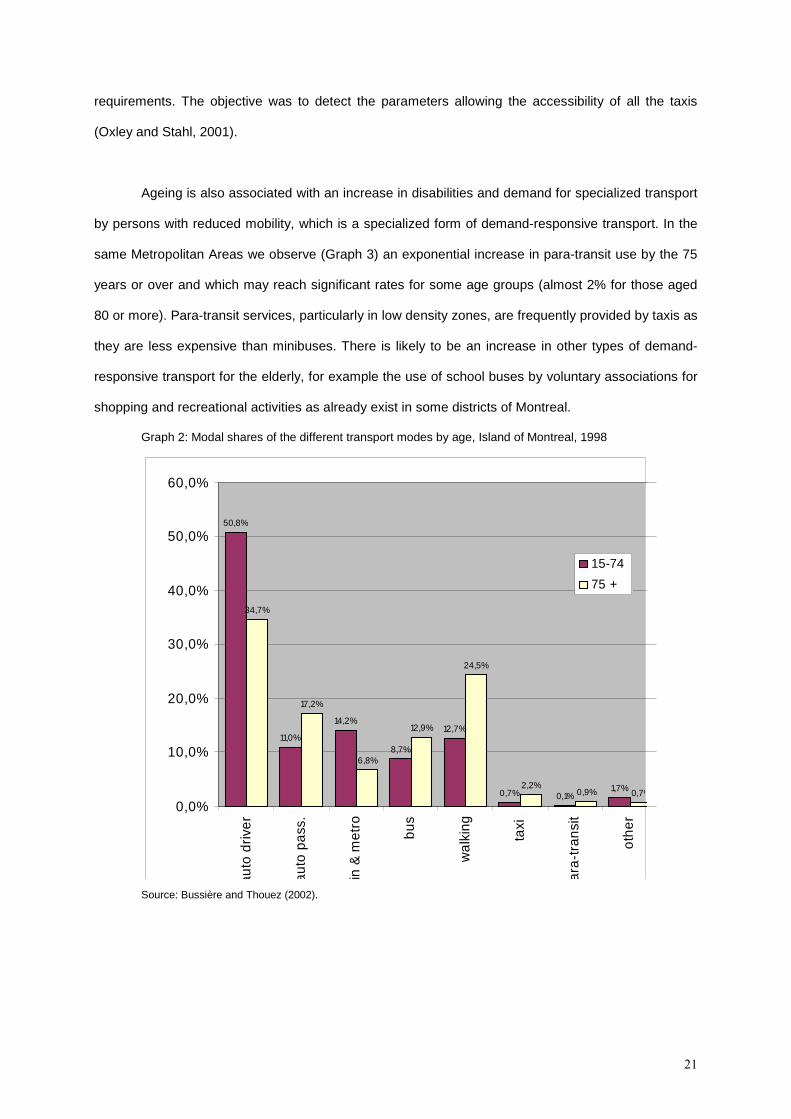
Ageing is also associated with an increase in disabilities and demand for specialized transport
by persons with reduced mobility, which is a specialized form of demand-responsive transport. In the
same Metropolitan Areas we observe (Graph 3) an exponential increase in para-transit use by the 75
years or over and which may reach significant rates for some age groups (almost 2% for those aged
80 or more). Para-transit services, particularly in low density zones, are frequently provided by taxis as
they are less expensive than minibuses. There is likely to be an increase in other types of demand-
responsive transport for the elderly, for example the use of school buses by voluntary associations for
shopping and recreational activities as already exist in some districts of Montreal.
Graph 2: Modal shares of the different transport modes by age, Island of Montreal, 1998
Source: Bussière and Thouez (2002).
50,8%
11,0%
14,2%
8,7%
12,7%
0,7% 0,1%1,7%
34,7%
17,2%
6,8%
12,9%
24,5%
2,2%0,9% 0,7%
0,0%
10,0%
20,0%
30,0%
40,0%
50,0%
60,0%
auto
driv
er
auto
pas
s.
trai
n &
met
ro
bus
wal
king
taxi
para
-tra
nsit
othe
r
15-74
75 +
22
Graph 3: Modal share for para-transit by age, Island of Montreal, 1998
Source: Bussière and Thouez (2002). 7. Projection of the demand for taxi in the Greater Paris Region
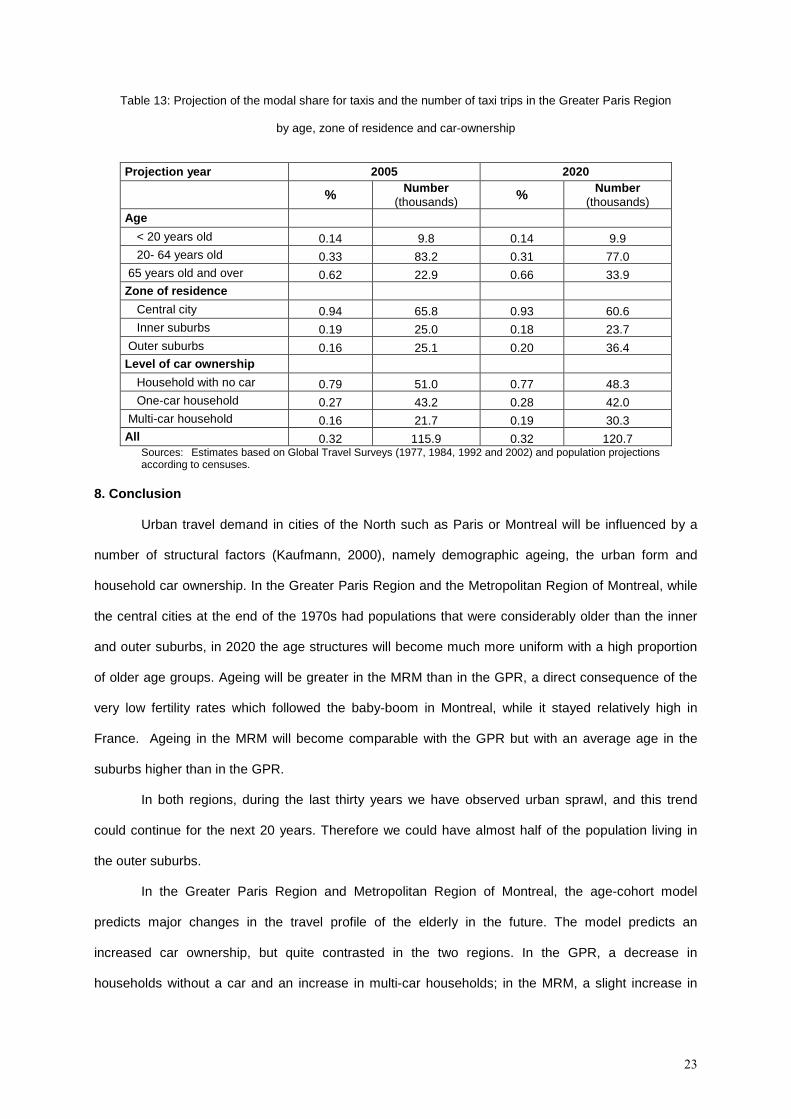
In order to estimate changes in the number of taxi trips and the modal share of taxis up to the
year 2020, we used the Global Travel Surveys for the Greater Paris Region. Due to the relatively small
number of taxi trips it was necessary to aggregate the 1977, 1984, 1992 and 2002 surveys. The modal
share of taxi has been computed at the most detailed level, i.e. by crossing the zone of residence, the
level of car ownership, gender and age. Then, assuming that these modal shares will remain stable
over time and combining the data with the INSEE population projections to the year 2020, we have
measured the impact of structural changes in the population, in particular it’s ageing, on trip making by
taxi. A slight increase in the number of trips made by taxi is projected between 2005 and 2020 in the
GPR, with an increase from about 116 000 trips to 121 000 (Table 13). This is essentially due to
individuals aged 65 and over, among whom a 48% increase in taxi trips is projected over the period.
Also, the number of taxi trips should increase by approximately 45% for residents of the outer suburbs,
rising from 25 000 trips in 2005 to 36 000 in 2020.
Despite the important changes in the structure of the population shown in section 2, the modal
split of trips is projected to exhibit a high degree of stability between 2005 and 2020, being aware that
we have made the hypothesis of stable modal shares in each population group. Taxi trips should
account for 0.3% of all the trips in the Greater Paris Region, and this percentage should increase for
the elderly and among residents of the outer suburbs.
0,00%
0,20%
0,40%
0,60%
0,80%
1,00%
1,20%
1,40%
1,60%
1,80%
2,00%
15-29 30-44 45-59 60-74 75-79 80- +
Total
23
Table 13: Projection of the modal share for taxis and the number of taxi trips in the Greater Paris Region
by age, zone of residence and car-ownership
Projection year 2005 2020
% Number (thousands) % Number
(thousands) Age
< 20 years old 0.14 9.8 0.14 9.9 20- 64 years old 0.33 83.2 0.31 77.0
65 years old and over 0.62 22.9 0.66 33.9 Zone of residence
Central city 0.94 65.8 0.93 60.6 Inner suburbs 0.19 25.0 0.18 23.7
Outer suburbs 0.16 25.1 0.20 36.4 Level of car ownership
Household with no car 0.79 51.0 0.77 48.3 One-car household 0.27 43.2 0.28 42.0
Multi-car household 0.16 21.7 0.19 30.3 All 0.32 115.9 0.32 120.7
Sources: Estimates based on Global Travel Surveys (1977, 1984, 1992 and 2002) and population projections according to censuses.
8. Conclusion
Urban travel demand in cities of the North such as Paris or Montreal will be influenced by a
number of structural factors (Kaufmann, 2000), namely demographic ageing, the urban form and
household car ownership. In the Greater Paris Region and the Metropolitan Region of Montreal, while
the central cities at the end of the 1970s had populations that were considerably older than the inner
and outer suburbs, in 2020 the age structures will become much more uniform with a high proportion
of older age groups. Ageing will be greater in the MRM than in the GPR, a direct consequence of the
very low fertility rates which followed the baby-boom in Montreal, while it stayed relatively high in
France. Ageing in the MRM will become comparable with the GPR but with an average age in the
suburbs higher than in the GPR.
In both regions, during the last thirty years we have observed urban sprawl, and this trend
could continue for the next 20 years. Therefore we could have almost half of the population living in
the outer suburbs.
In the Greater Paris Region and Metropolitan Region of Montreal, the age-cohort model
predicts major changes in the travel profile of the elderly in the future. The model predicts an
increased car ownership, but quite contrasted in the two regions. In the GPR, a decrease in
households without a car and an increase in multi-car households; in the MRM, a slight increase in
24
multi-motorised households accompanied however with a slight decrease of households without a car,
due to a more pronounced ageing.
As for mobility, we observe gender differences between the two regions. In the GPR eldery
women have a higher mobility than men but we observe the contrary in the MRM. In both cases
mobility rises with car ownership and residential location seems to have little impact on mobility levels.
It has however, a significant impact on distances travelled. In the GPR distances travelled are higher
for men and directly to the distance of residence from the centre. In the MRM there is almost no
difference between genders in average trip length.
In both regions the model predicts an increase in distances travelled and trip length increase
with car ownership. In the next 15 years, people aged 75 or over should increase their mileage by
46% in GPR and by 54% in MRM. This increase will be higher than for the population as a whole.
However, our analysis of the travel profile throughout the life cycle indicates that travel tends to
diminish markedly with age as does household car ownership and average trip length. The net impact
of ageing as regards the total number of passenger-kilometres travelled will therefore be relatively
small by the year 2020 despite the major changes in the profile of the clientele.
Travel demand among the elderly will increase irrespective of their zone of residence. This
increase will involve trip frequencies, daily distance travelled and global volume of trips. This will occur
in a context of continuing urban sprawl and dependency on motorized modes. In such a context and in
both areas, among other impacts, we must anticipate a rapid growth in demand-responsive transport
be it conventional taxi, specialized services for persons with reduced mobility (disabilities starting to
rise exponentially from the age of sixty), or other forms yet to be invented.
8. ACKNOWLEDGMENTS This research was funded by the French Ministry of Transport under the PREDIT framework program
and the ECOS-NORD cooperation program. The authors also acknowledge the valuable comments of
three anonymous reviewers.
9. REFERENCES Berri, A. (2005). "Dynamiques de la motorisation et des dépenses de transport des ménages.
Analyses sur données individuelles et semi-agrégés, 254p.
Bonnafous, A. (1992). "La croissance du transport en question. Sous-thème 1 : structures
25
démographiques et comportements sociaux". Paper presented at the 12th International Symposium
on the Transport Economics Theory, CEMT, Lisboa.
Bush, S. (2003). "Forecasting 65+ Travel: An Integration of Cohort Analysis and Travel Demand
Modeling," Massachusetts Institute of Technology, Department of Civil and Environmental
Engineering, Cambridge, MA, USA.
Bussière, Y., J. Armoogum and J.L. Madre (1996). "Vers la saturation ? une approche démographique
de l'équipement des ménages en automobile dans trois régions urbaines". Population, N°4-5, pp
955-978.
Bussière, Y. and J.-P. Thouez (2004). “Mobility patterns of the disabled in Montreal in 1998 and long
term perspectives”, 10th International Conference on Mobility and Transport for Elderly and Disabled
People, TRANSED 2004, 23-26 mai, Hamamatsu (Japan). Proceedings.
ECMT, (2000) European Conference of Ministers of Transport. “Transport and Ageing of the
Population”, round table 112, 260p.
Chapleau, R. (1990). “Recent Trends in Urban Transportation Demand and their Potential Impacts”,
Global Opportunities for Business in Environment, Vancouver.
Harris, A. and D. Tapsas (2006). “Transport and mobility: Challenges, innovations and improvements.
Melbourne, Australia, Roayal Automobile Club of Victoria.
Kaufmann, V. (2000). “Mobilité quotidienne et dynamiques urbaines“, Presses Polytechniques et
Universitaires Romandes, Lausanne, Suisse.
Krakutovski, Z. (2004). “Améliorations de l’approche démographique pour la prévision à long terme de
la mobilité urbaine“, thèse de l'Université de Paris XII, 2004, 358 p.
Gallez,. C. (1994). "Identifying the long term dynamics of car ownership: a demographic approach".
Transport Reviews, vol. 14, n° 1, 83-102.
Insee (2005). "Le modèle de projection démographique Omphale 2000", Insee Method N°112, 2005
Grönvall, O., A. Stahl, M. Bernman (2005) Proceedings of Workshop III, SIZE project, Deliverable
D15, Department of Technology and Society, Lund University, Sweden.
Grönvall, O., A. Stahl, M. Bernman (2006) Summary of the results of Area 3, SIZE project, Deliverable
D14 and D16, Department of Technology and Society, Lund University, Sweden.
Madre, J.-L. (1990). "Long-term forecasting of car ownership and car use" in Jones, P., Ed.,
Developements in dynamic and activity-based approaches to travel analysis, Oxford Studies in
26
Transport, Avebury, Aldershot.
Madre, J-L., Y. Bussière and J. Armoogum (1995). "Demographic Dynamics of Mobility in Urban
Areas: A Case Study of Paris and Grenoble", Proceeding of the 7th WCTR, Sydney, Australia.
Madre, J.-L., J. Armoogum, C. Gallez and Y. Bussière (1996). "Motorisation et mobilité des Franciliens
dans les années 2000". Rapport INRETS no 209.
Oxley, P., and A. Stahl (2001) “Taxis for All ? Final Report”. Directorate General for Transport,
Commission of the European Community. Brussels.
Stahl, A., G. Carlsson, P. Hovbrandt, and S. Iwarsson.(2008)“Let´s go for a Walk – Accessibility and
Safety for Older People in the Outdoor Environment. Submitted.
U.S. Department of Transportation (2003) “Safe Mobility for a Maturing Society: Challenges end
Opportunities”. Washington.
Whelan, M., J. Langford, J. Oxley, S. Koppel, J. Charlton (2006). “The elderly and mobility: a review of
the literature”. Report no 255. Monash University. Accident Research Centre.