Embed Size (px)
Citation preview
Projects of Open Data
for Official Statistics
Toshihiko AKATANI
Deputy Director,
Planning and Management Office,
National Statistics Center (NSTAC)
IAOS 2014 Conference – Meeting the Demands of a Changing World
Da Nang, Vietnam, 8-10 October 2014

Table of Contents
1
I. Introduction
II.Project 1: Development of an
environment for advanced use of
statistics by API
III.Project 2: Improvement of statistics GIS
IV.Project 3: Study of on-demand tabulation
functions
V.Future work and some implications
VI.Conclusion

2
I. Introduction
II.Project 1: Development of an
environment for advanced use of
statistics by API
III.Project 2: Improvement of statistics GIS
IV.Project 3: Study of on-demand tabulation
functions
V.Future work and some implications
VI.Conclusion

G8 Open Data Charter (excerpt)
3
8. We therefore agree to follow a set of principles that
will be the foundation for access to, and the release
and re-use of, data made available by G8 governments.
They are:
• Open Data by Default
• Quality and Quantity
• Useable by All
• Releasing Data for Improved
Governance
• Releasing Data for
Innovation Picture: http://lod-cloud.net/
(“G8 Open Data Charter”, Published 18 June 2013)
Five Levels of Open Data
4
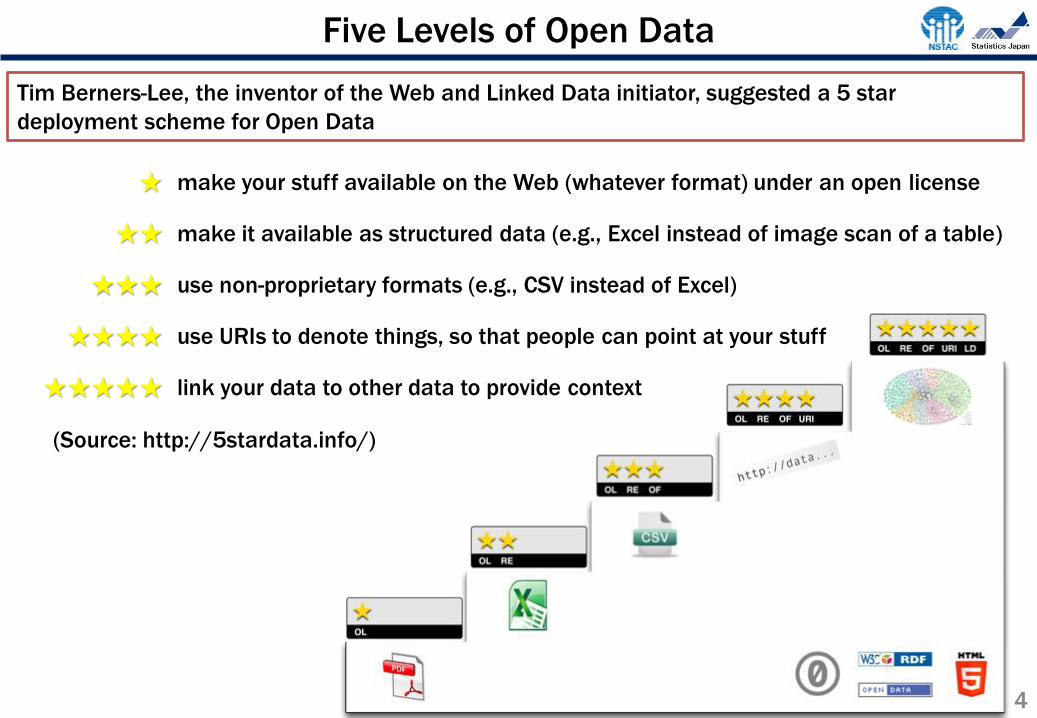
★ make your stuff available on the Web (whatever format) under an open license
★★ make it available as structured data (e.g., Excel instead of image scan of a table)
★★★ use non-proprietary formats (e.g., CSV instead of Excel)
★★★★ use URIs to denote things, so that people can point at your stuff
★★★★★ link your data to other data to provide context
Tim Berners-Lee, the inventor of the Web and Linked Data initiator, suggested a 5 star
deployment scheme for Open Data
(Source: http://5stardata.info/)

June 2013 Japan Revitalisation Strategy – JAPAN is BACK – (adopted by the Cabinet)
◎ Make the 2-year period between FY2014 and FY2015 the intensive period for taking measures
◎ Launch the data catalog website (trial version)
◎ Offer the world’s top-level data sets to disclose (more than 10,000) by the end of FY2015
Japanese Government’s Efforts on Open Data
5
Data Catalog Site “data.go.jp” beta has launched (Dec 20, 2013)
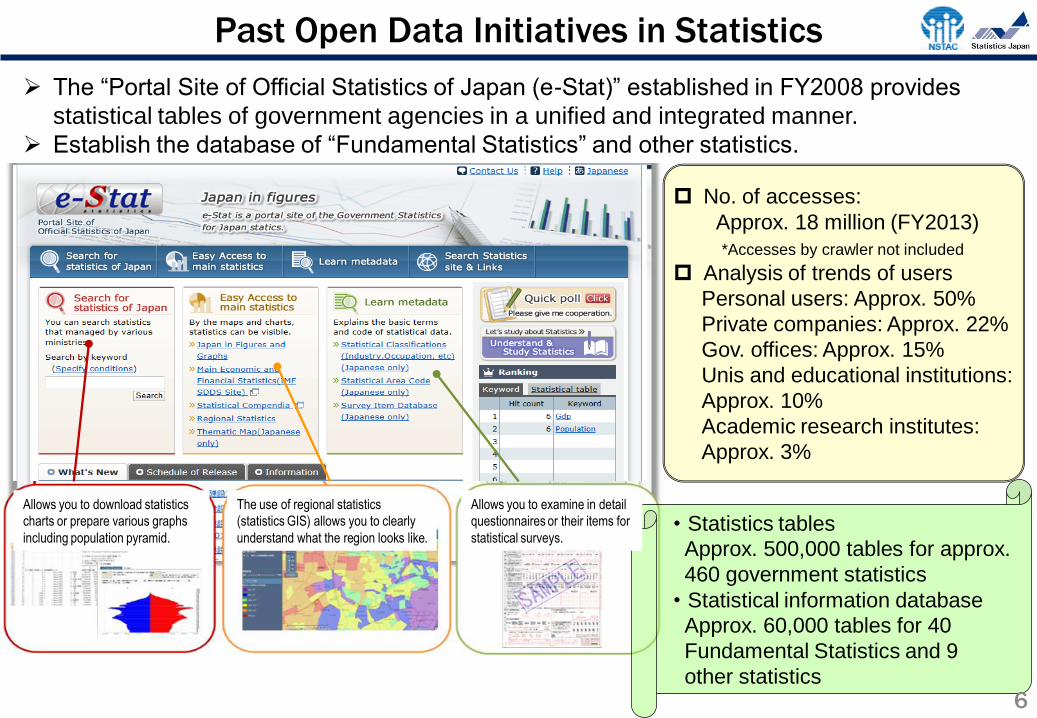
No. of accesses:
Approx. 18 million (FY2013)
*Accesses by crawler not included
Analysis of trends of users
Personal users: Approx. 50%
Private companies: Approx. 22%
Gov. offices: Approx. 15%
Unis and educational institutions:
Approx. 10%
Academic research institutes:
Approx. 3%
・Statistics tables
Approx. 500,000 tables for approx.
460 government statistics
・Statistical information database
Approx. 60,000 tables for 40
Fundamental Statistics and 9
other statistics
The “Portal Site of Official Statistics of Japan (e-Stat)” established in FY2008 provides
statistical tables of government agencies in a unified and integrated manner.
Establish the database of “Fundamental Statistics” and other statistics.
Past Open Data Initiatives in Statistics
6
Allows you to download statistics
charts or prepare various graphs
including population pyramid.
Allows you to examine in detail
questionnaires or their items for
statistical surveys.
The use of regional statistics
(statistics GIS) allows you to clearly
understand what the region looks like.

(1) Data shall be provided in formats appropriate for machine reading. -> Provide data in
formats (e.g. XML) that allow you to automatically reuse (e.g. process, edit) the data
e-Stat provides the statistics tables for almost all countries (in Excel, CSV or other formats) and
statistics data (in the XML format) for the major statistics. However, it requires users to manually
operate the computer and download data to acquire the data or tables.
It is necessary to provide the function that allows you to automatically and mechanically acquire
statistics data and facilitate data processing or editing.
Promote “advanced open data in statistics” including the establishment of API that allows you to
automatically and mechanically acquire statistics data
(2) Data shall be released under the rules that enable secondary use. -> Reexamine the terms
of use of websites, etc.
It is necessary to reexamine the terms of use to widely allow for the secondary use of data.
The government has adopted the template for the terms of use of websites covering open data,
which is scheduled to be implemented in FY2014. (Set out the principles of clearly stating the
source and allowing for secondary use including the use for commercial purposes. Any exceptions
resulting from legal or other restrictions shall be clearly stated.)
Government’s Open Data Initiatives in Statistics
7
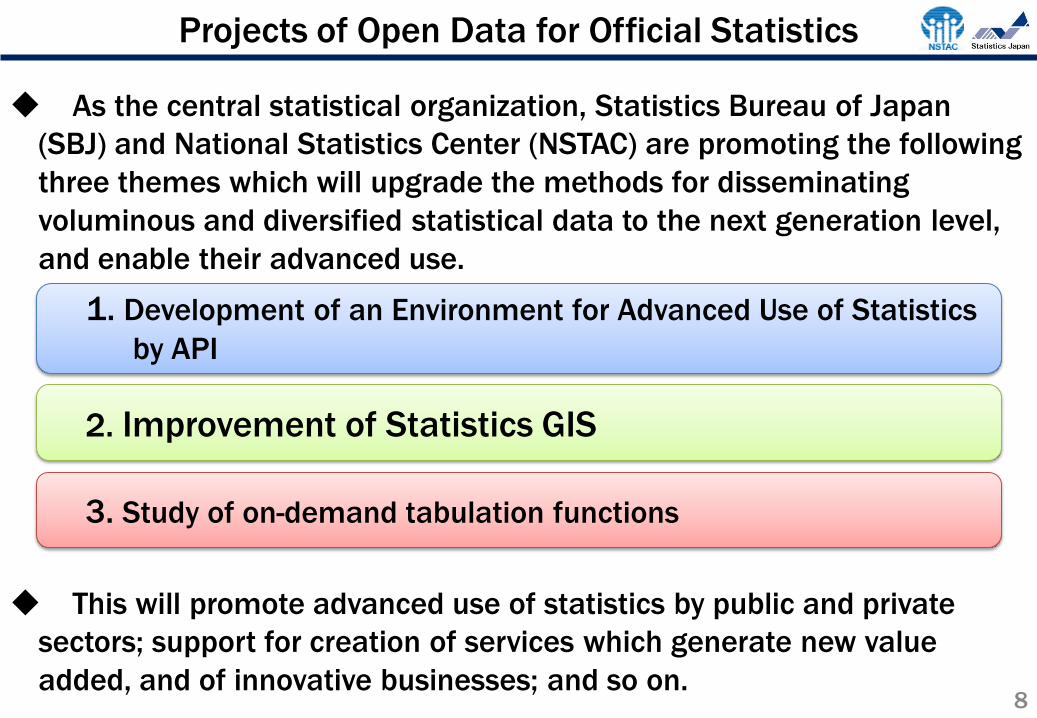
Projects of Open Data for Official Statistics
As the central statistical organization, Statistics Bureau of Japan
(SBJ) and National Statistics Center (NSTAC) are promoting the following
three themes which will upgrade the methods for disseminating
voluminous and diversified statistical data to the next generation level,
and enable their advanced use.
2. Improvement of Statistics GIS
1. Development of an Environment for Advanced Use of Statistics
by API
3. Study of on-demand tabulation functions
This will promote advanced use of statistics by public and private
sectors; support for creation of services which generate new value
added, and of innovative businesses; and so on. 8

9
I. Introduction
II.Project 1: Development of an
environment for advanced use of
statistics by API
III.Project 2: Improvement of statistics GIS
IV.Project 3: Study of on-demand tabulation
functions
V.Future work and some implications
VI.Conclusion

Development of an Environment for Advanced Use of Statistics by API
10
SBJ and NSTAC started a trial run of API functions for official statistics on 10 June 2013 in
order to develop an environment for advanced use of statistical data.
As of 31 July 2014, 2,131 users registered themselves, and the number is increasing
steadily.
To shift to high gear in 2014, functions and stress tests are being verified, and comments
from users are being collected.
API (Application Programming Interface) function has been newly added to e-Stat enabling
the conversion of statistics data to machine readable data.
Statistics information
database
API
INT
ER
NE
T
Info. system
of private sector
Info. system
of local gov.
automatic
update
automatic
update
Example 1:
Update data of e-Stat
automatically
Example 2:
Mash-up with other data of user
or data available from the
internet Other info.
or services
Outline of API function

Presenting data in
a bubble chart
Presenting the latest
monthly data every
time the data base is
updated
Presenting data
in a bar chart
11
Analytical example using API functions
The statistics data of consumer spending on Chinese dumplings (results of Family Income and Expenditure Survey) by prefectural capital or ordinance-designated city is acquired by API and superimposed with the program available on the Internet (mash-up).

Official App by SBJ on Smartphone (App on Statistics)
12
A trial version of “App on Statistics” (for Android) was released on 15 April 2014
The app interlocks the statistical API functions with the smartphone GIS to display the
statistics data of your current location, and provides other functions that allow you to feel
familiar with statistics data.
Displays statistics data of
your location using GPS
A location may also be
specified to display the
data
Major statistics data available so far (SBJ data):
• Population/households (Population Census)
• Number of private establishments and employees (Economic Census for
Business Activity)
• Major prices (Retail Price Survey)
• Monthly income and expenditure (Family Income and Expenditure Survey),
etc.
*Use of the API functions allows you to always acquire the latest statistics data.
Displays a list of
statistics data on
each item
City Stat
Pocket Statistics
Statistics Clock
Link to SBJ top page
Displays the statistical information
and quiz of the day
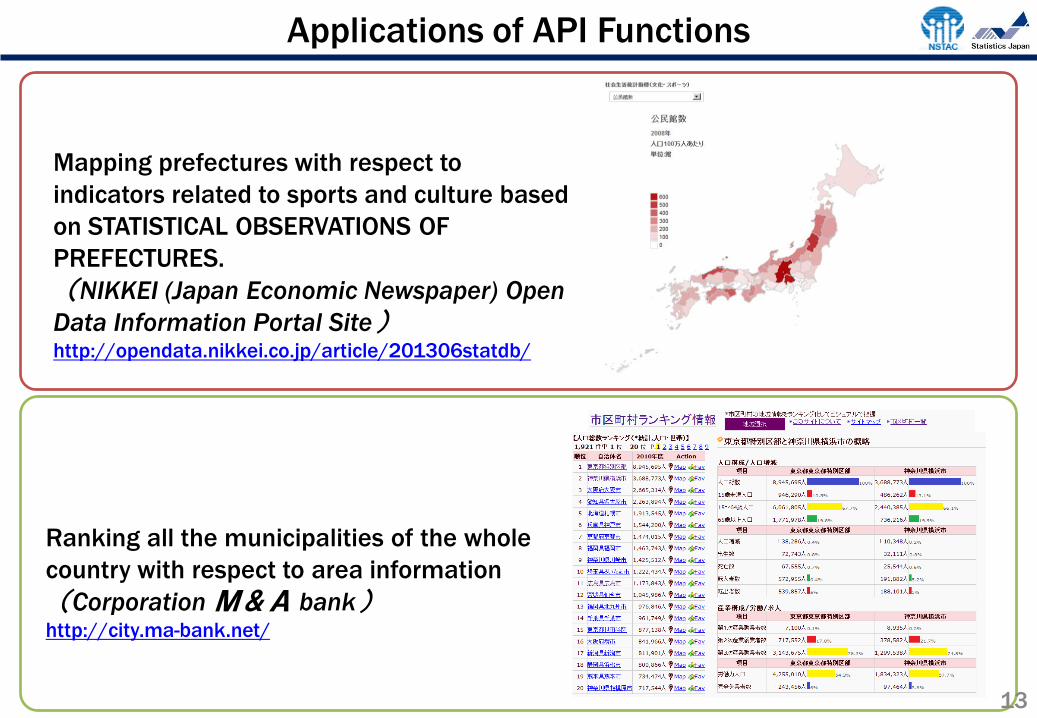
Applications of API Functions
Mapping prefectures with respect to
indicators related to sports and culture based
on STATISTICAL OBSERVATIONS OF
PREFECTURES.
(NIKKEI (Japan Economic Newspaper) Open
Data Information Portal Site) http://opendata.nikkei.co.jp/article/201306statdb/
Ranking all the municipalities of the whole
country with respect to area information
(Corporation M&A bank) http://city.ma-bank.net/
13
14
I. Introduction
II.Project 1: Development of an
environment for advanced use of
statistics by API
III.Project 2: Improvement of statistics GIS
IV.Project 3: Study of on-demand tabulation
functions
V.Future work and some implications
VI.Conclusion

Improvement of Statistics GIS
15
To improve Statistics GIS on e-Stat, there is a new system under development that
enables retrieving data held by users and analysis of statistics data in an
arbitrarily designated area.
On 18 October 2013, a trial run started under a user registration system.
(Functions and stress tests are being verified through provisional dissemination of
statistics provided by SBJ. 1,077 users are registered as of 31 July 2014)
The addition of functions enabling
①retrieving data held by user
②compiling statistics data in an arbitrarily designated area
Designated
Area(arbitrary)
Data held by
user
自社売上高
Statistics in the
designated area

16 In the analysis, municipal information on evacuation buildings or shelters within a city in case of a disaster is incorporated
into the statistical GIS functions to display an estimate of the population within the area of an evacuation site.
Imported
contents
Possible to enter
on the screen
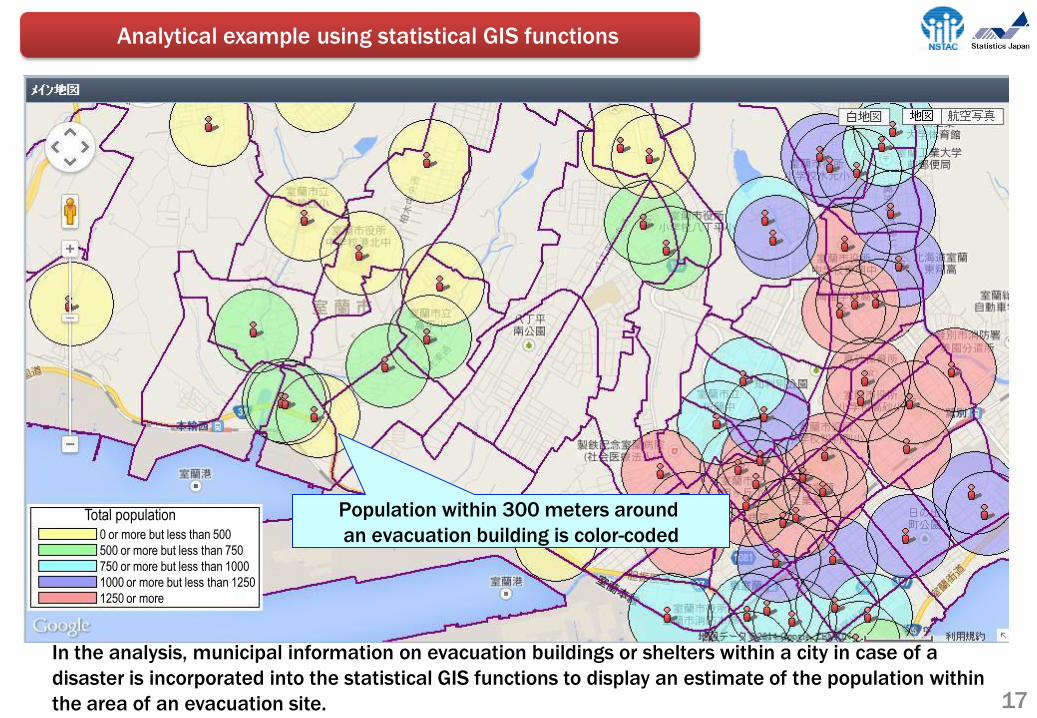
Analytical example using statistical GIS functions
Plot the user’s data by geo-coding which
converts the address into the
coordinates of longitude and latitude.
Source: Muroran City Muroran Open Data Library
17
In the analysis, municipal information on evacuation buildings or shelters within a city in case of a
disaster is incorporated into the statistical GIS functions to display an estimate of the population within
the area of an evacuation site.
Analytical example using statistical GIS functions
Population within 300 meters around
an evacuation building is color-coded 0 or more but less than 500
500 or more but less than 750
750 or more but less than 1000
1000 or more but less than 1250
1250 or more
Total population
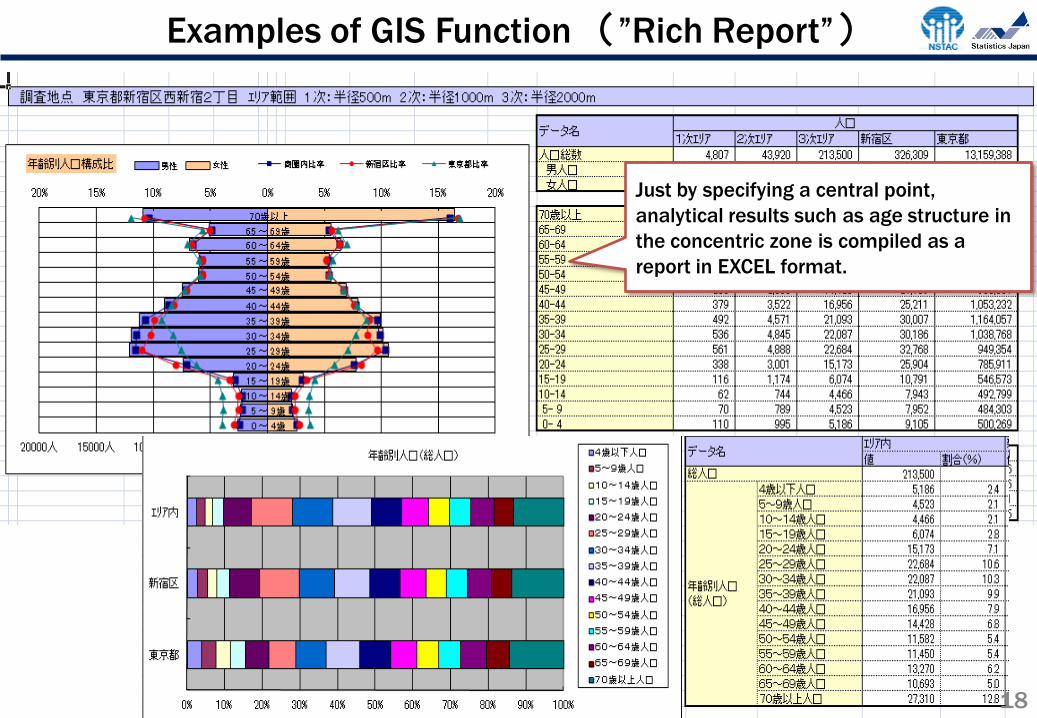
Examples of GIS Function (”Rich Report”)
Just by specifying a central point,
analytical results such as age structure in
the concentric zone is compiled as a
report in EXCEL format.
18
19
I. Introduction
II.Project 1: Development of an
environment for advanced use of
statistics by API
III.Project 2: Improvement of statistics GIS
IV.Project 3: Study of on-demand tabulation
functions
V.Future work and some implications
VI.Conclusion

Study of On-demand Tabulation Functions
20
A new statistics delivery service which puts out statistics table automatically
when a user selects survey item is currently under study. This service will
possibly be used by the public as well as the academic sector.
It is expected that this new function will answer various needs such as
academic research, enabling arbitrary cross tabulation which is not included in
existing tables.
*For practical use, there are some issues to be solved regarding operational and
institutional aspects and confidentiality.
20
全国 北海道 青森県
A 農業,林業
B 漁業 ・・・T 分類不能の産業
A 農業,林業
B 漁業 ・・・T 分類不能の産業
総数(15歳以上) 1260195 282123 435711 378886 977285 222123 375711 379451 282910
男 656876 157533 255536 209623 532692 127533 225536 179623 124184
A 管理的職業従事者 191416 11403 92070 58684 132157 1403 82070 48684 59259
B 専門的・技術的職業従事者 220767 59498 100784 55346 185628 49498 90784 45346 35139
・・・
L 分類不能の職業 244693 86632 62682 95593 214907 76632 52682 85593 29786
女 603319 124590 180175 169263 444593 94590 150175 199828 158726
A 管理的職業従事者 228003 22245 91360 91532 175137 12245 81360 81532 52866
B 専門的・技術的職業従事者 178185 56636 37478 77731 141845 46636 27478 67731 36340
・・・
L 分類不能の職業 197131 45709 51337 127611 35709 41337 50565 69520
15~19歳
1185020 245179 381871 178115 902184 225179 361871 315134 282836
男 553244 146415 184967 178115 479497 136415 174967 168115 73747
A 管理的職業従事者 223239 91348 80092 54987 196427 81348 70092 44987 26812
B 専門的・技術的職業従事者 198228 30820 63136 100098 164054 20820 53136 90098 34174
・・・
L 分類不能の職業 131777 44247 61739 43030 119016 34247 51739 33030 12761
女 631776 98764 196904 422687 88764 186904 147019 209089
A 管理的職業従事者 234761 78719 97074 24329 170122 68719 87074 14329 64639
B 専門的・技術的職業従事者 170529 16900 16617 94245 97762 6900 6617 84245 72767
・・・
L 分類不能の職業 226486 23145 103213 58445 154803 13145 93213 48445 71683
20~24歳
626331 162330 115462 227750 475542 152330 105462 217750 150789
男 626331 162330 115462 227750 475542 152330 105462 217750 150789
A 管理的職業従事者 297975 76392 74027 81633 202052 66392 64027 71633 95923
B 専門的・技術的職業従事者 211700 80929 36018 69976 156923 70929 26018 59976 54777
・・・
L 分類不能の職業 116656 25009 25417 96141 116567 15009 15417 86141 89
Prefecture industry
age-group
sex
occupation
tabulation items:
population, households
① User selects survey item ②Tabulating automatically
【Image】 User combines survey items
depending on his or her needs

Mechanism of On-demand Tabulation Functions
Microdata
Hyper data cube
development
1. NSTAC develops Hyper data cube using microdata
Users
2. Users designate survey items
INTE
RN
ET
3. On-demand tabulation functions apply tabulation and disclosure control from Hyper data cube and output secured statistical tables automatically
•Tabulation
•Disclosure
Control
21
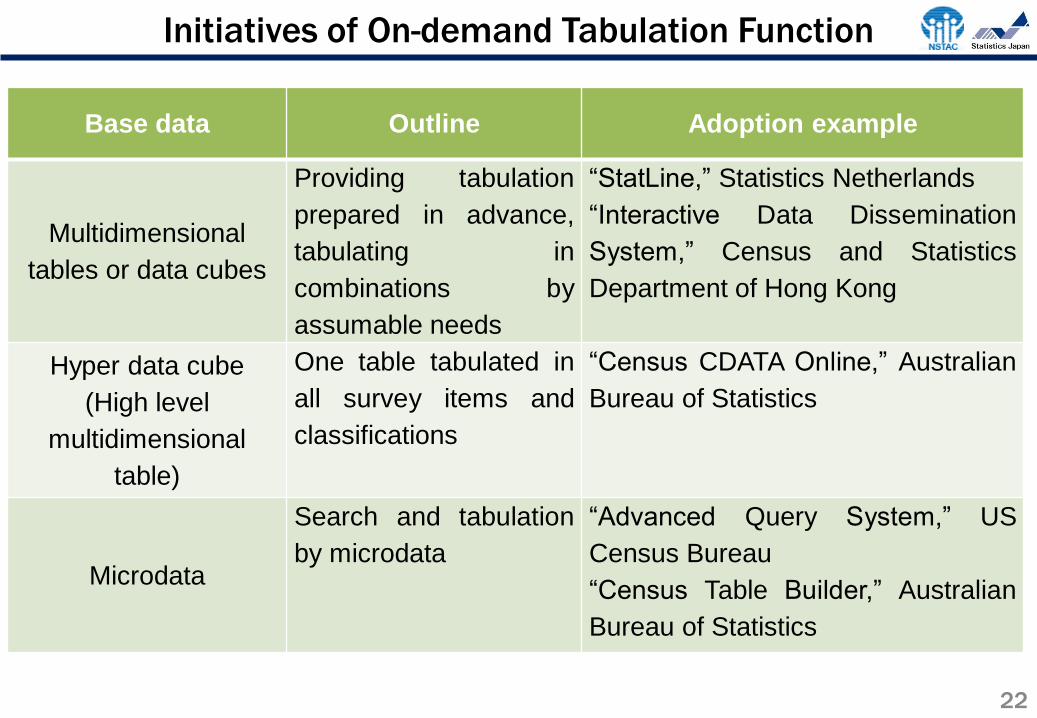
Initiatives of On-demand Tabulation Function
22
Base data Outline Adoption example
Multidimensional
tables or data cubes
Providing tabulation
prepared in advance,
tabulating in
combinations by
assumable needs
“StatLine,” Statistics Netherlands
“Interactive Data Dissemination
System,” Census and Statistics
Department of Hong Kong
Hyper data cube
(High level
multidimensional
table)
One table tabulated in
all survey items and
classifications
“Census CDATA Online,” Australian
Bureau of Statistics
Microdata
Search and tabulation
by microdata
“Advanced Query System,” US
Census Bureau
“Census Table Builder,” Australian
Bureau of Statistics

23
I. Introduction
II.Project 1: Development of an
environment for advanced use of
statistics by API
III.Project 2: Improvement of statistics GIS
IV.Project 3: Study of on-demand tabulation
functions
V.Future work and some implications
VI.Conclusion
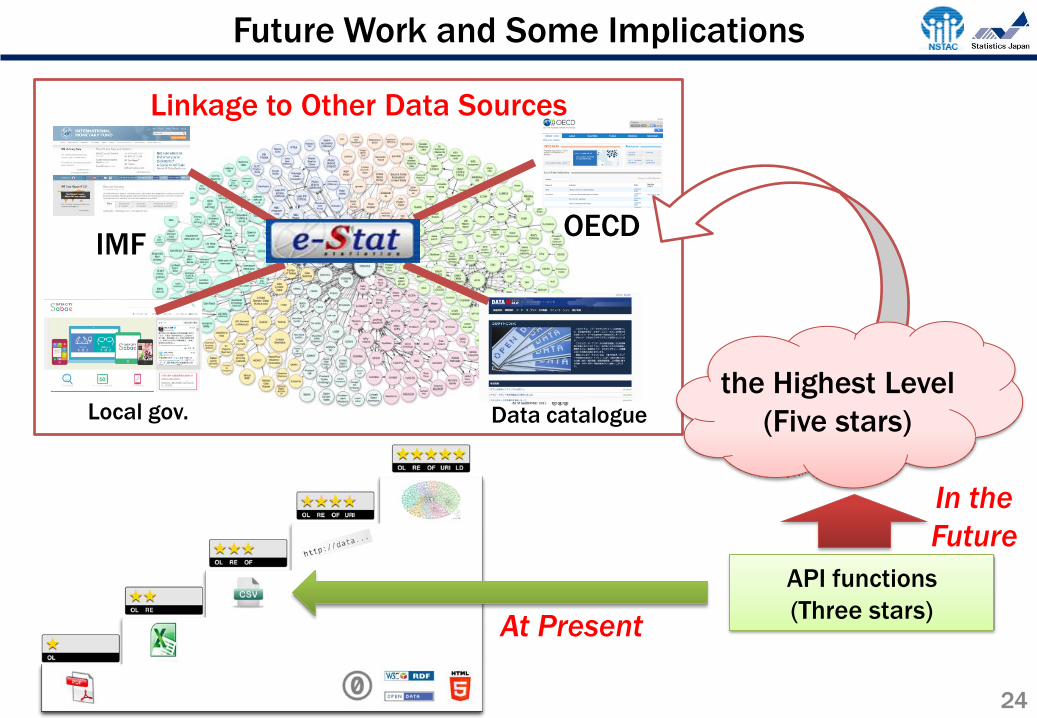
Future Work and Some Implications
24
API functions
(Three stars)
Linkage to Other Data Sources
IMF OECD
Local gov. Data catalogue
the Highest Level
(Five stars)
At Present
In the
Future
25
I. Introduction
II.Project 1: Development of an
environment for advanced use of
statistics by API
III.Project 2: Improvement of statistics GIS
IV.Project 3: Study of on-demand tabulation
functions
V.Future work and some implications
VI.Conclusion
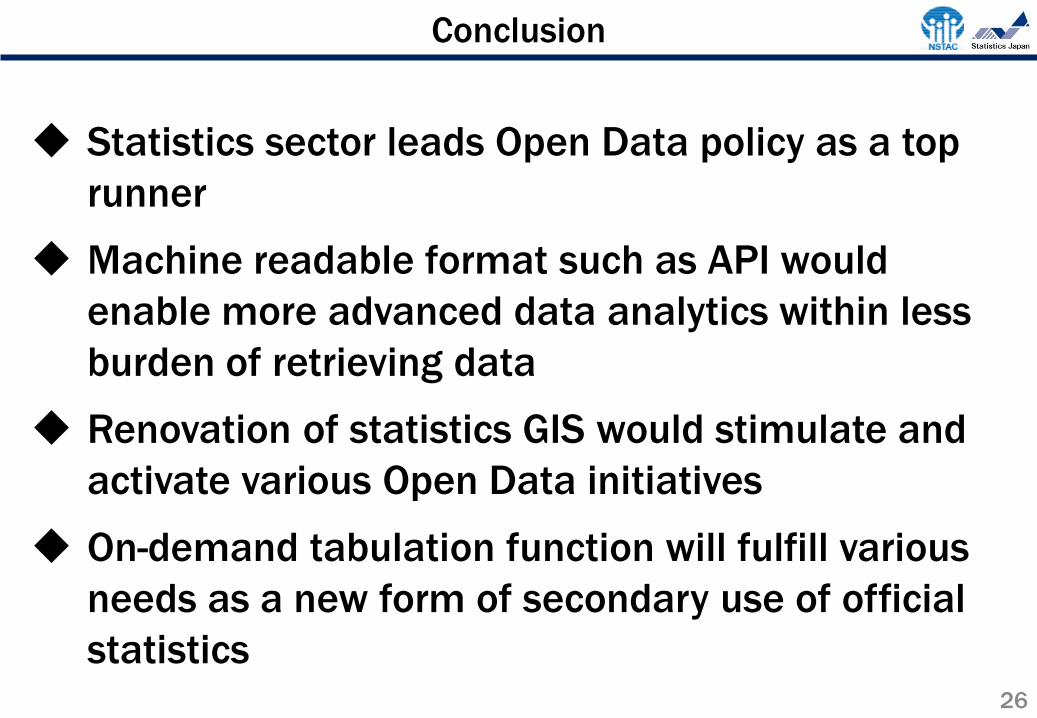
Conclusion
26
Statistics sector leads Open Data policy as a top
runner
Machine readable format such as API would
enable more advanced data analytics within less
burden of retrieving data
Renovation of statistics GIS would stimulate and
activate various Open Data initiatives
On-demand tabulation function will fulfill various
needs as a new form of secondary use of official
statistics
Thank you for your attention!
http://statdb.nstac.go.jp/
27
Toward enhancement of open data for official statistics
*You can access the GAUSS website from the SBJ or the NSTAC homepage. As of October 2014, the GAUSS website is in Japanese only.