Embed Size (px)
Citation preview
1
PROMOTING GENDER DIVERSITY ON BOARDS: HARMFUL OR BENEFICIAL
FOR MERIT AND PERFORMANCE?
Irma Martínez-García
University of Oviedo
Avda. del Cristo s/n, 33071 Oviedo, Spain
Phone: 00 34 98 5103794
e-mail: [email protected]
Silvia Gómez-Ansón
University of Oviedo
Avda. del Cristo s/n, 33071 Oviedo, Spain
Phone: 00 34 98 5102825
e-mail: [email protected]
ABSTRACT
This article analyses how gender diversity on boards’ laws (soft and hard) may impact female
presence on boards, directors’ characteristics, specifically educational, professional and
international backgrounds, and firm performance. The analyses are undertaken using Spain as
work field. Spain is a country that has approved both quotas (hard law) and Corporate
Governance Codes that recommend women presence on boards (soft law). Besides, Spain as a
member of EU-28 is affected by the proposal of EU Directive about female presence on
boards (hard law). For a panel of Spanish non-financial listed firms over an 11-year period,
the results reveal that female representation on board of directors has been improved after the
approval of both gender equality soft and hard laws, although the targets established by the
quota legislation have not been reached. The analyses show that after passing gender equality

2
laws women directors’ human capital attributes improve, although women still show lower
human capital assets than their male counterparts. Laws that promote gender presence on
boards derive in hiring women directors with higher tertiary educational levels, executive
experience in non-listed firms and international and non-business professional backgrounds.
Besides, the approval of a Code of Good Governance that includes gender equality
recommendations and of the Equality Law has a positive impact on the firms’ market value,
but overall the presence of women directors on boards decreases firms’ performance. The
lower professional experience of women directors, as a group, may explain the negative
impact of women directors on firms’ performance.
Key words: Corporate Governance, Board of Directors, Gender Diversity, Quota, Human
Capital Characteristics.
EFM Classification Code: 150 - Corporate Governance.
3
1.- Introduction.
Gender equality on corporate boards and its effect on firms’ performance is part of the
political and academic debate. Although with large variations, attributable largely to national
institutional systems worldwide (Grosvold and Brammer, 2011), men hold the majority of
corporate directorships (Credit Suisse, 2016; Lee et al., 2015). This situation has brought with
different initiatives that aim to increase women’s representation on boards. Among these
initiatives, soft and controversial hard (quota) laws play a prominent role. At country level,
some countries have included soft-measures such as provisions in Corporate Governance
Codes that follow the norm “comply or explain” that encourage gender diversity on board
(Terjesen, et al., 2015; Gómez-Ansón, 2012); others, starting with Norway in 2003, have
introduced quotas mandating that women represent a certain percentage of board seats (40%
in Norway for listed companies and SOEs). After Norway, other countries have also
introduced quotas. France, Belgium, Italy and Germany have passed quota legislations that,
like in Norway, include various sanctions for listed firms for non-compliance (European
Commission, 2012). Other countries such as The Netherlands, Spain, Iceland, India, Malaysia
and Israel have also introduced quotas for listed companies but without sanctions, while
Denmark, Finland, Greece, Austria, Poland, Ireland, Slovenia and Kenya have also approved
quota regulations but just for state-owned companies (Kirsch, 2017). The European
Commission also proposed a Directive on women boards in November 2012 that sets at 40%
the objective of the under-represented sex for non-executive board-member positions in
publicly listed companies. The proposal was backed by the European Parliament in November
2013, but up to now the Directive has not been approved (European Parliament, 2017).
Different studies have analyzed the consequences of quota regulations on company
performance. For Norway, Ahern and Dittmar (2012) report that the quota had a negative
impact on corporate performance, specifically, in companies’ stock prices and Tobin’s q ratio
4
while it increased leverage; Matsa and Miller (2013) find that firms affected by the quota law
increased labor costs and employment levels, and made less cuts on their workforce and
Bøhren and Staubo (2015) results show that introducing the gender quota reduced firm value.
The apparent negative relation between firm performance the introduction of quota laws that
carries with an increase of women presence on boards seems to contradict the results of
Pletzer et al. (2015) meta-analysis that show a small and non-significant correlation between
percentage of females on corporate boards and firm performance. Female directors’
characteristics could be behind the negative impact of quotas on firm performance, although
the results of the few studies that have analyzed this issue are mixed. For Norway, Bøhren and
Staubo (2015) report that introducing a gender quota tends to increase board independence;
Ahern and Dittmar (2012) find that passing the quota law caused the corporate boards to
become less experienced whereas Bertrand et al., (2014) find no differences in human capital
attributes between new male and women appointees after passing the quota law. For Italy,
Solimene et al. (2017) report an increase in women educational attainment, professional
background and experience on boards of other companies. Our paper contributes to the
limited body of literature dealing with consequences of legislation that aims to promote
women to the boardroom and in particular to the analysis of how directors’ human capital
attributes, specifically female director’ educational and professional background, may be
affected by the establishment of soft and hard laws. In this sense, we try to answer the
following questions: Do soft and hard laws influence, even if not approved, significantly
gender diversity on boards? What are the attributes related to education, internationalization
and professional background of women directors? Are women attributes similar to those of
the men holding similar posts? Have women attributes change with the approval of soft and
hard legislation? Do laws that promote gender diversity affect directors’ educational and

5
professional background? Do laws that promote gender diversity and the presence of women
directors affect firm performance?
Using a large database with more than 950 year-firm observations of Spanish non-financial
companies over an eleven-year period, we analyze the effectiveness of Spanish soft and hard
laws and the proposal of EU Directive that aim to promote women presence on boards of
directors and their consequences on directors’ human capital characteristics (in terms of
educational, international and professional background), specifically on women directors’
attributes. Using a contingency approach, we hypothesize that soft and hard laws that to
promote women presence on boards will increase gender diversity on boards and that new
female directors with higher educational attainment, higher experience in non-business related
sector but lower professional management background than existing women directors and
their men counterparts will be appointed deriving in a negative impact of promoting gender
legislation on firm performance. The results of the analyses support partially this prediction.
They reveal that soft legislation and gender quotas increase gender diversity on boards
although established targets have not been fulfilled. New women directors’ show higher
educational levels and international backgrounds and the percentage of women directors
coming from professorships, politics and consultancy increases significantly. But, contrary to
our expectations the percentage of female directors with management experience as chief
executive officers in non-listed firms and senior managers in listed firms also increases.
Overall, legislation does not drive to lower levels of women directors’ human capital, namely,
laws significantly increase the percentage of women directors with certain educational or
professional characteristics or do not affect the percentage of women with other desirable
ones. This behavior could help to explain the observed positive influence found of the Conthe
Code (Spanish soft law) and the Equality Law (Spanish hard law) on the firm’s market value.
However, the results also suggest a negative impact of both female presence and gender
6
diversity on firms’ performance as women directors’ labor attributes are lower than their men
counterparts. The results of Ahern and Dittman, (2012) and Bertrand et al., (2014) point in the
same direction. They report that the Norwegian quota had a negative impact on firm value as
a consequence of the appointment of women directors with less management experience than
men directors.
The rest of the paper is organized as follows: Section 2 refers to the theoretical framework
and hypotheses to be tested. Section 3 describes the database, variables and methodologies
employed in the analyses. The results are presented in Section 4 and conclusions are
summarized in Section 5.
2.- Theoretical Background and hypotheses.
Women underrepresentation on the boardrooms has been tackled by introducing a set of
initiatives to control gender composition of corporate boards. This set of initiatives includes
“soft law” based on Corporate Governance Codes’ recommendations and regulations and
quota legislation or “hard law” which states that certain percentage of directors’
representation must be allocated to the underrepresented group, in this case women. In several
EU countries the Codes of Corporate Governance recommend gender diversity including
Sweden, the Netherlands, Belgium, France, Germany, UK or Spain. Quotas for publicly
traded companies where first established by Norway who set a mandatory 40% gender quota
with punishment measures associated in 2003. Next, other countries, and specially, European
countries, such as Spain (2007; 40%) Iceland (2010; 40%), France (2011; 40%), Belgium
(2011; 33%), Italy (2011; 33%), Netherlands (2011; 30%) or Germany (2015; 30%) approved
quota legislation. At a supranational level, in 2012, the European Commission passed a
proposal of Directive that sets at 40% the objective of the under-represented sex for non-
executive board-member positions in publicly listed companies. The proposal was backed by
7
the European Parliament in November 2013, has not yet be approved as Directive (European
Parliament, 2017).
Several factors are associated to the effectiveness of the laws that promote women
representation on boardrooms (Sweigart, 2012). For soft-laws as provisions included in Codes
of Good Governance, the requirement to comply or explain, the need to be transparent and
disclose the percentage of women directors explaining the reasons for non-diversity will force
companies to signal to the market their commitment towards diversity (Gómez-Ansón, 2012).
Quota laws effects may also vary depending on whether there are punishments for non-
compliance. In this sense, the empirical evidence reveals that in Norway the quota produced
the desirable increase in female directorships achieving the 40% quota target (Storvik and
Teigen, 2010). Associated sanctions were effective for reaching the target of women presence
on boards set. Iceland has also reached the 40% gender target although no penalties for non-
compliance were associated (Terjesen and Sealy, 2016). Nevertheless, non-mandatory or non-
punitive quota laws lead to slower and smaller increments in women directorships (Armstrong
and Qalby, 2012; Labelle et al. 2015).
In Spain, the 2006 Spanish Corporate Governance Code also known as Conthe Code
established recommendations about women representation on the boardroom being companies
expected to publish in their annual Corporate Governance Report a section on gender
diversity with detailed information on year-end gender distribution and changes occurring in
gender distribution over the course of the year. One year later, in 2007, Spain was the first EU
country and the second European country to establish a gender quota for public limited
companies. Spanish Equality Law was approved establishing a 40% gender quota by 2015 for
publicly-traded firms with more than 250 employees. The Spanish quota does not include a
full implementation plan or punitive measures for non-compliance. Spain as EU State
member is also affected by proposal of EU Directive.
8
Considering the above mentioned arguments, we should therefore expect that the Conthe
Code, the Equality Law and the proposal of Directive even when they are voluntary or have
not associated punitive measures, would lead to an increase in women representation on
boards. Thus, we hypothesize:
Hypothesis 1: Soft and hard laws that aim to promote women presence on boards
increase gender diversity on boards of directors.
Directorships on boards may be considered a labor market for skilled people and,
consequently, female underrepresentation on boards has been explained through different
theories, on both the supply and demand side of the labor market of directors (Gabaldon, et al.
2016). On the supply side, previous studies report that women face different barriers to
becoming directors due to gender differences in values and attitudes, due to their
identification with gender expected roles or work-family conflicts (Pande and Ford, 2011;
Terjesen et al., 2009). From the point of view of the demand side of the labor market of
directorships, barriers for the appointment of female directors include gender discrimination
(Becker, 1957) and biased perceptions toward female directors’ capabilities, expertise,
resources and networking capacity (Becker, 1964; Ragins et al., 1998). Social identity theory
(Tajfel, 1972) also predicts a lower demand of women on boards: individuals classify
themselves according to their characteristics (among them, gender) in groups and consider
themselves and others as either in- or out-group members, creating barriers for women as out-
group individuals (Terjesen et al., 2009).
Demand-side barriers may shape women potential directors’ human capital characteristics. In
this respect, women willing to become top managers and directors need to signal to the
market their value more than men candidates and therefore they may invest more in education
and in presenting an international experience than their male counterparts. The results of
9
different studies that find that women directors hold higher educational levels than male
directors (Hillman et al., 2002; Singh et al., 2008; Dang, et al., 2014) support this prediction.
The barriers that women face to be appointed to directors and glass ceiling phenomenon also
predict that women potential candidates will be less likely to present leadership and business
backgrounds (Bilimoria and Piderit, 1994). In fact, Adams and Ferreira (2009) argue that
women are more likely to be appointed to the boardroom to act as monitors. They may also be
appointed to bring board specialist knowledge in business-related fields, such as, consultancy,
law or finance (Dang et al., 2014; Dunn, 2012; Singh et al., 2008), or to provide boards with
non-business perspectives on issues and relationships with groups of the community (Dang et
al. 2014; Hillman, et al. 2002; Simpson et al. 2010).
In this directorship labor market scenario, legislative initiatives that aim to promote gender
balance on boards will lead to an increase in the demand of women directors and may alter
women directors’ human capital attributes. One of the most common reasons given by firms
for not appointing women to the boardroom is the lack of qualified and experienced women
candidates in the labor market (Becker, 1962; Singh et al., 2008) that may appear when larger
amounts of women have to be selected for directorships. If the pool of women directors with
this required management experience or executive background is small, and the demand for
female directors increases significantly, demand for women with management experience
may exceed the supply of women with these characteristics. Consequently, we hypothesize:
Hypothesis 2a: Soft and hard laws that aim to promote women presence on boards
decrease women directors’ executive experience.
According with the Resource Dependency theory (Pfeffer, 1972; Pfeffer & Salancik, 1978),
not only directors’ leadership experience is essential for the well- functioning of boards of
directors, but also a variety of director’s expertise profiles enhances the competence of the
board. Based on this theory, the literature identifies other two specifically directors

10
backgrounds (apart from executive experience): directors who come from specific
professional fields closely related to the business world and bring with specialist knowledge
in law, banking, marketing etc.; and directors who come from the public sector and from
professorships or politics and provide board of directors with non-business perspectives and
relationships with various groups in the community (Hillman, et al., 2000). In light of the
restricted pool of women with executive backgrounds, soft and hard laws that promote an
increase of women on boards may lead companies to look for potential women directors in
other sectors, such as consultancy and public sector or academia, sectors with high
educational requirements. Consequently, we state the following hypotheses:
Hypothesis 2b: Soft and hard laws that aim to promote women presence on boards
increase women directors’ non-business professional experience.
Hypothesis 2c: Soft and hard laws that aim to promote women presence on boards
increase women directors’ educational attainment.
Following the economic rationale for appointing women on boards, known as the business
case, a considerable number of studies have analyzed the economic argument that argues that
gender diversity at board level and in senior management enhance the productivity and
performance of corporations, thereby increase profitability and shareholder value (Gómez-
Ansón, 2012). Theoretical arguments based on agency theory (Jensen and Meckling 1976),
transaction cost economics (Williamson, 1988) and resource dependence theory (Pfeffer,
1972; Pfeffer and Salancik, 1978) predict, for instance, that diversity may improve the ability
of the board to monitor, due to increased independence; may also enhance the decision
making process of the board, due to unique new perspectives and knowledge, increased
creativity and non-traditional innovative approaches (Carter et al., 2010). In addition, women
may be less likely to have attendance problems (Adams and Ferreira, 2009), and they may
care more about stimulation and may be more open to risk taking compared to male directors
11
(Adams & Funk, 2010). Nevertheless there is inconclusive empirical evidence about the real
effect associated to the influence of women directors on boards on firms’ performance. For
instance, some studies show a positive relationship between gender diversity and firm
performance for EEUU listed companies (Carter et al., 2003; Erhardt et al., 2003) while
others reveal a negative one (Farrell and Hersch, 2005). For Europe, the evidence is also
inconclusive (Bøhren and Strøn, 2005; Ryan and Haslan, 2005; Kotiranta et al., 2007; Rose,
2007; Campbell and Mínguez-Vera, 2010). For a meta-analysis, using data from 20 studies on
3097 companies published in peer-reviewed academic journals Pletzer et al. (2015) conclude
that the mere representation of females on corporate boards is not related to firm financial
performance if other factors are not considered. Recent studies have also analyzed the effect
of legislation that aims to improve gender presence on boards on firm performance (Ahern
and Dittman, 2012; Bertrand et al., 2014). The results of these studies suggest that legislation,
apart from increasing women presence on boards, reduces firm performance since quotas may
have led to less experienced and capable boards and less capable boards. These results point
out to the importance of directors’ educational and professional characteristics beyond
sociological characteristics such as gender (Anderson et al., 2011). Nygaard (2011) and
Labelle et al. (2015) have found a negative effect of gender diversity on firm performance
under regulatory systems imposing gender quotas since they alter the existing optimal
governance structure. The preceding discussion leads us to state:
Hypothesis 3: Soft and hard laws that aim to promote women presence on boards
decrease firms’ performance.
3.- Sample, variables and methodology.
3.1.- Sample
12
The initial sample includes the entire population of non-financial firms listed on the Spanish
Stock Exchanges over the period 2003-2013. Companies from the finance, banking and
insurance sectors are excluded due to their different regulatory and governance characteristics
(Adams and Mehran, 2003; Macey and O’Hara 2003; Prowse 1997; Stoney and Winstanley
2001). Over this initial sample, the following filters were applied: observations of subsidiary
firms (defined as a business 90 percent or more of which is owned by another sample’s listed
firm), companies for which information for at least four consecutive years was not available,
and merged firms, were excluded. After applying these filters, the final sample is formed by
an unbalanced panel of 114 non-financial firms and 1,066 firm-year observations evenly
distributed over the study period. The data used was collected manually. Information related
to firms’ corporate governance structures was obtained from the Annual Corporate
Governance Reports filled in by each firm at the Spanish Supervisory Agency (Comisión
Nacional del Mercado de Valores –CNMV-). The economic and financial data comes from
different sources: SABI database (Sociedad de Análisis de Balances Ibéricos), the Madrid
Stock Exchange and the CNMV.
For the sample of 1,066 observations, we identified all the members of the board of directors
using the Annual Corporate Governance Reports filled in by each firm at the Spanish
Supervisory Agency (Comisión Nacional del Mercado de Valores –CNMV-) and searched for
board director’s sociological characteristics and educational and professional backgrounds
looking at the biographical section of firms’ annual reports and/or the official websites. If
biographical information was not available, we directly contacted firms requesting board
directors’ curricula vitae. Lastly, if we received no answer, missing data was obtained from
the BoardEx database when available; however BoardEX coverage is not as complete as our
sample. Due to the difficulty of finding information about board of directors´ educational and
professional attributes, for a firm-year observation, if more than twenty five percent of the
13
information about their directors’ profiles was missing, that firm-observation was not
considered for the estimations. Thus, analyses related to directors’ characteristics are
performed using an unbalanced panel of 103 non-financial firms and 954 observations.
3.2.- Variables
Table 1 shows the list of variables employed in the analyses. Gender diversity variables refer
to gender diversity on boards of directors and to the national and EU initiatives (both soft and
hard laws) that aim to promote women presence on boards.
- Insert Table 1-
Gender diversity on boards is measured by different variables: a) a dummy variable which
equals one when there is at least one woman director and zero otherwise (FEMEXIST), b) the
percentage of female directors (PERFEM), and c) two gender diversity indexes (the Blau
Index –BLAU-and the Shannon Index –SHANNON-) that are frequently used in demography,
biology, ecology and gender diversity studies (Campbell and Míngez-Vera 2008; Mínguez-
Vera and López-Martínez, 2010).
The Blau Index (Blau, 1977; Simpson, 1949) is defined as:
1 − ∑ 𝑝𝑖2
𝑛
𝑖=1
Where 𝑝𝑖 is the percentage of directors in each category (women and men), and 𝑛 is the
number of categories. Its range of values is between 0, when there is no gender diversity, and
0.5 when there is the same number of female and male directors.
The Shannon Index (Shannon, 1948; Wiener, 1961) is estimated as:
− ∑ 𝑝𝑖 ln (𝑝𝑖)
𝑛
𝑖=1
14
Where 𝑝𝑖 and 𝑛 are equivalent to the Blau Index definition. The maximum value of this index
is 0.69 (when the percentage of each category is the same) and the minimum value is 0 (when
there are only either men or women on the board).
Soft and hard laws that aim to improve gender diversity on boards, namely legislation known
as the Conthe Code of Good Governance approved in 2006 (soft law), the Spanish Equality
Law Act (hard law) approved in 2007 and the proposed European Commission Directive of
2012 (hard law not yet approved). These initiatives are considered by estimating two dummy
variables named CONTHELAW and DIRECTIVE. CONTHELAW takes value one from 2006
onwards and zero before that year as 2006 was the year that the Conthe Code was approved.
The variable DIRECTIVE takes value one from 2012 onwards and zero before as 2012 is the
year the proposal of the Directive was approved by the European Commission.
Firm governance variables include the number of directors (BSIZE) and the percentage of
proprietary (PDIRMAIN) and independent (PDIRINDP) directors. Firm characteristics
variables include: the industry adjusted firm market to book ratio (AVALUE) as an indicator
of firms’ market performance, the firm industry adjusted ROA profitability ratio (AROA), the
number of years since the foundation of the firm (AGE), the natural logarithm of the book
value of total assets as a measure of firm size (LASSETS), the firm’s leverage (LEV), a
dummy variable which measures if the firm belongs to a regulated industry (energy,
electricity, telecommunications and transport) (REGUL), and the numbers of years since the
first appointment of the CEO (CEOTENURE).
Labor directors’ characteristics variables refer to directors’ educational, professional and
international background. Directors’ level of educational attainment is measured by the
proportion of directors that hold at least a bachelor´s degree (PGRAD), a post-baccalaureate
degree (PMBA) or a PhD (PPHD), respectively. Directors’ professional experiences variables
include the proportion of director with work experience as senior manager in non-listed firms
15
(PSMNLF) or in listed firms (PSMLF), as CEO in non-listed firms (PCEONLF) or in listed
companies (PCEOLF), as Chairman or Chairwoman in non-listed firms (PCHAIRNLF) or in
listed firms (PCHAIRLF), as Professor (PPROF), as politician (PPOLIT), as civil servant
(PCIVIL) or as consultant or advisor (PCONSULT), respectively. Finally, director’s
international experience measured by the proportion of directors that hold, at least, an
undergraduate degree abroad (PINTERSTUDY) or have international labor experience
(PINTERJOB), respectively. Labor directors’ characteristics variables are defined for the
whole board of directors and for both women and men directors separately.
3.3.- Methodology
We first employ standard descriptive statistics, comparing the statistical significance of means
of the continuous and dummy variables related to board structure, gender diversity on boards
and labor directors’ characteristics for firms before and after the soft and hard laws that aim to
improve gender diversity on boards were approved using the non-parametric test Wilcoxon,
given that the Kolmogorov-Smirnov test reveals the non-normality of the continuous
variables, and the McNemar test for significant differences in dummy variables.
Next, we try to test the proposed hypotheses. In order to test Hypothesis 1, we analyse the
impact of the laws for promoting gender equality on the presence of women directors by
applying Probit models for dependent variable FEMEXIST and Tobit models for dependent
variables PERFEM, BLAU and SHANNON.
Thus, the panel-data maximum-likelihood Probit model is defined as follows:
𝐸[𝐹𝐸𝑀𝐸𝑋𝐼𝑆𝑇𝑖𝑡∗ |𝑋𝑖𝑡 , 𝑋𝑖𝑡−1] = 𝛼0 + 𝛽1𝑋𝑖𝑡 + 𝛽2𝑋𝑖𝑡−1 + 𝜀𝑖𝑡 (1)
Where 𝐹𝐸𝑀𝐸𝑋𝐼𝑆𝑇𝑖𝑡 reflects whether firm 𝑖 in the year 𝑡 has at least one female director, 𝑋𝑖𝑡
and 𝑋𝑖𝑡−1 denote the explanatory variables that relate to the hypothesis (CONTHELAW,
DIRECTIVE) and the control variables (board structure’s variables and variables that relate to

16
firms’ characteristics). Variables CONTHELAW, DIRECTIVE, AGE and REGUL are
estimated at year t, while variables PINDPDIR, PMAINDIR, BSIZE, LASSETS and LEV are
estimated at year t-1 in order to control for endogeneity problems.
For the continuous variable that measures the percentage of women directors on boards
(PERFEM) and the Blau and Shannon Index (BLAU; SHANNON), we estimate panel-data
Tobit models as follows:
𝐸[ 𝐺𝐷𝑖𝑡|𝑋𝑖𝑡 ,𝑋𝑖𝑡−1, 𝐺𝐷𝑖𝑡 > 0] = 𝛼0 + 𝛽1𝑋𝑖𝑡 + 𝛽2𝑋𝑖𝑡−1 + 𝜗𝜆𝑖𝑡 + 𝜀𝑖𝑡 (2)
Where 𝐺𝐷𝑖𝑡 is a vector of gender diversity continuous variables (PERFEM, BLAU,
SHANNON) of firm 𝑖 in the year 𝑡 and 𝜆𝑖𝑡 represents the inverse Mills ratio, the amount of
truncation (the higher λ, the higher the truncation). 𝑋𝑖𝑡 and 𝑋𝑖𝑡−1 are the same vectors of
independent variables used for the Probit model.
To test Hypothesis 2, we analyse how female director’ educational, professional and
international backgrounds may be affected by the approval of gender equality laws that relate
to the board of directors. As the aim is to analyse just women labour directors’ characteristics,
we apply the Heckman two-stage method to control for endogeneity bias of self-selection.
The Heckman two-stage method, one of the best solutions to eliminate the bias (Green, 1999;
Wooldridge, 2002), requires the identification of at least one variable that may be significant
in the selection equation but not in the regression equation (in our case, CEOTENURE), and
that most of the regressors in the regression equation are also included in the selection
equation.
In the first stage of the Heckman analysis, the selection equation is estimated as a maximum-
likelihood probit model for analysing the propensity to have a firm with female directors on
the board. In the second stage, the corrected regression equation is estimated by ordinary least
squares (OLS) regression defined as:
17
𝑃𝐶𝐻𝐴𝑅𝐴𝐶𝑖𝑡 = 𝛼0 + 𝛽1𝑋𝑖𝑡 + 𝛽2𝑋𝑖𝑡−1 + 𝜗𝜆𝑖𝑡 + 𝜀𝑖𝑡 (corrected regression equation) (3)
Where 𝑃𝐶𝐻𝐴𝑅𝐴𝐶𝑖𝑡 is a vector of women directors’ characteristics continuous variables
(PGRAD, PMBA, PPHD, PSMLF, PSMNLF, PCEOLF, PCEONLF, PCHAIRLF,
PCHAIRNLF, PPROF, PPOLITC, PCIVIL, PCONSULT, PINTERSTUDY and PINTERJOB)
of the firm 𝑖 in the year 𝑡, 𝑋𝑖𝑡 and 𝑋𝑖𝑡−1 denote the explanatory variables that relate to the
hypothesis (CONTHELAW and DIRECTIVE) and the control variables (those that refer to
board structure and firms’ characteristics). Variables CONTHELAW, DIRECTIVE, AGE and
REGUL are estimated at year t, while variables PINDPDIR, PMAINDIR, BSIZE, LASSETS
and LEV are estimated at year t-1 in order to control for endogeneity problems. The fact that
for female directors 𝑃𝐶𝐻𝐴𝑅𝐴𝐶𝑇𝐸𝑅𝐼𝑆𝑇𝐼𝐶𝑖𝑡 is observed only if 𝐹𝐸𝑀𝐸𝑋𝐼𝑆𝑇𝑖 = 1 may lead to
bias from self-selection. Thus the Heckman method controls for this bias by including the
Inverse Mills ratio (𝜆𝑖𝑡 ), as additional regressor in the regression equation that approximates
the likelihood of a company to have women directors on the board.
Finally, to test the impact of gender equality legislation on firm value, Hypothesis 3, we apply
the panel data Generalized Method of Moments (GMM) estimator proposed by Arellano and
Bond (1991). With this estimator, we control for endogeneity problems using a set of internal
instruments (the lags of the explanatory variables). The two step difference GMM model is
defined as follows:
𝐴𝑃𝐸𝑅𝐹𝑂𝑅𝑖𝑡 = 𝛽1𝑋𝑖𝑡 + 𝛽2𝑍𝑖𝑡 + 𝜀𝑖𝑡 (4)
Where 𝐴𝑃𝐸𝑅𝐹𝑂𝑅𝑀𝑖𝑡 are firm performance continuous variables (AVALUE and AROA) of
firm 𝑖 in the year 𝑡, 𝑋𝑖𝑡 denote the exogenous explanatory variables that relate to the
hypothesis and the control variables (CONTHELAW, DIRECTIVE, AGE and REGUL), 𝑍𝑖𝑡
denote potential endogenous explanatory variables (FEMEXIST, PERFEM, BLAU,
SHANNON, LASSETS and LEV) and 𝜀𝑖 represents the random error term.
18
It is worth noting that all panel data models employed in the analysis control for unobservable
heterogeneity decomposing the random error term 𝜀𝑖 into two parts: the combined effect (𝜇𝑖𝑡),
which depends on individual and time periods; and the individual effect (𝜂𝑖), which is the
characteristics of the company and is constant over time.
4.- Results.
4.1.- Descriptive statistics
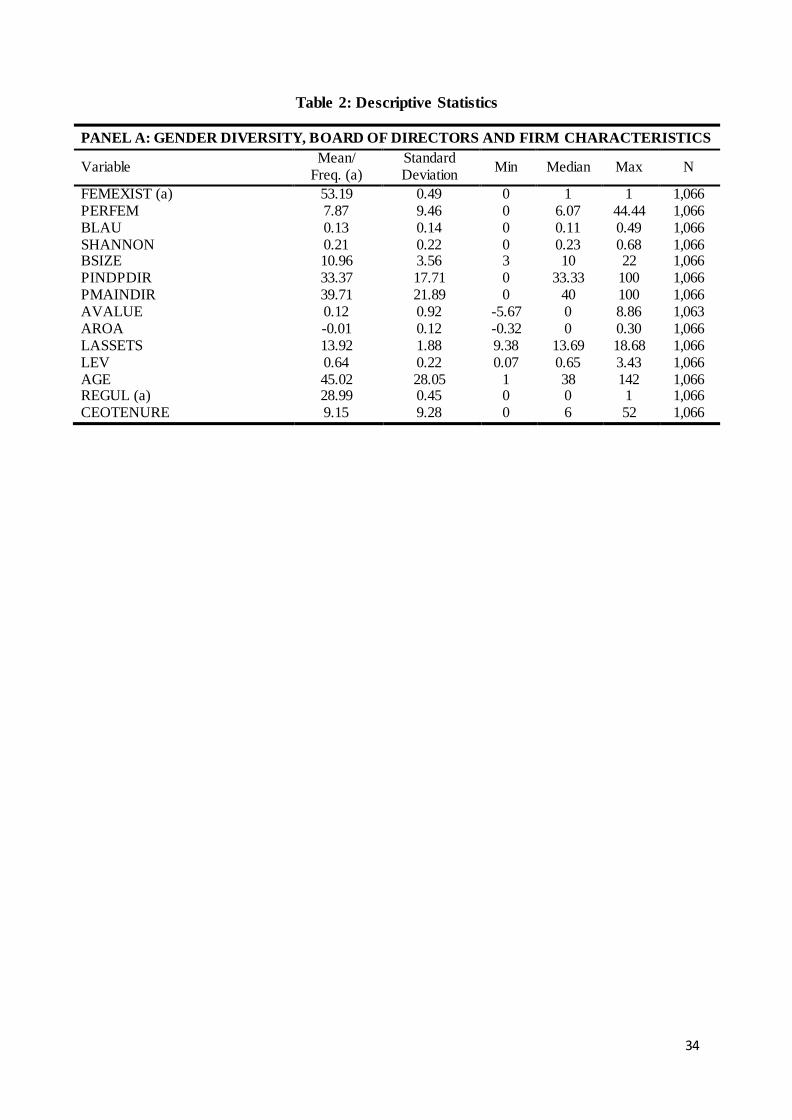
Table 2 presents the descriptive statistics for defined variables. Panel A shows descriptive
statistics for gender diversity, board structure and firm characteristics variables while Panel B
displays directors’ educational, professional and internationals backgrounds for women, men
and total directors as a whole.
- Insert Table 2 -
The analysis reveals that the percentage of female directors is on average 7.87 percent
(PERFEM) and 53.19 percent of firms have at least one woman on boards (FEMEXIST).
Boards are on average composed by 11 directors (BSIZE) belonging 33.37 percent of sits to
independent directors (PINDPDIR) and 39.71 percent to proprietary or shareholders
representative’s directors (PMAINDIR). Companies present on average higher market
performance (AVALUE) and lower profitability (AROA) than their industry. Firms show on
average 0.64 leverage ratio (LEV), they are on average 45 years old (AGE) and 28.99 percent
of firms belong to regulated sectors (REGUL).
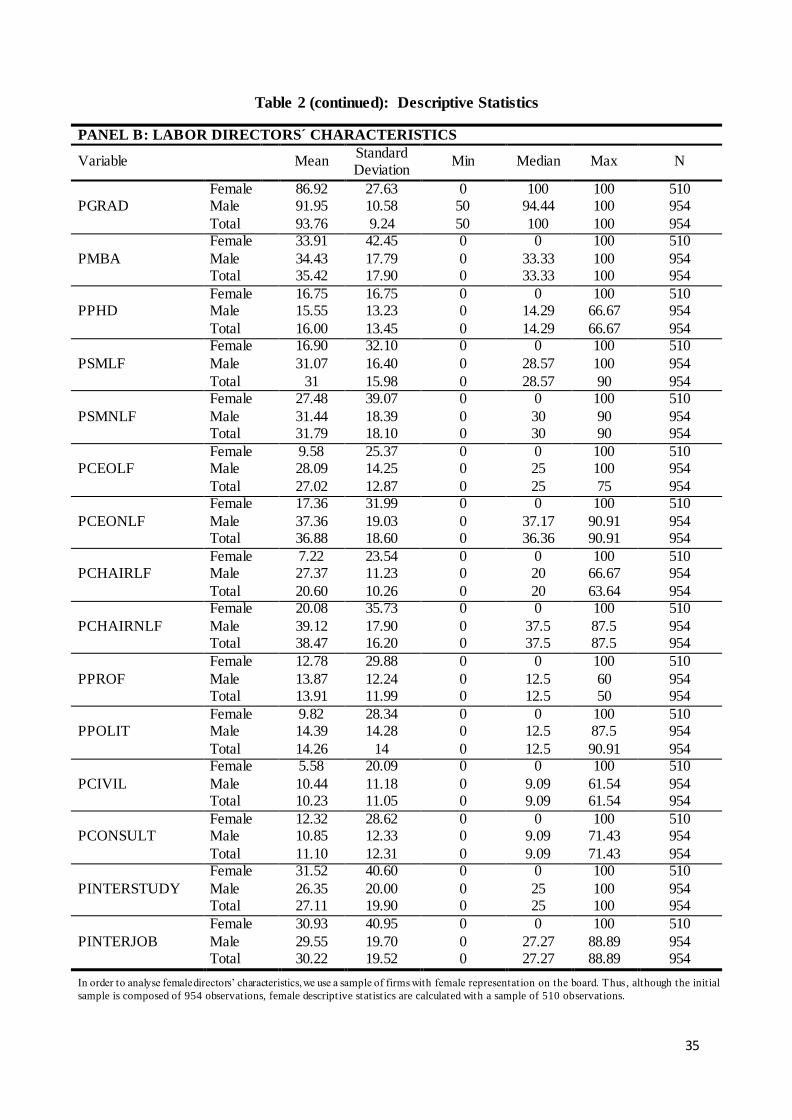
Regarding labor directors’ characteristics (Table 2; Panel B), 93.76 percent of total directors
hold at least a bachelor’s degree (PGRAD), 35.42 percent a post-baccalaureate degree
(PMBA), and 16 percent a PhD (PPHD). Among male directors the percentage of directors
holding at least a bachelor´s degree and a post-baccalaureate degree is larger than for female
directors’ subsample whereas the percentage of directors with a PhD is larger for women than
19
for men. With regard to directors’ executive experience, firms appoint to their boards people
with greater previous executive experience in non-listed firms than in listed firms. 31.79
percent of the board members have experience as senior managers (PSMNLF), 36.88 percent
as chief executive officers (CEONLF) and 38.47 percent as Chairmen or Chairwomen
(PCHAIRNLF) in non-listed companies compared with 31 percent (PSMLF), 27.02 percent
(CEOLF) and 20.60 percent (CHAIRLF) in listed firms. Male directors have greater previous
executive experience as senior managers, chief executive officers and Chairmen in both listed
and non-listed firms than female directors. The lowest difference between genders relates to
previous experience as senior managers in non-listed firms (PSMNLF) (27.48 percent versus
31.44 percent) and the largest to experience as Chairmen and Chairwomen of listed firms
(CHAIRLF) (7.22 percent versus 27.37 percent).
Regarding directors’ other professional backgrounds, 13.91 percent of board members present
previous experience as Professors (PPROF), 14.26 percent as politicians (PPOLIT), 10.23
percent as civil servants (PCIVIL) and 11.10 percent as consultants (PCONSULT).
Differences in non-business experiences between women and men directors are smaller
compared to gender differences in executive experience although male directors have also
more experience than women directors as Professors (12.78 percent versus 13.87 percent),
politicians (9.82 percent versus 14.39 percent) and civil servants (5.58 percent versus 10.44
percent). Only the percentage of directors with previous experience as consultants
(PCONSULT) is larger among women directors (12.32 percent) than among men board
members (10.85 percent).
As for directors’ international experience, percentage of board members with both
international studies (PINTERSTUDY) and international labor experience (PINTERJOB) is
greater for women directors than for male directors. 31.52 percent of women directors hold at
20
least an undergraduate degree abroad and 30.93 percent have international work experience
compared with just 26.35 percent and 29.55 percent, respectively, of male directors.
4.2. Mean difference analyses
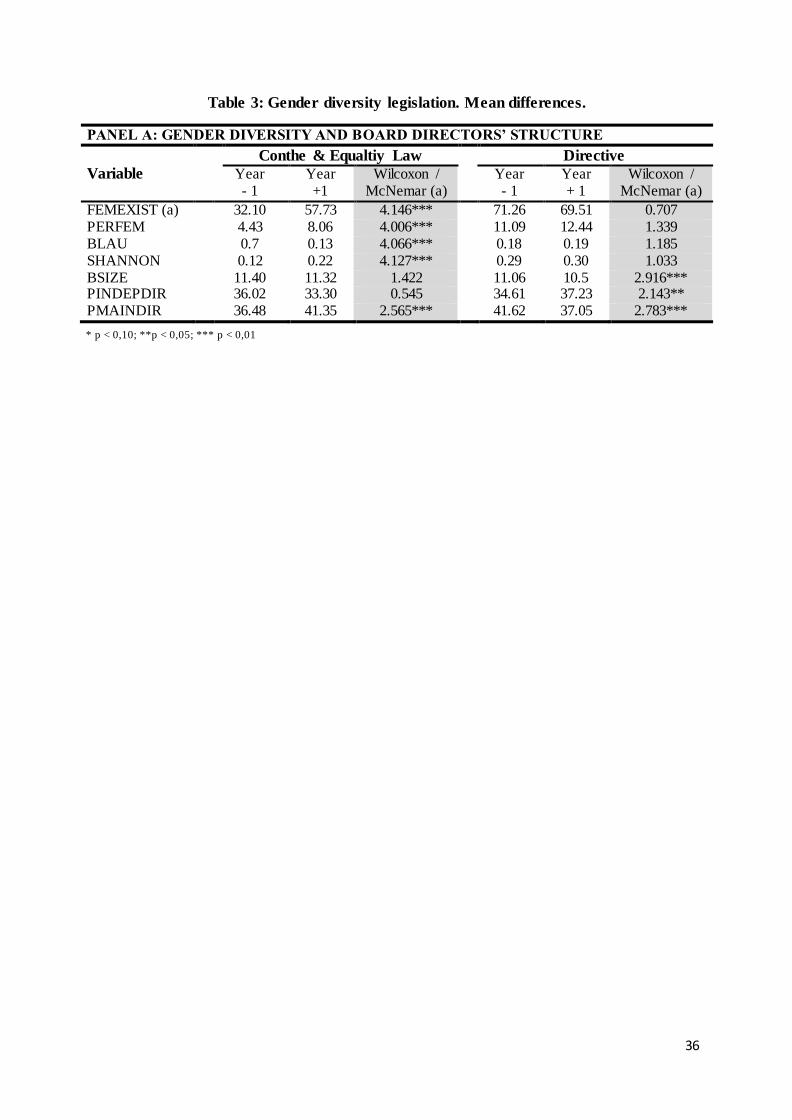
Table 3 presents mean differences of gender diversity and board of directors’ structure (Panel
A) and directors’ labour characteristics variables (Panel B) one year before (year - 1) and one
year after (year + 1) the approval of legislation that promotes gender diversity on board, that
is, we compare year 2005 versus year 2008 in order to analyse the joint effect of the
implementation of the Conthe Code (2006) and of the approval of the Equality Law (2007)
and, on the other hand, year 2011 with year 2013 to measure the impact of the proposal of the
Directive (2012).
- Insert Table 3 -
The Conthe Code and the Equality Law have a positive and significant impact in all gender
diversity variables. The percentage of firms with at least one woman director (PERFEM)
increases from 32.10 percent in 2005 to 57.73 percent in 2008; the percentage of women
directors (PERFEM) shows also a significant increase from 4.43 in 2005 to 8.06 in 2008,
likewise dothe Blau and Shannon Indexes (BLAU and SHANNON). This increase does not
carry with an increase in board size. Board size (BSIZE) has not been affected by Spanish soft
and hard laws whereas the percentage of proprietary directors (PMAINDIR) increases from
36.48 percent to 41.35 percent. The percentage of women directors also increases and gender
diversity indexes improve from 2011 to 2013, but the proposal of the Directive approved in
2012 has no significant impact on gender diversity.
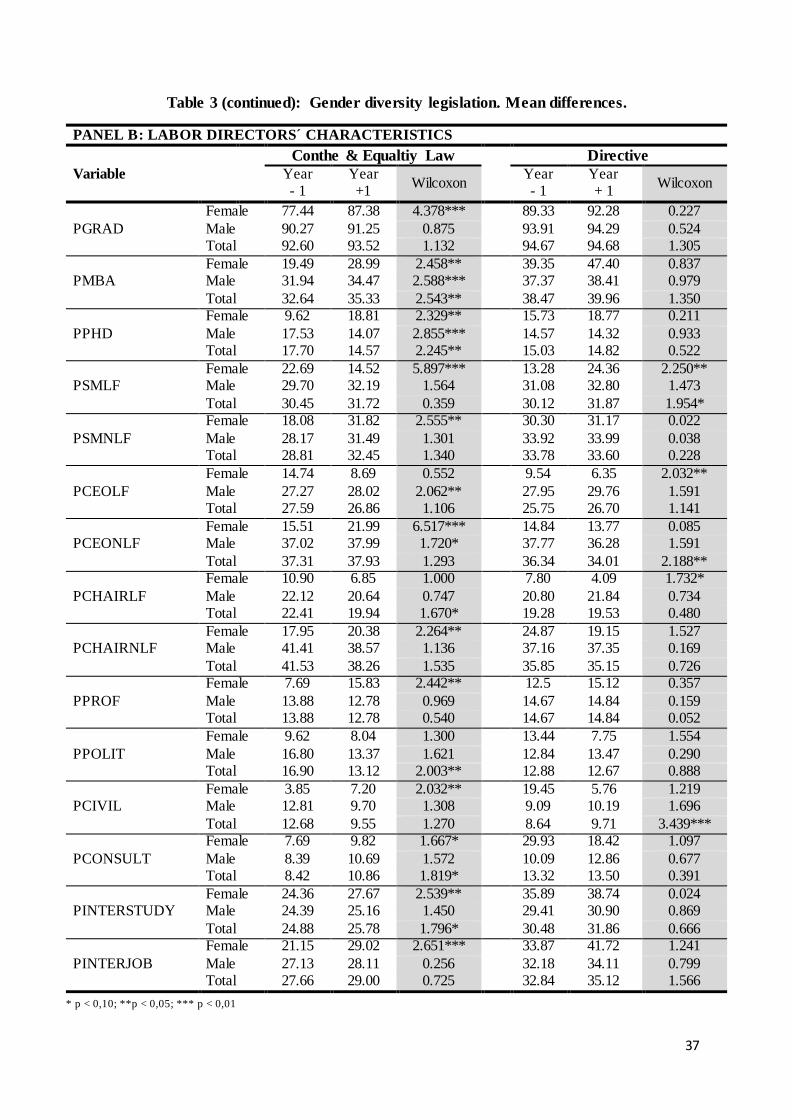
With respect to professional background (Table 3; Panel B), no law has, as general rule, a
significant impact on board directors’ characteristics considering the board as a whole. The
same applies when just considering the subsample of male directors. As observed in Table 3,
21
the results just reveal a positive and significant impact of the Conthe Code and the Equality
Law on the percentage of directors (male and total directors) who hold at least a post-
baccalaureate degree (PMBA), on the percentage of total directors with international studies
(PINTERSUTY), on the percentage of total directors with previous experience as consultants
(PCONSULT) and on the percentage of male directors who have expertise as chief executive
officers in listed firms (CEOLF). On the contrary the percentage of male directors and total
directors with a PhD falls significantly after the approval of laws and the percentage of total
directors with previous experience as Chairmen or Chairwoman in listed firms (CHAIRLF)
and as politicians (PPOLIT). But, for the sub-sample of women directors, Spanish soft and
hard legislation has a highly significant and positive impact in several women educational,
professional and international characteristics. In fact, the percentage of women with at least a
bachelor degree (PGRAD), a post-baccalaureate degree (PMBA) and a PhD (PPHD increases
significantly from 2005 to 2008. This result is line with Ahern and Dittmar (2012) and
Bertrand et al., (2014) findings. In the same vein, the percentage of women directors with
both international studies (PINTERSTUDY) and international labor experience (PINTERJOB),
with non-executive backgrounds as professors (PPROF), politicians (PPOLIT), civil servants
(PCIVIL) and consultants (PCONSULT) rises with the approval of the Conthe Code and the
Equality Law. Regarding women directors’ executive experience, soft and hard laws have
negative impact on the percentage of female directors holding previous experience in
executive positions in listed firms, namely, as seniors managers, chief executive officers and
Chairwomen (PSMLF, PCEOLF and PCHAIRLF), although the decrease is only significant
for the percentage of women directors with experience as senior managers in listed firms
(PSMLF). Contradicting, Ahern and Dittmar (2012) results, the percentage of women
directors with previous experience as executives of non-listed firms increases after the
approval of the laws (PSMNLF, PCEONLF and PCHAIRNLF).
22
The results just show a smooth impact of the proposal of Directive on labor directors’
characteristics for both male, women subsamples and for the board as a whole. The proposal
of the EU Directive has a positive and significant effect on the percentage of total directors
with executive experience as senior managers of listed firms (PSMLF) and with expertise as
civil servants (PCIVIL), whereas it impacts negatively the percentage of total directors with
previous experience as CEO of non-listed companies (PCEONLF). Male directors’
educational, professional and international backgrounds remain unchanged while for women
directors only their executive experience in listed firms is subject to significant changes.
Thus, the percentage of women directors with experience as chief executive officers
(PCEOLF) and Chairwomen (PCHAIRLF) decreases from 2011 to 2013, while he percentage
of female directors who have experience as senior managers in listed firms (PSMLF) rises
from 13.28 percent in 2011 to 24.36 percent in 2013.
It is worth noting that results for women directors’ labor characteristics should be interpreted
with caution as the methodology employed, Wilcoxon test, only considers firms with women
presence in the board in both time periods compared (2005 and 2008 for the Conthe Code and
the Equality Law; and 2011 and 2013 for the proposal of Directive). Thus, firms which have
been listed on the stock exchange or have appointed the first woman to the board during the
period of study are excluded from the test. The latter is of particular importance as the
percentage of companies with female representation on boards has changed significantly since
2005 (Table 3; Panel A; PERFEM).
4.3.- Impact of gender diversity legislation on women presence on boards.
To test our Hypothesis 1, we analyse how gender diversity on board is affected by the Conthe
Code of Good Governance approved in 2006, the Spanish Equality Law Act approved in 2007
and the proposed European Commission Directive of 2012. Table 4 summarizes the result of
the regression models. We consider a set of alternative gender diversity variables as
23
dependent variables: the presence of female directors (FEMEXIST; Reg. 1), the percentage of
women directors (PERFEM; Reg. 2), the Blau diversity index (BLAU; Reg. 3) and the
Shannon diversity index (SHANNON; Reg. 4)
- Insert Table 4 -
Our results show that legislation aimed at increasing female board representation has in fact a
positive impact on gender diversity. This result supports Hypothesis 1. Specifically, the
approval of the Conthe Code and the Equality Law Act (CONTHELAW) increase the
likelihood that a company will have a woman director to a 81.83 percent whereas the
proposed Directive (DIRECTIVE) increase the likelihood of women being on board to a lesser
extent (19.33 percent).
Thus, Spanish laws and the proposal of EU Directive increase both the likelihood of women
being on boards and the percentage of female directors and improve the Blau and the Shannon
diversity indexes. Nevertheless, the results show that the impact of the proposed EU Directive
on gender diversity on boards is much lower and smoother than the effect of national laws.
The threat of a law does not seem to have an ample effect on the incorporation of women on
boards. As for the control variables, gender diversity is positively affected by the size of the
board (BSIZE) and the higher the percentage of independent directors (PINDPDIR), the
higher the greater the likelihood of having a woman director and the better gender diversity
on boards.
4.4.- Impact of gender diversity legislation on women profiles.
In order to test Hypotheses 2a, 2b and 2c, we analyze how women directors’ educational and
professional background may be affected by promoting gender diversity laws. Table 5
summarizes the results of the second step of the Heckman regression models related to female
educational (Reg. 1 to Reg. 3) and executive experience (Reg. 4 to Reg. 9).
24
- Insert Table 5 -
Regarding educational background, the results show a positive effect of the proposal of
Directive (DIRECTIVE) on the percentage of women directors holding at least a post-
baccalaureate degree (Reg. 2) and of the Conthe Code and the Equality Law (CONTHELAW)
on the percentage of females with a PhD (Reg. 3). Although there is no impact on the
percentage of women directors who hold at least a bachelor degree (Reg.1), these results are
in line with Ahern and Dittman, (2012) and Bertrand et al., (2014) who find that quota laws
increase the educational levels of women directors. Laws that aim to promote women to board
positions lead to the appointment of women with higher educational attainments than existing
women directors. With regards to women executive experience, in line with the mean
differences analysis (Table 3; Panel B), even though the percentage of women directors with
previous experience as senior managers, chief executives officers and Chairwomen decreases
after the approval of the Conthe Code and the Equality law (CONTHELAW), there does not
exist a negative and significant effect of laws on the percentage of women with the mentioned
attributes (Reg. 4; Reg. 6 and Reg. 8). However, the positive and significant effect of the
proposal of Directive (DIRECTIVE) on the percentage of women directors with previous
experience as senior managers of listed firms revealed for the mean differences analysis is
also observed in the regression models (Reg. 4). Additionally, the Conthe Law and the
Equality Law (CONTHELAW) impact positively the percentage of women with experience as
chief executive officers of non-listed firms (Reg. 7), which also reinforces previous results.
Just like for educational and executive attributes, in Table 6 we report the results of the
second step of the Heckman regression models related to female non-business professional
background (Reg. 1 to Reg. 4) and international experience (Reg. 5 and Reg. 6).
- Insert Table 6 -
25
Results reveal that the approval of the Conthe Code and the Equality Law (CONTHELAW)
increase the percentage of women directors coming from professorships (Reg. 1), from
political careers (Reg. 2) and from consulting (Reg. 4). These results are in line with those
reported by Dang et al. (2014); Hillman, et al. (2002); Simpson et al. (2010). They show that
women are more likely to come from non-business sectors (academia, politics, public sector,
etc.) or business-related sectors (consultancy, banking, law…). Legislation that promotes
women presence on boards increases the percentage of women with aforementioned
backgrounds. Finally, the analyses reveal that both Spanish and European laws promoting
gender equality (CONTHELAW and DIRECTIVE) affect positively the degree of
internationalization of women directors (Reg. 6). Altogether, our results seem to indicate that
gender diversity legislation enhances women directors’ educational, international and non-
business and business-related professional experience whereas it does not affect their
executive experience as general rule, though in some specific cases (CEO in non-listed firms
and senior managers in listed firms) the influence is positive.
4.5.- Impact of gender diversity legislation on firm value and performance.
To test Hypothesis 3, we analyze how firm performance is affected by the soft and hard laws
that aim to improve gender diversity on boards of directors and by gender diversity on boards
itself. Table 7 summarizes the results of the Generalized Method of Moments regression
models. Models 1 to 4 consider the industry adjusted firm market to book ratio as dependent
variable (AVALUE) and Models 5 to 8 the firm industry adjusted ROA (AROA).
- Insert Table 7 -
The results of the models vary when considering market or accounting performance, and
therefore, must be taken with caution. The results of Models 1 to 4 suggest that the Conthe
Code and the Equality Law (CONTHELAW) have a positive impact on the firms’ market
26
value whereas the proposal of Directive (DIRECTIVE) does not influence firms’ value. The
positive impact of the Code and the Equality Law on firms’ market value may be linked to the
improvement of the professional profile of female directors. Overall, women labor directors’
characteristics improve after 2006 (Tables 3, 5 and 6). But, overall, the presence of women
directors (PERFEM), the percentage of women directors (PERFEM) and both diversity
indexes (BLAU and SHANNON) decrease firms’ market value. This result may be explained
through be a consequence of the professional profile of female directors with regard to male
directors one since women directors’ attributes are still lower that men directors’ ones.
Nevertheless, we must note that when we consider an accounting ratio as a measure of
performance (AROA), the results (Models 5 to 8) do not show any influence of the promoting
gender diversity laws (CONTHELAW and DIRECTIVE) on firm performance; the results do
not support that gender diversity itself (FEMEXIST, PERFEM, BLAU and SHANNON)
decreases family firm performance, Summing up, overall these results, similarly to Ahern and
Dittman, (2012) and Bertrand et al., (2014), do not support a positive influence of female
directors on firm performance.
4.6.- Robustness checks
Although they are not shown, we repeated our estimations considering additional measures
and models. First, we estimated all the models using, instead of LASSETS, the natural
logarithm of value of total sales (LSALES) as an alternative measure of firm size. The results
were similar. Second we estimated the models reported in Tables 4, 5 and 6 including as
additional control variables two measures of firm performance: the industry-adjusted market
value to book value ratio (AVALUE) and the industry-adjusted return on assets ratio (AROA).
The results did not change. Third, for the models included in Tables 5 and 6, we considered
alternative measures of directors’ attributes: a variable that refers to directors’ educational
attainment in general (PUNIVERSITY); a variable related to directors’ international
27
background as a whole, whether linked to studies or to labor experience (PINTER); and a set
of variables that identify directors’ professional experience: whether they have worked as a
senior manager in listed or non-listed firms (PSM), as CEO in public or private firms (PCEO);
as Chairman or Chairwoman in listed or non-listed companies (PCHAIR); as senior manager,
CEO, Chairman or Chairwoman in listed firms. The results did not change. Finally, we ran
mean test analyses (Wilcoxon and McNemar tests) for the principal and alternative measures
of labor directors’ characteristics. The results and findings remained unchanged.
5.- Conclusions.
This article analyses the consequences of legislation that aims to promote women to the
boardroom. In particular, we study how directors’ human capital attributes, specifically
female director’ educational and professional backgrounds, may be affected by the approval
(and threat) of soft and hard laws.
For a country, Spain, that has approved both quotas (hard law) and Corporate Governance
Codes that recommend women presence on boards (soft law) and as a member of EU-28 is
affected by the proposal of EU Directive about female presence on boards (threat of hard
law), we analyse how gender diversity on boards’ laws may impact female presence on
boards, women directors’ human capital attributes, and firm performance. Our results reveal
that soft legislation and gender quotas increase gender diversity on boards, although, probably
because of the lack of punishment, targets have not been reached. New women directors’
show higher educational levels and international backgrounds and the percentage of women
directors coming from non-business related sectors (professorships, politics and consultancy)
increases significantly. Additionally, laws positively influence women directors previous
executive experience, specifically, the percentage of women with executive experience as
chief executive experience in non-listed firms and senior managers in listed firms has
increased significantly increase. Overall, women attributes seem to improve with the approval
28
of soft and hard legislation or remain unchanged. Besides, the approval of a Code of Good
Governance that includes gender equality recommendations and of the Equality Law has a
positive impact on the firms’ market value, but overall the presence of women directors on
boards decreases firms’ performance. This negative impact may be due to the fact that women
directors’ labor attributes are still poorer, with very few exceptions, than their male
counterparts.
We are aware of different limitations of the study: the database only refers to one country, and
results may not be the same for different institutional contexts; and our data is not able to
capture the field of the tertiary education for all the observations, and therefore, for example,
we do not analyze the influence of business related and non-business related degrees.
Future research could explore the impact of soft and hard legislation on gender diversity,
directors’ attributes and firm performance considering firms’ ownership characteristics,
analyzing possible differential effect between family and non-family firms. In addition future
studies could explore not only the impact on gender diversity, directors’ human capital
attributes and firm performance, but also on firms’ strategies and gender-specific actions,
such as, the access of women to top management positions or the percentage of women in
senior management positions. All these issues are also worth studying in different institutional
settings.
29
REFERENCES
Adams, R. B., and Ferreira, D. 2009. “Women in the boardroom and their impact on
governance and performance”. Journal of Financial Economics, 94 (2): 291-309
Adams, R. B. and Funk, P. 2012. “Beyond the glass ceiling: Does gender matter?”
Management Science, 58: 219-235
Adams, R., and Mehran, H. 2003. “Is corporate governance different for bank holding
companies”, Economic Policy Review, 9: 123-142.
Ahern, K. R. and Dittmar, A. K. 2012. “The changing of the boards: The impact on firms
valuation of mandated female board representation”, Quarterly Journal of Economics, 127
(1): 137-197
Arellano, M., and Bond, S. 1991. “Some tests of specification for panel data: Monte Carlo
evidence and an application to employment equations”. Review of Economic Studies, 58: 277–
297
Anderson R. C., Reeb, D. M., Upadhyay, A. and Zhao, W. 2011. “The economics of director
heterogeneity”, Financial Management, 40: 50-38
Armstrong, J. and Walby, S. 2012. Gender Quotas in management boards. Brussels:
European Parliament
Becker, G. 1957. The economics of discrimination, 2nd ed. Chicago, IL: University of
Chicago Press.
Becker, G. S. 1962. “Investment in human capital: A theoretical analysis”. Journal of
Political Economy 70 (5): 9–49.
Becker, G. 1964. Human Capital, 2nd edn. Columbia University Press, New York.
Bertrand, M., Black, S. E., Jensen, S. and Lleras-Muney, A. 2014. “Breaking the Glass
Ceiling? The Effect of Board Quotas on Female Labor Market Outcomes in Norway”, NHH
Dept. of Economics Discussion Paper No. 28/2014. Available at SSRN:
https://ssrn.com/abstract=2488955.
Bilimoria, D. and Piderit, S. 1994. “Board committee membership: Effects of sex-based bias”.
Academy of Management Journal 37(6), 1453–1477.
Blau, P. M. 1977. Inequality and heterogeneity: A primitive theory of social structure. New
York: Free Press.
Bøhren, Ø. and Staubo, S. 2015. “Mandatory Gender Balance and Board Independence”,
European Financial Management, 22 (1): 3-30.
Bøhren, Ø. and Strøm, R. Ø. 2005. “Aligned, informed, and decisive: Characteristics of
value-creating boards”. Working Paper, Norwegian School of Management BI, Oslo.
Campbell, K., and Mínguez-Vera, A. 2008. “Gender diversity in the boardroom and firm
financial performance”, Journal of Business Ethics, 83 (3): 435-451.
30
Campbell, K., and Mínguez-Vera, A. 2010. “Female board appointments and firm valuation:
short and long term effect”, Journal of Management and Governance, 14: 37-59.
Carter, D. A., Simkins, B., and Simpson, G. 2003. “Corporate governance, board diversity,
and firm value”, Financial Review, 38: 33–53.
Carter, D. A. D’ Souza, F., Simkins, B. J. and Simpson, W. P. 2010. “The gender and ethnic
diversity of US boards and board committees and firm financial performance”. Corporate
Governance: An International Review, 18 (5): 396-414
Credit Suisse, 2016. The CS Gender 3000: The Reward for Change. Zurich: Publisher Credit
Suisse AG Research Institute.
Dang, R., Bender, A. F., and Scotto, M. J. 2014. “Women on French corporate board of
directors: How do they differ from their male counterparts?”, Journal of Applied Business
Research 30 (2): 489-507
Dunn, P. 2012. “Breaking the boardroom gender barrier: The human capital of female
corporate directors”, Journal of Management and Governance, 16 (4): 557–570
European Commission 2012. Women in economic decision-making in the EU: Progress
report. Luxembourg: Publications Office of the European Union.
European Parliament, 2017. Legislative Train Schedule, Area of Justice and Fundamental
Rights, Gender Balance on Boards. Retrieved January 08, 2018, from
http://www.europarl.europa.eu/legislative-train/theme-area-of-justice-and-fundamental-
rights/file-gender-balance-on-boards/12-2017
Erhardt, A., Niclas, L., James, D., Werbel, C., and Shrader, B. 2003. “Board of director’s
diversity and firm financial performance”. Corporate Governance: An International Review,
11 (2): 102-111.
Farrell, K. A., and Hersch, P. L. 2005. “Additions to corporate boards: The effect of gender”,
Journal of Corporate Finance, 11 (1-2): 85-106.
Gabaldon, P., de Anca, C., Mateos de Cabo, R., and Gimeno, R. 2016. “Searching for women
on boards: An Analysis from the supply and demand perspective”, Corporate Governance:
An International Review, 24 (3): 371-385
Gómez-Ansón, S. 2012. “Women on Boards of EU companies: present and future”, In C.
Fagan, M. Gutiérrez y S. Gómez Ansón, ed., Women on corporate boards and in elite
management: European trends and policy, Palgrave McMillan.
Greene, W. H. 1999. Análisis Económico. Madrid: Prentice Hall Iberia
Grosvold, J. and Brammer, S. 2011. “National institutional systems as antecedents of female
board representation: an empirical study”. Corporate Governance: An International Review,
19 (2): 116-135
Hillman, A. J., Cannella, A. A., Jr. and Harris, I. C. 2002, “Women and racial minorities in
the boardroom: How do directors differ?” Journal of Management, 28(6): 747–63.
31
Hillman, A. J., Cannella, A. A., Paetzold, R. L. 2000. “The resource dependency role of
corporate directors: Strategy adoption of board composition in response to environmental
change”. Journal of Management Studies, 37 (2): 235-255.
Jensen, M. C., and Meckling, W. H. 1976. “Theory of the firm: managerial behaviour, agency
costs and ownership structure”, Journal of Financial Economics, 3 (4): 305-360.
Kirsch, A. 2017. “The gender composition of corporate boards: A review and research
agenda”, The Leadership Quarterly (in press) https://doi.org/10.1016/j.leaqua.2017.06.001
Kotiranta, A., Kovalainen, A., and Rouvinen, P. 2007. “Female Leadership and Firm
Profitability”, Finnish Business and Policy Forum, EVA Analysis.
Labelle, R., Francoeur, C. and Lakhal, F. 2015. “To regulate or not to regulate? Early
evidence on the means used around the world to promote gender diversity in the boardroom?”
Gender, Work and Organization, 22 (4): 339-363.
Lee, L-E., Marshall, R., Rallis, D. and Moscardi, M. 2015. “Women on Boards: Global
Trends in Gender Diversity on Corporate Boards” MSCI ESG Research Inc. Available at:
https://www.msci.com/documents/10199/04b6f646-d638-4878-9c61-4eb91748a82b
Macey J. R., and O’Hara, M. 2003. “The corporate governance of banks”, Economic Policy
Review, 9 (1): 91-107.
Matsa, D. A., and Miller, A. R. 2013. “A female style in corporate leadership? Evidence from
quotas”, American Economic Journal: Applied Economics, 5(3): 136-169.
Mínguez-Vera, A., and López-Martínez R. 2010. “Female directors and SMEs: An empirical
analysis”, Journal of Global Strategic Management, 8: 34-46.
Nygaard, K. 2011. “Forced board changes: evidence from Norway”. Working paper series,
Norwegian School of Economics
Pande, R., and Ford, D. 2011. “Gender quotas and female leadership: A review”. Working
paper. Washington, DC: World Bank.
Pfeffer, J. 1972. “Size and composition of corporate boards of directors: The organization and
its environment”, Administrative Science Quarterly, 17 (2): 218-228.
Pfeffer, J., and Salancik, G. R. 1978. The external control of organizations: A resource
dependence Perspective. New York: Harper & Row.
Pletzer, J. L., Nikolova, R., Kedzior, K. K. and & Voelpel, S. 2015. “Does Gender Matter?
Females on Corporate Boards and Firm Financial Performance - A Meta-Analysis”. PLoS
One, 10(6): e0130005.
Prowse, S. 1997. “Corporate Control in Commercial Banks”, Journal of Financial Research,
20 (4): 509-527.
Ragins, B. R., Townsend, B., and Mattis, M. 1998. “Gender gap in the executive suite: CEOs
and female executives report on breaking the glass ceiling”, The Academy of Management
Executive, 12: 28-42
32
Rose, C. 2007. “Does female board representation influence firm performance? The Danish
evidence”, Corporate Governance: An International Review, 15 (29): 404-413.
Ryan, M. K., and Haslam, S. A. 2005. “The glass cliff: Evidence that women are
overrepresented in precarious leadership positions”. British Journal of Management, 16: 81-
90.
Shannon, C. E. 1948. “A mathematical theory of communication”, Bell System Technical
Journal, 27: 379-423.
Simpson, E. H. 1949. “Measurement of diversity”, Nature, 163: 688.
Simpson, W. G., Carter, D. A., and D'Souza, F. 2010. “What do we know about women on
corporate boards?” Journal of Applied Finance, 20 (2): 27-39.
Singh, V., Terjesen, S., and Vinnicombe, S. 2008. “Newly appointed directors in the
boardroom: How do women and men differ?” European Management Journal, 26, 48-58
Solimene, S., Coluccia, D., and Fontana, S. 2017. “Gender diversity on corporate boards: an
empirical investigation of Italian listed companies”, Palgrave Communications 3, nº 16109
Stoney, C., and Winstanley, D. 2001. “Stakeholding: Confusion or utopia? Mapping the
conceptual terrain”, Journal of Management Studies, 38 (5): 603-626.
Storvik, A., and Teigen, M. 2010. “Women on board: The Norwegian experience”. Friedrich-
Ebert-Foundation, Berlin. Available at: http://library.fes.de/pdf-files/id/ipa/07309.pdf
Sweigart, A. 2012. “Women on board for change: The Norway model of boardroom quotas as
a tool for progress in the United States and Canada”, Northwestern Journal of International
Law & Business, 32(4): 80-105 (A).
Tajfel, H. 1972. “La catégorisation sociale”. In S. Moscovici (Ed.) Introduction à la
Pshychologie Sociale, Vol. 1: 272-302. Paris: Larousse.
Terjesen, S., Aguilera R.V., and Lorenz, R. 2015 “Legislating a woman’s seat on the board:
Institutional factors driving gender quotas for boards of directors”, Journal of Business Ethics,
128 (2): 233-251.
Terjesen, S. and Sealy, R. 2016. “Board gender quotas: Exploring ethical tensions from a
multi-theoretical perspective”. Business Ethics Quarterly, 26 (1): 23-65.
Terjesen, S., Sealy, R., and Singh, V. 2009. “Women directors on corporate boards: A review
and research agenda”, Corporate Governance: An International Review, 17: 320-337
Wiener, N. 1961. Cybernetics or control and communication in the animal and the machine,
Cambridge: MIT Press.
Williamson, O. 1988. “Corporate Finance and Corporate Governance”, The Journal of
Finance, 43(3): 567-591.
Wooldridge, J. 2002. Econometric analysis of cross section and panel data. Cambridge, MA:
MIT Press

33
Table 1: Variables
Variables Description
Gender Diversity
FEMEXIST Dummy variable that equals 1 if there is at least a female director at the board and 0 otherwise.
PERFEM Percentage of female directors at the board.
BLAU Blau Index = 1 − ∑ 𝑃𝑖2𝑛
𝑖=1 where𝑃𝑖 is the percentage of director of each sex.
SHANNON Blau Shannon = − ∑ 𝑃𝑖 ln 𝑃𝑖 𝑛𝑖 =1 where𝑃𝑖 is the percentage of director of each sex.
CONTHELAW Dummy variable that equals to 1 from 2006 onwards and 0 otherwise.
DIRECTIVE Dummy variable that equals to 1 from 2012 onwards and 0 otherwise. Board of directors
BSIZE Number of board directors
PINDPDIR Proportion of independent directors . Independent directors are non-executive directors who do not
have any kind of relationship with the company or significant shareholders.
PMAINDIR Proportion of proprietary directors . Proprietary directors are non-executive directors who
represent significant shareholders on the board. Firs characteristics
AVALUE
Firm industry-adjusted market value to book value ratio defined as: firm market value or
capitalization plus the book value of debt divided by the book value of total assets for each firm
and year minus the industry median each year.
AROA Firm industry-adjusted return on assets defined as: operating income over total assets for each
firm and year minus the industry median each year.
AGE Firm age defined as the number of years since the foundation of the firm up to the reference year.
LASSETS Natural logarithm of the book value of total assets in thousands of euros.
LEV Leverage defined as: book value of total debt/book value of total assets
REGUL Dummy variable that adopts the value of one if the firm belongs to a regulated industry (energy,
electricity, telecommunications and transport) and zero otherwise.
CEOTENURE Number of years since the first appointment of the CEO up to the reference year. Labor directors’ characteristics
PGRAD Proportion of directors that hold at least a bachelor’s degree. Defined for women, men and total
directors.
PMBA Proportion of directors that hold at least post-baccalaureate degree. Defined for women, men and
total directors.
PPHD Proportion of directors that hold at least a PhD. Defined for women, men and total directors.
PSMNLF Proportion of directors that have work experience as senior manager in listed firms. Defined for
women, men and total directors.
PSMLF Proportion of directors that have work experience as senior manager in non -listed firms. Defined
for women, men and total directors.
PCEONLF Proportion of directors that have work experience as CEO in listed firms. Defined for women,
men and total directors.
PCEOLF Proportion of directors that have work experience as CEO in non-listed firms. Defined for
women, men and total directors.
PCHAIRNLF Proportion of directors that have work experience as Chairman or Chairwoman in listed firms.
Defined for women, men and total directors.
PCHAIRLF Proportion of directors that have work experience as Chairman or Chairwoman in non-listed
firms. Defined for women, men and total directors. Defined for women, men and total directors.
PPROF Proportion of directors that have work experience as Professor. Defined for women, men and total
directors.
PPOLIT Proportion of directors that have work experience as politician. Defined for women, men and total
directors.
PCIVIL Proportion of directors that have work experience as civil servant. Defined for women, men and
total directors.
PCONSULT Proportion of director that have work experience as consultant. Defined for women, men and total
directors
PINTERSTUDY Proportion of directors that hold at least a bachelor´s degree abroad. Defined for women, men and
total directors.
PINTERJOB Proportion of directors that have work international experience. Defined for women, men and
total directors.
34
Table 2: Descriptive Statistics
PANEL A: GENDER DIVERSITY, BOARD OF DIRECTORS AND FIRM CHARACTERISTICS
Variable Mean/
Freq. (a) Standard Deviation
Min Median Max N
FEMEXIST (a) 53.19 0.49 0 1 1 1,066 PERFEM 7.87 9.46 0 6.07 44.44 1,066 BLAU 0.13 0.14 0 0.11 0.49 1,066 SHANNON 0.21 0.22 0 0.23 0.68 1,066 BSIZE 10.96 3.56 3 10 22 1,066 PINDPDIR 33.37 17.71 0 33.33 100 1,066 PMAINDIR 39.71 21.89 0 40 100 1,066 AVALUE 0.12 0.92 -5.67 0 8.86 1,063 AROA -0.01 0.12 -0.32 0 0.30 1,066 LASSETS 13.92 1.88 9.38 13.69 18.68 1,066 LEV 0.64 0.22 0.07 0.65 3.43 1,066 AGE 45.02 28.05 1 38 142 1,066 REGUL (a) 28.99 0.45 0 0 1 1,066 CEOTENURE 9.15 9.28 0 6 52 1,066
35
Table 2 (continued): Descriptive Statistics
PANEL B: LABOR DIRECTORS´ CHARACTERISTICS
Variable Mean Standard Deviation
Min Median Max N
PGRAD Female 86.92 27.63 0 100 100 510 Male 91.95 10.58 50 94.44 100 954
Total 93.76 9.24 50 100 100 954
PMBA
Female 33.91 42.45 0 0 100 510
Male 34.43 17.79 0 33.33 100 954 Total 35.42 17.90 0 33.33 100 954
PPHD Female 16.75 16.75 0 0 100 510 Male 15.55 13.23 0 14.29 66.67 954
Total 16.00 13.45 0 14.29 66.67 954
PSMLF
Female 16.90 32.10 0 0 100 510
Male 31.07 16.40 0 28.57 100 954
Total 31 15.98 0 28.57 90 954
PSMNLF
Female 27.48 39.07 0 0 100 510
Male 31.44 18.39 0 30 90 954 Total 31.79 18.10 0 30 90 954
PCEOLF Female 9.58 25.37 0 0 100 510 Male 28.09 14.25 0 25 100 954
Total 27.02 12.87 0 25 75 954
PCEONLF
Female 17.36 31.99 0 0 100 510
Male 37.36 19.03 0 37.17 90.91 954 Total 36.88 18.60 0 36.36 90.91 954
PCHAIRLF Female 7.22 23.54 0 0 100 510 Male 27.37 11.23 0 20 66.67 954
Total 20.60 10.26 0 20 63.64 954
PCHAIRNLF
Female 20.08 35.73 0 0 100 510
Male 39.12 17.90 0 37.5 87.5 954 Total 38.47 16.20 0 37.5 87.5 954
PPROF
Female 12.78 29.88 0 0 100 510
Male 13.87 12.24 0 12.5 60 954 Total 13.91 11.99 0 12.5 50 954
PPOLIT Female 9.82 28.34 0 0 100 510 Male 14.39 14.28 0 12.5 87.5 954
Total 14.26 14 0 12.5 90.91 954
PCIVIL
Female 5.58 20.09 0 0 100 510
Male 10.44 11.18 0 9.09 61.54 954 Total 10.23 11.05 0 9.09 61.54 954
PCONSULT Female 12.32 28.62 0 0 100 510 Male 10.85 12.33 0 9.09 71.43 954
Total 11.10 12.31 0 9.09 71.43 954
PINTERSTUDY
Female 31.52 40.60 0 0 100 510
Male 26.35 20.00 0 25 100 954 Total 27.11 19.90 0 25 100 954
PINTERJOB
Female 30.93 40.95 0 0 100 510
Male 29.55 19.70 0 27.27 88.89 954 Total 30.22 19.52 0 27.27 88.89 954
In order to analyse female directors’ characteristics, we use a sample of firms with female representation on the board. Thus , although the initial
sample is composed of 954 observations, female descriptive statistics are calculated with a sample of 510 observations.
36
Table 3: Gender diversity legislation. Mean differences.
PANEL A: GENDER DIVERSITY AND BOARD DIRECTORS’ STRUCTURE
Variable
Conthe & Equaltiy Law Directive
Year - 1
Year +1
Wilcoxon / McNemar (a)
Year - 1
Year + 1
Wilcoxon / McNemar (a)
FEMEXIST (a) 32.10 57.73 4.146*** 71.26 69.51 0.707 PERFEM 4.43 8.06 4.006*** 11.09 12.44 1.339 BLAU 0.7 0.13 4.066*** 0.18 0.19 1.185 SHANNON 0.12 0.22 4.127*** 0.29 0.30 1.033 BSIZE 11.40 11.32 1.422 11.06 10.5 2.916*** PINDEPDIR 36.02 33.30 0.545 34.61 37.23 2.143** PMAINDIR 36.48 41.35 2.565*** 41.62 37.05 2.783***
* p < 0,10; **p < 0,05; *** p < 0,01
37
Table 3 (continued): Gender diversity legislation. Mean differences.
PANEL B: LABOR DIRECTORS´ CHARACTERISTICS
Variable
Conthe & Equaltiy Law Directive
Year - 1
Year +1
Wilcoxon Year
- 1 Year + 1
Wilcoxon
PGRAD
Female 77.44 87.38 4.378*** 89.33 92.28 0.227
Male 90.27 91.25 0.875 93.91 94.29 0.524 Total 92.60 93.52 1.132 94.67 94.68 1.305
PMBA Female 19.49 28.99 2.458** 39.35 47.40 0.837 Male 31.94 34.47 2.588*** 37.37 38.41 0.979
Total 32.64 35.33 2.543** 38.47 39.96 1.350
PPHD
Female 9.62 18.81 2.329** 15.73 18.77 0.211
Male 17.53 14.07 2.855*** 14.57 14.32 0.933 Total 17.70 14.57 2.245** 15.03 14.82 0.522
PSMLF Female 22.69 14.52 5.897*** 13.28 24.36 2.250** Male 29.70 32.19 1.564 31.08 32.80 1.473
Total 30.45 31.72 0.359 30.12 31.87 1.954*
PSMNLF
Female 18.08 31.82 2.555** 30.30 31.17 0.022
Male 28.17 31.49 1.301 33.92 33.99 0.038 Total 28.81 32.45 1.340 33.78 33.60 0.228
PCEOLF
Female 14.74 8.69 0.552 9.54 6.35 2.032**
Male 27.27 28.02 2.062** 27.95 29.76 1.591 Total 27.59 26.86 1.106 25.75 26.70 1.141
PCEONLF Female 15.51 21.99 6.517*** 14.84 13.77 0.085 Male 37.02 37.99 1.720* 37.77 36.28 1.591
Total 37.31 37.93 1.293 36.34 34.01 2.188**
PCHAIRLF
Female 10.90 6.85 1.000 7.80 4.09 1.732*
Male 22.12 20.64 0.747 20.80 21.84 0.734 Total 22.41 19.94 1.670* 19.28 19.53 0.480
PCHAIRNLF Female 17.95 20.38 2.264** 24.87 19.15 1.527 Male 41.41 38.57 1.136 37.16 37.35 0.169
Total 41.53 38.26 1.535 35.85 35.15 0.726
PPROF
Female 7.69 15.83 2.442** 12.5 15.12 0.357
Male 13.88 12.78 0.969 14.67 14.84 0.159 Total 13.88 12.78 0.540 14.67 14.84 0.052
PPOLIT
Female 9.62 8.04 1.300 13.44 7.75 1.554
Male 16.80 13.37 1.621 12.84 13.47 0.290 Total 16.90 13.12 2.003** 12.88 12.67 0.888
PCIVIL Female 3.85 7.20 2.032** 19.45 5.76 1.219 Male 12.81 9.70 1.308 9.09 10.19 1.696
Total 12.68 9.55 1.270 8.64 9.71 3.439***
PCONSULT
Female 7.69 9.82 1.667* 29.93 18.42 1.097
Male 8.39 10.69 1.572 10.09 12.86 0.677 Total 8.42 10.86 1.819* 13.32 13.50 0.391
PINTERSTUDY Female 24.36 27.67 2.539** 35.89 38.74 0.024 Male 24.39 25.16 1.450 29.41 30.90 0.869
Total 24.88 25.78 1.796* 30.48 31.86 0.666
PINTERJOB
Female 21.15 29.02 2.651*** 33.87 41.72 1.241
Male 27.13 28.11 0.256 32.18 34.11 0.799 Total 27.66 29.00 0.725 32.84 35.12 1.566
* p < 0,10; **p < 0,05; *** p < 0,01

38
Table 4: Impact of gender diversity legislation on women presence on boards.
VARIABLES A. PROBIT B. TOBIT
Reg. 1 (FEMEXIST)
Reg. 2 (PERFEM)
Reg. 3 (BLAU)
Reg. 4 (SHANNON)
CONTHELAW 1.257***
(7.08) 7.720***
(7.84) 0.117***
(7.94) 0.186***
(7.97)
DIRECTIVE 0.312* (1.93)
3.484*** (4.28)
0.046*** (3.74)
0.064*** (3.26)
PINDPDIR 0.012* (1.95)
0.090** (2.36)
0.001** (2.26)
0.002** (2.21)
PMAINDIR 0.006 (0.98)
0.038 (1.07)
0.001 (1.00)
0.001 (0.99)
BSIZE 0.094** (2.52)
0.410* (1.84)
0.007** (2.02)
0.011** (2.14)
LASSETS 0.049 (0.47)
0.370 (0.61)
0.006 (0.70)
0.010 (0.67)
LEV -0.332 (-0.87)
-1.820 (-1.51)
-0.027 (-1.47)
-0.039 (-1.35)
AGE -0.001 (-0.06)
0.046 (1.17)
0.001 (1.08)
0.001 (0.95)
REGUL -0.0639 (-1.44)
-1.734 (-0.58)
-0.032 (-0.71)
-0.057 (-0.81)
Wald s 𝜒2 75.75*** 127.36*** 123.38*** 117.43*** N observations 952 952 952 952 N firms 144 144 144 114
The dependent variables are FEMEXIST (A. Probit Model), PERFEM, BLAU and SHANNON (B. Tobit Models). Values are unstandardized coefficients, with z values in parentheses. The Wald test is 𝜒2 test of all coefficients in the regression model expect
the constant, are equal to 0. Models are estimated with the constant but it is not reported in the table. * p < 0,10; **p < 0,05; *** p < 0,01
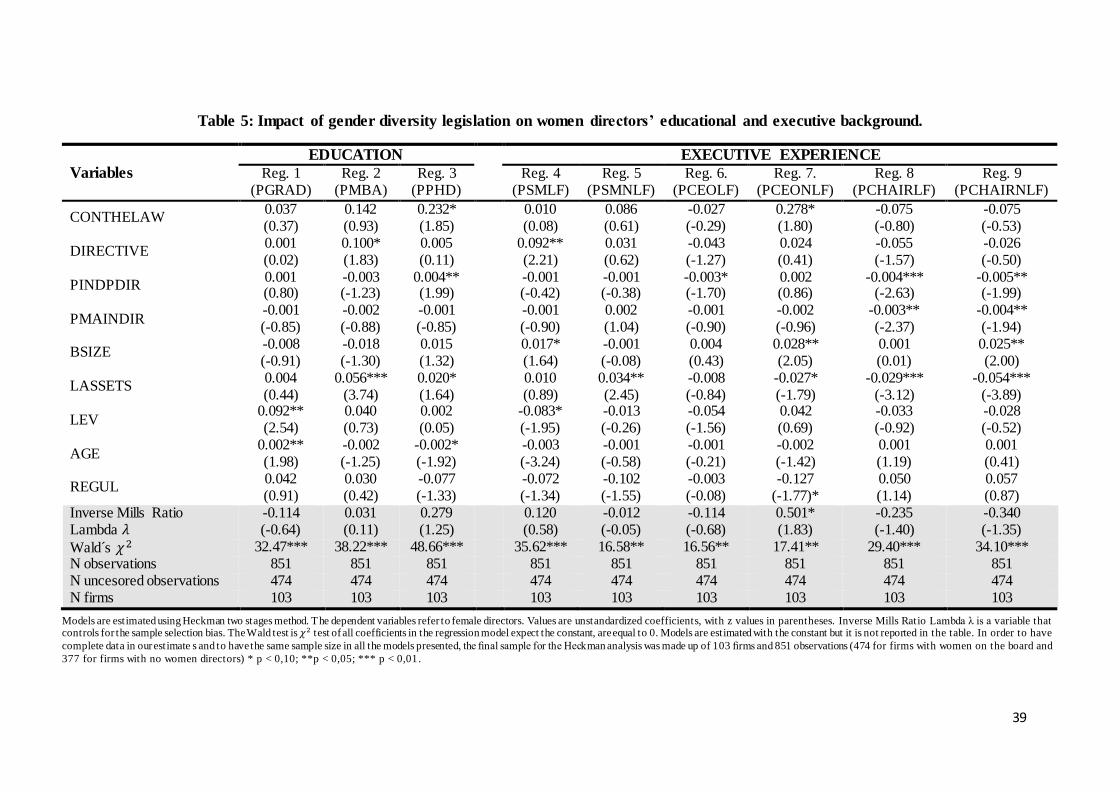
39
Table 5: Impact of gender diversity legislation on women directors’ educational and executive background.
Variables
EDUCATION EXECUTIVE EXPERIENCE
Reg. 1 (PGRAD)
Reg. 2 (PMBA)
Reg. 3 (PPHD)
Reg. 4 (PSMLF)
Reg. 5 (PSMNLF)
Reg. 6. (PCEOLF)
Reg. 7. (PCEONLF)
Reg. 8 (PCHAIRLF)
Reg. 9 (PCHAIRNLF)
CONTHELAW 0.037 (0.37)
0.142 (0.93)
0.232* (1.85)
0.010 (0.08)
0.086 (0.61)
-0.027 (-0.29)
0.278* (1.80)
-0.075 (-0.80)
-0.075 (-0.53)
DIRECTIVE 0.001 (0.02)
0.100* (1.83)
0.005 (0.11)
0.092** (2.21)
0.031 (0.62)
-0.043 (-1.27)
0.024 (0.41)
-0.055 (-1.57)
-0.026 (-0.50)
PINDPDIR 0.001 (0.80)
-0.003 (-1.23)
0.004** (1.99)
-0.001 (-0.42)
-0.001 (-0.38)
-0.003* (-1.70)
0.002 (0.86)
-0.004*** (-2.63)
-0.005** (-1.99)
PMAINDIR -0.001 (-0.85)
-0.002 (-0.88)
-0.001 (-0.85)
-0.001 (-0.90)
0.002 (1.04)
-0.001 (-0.90)
-0.002 (-0.96)
-0.003** (-2.37)
-0.004** (-1.94)
BSIZE -0.008 (-0.91)
-0.018 (-1.30)
0.015 (1.32)
0.017* (1.64)
-0.001 (-0.08)
0.004 (0.43)
0.028** (2.05)
0.001 (0.01)
0.025** (2.00)
LASSETS 0.004 (0.44)
0.056*** (3.74)
0.020* (1.64)
0.010 (0.89)
0.034** (2.45)
-0.008 (-0.84)
-0.027* (-1.79)
-0.029*** (-3.12)
-0.054*** (-3.89)
LEV 0.092** (2.54)
0.040 (0.73)
0.002 (0.05)
-0.083* (-1.95)
-0.013 (-0.26)
-0.054 (-1.56)
0.042 (0.69)
-0.033 (-0.92)
-0.028 (-0.52)
AGE 0.002** (1.98)
-0.002 (-1.25)
-0.002* (-1.92)
-0.003 (-3.24)
-0.001 (-0.58)
-0.001 (-0.21)
-0.002 (-1.42)
0.001 (1.19)
0.001 (0.41)
REGUL 0.042 (0.91)
0.030 (0.42)
-0.077 (-1.33)
-0.072 (-1.34)
-0.102 (-1.55)
-0.003 (-0.08)
-0.127 (-1.77)*
0.050 (1.14)
0.057 (0.87)
Inverse Mills Ratio Lambda 𝜆
-0.114 (-0.64)
0.031 (0.11)
0.279 (1.25)
0.120 (0.58)
-0.012 (-0.05)
-0.114 (-0.68)
0.501* (1.83)
-0.235 (-1.40)
-0.340 (-1.35)
Wald s 𝜒2 32.47*** 38.22*** 48.66*** 35.62*** 16.58** 16.56** 17.41** 29.40*** 34.10*** N observations 851 851 851 851 851 851 851 851 851 N uncesored observations 474 474 474 474 474 474 474 474 474 N firms 103 103 103 103 103 103 103 103 103
Models are estimated using Heckman two stages method. The dependent variables refer to female directors. Values are unstandardized coefficients, with z values in parentheses. Inverse Mills Ratio Lambda λ is a variable that controls for the sample selection bias. The Wald test is 𝜒2 test of all coefficients in the regression model expect the constant, are equal to 0. Models are estimated with the constant but it is not reported in the table. In order to have
complete data in our estimate s and to have the same sample size in all the models presented, the final sample for the Heckman analysis was made up of 103 firms and 851 observations (474 for firms with women on the board and
377 for firms with no women directors) * p < 0,10; **p < 0,05; *** p < 0,01.
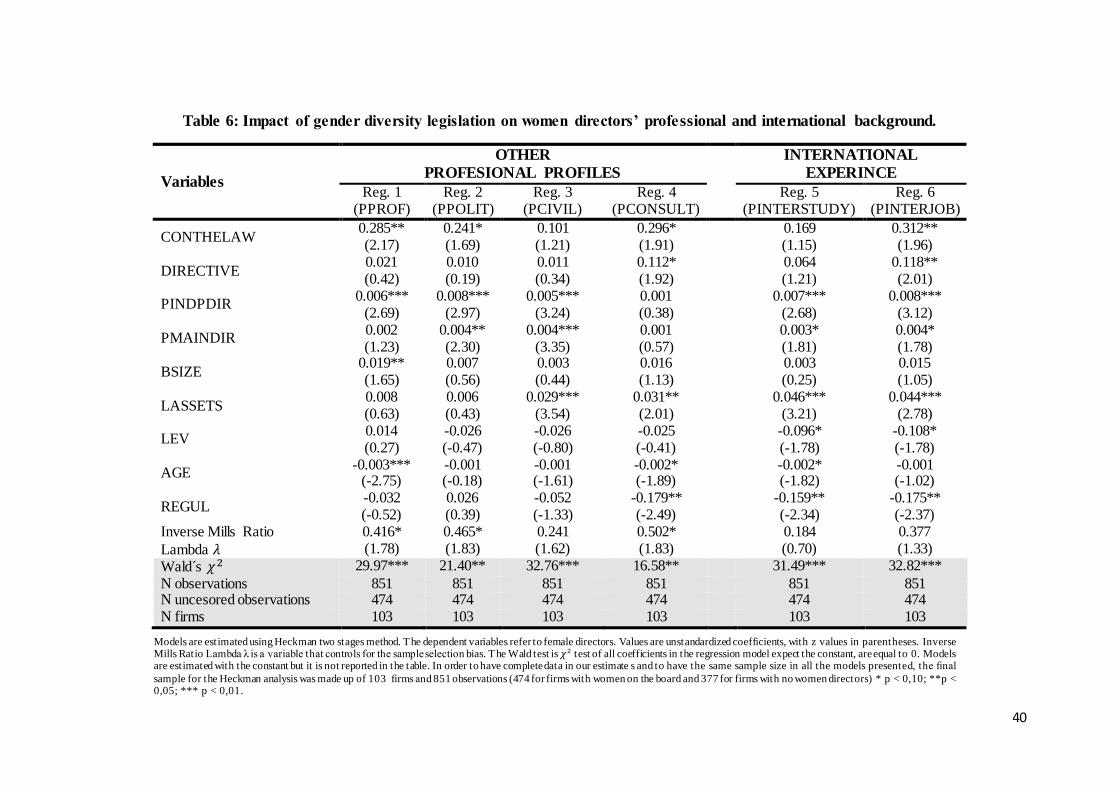
40
Table 6: Impact of gender diversity legislation on women directors’ professional and international background.
Variables
OTHER
PROFESIONAL PROFILES
INTERNATIONAL
EXPERINCE
Reg. 1 (PPROF)
Reg. 2 (PPOLIT)
Reg. 3 (PCIVIL)
Reg. 4 (PCONSULT)
Reg. 5 (PINTERSTUDY)
Reg. 6 (PINTERJOB)
CONTHELAW 0.285** (2.17)
0.241* (1.69)
0.101 (1.21)
0.296* (1.91)
0.169 (1.15)
0.312** (1.96)
DIRECTIVE 0.021 (0.42)
0.010 (0.19)
0.011 (0.34)
0.112* (1.92)
0.064 (1.21)
0.118** (2.01)
PINDPDIR 0.006***
(2.69) 0.008***
(2.97) 0.005***
(3.24) 0.001 (0.38)
0.007*** (2.68)
0.008*** (3.12)
PMAINDIR 0.002 (1.23)
0.004** (2.30)
0.004*** (3.35)
0.001 (0.57)
0.003* (1.81)
0.004* (1.78)
BSIZE 0.019** (1.65)
0.007 (0.56)
0.003 (0.44)
0.016 (1.13)
0.003 (0.25)
0.015 (1.05)
LASSETS 0.008 (0.63)
0.006 (0.43)
0.029*** (3.54)
0.031** (2.01)
0.046*** (3.21)
0.044*** (2.78)
LEV 0.014 (0.27)
-0.026 (-0.47)
-0.026 (-0.80)
-0.025 (-0.41)
-0.096* (-1.78)
-0.108* (-1.78)
AGE -0.003***
(-2.75) -0.001 (-0.18)
-0.001 (-1.61)
-0.002* (-1.89)
-0.002* (-1.82)
-0.001 (-1.02)
REGUL -0.032 (-0.52)
0.026 (0.39)
-0.052 (-1.33)
-0.179** (-2.49)
-0.159** (-2.34)
-0.175** (-2.37)
Inverse Mills Ratio
Lambda 𝜆
0.416* (1.78)
0.465* (1.83)
0.241 (1.62)
0.502* (1.83)
0.184 (0.70)
0.377 (1.33)
Wald s 𝜒2 29.97*** 21.40** 32.76*** 16.58** 31.49*** 32.82***
N observations 851 851 851 851 851 851 N uncesored observations 474 474 474 474 474 474 N firms 103 103 103 103 103 103
Models are estimated using Heckman two stages method. The dependent variables refer to female directors. Values are unstandardized coefficients, with z values in parentheses. Inverse Mills Ratio Lambda λ is a variable that controls for the sample selection bias. The Wald test is 𝜒2 test of all coefficients in the regression model expect the constant, are equal to 0. Models are estimated with the constant but it is not reported in the table. In order to have complete data in our estimate s and to have the same sample size in all the models presented, the final
sample for the Heckman analysis was made up of 103 firms and 851 observations (474 for firms with women on the board and 377 for firms with no women directors) * p < 0,10; **p < 0,05; *** p < 0,01.
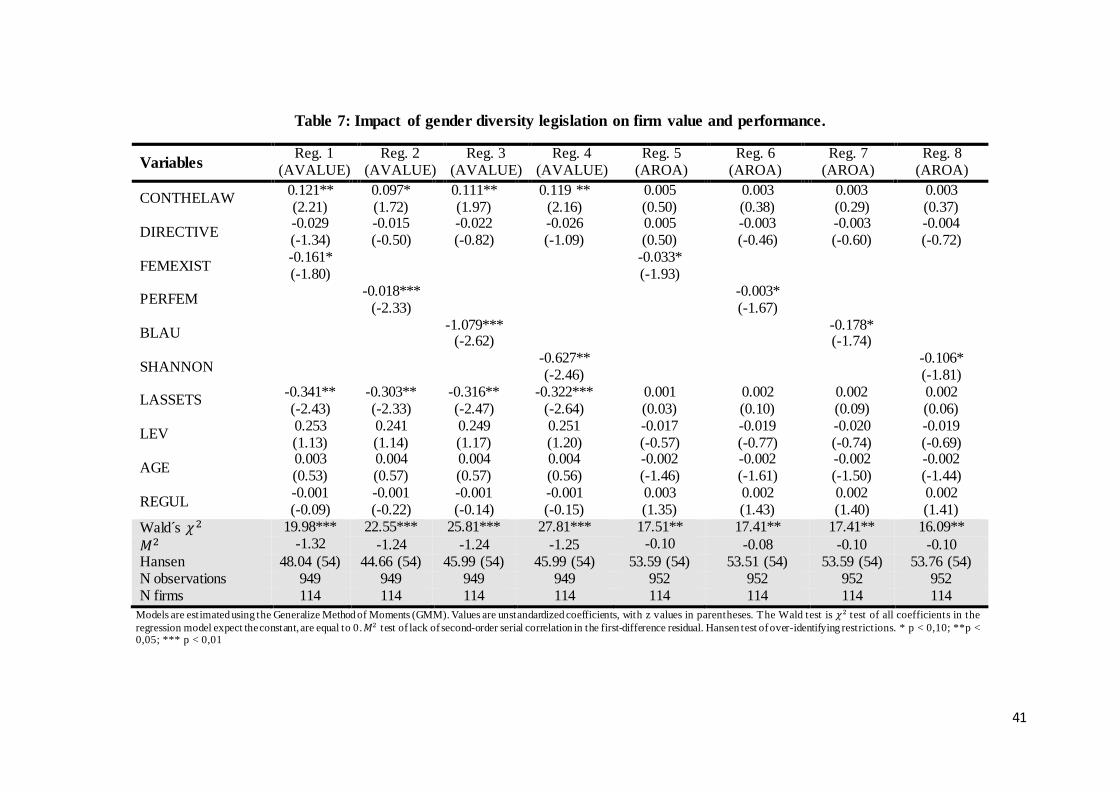
41
Table 7: Impact of gender diversity legislation on firm value and performance.
Variables Reg. 1
(AVALUE) Reg. 2
(AVALUE) Reg. 3
(AVALUE) Reg. 4
(AVALUE) Reg. 5
(AROA) Reg. 6
(AROA) Reg. 7
(AROA) Reg. 8
(AROA)
CONTHELAW 0.121** (2.21)
0.097* (1.72)
0.111** (1.97)
0.119 ** (2.16)
0.005 (0.50)
0.003 (0.38)
0.003 (0.29)
0.003 (0.37)
DIRECTIVE -0.029 (-1.34)
-0.015 (-0.50)
-0.022 (-0.82)
-0.026 (-1.09)
0.005 (0.50)
-0.003 (-0.46)
-0.003 (-0.60)
-0.004 (-0.72)
FEMEXIST -0.161* (-1.80)
-0.033* (-1.93)
PERFEM -0.018***
(-2.33)
-0.003* (-1.67)
BLAU
-1.079***
(-2.62)
-0.178* (-1.74)
SHANNON
-0.627** (-2.46)
-0.106* (-1.81)
LASSETS -0.341** (-2.43)
-0.303** (-2.33)
-0.316** (-2.47)
-0.322*** (-2.64)
0.001 (0.03)
0.002 (0.10)
0.002 (0.09)
0.002 (0.06)
LEV 0.253 (1.13)
0.241 (1.14)
0.249 (1.17)
0.251 (1.20)
-0.017 (-0.57)
-0.019 (-0.77)
-0.020 (-0.74)
-0.019 (-0.69)
AGE 0.003 (0.53)
0.004 (0.57)
0.004 (0.57)
0.004 (0.56)
-0.002 (-1.46)
-0.002 (-1.61)
-0.002 (-1.50)
-0.002 (-1.44)
REGUL -0.001 (-0.09)
-0.001 (-0.22)
-0.001 (-0.14)
-0.001 (-0.15)
0.003 (1.35)
0.002 (1.43)
0.002 (1.40)
0.002 (1.41)
Wald s 𝜒2 19.98*** 22.55*** 25.81*** 27.81*** 17.51** 17.41** 17.41** 16.09**
𝑀2 -1.32 -1.24 -1.24 -1.25 -0.10 -0.08 -0.10 -0.10 Hansen 48.04 (54) 44.66 (54) 45.99 (54) 45.99 (54) 53.59 (54) 53.51 (54) 53.59 (54) 53.76 (54) N observations 949 949 949 949 952 952 952 952 N firms 114 114 114 114 114 114 114 114
Models are estimated using the Generalize Method of Moments (GMM). Values are unstandardized coefficients, with z values in parentheses. The Wald test is 𝜒2 test of all coefficients in the
regression model expect the constant, are equal to 0. 𝑀2 test of lack of second-order serial correlation in the first-difference residual. Hansen test of over-identifying restrictions. * p < 0,10; **p < 0,05; *** p < 0,01