Embed Size (px)
Citation preview
Promoting Population Health: One Health Plan’s Perspective
Thomas Kottke, MD MSPH Medical Director for Population Health
HealthPartners
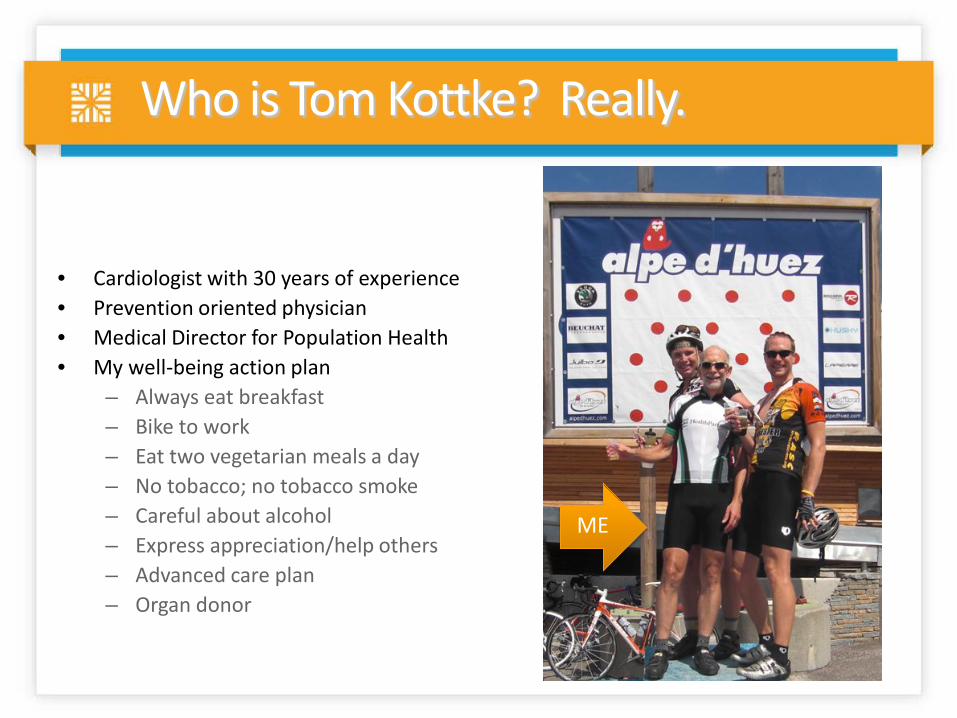
Who is Tom Kottke? Really.
• Cardiologist with 30 years of experience • Prevention oriented physician • Medical Director for Population Health • My well-being action plan
– Always eat breakfast – Bike to work – Eat two vegetarian meals a day – No tobacco; no tobacco smoke – Careful about alcohol – Express appreciation/help others – Advanced care plan – Organ donor
ME
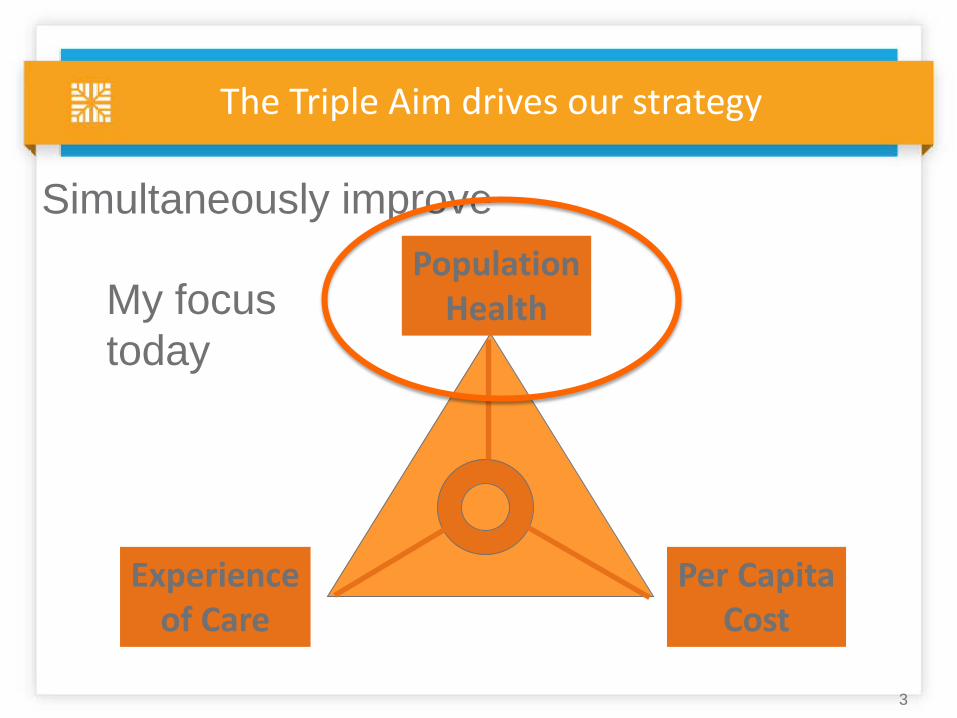
The Triple Aim drives our strategy
Population Health
Experience of Care
Per Capita Cost
Simultaneously improve
3
My focus today
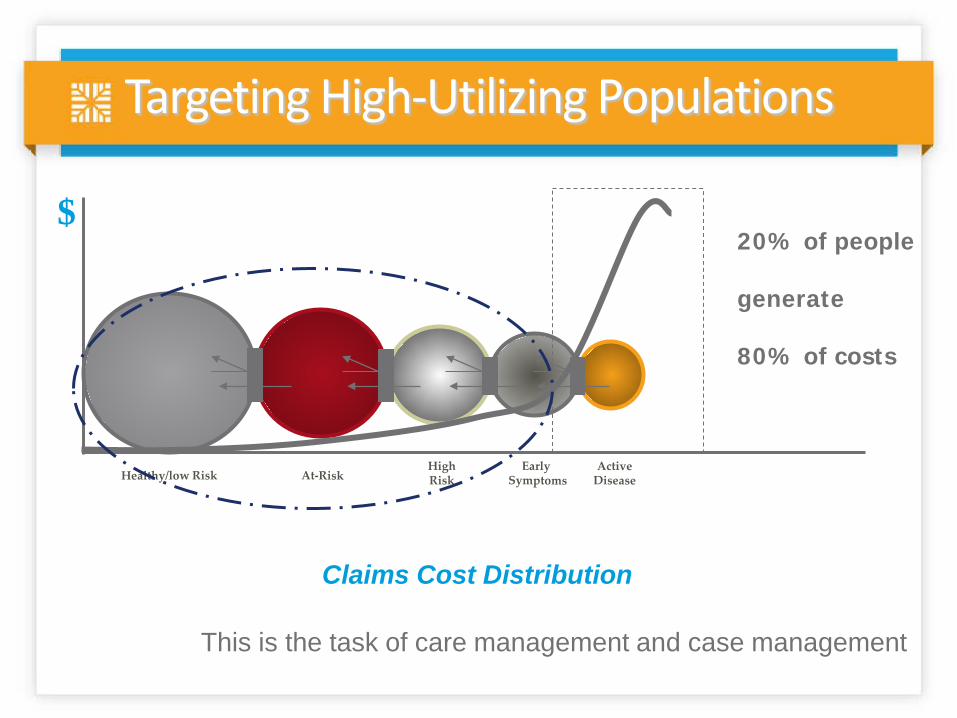
Targeting High-Utilizing Populations
20% of people generate 80% of costs
Claims Cost Distribution
$
This is the task of care management and case management
5
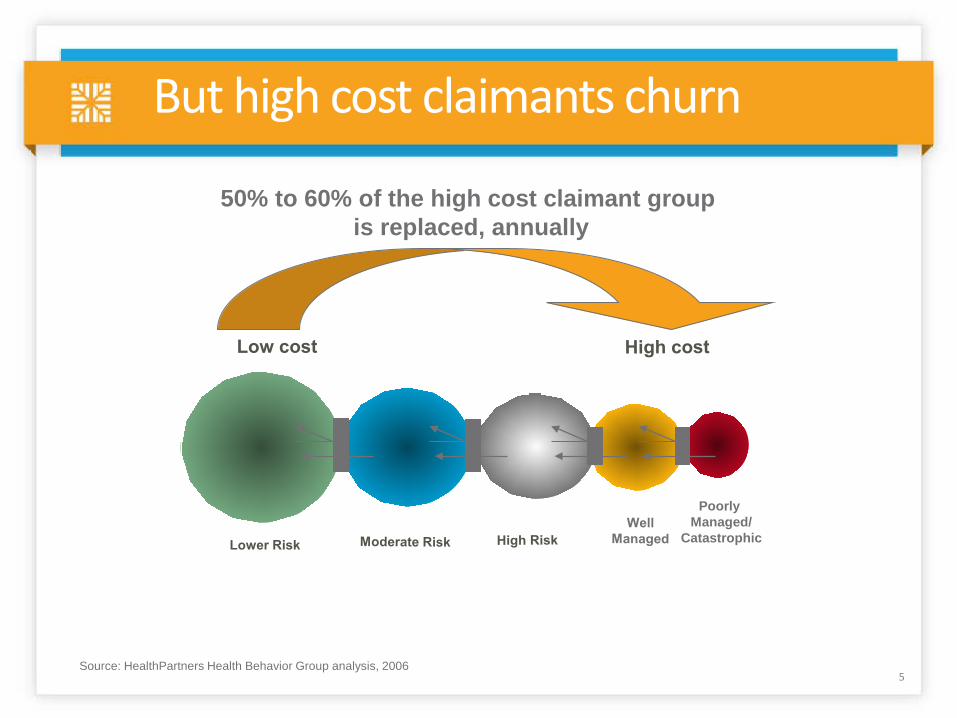
But high cost claimants churn
Poorly Managed/
Catastrophic
50% to 60% of the high cost claimant group is replaced, annually
Source: HealthPartners Health Behavior Group analysis, 2006
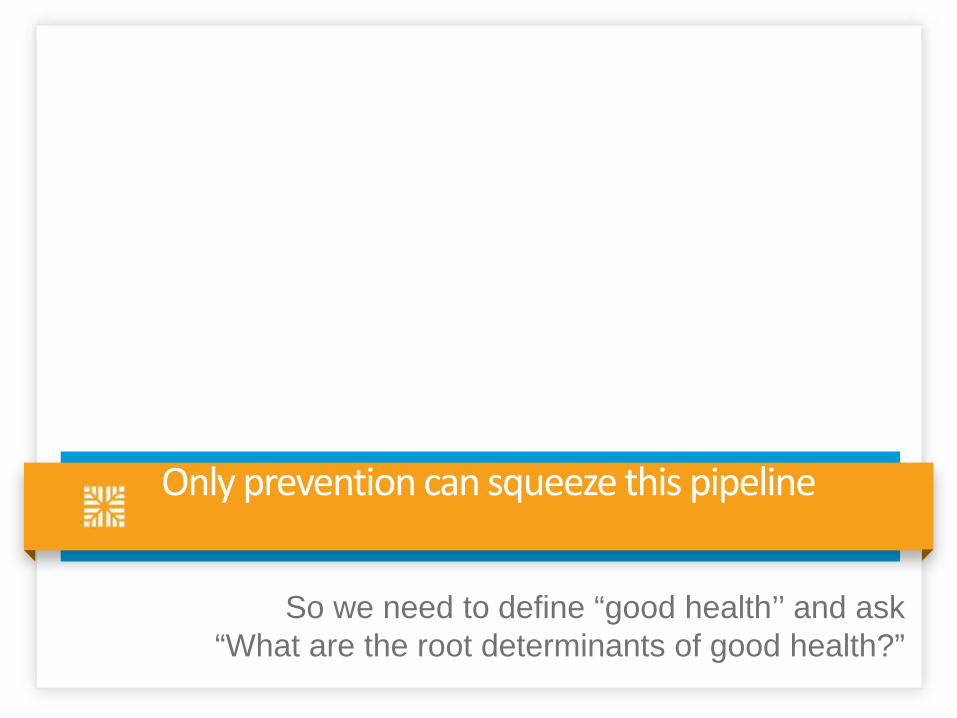
Only prevention can squeeze this pipeline
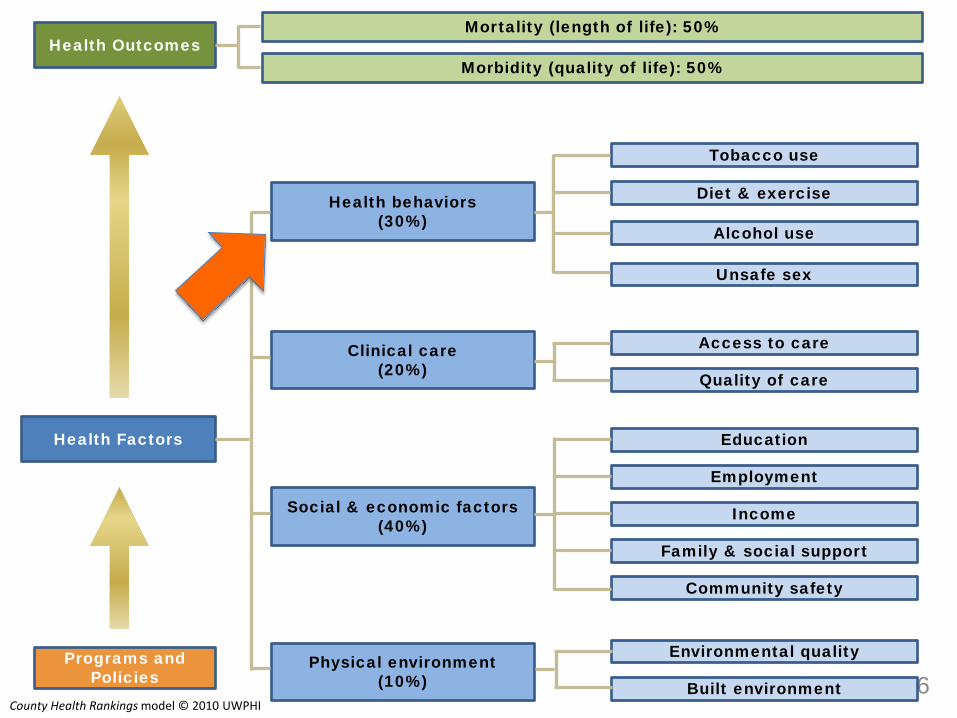
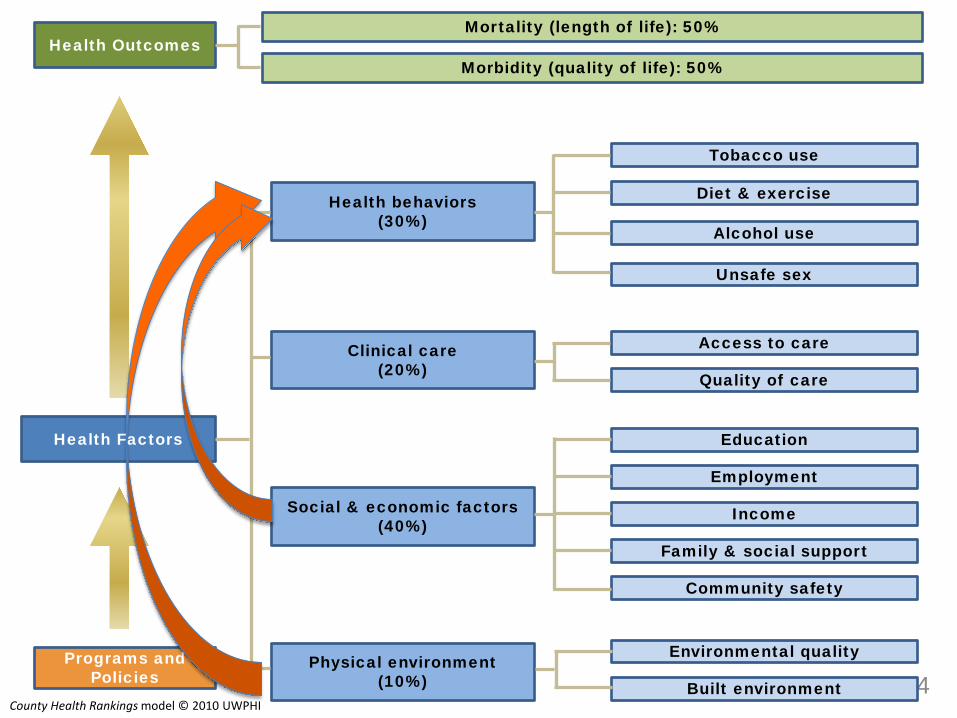
So we need to define “good health’’ and ask “What are the root determinants of good health?”
7
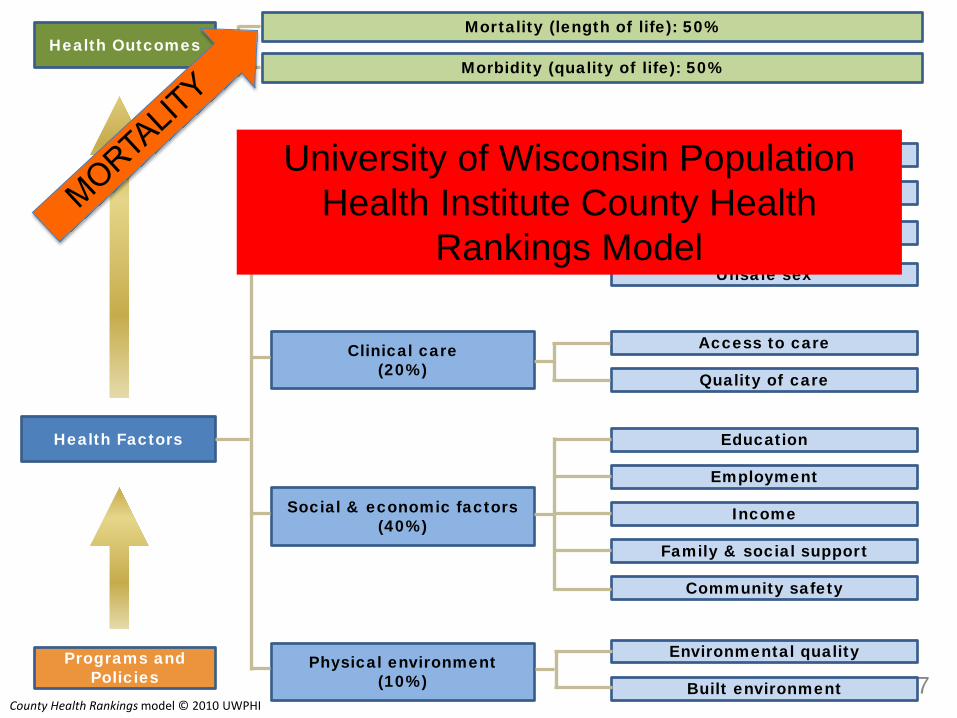
Community safety
Education
Family & social support
Employment
Built environment
Environmental quality
Income
Unsafe sex
Alcohol use
Diet & exercise
Tobacco use
Access to care
Quality of care
Physical environment (10%)
Social & economic factors (40%)
Health behaviors (30%)
Clinical care (20%)
Health Factors
Programs and Policies
Health Outcomes Mortality (length of life): 50%
Morbidity (quality of life): 50%
County Health Rankings model © 2010 UWPHI
University of Wisconsin Population Health Institute County Health
Rankings Model
8
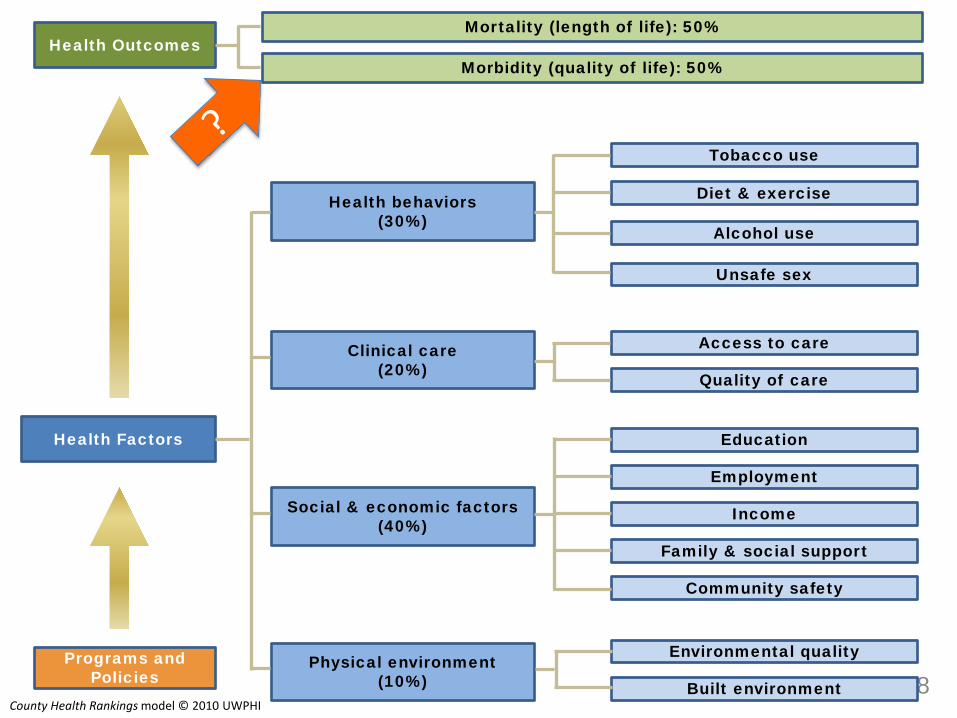
Community safety
Education
Family & social support
Employment
Built environment
Environmental quality
Income
Unsafe sex
Alcohol use
Diet & exercise
Tobacco use
Access to care
Quality of care
Physical environment (10%)
Social & economic factors (40%)
Health behaviors (30%)
Clinical care (20%)
Health Factors
Programs and Policies
Health Outcomes Mortality (length of life): 50%
Morbidity (quality of life): 50%
County Health Rankings model © 2010 UWPHI
9
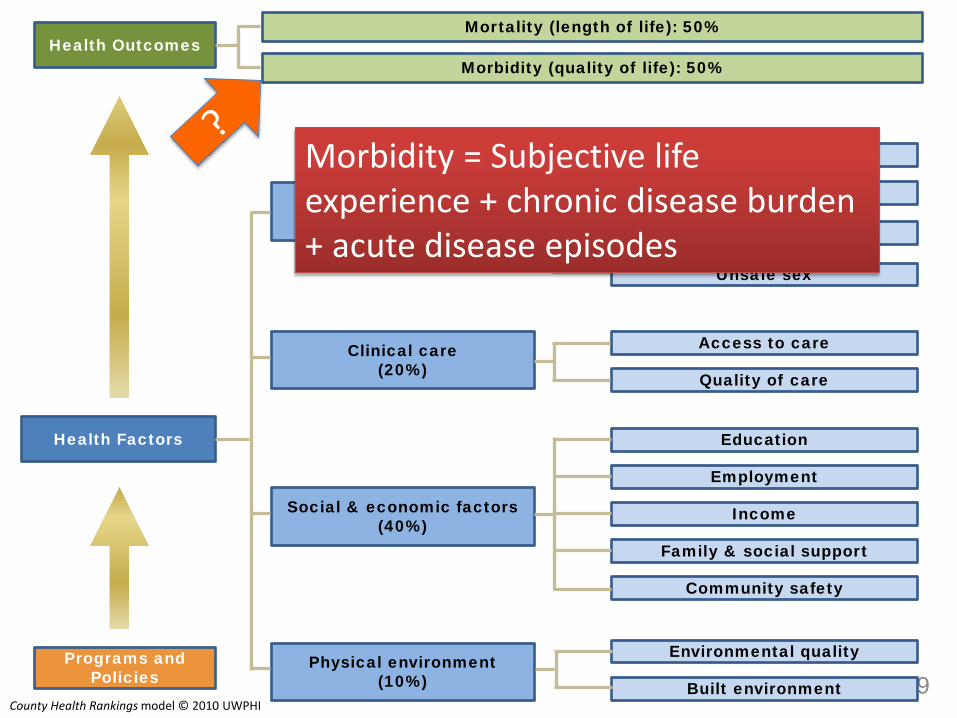
Community safety
Education
Family & social support
Employment
Built environment
Environmental quality
Income
Unsafe sex
Alcohol use
Diet & exercise
Tobacco use
Access to care
Quality of care
Physical environment (10%)
Social & economic factors (40%)
Health behaviors (30%)
Clinical care (20%)
Health Factors
Programs and Policies
Health Outcomes Mortality (length of life): 50%
Morbidity (quality of life): 50%
County Health Rankings model © 2010 UWPHI
Morbidity = Subjective life experience + chronic disease burden + acute disease episodes
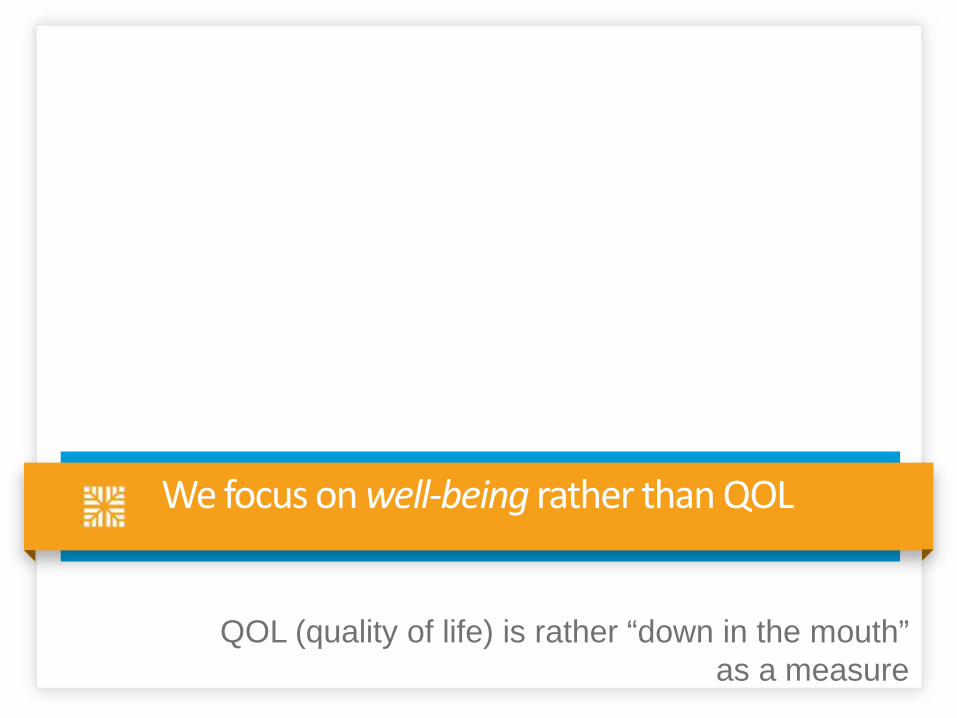
We focus on well-being rather than QOL
QOL (quality of life) is rather “down in the mouth” as a measure
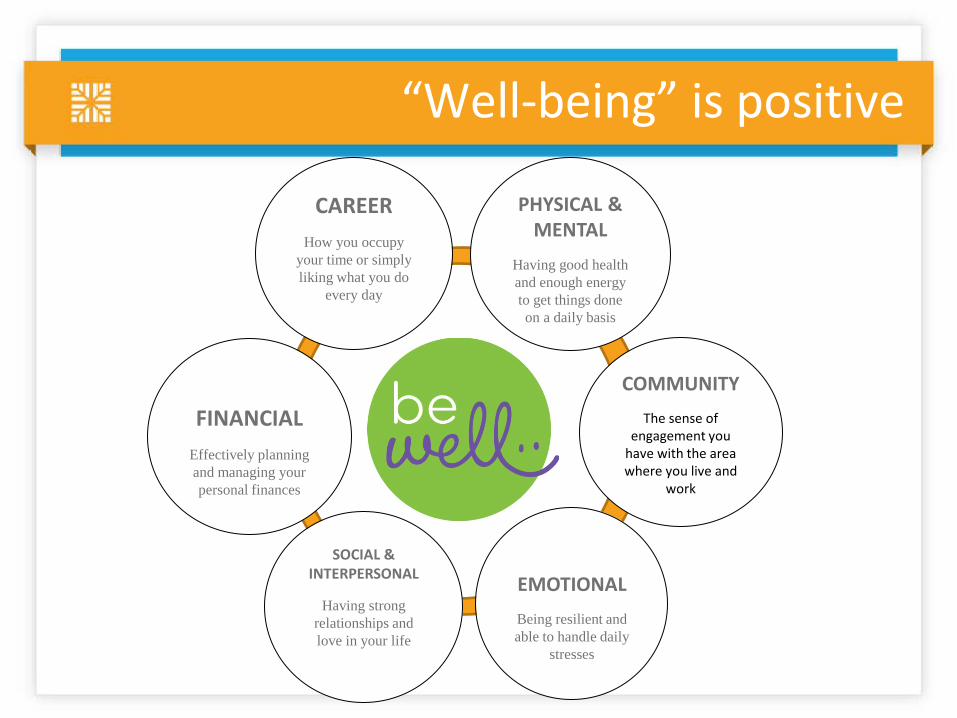
“Well-being” is positive
SOCIAL & INTERPERSONAL
Having strong relationships and love in your life
COMMUNITY The sense of
engagement you have with the area where you live and
work
FINANCIAL
Effectively planning and managing your personal finances
PHYSICAL & MENTAL
Having good health and enough energy to get things done on a daily basis
CAREER
How you occupy your time or simply liking what you do
every day
EMOTIONAL Being resilient and able to handle daily
stresses
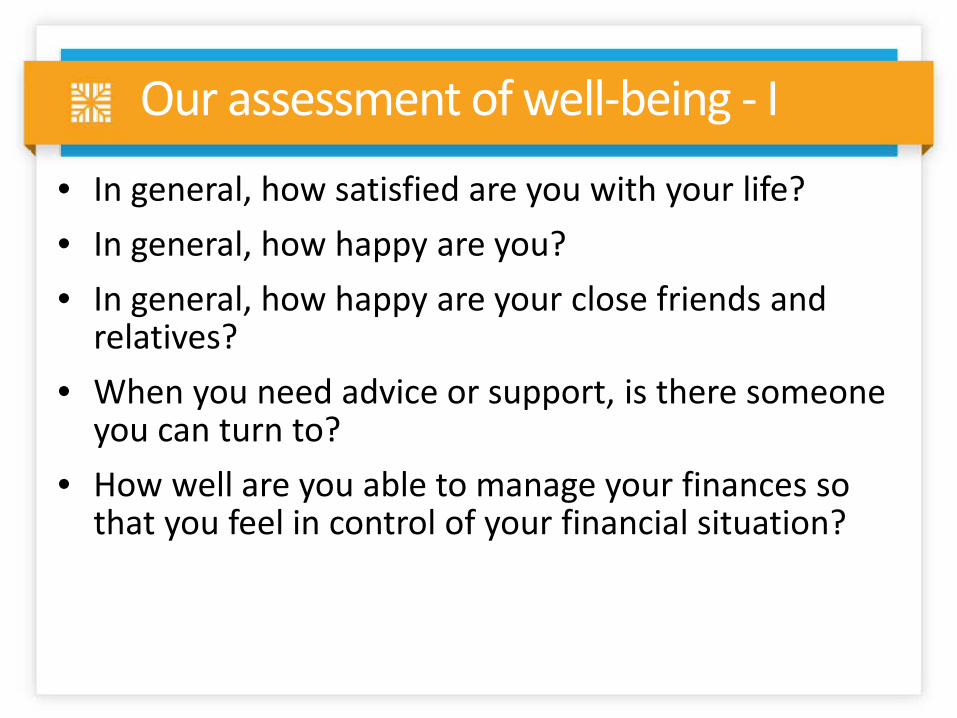
Our assessment of well-being - I
• In general, how satisfied are you with your life? • In general, how happy are you? • In general, how happy are your close friends and
relatives? • When you need advice or support, is there someone
you can turn to? • How well are you able to manage your finances so
that you feel in control of your financial situation?
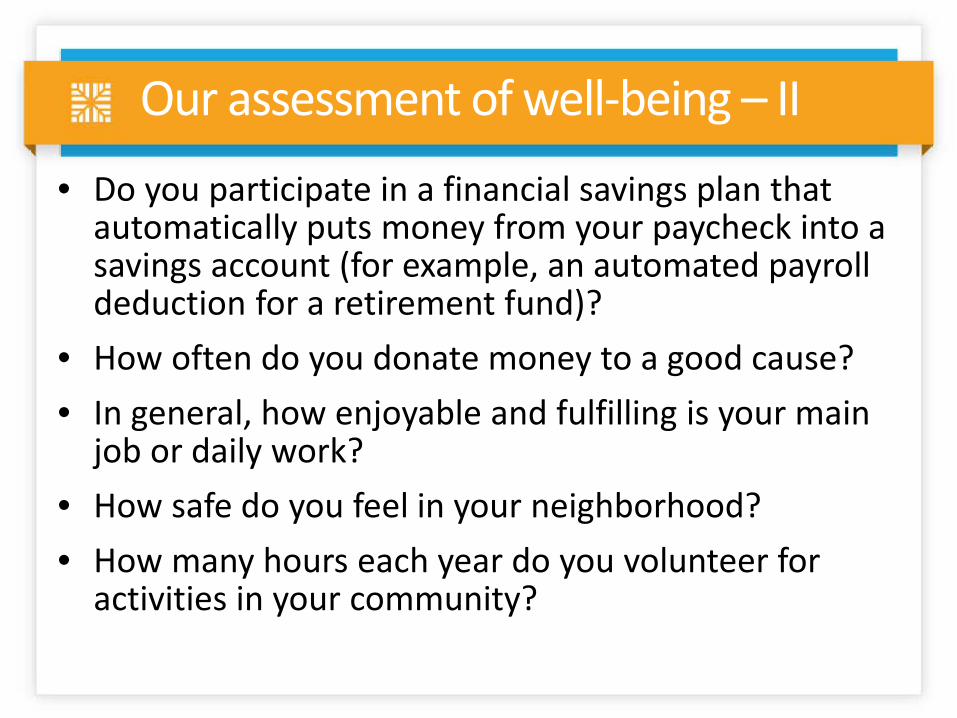
Our assessment of well-being – II
• Do you participate in a financial savings plan that automatically puts money from your paycheck into a savings account (for example, an automated payroll deduction for a retirement fund)?
• How often do you donate money to a good cause? • In general, how enjoyable and fulfilling is your main
job or daily work? • How safe do you feel in your neighborhood? • How many hours each year do you volunteer for
activities in your community?
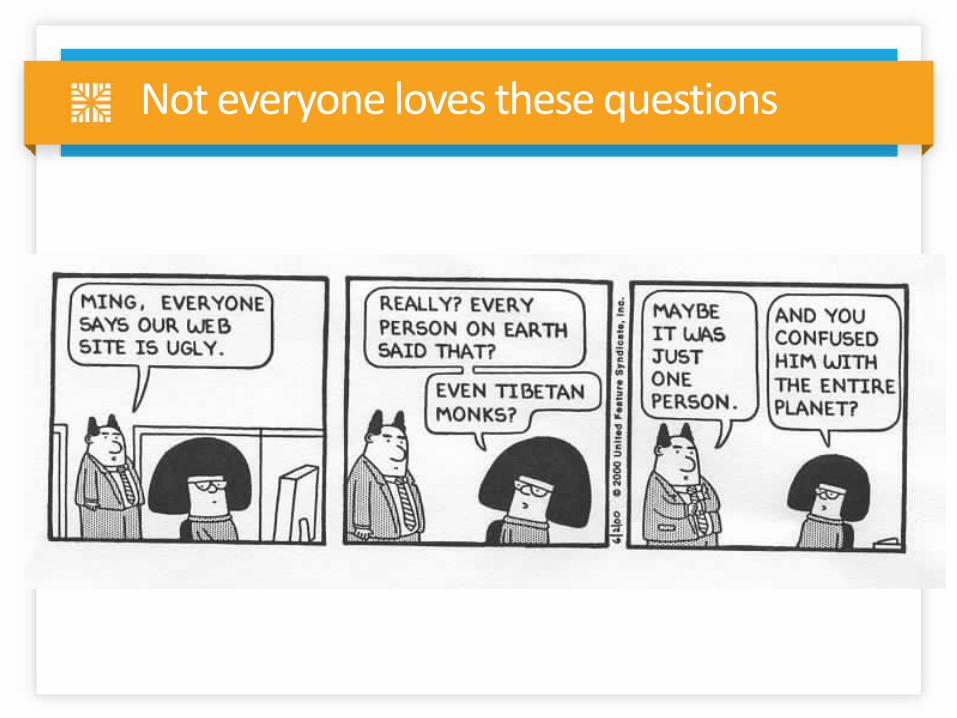
Not everyone loves these questions
What predicts well-being?
16
Community safety
Education
Family & social support
Employment
Built environment
Environmental quality
Income
Unsafe sex
Alcohol use
Diet & exercise
Tobacco use
Access to care
Quality of care
Physical environment (10%)
Social & economic factors (40%)
Health behaviors (30%)
Clinical care (20%)
Health Factors
Programs and Policies
Health Outcomes Mortality (length of life): 50%
Morbidity (quality of life): 50%
County Health Rankings model © 2010 UWPHI
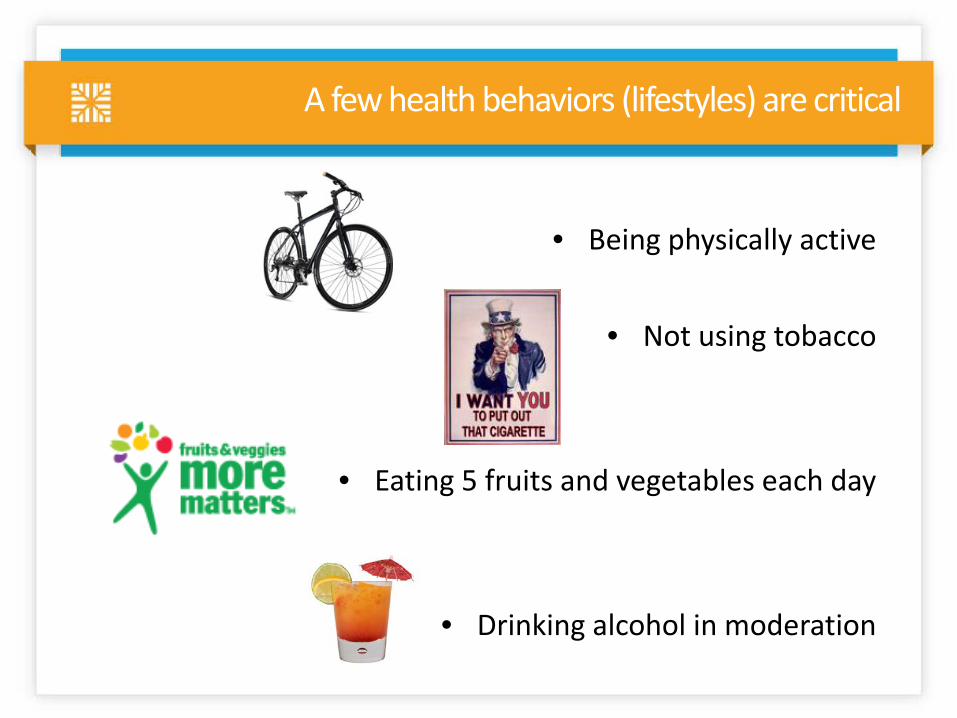
A few health behaviors (lifestyles) are critical
• Being physically active
• Not using tobacco
• Eating 5 fruits and vegetables each day
• Drinking alcohol in moderation
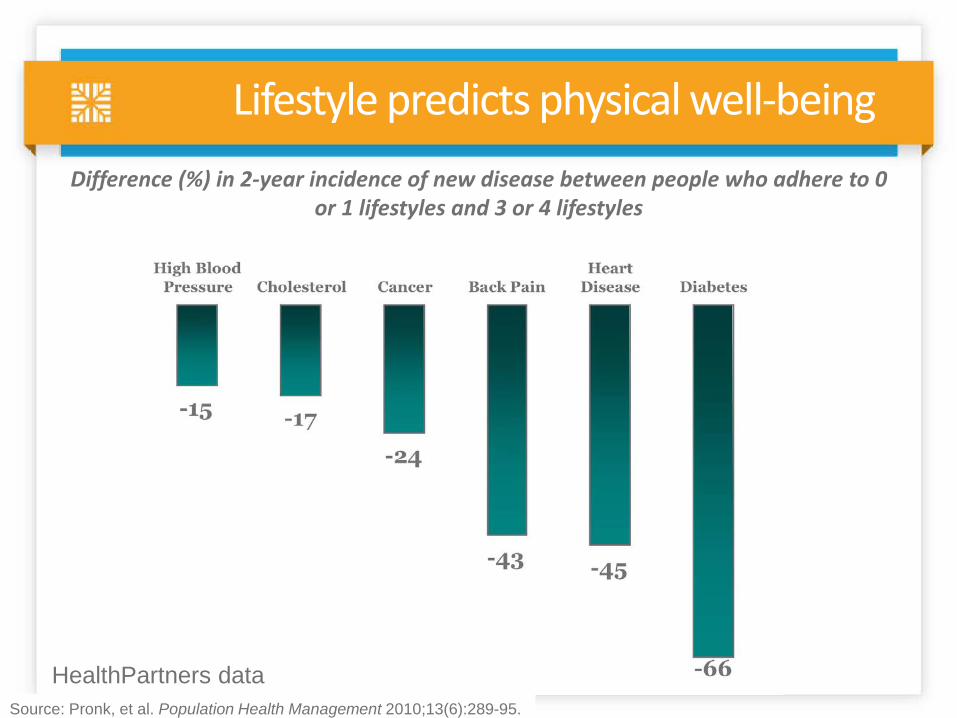
Lifestyle predicts physical well-being
Source: Pronk, et al. Population Health Management 2010;13(6):289-95.
Difference (%) in 2-year incidence of new disease between people who adhere to 0 or 1 lifestyles and 3 or 4 lifestyles
HealthPartners data
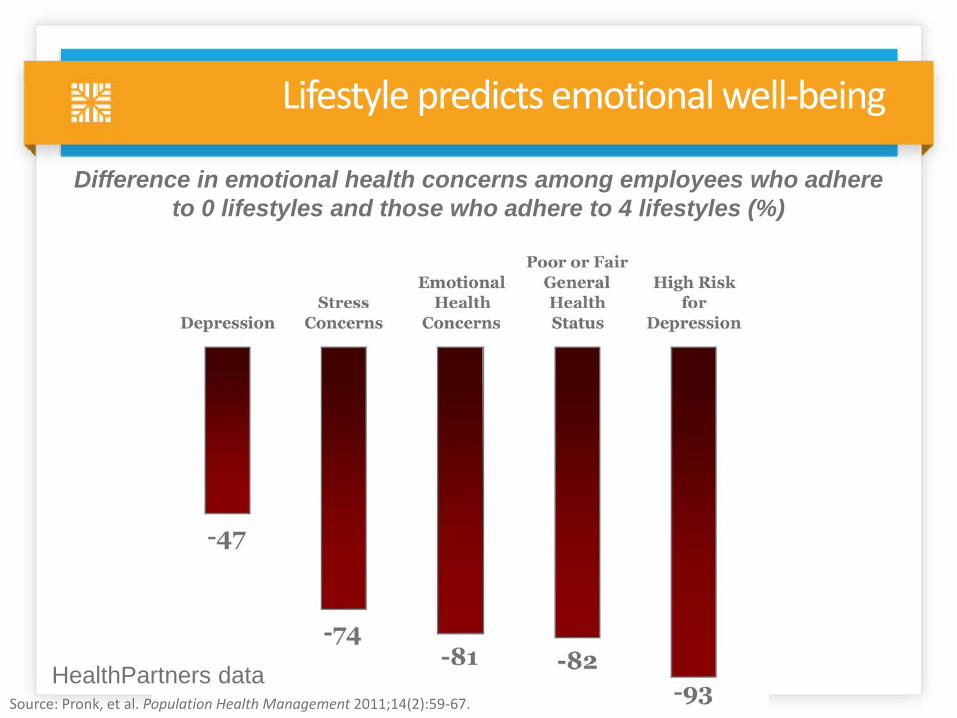
Lifestyle predicts emotional well-being
Difference in emotional health concerns among employees who adhere to 0 lifestyles and those who adhere to 4 lifestyles (%)
Source: Pronk, et al. Population Health Management 2011;14(2):59-67.
HealthPartners data
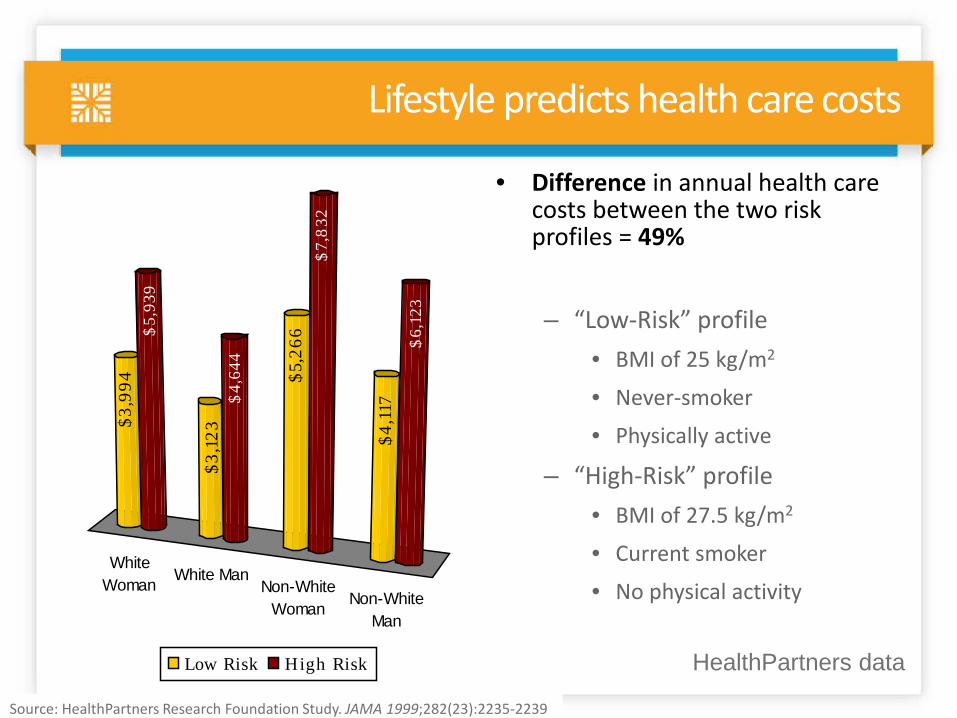
Lifestyle predicts health care costs
• Difference in annual health care costs between the two risk profiles = 49% – “Low-Risk” profile
• BMI of 25 kg/m2
• Never-smoker
• Physically active
– “High-Risk” profile • BMI of 27.5 kg/m2
• Current smoker
• No physical activity
Source: HealthPartners Research Foundation Study. JAMA 1999;282(23):2235-2239
WhiteWoman White Man
Non-WhiteWoman Non-White
Man
$3,9
94$
5,93
9
$3,1
23$
4,64
4
$5,2
66$
7,8
32
$4,1
17
$6,
123
Low Risk High Risk HealthPartners data
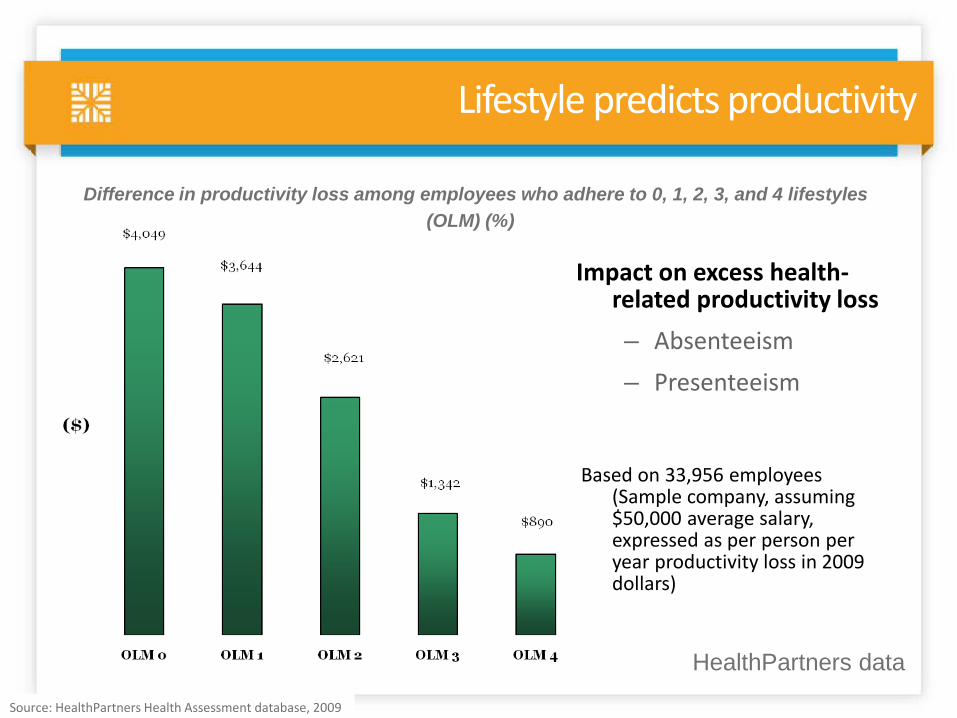
Lifestyle predicts productivity
Impact on excess health-related productivity loss – Absenteeism – Presenteeism
Based on 33,956 employees
(Sample company, assuming $50,000 average salary, expressed as per person per year productivity loss in 2009 dollars)
Source: HealthPartners Health Assessment database, 2009
Difference in productivity loss among employees who adhere to 0, 1, 2, 3, and 4 lifestyles (OLM) (%)
HealthPartners data
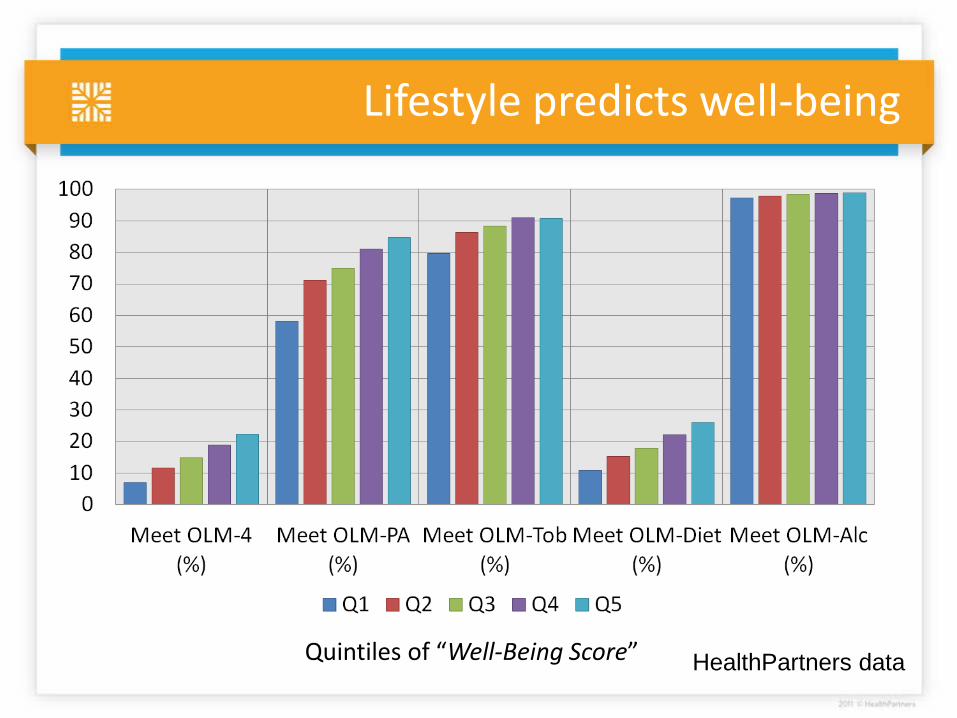
Lifestyle predicts well-being
Quintiles of “Well-Being Score” HealthPartners data
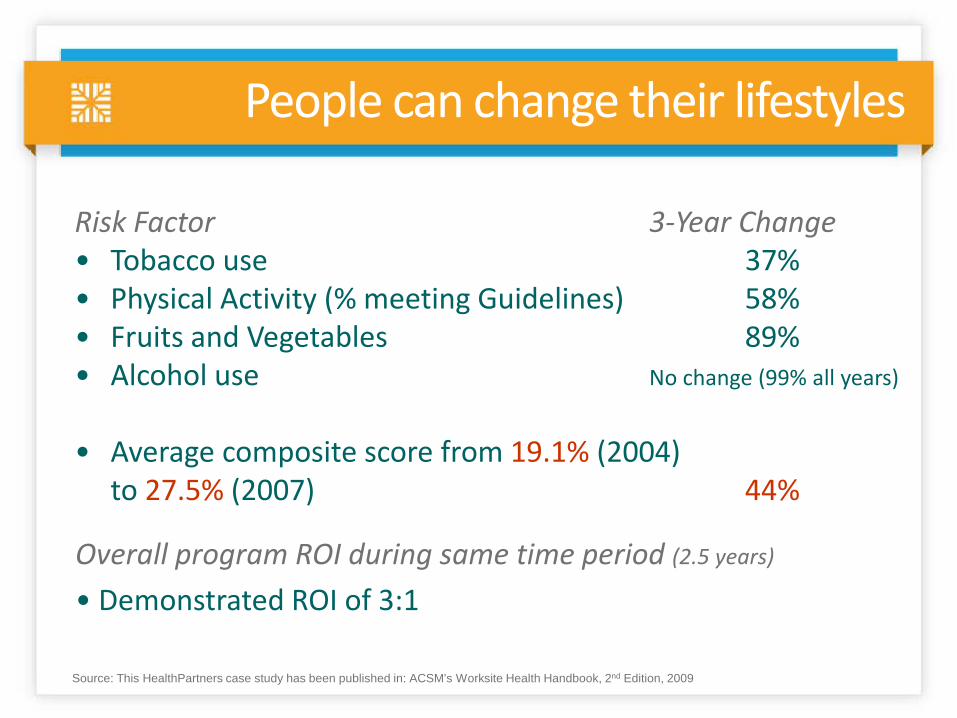
People can change their lifestyles
Source: This HealthPartners case study has been published in: ACSM’s Worksite Health Handbook, 2nd Edition, 2009
Risk Factor 3-Year Change • Tobacco use 37% • Physical Activity (% meeting Guidelines) 58% • Fruits and Vegetables 89% • Alcohol use No change (99% all years)
• Average composite score from 19.1% (2004) to 27.5% (2007) 44%
Overall program ROI during same time period (2.5 years)
• Demonstrated ROI of 3:1
24
Community safety
Education
Family & social support
Employment
Built environment
Environmental quality
Income
Unsafe sex
Alcohol use
Diet & exercise
Tobacco use
Access to care
Quality of care
Physical environment (10%)
Social & economic factors (40%)
Health behaviors (30%)
Clinical care (20%)
Health Factors
Programs and Policies
Health Outcomes Mortality (length of life): 50%
Morbidity (quality of life): 50%
County Health Rankings model © 2010 UWPHI
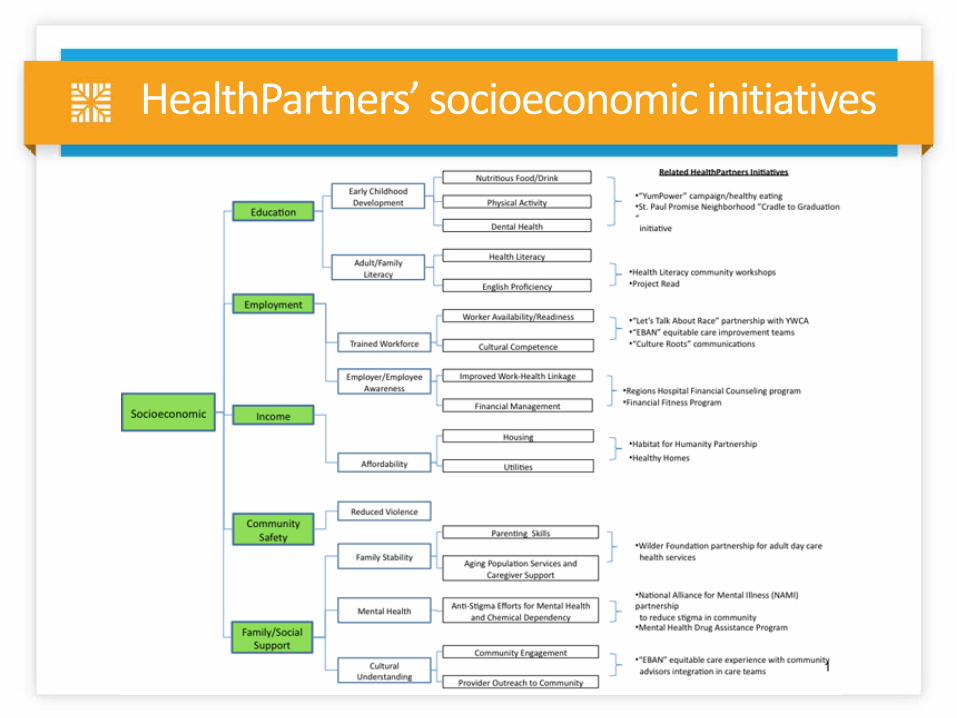
HealthPartners’ socioeconomic initiatives
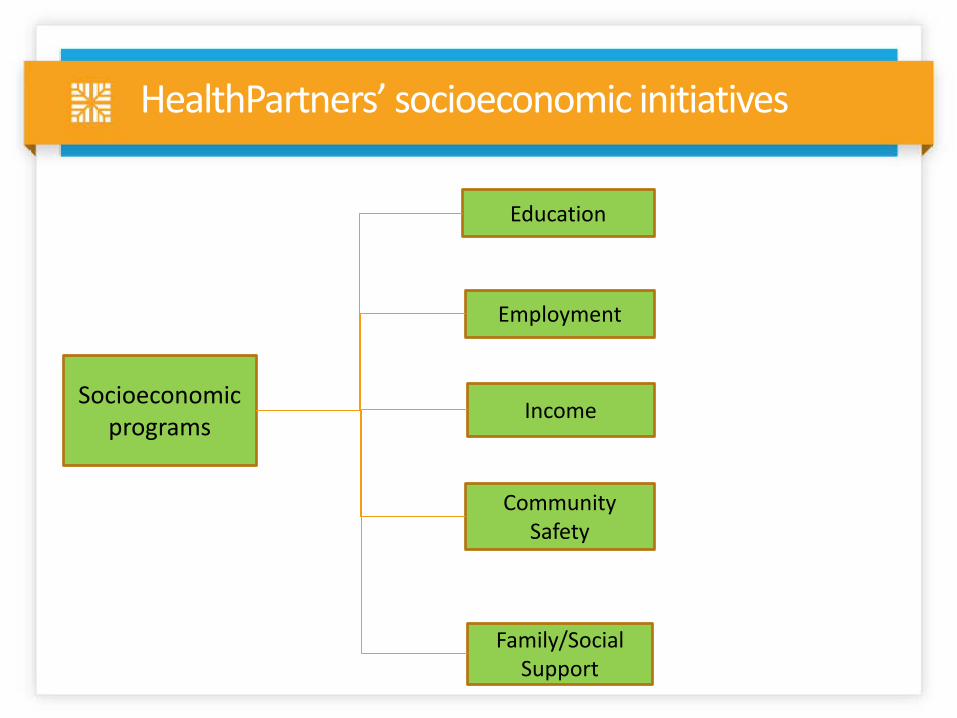
HealthPartners’ socioeconomic initiatives
Socioeconomic programs
Income
Family/Social Support
Community Safety
Employment
Education
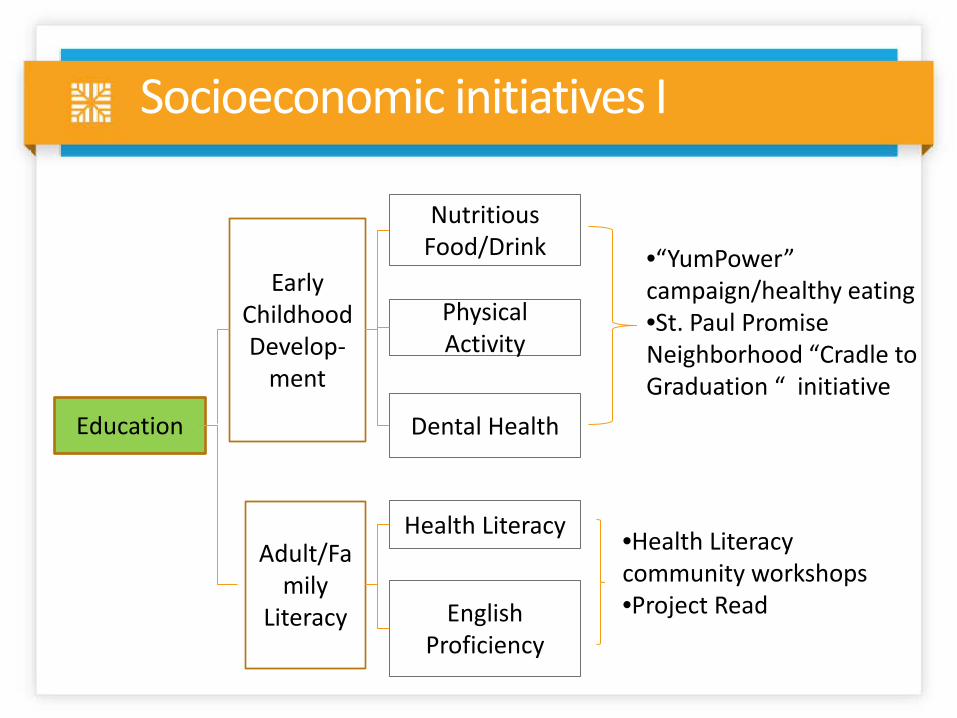
Adult/Family
Literacy
Early Childhood Develop-
ment
Physical Activity
Nutritious Food/Drink
Health Literacy
Dental Health
English Proficiency
•“YumPower” campaign/healthy eating •St. Paul Promise Neighborhood “Cradle to Graduation “ initiative
•Health Literacy community workshops •Project Read
Education
Socioeconomic initiatives I
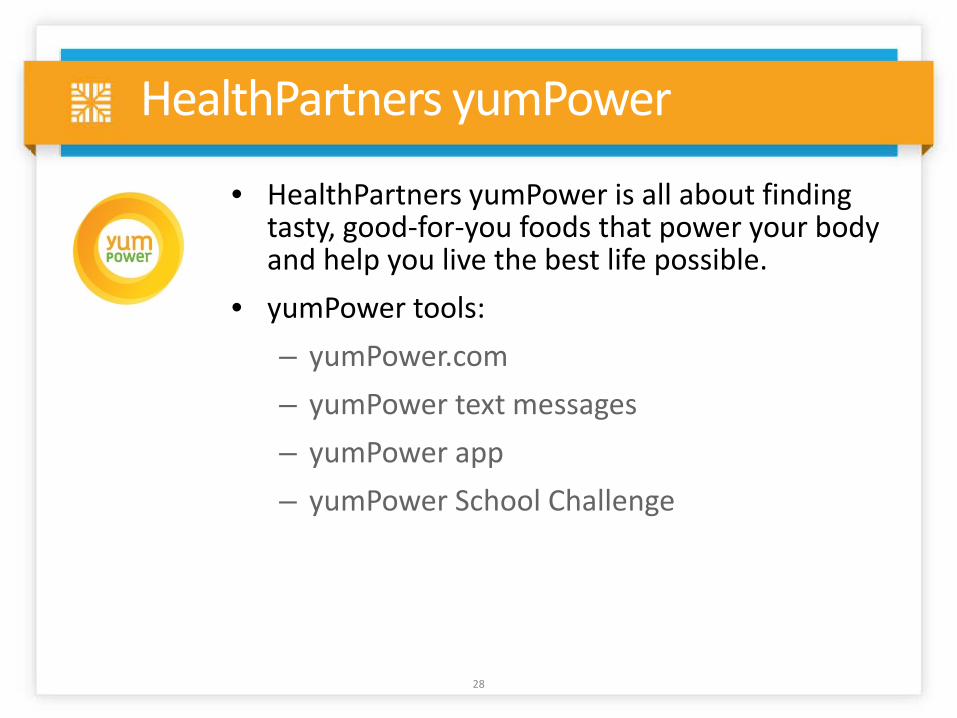
HealthPartners yumPower
• HealthPartners yumPower is all about finding tasty, good-for-you foods that power your body and help you live the best life possible.
• yumPower tools: – yumPower.com – yumPower text messages – yumPower app – yumPower School Challenge
28

29 29
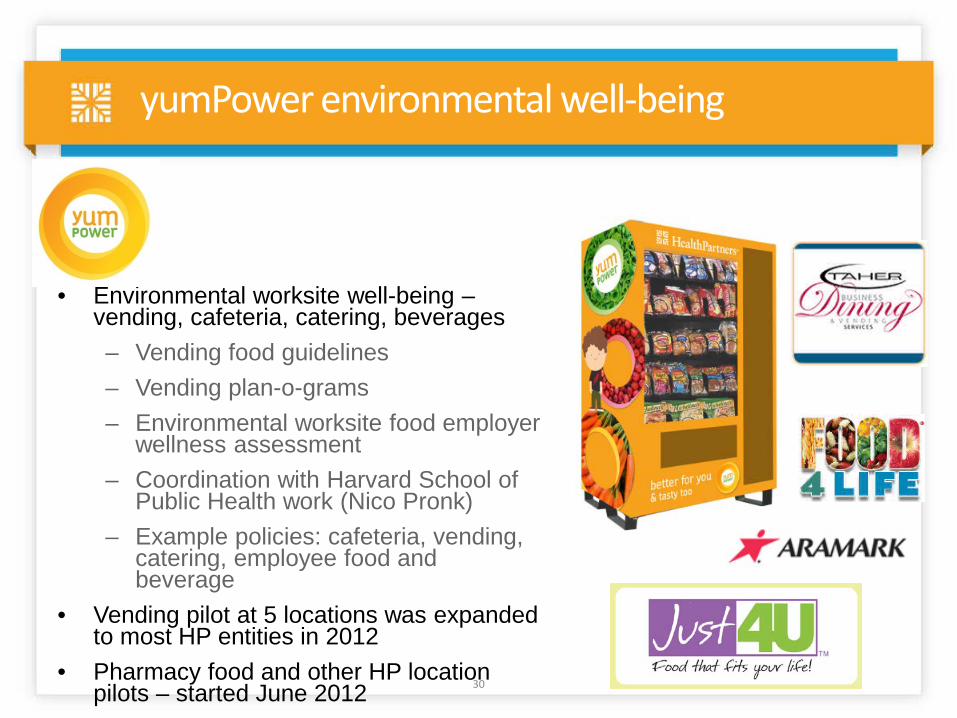
yumPower environmental well-being
• Environmental worksite well-being – vending, cafeteria, catering, beverages – Vending food guidelines – Vending plan-o-grams – Environmental worksite food employer
wellness assessment – Coordination with Harvard School of
Public Health work (Nico Pronk) – Example policies: cafeteria, vending,
catering, employee food and beverage
• Vending pilot at 5 locations was expanded to most HP entities in 2012
• Pharmacy food and other HP location pilots – started June 2012
30
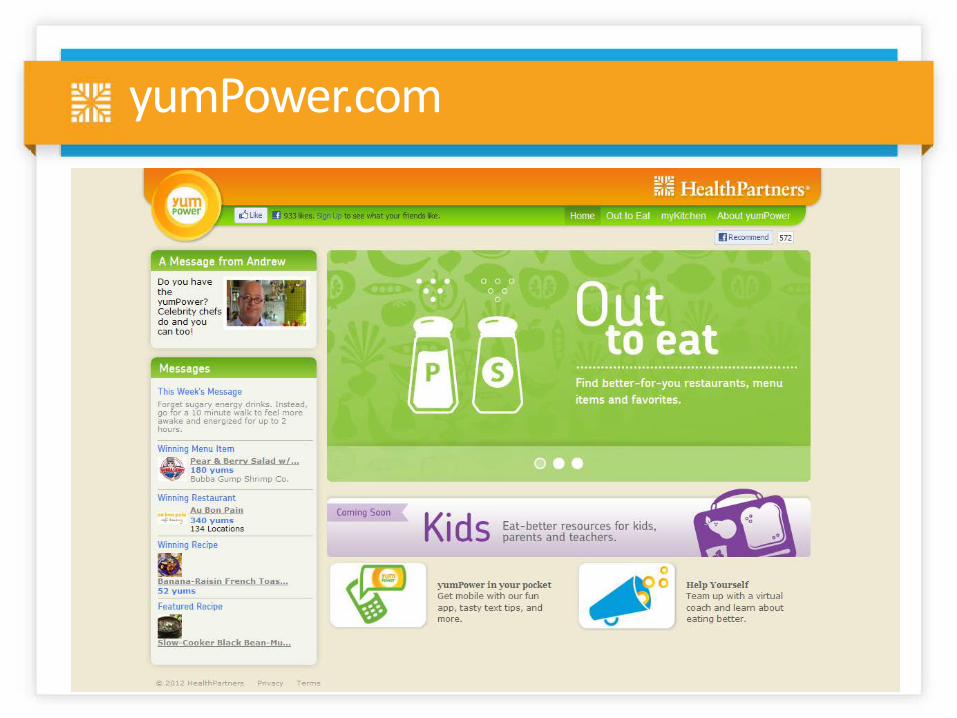
yumPower.com
31
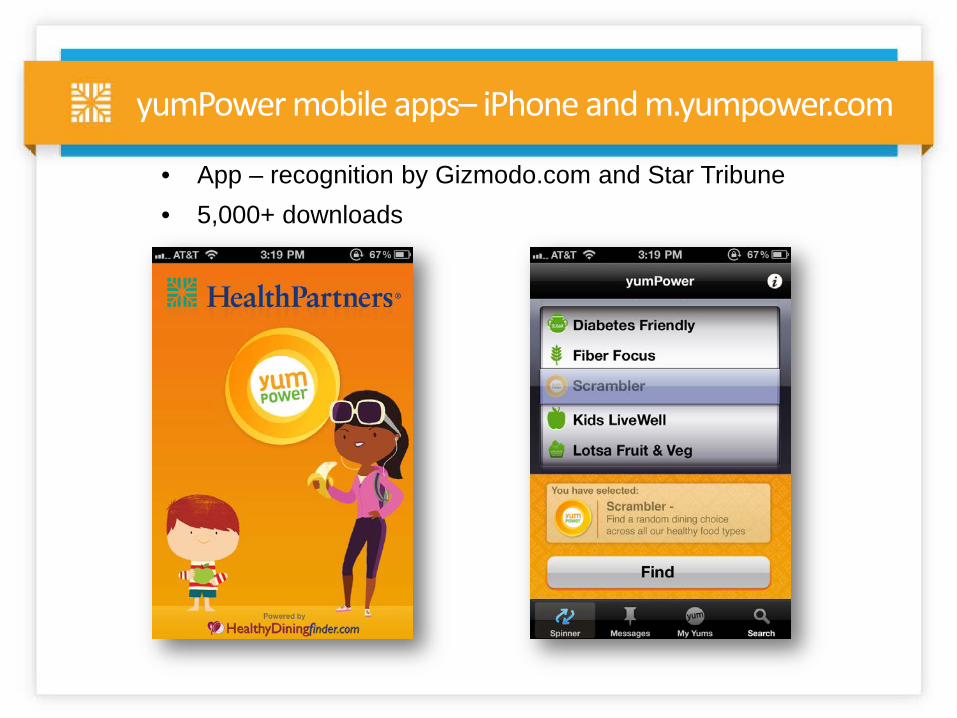
yumPower mobile apps– iPhone and m.yumpower.com • App – recognition by Gizmodo.com and Star Tribune • 5,000+ downloads

HealthPartners yumPower School Challenge

Teachers rave about the yumPower School Challenge
• “We’re really excited to see that our Superintendent as well as Senator Mary Jo McGuire attended the assembly today. The kids seemed to respond well and were excited to see new guests at their school. Thanks!” – Kelly Kantack, RN at Bruce Vento Elementary in St. Paul.
• “I do believe that tracking has been good for our younger students
especially. I am seeing many more fruits and veggies on trays as kids get their breakfast and lunch trays AND less is being dumped at the end of the meal time. I think it became a pattern for the kids and I am hoping very much that it continues to be the pattern.” – Vickie Spindler, Principal of Franklin Elementary in Anoka.
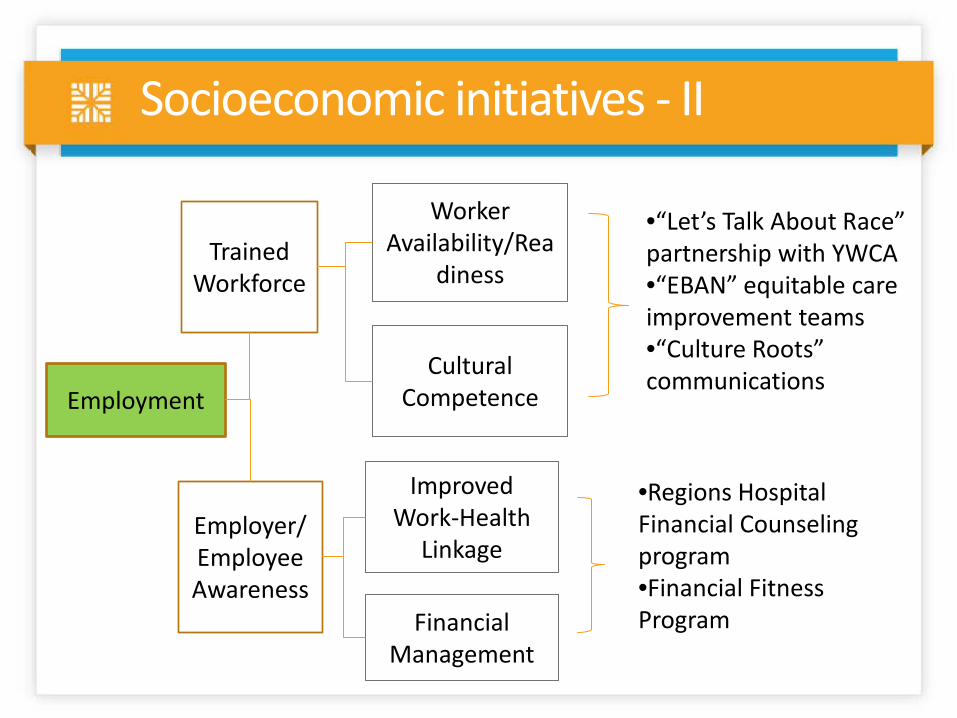
Trained Workforce
Employer/Employee Awareness
Worker Availability/Rea
diness
Cultural Competence
Financial Management
Improved Work-Health
Linkage
•Regions Hospital Financial Counseling program •Financial Fitness Program
Employment
•“Let’s Talk About Race” partnership with YWCA •“EBAN” equitable care improvement teams •“Culture Roots” communications
Socioeconomic initiatives - II
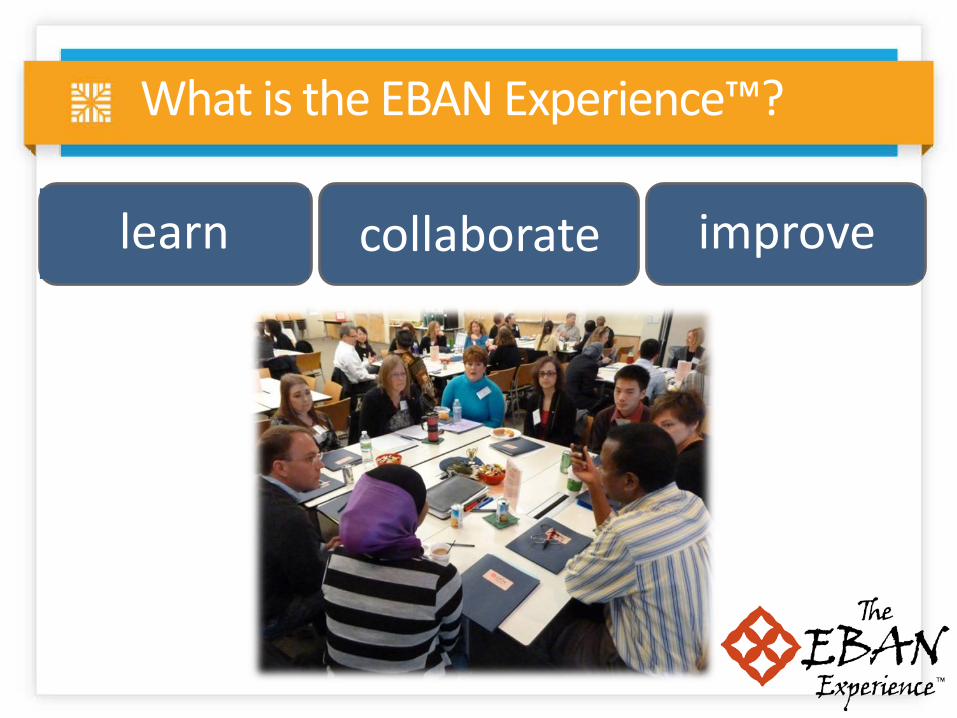
What is the EBAN Experience™?
learn collaborate improve
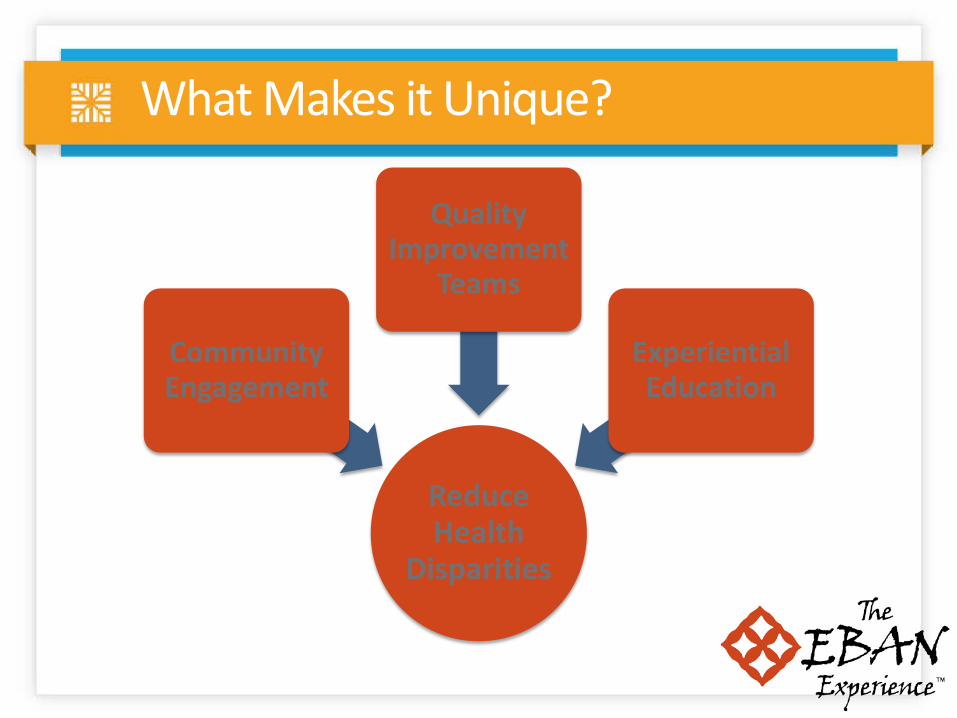
What Makes it Unique?
Reduce Health
Disparities
Community Engagement
Quality Improvement
Teams
Experiential Education
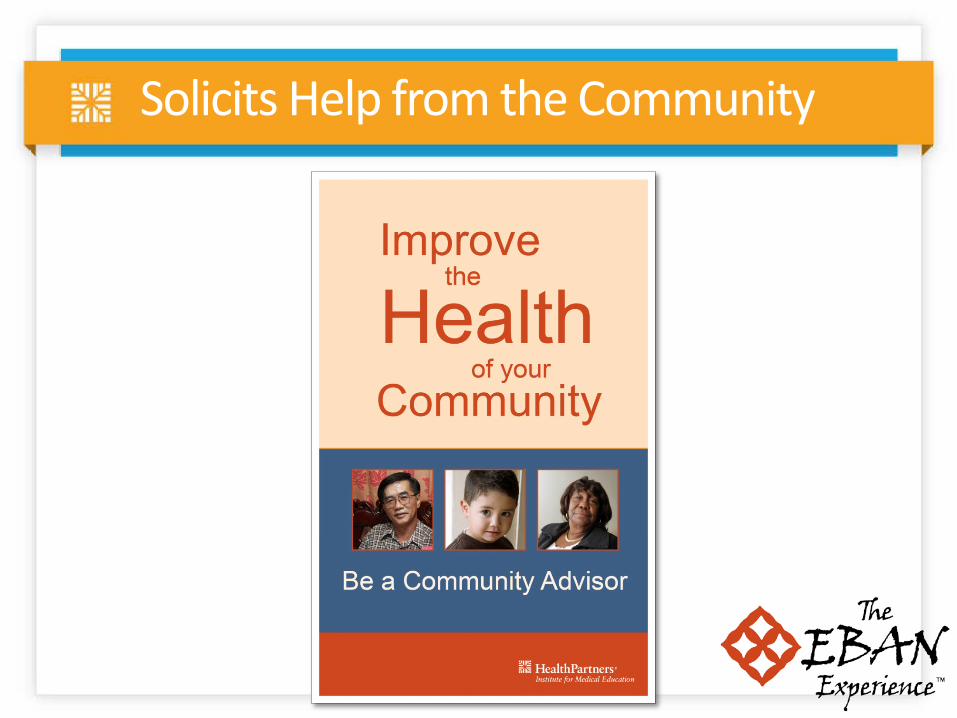
Solicits Help from the Community
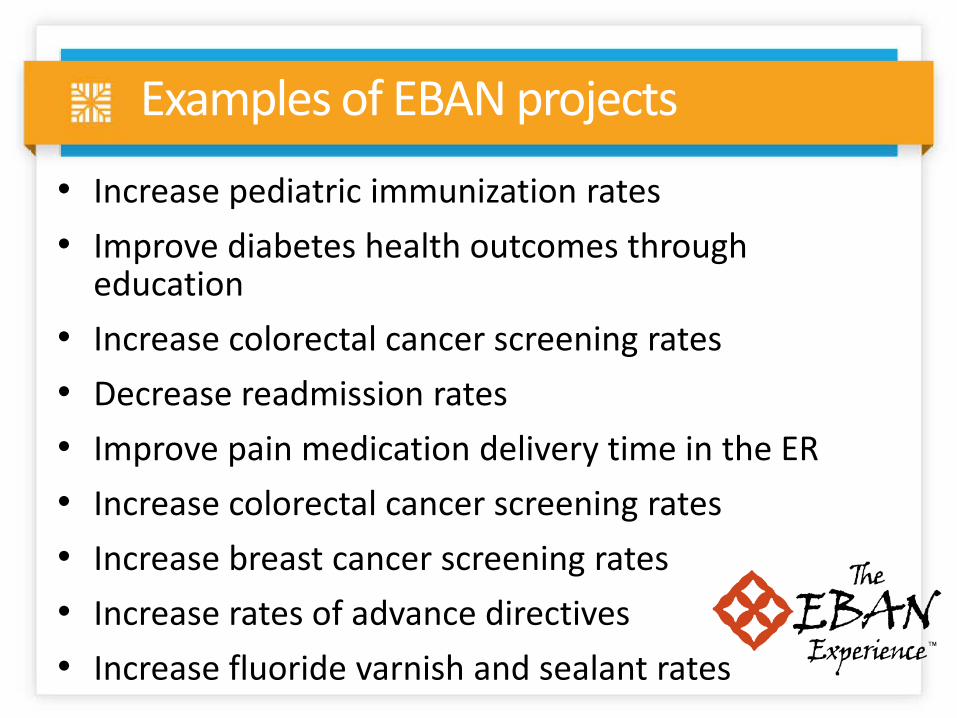
Examples of EBAN projects
• Increase pediatric immunization rates • Improve diabetes health outcomes through
education • Increase colorectal cancer screening rates • Decrease readmission rates • Improve pain medication delivery time in the ER • Increase colorectal cancer screening rates • Increase breast cancer screening rates • Increase rates of advance directives • Increase fluoride varnish and sealant rates
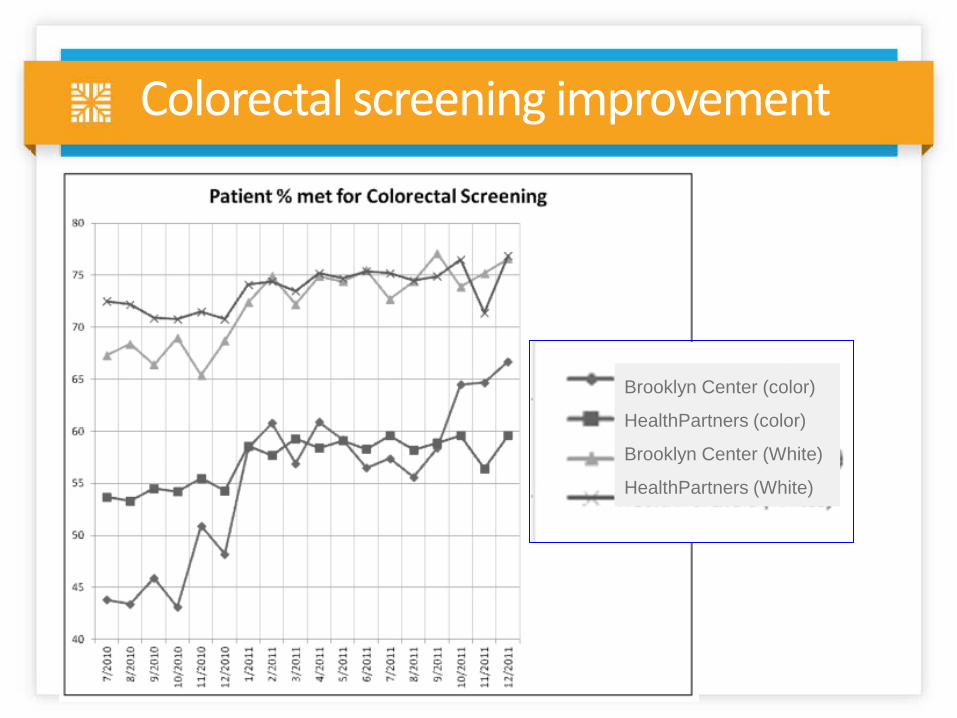
Colorectal screening improvement
Brooklyn Center (color)
HealthPartners (color)
Brooklyn Center (White)
HealthPartners (White)
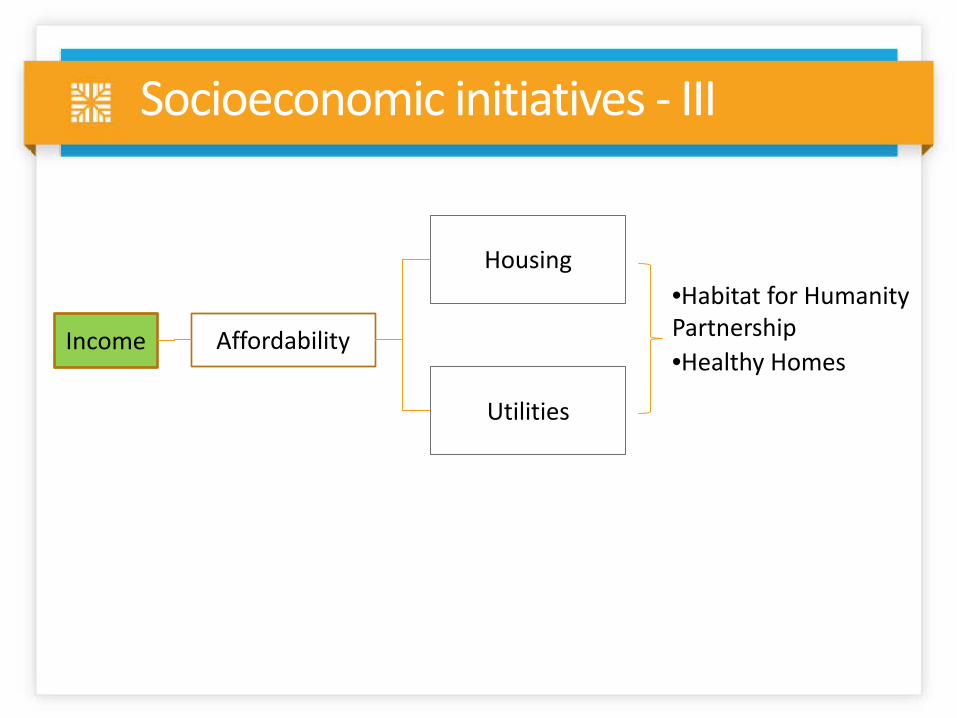
Income Affordability
Housing
Utilities
•Habitat for Humanity Partnership •Healthy Homes
Socioeconomic initiatives - III
A program of the Association for Nonsmokers—Minnesota
Smoke-Free Multi-Housing: For Health and Social Justice
Smoke-Free Multi-Housing: Healthier Buildings, Happier Tenants,
A Smart Investment.
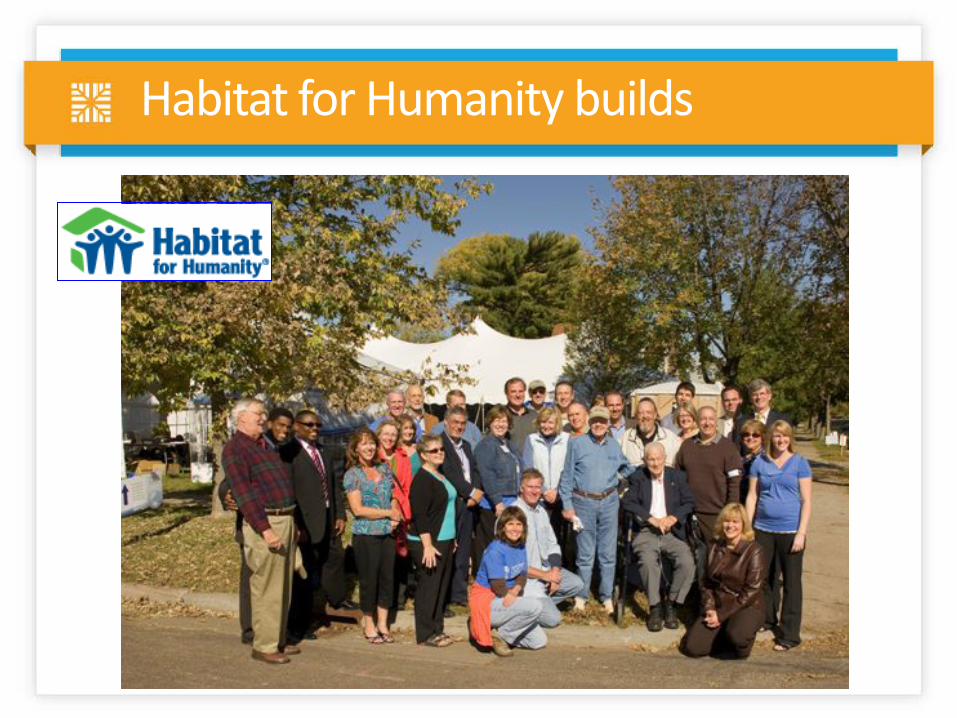
Habitat for Humanity builds
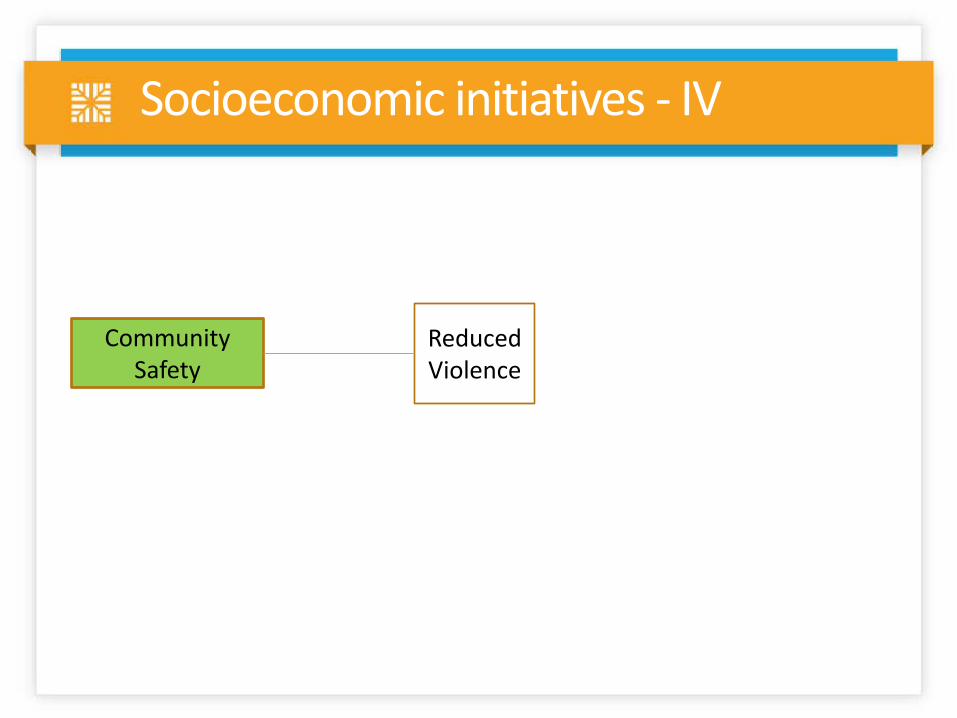
Community Safety
Reduced Violence
Socioeconomic initiatives - IV
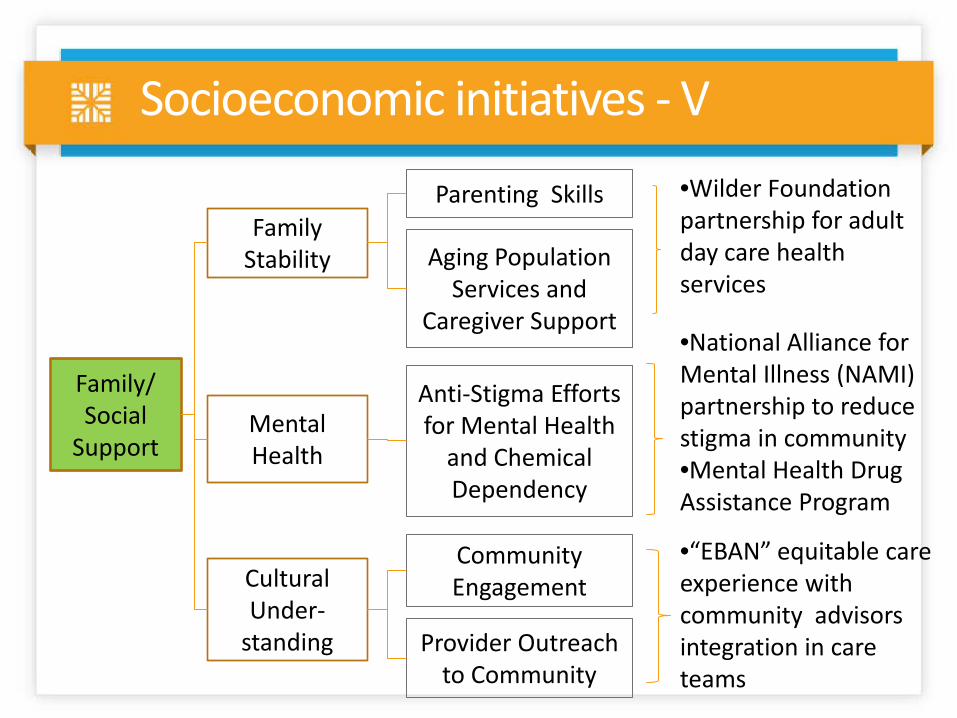
Family/ Social
Support
Family Stability
Mental Health
Anti-Stigma Efforts for Mental Health
and Chemical Dependency
Cultural Under-
standing
Community Engagement
Provider Outreach to Community
•Wilder Foundation partnership for adult day care health services
Parenting Skills
Aging Population Services and
Caregiver Support
•National Alliance for Mental Illness (NAMI) partnership to reduce stigma in community •Mental Health Drug Assistance Program
•“EBAN” equitable care experience with community advisors integration in care teams
Socioeconomic initiatives - V
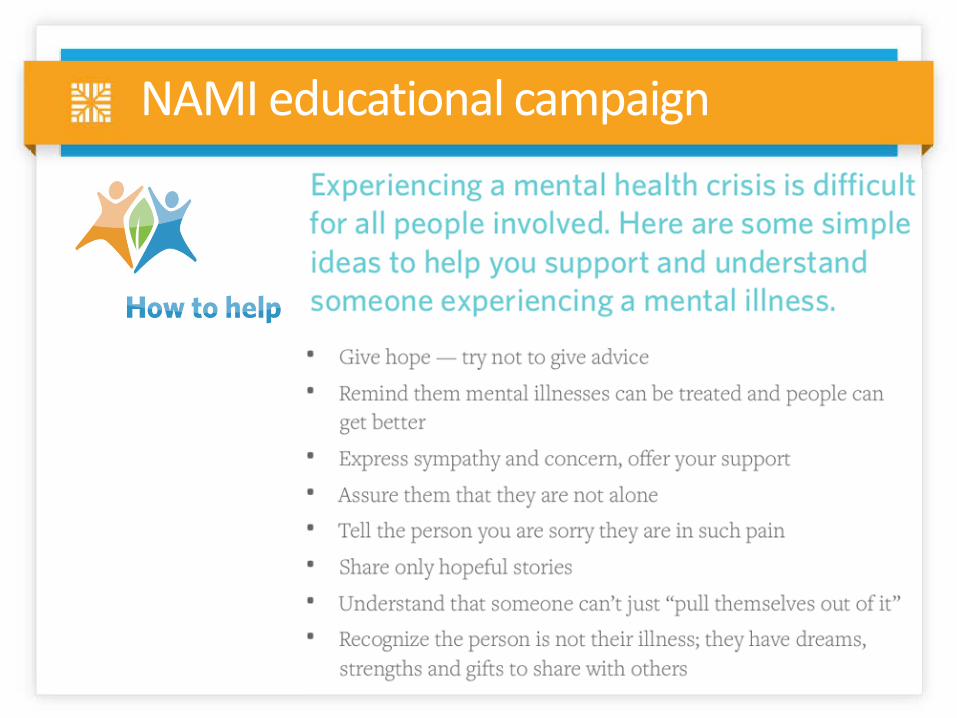
NAMI educational campaign

Join the fun at the NAMI Walk
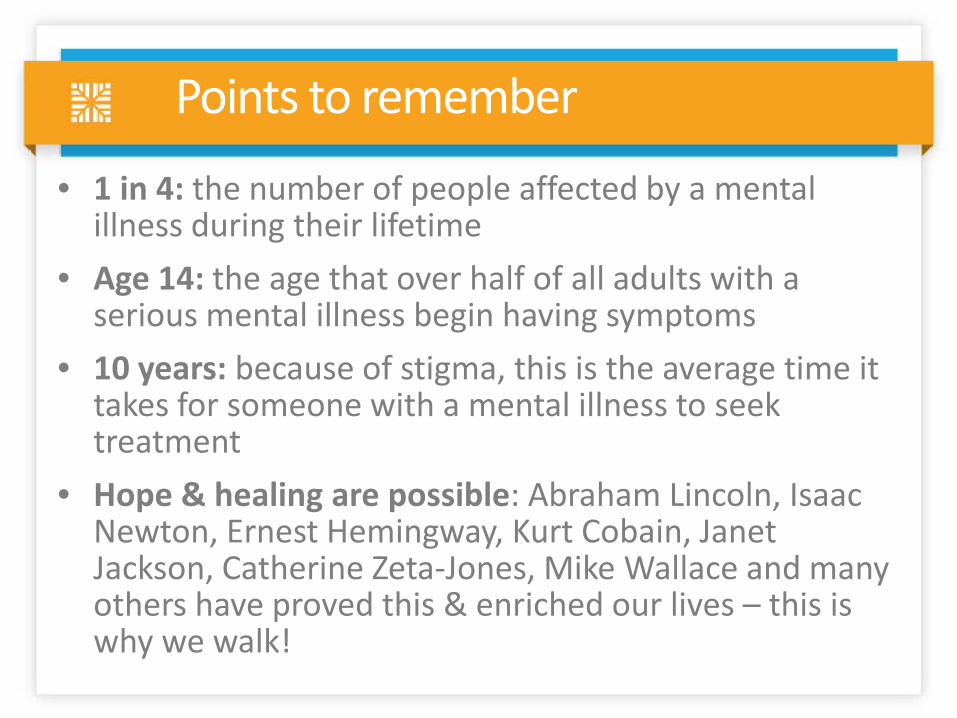
Points to remember
• 1 in 4: the number of people affected by a mental illness during their lifetime
• Age 14: the age that over half of all adults with a serious mental illness begin having symptoms
• 10 years: because of stigma, this is the average time it takes for someone with a mental illness to seek treatment
• Hope & healing are possible: Abraham Lincoln, Isaac Newton, Ernest Hemingway, Kurt Cobain, Janet Jackson, Catherine Zeta-Jones, Mike Wallace and many others have proved this & enriched our lives – this is why we walk!

Destigmatizing mental illness
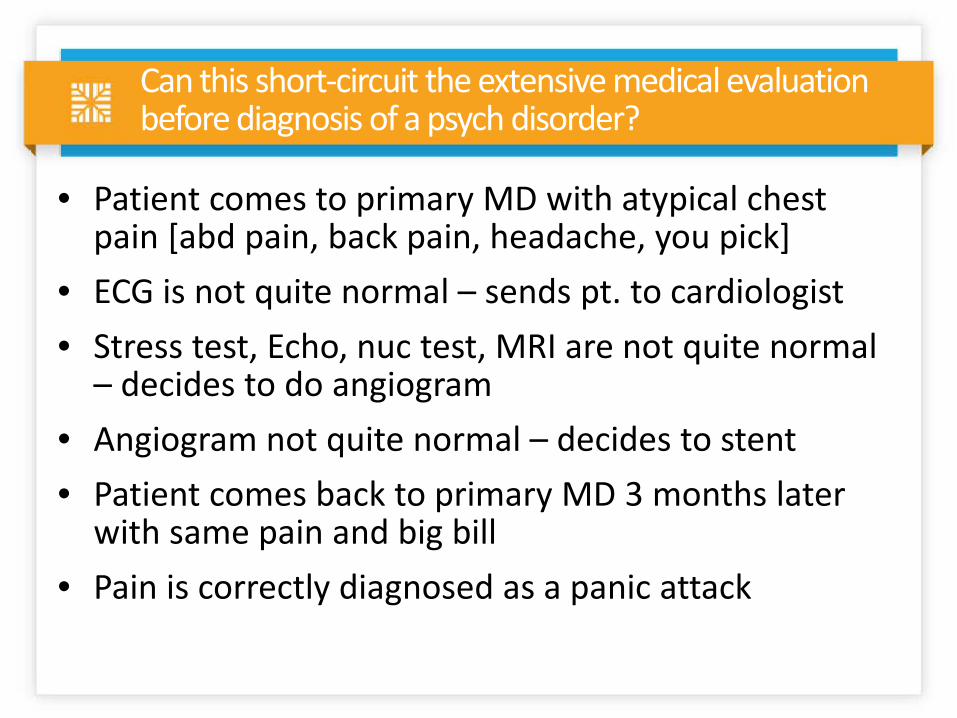
Can this short-circuit the extensive medical evaluation before diagnosis of a psych disorder?
• Patient comes to primary MD with atypical chest pain [abd pain, back pain, headache, you pick]
• ECG is not quite normal – sends pt. to cardiologist • Stress test, Echo, nuc test, MRI are not quite normal
– decides to do angiogram • Angiogram not quite normal – decides to stent • Patient comes back to primary MD 3 months later
with same pain and big bill • Pain is correctly diagnosed as a panic attack
How do we know that we are having an impact?
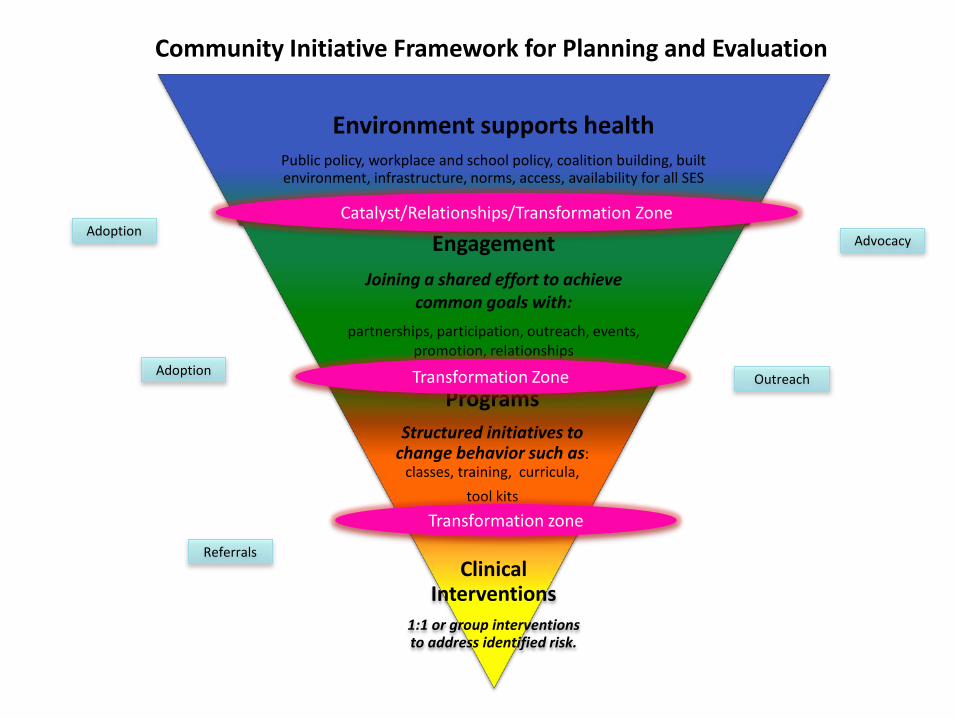
Environment supports health
Public policy, workplace and school policy, coalition building, built environment, infrastructure, norms, access, availability for all SES
Engagement Joining a shared effort to achieve
common goals with: partnerships, participation, outreach, events,
promotion, relationships
Programs Structured initiatives to
change behavior such as: classes, training, curricula,
tool kits
Clinical Interventions
1:1 or group interventions to address identified risk.
Catalyst/Relationships/Transformation Zone
Transformation Zone
Community Initiative Framework for Planning and Evaluation
Referrals
Advocacy Adoption
Adoption Outreach
Transformation zone
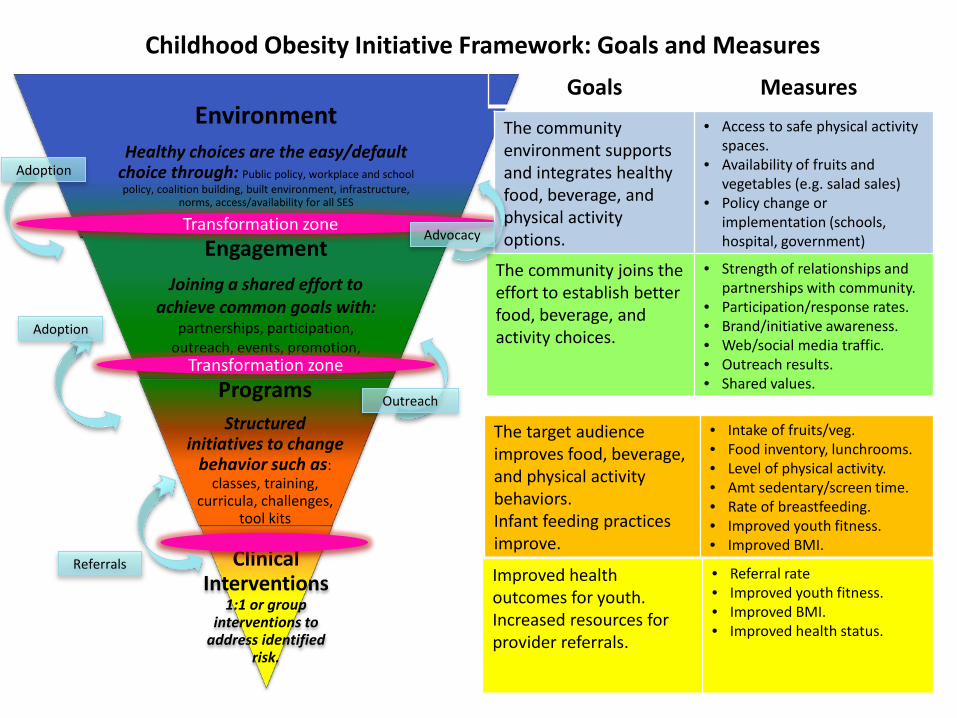
Environment
Healthy choices are the easy/default choice through: Public policy, workplace and school policy, coalition building, built environment, infrastructure,
norms, access/availability for all SES
Engagement Joining a shared effort to
achieve common goals with: partnerships, participation,
outreach, events, promotion, interactions
Programs Structured
initiatives to change behavior such as:
classes, training, curricula, challenges,
tool kits
Clinical Interventions
1:1 or group interventions to
address identified risk.
Transformation zone
Transformation zone
Childhood Obesity Initiative Framework: Goals and Measures Goals Measures
The community environment supports and integrates healthy food, beverage, and physical activity options.
• Access to safe physical activity spaces.
• Availability of fruits and vegetables (e.g. salad sales)
• Policy change or implementation (schools, hospital, government)
The community joins the effort to establish better food, beverage, and activity choices.
• Strength of relationships and partnerships with community.
• Participation/response rates. • Brand/initiative awareness. • Web/social media traffic. • Outreach results. • Shared values.
The target audience improves food, beverage, and physical activity behaviors. Infant feeding practices improve.
• Intake of fruits/veg. • Food inventory, lunchrooms. • Level of physical activity. • Amt sedentary/screen time. • Rate of breastfeeding. • Improved youth fitness. • Improved BMI.
Improved health outcomes for youth. Increased resources for provider referrals.
• Referral rate • Improved youth fitness. • Improved BMI. • Improved health status.
Referrals
Advocacy
Adoption
Adoption
Outreach
HealthPartners Health Driver Diagram
Improved Health
(As Measured
by a Summary
Measure of Health)
Key Outcome
Primary Drivers
Preventive Services Acute Care Chronic Disease End of Life Cross Cutting Issues
Tobacco Non-use Activity Diet/Nutrition Alcohol Use
Community Identified Drivers (Advocacy and Participation)
Health Care (20%)
Health Behaviors
(30%)
Socio-economic Factors (40%)
Environmental Factors (10%)
Modified from Isham G and Zimmerman D, HealthPartners Board of Directors Retreat, October 2010
Health Determinant
Alignment with Mission,
Capabilities, and Degree of Control
• Central to Mission • Many Capabilities • High Control
• Central to Mission • Shared Capabilities • Shared Control
• Aligned with Mission
• Limited Capabilities • Limited Control
Community Identified Drivers (Advocacy and Participation)
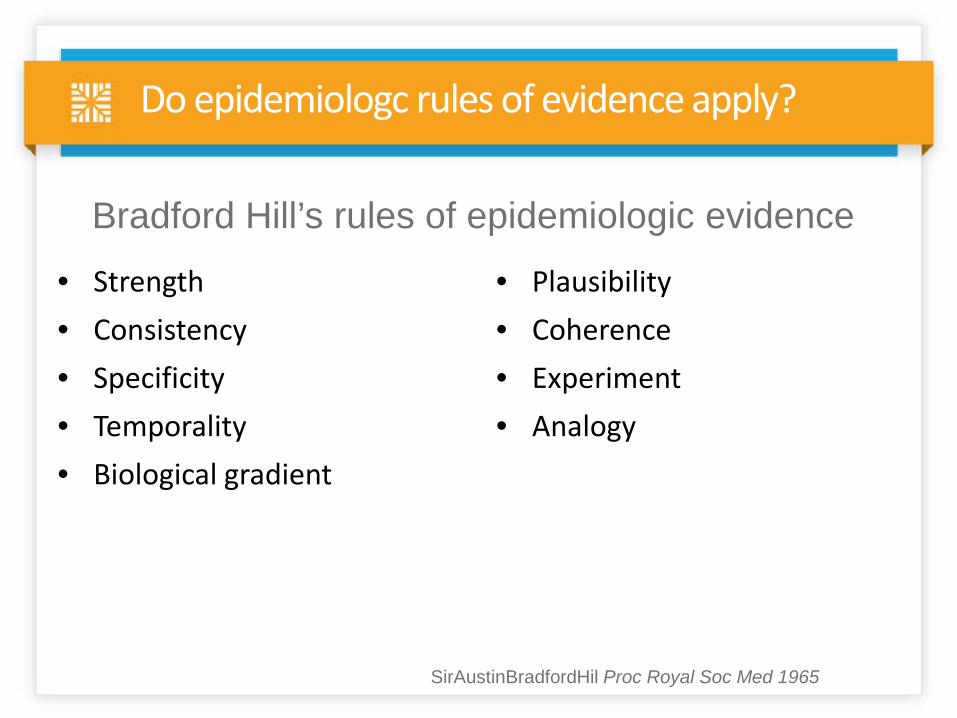
Do epidemiologc rules of evidence apply?
• Strength • Consistency • Specificity • Temporality • Biological gradient
• Plausibility • Coherence • Experiment • Analogy
SirAustinBradfordHil Proc Royal Soc Med 1965
Bradford Hill’s rules of epidemiologic evidence
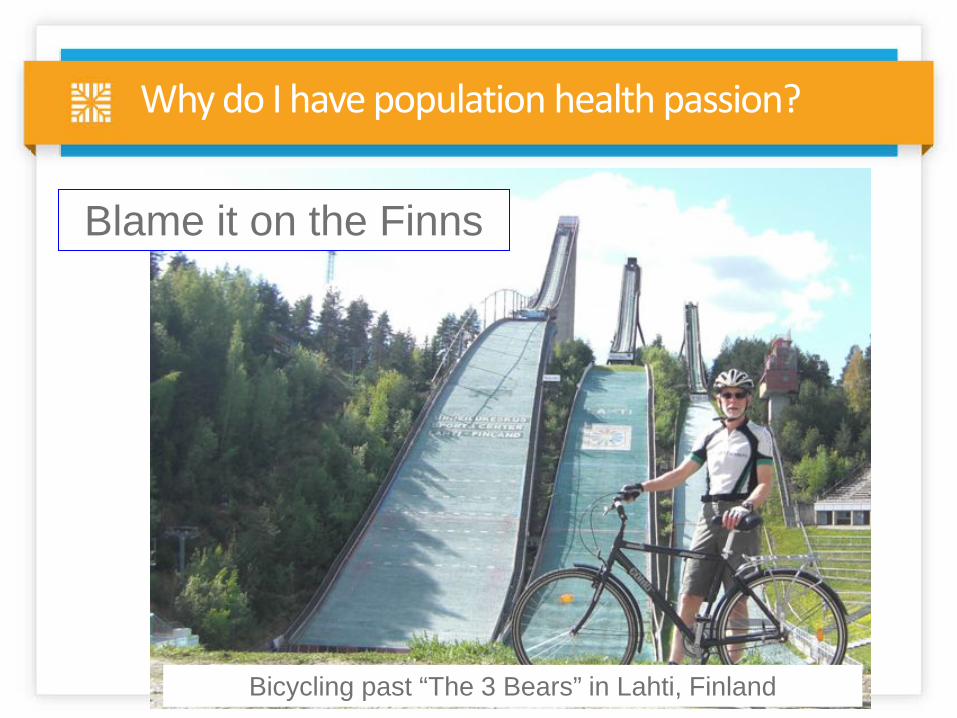
Why do I have population health passion?
Blame it on the Finns
Bicycling past “The 3 Bears” in Lahti, Finland
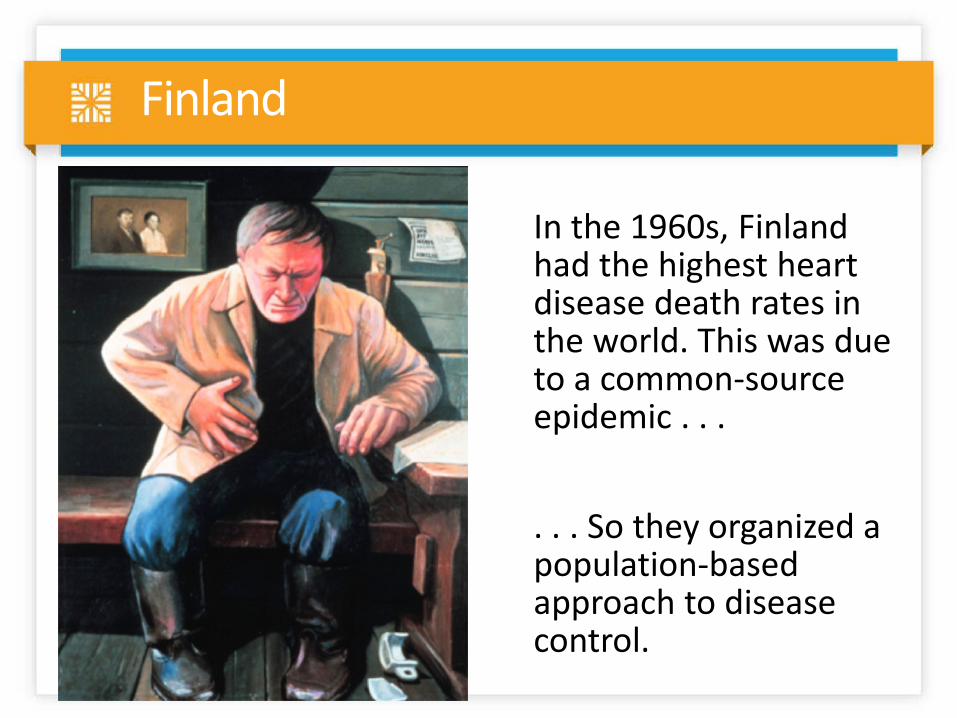
Finland
In the 1960s, Finland had the highest heart disease death rates in the world. This was due to a common-source epidemic . . . . . . So they organized a population-based approach to disease control.
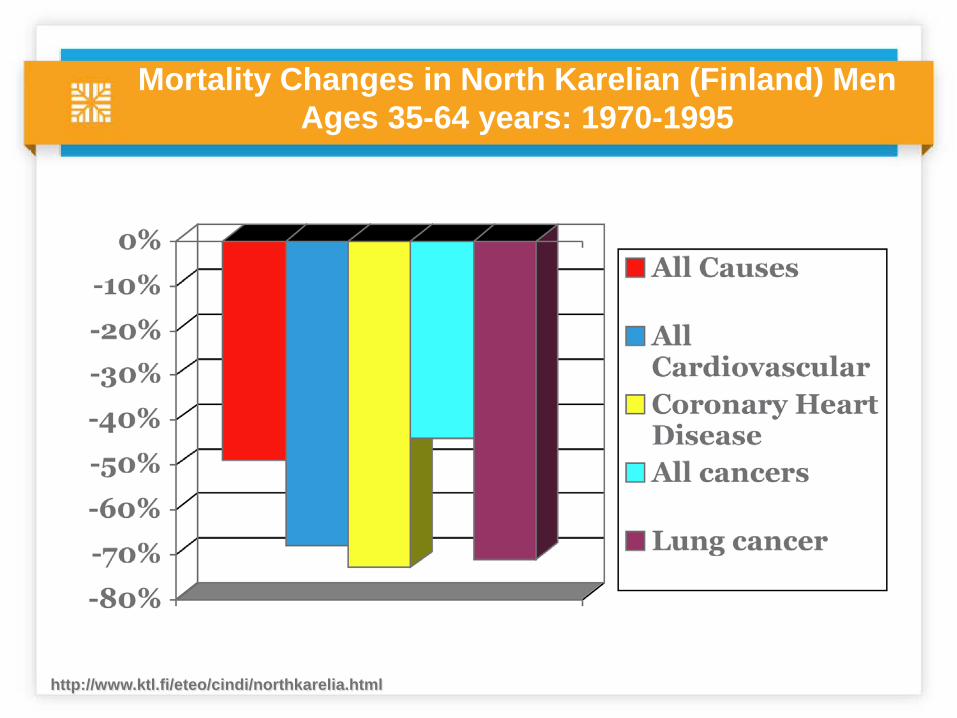
Mortality Changes in North Karelian (Finland) Men Ages 35-64 years: 1970-1995
http://www.ktl.fi/eteo/cindi/northkarelia.html
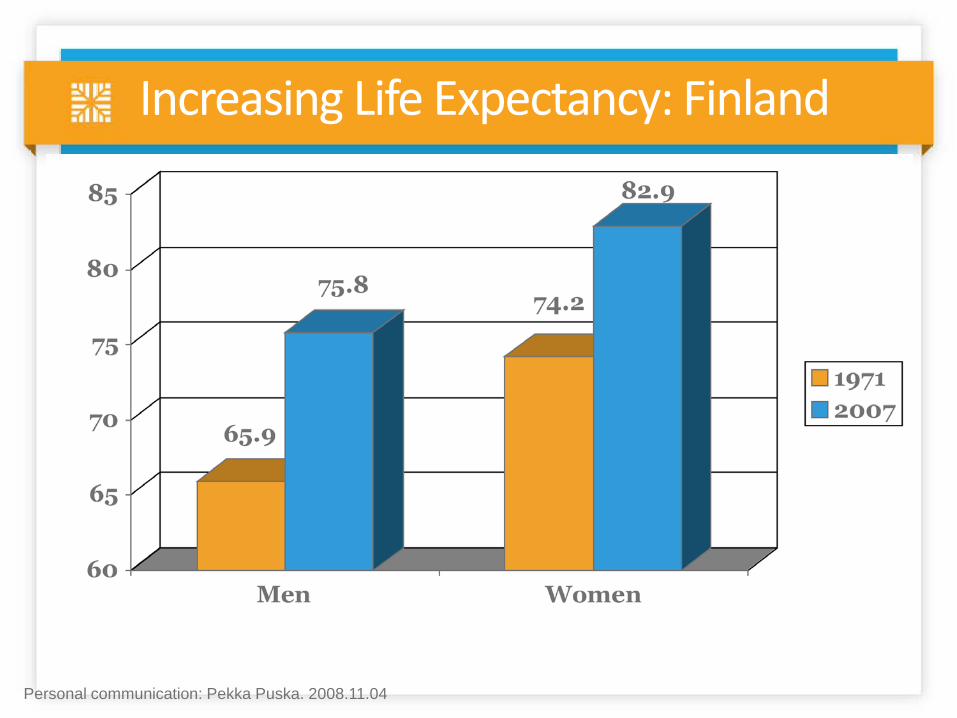
Increasing Life Expectancy: Finland
Personal communication: Pekka Puska. 2008.11.04
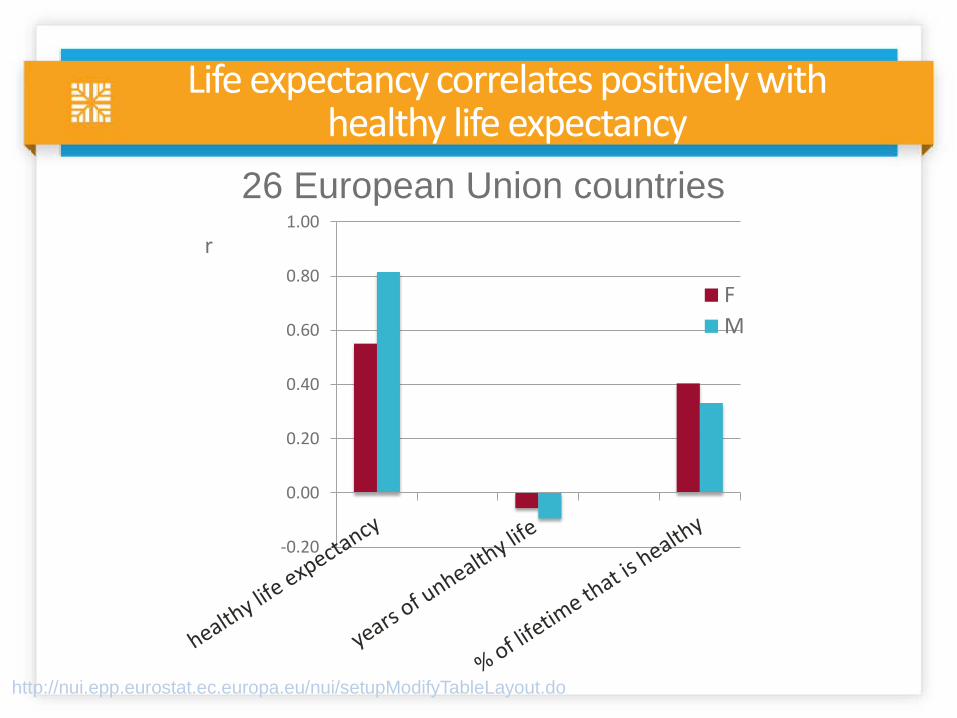
Life expectancy correlates positively with healthy life expectancy
-0.20
0.00
0.20
0.40
0.60
0.80
1.00
FM
r
http://nui.epp.eurostat.ec.europa.eu/nui/setupModifyTableLayout.do
26 European Union countries
Thanks!
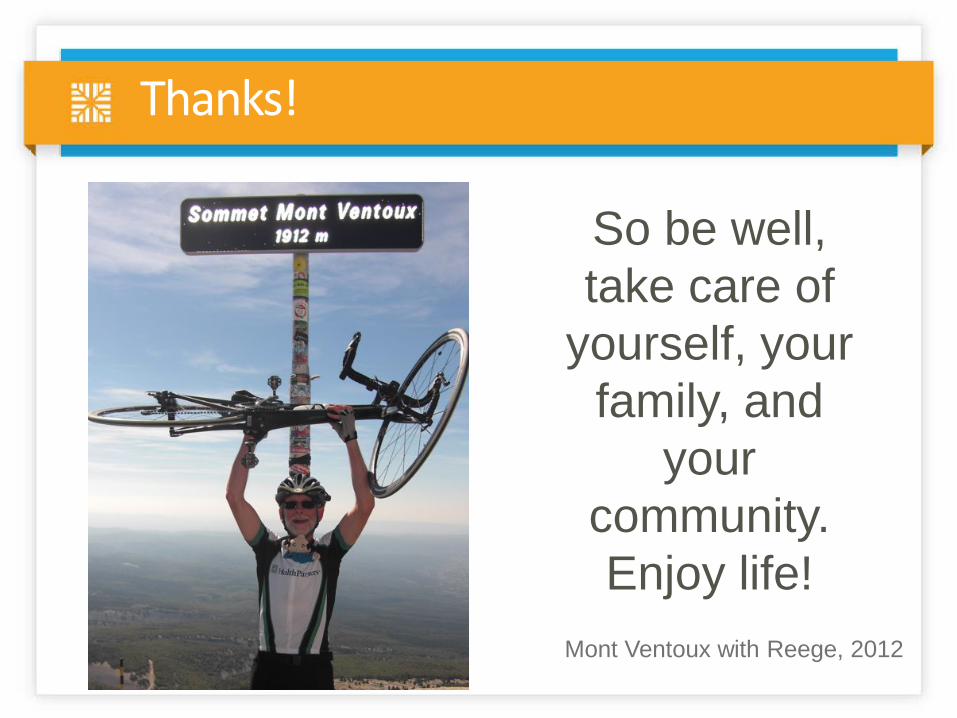
Mont Ventoux with Reege, 2012
So be well, take care of
yourself, your family, and
your community. Enjoy life!

Descending from La Berarde in the High Alps, France