Embed Size (px)
Citation preview

Promotion of the FMSP Fishery Promotion of the FMSP Fishery Management and Stock Assessment Management and Stock Assessment
GuidesGuides
Part 2. Part 2.
The ‘Stock Assessment Guide’The ‘Stock Assessment Guide’
Presented at:Presented at:
CRFM 2CRFM 2ndnd Annual Science Conference Annual Science Conference
Trinidad and Tobago, March 2006Trinidad and Tobago, March 2006
By Dan Hoggarth, By Dan Hoggarth, Scales Consulting LtdScales Consulting Ltd
Reminder….Reminder….
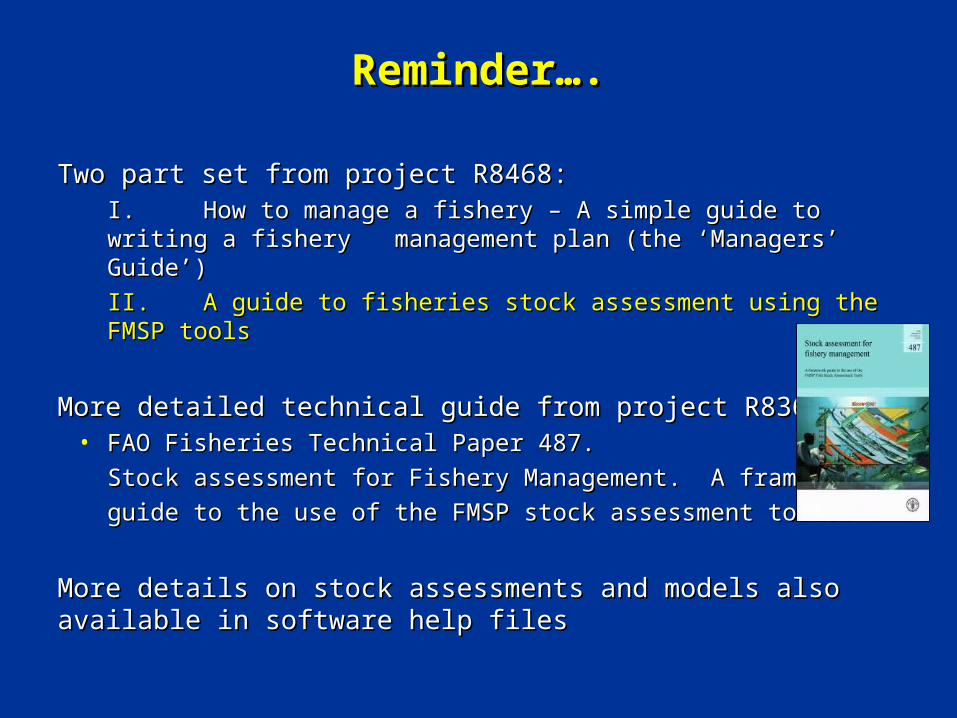
Two part set from project R8468:Two part set from project R8468:I. I. How to manage a fishery – A simple guide to writing a fishery How to manage a fishery – A simple guide to writing a fishery management plan (the ‘Managers’ Guide’)management plan (the ‘Managers’ Guide’)
II. II. A guide to fisheries stock assessment using the FMSP toolsA guide to fisheries stock assessment using the FMSP tools
More detailed technical guide from project R8360:More detailed technical guide from project R8360:• FAO Fisheries Technical Paper 487. FAO Fisheries Technical Paper 487.
Stock assessment for Fishery Management. A framework Stock assessment for Fishery Management. A framework
guide to the use of the FMSP stock assessment tools.guide to the use of the FMSP stock assessment tools.
More details on stock assessments and models also available in More details on stock assessments and models also available in software help filessoftware help files

The ‘SA’ Guide - Table of ContentsThe ‘SA’ Guide - Table of Contents
PrefacePreface
11 What is the role of stock assessment in fishery management?What is the role of stock assessment in fishery management?
22 What is a stock assessment?What is a stock assessment?
33 What tools can I use to make a stock assessment?What tools can I use to make a stock assessment?
44 How do I select the best tool for the job?How do I select the best tool for the job?
55 How should I provide stock assessment advice to managers?How should I provide stock assessment advice to managers?
66 ReferencesReferences
AnnexesAnnexes
Annex 1. A checklist for fisheries scientistsAnnex 1. A checklist for fisheries scientists
Annex 2. Glossary of termsAnnex 2. Glossary of terms
Annex 3. The analytical approach to stock assessment using Annex 3. The analytical approach to stock assessment using LFDALFDA and and YieldYield
Annex 2. The biomass dynamic approach to stock assessment using Annex 2. The biomass dynamic approach to stock assessment using CEDACEDA
Annex 3. Using the Annex 3. Using the ParFishParFish tool in data-limited situations and co-management tool in data-limited situations and co-management
1. What is the role of Stock 1. What is the role of Stock Assessment in fishery Assessment in fishery
management?management?
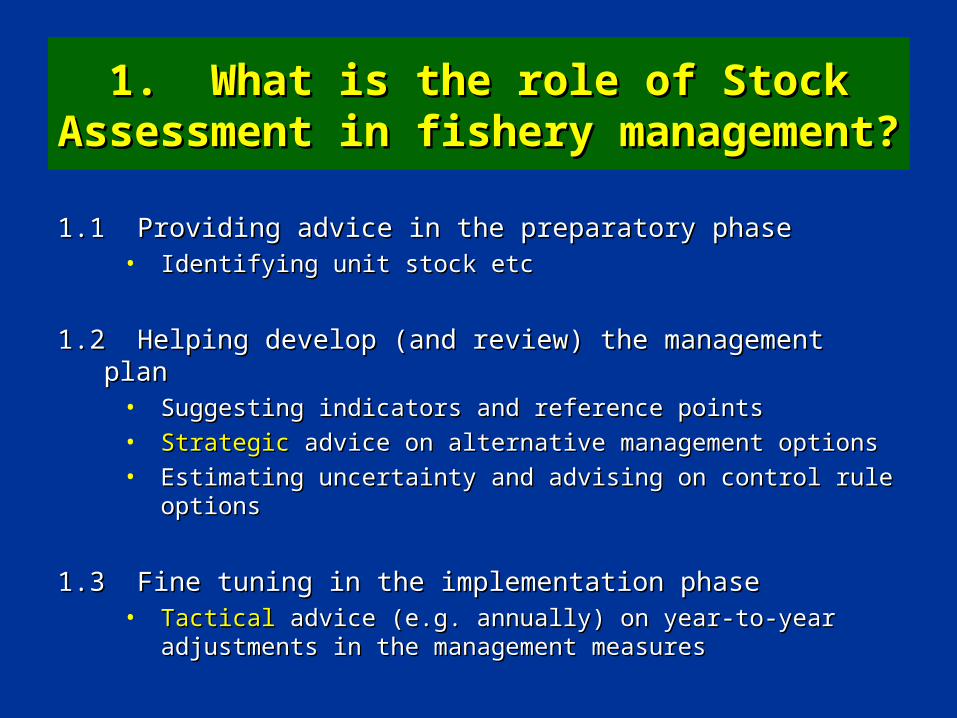
1.1 Providing advice in the preparatory phase1.1 Providing advice in the preparatory phase• Identifying unit stock etcIdentifying unit stock etc
1.2 Helping develop (and review) the management plan 1.2 Helping develop (and review) the management plan • Suggesting indicators and reference pointsSuggesting indicators and reference points
• StrategicStrategic advice on alternative management options advice on alternative management options
• Estimating uncertainty and advising on control rule optionsEstimating uncertainty and advising on control rule options
1.3 Fine tuning in the implementation phase1.3 Fine tuning in the implementation phase• TacticalTactical advice (e.g. annually) on year-to-year adjustments in the advice (e.g. annually) on year-to-year adjustments in the
management measuresmanagement measures
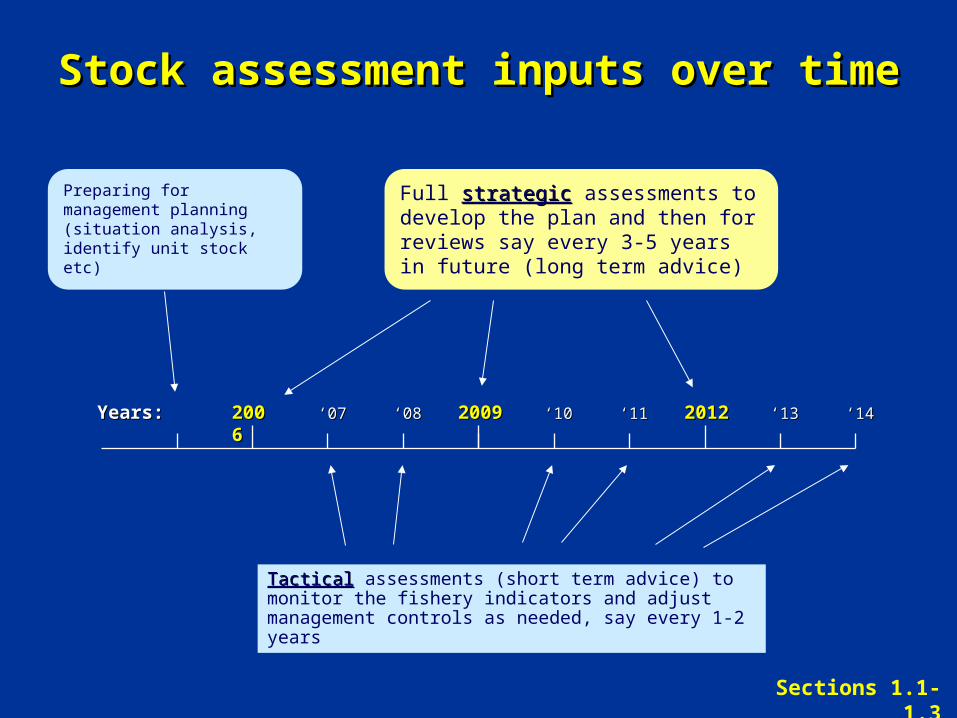
Stock assessment inputs over Stock assessment inputs over timetime
TacticalTactical assessments (short term advice) to monitor the fishery indicators and adjust management controls as needed, say every 1-2 years
20062006 20092009 20122012‘‘0707 ‘‘0808 ‘‘1010 ‘‘1111 ‘‘1313 ‘‘1414Years:Years:
Preparing for management planning (situation analysis, identify unit stock etc)
Full strategicstrategic assessments to develop the plan and then for reviews say every 3-5 years in future (long term advice)
Sections 1.1-1.3
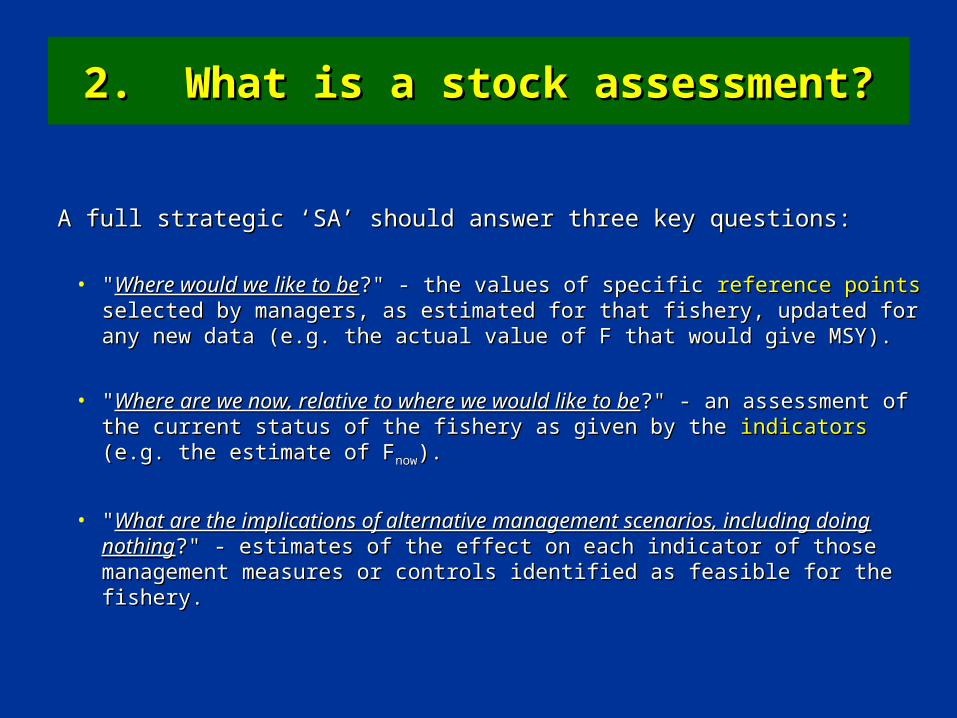
2. What is a stock assessment?2. What is a stock assessment?
A full strategic ‘SA’ should answer three key questions:A full strategic ‘SA’ should answer three key questions:
• ""Where would we like to beWhere would we like to be?" - the values of specific ?" - the values of specific reference pointsreference points selected by managers, as estimated for that fishery, updated for any new selected by managers, as estimated for that fishery, updated for any new data (e.g. the actual value of F that would give MSY).data (e.g. the actual value of F that would give MSY).
• ""Where are we now, relative to where we would like to beWhere are we now, relative to where we would like to be?" - an assessment ?" - an assessment of the current status of the fishery as given by the of the current status of the fishery as given by the indicatorsindicators (e.g. the (e.g. the estimate of Festimate of Fnownow).).
• ""What are the implications of alternative management scenarios, including What are the implications of alternative management scenarios, including doing nothingdoing nothing?" - estimates of the effect on each indicator of those ?" - estimates of the effect on each indicator of those management measures or controls identified as feasible for the fishery.management measures or controls identified as feasible for the fishery.
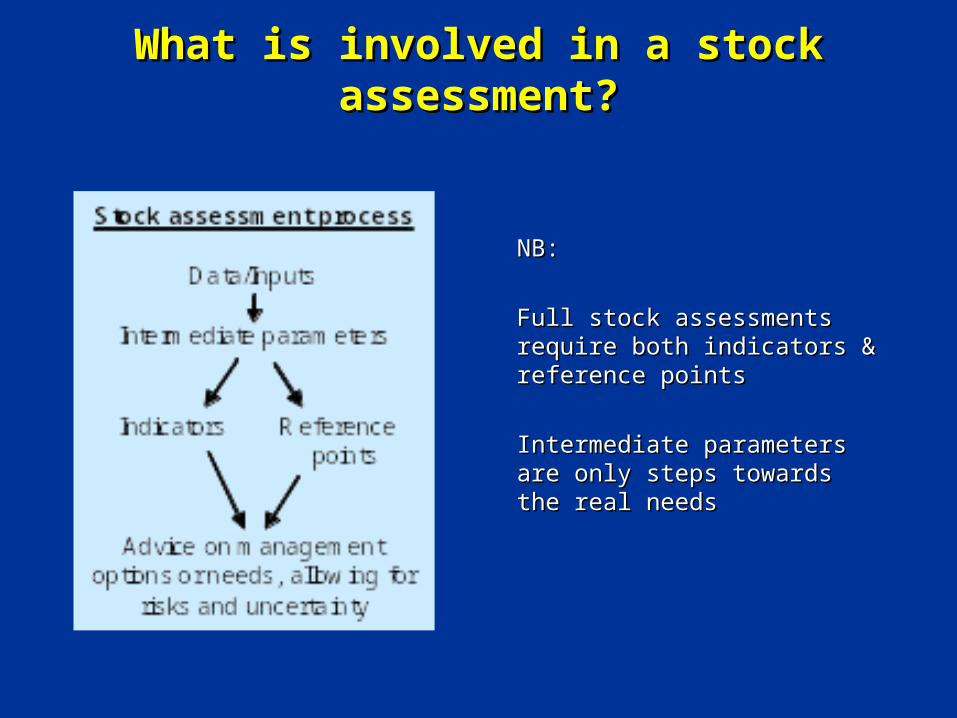
What is involved in a stock What is involved in a stock assessment?assessment?
NB:NB:
Full stock assessments require Full stock assessments require both indicators & reference pointsboth indicators & reference points
Intermediate parameters are only Intermediate parameters are only steps towards the real needssteps towards the real needs

Example Example Stock Stock
AssessmenAssessment Elementst Elements
Data / Inputs Catch, effort and abundance data Size compositions (catch at age and length frequency data) Biological data (sex, size at maturity, etc) Other data: Social, economic, indigenous knowledge, etc
Assessmenttools
FMSP software
LFDA
Yield
CEDA
ParFish
Other FMSPtools/
guidelines
Age based methods
B&H invariant methods
Multi-species guidelines
Bayesian approaches
Empirical approaches
Other tools
FiSAT
VPA
BEAM4, etc
Intermediate parameters
Used in models to estimate indicators and reference points, e.g.: Individual fish growth rates (K, L∞) Population growth rate (r) and carrying capacity (K) Natural mortality (M), maturity and reproduction (Lm50) Gear selectivity (e.g. Lc50), Catchability (q) Stock recruitment relationship
Fishery Indicators Catch, effort (Cnow, fnow) CPUE, Stock size (Bnow) Fishing mortality rate (Fnow) Others (social, economic,
ecological, governance etc)
Reference Points MSY-based (FMSY, BMSY) Proxies for MSY (e.g. F0.1) For maintaining reproductive
capacity (e.g. F%SSB, F%SPR) Risk-defined (e.g. Ftransient) Multispecies and eco-
system based Economic and social
Management advice Comparison of fishery indicators and reference points to provide
management advice allowing for uncertainty and risk Feedback for control rule management Management projections (short-term and long-term advice) Recognising multiple objectives and management options
Section 2.1 (and see FAO
FTP 487)

2.22.2 Are there alternative Are there alternative approaches to stock assessment? approaches to stock assessment?
Yes….Yes….
Analytical / dynamic pool approach Analytical / dynamic pool approach
(see e.g. Annex 3 - using (see e.g. Annex 3 - using LFDALFDA and and YieldYield software) software)
Biomass dynamic approachBiomass dynamic approach
(see e.g. Annex 4 - using (see e.g. Annex 4 - using CEDACEDA software) software)
ParFishParFish approach (see Annex 5) approach (see Annex 5)
And many other alternative approaches, software, models...And many other alternative approaches, software, models...
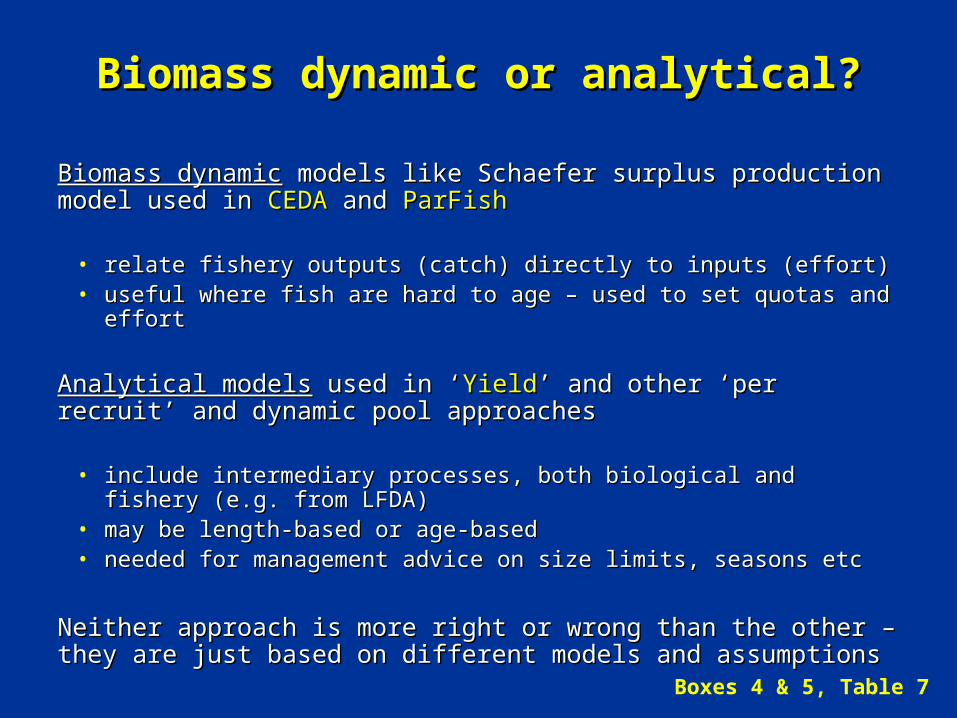
Biomass dynamic or analytical?Biomass dynamic or analytical?
Biomass dynamicBiomass dynamic models like Schaefer surplus production model used models like Schaefer surplus production model used in in CEDACEDA and and ParFishParFish
• relate fishery outputs (catch) directly to inputs (effort)relate fishery outputs (catch) directly to inputs (effort)• useful where fish are hard to age – used to set quotas and effortuseful where fish are hard to age – used to set quotas and effort
Analytical modelsAnalytical models used in ‘ used in ‘YieldYield’ and other ‘per recruit’ and dynamic ’ and other ‘per recruit’ and dynamic pool approachespool approaches
• include intermediary processes, both biological and fishery (e.g. from include intermediary processes, both biological and fishery (e.g. from LFDA)LFDA)
• may be length-based or age-basedmay be length-based or age-based• needed for management advice on size limits, seasons etcneeded for management advice on size limits, seasons etc
Neither approach is more right or wrong than the other – they are just Neither approach is more right or wrong than the other – they are just based on different models and assumptions based on different models and assumptions
Boxes 4 & 5, Table 7

2.3 What data would I need?2.3 What data would I need?
For the biomass dynamic approach For the analytical approach
Multi-year time series of catch and effort data, or catch and some other index of abundance (e.g. from annual surveys)
(see Box 6)
Short time series of catch composition data (e.g. from length frequencies or ageing studies)
Biological data (e.g. size at maturity)
(see Box 7)

3.3. What tools can I use to make a stock What tools can I use to make a stock assessment?assessment?
FMSP software tools:FMSP software tools:
• Length Frequency Distribution Analysis (Length Frequency Distribution Analysis (LFDALFDA) ) see Box 8see Box 8• YieldYield see Box 9see Box 9• Catch Effort Data Analysis (Catch Effort Data Analysis (CEDACEDA) ) see Box see Box
1010• Participatory Fisheries Stock Assessment (Participatory Fisheries Stock Assessment (ParFishParFish) ) see Box see Box
1111
and many othersand many others
See FAO Fish. Tech. Paper 487 for detailsSee FAO Fish. Tech. Paper 487 for details

3.1 What do the different FMSP stock 3.1 What do the different FMSP stock assessment tools estimate? (Table 5)assessment tools estimate? (Table 5)
Parameters estimated Available FMSP tools Type Parameters
LF
DA
Yie
ld
CE
DA
Pa
rFis
h
Em
pir
ical
m
eth
od
s
Bev
ert
on
an
d H
olt
in
vari
ants
r, K, q (production model) x x K, L∞, t0 (von Bertalanffy growth) x M (natural mortality rate) x x
Intermediate
Z (total mortality rate) x YPR / BPR (yield / biomass per recruit) x Yield / biomass (absolute, equilibrium) x Bt (biomass in year t) x x x Nt (numbers in year t) x x Feq (fishing mortality rate, Z-M) x
Indicators
CPUA (catch per unit area) x MSY, fMSY, BMSY, FMSY x x x Fmax, F0.1, F0.x, F%SPR (per recruit) FMSY, F%SSB, Fcrash (absolute) Ftransient (risk-based)
x x x
flim, Clim (risk-based, biological limits) fopt, Copt (adjusted for ‘preferences’)
x x
Reference points
Fmax (max yield per recruit) FMSY (max absolute yield)
x x
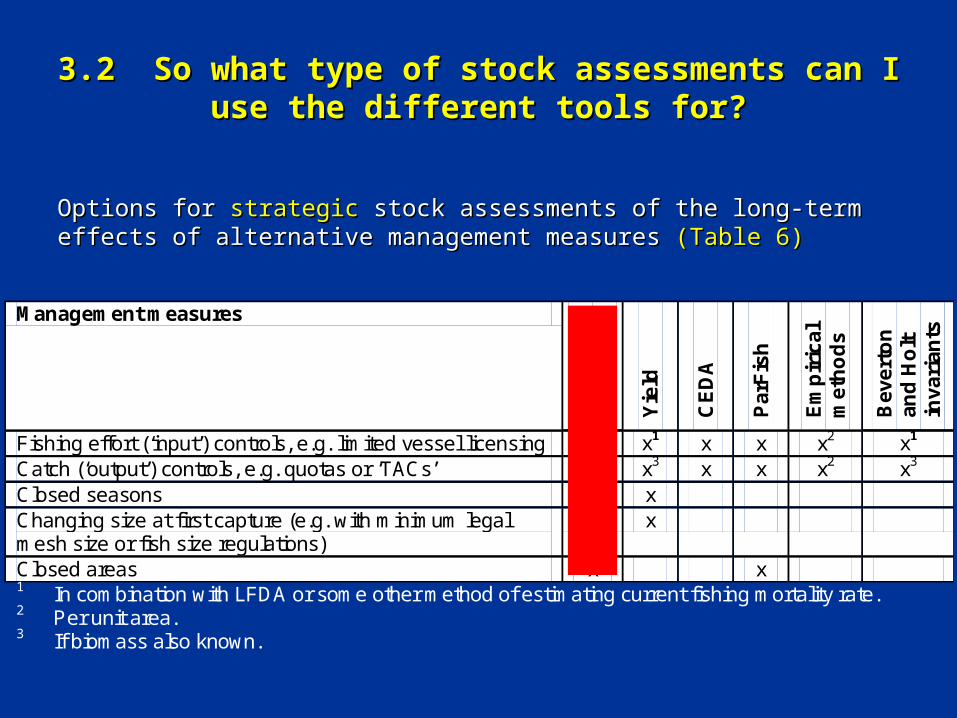
3.2 So what type of stock assessments can I 3.2 So what type of stock assessments can I use the different tools for?use the different tools for?
Options for Options for strategicstrategic stock assessments of the long-term effects of alternative stock assessments of the long-term effects of alternative management measures management measures (Table 6)(Table 6)
Management measures
Bio
log
ical
st
ud
ies
Yie
ld
CE
DA
Par
Fis
h
Em
pir
ical
m
eth
od
s
Bev
ert
on
an
d H
olt
in
vari
ants
Fishing effort (‘input’) controls, e.g. limited vessel licensing x1 x x x2 x1 Catch (‘output’) controls, e.g. quotas or ‘TACs’ x3 x x x2 x3 Closed seasons x x Changing size at first capture (e.g. with minimum legal mesh size or fish size regulations)
x x
Closed areas x x 1 In combination with LFDA or some other method of estimating current fishing mortality rate. 2 Per unit area. 3 If biomass also known.

3.2 And for short term 3.2 And for short term tacticaltactical assessments…assessments…
At this stage, you just need to re-estimate your selected At this stage, you just need to re-estimate your selected indicatorsindicators to to see if you are meeting your targets or avoiding your limits (e.g. every 1-see if you are meeting your targets or avoiding your limits (e.g. every 1-2 years)2 years)
As shown in Table 5…...As shown in Table 5…...
• If you are using Biomass-based reference points, use CEDA or ParFishIf you are using Biomass-based reference points, use CEDA or ParFish
• If you are using F-based reference points, use LFDA or other (VPA)If you are using F-based reference points, use LFDA or other (VPA)

4. How do I select the best tool for the 4. How do I select the best tool for the job?job?
Step 1. Step 1. What tools could provide advice about the management controls What tools could provide advice about the management controls and standards (indicators and reference points) selected for the and standards (indicators and reference points) selected for the fishery? fishery?
See Tables 5 and 6 as aboveSee Tables 5 and 6 as above
Note that several tools might be suitable, so...Note that several tools might be suitable, so...
Step 2. Step 2. Of the tools and approaches available, what is the most Of the tools and approaches available, what is the most appropriate to the local situation?appropriate to the local situation?
See Tables 7 and 8 to help decideSee Tables 7 and 8 to help decide
See also Box 13 and Table 9 for process….See also Box 13 and Table 9 for process….

5. How should I provide stock 5. How should I provide stock assessment advice to managers?assessment advice to managers?
5.15.1 Providing Providing strategicstrategic advice on alternative management options advice on alternative management options
5.25.2 Providing Providing tacticaltactical advice to guide management by the control rules advice to guide management by the control rules
5.35.3 Making Making projectionsprojections: how long will it take to achieve the results?: how long will it take to achieve the results?
5.45.4 How should I present the How should I present the uncertaintyuncertainty in my analysis? in my analysis?
5.55.5 Giving advice in terms of Giving advice in terms of riskrisk

5.1 Providing strategic advice on alternative 5.1 Providing strategic advice on alternative management optionsmanagement options
Remember, full strategic SA report should cover:Remember, full strategic SA report should cover:
• ""Where would we like to beWhere would we like to be?" - the values of specific ?" - the values of specific reference pointsreference points selected by managers, as estimated for that fishery, updated for any new selected by managers, as estimated for that fishery, updated for any new data (e.g. the actual value of F that would give MSY, e.g. Fdata (e.g. the actual value of F that would give MSY, e.g. FMSYMSY = 0.4). = 0.4).
• ""Where are we now, relative to where we would like to beWhere are we now, relative to where we would like to be?" - an ?" - an assessment of the current status of the fishery as given by the assessment of the current status of the fishery as given by the indicatorsindicators (e.g. the estimate of F(e.g. the estimate of Fnownow).).
• ""What are the implications of alternative What are the implications of alternative management scenariosmanagement scenarios, including , including doing nothingdoing nothing?" - estimates of the effect on each indicator of those ?" - estimates of the effect on each indicator of those management measures or controls identified as feasible for the fishery.management measures or controls identified as feasible for the fishery.

Providing strategic advice….Providing strategic advice….
Use graphs or decision Use graphs or decision tables to show the trade-offs tables to show the trade-offs between the different between the different objectivesobjectives
Graphs nice when only two Graphs nice when only two objectives, e.g. hereobjectives, e.g. here
Add lines or symbols to Add lines or symbols to show current position on show current position on curvescurves 0
0.2
0.4
0.6
0.8
1
0 0.2 0.4 0.6 0.8 1 1.2 1.4 1.6 1.8 2
Fishing mortality rate, F
SSBPR reference points, e.g. F20%SPR, where SSBPR is 20% of its unfished level
YPR reference points, e.g. F0.1, where slope of YPR curve is 10% of that at the origin

Or use decision tables when more Or use decision tables when more objectives to consider...objectives to consider...
E.g. here from box 14 (could add more rows or columns…)E.g. here from box 14 (could add more rows or columns…)
ManagementScenario 1(No change)
ManagementScenario 2
e.g. F down 20%
ManagementScenario 3
e.g. mesh sizelimit up 20%
Biological Indicatorse.g. Relative spawning per recruit (%SPR) 20 (11 – 29) 30 (20 – 40) 35 (26 – 44)
Economic Indicatorse.g. Relative yield per recruit (%YPR)
Mean catch value per fisher ($ ‘000)13 (10 – 16)
5 (3 – 7)12 (9 – 15)
5.8 (3.8 – 7.8)14 (11 – 17)
5.4 (3.4 – 7.4)Social Indicators
e.g. Change in number of fishers 0 -20% 0Note: values in parentheses are 95% confidence intervals).
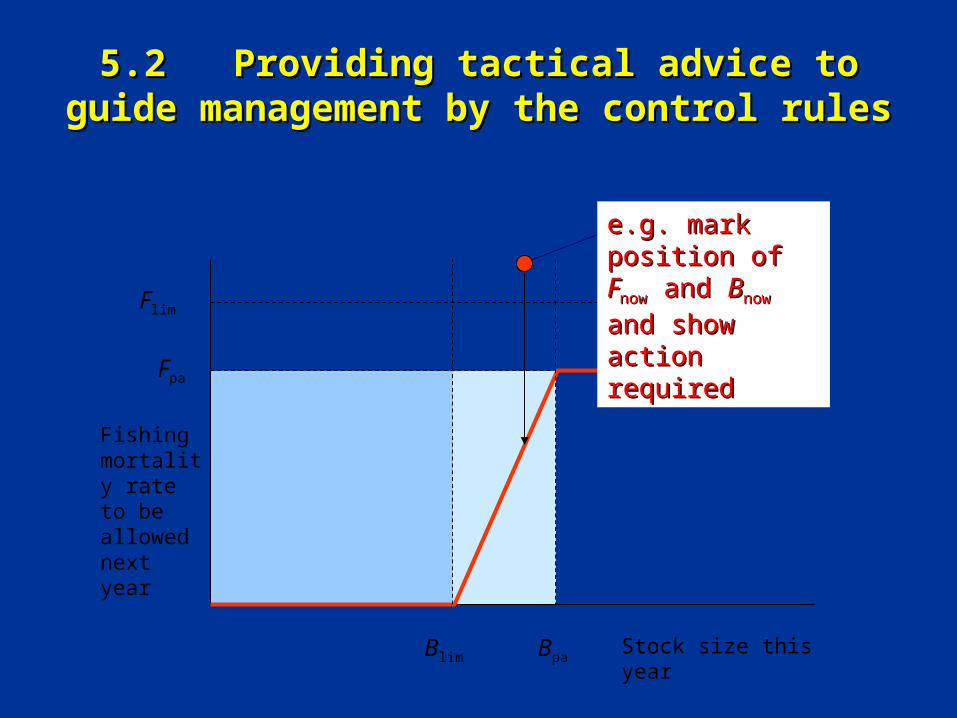
5.2 Providing tactical advice to guide 5.2 Providing tactical advice to guide management by the control rulesmanagement by the control rules
Blim BpaStock size this year
Flim
Fpa
Fishing mortality rate to be allowed next year
e.g. mark position e.g. mark position of of FFnownow and and BBnownow
and show action and show action requiredrequired

5.3 Making projections5.3 Making projections
1. 1. Show how long it will take to achieve resultsShow how long it will take to achieve results
2. 2. Allow for the fact that current biomass might be below optimum or target levels Allow for the fact that current biomass might be below optimum or target levels
(gives the basis of rebuilding plans for overexploited fisheries).(gives the basis of rebuilding plans for overexploited fisheries).
Can use Yield or CEDA software.Can use Yield or CEDA software.
C. Predicted stock biomasses from 1968 with alternative TACs
0
200
400
600
800
1000
1200
1400
1934 1939 1944 1949 1954 1959 1964 1969 1974 1979 1984 1989 1994 1999
Year
Sto
ck b
iom
ass
(Kt)
130 Kt
140 Kt
140 Kt, then 161 Kt(MSY) after 1977
151 Kt (Replace-ment yield)
161 Kt (MSY)
170 Kt
Fit

5.4 How should I present the 5.4 How should I present the uncertainty in my analysis?uncertainty in my analysis?
See boxes etc to illustrate use of confidence intervals, histograms of See boxes etc to illustrate use of confidence intervals, histograms of parameter estimates, and sensitivity testsparameter estimates, and sensitivity tests
Uncertainty can be used to adjust management advice to give Uncertainty can be used to adjust management advice to give ‘precautionary’ reference points, but….‘precautionary’ reference points, but….
… … remember that the remember that the managermanager needs to decide what level of needs to decide what level of precaution is appropriate (not the SA advisor), e.g. following precaution is appropriate (not the SA advisor), e.g. following discussions with stakeholdersdiscussions with stakeholders
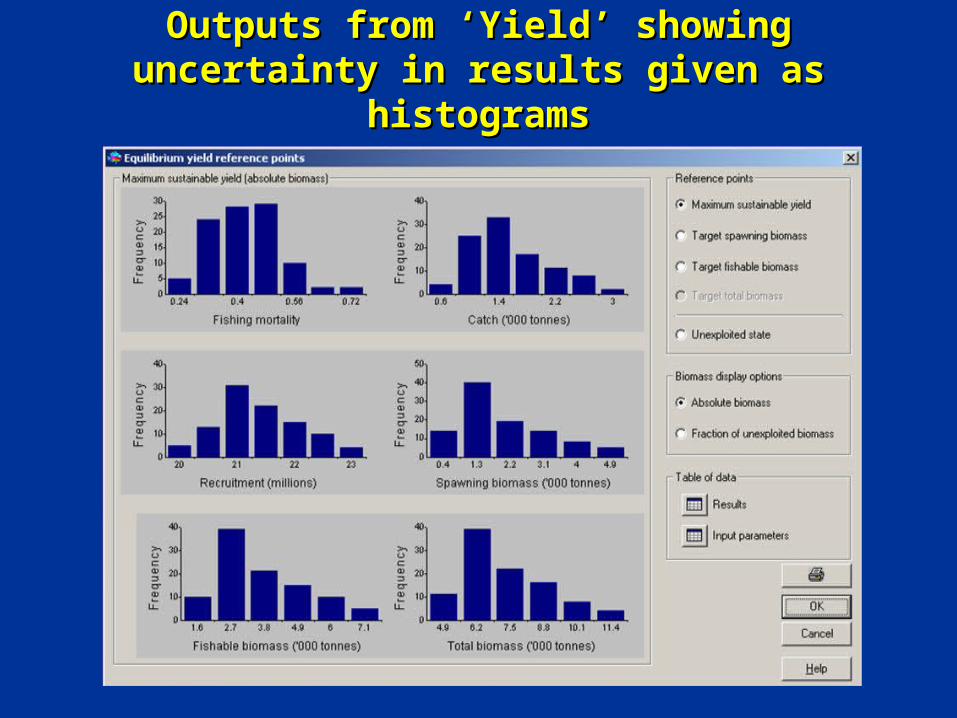
Outputs from ‘Yield’ showing Outputs from ‘Yield’ showing uncertainty in results given as uncertainty in results given as
histogramshistograms

Uncertainties in the control rule Uncertainties in the control rule plotplot
B lim
( B MSY )
B pa
(% ile B MSY )
Stock status RPs
(e.g. Biomass)
( F MSY ) F lim
(% ile F MSY ) F pa
Fishing control RPs
(e.g. Fishing mortality rate)

5.5 Giving advice in terms of risk5.5 Giving advice in terms of risk
Risk is formally defined as the probability of something bad or Risk is formally defined as the probability of something bad or undesirable happeningundesirable happening
Risk assessment is one of the foundations of the precautionary Risk assessment is one of the foundations of the precautionary approach, and required by the FAO Code of Conduct for Responsible approach, and required by the FAO Code of Conduct for Responsible FisheriesFisheries
You can provide advice in simple waysYou can provide advice in simple ways• e.g. by clarifying the risks of alternative reference pointse.g. by clarifying the risks of alternative reference points
• or by showing confidence intervals or distributionsor by showing confidence intervals or distributions
or more explicitlyor more explicitly• e.g. using Yield’s e.g. using Yield’s FFtransienttransient reference point (see Boxes 19 and 25) reference point (see Boxes 19 and 25)

Annex 1. A checklist for fisheries Annex 1. A checklist for fisheries scientistsscientists
p 60
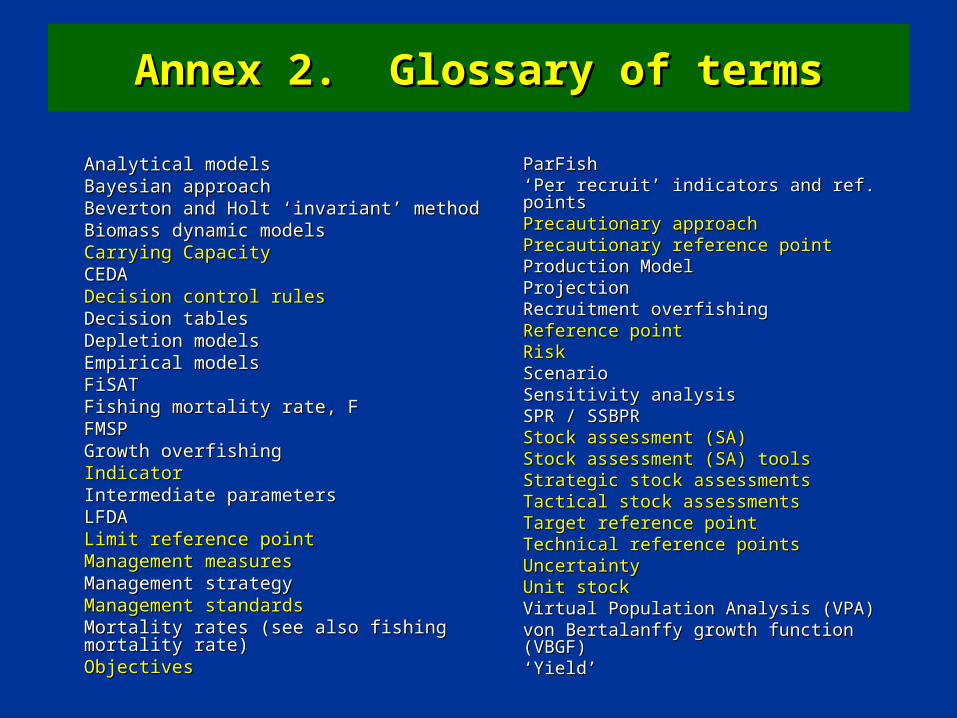
Annex 2. Glossary of termsAnnex 2. Glossary of terms
Analytical modelsAnalytical modelsBayesian approachBayesian approachBeverton and Holt ‘invariant’ methodBeverton and Holt ‘invariant’ methodBiomass dynamic modelsBiomass dynamic modelsCarrying CapacityCarrying CapacityCEDACEDADecision control rulesDecision control rulesDecision tablesDecision tablesDepletion modelsDepletion modelsEmpirical modelsEmpirical modelsFiSAT FiSAT Fishing mortality rate, FFishing mortality rate, FFMSPFMSPGrowth overfishingGrowth overfishingIndicatorIndicatorIntermediate parametersIntermediate parametersLFDALFDALimit reference pointLimit reference pointManagement measuresManagement measuresManagement strategyManagement strategyManagement standardsManagement standards Mortality rates (see also fishing mortality rate)Mortality rates (see also fishing mortality rate)ObjectivesObjectives
ParFishParFish‘‘Per recruit’ indicators and ref. pointsPer recruit’ indicators and ref. pointsPrecautionary approachPrecautionary approachPrecautionary reference pointPrecautionary reference pointProduction ModelProduction ModelProjectionProjectionRecruitment overfishingRecruitment overfishingReference pointReference pointRiskRisk ScenarioScenarioSensitivity analysisSensitivity analysisSPR / SSBPRSPR / SSBPRStock assessment (SA)Stock assessment (SA)Stock assessment (SA) toolsStock assessment (SA) toolsStrategic stock assessmentsStrategic stock assessmentsTactical stock assessmentsTactical stock assessmentsTarget reference pointTarget reference pointTechnical reference pointsTechnical reference pointsUncertaintyUncertaintyUnit stockUnit stockVirtual Population Analysis (VPA) Virtual Population Analysis (VPA) von Bertalanffy growth function (VBGF)von Bertalanffy growth function (VBGF)‘‘Yield’Yield’
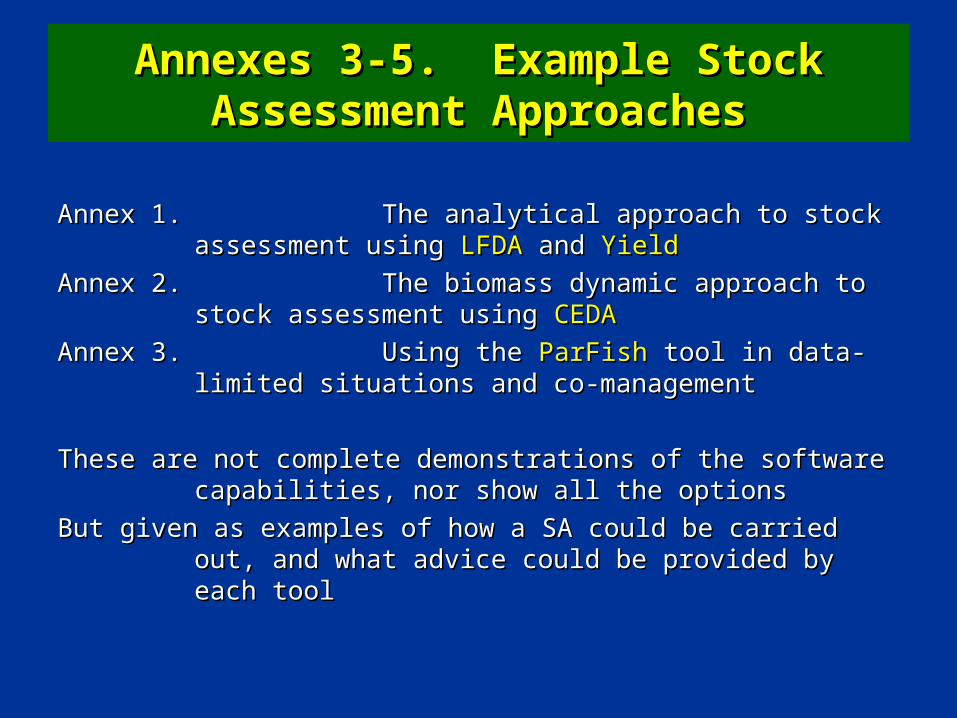
Annexes 3-5. Example Stock Annexes 3-5. Example Stock Assessment ApproachesAssessment Approaches
Annex 1. Annex 1. The analytical approach to stock assessment using The analytical approach to stock assessment using LFDALFDA and and YieldYield
Annex 2. Annex 2. The biomass dynamic approach to stock assessment using The biomass dynamic approach to stock assessment using CEDACEDA
Annex 3. Annex 3. Using the Using the ParFishParFish tool in data-limited situations and co- tool in data-limited situations and co-managementmanagement
These are not complete demonstrations of the software capabilities, These are not complete demonstrations of the software capabilities, nor show all the optionsnor show all the options
But given as examples of how a SA could be carried out, and what But given as examples of how a SA could be carried out, and what advice could be provided by each tooladvice could be provided by each tool
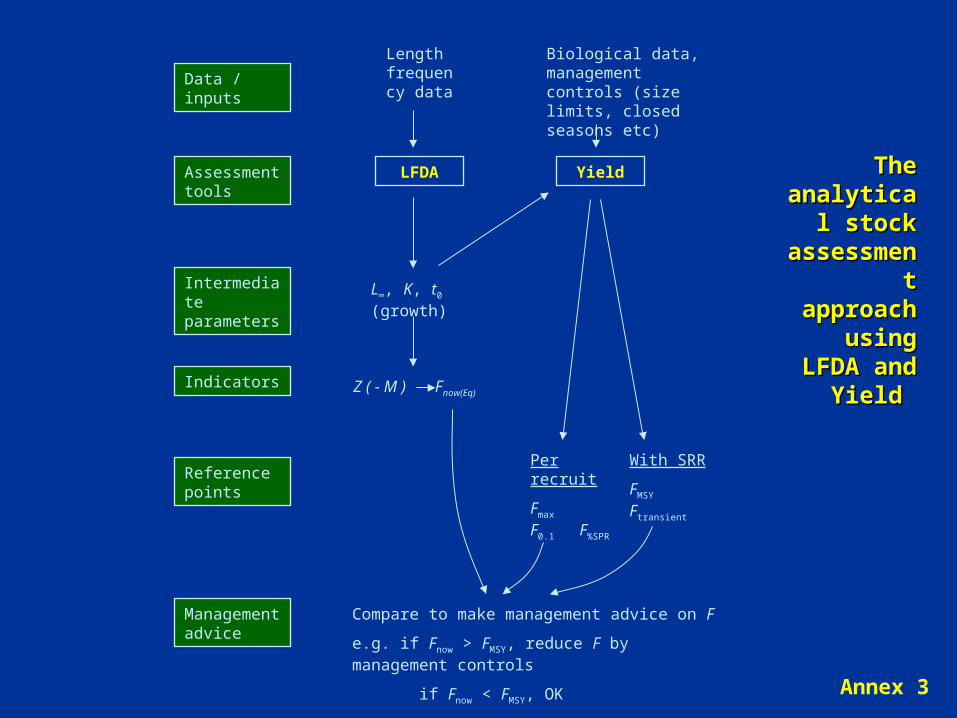
The The analytical analytical
stock stock assessmeassessme
nt nt approach approach
using using LFDA and LFDA and
Yield Yield
LFDA
Intermediate parameters
L∞, K, t0 (growth)
Z ( - M ) Fnow(Eq)
Biological data, management controls (size limits, closed seasons etc)
Compare to make management advice on F
e.g. if Fnow > FMSY, reduce F by management controls
if Fnow < FMSY, OK
Yield
Per recruit
Fmax F0.1 F%SPR
With SRR
FMSY Ftransient
Data / inputs
Assessment tools
Indicators
Reference points
Management advice
Length frequency data
Annex 3

‘‘per recruit’ or with recruitment?per recruit’ or with recruitment?
Including recruitment in Including recruitment in analytical models analytical models completely changes completely changes resultsresults
But stock-recruit But stock-recruit relationship expensive relationship expensive to getto get
So, if using per-recruit So, if using per-recruit models, give first priority models, give first priority to LRPs for biomass per to LRPs for biomass per recruitrecruit
Box 24
0 0.5 1 1.5 2
Fishing mortality rate (F)
Yield-per-R
Yield
SSB-per-R
SSB

Age-based or length-based?Age-based or length-based?
ELEFAN, FiSAT II etc largely promoted length-based methods for ELEFAN, FiSAT II etc largely promoted length-based methods for tropical fisheries. FMSP LFDA software also length-basedtropical fisheries. FMSP LFDA software also length-based
Four FMSP projects, however, have confirmed the benefits of age-Four FMSP projects, however, have confirmed the benefits of age-based approaches, wherever fish can be aged (e.g. using otolith based approaches, wherever fish can be aged (e.g. using otolith readings) – more accurate etcreadings) – more accurate etcAge-based methods now used for deep slope snapper fisheries in Age-based methods now used for deep slope snapper fisheries in FMSP study sites in SeychellesFMSP study sites in Seychelles
Length-based methods better where fish really can not be aged (e.g. Length-based methods better where fish really can not be aged (e.g. crustacea), or where ageing is v. expensivecrustacea), or where ageing is v. expensive
Table 7
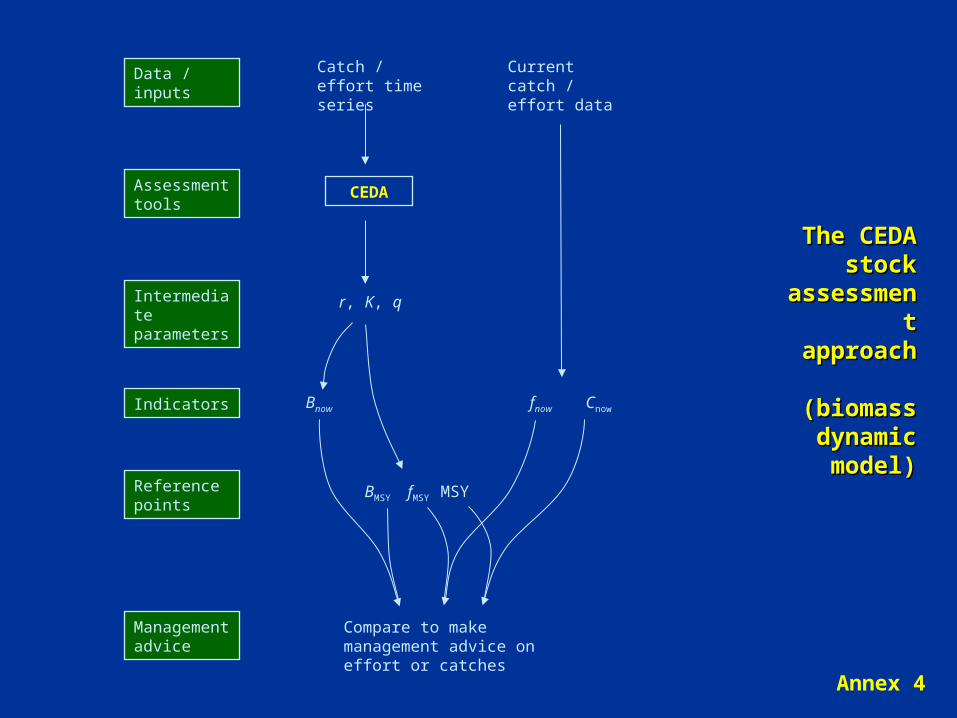
The CEDA The CEDA stock stock
assessmeassessment nt
approachapproach
(biomass (biomass dynamic dynamic
model)model)
Annex 4
CEDA
Intermediate parameters
r, K, q
Bnow
Current catch / effort data
Compare to make management advice on effort or catches
Data / inputs
Assessment tools
Indicators
Reference points
Management advice
Catch / effort time series
BMSY fMSY MSY
fnow Cnow

The The ParFish ParFish
stock stock assessmeassessme
nt nt approachapproach
Annex 5
ParFish
Intermediate parameters
r, K, q
Current catch / effort data
Data / inputs
Assessment tools
Indicators
Reference points
Catch / effort time series
fnow Cnow
Stock assess’t interview data or other priors
Preference interview data
ParFish
flim Clim
Management advice on effort or catch controls, in terms of limit and target levels. Targets (fopt,Copt) incorporate the preferences of resource users. Limits are based on the risk that B will be reduced below a specified % of K.
fopt Copt
Management advice
Bnow