Embed Size (px)
DESCRIPTION
Pilot Project Flyingfish CRFM
Citation preview
i
i
CRFM Fishery Report – 2011
Volume 2
Fishery Management Advisory Summaries
Report of Seventh Annual Scientific Meeting – Kingstown, St. Vincent and the Grenadines, 16 – 24 June 2011
CRFM Secretariat Belize 2011
ii
CRFM FISHERY REPORT – 2011. Volume 2 - Fishery Management Advisory
Summaries. Report of Seventh Annual Scientific Meeting – Kingstown, St.
Vincent and the Grenadines, 16 – 24 June 2011
© CRFM 2011
All right reserved.
Reproduction, dissemination and use of material in this publication for educational or noncommercial
purposes are authorized without prior written permission of the CRFM, provided the source is fully
acknowledged. No part of this publication may be reproduced, disseminated or used for any commercial
purposes or resold without the prior written permission of the CRFM.
Correct Citation:
CRFM 2011. Report of Seventh Annual Scientific Meeting – Kingstown, St. Vincent and the
Grenadines, 16 - 24 June 2011 – Fishery Management Advisory Summaries. CRFM Fishery
Report - 2011. Volume 2. 77p.
ISSN: 1995-1426
ISBN: 978-976-8165-45-9
Published by the Caribbean Regional Fisheries Mechanism Secretariat,
Belize City, Belize
iii
Foreword
The Seventh Annual Scientific Meeting took place during 16 - 24 June 2011 in Kingstown, St. Vincent
and the Grenadines. During this Meeting, CRFM Resource Working Groups examined data from the
following fisheries: the flyingfish fishery of the Eastern Caribbean, the seabob fishery of Suriname, and
the shrimp trawl fishery of Trinidad and Tobago and Venezuela. The SGWG also reviewed catch and
effort data from the white shrimp fishery in Kingston Harbour, Jamaica. The LPWG conducted several
activities: exploration of catch and effort data from the blackfin tuna fishery in St. Lucia, Vincent & the
Grenadines and Trinidad & Tobago; review of a report on the fishing fleets targeting dolphinfish,
flyingfishes and blackfin tuna in Martinique and Guadeloupe; review of a report on blackfin tuna catch,
catch rates, and size structure from Venezuelan fisheries; and completed the first part of an ERAEF
analysis of the Eastern Caribbean dolphinfish fishery. This year’s CLWG meeting completed a peer
review of a Caribbean spiny lobster stock assessment that was conducted intersessionally in The Bahamas
during 2010. The RSWG did not meet in 2011.
A training seminar on bioeconomics of the ecosystem approach to fisheries was held during the meeting
of the DMTWG. An update on the progress made by the JICA FAD and Statistics pilot studies, with
special emphasis on the data collection, storage, and management aspects was also provided. A plenary
session was held to review and discuss issues and recommendations pertaining to data, methods and
training, as well as to review the inter-sessional activities of the DMTWG.
During the plenary session of the Seventh Annual Scientific Meeting, updates were provided on relevant
collaborative activities / projects / programmes which included: the CIDA pelagic internship hosted by
CRFM; the CLME project; the Regional Governance Framework Project; the CRFM/JICA Formulation
of a Master Plan on Sustainable Use of Fisheries Resources for Coastal Community Development in the
Eastern Caribbean Project; and the ACP Fish II Programme.
The Report of the Seventh Annual Scientific Meeting is published in two Volumes: Volume 1 contains
the report of the plenary sessions and the full reports of the CRFM Resource Working Groups for 2011.
Eight national reports were submitted for consideration by the Seventh Annual Scientific Meeting, and
these are published as Supplement 1 to Volume 1. Volume 2 contains part A (Overview), and the fishery
management advisory summaries of individual fishery reports comprising part B of each Working Group
report, where relevant. Volume 1 is intended to serve as the primary reference for fishery assessment
scientists, while Volume 2 is intended to serve as the main reference for managers and stakeholders.
The covers for this volume were designed and prepared by Mr. Shaun Young, while the photographs were
provided by Ms. Maren Headley, Ms. Elaine Ferrier, Mr. Motoki Fujii and Ms. Brooke Campbell. These
contributions are gratefully acknowledged.
iv
Contents
List of Acronyms and Abbreviations ............................................................................................ vii
I. REPORT OF THE CONCH AND LOBSTER RESOURCES WORKING GROUP
(CLWG) .......................................................................................................................................... 1 A. INTRODUCTION .................................................................................................................. 1 B. FISHERIES REPORTS .......................................................................................................... 1 1.0 The spiny lobster (Panulirus argus) fishery of the Bahamas .............................................. 1
1.1 Management Objectives ................................................................................................... 1 1.2 Status of Stocks ................................................................................................................ 1 1.3 Management Advice ........................................................................................................ 1 1.4 Statistics and Research Recommendations ...................................................................... 2
1.4.1 Data Quality .............................................................................................................. 2
1.4.2 Research Needs ......................................................................................................... 2 1.5 Stock Assessment Summary ............................................................................................ 2
1.6 Special Comments ............................................................................................................ 3 II. REPORT OF THE SMALL COSTAL PELAGIC FISH RESOURCE WORKING GROUP
(SCPWG) ...................................................................................................................................... 10 A. OVERVIEW ......................................................................................................................... 10 1. Review and Adoption of Meeting Agenda ........................................................................... 10
2. Review of Meeting’s Objectives ........................................................................................... 10 3. Review of Working Group’s Commitment to the CLME Project ........................................ 10
4. Review of available new data and information on fishery interest, including review of
national reports, fisheries trends, pertinent technical studies completed to date and management
developments. ............................................................................................................................... 11
B. FISHERIES REPORTS ..................................................................................................... 13
1.0 Eastern Caribbean Flyingfish Fishery ................................................................................ 13 1.1 Management Summary .................................................................................................. 13
1.1.1 Policy and Objectives ............................................................................................. 13
1.1.2 Fisheries Management ............................................................................................ 13 1.2 Status of Stocks .............................................................................................................. 15
1.2.1 Flyingfish (Hirundichthys affinis)........................................................................... 15
1.2.2 LAPE-flyingfish/dolphinfish interactions ............................................................... 16 1.3 Management Advice ...................................................................................................... 17 1.4 Statistics and research recommendations ....................................................................... 17
1.4.1 Recommendations for the Caribbean Regional Fisheries Mechanism Secretariat . 17 1.4.2 Individual Countries................................................................................................ 18
1.5 Stock Assessment Summary .......................................................................................... 18
1.6 Special Comments .......................................................................................................... 19
1.7 Policy Summary ............................................................................................................. 19 1.8 Conclusion & Recommendations .................................................................................. 19 1.9 References ...................................................................................................................... 20
III. REPORT OF THE SHRIMP AND GROUNDFISH RESORUCE WORKING GROUP
(SGWG) ........................................................................................................................................ 22 A. OVERVIEW ......................................................................................................................... 22
v
1. Review of inter-sessional activities since last meeting, including management
developments during this period ............................................................................................... 22 2. General review of fisheries trends throughout the region, including recent developments23 3. Fishery data preparation, analysis, and report preparation ................................................ 23
4. Inter-sessional workplan and Recommendations............................................................... 25 B. FISHERIES REPORTS ........................................................................................................ 28 1.0 The Seabob (Xiphopenaeus kroyeri) Fishery of Suriname ................................................ 28
1.1 Management Objectives ................................................................................................. 28 1.2 Status of Stock ................................................................................................................ 28
1.3 Management Advice ...................................................................................................... 29 1.4 Statistics and Research Recommendations .................................................................... 31
1.4.1 Data Quality ............................................................................................................ 31 1.4.2 Research .................................................................................................................. 32
1.5 Stock Assessment Summary .......................................................................................... 32 1.6 Special Comments .......................................................................................................... 33
1.7 Policy Summary ............................................................................................................. 34 2.0 The Shrimp Fisheries Shared by Trinidad & Tobago and Venezuela ............................... 35
2.1 Management Objectives ................................................................................................. 35 2.2 Status of Stocks .............................................................................................................. 35 2.3 Management Advice ...................................................................................................... 35
2.4 Statistics and Research Recommendations .................................................................... 39 2.4.1 Data Quality ............................................................................................................ 39
2.4.2 Research .................................................................................................................. 39 2.5 Stock Assessment Summary .......................................................................................... 39 2.6 Special Comments .......................................................................................................... 40
2.7 Policy Summary ............................................................................................................. 40
2.8 References ...................................................................................................................... 41 3.0 Marine Shrimp Fishery in Kingston Harbour, Jamaica ..................................................... 42
3.1 Introduction .................................................................................................................... 42
3.2 Previous Assessments .................................................................................................... 42 3.3 Management ................................................................................................................... 43
3.3.1 Management Objective ........................................................................................... 43 3.3.2 Data Quality/Monitoring ......................................................................................... 43
3.3.3 Environmental and Anthropogenic issues affecting the fishery ............................. 43 3.4 Review Summary ........................................................................................................... 43
3.4.1 Catch trends ............................................................................................................ 43 3.5 Recommendations .......................................................................................................... 44 3.6 References ...................................................................................................................... 45
IV. REPORT OF THE LARGE PELAGIC FISH RESOURCE WORKING GROUP (LPWG)
……………………………………………………………………………………………46
A. OVERVIEW ......................................................................................................................... 46 B. FISHERIES REPORTS ........................................................................................................ 50 1.0 Ecological Risk Assessment for the Effects of Fishing (ERAEF) for the Dolphinfish
Fishery in the Eastern Caribbean .................................................................................................. 50 1.1 Overview of ERAEF Experimental Approach ............................................................... 50 1.2 Significance for the Caribbean Large Marine Ecosystem Project ................................. 50
vi
1.3 Objectives and Outputs .................................................................................................. 50
2.0 Data issues highlighted in the assessment of blackfin tuna ............................................... 51 2.1 Overview of Available Data ........................................................................................... 51 2.2 Overall Recommendations ............................................................................................. 51
3.0 Martinique and Guadeloupe fishing fleets targeting Dolphinfish, Flyingfishes and
Blackfin tuna ................................................................................................................................. 55 3.1 Fishery and Fleet description ......................................................................................... 55 3.2 Statistics and Sampling .................................................................................................. 56 3.3. Research ......................................................................................................................... 57
3.4. Legislation and Management Regulations ..................................................................... 57 3.5 Literature cited ............................................................................................................... 57
4.0 Blackfin tuna catch, catch rates, and size structure from Venezuelan fisheries ................ 66
vii
List of Acronyms and Abbreviations
ACP - African, Caribbean and Pacific states
CARICOM - Caribbean Community
CERMES - Centre for Resource Management and Environmental Studies
CIDA - Canadian International Development Agency
CLME - Caribbean large Marine Ecosystem
CLWG - Conch and Lobster Resource Working Group
CPUE - Catch Per Unit of Effort
CRFM - Caribbean Regional Fisheries Mechanism
DMR - Department of Marine Resources
DMTWG - Data, Methods and Training Working Group
EAF - Ecosystem Approach to Fisheries
EBFM - Ecosystem Based Fisheries Management
ERAEF - Ecological Risk Assessment for the Effects of Fishing
ETP - Endangered, Threatened and Protected (species)
EU - European Union
FAD - Fish Aggregating Device
FAO - Food and Agriculture Organization of the United Nations
FMP - Fisheries Management Plan
GDP - Gross Domestic Product
GEF - Global Environmental Fund
GLM - General Linear Models
HCR - Harvest Control Rule
ICCAT - International Commission for the Conservation of Atlantic Tunas
IFREMER - Institut Français de Recherche pour l’Exploitation de la Mer
IQ - Individual Quotas
JICA - Japanese International Cooperation Agency
LAPE - Lesser Antilles Pelagic Ecosystem
LPWG - Large Pelagic Fish Resource Working Group
MPA - Marine Protected Areas
MSC P&C - Marine Stewardess Council Principles and Criteria
MSY - Maximum Sustainable Yield
NGO - Non-Governmental Organization
NMFS-SEFSC - National Marine Fisheries Service – South East Fisheries Science Center
NOAA - National Oceanic and Atmospheric Administration
NPV - Net Present Value
OSPESCA - Organization of Fishing and Aquaculture in Central America
(Organización del Sector Pesquero y Acuícola de Centroamerica)
RSWG - Reef and Slope Fish Resource Working Group
SCPWG - Small Coastal Pelagic Fish Resource Working Group
SGWG - Shrimp and Groundfish Resource Working Group
SICA - Scale Intensity and Consequence Analysis
SSB - Spawning Stock Biomass
TAC - Total Allowable Catch
TRP - Target Reference Point
UNDP - United Nations Development Programme
WECAFC - Western Central Atlantic Fishery Commission
WWF - World Wildlife Fund
1
I. REPORT OF THE CONCH AND LOBSTER RESOURCES WORKING GROUP (CLWG)
Consultant: Dr. Paul Medley
Chairman: Lester Gittens (The Bahamas)
A. INTRODUCTION
The Conch and Lobster Working Group meeting was attended by representatives of Anguilla, The
Bahamas, Belize, Jamaica, Montserrat, St Kitts, St Vincent & the Grenadines, OSPESCA, as well as Dr
Paul Medley (consultant).
This year’s meeting was specially convened to facilitate the peer review of a Caribbean spiny lobster
stock assessment that was conducted inter-sessionally in The Bahamas during 2010 (see Annex 1). The
assessment was conducted as part of a lobster fishery improvement project aimed at bringing the fishery
up to Marine Stewardship Council (MSC) certification standards.
Time was also allotted to discussing lobster and conch related issues that other countries wished to raise.
Issues that were raised included:-
1. A CLWG meeting should be convened at the next Scientific Meeting so that countries can discuss
progress made and further strategize as a region.
2. It was also felt that a wider regional meeting possibly involving the WECAFC is overdue.
3. Nicaragua has implemented a quota system that may be of interest to other countries. A
presentation of how Nicaragua’s system works should be considered for the next meeting.
4. The regional review of the lobster fishery conducted by the CRFM should be presented at next
year’s meeting.
B. FISHERIES REPORTS
1.0 The spiny lobster (Panulirus argus) fishery of the Bahamas
1.1 Management Objectives
The management objective for the spiny lobster fishery is to ensure that spiny lobsters are harvested for
maximum economic benefit and in a sustainable manner. This is unofficial as a fishery management plan
is still being developed.
1.2 Status of Stocks
Based on the inter-sessional stock assessment, the lobster fishery is believed to be in a good state. The
stock assessment is believed to be the best to date and is based on exhaustive analysis of the best data
available.
1.3 Management Advice
Given the great economic importance of the lobster fishery and the role it plays in recruitment in the
region, every effort should be made to further improve the assessment.
2
1.4 Statistics and Research Recommendations
1.4.1 Data Quality
The data analyzed was not ideal hence the longtime difficulty of assessing the fishery. Although this is the
best assessment to date, it is still recognized that there is a less than ideal amount of uncertainty. This
cannot be changed for the historic data but new data collection efforts can address this. An improvement
in data quality is fully expected and it is expected that the implementation of a Catch Certificate
programme will facilitate this. This program was initiated at the beginning of the 2010-2011 season in an
effort to comply with European Union demands.
1.4.2 Research Needs
It is recommended that research be conducted on the impact of casitas on the lobster fishery. It is
unknown whether casitas enhance the fishery by increasing total production, whether their aggregating
effects simply hasten overfishing or whether each circumstance prevails in certain situations. Research in
this area is expected to begin during mid 2012.
Fishery independent data is also needed to enhance the stock assessment.
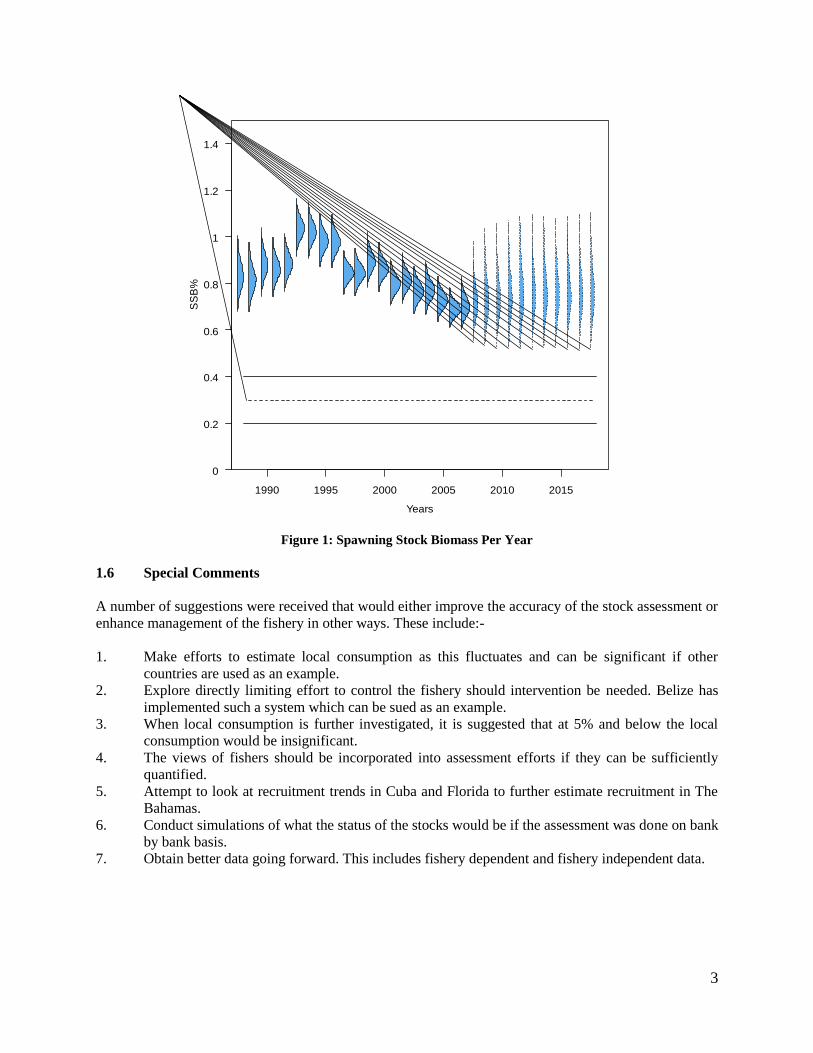
1.5 Stock Assessment Summary
Stock assessment results indicate that the biomass of spawning lobsters is well above levels of concern.
Figure 1 shows the estimates relative to internationally recognized reference points. The suggested target
reference point was 40% spawning stock biomass (SSB), 30% SSB as a trigger for management
intervention and 20% SSB as the point at which all fishing should cease.
Diver catch per unit effort was used as a proxy for SSB and was suggested as for use in a harvest control
rule. It is suggested that management intervention should take place when catch per unit effort goes below
30lbs (13.61 kg) per man/day for divers or if 7 million lbs (3.18 million kg) of tails is exported. The
suggested management action would involve limiting exports as this is the main driving force behind the
fishery.
3
1990 1995 2000 2005 2010 2015
0
0.2
0.4
0.6
0.8
1
1.2
1.4
Years
SS
B%
Figure 1: Spawning Stock Biomass Per Year
1.6 Special Comments
A number of suggestions were received that would either improve the accuracy of the stock assessment or
enhance management of the fishery in other ways. These include:-
1. Make efforts to estimate local consumption as this fluctuates and can be significant if other
countries are used as an example.
2. Explore directly limiting effort to control the fishery should intervention be needed. Belize has
implemented such a system which can be sued as an example.
3. When local consumption is further investigated, it is suggested that at 5% and below the local
consumption would be insignificant.
4. The views of fishers should be incorporated into assessment efforts if they can be sufficiently
quantified.
5. Attempt to look at recruitment trends in Cuba and Florida to further estimate recruitment in The
Bahamas.
6. Conduct simulations of what the status of the stocks would be if the assessment was done on bank
by bank basis.
7. Obtain better data going forward. This includes fishery dependent and fishery independent data.
4
Annex 1: 2010 Bahamas Spiny Lobster Stock Assessment
Prepared by: Dr. Paul Medley
Sunny View, Main Street, Alne, UK, YO61 1RT
1. Preparation of this Document
This document has been prepared for the Bahamas Fisheries Improvement Plan. It documents work done
and results particularly addressing Principle 1 under the Marine Stewardship Council Principles and
Criteria (MSC P&C).
The assessment and advice presented here has not yet undergone peer review. Various outputs from the
assessment, including management advice should be reviewed and changed as considered appropriate by
an independent scientific working group. As such, this report’s conclusions (Sections 3-11) will be
subject to evaluation and change before gaining any official status in the harvest strategy.
2. Recommendations for the Fisheries Improvement Plan
The main objective of this study was to support the Fisheries Improvement Plan (primarily task 4.3),
which aims to help the fishery meet the MSC standard. On completion of the work, the tasks identified in
the plan relevant to Principle 1 were reviewed and remaining tasks identified which need to be completed
(Table 1).
Two major gaps have been identified which need to be addressed:
1. It is recommended that a Bahamas Spiny Lobster Working Group is established which consists of
representatives of all major stakeholders (i.e. relevant Government staff, processors, fishers,
scientists) who will advise government of actions which need to be taken to implement and be
consistent with agreed policy. Such a working group could form the focus for many of the
requirements under the MSC standard, including all performance indicators under MSC P&C 1.2
and 3.2, as well as addressing 3.1.2, and all management strategies under Principle 2. Bearing in
mind that managing fisheries is an on-going process, the Working Group would exist to address
any issues in future as they arise. The first objective of the Working Group would be to take the
fishery forward as quickly as possible to certification.
2. The main remaining hurdle for meeting MSC P&C for Principle 1 is the data collection system
(FIP tasks 1.1 – 1.3). A minimum requirement will be reliable data collection and management
reporting information rapidly and accurately enough that the harvest control rule can be applied,
as well as providing the longer term needs of an improved stock assessment. It is not clear that
the DMR or the processors can do this without technical support. It is important to note that the
primary data collection would be implemented with the processors, not the DMR, although the
DMR would need to verify and manage their part of the system.
Table 1: Evaluation of tasks relevant to the FIP and MSC certification
No. Task Comments
1.1 Development of revised data
collection form
The current fisheries information system is not good enough to
support the harvest strategy. Even where data are now being
collected in a more rigorous fashion, they need to be made
available through an information system. This will be critical for
all four Principle 1 management performance indicators (P1.2.1 -
4). Currently, the processors and DMR do not have the capacity
1.2 Initiate data collection at
processors
1.3 Update and maintenance of
Fisheries Information System
5
to carry out these tasks.
2. Education and Outreach (all
tasks)
The proposed Bahamas Spiny Lobster Working Group should
have a role in carrying out all tasks under these headings.
3. Enforcement (all tasks)
4.1 Demonstrate effectiveness of
MPAs
This has been marked as high priority for the stock status
determination and assessment, but this information is not
necessary for either. It is difficult to see what can be done to
address this in the short term, and it should not be necessary to
address before the full MSC assessment. The current role of
MPAs in the harvest strategy is to reduce general risk factors for
the fishery only, and this can be argued effectively without the
completion research.
4.2 Develop in-house capacity to
conduct stock assessments
This is an on-going requirement and need not be completed
before full MSC assessment.
4.3 Develop stock assessment,
harvest control rules and
reference points
This report addresses these issues. A stock status determination
has been made; reference points and harvest control rule have
been proposed. The next stage of the process will be to carry out
the scientific and management review. It is planned to have the
CRFM Conch and Lobster Working Group conduct the scientific
review of the stock assessment, HCR and management advice.
The management review should be undertaken by the Bahamas
Spiny Lobster Working Group (see above).
4.4 Growth, minimum size at
capture and maturity
There is information in the scientific literature to support the
minimum size. In addition, a maturity study can be conducted
rapidly to provide an estimate of the onset of maturity between
November 2010 and April 2011. This is likely to support the
current minimum size. Growth estimates would be valuable, but
are unlikely to be conducted before full assessment, unless full
assessment was significantly delayed. Even without new data, an
argument can be constructed to support the current minimum
size.
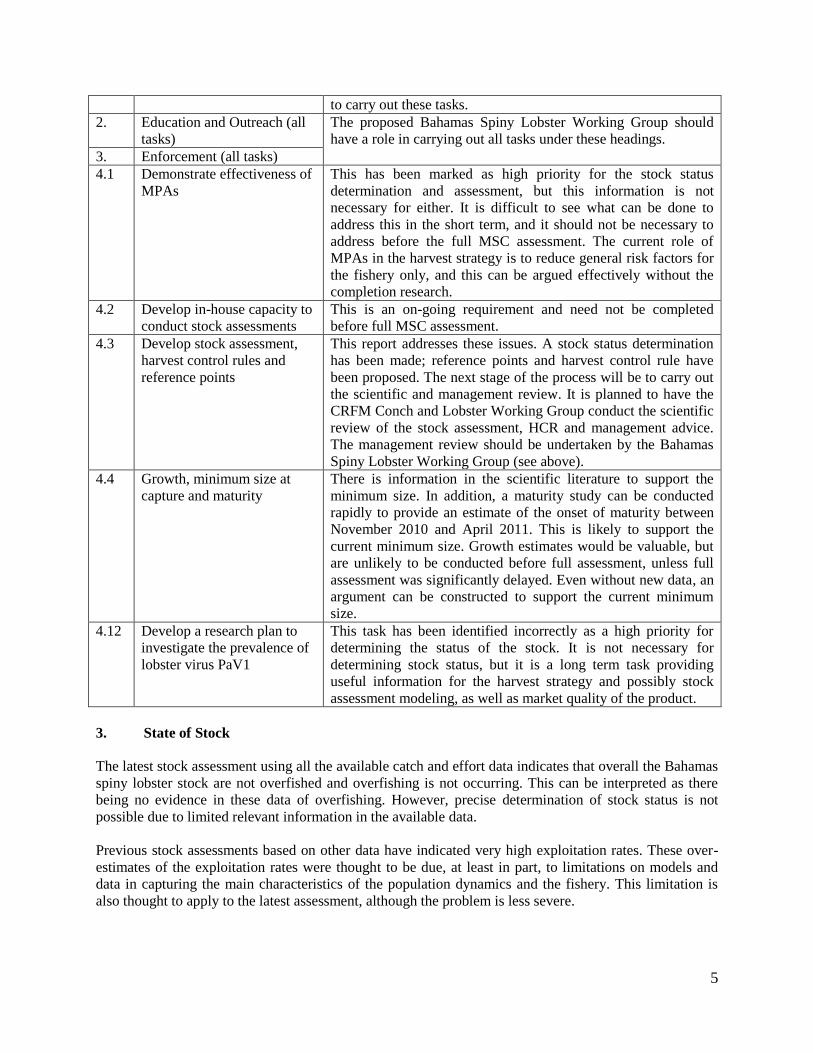
4.12 Develop a research plan to
investigate the prevalence of
lobster virus PaV1
This task has been identified incorrectly as a high priority for
determining the status of the stock. It is not necessary for
determining stock status, but it is a long term task providing
useful information for the harvest strategy and possibly stock
assessment modeling, as well as market quality of the product.
3. State of Stock
The latest stock assessment using all the available catch and effort data indicates that overall the Bahamas
spiny lobster stock are not overfished and overfishing is not occurring. This can be interpreted as there
being no evidence in these data of overfishing. However, precise determination of stock status is not
possible due to limited relevant information in the available data.
Previous stock assessments based on other data have indicated very high exploitation rates. These over-
estimates of the exploitation rates were thought to be due, at least in part, to limitations on models and
data in capturing the main characteristics of the population dynamics and the fishery. This limitation is
also thought to apply to the latest assessment, although the problem is less severe.
6
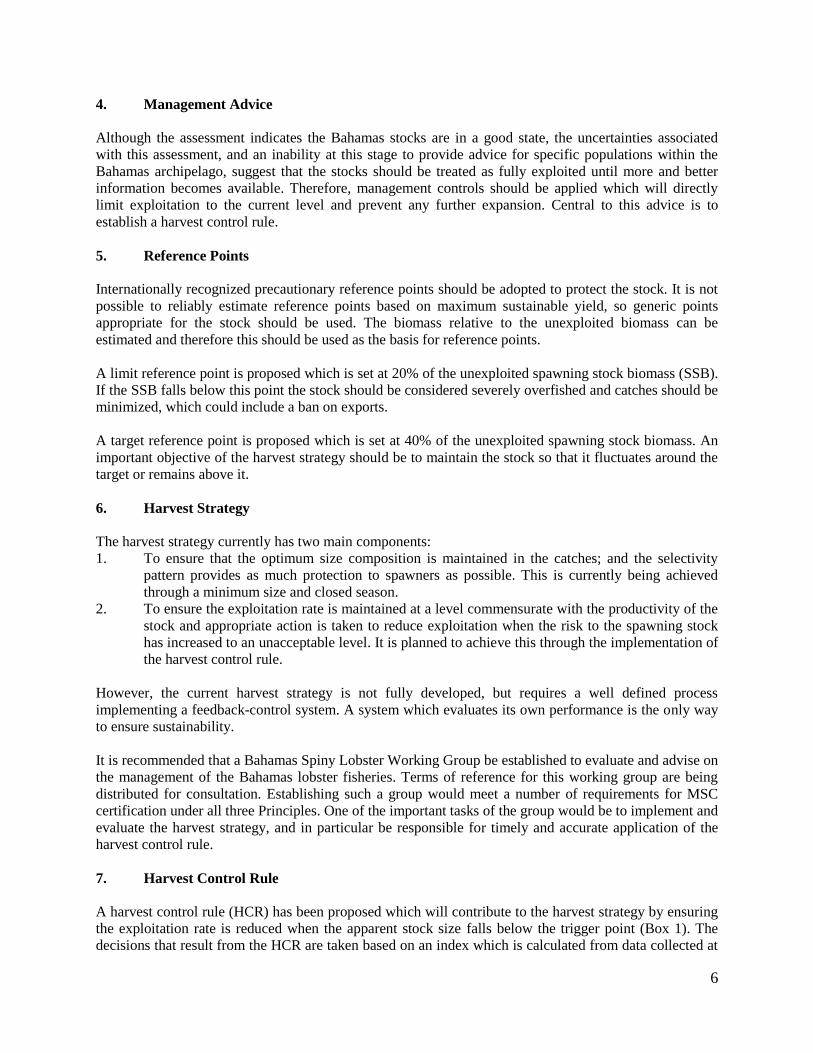
4. Management Advice
Although the assessment indicates the Bahamas stocks are in a good state, the uncertainties associated
with this assessment, and an inability at this stage to provide advice for specific populations within the
Bahamas archipelago, suggest that the stocks should be treated as fully exploited until more and better
information becomes available. Therefore, management controls should be applied which will directly
limit exploitation to the current level and prevent any further expansion. Central to this advice is to
establish a harvest control rule.
5. Reference Points
Internationally recognized precautionary reference points should be adopted to protect the stock. It is not
possible to reliably estimate reference points based on maximum sustainable yield, so generic points
appropriate for the stock should be used. The biomass relative to the unexploited biomass can be
estimated and therefore this should be used as the basis for reference points.
A limit reference point is proposed which is set at 20% of the unexploited spawning stock biomass (SSB).
If the SSB falls below this point the stock should be considered severely overfished and catches should be
minimized, which could include a ban on exports.
A target reference point is proposed which is set at 40% of the unexploited spawning stock biomass. An
important objective of the harvest strategy should be to maintain the stock so that it fluctuates around the
target or remains above it.
6. Harvest Strategy
The harvest strategy currently has two main components:
1. To ensure that the optimum size composition is maintained in the catches; and the selectivity
pattern provides as much protection to spawners as possible. This is currently being achieved
through a minimum size and closed season.
2. To ensure the exploitation rate is maintained at a level commensurate with the productivity of the
stock and appropriate action is taken to reduce exploitation when the risk to the spawning stock
has increased to an unacceptable level. It is planned to achieve this through the implementation of
the harvest control rule.
However, the current harvest strategy is not fully developed, but requires a well defined process
implementing a feedback-control system. A system which evaluates its own performance is the only way
to ensure sustainability.
It is recommended that a Bahamas Spiny Lobster Working Group be established to evaluate and advise on
the management of the Bahamas lobster fisheries. Terms of reference for this working group are being
distributed for consultation. Establishing such a group would meet a number of requirements for MSC
certification under all three Principles. One of the important tasks of the group would be to implement and
evaluate the harvest strategy, and in particular be responsible for timely and accurate application of the
harvest control rule.
7. Harvest Control Rule
A harvest control rule (HCR) has been proposed which will contribute to the harvest strategy by ensuring
the exploitation rate is reduced when the apparent stock size falls below the trigger point (Box 1). The
decisions that result from the HCR are taken based on an index which is calculated from data collected at
7
the beginning of the lobster season. There are a number of indices which could be calculated, and it is
recommended that at least two are estimated each year to help with the evaluation and auditing of the
rule. Indices include:
The index which is currently suggested for the HCR is the average catch (tail weight) per man
day taken by divers during August. Historical information already exists to propose appropriate
reference points for this index, although the true behaviour of this index might only become
apparent under the new data collection system which has only recently been implemented.
An index obtained from fishers who are preparing for the season in July. Fishers would collect
standardized information on abundance from condominiums and diving activity which could be
sent into the Department of Marine Resources and combined into an abundance index. While this
has the advantage of involving the fishing community in implementing the rule, there is no
current information that might be used to evaluate this approach and the data may be difficult to
validate.
A fishery independent index obtained by DMR staff and others during the closed season by
inspecting condominiums and traps. There is no current information that might be used to
evaluate this approach and obtaining a valid sample representing the large fishery area involved
may be difficult and expensive to achieve.
Mean size as calculated from the commercial size composition reported as part of the export
procedure. The mean size would cover the whole year and is not suitable for the harvest control
rule, but provides a useful comparison for other indices.
The details of the data collection system for the index and the necessary auditing that will be required to
ensure it is correct have not yet been developed.
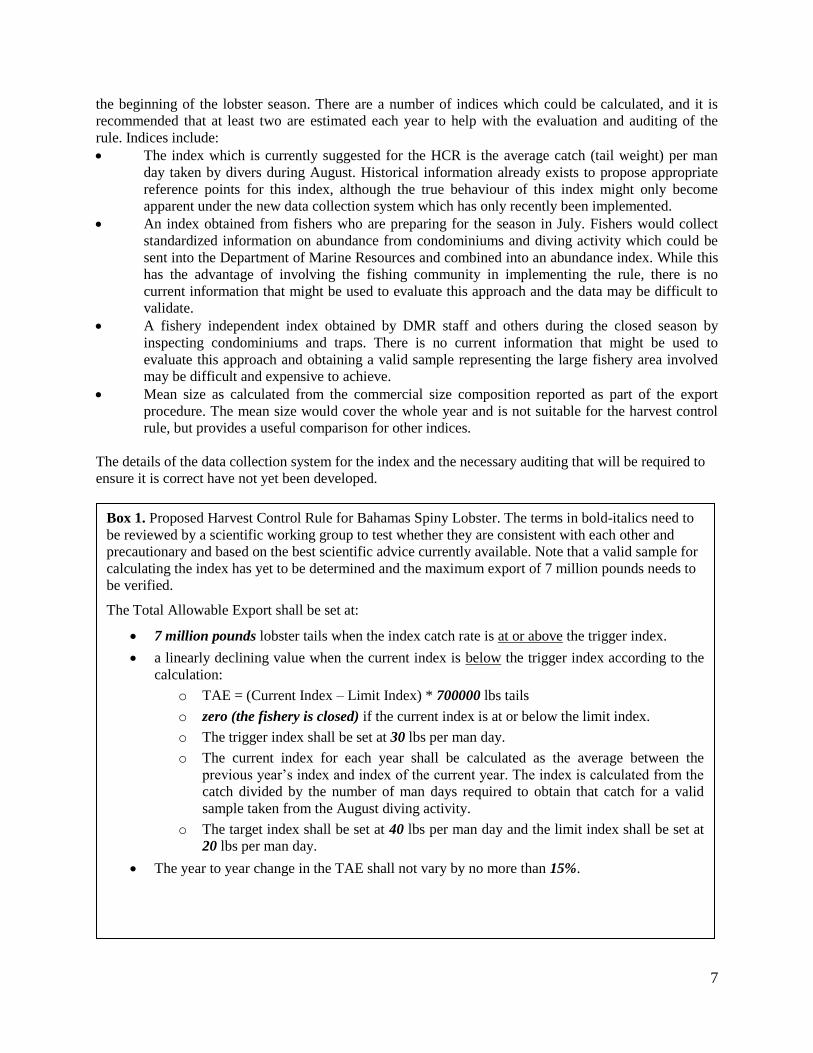
Box 1. Proposed Harvest Control Rule for Bahamas Spiny Lobster. The terms in bold-italics need to
be reviewed by a scientific working group to test whether they are consistent with each other and
precautionary and based on the best scientific advice currently available. Note that a valid sample for
calculating the index has yet to be determined and the maximum export of 7 million pounds needs to
be verified.
The Total Allowable Export shall be set at:
7 million pounds lobster tails when the index catch rate is at or above the trigger index.
a linearly declining value when the current index is below the trigger index according to the
calculation:
o TAE = (Current Index – Limit Index) * 700000 lbs tails
o zero (the fishery is closed) if the current index is at or below the limit index.
o The trigger index shall be set at 30 lbs per man day.
o The current index for each year shall be calculated as the average between the
previous year’s index and index of the current year. The index is calculated from the
catch divided by the number of man days required to obtain that catch for a valid
sample taken from the August diving activity.
o The target index shall be set at 40 lbs per man day and the limit index shall be set at
20 lbs per man day.
The year to year change in the TAE shall not vary by no more than 15%.
8
0
1000000
2000000
3000000
4000000
5000000
6000000
7000000
8000000
0 10 20 30 40 50 60
August Diver Catch Rate (lbs/day)
Tota
l A
llow
ab
le E
xp
ort
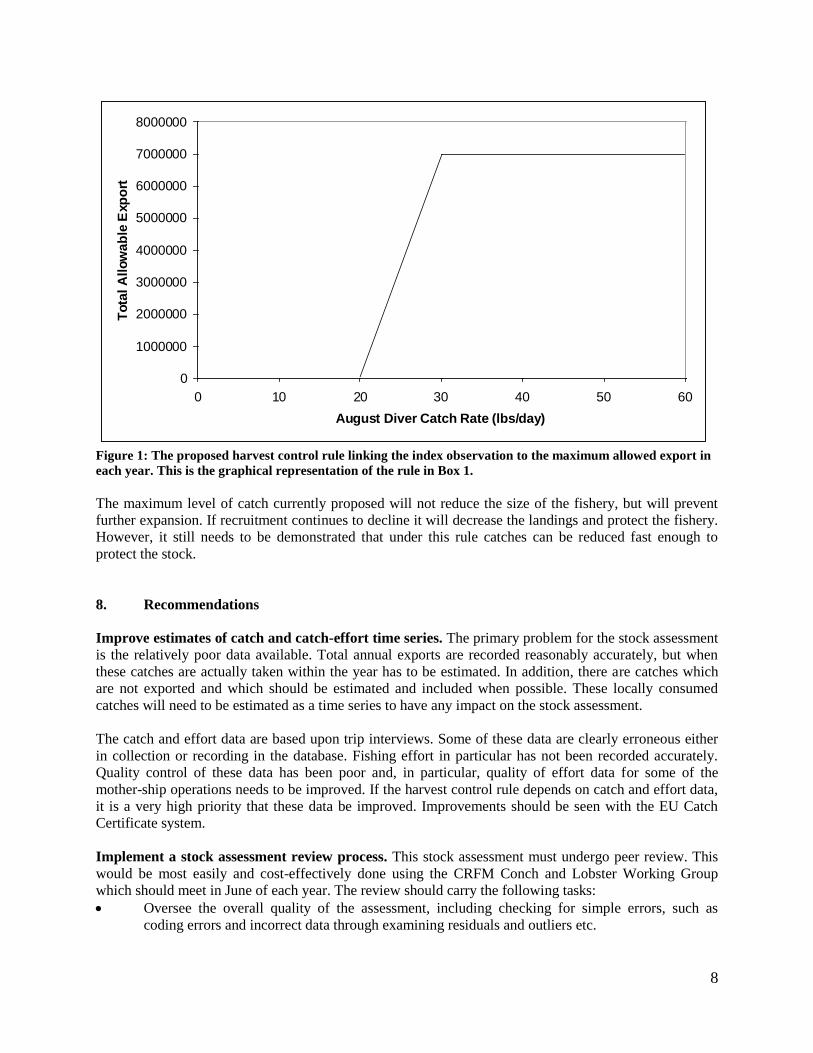
Figure 1: The proposed harvest control rule linking the index observation to the maximum allowed export in
each year. This is the graphical representation of the rule in Box 1.
The maximum level of catch currently proposed will not reduce the size of the fishery, but will prevent
further expansion. If recruitment continues to decline it will decrease the landings and protect the fishery.
However, it still needs to be demonstrated that under this rule catches can be reduced fast enough to
protect the stock.
8. Recommendations
Improve estimates of catch and catch-effort time series. The primary problem for the stock assessment
is the relatively poor data available. Total annual exports are recorded reasonably accurately, but when
these catches are actually taken within the year has to be estimated. In addition, there are catches which
are not exported and which should be estimated and included when possible. These locally consumed
catches will need to be estimated as a time series to have any impact on the stock assessment.
The catch and effort data are based upon trip interviews. Some of these data are clearly erroneous either
in collection or recording in the database. Fishing effort in particular has not been recorded accurately.
Quality control of these data has been poor and, in particular, quality of effort data for some of the
mother-ship operations needs to be improved. If the harvest control rule depends on catch and effort data,
it is a very high priority that these data be improved. Improvements should be seen with the EU Catch
Certificate system.
Implement a stock assessment review process. This stock assessment must undergo peer review. This
would be most easily and cost-effectively done using the CRFM Conch and Lobster Working Group
which should meet in June of each year. The review should carry the following tasks:
Oversee the overall quality of the assessment, including checking for simple errors, such as
coding errors and incorrect data through examining residuals and outliers etc.
9
Consider whether the model assumptions and structure are reasonable. If the model structure can
be significantly improved, implement the improvement as part of the assessment.
Identify an appropriate base case and sensitivity analyses. Request and review all output
necessary to verify the model fit, diagnose problems and be able to give management advice.
Identify the main axis of uncertainty and bracket the interval which will cover the true fishery
state with a high degree of certainty.
Provide full management advice, taking account of the uncertainty, based on the best scientific
assessment available. The management advice may require evaluation of management tools such
as harvest control rules, indicating whether they are precautionary and robust to uncertainties
identified as part of the assessment process.
Include Size Composition Data into the Assessment. Assuming that the current catch and effort data
are considered acceptable, including size composition should allow the assessment to model the
population components. However, the limitations on the size data (i.e. sizes based on weight and
inconsistent sizes used in commercial size categories) would make such a model far from easy to
complete.
Assessments for the Separate Bank Populations. The stock assessment cannot separate the different
lobster populations in the Bahamas because the catch data cannot be attributed to any particular location.
Strictly speaking, adult stocks should be managed separately, and as data improves, separate assessments
for each area should be undertaken.
10
II. REPORT OF THE SMALL COSTAL PELAGIC FISH RESOURCE WORKING GROUP
(SCPWG)
Consultant: Professor Juan Carlos Seijo
Chairperson: Maren Headley
Group Members: Dr. Susan Singh-Renton (CRFM Secretariat); Ms. Ruth Redman (Trinidad and
Tobago); Mr. Mauro Gongora (Belize); Ms. Elizabeth Mohammed (Trinidad and
Tobago); Mr. Ricardo Morris (Jamaica); Professor Hazel Oxenford (CERMES);
Mrs. Anginette Murray (Jamaica); Mr. Sam Heyliger (St. Kitts and Nevis); Mr.
Alwyn Ponteen (Montserrat); Ms. Elaine Ferrier (CIDA)
A. OVERVIEW
1. Review and Adoption of Meeting Agenda
The group reviewed and adopted the proposed agenda.
2. Review of Meeting’s Objectives
It was agreed that the main objectives of this year’s meeting would be to:
(i) To explore the bioeconomic dynamic impacts of managing the multi-fleet and multispecies
flyingfish fishery.
(ii) To undertake risk analysis of alternative fishery management decisions.
3. Review of Working Group’s Commitment to the CLME Project
An overview of the Flyingfish Pilot component of the CLME project was provided. The Caribbean Large
Marine Ecosystem (CLME) project is a four year Global Environment Fund (GEF) project to promote the
sustainable management of the shared living marine resources of the region through an integrated or
ecosystem-management approach (CRFM 2010; UNDP 2010). The overall coordination for this
flyingfish pilot will be provided by the CRFM Secretariat.
The following priority actions for the sustainability of the Eastern Caribbean flyingfish fishery have been
identified under the CLME Flyingfish Pilot project:
(i) Improvement of data availability and information including catch / effort information, in the
Eastern Caribbean taking into account long lining and mixed landings;
(ii) Bioeconomic studies of the fishery to establish the bioeconomic criteria and set reliable
management measures for the fourwinged flyingfish;
(iii) Assessment of species interaction between flyingfish and large pelagic fishes to provide for these
in management using EBM principles; and
(iv) Assessment of economic risk and social impacts to refine the management for the fourwinged
flyingfish.
11
4. Review of available new data and information on fishery interest, including review of
national reports, fisheries trends, pertinent technical studies completed to date and
management developments.
A brief overview of the flyingfish fisheries in the region was provided including trends in landings and
the value of the fisheries in the Eastern Caribbean.
An update on the status of the flyingfish fishery in Tobago was provided by the national representative. It
was reported that only one company was currently processing flyingfish and fishers were not targeting
flyingfish as much as in previous years given the lack of a market. The meeting was also informed that
many of the individuals who received training in deboning flyingfish, which adds considerable value to
the product have left the processing sector and sought alternative employment.
An inter-sessional study completed by the CIDA intern Ms. Elaine Ferrier, was presented to the group.
The study was focused on obtaining the perspectives of stakeholders on the importance of various
management objectives. A summary of the findings is provided below.
Regional governance of the flyingfish fishery in the Eastern Caribbean requires agreement upon
management objectives as well as how important these objectives are in relation to each other. A pre-
established hierarchy of objectives can guide governance of the fishery and significantly assist decision-
making processes. This hierarchy is critical to manage the complexity of a multi-species regional fishery,
because it is rarely possible to optimize multiple and competing objectives (Pope 1997 as cited in Mardle
et al., 2004).
Field work was conducted with fishers, fish processors, and fisheries division staff in Barbados and
Tobago to determine their perception of the relative importance of a range of management objectives
drawn from FMPs and reports relating to the Eastern Caribbean Flyingfish fishery. Thirty seven
respondents from eight landing sites conducted a modified pairwise comparison technique developed by
Simos (1990, as described in Ondrus and Pigneur 2006) which involved sorting cards with a description
of each management objective. In this technique, respondents were asked to arrange the cards according
to their importance from 1 to n. This ordinal data was then converted into pairwise comparison tables.
That is, if a respondent sorted objective A as more important than objective B, objective A was recorded
as being more important in the pairwise comparison. Note that this assumes that by positioning a card in a
certain level, the respondent believed this card to be more important than all those below it, less important
than all those above it, and of equal importance to those in the same level.
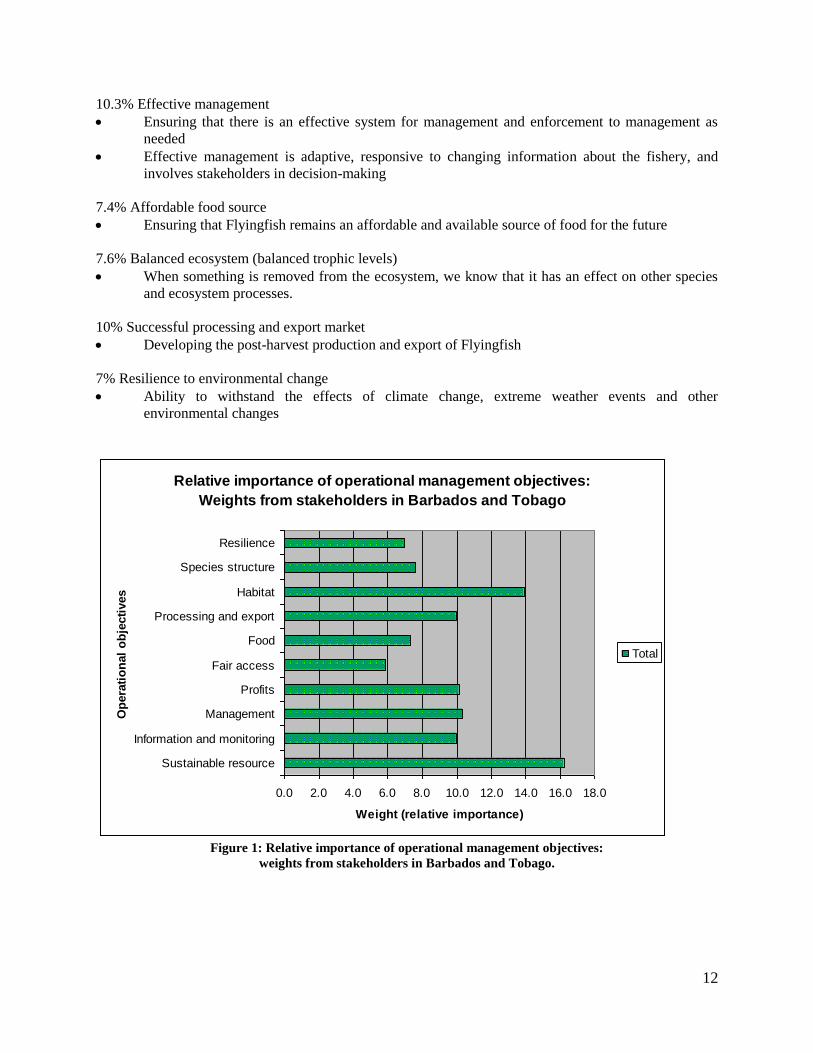
The management objectives drawn from FMPs and grey literature reports and their relative weights as
determined in the study are as follows (Figure 1):
16.2% Sustaining the stock size
Ensuring that there are Flyingfish available for future generations
Preventing overfishing to maintain a healthy stock
10% Accurate information
Ensuring that an effective data collection system is in place to provide accurate information and
knowledge about the state of the fishery
10.1% High profits
Optimal economic benefits for all involved in the fishery
12
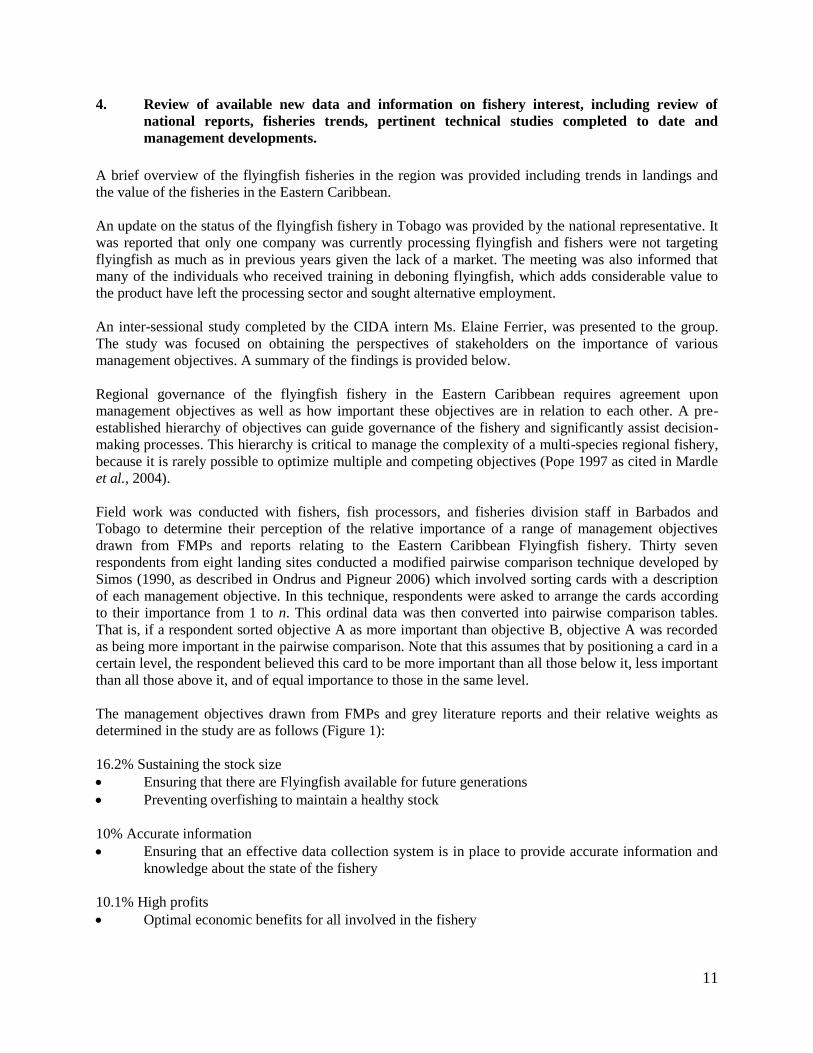
10.3% Effective management
Ensuring that there is an effective system for management and enforcement to management as
needed
Effective management is adaptive, responsive to changing information about the fishery, and
involves stakeholders in decision-making
7.4% Affordable food source
Ensuring that Flyingfish remains an affordable and available source of food for the future
7.6% Balanced ecosystem (balanced trophic levels)
When something is removed from the ecosystem, we know that it has an effect on other species
and ecosystem processes.
10% Successful processing and export market
Developing the post-harvest production and export of Flyingfish
7% Resilience to environmental change
Ability to withstand the effects of climate change, extreme weather events and other
environmental changes
Relative importance of operational management objectives:
Weights from stakeholders in Barbados and Tobago
0.0 2.0 4.0 6.0 8.0 10.0 12.0 14.0 16.0 18.0
Sustainable resource
Information and monitoring
Management
Profits
Fair access
Food
Processing and export
Habitat
Species structure
Resilience
Op
era
tio
nal
ob
jecti
ves
Weight (relative importance)
Total
Figure 1: Relative importance of operational management objectives:
weights from stakeholders in Barbados and Tobago.
13
B. FISHERIES REPORTS
1.0 Eastern Caribbean Flyingfish Fishery
1.1 Management Summary
1.1.1 Policy and Objectives
Regional Flyingfish Policy
Regional policy relating to flyingfish in the Eastern Caribbean is currently under development. In 1999,
an ad hoc Working Group was assembled by the FAO to compile existing data and develop regional
policy and management strategies. The following policy statement was developed in 2008 at the third
meeting of this group:
“The objective of fisheries management and development shall be to ensure responsible and sustained
fisheries, such that the fisheries resources in the waters of the eastern Caribbean are optimally utilized for
the long-term benefit of all people in the eastern Caribbean region.”
More specifically, the working group articulated the following operational objectives for the flyingfish
fishery (FAO 2010; paraphrased and headings added):
Management
Collaborative management
Fair access to the fishery
Distribution of benefits to all people in the region
Active fisherfolk organizations with effective links to other organizations and governments
Harvest sector
Well trained fishers
Investment in the fishery
Commitment to responsible fishing practices
Access to reasonably priced fishing equip and supplies, stable market
Post-harvest sector
High quality fish and fish products
Prevention of wastage
Greater distribution of profits
Value-added (processed) products
Better distribution of fish products to all sectors of the local public
1.1.2 Fisheries Management
Flyingfish Management
There are currently no management rules or controls for the Flyingfish fishery in the Eastern Caribbean.
In lieu of formal reference points for the Flyingfish fishery, a stock assessment conducted in 2008
identified an annual harvest trigger point of 5,000 tonnes, indicating that:
“Sustained catches at, or above, this level are likely to bring about an unacceptable risk of overfishing.
Either catches must be maintained below this level, or further research, data collection and stock
14
assessment work is required to enable a new higher limit to be set while still ensuring that the limit is
safe” (Medley et al. 2008).
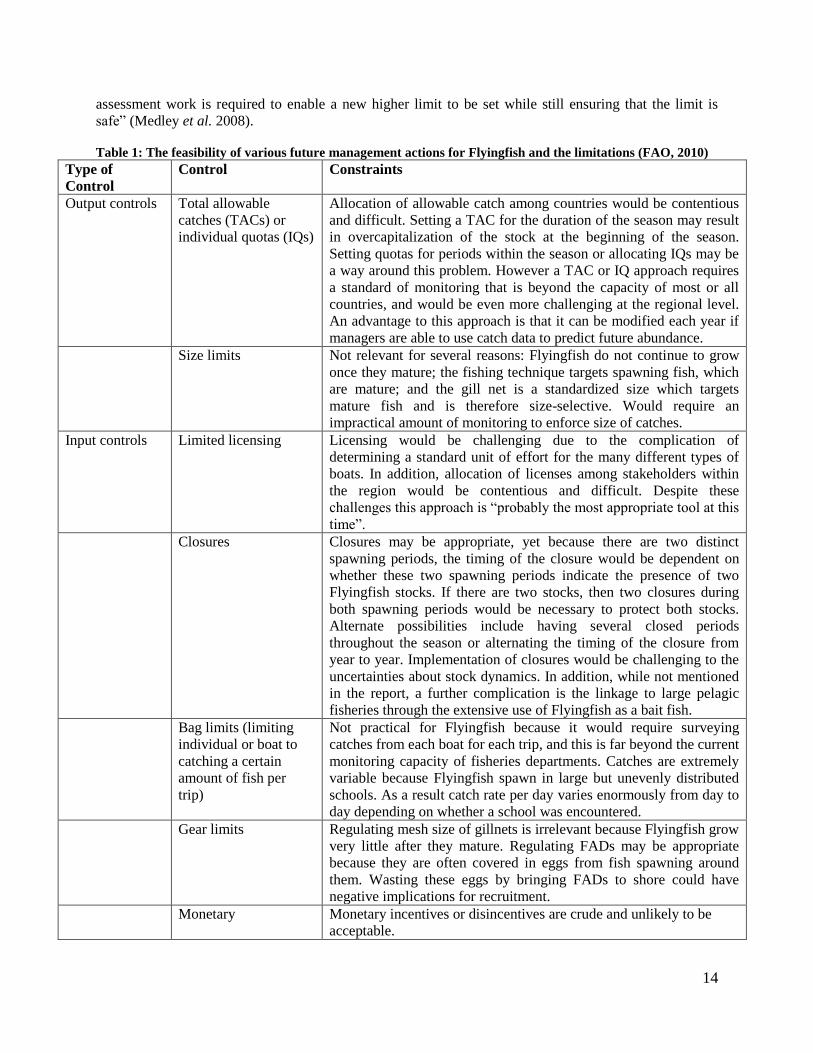
Table 1: The feasibility of various future management actions for Flyingfish and the limitations (FAO, 2010)
Type of
Control
Control Constraints
Output controls
Total allowable
catches (TACs) or
individual quotas (IQs)
Allocation of allowable catch among countries would be contentious
and difficult. Setting a TAC for the duration of the season may result
in overcapitalization of the stock at the beginning of the season.
Setting quotas for periods within the season or allocating IQs may be
a way around this problem. However a TAC or IQ approach requires
a standard of monitoring that is beyond the capacity of most or all
countries, and would be even more challenging at the regional level.
An advantage to this approach is that it can be modified each year if
managers are able to use catch data to predict future abundance.
Size limits
Not relevant for several reasons: Flyingfish do not continue to grow
once they mature; the fishing technique targets spawning fish, which
are mature; and the gill net is a standardized size which targets
mature fish and is therefore size-selective. Would require an
impractical amount of monitoring to enforce size of catches.
Input controls
Limited licensing
Licensing would be challenging due to the complication of
determining a standard unit of effort for the many different types of
boats. In addition, allocation of licenses among stakeholders within
the region would be contentious and difficult. Despite these
challenges this approach is “probably the most appropriate tool at this
time”.
Closures
Closures may be appropriate, yet because there are two distinct
spawning periods, the timing of the closure would be dependent on
whether these two spawning periods indicate the presence of two
Flyingfish stocks. If there are two stocks, then two closures during
both spawning periods would be necessary to protect both stocks.
Alternate possibilities include having several closed periods
throughout the season or alternating the timing of the closure from
year to year. Implementation of closures would be challenging to the
uncertainties about stock dynamics. In addition, while not mentioned
in the report, a further complication is the linkage to large pelagic
fisheries through the extensive use of Flyingfish as a bait fish.
Bag limits (limiting
individual or boat to
catching a certain
amount of fish per
trip)
Not practical for Flyingfish because it would require surveying
catches from each boat for each trip, and this is far beyond the current
monitoring capacity of fisheries departments. Catches are extremely
variable because Flyingfish spawn in large but unevenly distributed
schools. As a result catch rate per day varies enormously from day to
day depending on whether a school was encountered.
Gear limits
Regulating mesh size of gillnets is irrelevant because Flyingfish grow
very little after they mature. Regulating FADs may be appropriate
because they are often covered in eggs from fish spawning around
them. Wasting these eggs by bringing FADs to shore could have
negative implications for recruitment.
Monetary
Monetary incentives or disincentives are crude and unlikely to be
acceptable.
15
1.2 Status of Stocks
1.2.1 Flyingfish (Hirundichthys affinis)
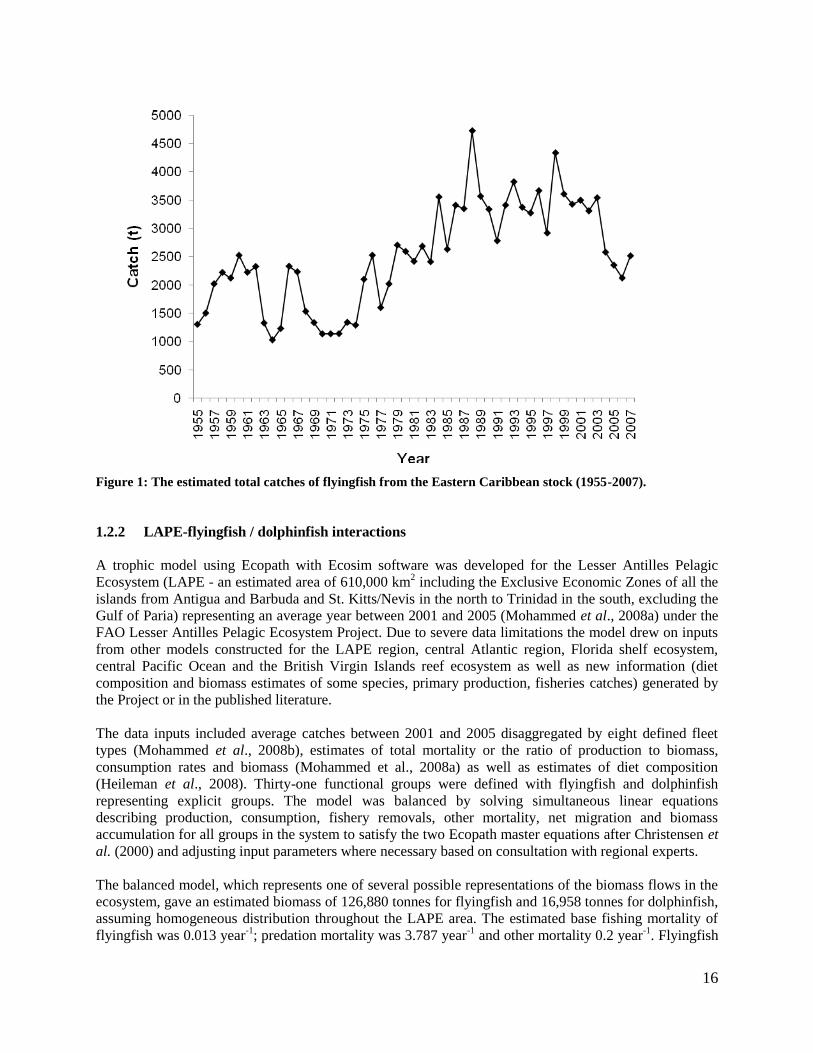
Estimates of annual total flyingfish landings for the eastern Caribbean are available in FAO (2010). The
landings, estimated for Barbados, Trinidad and Tobago, St Lucia, Grenada, St Vincent and the
Grenadines, Dominica and Martinique vary considerably from year to year. These estimated landings
ranged from 1,025 to 2,523 tonnes per year between 1950 and 1979 and appeared to increase thereafter,
ranging from 2,121 to 4,725 tonnes per year between 1980 and 2007 (Figure 2). The estimated average
annual landing between 2002 and 2007 was 2,512 tonnes. These data are, however, to be treated
cautiously as they are likely underestimates of the true catches in the region. Grenada has developed a
significant bait fishery for the species, the catches of which are not well documented. In addition,
landings from Martinique and other countries in the Eastern Caribbean likely to be harvesting the species
are not available. There are also gaps in available data which required interpolation to estimate landings
for years without data. Generally several countries lack a clear methodology for estimating total catches
from recorded data. Consequently, there is tremendous uncertainty in the level of historical catches of
flyingfish for the Eastern Caribbean. Estimates of fishing effort are also uncertain.
Three stock assessments of the flyingfish fishery within the Eastern Caribbean have been conducted
(Mahon 1989; Oxenford et al., 2007; Medley et al., 2008) and extensive research undertaken on the
fishery by the Eastern Caribbean Flyingfish Project (Oxenford et al., 2007). In addition, a preliminary
trophic model constructed for the Lesser Antilles Pelagic Ecosystem (LAPE) project examined impacts of
predator-prey and technological interactions in the fishery (Mohammed et al., 2008a) and a preliminary
bioeconomic model for the eastern Caribbean flyingfish fishery was developed (Headley, 2009).
The most recent stock assessment (Medley et al., 2008) considered a wider spatial range of landings data
than the previous assessments (Barbados, Trinidad and Tobago, St Lucia, Grenada, St Vincent and the
Grenadines, Dominica and Martinique) for 1955 to 2007 and catch and effort data from Barbados,
Trinidad and Tobago and Saint Lucia from 1994 to 2007. A Beverton and Holt Stock Recruitment model
was used with the possible oceanographic effects on the population accounted for by inclusion of process
error in the analyses and uncertainties in biological parameters accounted for using a Bayesian approach.
The stock assessment suggested that the stock of flyingfish in the eastern Caribbean is not overfished
and that overfishing is not occurring.
The assessment, however, could not be used to determine whether or not “local depletion” may be
occurring as the data are not available in the level of detail required to do so. Catch rates have remained
fairly stable even with increased overall catches. Given the potential stock area, and estimates of a
relatively large stock size from tagging and survey data, it is unlikely that the catches have ever exceeded
the maximum sustainable yield from the stock. Consequently, there is no evidence that the stock has ever
been overfished.
The model estimated, for 2007, MSY at between 3,312 and 36,291 tonnes; B/Bmsy at between 1.97 and
4.17; and F/Fmsy at between 0.03 and 0.5 (0.05 and 0.95 confidence intervals respectively). The model
projections show that keeping the fishing effort and capacity or catch at about 2,500 tonnes (the
maximum recorded catch to date has been 4,700 tonnes) should be safe with overfishing very unlikely
even with stock fluctuations due to environmental influences. Given the uncertainty in the MSY value,
attempts to fix the fishing mortality in relation to MSY or set catches at or above 5,000 tonnes led to
prediction of significant risks in overfishing. Consequently, it was suggested that a trigger point should be
established at 5,000 tonnes, such that when catches consistently exceed this figure management should
take action to safeguard the stock from overfishing.
16
Figure 1: The estimated total catches of flyingfish from the Eastern Caribbean stock (1955-2007).
1.2.2 LAPE-flyingfish / dolphinfish interactions
A trophic model using Ecopath with Ecosim software was developed for the Lesser Antilles Pelagic
Ecosystem (LAPE - an estimated area of 610,000 km2 including the Exclusive Economic Zones of all the
islands from Antigua and Barbuda and St. Kitts/Nevis in the north to Trinidad in the south, excluding the
Gulf of Paria) representing an average year between 2001 and 2005 (Mohammed et al., 2008a) under the
FAO Lesser Antilles Pelagic Ecosystem Project. Due to severe data limitations the model drew on inputs
from other models constructed for the LAPE region, central Atlantic region, Florida shelf ecosystem,
central Pacific Ocean and the British Virgin Islands reef ecosystem as well as new information (diet
composition and biomass estimates of some species, primary production, fisheries catches) generated by
the Project or in the published literature.
The data inputs included average catches between 2001 and 2005 disaggregated by eight defined fleet
types (Mohammed et al., 2008b), estimates of total mortality or the ratio of production to biomass,
consumption rates and biomass (Mohammed et al., 2008a) as well as estimates of diet composition
(Heileman et al., 2008). Thirty-one functional groups were defined with flyingfish and dolphinfish
representing explicit groups. The model was balanced by solving simultaneous linear equations
describing production, consumption, fishery removals, other mortality, net migration and biomass
accumulation for all groups in the system to satisfy the two Ecopath master equations after Christensen et
al. (2000) and adjusting input parameters where necessary based on consultation with regional experts.
The balanced model, which represents one of several possible representations of the biomass flows in the
ecosystem, gave an estimated biomass of 126,880 tonnes for flyingfish and 16,958 tonnes for dolphinfish,
assuming homogeneous distribution throughout the LAPE area. The estimated base fishing mortality of
flyingfish was 0.013 year-1
; predation mortality was 3.787 year-1
and other mortality 0.2 year-1
. Flyingfish
17
experienced greatest predation mortality from dolphinfish (1.15 year-1
), large mesopelagics (1.11 year-1
),
large squids (0.74 year-1
) and coastal predators (0.52 year-1
). For dolphinfish, the estimated base fishing
mortality was 0.13 year-1
, predation mortality was 4.394 year-1
and other mortality was 0.196 year-1
.
Dolphinfish experienced greatest predation mortality due to cannibalism (4.32 year-1
) compared to
predation by bigeye tuna (0.023 year-1
and yellowfin tuna (0.016 year-1
). A preliminary simulation using
Ecosim examined the impacts of increased fishing mortality on flyingfish from the baseline to F = 1.0
year-1
at year 5, and sustained at this level for an additional 15 years showed that dolphinfish, as a key
predator of flyingfish, is negatively impacted. However, when dolphinfish is subject to a similar pattern in
fishing mortality the increases in flyingfish biomass were modest. A combined increase in fishing
mortality of the two groups was detrimental to dolphinfish. The inequality in responses to increased
fishing on flyingfish and dolphinfish suggests that prey availability is a stronger control in the
dolphinfish – flyingfish dynamics, than predator control.
The authors caution about the limitations of the model, including its non-validation and advised that the
model be considered a framework for critical analysis which can be used to assess the compatibility of
new and existing information for the region, to develop hypotheses about the biological and technical
interactions within the LAPE and to identify research needs for understanding these interactions and their
relevance to management.
Fanning and Oxenford (2011) extracted outputs of the trophic model (Mohammed et al., 2008a) to
describe the trophic, technical and economic linkages between dolphinfish and flyingfish, and among the
longline, beach seine and traditional flyingfish fisheries and to highlight the management concerns that
are of relevance to implementing an ecosystem approach to fisheries. In concluding, the authors noted
that single species assessments of both species, each of which is annual, based on their respective life
history characteristics have suggested that each stock can withstand relatively high levels of fishing effort
with little risk of stock collapse but that when the trophic linkages are quantified it becomes apparent that
the dolphinfish population is highly sensitive to flyingfish biomass, and the respective fishery is less
likely to be sustainable with a marked decrease in flyingfish biomass. The authors recommended that the
quality and quantity of catch and economic data be improved and that basic biological research, in
particular diet studies, be conducted to improve the model quality as a basis for its use in assessing
ecosystem level changes over time.
1.3 Management Advice
Given that stock fluctuations and climate change effects can negatively affect the abundance of flyingfish,
the following management considerations are suggested:
1. Strengthening, through education, fishing community resilience and adaptability to fluctuating
stocks and changes in resource accessibility,
2. Fostering vessel malleability and versatility to facilitate shifting of target species as required by
stock fluctuations and climate changes effects on species distribution and availability and over
space and time,
3. Fishing licensing, for this fishery should be for multiple species rather than for single species.
This would allow fishermen to react intelligently to relative stock abundance/availability and
associated profits over time.
1.4 Statistics and research recommendations
1.4.1 Recommendations for the Caribbean Regional Fisheries Mechanism Secretariat
Future bioeconomic research for this important fishery of the CLME, should perhaps consider the
following questions:
18
1. Are long-term stock fluctuations associated to changes in abundance of predators (i.e.
dolphinfish, and other large pelagic species) and competitors targeted by other fleets? If so, is
there a dynamic bioeconomic optimum level of effort and fishing capacity of the eco-
technological interdependent fleets?
2. Are the cycle and/or amplitude of long-term fluctuating stocks changing with climate change? If
so, what should the adequate vessel capacity be?
In order to address the questions listed above, biomass estimates for the important commercial pelagic
species harvested in the multi-species flyingfish fishery will be necessary to incorporate in the analysis
their dynamics and corresponding ecological interdependencies.
1.4.2 Individual Countries
Countries should consider conducting a cost survey of their multi-species pelagic fleets, which would
allow the economic data to be updated.
1.5 Stock Assessment Summary
This assessment explored the bioeconomic dynamic impacts of managing the multi-fleet and multispecies
flyingfish fishery, and undertook risk analysis of alternative fishery management decisions. Some of the
management questions considered in the analysis of this stock fluctuating fishery involved the following
questions:
1. Can this stock fluctuating fishery be managed sustainably with an open access strategy?
2. Which is the bioeconomic optimum fishing mortality and corresponding vector of catch quotas
for managing a stock fluctuating fishery?
3. Which are the risks of falling below limit reference points associate to alternative fishery
management strategies?
For the identified management questions, and corresponding performance variables:
1. A dynamic model was built with and without fluctuating carrying capacity.
2. Bioeconomic parameters were calculated from data provided by participants’ countries and
relevant published previous fishery assessments.
3. Without fluctuating carrying capacity, as suggested by Klyashtorin (2001), the flyingfish pelagic
fishery model did not represent the dynamics of observed catch.
4. Optimal control theory was applied to estimate the cycle and amplitude parameters that best fitted
the trajectory of observed catch data, and the optimum fishing mortality (Fopt) to be multiplied
over time by the fluctuating biomass to obtain a dynamic TAC.
5. Proceed to explore alternative management strategies to address the management questions and
their effect on Bt, Yt and NPV.
6. A Monte Carlo analysis was undertaken to estimate the probability of exceeding biologic
(B(OA)t/Kt) and economic LRP’s (NPV(OA)/NPV(TACopt) with alternative management
strategies. A risk analysis to estimate tables without mathematical probabilities were built using
alternative criteria involving different degrees of risk aversion.
The main results of this preliminary dynamic bioeconomic analysis are the following:
1. The biomass dynamics for this stock fluctuating fishery using a dynamic carrying capacity with
an expanded version of Schaefer-Gordon model with multispecies and multi-fleet built in reflects
adequately the trajectory of catches for the period 1950-2007.
2. Under open access, harvest rates in the neighborhood of 5000/year ton could result in temporary
collapse of this pelagic fishery. This could be prevented with catch quotas, tending to the
19
TACopt, are established and effort is controlled to reduce exploitation rates by 30% to allow the
resource to recover its natural fluctuations over time.
3. The multi-species nature of this fishery involves additions to the flows of revenues to the fishery
over time coming from the harvest of valuable large pelagic species like dolphinfish, tunas,
wahoo, among others. Therefore, under open access, fishermen will not react by reducing their
effort when encountering lower biomass levels of flyingfish because the other species harvested
will tend to cover the variable costs of the fishing trip. Also, it was pointed in the discussions of
the working group that price of flyingfish has is very seasonally sensitive to supply (harvest rates
over time), tending to reach substantial increases in price with low catch rates. This effect not
explored in the quantitative analysis will tend to accentuate the need for managing the fishery
with the input and output control measures mentioned above.
4. Monte Carlo analysis indicates that with the current exploitation rates there is no risk of
exceeding a 0.3 ratio of Bt/Kt.
5. It was estimated in the Monte Carlo analysis that the net present value of the flow of profits was
in the neighborhood of 63% of the profits that could be obtained if operating the fishery at Fop.
1.6 Special Comments
None.
1.7 Policy Summary
Regional policy relating to flyingfish in the Eastern Caribbean is currently under development. In 1999,
an Ad Hoc Working Group was assembled by the FAO to compile existing data and develop regional
policy and management strategies. The following policy statement was developed in 2008 at the third
meeting of this group:
“The objective of fisheries management and development shall be to ensure responsible and sustained
fisheries, such that the fisheries resources in the waters of the eastern Caribbean are optimally utilized for
the long-term benefit of all people in the eastern Caribbean region.”
1.8 Conclusion and Recommendations
The main conclusions of this preliminary bioeconomic analysis of the four-wing flyingfish fishery are the
following:
(i) Because of exogenous fluctuations of carrying capacity, there are no possibilities for reaching
equilibrium (including bioeconomic equilibrium) in the fourwing flyingfish fishery of the Eastern
Caribbean.
(ii) Non-equilibrium conditions and stochasticity precludes the derivation of analytical solutions for
the differential equations describing resource and fishers dynamics.
(iii) Calculation of values of state variables for resource biomass and fleet specific effort dynamics
should be undertaken using numerical integration methods (e.g. Euler numerical integration)
(iv) Effort, catch and profits will tend to fluctuate in response to oscillations of resource abundance
through time, but not linearly because additional contributions of harvest of other pelagic species
contribute to pay for the variable costs of daily fishing effort.
(v) For stock fluctuating fisheries, target and limit reference points should not be scalars or discrete
values of biologic and economic indicators. To be meaningful, they should become time varying
hypothesis vectors of TRP’s and LRP’s with the corresponding vector of TAC´s.
(vi) The optimum fishing mortality for the stock fluctuating fishery was Fopt = 0.11.
(vii) Under current open access regime long-run risks are high for both, biologic and economic
indicators.
20
(viii) Model dynamic results of the Monte Carlo analysis indicate that license limiting to current levels
of effort drive above mentioned risks to low levels and increase to more than 70% the
probabilities of achieving bioeconomic target reference points for this fishery of the Eastern
Caribbean region.
Future bioeconomic research for this important fishery of the CLME, should perhaps consider the
following questions:
1. Are long-term stock fluctuations associated to changes in abundance of predators (i.e.
dolphinfish, and other large pelagic species) and competitors targeted by other fleets? If so, is
there a dynamic bioeconomic optimum level of effort and fishing capacity of the eco-
technological interdependent fleets?
2. Is the cycle and/or amplitude of long-term fluctuating stocks changing with climate change? If so,
what should the adequate vessel capacity be?
Finally, long-term stock fluctuating fisheries and possible climate change effects upon them, could
suggest the following management considerations:
1. Strengthening, through education, fishing community resilience and adaptability to fluctuating
stocks and changes in resource accessibility;
2. Fostering vessel malleability and versatility to facilitate shifting of target species as required by
stock fluctuations and climate changes effects on species distribution and availability and over
space and time;
3. Fishing licensing, for this fishery should be for multiple species rather than for single species.
This would allow fishermen to react intelligently to relative stock abundance/availability and
associated profits over time.
1.9 References
Christensen, V., C. J. Walters and D. Pauly. 2000. Ecopath with Ecosim: A User’s Guide, October 2000
Edition. Fisheries Centre, University of British Columbia, Vancouver, Canada and International
Center for Living Aquatic Resource Management (ICLARM), Penang, Malaysia. 130p.
CRFM (2010). Sustainable management of the shared marine resources of the Caribbean Large Marine
Ecosystem (CLME) and adjacent regions: Research proposal case study on eastern Flyingfish
fishery, TDA gap filling and SAP activities for the shared stocks of the Eastern Caribbean
Flyingfish Fishery. Belize City, Belize. http://www.caricom-
fisheries.com/LinkClick.aspx?fileticket=Xrc%2FVvnbL1U%3D&tabid=205
Fanning, P. and Oxenford, H. 2011. Ecosystem issues pertaining to the flyingfish fisheries of the eastern
Caribbean. Pp. 227-240 In: Fanning, L., Mahon, R. and McConney P. [Eds] Towards Marine
Ecosystem-based Management in the Wider Caribbean. MARE Publication Series No. 6. Amsterdam
University Press, Amsterdam 2011.
FAO. 2010. Western Central Atlantic Fishery Commission. Report of the Third Meeting of the
WECAFC ad hoc Flyingfish Working Group of the Eastern Caribbean. Mount Irvine, Tobago, 21 –
25 July 2008. FAO Fisheries and Aquaculture Report. No. 929. Rome, FAO. 2010. 88p.
Headley, M. 2009. Harvesting of Flyingfish in the Eastern Caribbean: A Bioeconomic Perspective.
United Nations University-Final Project.
Heileman, S., Mohammed, E. and Fanning, P. 2008. Derivation of diet composition in the Lesser Antilles
Pelagic Ecosystem. Technical Document No. 7 of Scientific Basis for Ecosystem-Based Management
21
in the Lesser Antilles Including Interactions with Marine Mammals and Other Top Predators FAO.
FI: GCP/RLA/140/JPN Barbados. 77p.
Klyashtorin, L.B. 2001. Climate change and long-term fluctuations of commercial catches: the possibility
of forecasting. FAO Fisheries Technical Paper 410:86p.
Mardle, Simon Pascoe, Sean and Herrero, Ines. 2004. Management objective importance in fisheries- an
evaluation using the Analytic Hierarchy Process. Environmental Management 33(1), 1-11.
Medley, P., Caesar, K., Hubert-Medar, P., Isaacs, K., Leslie, J., Mohammed, E., Oxenford,H.A., Phillip,
P., Potts, A.C., Ryan, R. And Walters, R. 2008. PART II: Management Strategy and Stock
Assessment Report for Flyingfish in the Eastern Caribbean. pp. 11 – 29 In: FAO, 2010. Report of the
Third Meeting of the WECAFC ad hoc Flyingfish Working Group of the Eastern Caribbean. Mount
Irvine, Tobago, 21–25 July 2008. FAO Fisheries and Aquaculture Report. No. 929. Rome, FAO.
2010. 88p.
Mohammed, E., Vasconcellos, M., Mackinson, S., Fanning, P., Heileman, S. and Carocci, F. 2008a. A
trophic model of the Lesser Antilles Pelagic Ecosystem. Technical Document No. 2 of Scientific
Basis for Ecosystem-Based Management in the Lesser Antilles Including Interactions with Marine
Mammals and Other Top Predators FAO. FI: GCP/RLA/140/JPN Barbados.168p.
Mohammed, E., P. Fanning, C. Parker, D. Theophille, L. Martin, S. Punnett, R. Wilkins, J. Rambally, P.
Phillip, C. Isaac, P. James and A. Barrett. 2008b. Estimated Catch, Price and Value for National Fleet
Sectors from Pelagic Fisheries in the Lesser Antilles. Technical Document No. 1 of Scientific Basis
for Ecosystem-Based Management in the Lesser Antilles Including Interactions with Marine
Mammals and Other Top Predators FAO. FI: GCP/RLA/140/JPN Barbados. 53p.
Ondrus, J. and Pigneur, Y. 2006. A multi-stakeholder multi-criteria assessment framework of mobile
payments: An illustration with the Swiss public transportation industry. Proceedings of the 39th
Annual Hawaii International Conference on System Sciences (HICSS’06), IEEE Computer Society.
UNDP 2010. PIMS 2193 - Sustainable Management of the Shared Living Marine Resources of the
Caribbean Large Marine Ecosystem (CLME) and Adjacent Regions
22
III. REPORT OF THE SHRIMP AND GROUNDFISH RESORUCE WORKING GROUP
(SGWG)
Chairperson: Lara Ferreira, Trinidad and Tobago
Rapporteurs: Ranjitsing Soekhradj, Suriname (Shrimp)
Lara Ferreira, Trinidad and Tobago (Shrimp)
Anginette Murray, Jamaica (Shrimp)
Ricardo Morris, Jamaica (Shrimp)
Consultant: Paul Medley (Fisheries Consultant, UK)
A. OVERVIEW
1. Review of inter-sessional activities since last meeting, including management developments
during this period
At the 5th CRFM Scientific Meeting in 2009 the following analyses were conducted for the Atlantic
seabob (Xiphopenaeus kroyeri) fishery in Guyana and Suriname separately as no evidence was found that
the stocks were shared: a catch and effort biomass dynamics model was fitted using Bayesian framework;
analysis of size composition data was conducted to determine the optimum closed season; several
morphometric relationships were determined; and various other exploratory analyses were done including
cross-correlations for river outflow. In the case of Trinidad and Tobago, preliminary analyses of ParFish
interview data for the shrimp trawl fishery were conducted.
The Inter-sessional Work Plan documented in the Report of the Shrimp and Groundfish Resource
Working Group at the 2009 Fifth Annual CRFM Scientific Meeting (the SGWG did not meet at the 2010
Sixth Annual Meeting) was reviewed and achievements noted as follows.
General
More interaction among SGWG members during the inter-sessional period was recommended via
electronic mail, Skype, net meeting sites or video conferencing. There was some interaction via
electronic mail among the members with respect to advancement in the ParFish assessment for Trinidad,
and the development and implementation of the Harvest Control Rule (HCR) for the Suriname seabob
fishery. There was a suggestion that if funding is sourced for the conduct of activities during the inter-
sessional period then this would promote more communication among the members of the Group.
The Stock Assessment Parameters Profile for five species of Western Atlantic Tropical Shrimp, first
developed by the Government of Trinidad and Tobago under an FAO/UNDP Project TRI/91/001 and
subsequently updated, is still to be circulated among the members of the SGWG for update with new
information obtained from assessments conducted at this workshop as well as any other relevant
information.
Guyana and Suriname
The Fisheries Department in Suriname obtained landings by size category and effort data from the two
seabob processing companies, namely Heiploeg Suriname (previously Guiana Seafoods which was
bought over by Heiploeg), and Namoona. Landings data (peeled weight in pounds) by size category for
1997 to 2010 were obtained from Heiploeg Suriname with days at sea for 2001 to 2010, and landings data
(live weight in kilogrammes) by size category for 1999 to 2010 were obtained from Namoona with days
at sea for 2003 to 2010.
23
Although no bilateral meeting between Suriname and Guyana was held as recommended, some sensitivity
analyses were conducted for the Suriname seabob assessment and the HCR was developed and
implemented. This rule has been reviewed by the Suriname Seabob Working Group which is a
management advisory group comprising the Government of Suriname, the two seabob processing
companies, and the NGO World Wildlife Fund (WWF). The HCR is being reviewed monthly to monitor
the status of the fishery. The relevant data are being obtained from the seabob processing companies in
Suriname to facilitate the monthly monitoring of the HCR.
Trinidad and Tobago
The Parfish interview data for the shrimp trawl fishery of Trinidad and Tobago were analysed to
determine the “priors” for the parameters (r, Binf, Bnow, q0) to update the Bayesian biomass dynamics
model for Trinidad and Tobago and Venezuela. In order to complete this analysis the methodology was
implemented in MS Excel and R. The “prior” probability of the parameters was determined based on the
proximity to the fishers’ estimated values. A method to use the preference interview data to estimate
utility for different HCRs was developed. Seven of the 43 ParFish interviews completed were considered
invalid and therefore not used in the analysis. The 1988 to 2004 time series of shrimp landings and effort
data for Trinidad and Tobago were updated to 2009. A similar data set was obtained from Venezuela to
update the series. Effort data however are still not available for Venezuela’s artisanal shrimping fleet.
2. General review of fisheries trends throughout the region, including recent developments
It was noted that industrial trawling in Venezuelan waters was banned by law as of 2008 which provided
for a one-year transition period until 2009. It was also noted that trawling was also banned in Belize
waters.
Details on the management developments in the seabob fishery in Suriname in its attempts to obtain MSC
Certification were discussed and are provided as Appendix 1.
3. Fishery data preparation, analysis, and report preparation
The members of the SGWG agreed to the following work plan for the meeting
Suriname
(a) Update the 2009 assessment of Atlantic seabob (Xiphopenaeus kroyeri) with revised and updated
annual catch and effort
(b) Publish the harvest control rule (HCR) and review its performance.
(c) Address any issues raised by management specifically artisanal catch
Trinidad and Tobago
(a) Complete ParFish assessment for the shrimp trawl fishery of Trinidad and Tobago
(b) Incorporate ParFish data into a Bayesian biomass dynamics model for Trinidad and Tobago and
Venezuela
(c) Develop a HCR using ParFish data
(d) Review assessment and HCR and make recommendations to Trinidad and Tobago Government.
24
Other
(a) Review catch and effort data on the marine white shrimp (Penaeus schmitti) fishery in the
Kingston Harbour, Jamaica
(b) Consider the use of hydrometric data as a recruitment/growth index using Guyana data.
Suriname
The 2009 seabob assessment was updated with the corrected landings and effort time series from the two
processing companies. The current assessment used the live weight as in the previous assessments from
which the harvest control rule was developed.
The current HCR for Suriname was tested against the new assessment to ensure it continues to achieve its
objectives. The HCR was found to be robust to the changes in the assessment that have occurred.
The assessment and HCR were reviewed for robustness against uncertainties. Further recommendations
were made to the Suriname Seabob Working Group on monitoring and procedures to ensure continued
sustainability.
Catch data are not available for the artisanal fishery but the catch is estimated to be some 500 tonnes per
year. Recommendations were made on designing a data collection programme to estimate this catch.
Trinidad and Tobago
Nominal CPUE indices (not standardized as this had little effect in previous assessments) were used in the
logistic model. Indices were still provided separately for the main fleet types which captures the main
differences among indices. Unfortunately, original raw data for the CPUE index was unavailable, but
averaged data derived from the same source were used, which followed the same trends. This was
combined with total annual catch obtained from Venezuela and Trinidad to update the 2006 assessment.
Recent information suggests catches have substantially declined and the stock has recovered to some
extent.
The stock assessment also used the Parfish interview data to carry out a decision analysis. The interviews
provide a prior probability based on fisher opinions and fisher preferences among different catch and
effort projections.
The fishers’ preference scores with respect to various levels of effort and resulting catch were used to
estimate the more preferred Harvest Control Rules. The aim would be to select those which are expected
to produce the most preferred outcomes for presentation to fishers.
The base effort was taken as the median effort of the entire Trinidad and Tobago / Venezuela shrimp fleet
1991 to 2004 (30,750 days at sea in Type II equivalent effort) when the shrimp stock was at its lowest.
Various lengths of closed season were considered, where the closed season reduced this effort
proportionally. Note that current effort is thought to be much lower than this, but is not due to direct
management intervention. In this context, a closed season would be put in place to protect the fishery
against expansion back to unsustainable levels. Other controls besides a closed season were also
considered, but it is not thought possible to implement other management measures at this time.
Choice of month for the closed season could be chosen based on fisher preference (Parfish interviews), or
observed shrimp size in particular months or some combination of the two. It was recommended that a
25
two month closed season be implemented and the fishers should be consulted on when the closure should
take place and how these would be administered.
Other
Jamaica
Catch and effort data from 1996, 2000 – 2010 for the marine white shrimp (Penaeus schmitti) in the
Kingston Harbour area were examined with the objective of determining the current stock status. It was
determined that based on the limited data set it would not be possible to conduct a reliable stock
assessment. As a result, it was decided to conduct a review of the fishery highlighting various
management issues and some of their implications. Recommendations were then put forward to address
these issues.
Time did not permit the consideration of hydrometric data as a recruitment /growth index using Guyana
data.
4. Inter-sessional workplan and Recommendations
Inter-sessional workplan
General
The Stock Assessment Parameters Profile for five species of Western Atlantic Tropical Shrimp, first
developed by the Government of Trinidad and Tobago under an FAO/UNDP Project TRI/91/001 and
subsequently updated, will be circulated among the members of the SGWG for update with new
information obtained from assessments conducted at this and previous workshops as well as any other
relevant information.
Suriname
The artisanal catch of seabob is to be estimated as part of the requirement for MSC certification. This can
be done based on information from the seabob buyers or by sampling the artisanal landings. If it can be
verified that the artisanal landings are less than 5% of the total seabob catch then no further monitoring of
this component of the fishery will be required in the longterm. If estimates suggest these catches are
significant, a time series of estimated catches needs to be developed for inclusion in the assessment.
The catch and effort data series is to be extended as far back as possible prior to 1998 for the seabob
fishery.
Trinidad and Tobago
The results of the ParFish analysis and biomass dynamics assessment for the shrimp fishery of Trinidad
and Tobago and Venezuela are to be presented to the fishing communities.
A closed season for the shrimp trawl fishery of Trinidad and Tobago is to be implemented in
collaboration with the fishing industry stakeholders.
Computerization of the Trinidad historical catch and effort data from the 1950s to the 1990s is to be
continued.
26
Jamaica
The national sampling plan for the white shrimp fishery that would facilitate regular stock assessments is
to be implemented.
An independent monitoring of white shrimp catch rates in various areas within the Kingston Harbour (and
possibly other areas) to determine the status of the stock and explore alternative fishing areas is to be
conducted.
A programme to obtain a socio-economic baseline which will complement the biological data for the
fishery is to be implemented. This baseline must include, but not be limited to; the number of active
fishers and vessels per year, earning per fisher/boat, basic household information, the degree of
importance of the fishery (economic and nutritional), operating costs of fishing
Relevant areas of the above recommendations are to be included in a management plan for the fishery and
the associated legislative regulations put in place.
Recommendations
General
An official membership list for the CFRM SGWG should be established to facilitate and promote
interaction among the member countries on issues related to these fisheries.
Funding could be sourced for the conduct of assessment- or management-related activities during the
inter-sessional period. The World Wildlife Fund (WWF) is one of the organizations identified as offering
funding in the area of fishery improvement plans with a view to raising the standard of fisheries
management to facilitate Marine Stewardship Council (MSC) Certification.
The use of hydrometric data as a recruitment/growth index should be considered as such factors as water
levels and water flows may cause fluctuation in stock size and hence help to explain variation in CPUE
and if so should be taken into consideration in the HCR. Data are available from Guyana for such
exploratory analyses.
Suriname
The measured weights should be obtained from the seabob processing companies and not the weights to
which conversion factors have already been applied for e.g. Namoona measures peeled weight in pounds
(so this is the measurement that should be obtained) but applies the factor 2.3 to convert to live weight
and then divides by 2.2046 to convert to kilogrammes.
Peeled weight (instead of live weight) in kilogrammes should be used in the assessment in future. The
morphometric and size frequency data should be examined at the next meeting as they provide some
information on size and age structure, which are not addressed by the current assessment. The research
should give estimates of growth rates, maximum size and mortality rates for independent comparison with
the results obtained from the catch and effort data.
Issues related to bycatch should be considered. Such issues are included in the research plan developed
for this fishery by the Suriname seabob management working group. This research plan forms part of the
management plan.
27
Trinidad and Tobago
Review historical records and consult with Trinidad industrial trawl fleet operators in an attempt to verify
or refine shrimp catch estimates prior to the year 2000 when sampling of this fleet was very low or non-
existent.
Implement a trip reporting system for the semi-industrial and industrial trawl fleets of Trinidad and
Tobago.
Implement an Observer Programme for the semi-industrial and industrial trawl fleets to verify the trip
reporting system.
Structure data collection to allow individual shrimp species to be monitored.
Obtain more detailed information, including on species life history, to account for other factors affecting
productivity, such as pollution, which was suggested as a contributing factor by stakeholders.
The shrimp stock distribution in Trinidad and Tobago waters should be investigated. Salinity, water
temperature, depth, chlorophyll distribution, shrimp species composition, and any other data which would
assist in determining the stock distribution should be collated.
Re-evaluate stock structure as the current assumed structure, effectively a single stock shared between
Venezuela and Trinidad, may not be accurate enough to protect fleets from depleting the resources they
have access to.
Recommendations to improve the logistic model for the Trinidad and Tobago/Venezuela shrimp fishery:
Consider changing catchability due to any shifts from targeting shrimp to targeting bycatch.
Include the CPUE standardization as part of the stock assessment rather that performing this
outside the assessment and pulling in the results.
Estimate the shrimp CPUE for the historical years
Jamaica
An assessment incorporating the socio-economic baseline data of the white shrimp fishery should be
conducted at the ninth CRFM scientific meeting (in the next two years).
1. Review and adoption of Working Group report, including species / fisheries reports for
2011.
The Working Group Report will be finalized, reviewed and adopted by the members of the SGWG via
electronic mail during the inter-sessional period.
Adjournment.
The meeting of the SGWG adjourned at 5.40 pm on 23 June 2011.
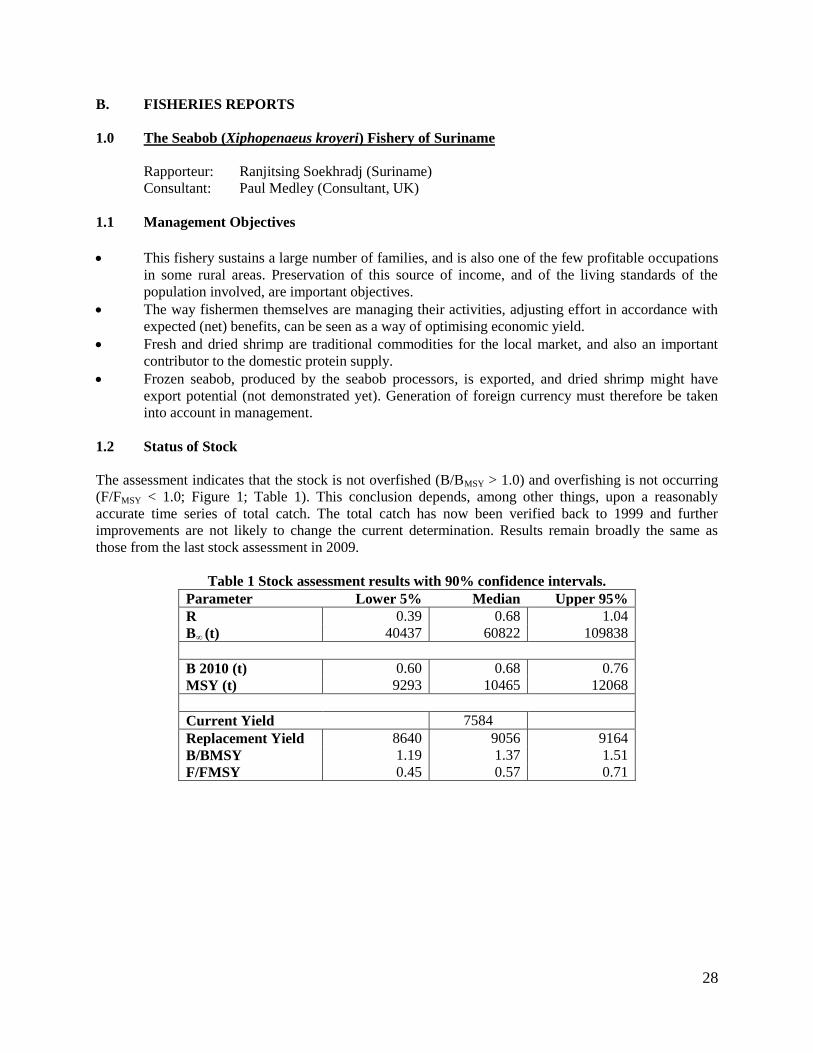
28
B. FISHERIES REPORTS
1.0 The Seabob (Xiphopenaeus kroyeri) Fishery of Suriname
Rapporteur: Ranjitsing Soekhradj (Suriname)
Consultant: Paul Medley (Consultant, UK)
1.1 Management Objectives
This fishery sustains a large number of families, and is also one of the few profitable occupations
in some rural areas. Preservation of this source of income, and of the living standards of the
population involved, are important objectives.
The way fishermen themselves are managing their activities, adjusting effort in accordance with
expected (net) benefits, can be seen as a way of optimising economic yield.
Fresh and dried shrimp are traditional commodities for the local market, and also an important
contributor to the domestic protein supply.
Frozen seabob, produced by the seabob processors, is exported, and dried shrimp might have
export potential (not demonstrated yet). Generation of foreign currency must therefore be taken
into account in management.
1.2 Status of Stock
The assessment indicates that the stock is not overfished (B/BMSY > 1.0) and overfishing is not occurring
(F/FMSY < 1.0; Figure 1; Table 1). This conclusion depends, among other things, upon a reasonably
accurate time series of total catch. The total catch has now been verified back to 1999 and further
improvements are not likely to change the current determination. Results remain broadly the same as
those from the last stock assessment in 2009.
Table 1 Stock assessment results with 90% confidence intervals.
Parameter Lower 5% Median Upper 95%
R 0.39 0.68 1.04
B∞ (t) 40437 60822 109838
B 2010 (t) 0.60 0.68 0.76
MSY (t) 9293 10465 12068
Current Yield 7584
Replacement Yield 8640 9056 9164
B/BMSY 1.19 1.37 1.51
F/FMSY 0.45 0.57 0.71
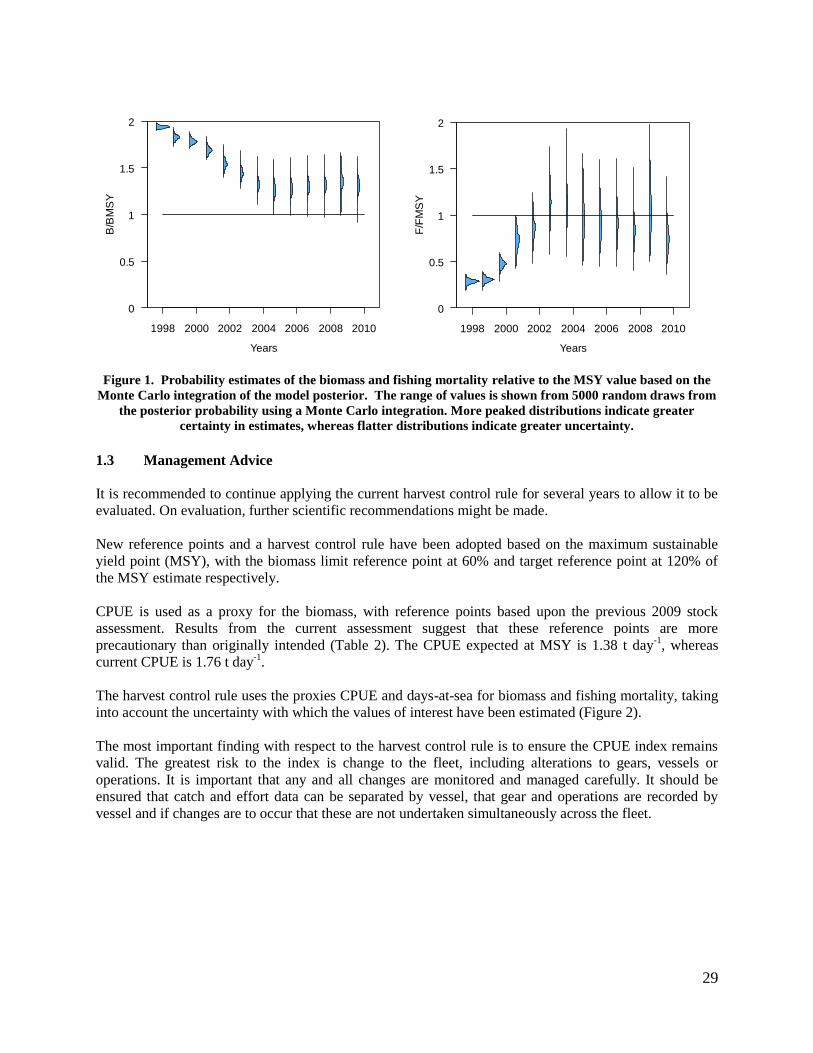
29
1998 2000 2002 2004 2006 2008 2010
0
0.5
1
1.5
2
Years
B/B
MS
Y
1998 2000 2002 2004 2006 2008 2010
0
0.5
1
1.5
2
Years
F/F
MS
Y
Figure 1. Probability estimates of the biomass and fishing mortality relative to the MSY value based on the
Monte Carlo integration of the model posterior. The range of values is shown from 5000 random draws from
the posterior probability using a Monte Carlo integration. More peaked distributions indicate greater
certainty in estimates, whereas flatter distributions indicate greater uncertainty.
1.3 Management Advice
It is recommended to continue applying the current harvest control rule for several years to allow it to be
evaluated. On evaluation, further scientific recommendations might be made.
New reference points and a harvest control rule have been adopted based on the maximum sustainable
yield point (MSY), with the biomass limit reference point at 60% and target reference point at 120% of
the MSY estimate respectively.
CPUE is used as a proxy for the biomass, with reference points based upon the previous 2009 stock
assessment. Results from the current assessment suggest that these reference points are more
precautionary than originally intended (Table 2). The CPUE expected at MSY is 1.38 t day-1
, whereas
current CPUE is 1.76 t day-1
.
The harvest control rule uses the proxies CPUE and days-at-sea for biomass and fishing mortality, taking
into account the uncertainty with which the values of interest have been estimated (Figure 2).
The most important finding with respect to the harvest control rule is to ensure the CPUE index remains
valid. The greatest risk to the index is change to the fleet, including alterations to gears, vessels or
operations. It is important that any and all changes are monitored and managed carefully. It should be
ensured that catch and effort data can be separated by vessel, that gear and operations are recorded by
vessel and if changes are to occur that these are not undertaken simultaneously across the fleet.
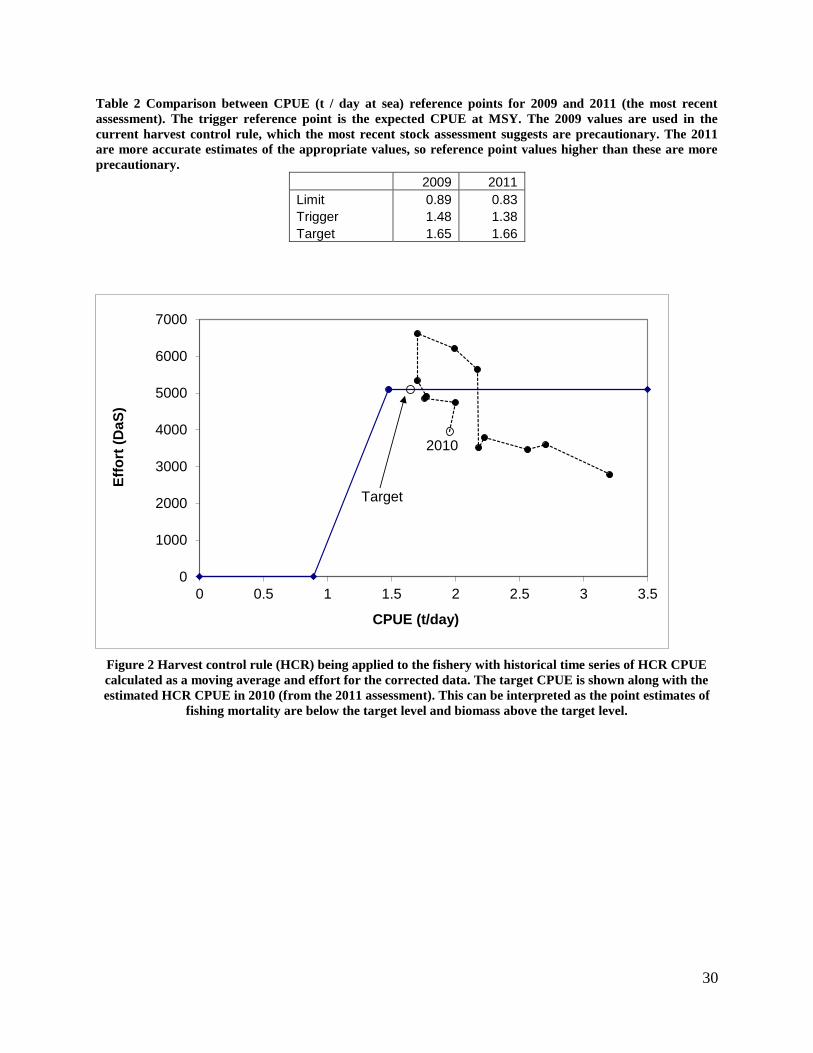
30
Table 2 Comparison between CPUE (t / day at sea) reference points for 2009 and 2011 (the most recent
assessment). The trigger reference point is the expected CPUE at MSY. The 2009 values are used in the
current harvest control rule, which the most recent stock assessment suggests are precautionary. The 2011
are more accurate estimates of the appropriate values, so reference point values higher than these are more
precautionary.
2009 2011
Limit 0.89 0.83
Trigger 1.48 1.38
Target 1.65 1.66
0
1000
2000
3000
4000
5000
6000
7000
0 0.5 1 1.5 2 2.5 3 3.5
Eff
ort
(D
aS
)
CPUE (t/day)
2010
Target
Figure 2 Harvest control rule (HCR) being applied to the fishery with historical time series of HCR CPUE
calculated as a moving average and effort for the corrected data. The target CPUE is shown along with the
estimated HCR CPUE in 2010 (from the 2011 assessment). This can be interpreted as the point estimates of
fishing mortality are below the target level and biomass above the target level.
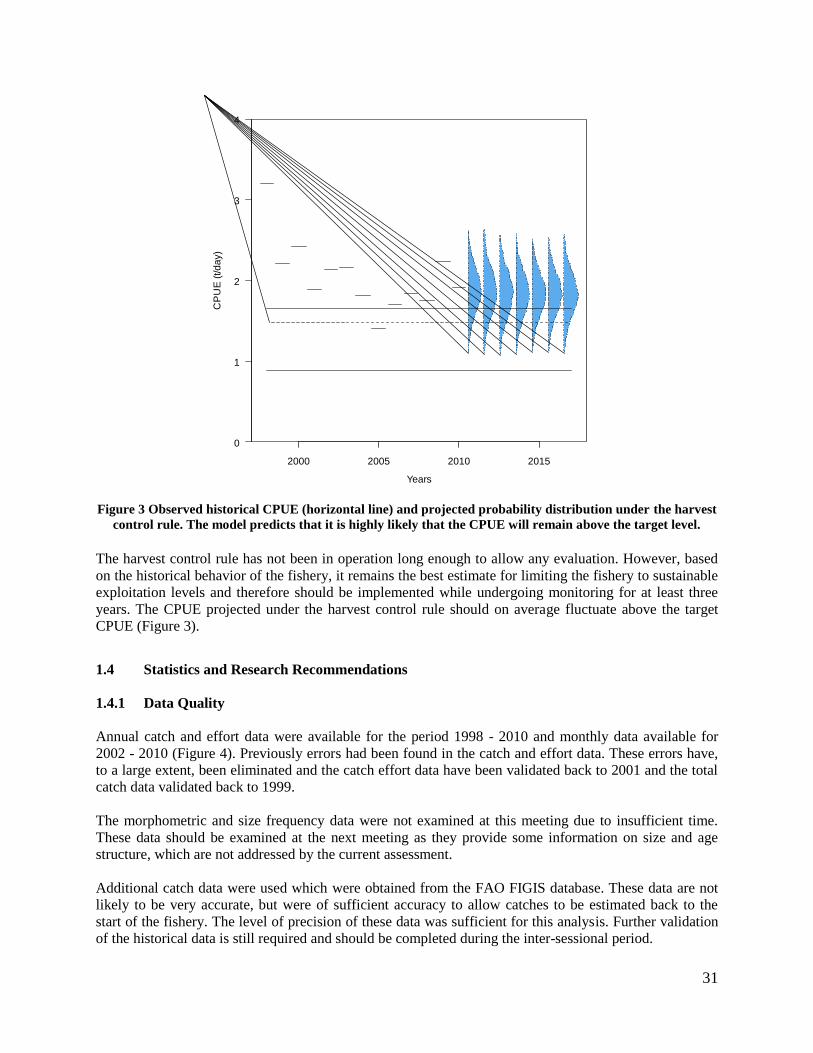
31
2000 2005 2010 2015
0
1
2
3
4
Years
CP
UE
(t/d
ay)
Figure 3 Observed historical CPUE (horizontal line) and projected probability distribution under the harvest
control rule. The model predicts that it is highly likely that the CPUE will remain above the target level.
The harvest control rule has not been in operation long enough to allow any evaluation. However, based
on the historical behavior of the fishery, it remains the best estimate for limiting the fishery to sustainable
exploitation levels and therefore should be implemented while undergoing monitoring for at least three
years. The CPUE projected under the harvest control rule should on average fluctuate above the target
CPUE (Figure 3).
1.4 Statistics and Research Recommendations
1.4.1 Data Quality
Annual catch and effort data were available for the period 1998 - 2010 and monthly data available for
2002 - 2010 (Figure 4). Previously errors had been found in the catch and effort data. These errors have,
to a large extent, been eliminated and the catch effort data have been validated back to 2001 and the total
catch data validated back to 1999.
The morphometric and size frequency data were not examined at this meeting due to insufficient time.
These data should be examined at the next meeting as they provide some information on size and age
structure, which are not addressed by the current assessment.
Additional catch data were used which were obtained from the FAO FIGIS database. These data are not
likely to be very accurate, but were of sufficient accuracy to allow catches to be estimated back to the
start of the fishery. The level of precision of these data was sufficient for this analysis. Further validation
of the historical data is still required and should be completed during the inter-sessional period.
32
As well as validating export catch estimates, the local artisanal catches for the dried seabob market need
to be estimated. If estimates suggest these catches are significant, a time series of estimated catches needs
to be developed for inclusion in the assessment. It is important to note that unless there have been
significant changes in these catches over time, they would not lead to a change in stock status, but they
will affect the estimate of absolute biomass.
1.4.2 Research
A research plan has been developed for this fishery by the Suriname seabob management working group,
and this research plan forms part of the management plan. This includes new issues related to bycatch
which has not been previously considered by this working group.
The primary aim for the stock assessment is to complete validation of the total catch, including estimates
of the artisanal catch.
Research is continuing on growth and mortality of seabob through the collection of detailed size
frequencies. A considerable data set is already available, but analysis is incomplete. The data were
reviewed and some analysis completed at the 2009 meeting. The research should give estimates of growth
rates, maximum size and mortality rates for independent comparison with the results obtained from the
catch and effort data. It is recommended that high priority be given to the analysis of these data.
1.5 Stock Assessment Summary
Bayesian statistics and the Monte Carlo (Sample importance resample algorithm) methods were used to
estimate probability distributions for Maximum Sustainable Yield (MSY)1, Replaceable Yield
2, current
biomass relative to biomass at MSY, and current fishing mortality relative to fishing mortality at MSY.
The assessment used the logistic biomass dynamics model fitted to the total catch 1989-2010 and catch
and effort 1998-2010.
Catch per unit effort (CPUE)3 was used as an index of the abundance of stock. The measure of effort used
was the number of days at sea, which would include steaming time. This was the only measure of effort
available, but was thought to be strongly related to the amount of fishing carried out. The CPUE index
has appeared to decline each year to 2005, but has also shown a recent increasing trend (Figure 4). The
results indicate a reasonable fit of the model (Figure 5), but it should be noted that although the model
largely explained the trends in the CPUE, these trends formed only a small part of the variation in CPUE.
The number of data points (13) was limited and with only very shallow trends, the four parameters could
only be weakly estimated.
The maximum sustainable yield was estimated to be between 9 000 and 12 000 t year-1
(Table 1).
However, in absolute terms, biomass, and therefore yield is poorly estimated (Figure 6). Hence, the
harvest control rule based on CPUE and effort rather than catch will be much more reliable.
1 Maximum Sustainable Yield or MSY is, theoretically, the largest yield/catch that can be taken from a species'
stock over an indefinite period. Any yield greater than MSY is thought to be unsustainable. 2 Replacement Yield is the yield/catch taken from a stock which keeps the stock at the current size.
3 CPUE is the quantity caught (in number or in weight) with one standard unit of fishing effort.
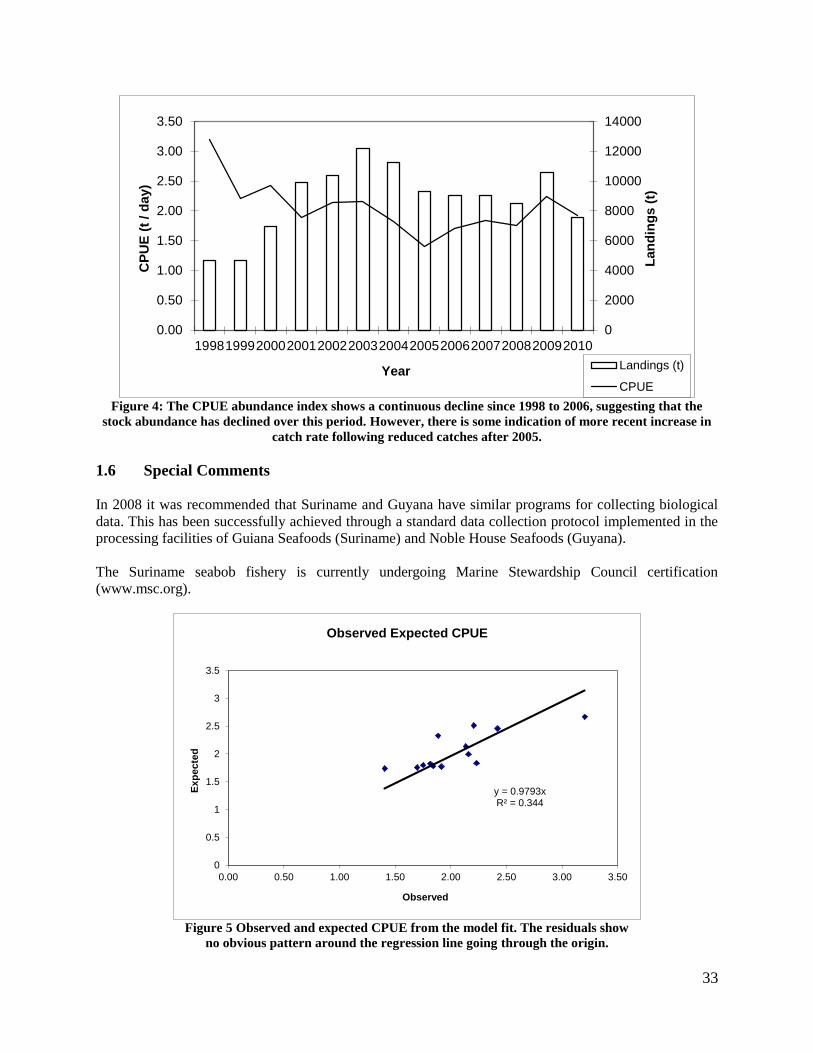
33
0
2000
4000
6000
8000
10000
12000
14000
0.00
0.50
1.00
1.50
2.00
2.50
3.00
3.50
1998199920002001200220032004200520062007200820092010
Lan
din
gs (
t)
CP
UE
(t
/ d
ay)
YearLandings (t)
CPUE
Figure 4: The CPUE abundance index shows a continuous decline since 1998 to 2006, suggesting that the
stock abundance has declined over this period. However, there is some indication of more recent increase in
catch rate following reduced catches after 2005.
1.6 Special Comments
In 2008 it was recommended that Suriname and Guyana have similar programs for collecting biological
data. This has been successfully achieved through a standard data collection protocol implemented in the
processing facilities of Guiana Seafoods (Suriname) and Noble House Seafoods (Guyana).
The Suriname seabob fishery is currently undergoing Marine Stewardship Council certification
(www.msc.org).
y = 0.9793xR² = 0.344
0
0.5
1
1.5
2
2.5
3
3.5
0.00 0.50 1.00 1.50 2.00 2.50 3.00 3.50
Exp
ecte
d
Observed
Observed Expected CPUE
Figure 5 Observed and expected CPUE from the model fit. The residuals show
no obvious pattern around the regression line going through the origin.
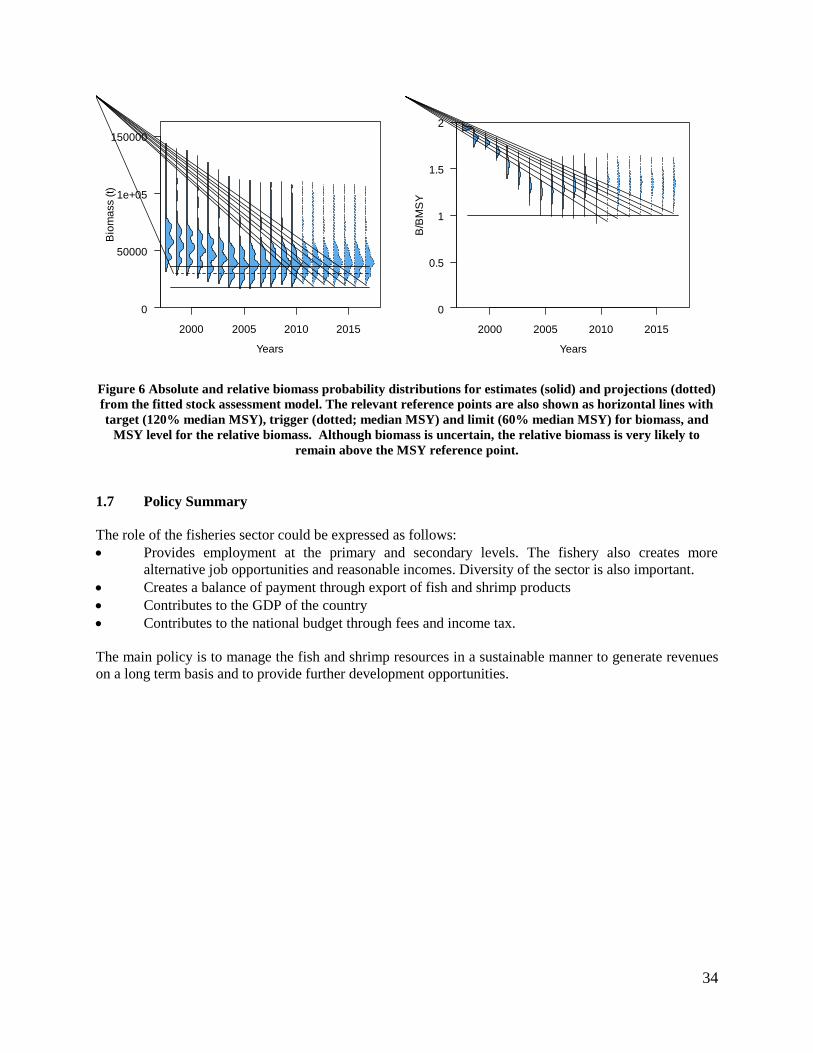
34
2000 2005 2010 2015
0
50000
1e+05
150000
Years
Bio
ma
ss (
t)
2000 2005 2010 2015
0
0.5
1
1.5
2
Years
B/B
MS
Y
Figure 6 Absolute and relative biomass probability distributions for estimates (solid) and projections (dotted)
from the fitted stock assessment model. The relevant reference points are also shown as horizontal lines with
target (120% median MSY), trigger (dotted; median MSY) and limit (60% median MSY) for biomass, and
MSY level for the relative biomass. Although biomass is uncertain, the relative biomass is very likely to
remain above the MSY reference point.
1.7 Policy Summary
The role of the fisheries sector could be expressed as follows:
Provides employment at the primary and secondary levels. The fishery also creates more
alternative job opportunities and reasonable incomes. Diversity of the sector is also important.
Creates a balance of payment through export of fish and shrimp products
Contributes to the GDP of the country
Contributes to the national budget through fees and income tax.
The main policy is to manage the fish and shrimp resources in a sustainable manner to generate revenues
on a long term basis and to provide further development opportunities.
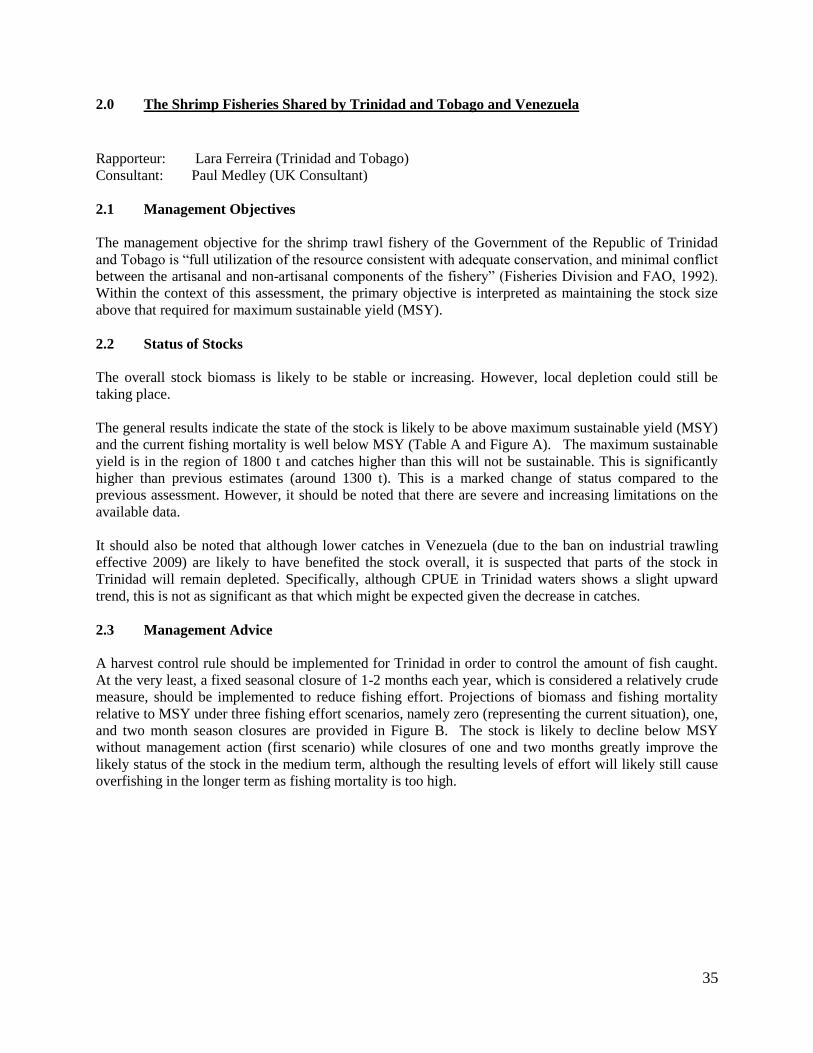
35
2.0 The Shrimp Fisheries Shared by Trinidad and Tobago and Venezuela
Rapporteur: Lara Ferreira (Trinidad and Tobago)
Consultant: Paul Medley (UK Consultant)
2.1 Management Objectives
The management objective for the shrimp trawl fishery of the Government of the Republic of Trinidad
and Tobago is “full utilization of the resource consistent with adequate conservation, and minimal conflict
between the artisanal and non-artisanal components of the fishery” (Fisheries Division and FAO, 1992).
Within the context of this assessment, the primary objective is interpreted as maintaining the stock size
above that required for maximum sustainable yield (MSY).
2.2 Status of Stocks
The overall stock biomass is likely to be stable or increasing. However, local depletion could still be
taking place.
The general results indicate the state of the stock is likely to be above maximum sustainable yield (MSY)
and the current fishing mortality is well below MSY (Table A and Figure A). The maximum sustainable
yield is in the region of 1800 t and catches higher than this will not be sustainable. This is significantly
higher than previous estimates (around 1300 t). This is a marked change of status compared to the
previous assessment. However, it should be noted that there are severe and increasing limitations on the
available data.
It should also be noted that although lower catches in Venezuela (due to the ban on industrial trawling
effective 2009) are likely to have benefited the stock overall, it is suspected that parts of the stock in
Trinidad will remain depleted. Specifically, although CPUE in Trinidad waters shows a slight upward
trend, this is not as significant as that which might be expected given the decrease in catches.
2.3 Management Advice
A harvest control rule should be implemented for Trinidad in order to control the amount of fish caught.
At the very least, a fixed seasonal closure of 1-2 months each year, which is considered a relatively crude
measure, should be implemented to reduce fishing effort. Projections of biomass and fishing mortality
relative to MSY under three fishing effort scenarios, namely zero (representing the current situation), one,
and two month season closures are provided in Figure B. The stock is likely to decline below MSY
without management action (first scenario) while closures of one and two months greatly improve the
likely status of the stock in the medium term, although the resulting levels of effort will likely still cause
overfishing in the longer term as fishing mortality is too high.
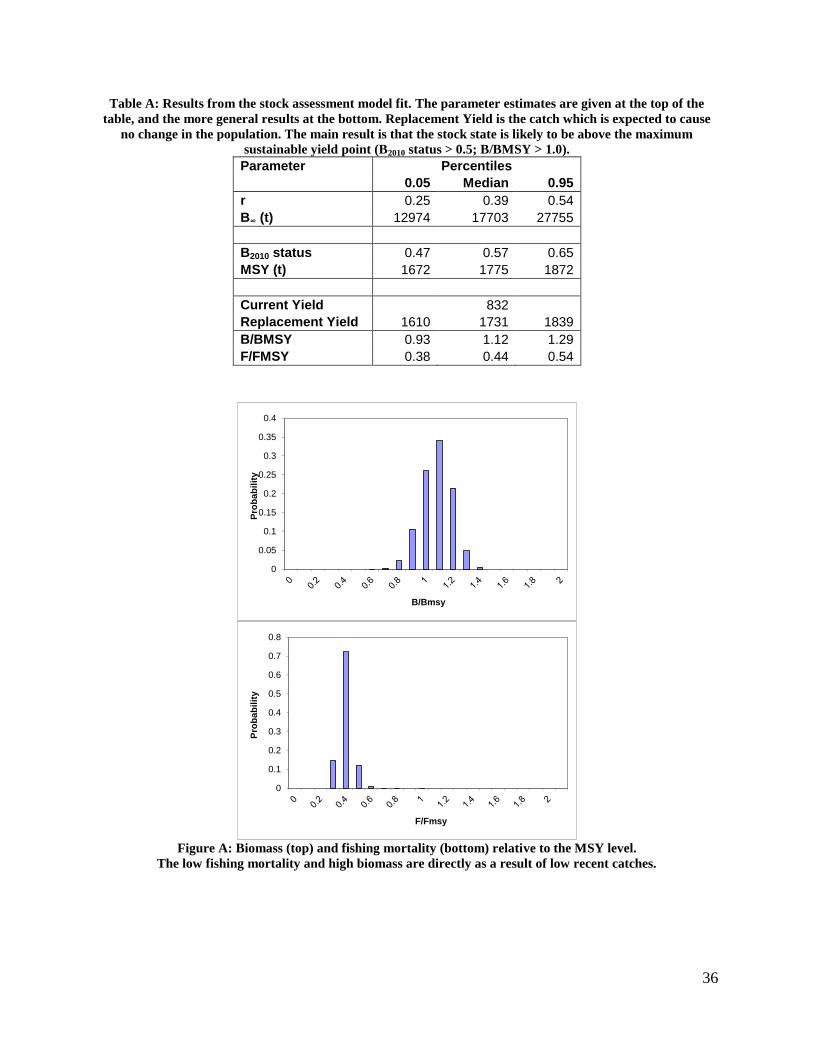
36
Table A: Results from the stock assessment model fit. The parameter estimates are given at the top of the
table, and the more general results at the bottom. Replacement Yield is the catch which is expected to cause
no change in the population. The main result is that the stock state is likely to be above the maximum
sustainable yield point (B2010 status > 0.5; B/BMSY > 1.0).
Parameter Percentiles
0.05 Median 0.95
r 0.25 0.39 0.54
B∞ (t) 12974 17703 27755
B2010 status 0.47 0.57 0.65
MSY (t) 1672 1775 1872
Current Yield 832
Replacement Yield 1610 1731 1839
B/BMSY 0.93 1.12 1.29
F/FMSY 0.38 0.44 0.54
0
0.05
0.1
0.15
0.2
0.25
0.3
0.35
0.4
Pro
bab
ilit
y
B/Bmsy
0
0.1
0.2
0.3
0.4
0.5
0.6
0.7
0.8
Pro
bab
ilit
y
F/Fmsy
Figure A: Biomass (top) and fishing mortality (bottom) relative to the MSY level.
The low fishing mortality and high biomass are directly as a result of low recent catches.
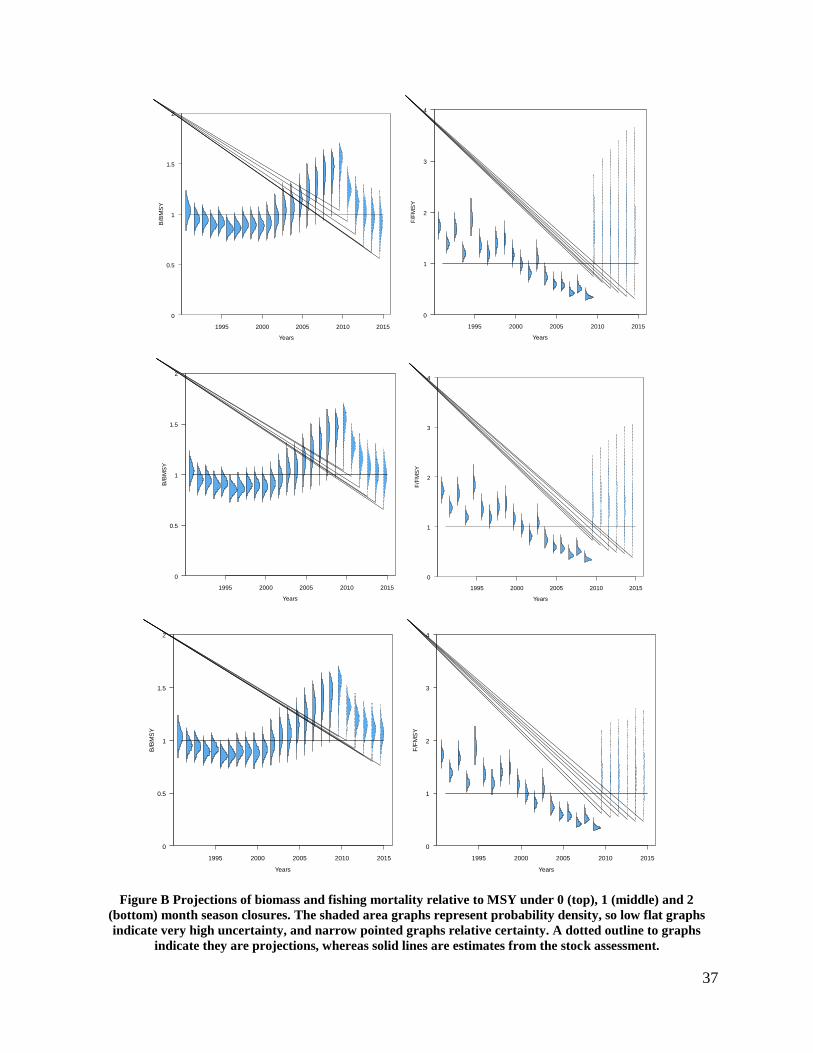
37
1995 2000 2005 2010 2015
0
0.5
1
1.5
2
Years
B/B
MS
Y
1995 2000 2005 2010 2015
0
1
2
3
4
Years
F/F
MS
Y
1995 2000 2005 2010 2015
0
0.5
1
1.5
2
Years
B/B
MS
Y
1995 2000 2005 2010 2015
0
1
2
3
4
Years
F/F
MS
Y
1995 2000 2005 2010 2015
0
0.5
1
1.5
2
Years
B/B
MS
Y
1995 2000 2005 2010 2015
0
1
2
3
4
Years
F/F
MS
Y
Figure B Projections of biomass and fishing mortality relative to MSY under 0 (top), 1 (middle) and 2
(bottom) month season closures. The shaded area graphs represent probability density, so low flat graphs
indicate very high uncertainty, and narrow pointed graphs relative certainty. A dotted outline to graphs
indicate they are projections, whereas solid lines are estimates from the stock assessment.
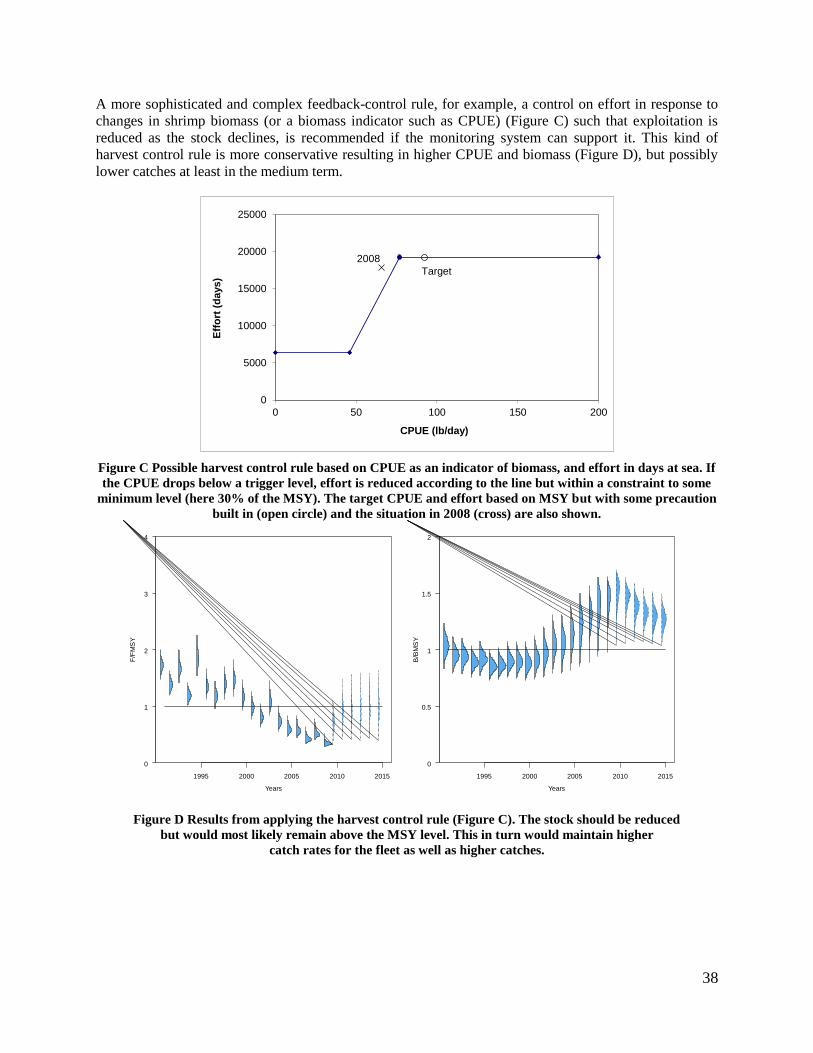
38
A more sophisticated and complex feedback-control rule, for example, a control on effort in response to
changes in shrimp biomass (or a biomass indicator such as CPUE) (Figure C) such that exploitation is
reduced as the stock declines, is recommended if the monitoring system can support it. This kind of
harvest control rule is more conservative resulting in higher CPUE and biomass (Figure D), but possibly
lower catches at least in the medium term.
0
5000
10000
15000
20000
25000
0 50 100 150 200
Eff
ort
(d
ays
)
CPUE (lb/day)
2008
Target
Figure C Possible harvest control rule based on CPUE as an indicator of biomass, and effort in days at sea. If
the CPUE drops below a trigger level, effort is reduced according to the line but within a constraint to some
minimum level (here 30% of the MSY). The target CPUE and effort based on MSY but with some precaution
built in (open circle) and the situation in 2008 (cross) are also shown.
1995 2000 2005 2010 2015
0
1
2
3
4
Years
F/F
MS
Y
1995 2000 2005 2010 2015
0
0.5
1
1.5
2
Years
B/B
MS
Y
Figure D Results from applying the harvest control rule (Figure C). The stock should be reduced
but would most likely remain above the MSY level. This in turn would maintain higher
catch rates for the fleet as well as higher catches.
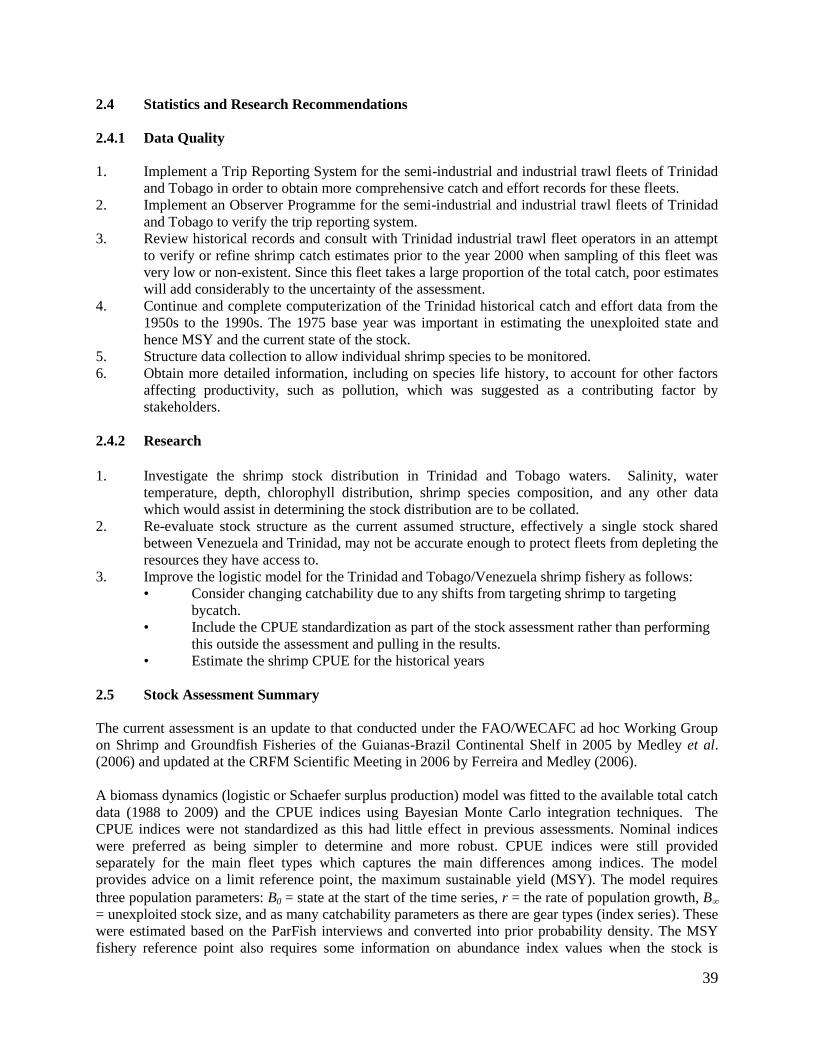
39
2.4 Statistics and Research Recommendations
2.4.1 Data Quality
1. Implement a Trip Reporting System for the semi-industrial and industrial trawl fleets of Trinidad
and Tobago in order to obtain more comprehensive catch and effort records for these fleets.
2. Implement an Observer Programme for the semi-industrial and industrial trawl fleets of Trinidad
and Tobago to verify the trip reporting system.
3. Review historical records and consult with Trinidad industrial trawl fleet operators in an attempt
to verify or refine shrimp catch estimates prior to the year 2000 when sampling of this fleet was
very low or non-existent. Since this fleet takes a large proportion of the total catch, poor estimates
will add considerably to the uncertainty of the assessment.
4. Continue and complete computerization of the Trinidad historical catch and effort data from the
1950s to the 1990s. The 1975 base year was important in estimating the unexploited state and
hence MSY and the current state of the stock.
5. Structure data collection to allow individual shrimp species to be monitored.
6. Obtain more detailed information, including on species life history, to account for other factors
affecting productivity, such as pollution, which was suggested as a contributing factor by
stakeholders.
2.4.2 Research
1. Investigate the shrimp stock distribution in Trinidad and Tobago waters. Salinity, water
temperature, depth, chlorophyll distribution, shrimp species composition, and any other data
which would assist in determining the stock distribution are to be collated.
2. Re-evaluate stock structure as the current assumed structure, effectively a single stock shared
between Venezuela and Trinidad, may not be accurate enough to protect fleets from depleting the
resources they have access to.
3. Improve the logistic model for the Trinidad and Tobago/Venezuela shrimp fishery as follows:
• Consider changing catchability due to any shifts from targeting shrimp to targeting
bycatch.
• Include the CPUE standardization as part of the stock assessment rather than performing
this outside the assessment and pulling in the results.
• Estimate the shrimp CPUE for the historical years
2.5 Stock Assessment Summary
The current assessment is an update to that conducted under the FAO/WECAFC ad hoc Working Group
on Shrimp and Groundfish Fisheries of the Guianas-Brazil Continental Shelf in 2005 by Medley et al.
(2006) and updated at the CRFM Scientific Meeting in 2006 by Ferreira and Medley (2006).
A biomass dynamics (logistic or Schaefer surplus production) model was fitted to the available total catch
data (1988 to 2009) and the CPUE indices using Bayesian Monte Carlo integration techniques. The
CPUE indices were not standardized as this had little effect in previous assessments. Nominal indices
were preferred as being simpler to determine and more robust. CPUE indices were still provided
separately for the main fleet types which captures the main differences among indices. The model
provides advice on a limit reference point, the maximum sustainable yield (MSY). The model requires
three population parameters: B0 = state at the start of the time series, r = the rate of population growth, B
= unexploited stock size, and as many catchability parameters as there are gear types (index series). These
were estimated based on the ParFish interviews and converted into prior probability density. The MSY
fishery reference point also requires some information on abundance index values when the stock is
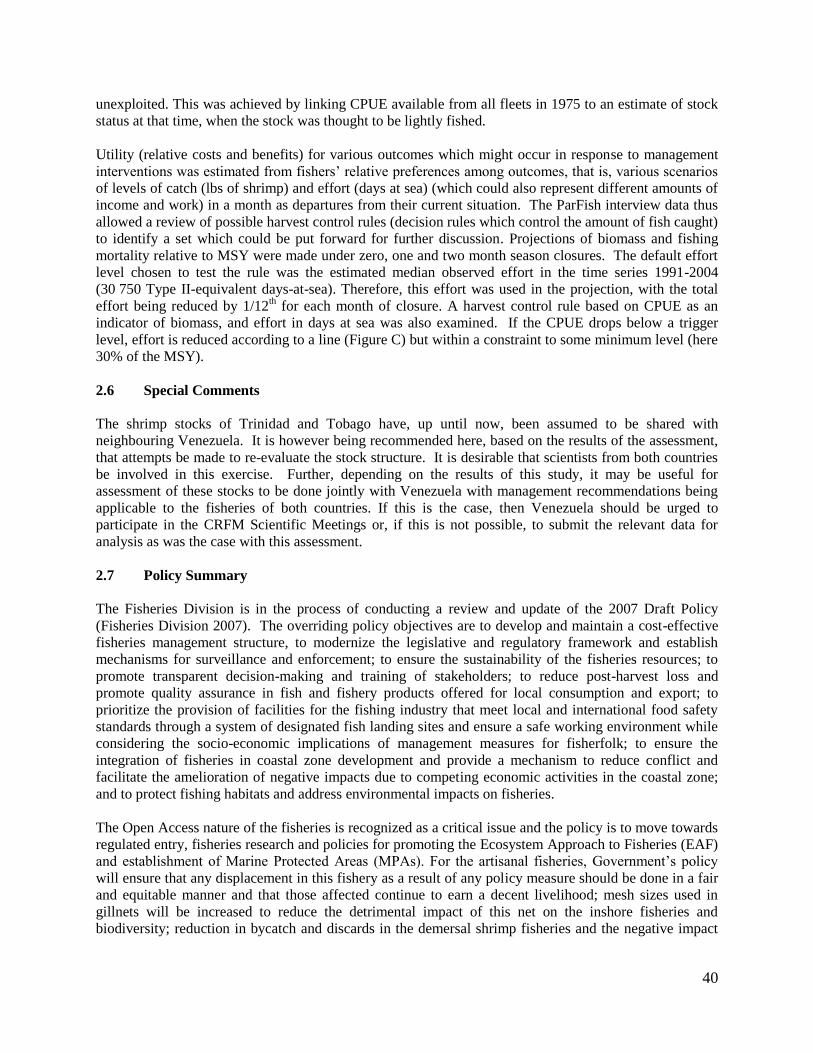
40
unexploited. This was achieved by linking CPUE available from all fleets in 1975 to an estimate of stock
status at that time, when the stock was thought to be lightly fished.
Utility (relative costs and benefits) for various outcomes which might occur in response to management
interventions was estimated from fishers’ relative preferences among outcomes, that is, various scenarios
of levels of catch (lbs of shrimp) and effort (days at sea) (which could also represent different amounts of
income and work) in a month as departures from their current situation. The ParFish interview data thus
allowed a review of possible harvest control rules (decision rules which control the amount of fish caught)
to identify a set which could be put forward for further discussion. Projections of biomass and fishing
mortality relative to MSY were made under zero, one and two month season closures. The default effort
level chosen to test the rule was the estimated median observed effort in the time series 1991-2004
(30 750 Type II-equivalent days-at-sea). Therefore, this effort was used in the projection, with the total
effort being reduced by 1/12th for each month of closure. A harvest control rule based on CPUE as an
indicator of biomass, and effort in days at sea was also examined. If the CPUE drops below a trigger
level, effort is reduced according to a line (Figure C) but within a constraint to some minimum level (here
30% of the MSY).
2.6 Special Comments
The shrimp stocks of Trinidad and Tobago have, up until now, been assumed to be shared with
neighbouring Venezuela. It is however being recommended here, based on the results of the assessment,
that attempts be made to re-evaluate the stock structure. It is desirable that scientists from both countries
be involved in this exercise. Further, depending on the results of this study, it may be useful for
assessment of these stocks to be done jointly with Venezuela with management recommendations being
applicable to the fisheries of both countries. If this is the case, then Venezuela should be urged to
participate in the CRFM Scientific Meetings or, if this is not possible, to submit the relevant data for
analysis as was the case with this assessment.
2.7 Policy Summary
The Fisheries Division is in the process of conducting a review and update of the 2007 Draft Policy
(Fisheries Division 2007). The overriding policy objectives are to develop and maintain a cost-effective
fisheries management structure, to modernize the legislative and regulatory framework and establish
mechanisms for surveillance and enforcement; to ensure the sustainability of the fisheries resources; to
promote transparent decision-making and training of stakeholders; to reduce post-harvest loss and
promote quality assurance in fish and fishery products offered for local consumption and export; to
prioritize the provision of facilities for the fishing industry that meet local and international food safety
standards through a system of designated fish landing sites and ensure a safe working environment while
considering the socio-economic implications of management measures for fisherfolk; to ensure the
integration of fisheries in coastal zone development and provide a mechanism to reduce conflict and
facilitate the amelioration of negative impacts due to competing economic activities in the coastal zone;
and to protect fishing habitats and address environmental impacts on fisheries.
The Open Access nature of the fisheries is recognized as a critical issue and the policy is to move towards
regulated entry, fisheries research and policies for promoting the Ecosystem Approach to Fisheries (EAF)
and establishment of Marine Protected Areas (MPAs). For the artisanal fisheries, Government’s policy
will ensure that any displacement in this fishery as a result of any policy measure should be done in a fair
and equitable manner and that those affected continue to earn a decent livelihood; mesh sizes used in
gillnets will be increased to reduce the detrimental impact of this net on the inshore fisheries and
biodiversity; reduction in bycatch and discards in the demersal shrimp fisheries and the negative impact
41
of trawl gear on the ecosystem will be pursued by the introduction of environmentally friendly gear and
enforcement of appropriate management measures.
The Policy promotes collaboration with regional and international organizations for management of
transboundary stocks and the establishment of the necessary enforcement mechanisms.
2.8 References
Fisheries Division. (2007). A DRAFT POLICY for the Fisheries Sector of Trinidad and Tobago.
Ministry of Agriculture, Land and Marine Resources; Port of Spain (Trinidad and Tobago). 57 p.
Fisheries Division; Food and Agriculture Organisation of the United Nations (FAO). 1992. Draft
management plan for the shrimp trawl fishery of Trinidad and Tobago. Management report of the
project for the Establishment of Data Collection Systems and Assessment of the Fisheries Resources.
FAO/UNDP: TRI/91/001/TR26. Ministry of Agriculture, Land and Marine Resources; Port of Spain
(Trinidad and Tobago). 20 p.
Medley, P., J. Alió, L. Ferreira and L. Marcano. (2006). Assessment of shrimp stocks shared by Trinidad
and Tobago and Venezuela. FAO/Western Central Atlantic Fishery Commission. Report of
Workshop on the Assessment of Shrimp and Groundfish Fisheries on the Brazil-Guianas Shelf . Port
of Spain, Trinidad and Tobago, 11-22 April, 2005. Rome: FAO. (In press).
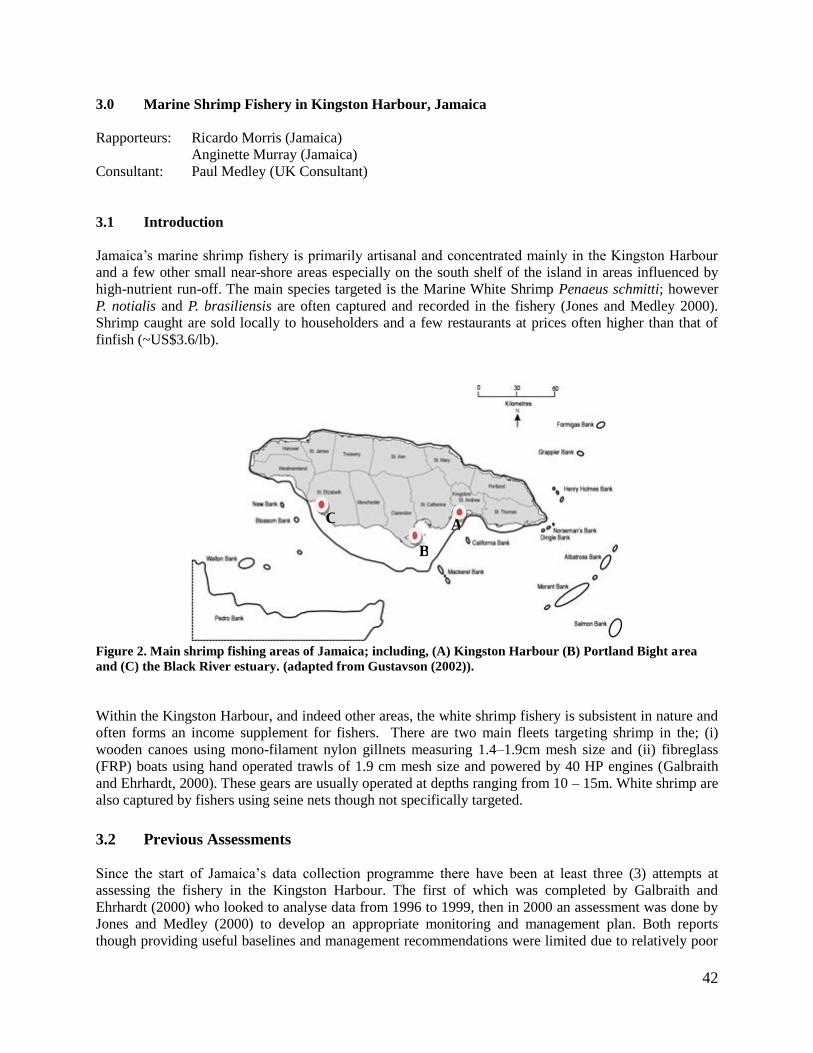
42
3.0 Marine Shrimp Fishery in Kingston Harbour, Jamaica
Rapporteurs: Ricardo Morris (Jamaica)
Anginette Murray (Jamaica)
Consultant: Paul Medley (UK Consultant)
3.1 Introduction
Jamaica’s marine shrimp fishery is primarily artisanal and concentrated mainly in the Kingston Harbour
and a few other small near-shore areas especially on the south shelf of the island in areas influenced by
high-nutrient run-off. The main species targeted is the Marine White Shrimp Penaeus schmitti; however
P. notialis and P. brasiliensis are often captured and recorded in the fishery (Jones and Medley 2000).
Shrimp caught are sold locally to householders and a few restaurants at prices often higher than that of
finfish (~US$3.6/lb).
Figure 2. Main shrimp fishing areas of Jamaica; including, (A) Kingston Harbour (B) Portland Bight area
and (C) the Black River estuary. (adapted from Gustavson (2002)).
Within the Kingston Harbour, and indeed other areas, the white shrimp fishery is subsistent in nature and
often forms an income supplement for fishers. There are two main fleets targeting shrimp in the; (i)
wooden canoes using mono-filament nylon gillnets measuring 1.4–1.9cm mesh size and (ii) fibreglass
(FRP) boats using hand operated trawls of 1.9 cm mesh size and powered by 40 HP engines (Galbraith
and Ehrhardt, 2000). These gears are usually operated at depths ranging from 10 – 15m. White shrimp are
also captured by fishers using seine nets though not specifically targeted.
3.2 Previous Assessments
Since the start of Jamaica’s data collection programme there have been at least three (3) attempts at
assessing the fishery in the Kingston Harbour. The first of which was completed by Galbraith and
Ehrhardt (2000) who looked to analyse data from 1996 to 1999, then in 2000 an assessment was done by
Jones and Medley (2000) to develop an appropriate monitoring and management plan. Both reports
though providing useful baselines and management recommendations were limited due to relatively poor
A
B
C
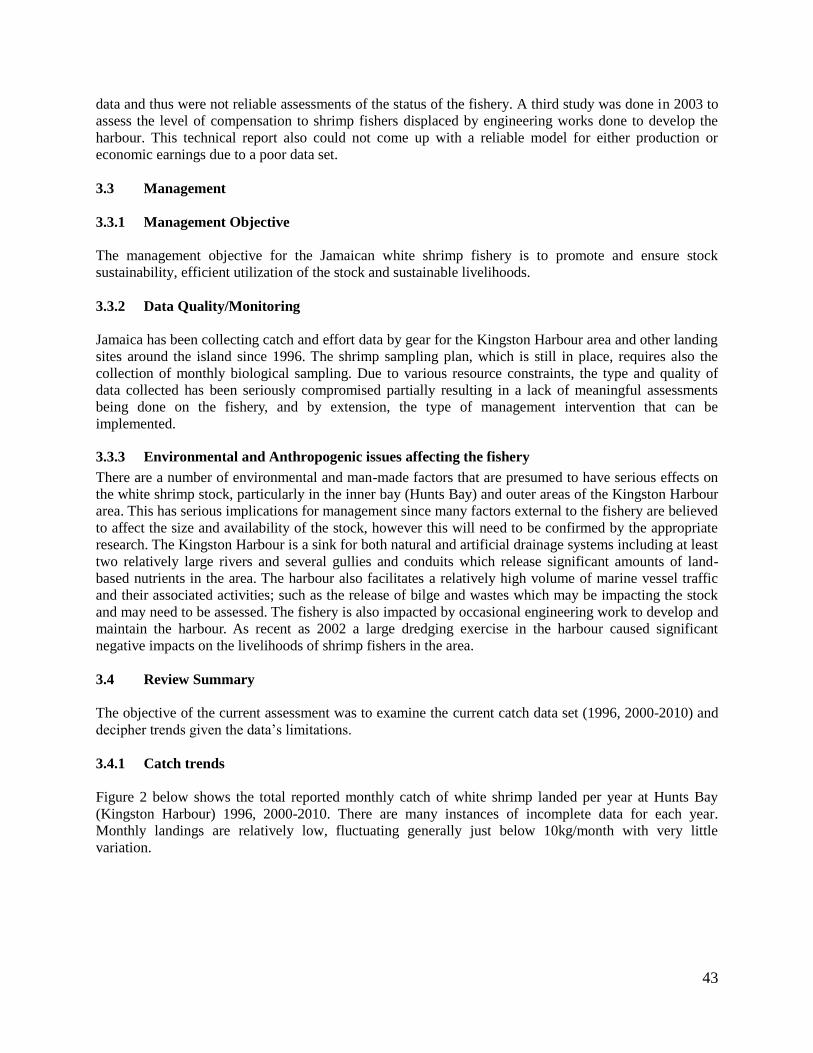
43
data and thus were not reliable assessments of the status of the fishery. A third study was done in 2003 to
assess the level of compensation to shrimp fishers displaced by engineering works done to develop the
harbour. This technical report also could not come up with a reliable model for either production or
economic earnings due to a poor data set.
3.3 Management
3.3.1 Management Objective
The management objective for the Jamaican white shrimp fishery is to promote and ensure stock
sustainability, efficient utilization of the stock and sustainable livelihoods.
3.3.2 Data Quality/Monitoring
Jamaica has been collecting catch and effort data by gear for the Kingston Harbour area and other landing
sites around the island since 1996. The shrimp sampling plan, which is still in place, requires also the
collection of monthly biological sampling. Due to various resource constraints, the type and quality of
data collected has been seriously compromised partially resulting in a lack of meaningful assessments
being done on the fishery, and by extension, the type of management intervention that can be
implemented.
3.3.3 Environmental and Anthropogenic issues affecting the fishery
There are a number of environmental and man-made factors that are presumed to have serious effects on
the white shrimp stock, particularly in the inner bay (Hunts Bay) and outer areas of the Kingston Harbour
area. This has serious implications for management since many factors external to the fishery are believed
to affect the size and availability of the stock, however this will need to be confirmed by the appropriate
research. The Kingston Harbour is a sink for both natural and artificial drainage systems including at least
two relatively large rivers and several gullies and conduits which release significant amounts of land-
based nutrients in the area. The harbour also facilitates a relatively high volume of marine vessel traffic
and their associated activities; such as the release of bilge and wastes which may be impacting the stock
and may need to be assessed. The fishery is also impacted by occasional engineering work to develop and
maintain the harbour. As recent as 2002 a large dredging exercise in the harbour caused significant
negative impacts on the livelihoods of shrimp fishers in the area.
3.4 Review Summary
The objective of the current assessment was to examine the current catch data set (1996, 2000-2010) and
decipher trends given the data’s limitations.
3.4.1 Catch trends
Figure 2 below shows the total reported monthly catch of white shrimp landed per year at Hunts Bay
(Kingston Harbour) 1996, 2000-2010. There are many instances of incomplete data for each year.
Monthly landings are relatively low, fluctuating generally just below 10kg/month with very little
variation.
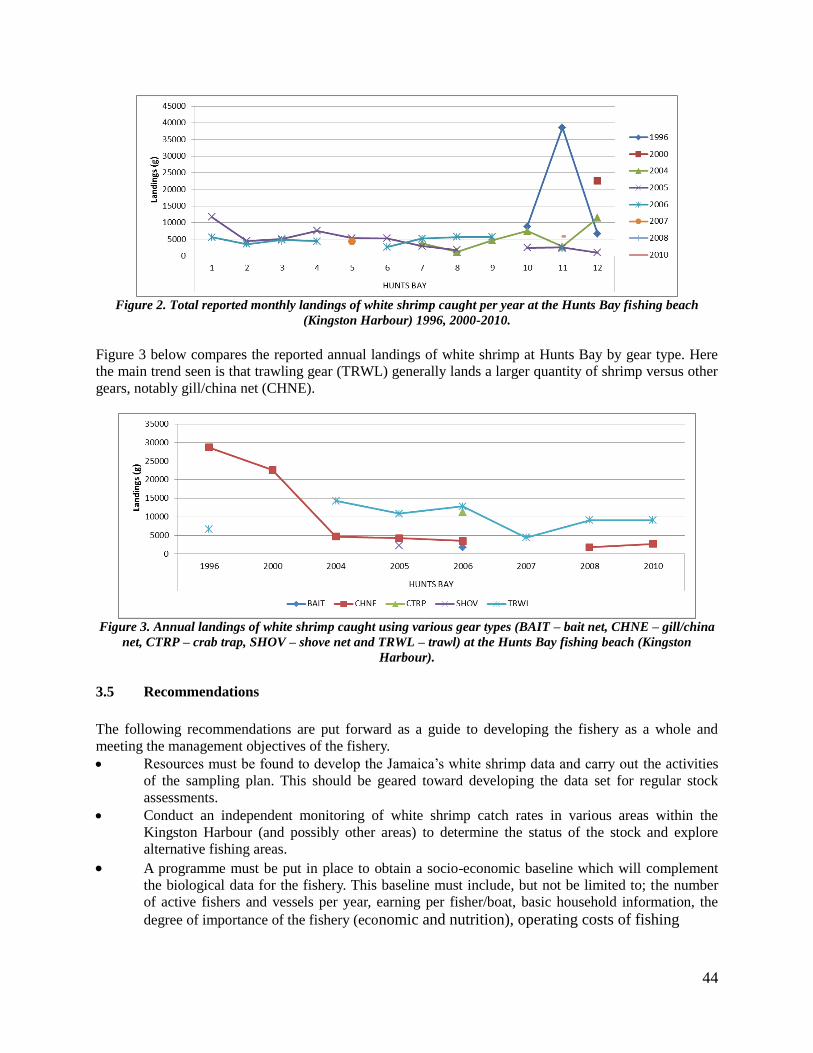
44
Figure 2. Total reported monthly landings of white shrimp caught per year at the Hunts Bay fishing beach
(Kingston Harbour) 1996, 2000-2010.
Figure 3 below compares the reported annual landings of white shrimp at Hunts Bay by gear type. Here
the main trend seen is that trawling gear (TRWL) generally lands a larger quantity of shrimp versus other
gears, notably gill/china net (CHNE).
Figure 3. Annual landings of white shrimp caught using various gear types (BAIT – bait net, CHNE – gill/china
net, CTRP – crab trap, SHOV – shove net and TRWL – trawl) at the Hunts Bay fishing beach (Kingston
Harbour).
3.5 Recommendations
The following recommendations are put forward as a guide to developing the fishery as a whole and
meeting the management objectives of the fishery.
Resources must be found to develop the Jamaica’s white shrimp data and carry out the activities
of the sampling plan. This should be geared toward developing the data set for regular stock
assessments.
Conduct an independent monitoring of white shrimp catch rates in various areas within the
Kingston Harbour (and possibly other areas) to determine the status of the stock and explore
alternative fishing areas.
A programme must be put in place to obtain a socio-economic baseline which will complement
the biological data for the fishery. This baseline must include, but not be limited to; the number
of active fishers and vessels per year, earning per fisher/boat, basic household information, the
degree of importance of the fishery (economic and nutrition), operating costs of fishing
45
Include relevant areas of the above recommendations in a management plan for the fishery and
also legislative regulations.
3.6 References
Galbraith, A. and N.M. Ehrhardt, 2000. Preliminary assessment of the Jamaican penaeid shrimp fisheries
of Kingston Harbour. FAO Fish. Rep. 628: 149-153.
Gustavson, K. 2002. Economic production from the artisanal fisheries of Jamaica, Fish. Res. 57 (2002),
pp. 103–115.
Jones, I. and P.A. Medley 2000. Jamaica shrimp fishery assessment. Paper presented at the Fourth
Workshop on the Assessment and Management of the Shrimp and Groundfish Fisheries on the Brazil-
Guianas Shelf. 2-13 October 2000, Cumaná, Venezuela.
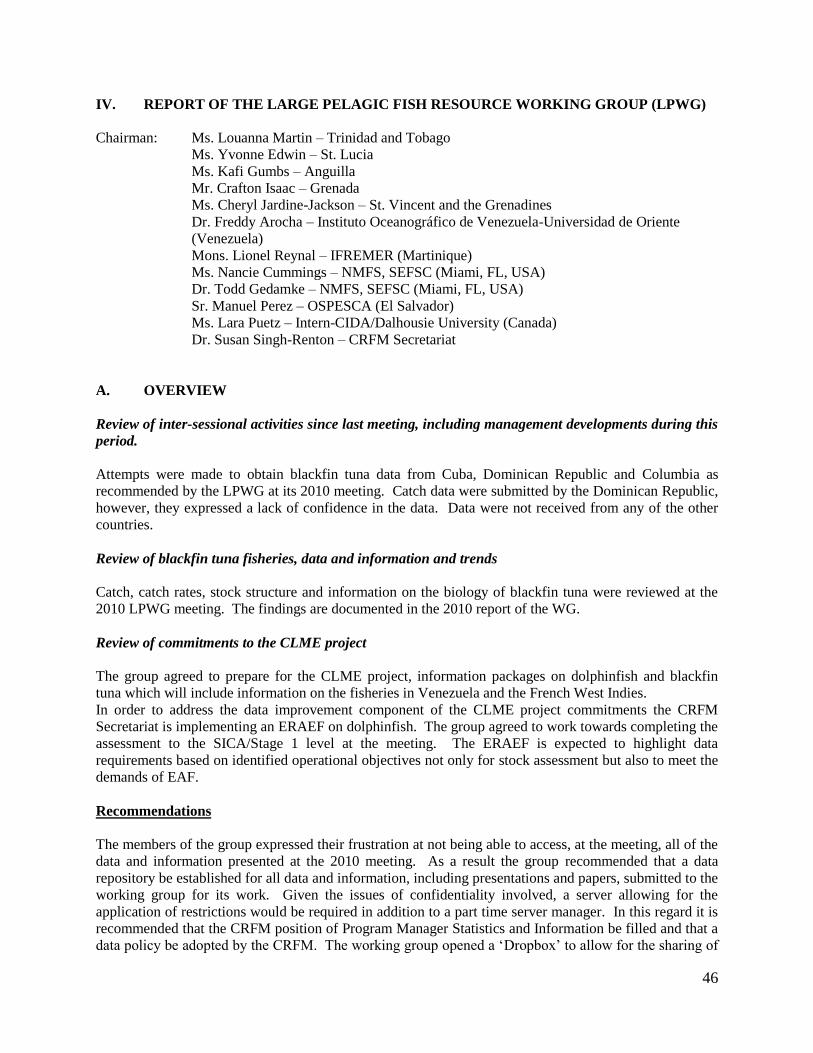
46
IV. REPORT OF THE LARGE PELAGIC FISH RESOURCE WORKING GROUP (LPWG)
Chairman: Ms. Louanna Martin – Trinidad and Tobago
Ms. Yvonne Edwin – St. Lucia
Ms. Kafi Gumbs – Anguilla
Mr. Crafton Isaac – Grenada
Ms. Cheryl Jardine-Jackson – St. Vincent and the Grenadines
Dr. Freddy Arocha – Instituto Oceanográfico de Venezuela-Universidad de Oriente
(Venezuela)
Mons. Lionel Reynal – IFREMER (Martinique)
Ms. Nancie Cummings – NMFS, SEFSC (Miami, FL, USA)
Dr. Todd Gedamke – NMFS, SEFSC (Miami, FL, USA)
Sr. Manuel Perez – OSPESCA (El Salvador)
Ms. Lara Puetz – Intern-CIDA/Dalhousie University (Canada)
Dr. Susan Singh-Renton – CRFM Secretariat
A. OVERVIEW
Review of inter-sessional activities since last meeting, including management developments during this
period.
Attempts were made to obtain blackfin tuna data from Cuba, Dominican Republic and Columbia as
recommended by the LPWG at its 2010 meeting. Catch data were submitted by the Dominican Republic,
however, they expressed a lack of confidence in the data. Data were not received from any of the other
countries.
Review of blackfin tuna fisheries, data and information and trends
Catch, catch rates, stock structure and information on the biology of blackfin tuna were reviewed at the
2010 LPWG meeting. The findings are documented in the 2010 report of the WG.
Review of commitments to the CLME project
The group agreed to prepare for the CLME project, information packages on dolphinfish and blackfin
tuna which will include information on the fisheries in Venezuela and the French West Indies.
In order to address the data improvement component of the CLME project commitments the CRFM
Secretariat is implementing an ERAEF on dolphinfish. The group agreed to work towards completing the
assessment to the SICA/Stage 1 level at the meeting. The ERAEF is expected to highlight data
requirements based on identified operational objectives not only for stock assessment but also to meet the
demands of EAF.
Recommendations
The members of the group expressed their frustration at not being able to access, at the meeting, all of the
data and information presented at the 2010 meeting. As a result the group recommended that a data
repository be established for all data and information, including presentations and papers, submitted to the
working group for its work. Given the issues of confidentiality involved, a server allowing for the
application of restrictions would be required in addition to a part time server manager. In this regard it is
recommended that the CRFM position of Program Manager Statistics and Information be filled and that a
data policy be adopted by the CRFM. The working group opened a ‘Dropbox’ to allow for the sharing of
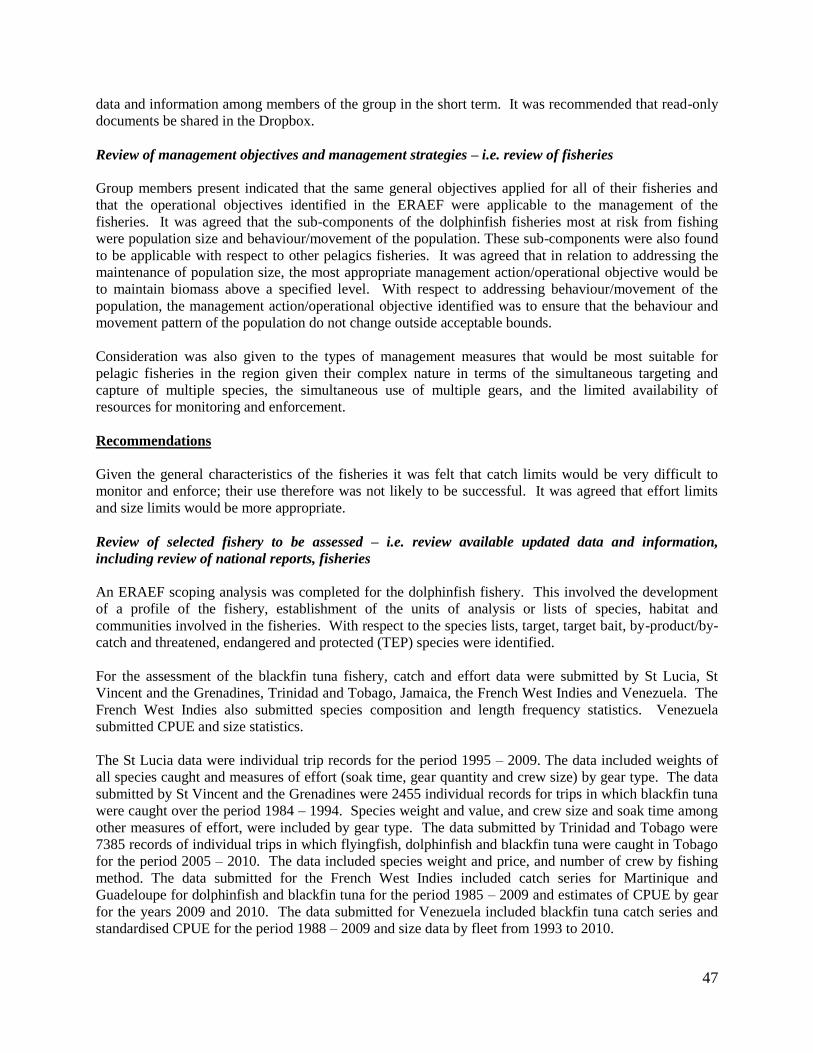
47
data and information among members of the group in the short term. It was recommended that read-only
documents be shared in the Dropbox.
Review of management objectives and management strategies – i.e. review of fisheries
Group members present indicated that the same general objectives applied for all of their fisheries and
that the operational objectives identified in the ERAEF were applicable to the management of the
fisheries. It was agreed that the sub-components of the dolphinfish fisheries most at risk from fishing
were population size and behaviour/movement of the population. These sub-components were also found
to be applicable with respect to other pelagics fisheries. It was agreed that in relation to addressing the
maintenance of population size, the most appropriate management action/operational objective would be
to maintain biomass above a specified level. With respect to addressing behaviour/movement of the
population, the management action/operational objective identified was to ensure that the behaviour and
movement pattern of the population do not change outside acceptable bounds.
Consideration was also given to the types of management measures that would be most suitable for
pelagic fisheries in the region given their complex nature in terms of the simultaneous targeting and
capture of multiple species, the simultaneous use of multiple gears, and the limited availability of
resources for monitoring and enforcement.
Recommendations
Given the general characteristics of the fisheries it was felt that catch limits would be very difficult to
monitor and enforce; their use therefore was not likely to be successful. It was agreed that effort limits
and size limits would be more appropriate.
Review of selected fishery to be assessed – i.e. review available updated data and information,
including review of national reports, fisheries
An ERAEF scoping analysis was completed for the dolphinfish fishery. This involved the development
of a profile of the fishery, establishment of the units of analysis or lists of species, habitat and
communities involved in the fisheries. With respect to the species lists, target, target bait, by-product/by-
catch and threatened, endangered and protected (TEP) species were identified.
For the assessment of the blackfin tuna fishery, catch and effort data were submitted by St Lucia, St
Vincent and the Grenadines, Trinidad and Tobago, Jamaica, the French West Indies and Venezuela. The
French West Indies also submitted species composition and length frequency statistics. Venezuela
submitted CPUE and size statistics.
The St Lucia data were individual trip records for the period 1995 – 2009. The data included weights of
all species caught and measures of effort (soak time, gear quantity and crew size) by gear type. The data
submitted by St Vincent and the Grenadines were 2455 individual records for trips in which blackfin tuna
were caught over the period 1984 – 1994. Species weight and value, and crew size and soak time among
other measures of effort, were included by gear type. The data submitted by Trinidad and Tobago were
7385 records of individual trips in which flyingfish, dolphinfish and blackfin tuna were caught in Tobago
for the period 2005 – 2010. The data included species weight and price, and number of crew by fishing
method. The data submitted for the French West Indies included catch series for Martinique and
Guadeloupe for dolphinfish and blackfin tuna for the period 1985 – 2009 and estimates of CPUE by gear
for the years 2009 and 2010. The data submitted for Venezuela included blackfin tuna catch series and
standardised CPUE for the period 1988 – 2009 and size data by fleet from 1993 to 2010.
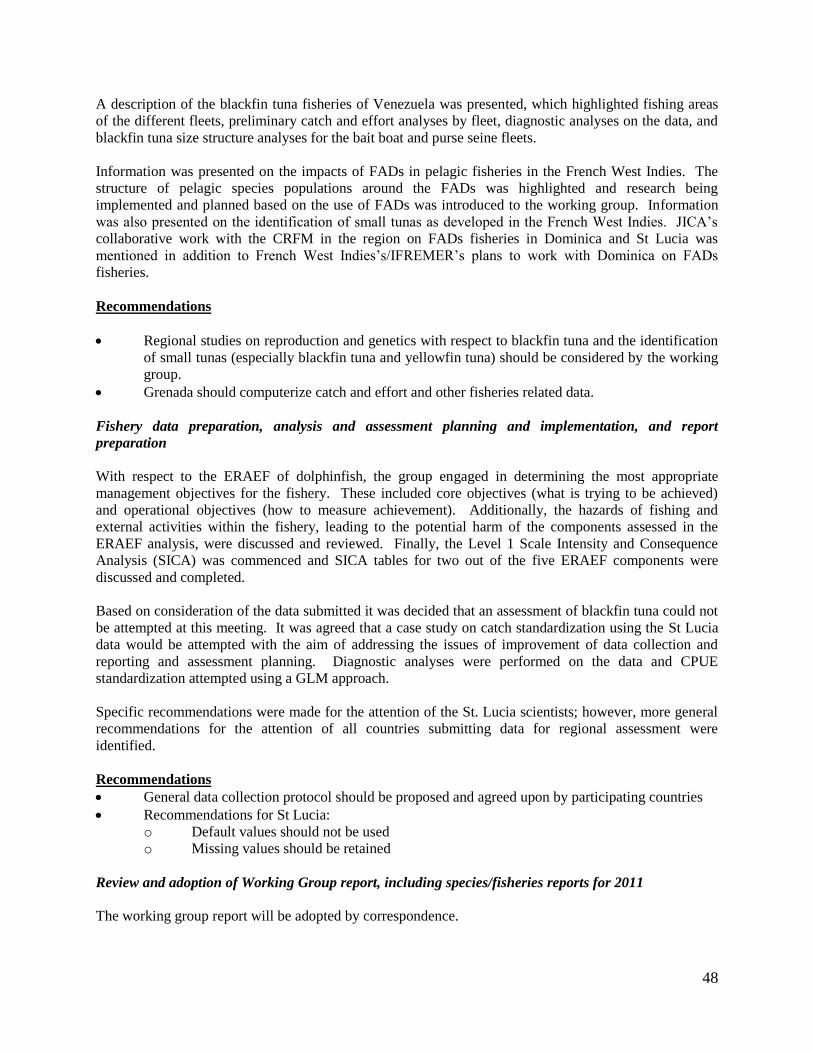
48
A description of the blackfin tuna fisheries of Venezuela was presented, which highlighted fishing areas
of the different fleets, preliminary catch and effort analyses by fleet, diagnostic analyses on the data, and
blackfin tuna size structure analyses for the bait boat and purse seine fleets.
Information was presented on the impacts of FADs in pelagic fisheries in the French West Indies. The
structure of pelagic species populations around the FADs was highlighted and research being
implemented and planned based on the use of FADs was introduced to the working group. Information
was also presented on the identification of small tunas as developed in the French West Indies. JICA’s
collaborative work with the CRFM in the region on FADs fisheries in Dominica and St Lucia was
mentioned in addition to French West Indies’s/IFREMER’s plans to work with Dominica on FADs
fisheries.
Recommendations
Regional studies on reproduction and genetics with respect to blackfin tuna and the identification
of small tunas (especially blackfin tuna and yellowfin tuna) should be considered by the working
group.
Grenada should computerize catch and effort and other fisheries related data.
Fishery data preparation, analysis and assessment planning and implementation, and report
preparation
With respect to the ERAEF of dolphinfish, the group engaged in determining the most appropriate
management objectives for the fishery. These included core objectives (what is trying to be achieved)
and operational objectives (how to measure achievement). Additionally, the hazards of fishing and
external activities within the fishery, leading to the potential harm of the components assessed in the
ERAEF analysis, were discussed and reviewed. Finally, the Level 1 Scale Intensity and Consequence
Analysis (SICA) was commenced and SICA tables for two out of the five ERAEF components were
discussed and completed.
Based on consideration of the data submitted it was decided that an assessment of blackfin tuna could not
be attempted at this meeting. It was agreed that a case study on catch standardization using the St Lucia
data would be attempted with the aim of addressing the issues of improvement of data collection and
reporting and assessment planning. Diagnostic analyses were performed on the data and CPUE
standardization attempted using a GLM approach.
Specific recommendations were made for the attention of the St. Lucia scientists; however, more general
recommendations for the attention of all countries submitting data for regional assessment were
identified.
Recommendations
General data collection protocol should be proposed and agreed upon by participating countries
Recommendations for St Lucia:
o Default values should not be used
o Missing values should be retained
Review and adoption of Working Group report, including species/fisheries reports for 2011
The working group report will be adopted by correspondence.
49
Inter-sessional workplan
ERAEF
o Review of SICA report
o Discussion on appropriate productivity and susceptibility most applicable to the regional
pelagic fisheries
Research on blackfin tuna biology
o Consider proposals identified by IFREMER and Venezuela on genetics, reproduction and
identification of little tunas (MAGDELESA project)
Paper for ICCAT on blackfin tuna case study
Data improvement – Grenada data computerization
Request for US dolphinfish statistics and analyses that were produced by David Die in 2010
Preparation of information packages for CLME
Any other business
No further issues were raised for discussion.
Adjournment
The meeting was adjourned at 4:30 p.m. on Wednesday 22 June 2011.
50
B. FISHERIES REPORTS
1.0 Ecological Risk Assessment for the Effects of Fishing (ERAEF) for the Dolphinfish Fishery
in the Eastern Caribbean
Lara Puetz
1.1 Overview of ERAEF Experimental Approach
An Ecological Risk Assessment for the Effects of Fishing (ERAEF) framework was developed for the
Australian government as a scientific tool to support ecosystem based fisheries management (EBFM).
The hierarchical approach is useful for data-deficient fisheries, such as the dolphinfish fishery in the
eastern Caribbean, as it facilitates a progression from qualitative (needed in data poor situations) to
quantitative analyses with each subsequent level of analysis. It is precautionary because in the absence of
data, high risk is associated with fishing activities. ERAEF’s overall objective is to determine existing
areas of vulnerability for ecosystem components within the fishery and its associated causes, in order to
improve the sustainable use of the resource. Several international groups have developed modified
versions of ERAEF to assess the potential risk of a fishery in data poor scenarios, such as the ICCAT
Ecosystems Working Group, NOAA’s National Marine Fisheries Service and the Marine Stewardship
Council. In a similar fashion, the Caribbean Regional Fisheries Mechanism (CRFM) could benefit from
the use of an EBFM tool such as ERAEF for data poor fisheries, such as the dolphinfish fishery, to
promote collaboration in management strategies where such resources are shared.
1.2 Significance for the Caribbean Large Marine Ecosystem Project
One of the main goals of the Caribbean Large Marine Ecosystem (CLME) project is to work towards the
sustainable management of shared marine resources within the region. These goals can be obtained
through improved regional databases, addressing major issues, causes and actions for the living marine
resources and the implementation of management reforms. ERAEF can be used as a tool to assist in the
CLME project objectives for the large pelagic dolphinfish fishery exploited by many nations within the
western central Atlantic region.
1.3 Objectives and Outputs
The Scoping section of the ERAEF framework was discussed and completed in the LPWG during the
2011 CRFM Scientific Meeting. At this stage of the assessment, a profile of the dolphinfish fishery,
previously compiled into one comprehensive report, and the units of analysis list for all species, habitats
and communities within the fishery were presented to the LPWG for review. The most appropriated
management objectives for the dolphinfish fishery were determined by the group which included core
objectives (what is trying to be achieved) and operational objectives (how to measure achievement).
Finally, the hazards of fishing and external activities within the fishery, leading to the potential harm of
the components assessed in the ERAEF analysis, were discussed and reviewed. Completed outputs from
the Scoping section will provide a detailed profile of the dolphinfish fishery, including its biological,
ecological and environmental components and will inform progressive levels in the ERAEF analysis.
The Level 1 Scale Intensity and Consequence Analysis (SICA) was commenced and SICA tables for two
out of the five ERAEF components were discussed and completed. Goals of the SICA analysis were to
determine the most vulnerable element for each component and apply a worst case approach when
choosing the most vulnerable sub-component and unit of analysis (species, habitat, communities)
associated with each fishing activity. Operational objectives were selected to indicate potential
management responses to high risk activities within the fishery. Low consequence activities for target and
51
byproduct/bycatch species were screened out by the working group to determine which hazards
associated with the dolphinfish fishery have significant impacts on the two components. The process will
help the CRFM direct the development of management solutions with current available data and where to
focus future research and resources for the regionally shared stock.
2.0 Data issues highlighted in the assessment of blackfin tuna
Todd Gedamke
2.1 Overview of Available Data
The data submitted by St. Vincent and the Grenadines, St. Lucia, and Trinidad/Tobago were evaluated.
For all nations, only records which recorded blackfin tuna were initially submitted. Unfortunately, the
filtering of data to only include trips that had positive records for blackfin does not provide the
information necessary to evaluate changes in catch rates or inferences on changes in population size. To
illustrate this point, consider a fishery where exploitation has significantly reduced population size.
Fishers and vessels targeting blackfin, for example, may have been 100% successful 10 years ago and
now only 10% of the trips are able to catch their target. By evaluating only the successful (ie. positive
trips) the underlying decline in catchability of the species - an indication of declining population size -
may be masked by a few fishers that know how or where to exploit the reduced number of individuals in
the population. Therefore, to develop an index all available information on catch and effort, regardless of
species landed must be available.
The St. Lucia representative was able to provide complete data sets for trips recorded as pelagic trips in
order to facilitate a case study on how the methodology should work. It should be stressed here that the
results of this exercise should not be treated as a true reflection of the stock. A number of questions about
the raw data and how they were collected did not allow a reliable index to be generated. For example, the
measure of effort (gear quantity and/or soak time) was filled with a default value of 3 when it was not
collected. As a result, it is impossible for the analyst to determine when a true ‘3’ was present and when a
default ‘3’ was filled to this data field. Specific to this point the group recommended that default values
not be used by data managers and that missing values should be retained. As part of the discussion, the
importance of metadata for future CRFM meetings was stressed. In order to ease interpretation in the
CRFM forum metadata should comprise at least a few primary components including the definitions of
variables included in the data (e.g. units and species codes), explanation of any manipulations from raw
form (e.g. use of default values), and any other caveats.
2.2 Overall Recommendations
1. A minimum data collection protocol, including a requirement for the recording of metadata,
should be proposed and agreed upon by participating nations. This should comprise data that can
reasonably be expected to be collected. Each nation can then add specifics based on the
individual characteristics of their fisheries. A list should be developed that starts with the coarsest
categories to finest, e.g.:
1) Catch – Goals: Total catch and catch per trip
2) Effort –Goals: Total Effort
The FAO references, http://www.fao.org/docrep/005/X8923E/X8923E00.htm and
http://www.fao.org/docrep/W5449E/w5449e00.htm provide information on minimum data
collection needs, e.g. see Table 1. below.
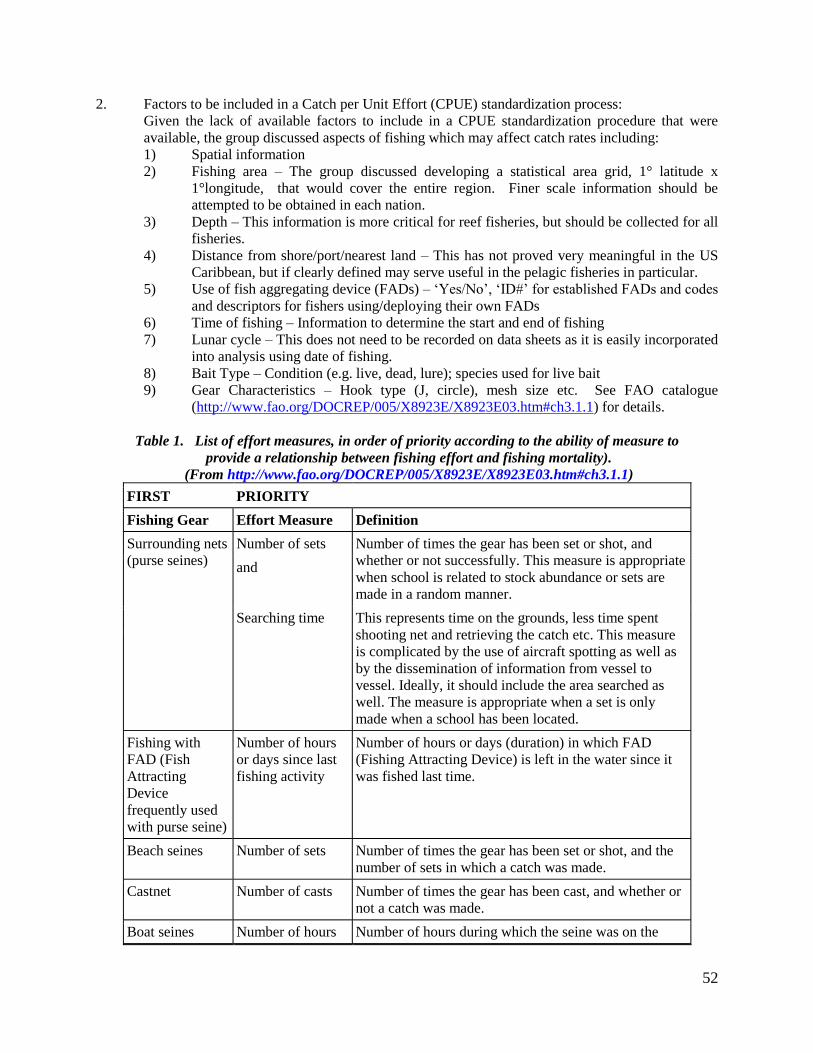
52
2. Factors to be included in a Catch per Unit Effort (CPUE) standardization process:
Given the lack of available factors to include in a CPUE standardization procedure that were
available, the group discussed aspects of fishing which may affect catch rates including:
1) Spatial information
2) Fishing area – The group discussed developing a statistical area grid, 1° latitude x
1°longitude, that would cover the entire region. Finer scale information should be
attempted to be obtained in each nation.
3) Depth – This information is more critical for reef fisheries, but should be collected for all
fisheries.
4) Distance from shore/port/nearest land – This has not proved very meaningful in the US
Caribbean, but if clearly defined may serve useful in the pelagic fisheries in particular.
5) Use of fish aggregating device (FADs) – ‘Yes/No’, ‘ID#’ for established FADs and codes
and descriptors for fishers using/deploying their own FADs
6) Time of fishing – Information to determine the start and end of fishing
7) Lunar cycle – This does not need to be recorded on data sheets as it is easily incorporated
into analysis using date of fishing.
8) Bait Type – Condition (e.g. live, dead, lure); species used for live bait
9) Gear Characteristics – Hook type (J, circle), mesh size etc. See FAO catalogue
(http://www.fao.org/DOCREP/005/X8923E/X8923E03.htm#ch3.1.1) for details.
Table 1. List of effort measures, in order of priority according to the ability of measure to
provide a relationship between fishing effort and fishing mortality).
(From http://www.fao.org/DOCREP/005/X8923E/X8923E03.htm#ch3.1.1)
FIRST PRIORITY
Fishing Gear Effort Measure Definition
Surrounding nets
(purse seines)
Number of sets Number of times the gear has been set or shot, and
whether or not successfully. This measure is appropriate
when school is related to stock abundance or sets are
made in a random manner.
and
Searching time This represents time on the grounds, less time spent
shooting net and retrieving the catch etc. This measure
is complicated by the use of aircraft spotting as well as
by the dissemination of information from vessel to
vessel. Ideally, it should include the area searched as
well. The measure is appropriate when a set is only
made when a school has been located.
Fishing with
FAD (Fish
Attracting
Device
frequently used
with purse seine)
Number of hours
or days since last
fishing activity
Number of hours or days (duration) in which FAD
(Fishing Attracting Device) is left in the water since it
was fished last time.
Beach seines Number of sets Number of times the gear has been set or shot, and the
number of sets in which a catch was made.
Castnet Number of casts Number of times the gear has been cast, and whether or
not a catch was made.
Boat seines Number of hours Number of hours during which the seine was on the
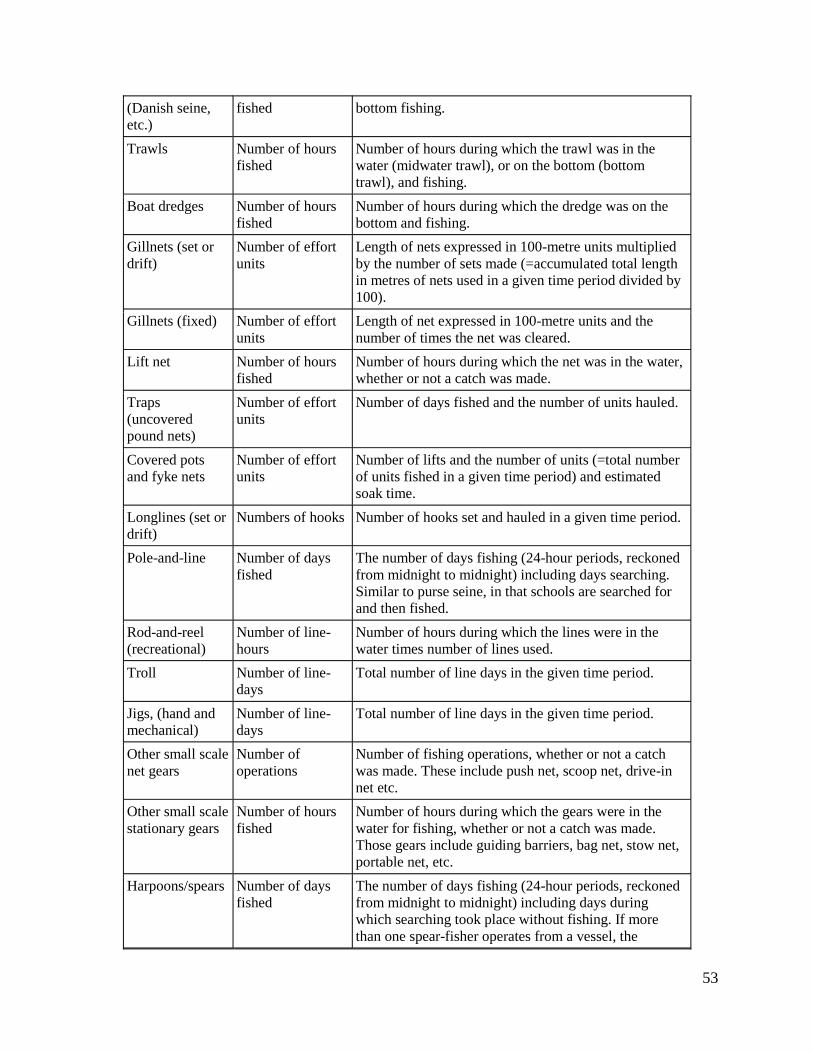
53
(Danish seine,
etc.)
fished bottom fishing.
Trawls Number of hours
fished
Number of hours during which the trawl was in the
water (midwater trawl), or on the bottom (bottom
trawl), and fishing.
Boat dredges Number of hours
fished
Number of hours during which the dredge was on the
bottom and fishing.
Gillnets (set or
drift)
Number of effort
units
Length of nets expressed in 100-metre units multiplied
by the number of sets made (=accumulated total length
in metres of nets used in a given time period divided by
100).
Gillnets (fixed) Number of effort
units
Length of net expressed in 100-metre units and the
number of times the net was cleared.
Lift net Number of hours
fished
Number of hours during which the net was in the water,
whether or not a catch was made.
Traps
(uncovered
pound nets)
Number of effort
units
Number of days fished and the number of units hauled.
Covered pots
and fyke nets
Number of effort
units
Number of lifts and the number of units (=total number
of units fished in a given time period) and estimated
soak time.
Longlines (set or
drift)
Numbers of hooks Number of hooks set and hauled in a given time period.
Pole-and-line Number of days
fished
The number of days fishing (24-hour periods, reckoned
from midnight to midnight) including days searching.
Similar to purse seine, in that schools are searched for
and then fished.
Rod-and-reel
(recreational)
Number of line-
hours
Number of hours during which the lines were in the
water times number of lines used.
Troll Number of line-
days
Total number of line days in the given time period.
Jigs, (hand and
mechanical)
Number of line-
days
Total number of line days in the given time period.
Other small scale
net gears
Number of
operations
Number of fishing operations, whether or not a catch
was made. These include push net, scoop net, drive-in
net etc.
Other small scale
stationary gears
Number of hours
fished
Number of hours during which the gears were in the
water for fishing, whether or not a catch was made.
Those gears include guiding barriers, bag net, stow net,
portable net, etc.
Harpoons/spears Number of days
fished
The number of days fishing (24-hour periods, reckoned
from midnight to midnight) including days during
which searching took place without fishing. If more
than one spear-fisher operates from a vessel, the
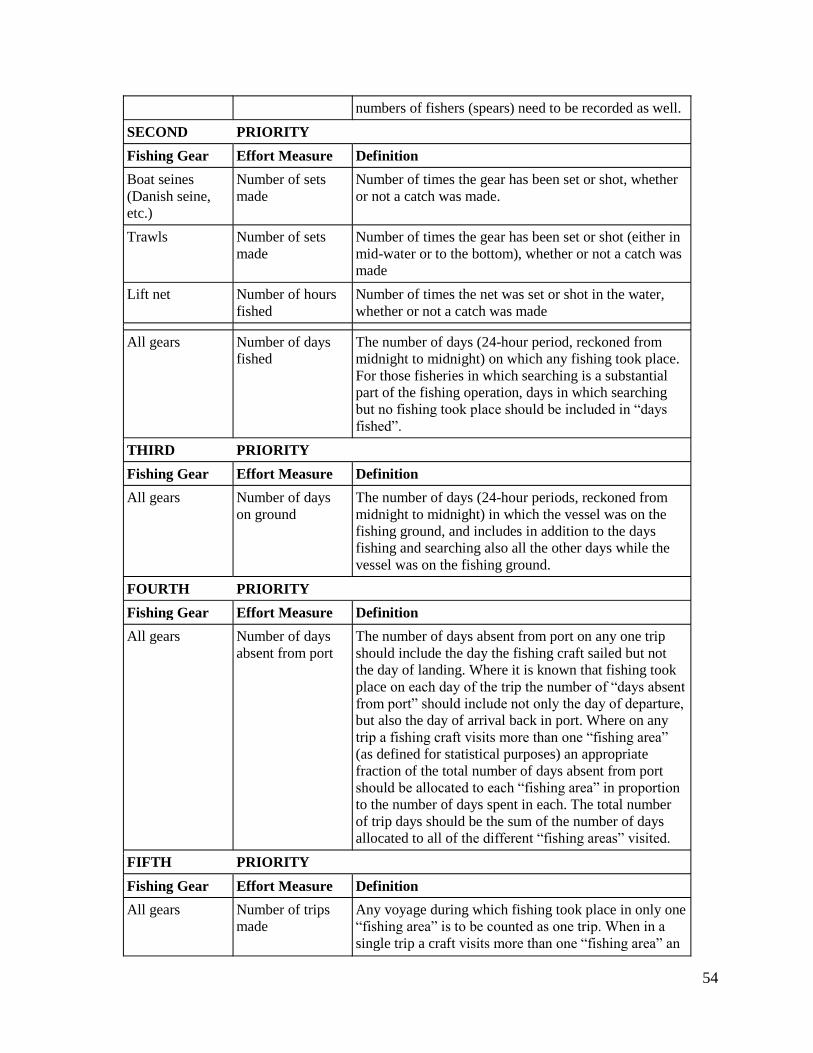
54
numbers of fishers (spears) need to be recorded as well.
SECOND PRIORITY
Fishing Gear Effort Measure Definition
Boat seines
(Danish seine,
etc.)
Number of sets
made
Number of times the gear has been set or shot, whether
or not a catch was made.
Trawls Number of sets
made
Number of times the gear has been set or shot (either in
mid-water or to the bottom), whether or not a catch was
made
Lift net Number of hours
fished
Number of times the net was set or shot in the water,
whether or not a catch was made
All gears Number of days
fished
The number of days (24-hour period, reckoned from
midnight to midnight) on which any fishing took place.
For those fisheries in which searching is a substantial
part of the fishing operation, days in which searching
but no fishing took place should be included in “days
fished”.
THIRD PRIORITY
Fishing Gear Effort Measure Definition
All gears Number of days
on ground
The number of days (24-hour periods, reckoned from
midnight to midnight) in which the vessel was on the
fishing ground, and includes in addition to the days
fishing and searching also all the other days while the
vessel was on the fishing ground.
FOURTH PRIORITY
Fishing Gear Effort Measure Definition
All gears Number of days
absent from port
The number of days absent from port on any one trip
should include the day the fishing craft sailed but not
the day of landing. Where it is known that fishing took
place on each day of the trip the number of “days absent
from port” should include not only the day of departure,
but also the day of arrival back in port. Where on any
trip a fishing craft visits more than one “fishing area”
(as defined for statistical purposes) an appropriate
fraction of the total number of days absent from port
should be allocated to each “fishing area” in proportion
to the number of days spent in each. The total number
of trip days should be the sum of the number of days
allocated to all of the different “fishing areas” visited.
FIFTH PRIORITY
Fishing Gear Effort Measure Definition
All gears Number of trips
made
Any voyage during which fishing took place in only one
“fishing area” is to be counted as one trip. When in a
single trip a craft visits more than one “fishing area” an
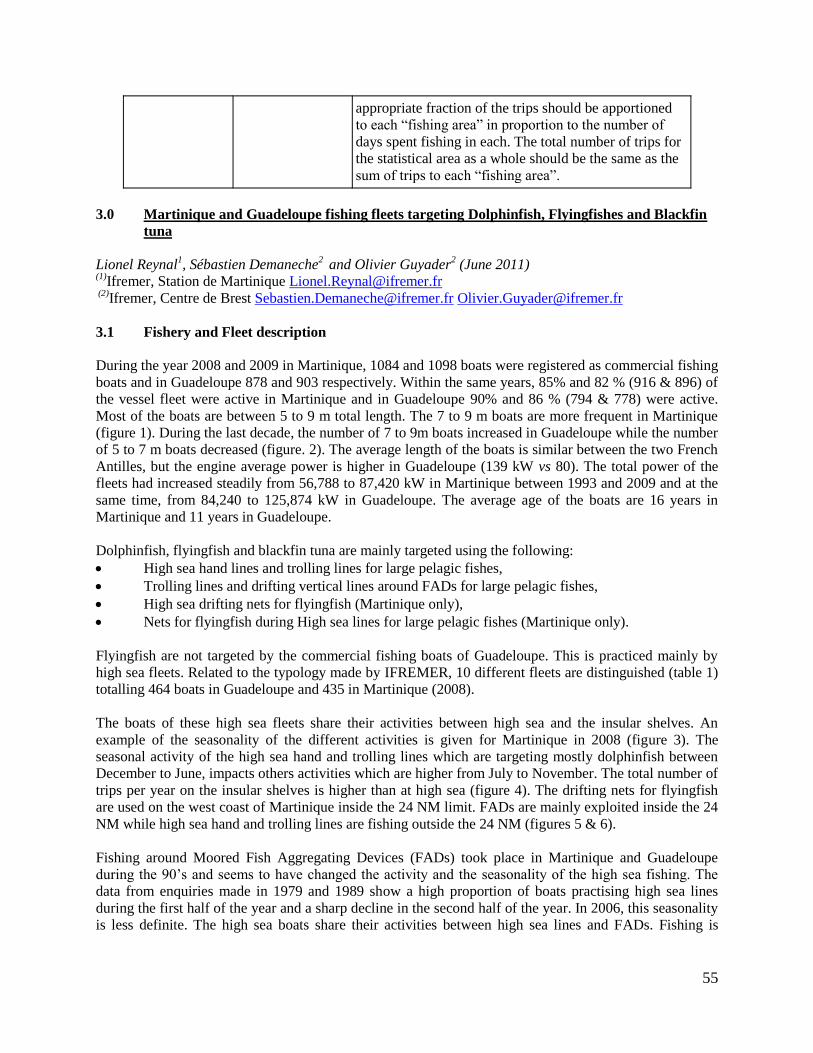
55
appropriate fraction of the trips should be apportioned
to each “fishing area” in proportion to the number of
days spent fishing in each. The total number of trips for
the statistical area as a whole should be the same as the
sum of trips to each “fishing area”.
3.0 Martinique and Guadeloupe fishing fleets targeting Dolphinfish, Flyingfishes and Blackfin
tuna
Lionel Reynal1, Sébastien Demaneche
2 and Olivier Guyader
2 (June 2011)
(1)Ifremer, Station de Martinique [email protected]
(2)Ifremer, Centre de Brest [email protected] [email protected]
3.1 Fishery and Fleet description
During the year 2008 and 2009 in Martinique, 1084 and 1098 boats were registered as commercial fishing
boats and in Guadeloupe 878 and 903 respectively. Within the same years, 85% and 82 % (916 & 896) of
the vessel fleet were active in Martinique and in Guadeloupe 90% and 86 % (794 & 778) were active.
Most of the boats are between 5 to 9 m total length. The 7 to 9 m boats are more frequent in Martinique
(figure 1). During the last decade, the number of 7 to 9m boats increased in Guadeloupe while the number
of 5 to 7 m boats decreased (figure. 2). The average length of the boats is similar between the two French
Antilles, but the engine average power is higher in Guadeloupe (139 kW vs 80). The total power of the
fleets had increased steadily from 56,788 to 87,420 kW in Martinique between 1993 and 2009 and at the
same time, from 84,240 to 125,874 kW in Guadeloupe. The average age of the boats are 16 years in
Martinique and 11 years in Guadeloupe.
Dolphinfish, flyingfish and blackfin tuna are mainly targeted using the following:
High sea hand lines and trolling lines for large pelagic fishes,
Trolling lines and drifting vertical lines around FADs for large pelagic fishes,
High sea drifting nets for flyingfish (Martinique only),
Nets for flyingfish during High sea lines for large pelagic fishes (Martinique only).
Flyingfish are not targeted by the commercial fishing boats of Guadeloupe. This is practiced mainly by
high sea fleets. Related to the typology made by IFREMER, 10 different fleets are distinguished (table 1)
totalling 464 boats in Guadeloupe and 435 in Martinique (2008).
The boats of these high sea fleets share their activities between high sea and the insular shelves. An
example of the seasonality of the different activities is given for Martinique in 2008 (figure 3). The
seasonal activity of the high sea hand and trolling lines which are targeting mostly dolphinfish between
December to June, impacts others activities which are higher from July to November. The total number of
trips per year on the insular shelves is higher than at high sea (figure 4). The drifting nets for flyingfish
are used on the west coast of Martinique inside the 24 NM limit. FADs are mainly exploited inside the 24
NM while high sea hand and trolling lines are fishing outside the 24 NM (figures 5 & 6).
Fishing around Moored Fish Aggregating Devices (FADs) took place in Martinique and Guadeloupe
during the 90’s and seems to have changed the activity and the seasonality of the high sea fishing. The
data from enquiries made in 1979 and 1989 show a high proportion of boats practising high sea lines
during the first half of the year and a sharp decline in the second half of the year. In 2006, this seasonality
is less definite. The high sea boats share their activities between high sea lines and FADs. Fishing is
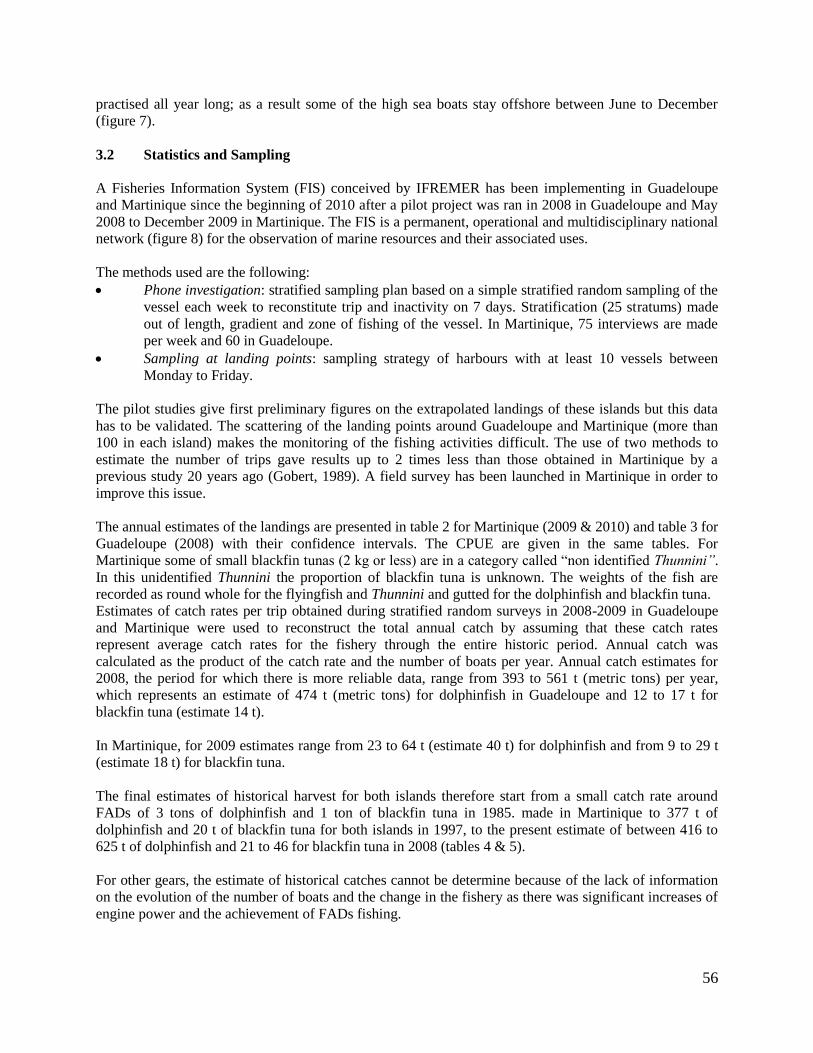
56
practised all year long; as a result some of the high sea boats stay offshore between June to December
(figure 7).
3.2 Statistics and Sampling
A Fisheries Information System (FIS) conceived by IFREMER has been implementing in Guadeloupe
and Martinique since the beginning of 2010 after a pilot project was ran in 2008 in Guadeloupe and May
2008 to December 2009 in Martinique. The FIS is a permanent, operational and multidisciplinary national
network (figure 8) for the observation of marine resources and their associated uses.
The methods used are the following:
Phone investigation: stratified sampling plan based on a simple stratified random sampling of the
vessel each week to reconstitute trip and inactivity on 7 days. Stratification (25 stratums) made
out of length, gradient and zone of fishing of the vessel. In Martinique, 75 interviews are made
per week and 60 in Guadeloupe.
Sampling at landing points: sampling strategy of harbours with at least 10 vessels between
Monday to Friday.
The pilot studies give first preliminary figures on the extrapolated landings of these islands but this data
has to be validated. The scattering of the landing points around Guadeloupe and Martinique (more than
100 in each island) makes the monitoring of the fishing activities difficult. The use of two methods to
estimate the number of trips gave results up to 2 times less than those obtained in Martinique by a
previous study 20 years ago (Gobert, 1989). A field survey has been launched in Martinique in order to
improve this issue.
The annual estimates of the landings are presented in table 2 for Martinique (2009 & 2010) and table 3 for
Guadeloupe (2008) with their confidence intervals. The CPUE are given in the same tables. For
Martinique some of small blackfin tunas (2 kg or less) are in a category called “non identified Thunnini”.
In this unidentified Thunnini the proportion of blackfin tuna is unknown. The weights of the fish are
recorded as round whole for the flyingfish and Thunnini and gutted for the dolphinfish and blackfin tuna.
Estimates of catch rates per trip obtained during stratified random surveys in 2008-2009 in Guadeloupe
and Martinique were used to reconstruct the total annual catch by assuming that these catch rates
represent average catch rates for the fishery through the entire historic period. Annual catch was
calculated as the product of the catch rate and the number of boats per year. Annual catch estimates for
2008, the period for which there is more reliable data, range from 393 to 561 t (metric tons) per year,
which represents an estimate of 474 t (metric tons) for dolphinfish in Guadeloupe and 12 to 17 t for
blackfin tuna (estimate 14 t).
In Martinique, for 2009 estimates range from 23 to 64 t (estimate 40 t) for dolphinfish and from 9 to 29 t
(estimate 18 t) for blackfin tuna.
The final estimates of historical harvest for both islands therefore start from a small catch rate around
FADs of 3 tons of dolphinfish and 1 ton of blackfin tuna in 1985. made in Martinique to 377 t of
dolphinfish and 20 t of blackfin tuna for both islands in 1997, to the present estimate of between 416 to
625 t of dolphinfish and 21 to 46 for blackfin tuna in 2008 (tables 4 & 5).
For other gears, the estimate of historical catches cannot be determine because of the lack of information
on the evolution of the number of boats and the change in the fishery as there was significant increases of
engine power and the achievement of FADs fishing.
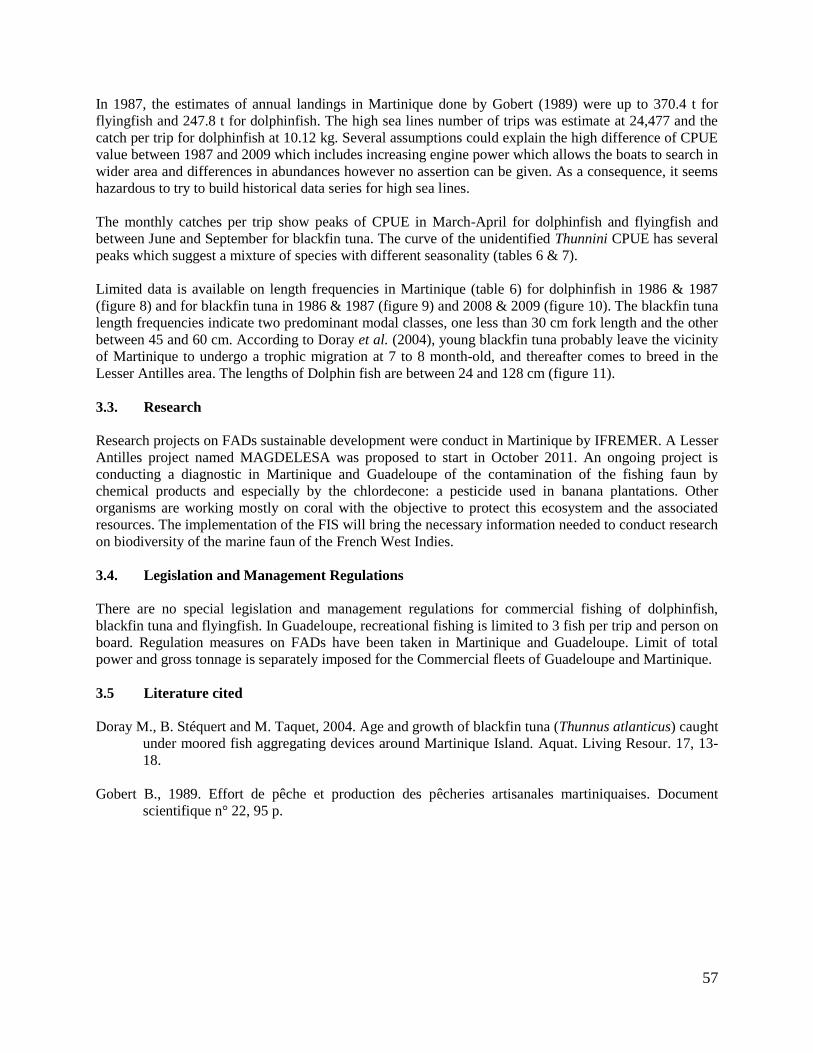
57
In 1987, the estimates of annual landings in Martinique done by Gobert (1989) were up to 370.4 t for
flyingfish and 247.8 t for dolphinfish. The high sea lines number of trips was estimate at 24,477 and the
catch per trip for dolphinfish at 10.12 kg. Several assumptions could explain the high difference of CPUE
value between 1987 and 2009 which includes increasing engine power which allows the boats to search in
wider area and differences in abundances however no assertion can be given. As a consequence, it seems
hazardous to try to build historical data series for high sea lines.
The monthly catches per trip show peaks of CPUE in March-April for dolphinfish and flyingfish and
between June and September for blackfin tuna. The curve of the unidentified Thunnini CPUE has several
peaks which suggest a mixture of species with different seasonality (tables 6 & 7).
Limited data is available on length frequencies in Martinique (table 6) for dolphinfish in 1986 & 1987
(figure 8) and for blackfin tuna in 1986 & 1987 (figure 9) and 2008 & 2009 (figure 10). The blackfin tuna
length frequencies indicate two predominant modal classes, one less than 30 cm fork length and the other
between 45 and 60 cm. According to Doray et al. (2004), young blackfin tuna probably leave the vicinity
of Martinique to undergo a trophic migration at 7 to 8 month-old, and thereafter comes to breed in the
Lesser Antilles area. The lengths of Dolphin fish are between 24 and 128 cm (figure 11).
3.3. Research
Research projects on FADs sustainable development were conduct in Martinique by IFREMER. A Lesser
Antilles project named MAGDELESA was proposed to start in October 2011. An ongoing project is
conducting a diagnostic in Martinique and Guadeloupe of the contamination of the fishing faun by
chemical products and especially by the chlordecone: a pesticide used in banana plantations. Other
organisms are working mostly on coral with the objective to protect this ecosystem and the associated
resources. The implementation of the FIS will bring the necessary information needed to conduct research
on biodiversity of the marine faun of the French West Indies.
3.4. Legislation and Management Regulations
There are no special legislation and management regulations for commercial fishing of dolphinfish,
blackfin tuna and flyingfish. In Guadeloupe, recreational fishing is limited to 3 fish per trip and person on
board. Regulation measures on FADs have been taken in Martinique and Guadeloupe. Limit of total
power and gross tonnage is separately imposed for the Commercial fleets of Guadeloupe and Martinique.
3.5 Literature cited
Doray M., B. Stéquert and M. Taquet, 2004. Age and growth of blackfin tuna (Thunnus atlanticus) caught
under moored fish aggregating devices around Martinique Island. Aquat. Living Resour. 17, 13-
18.
Gobert B., 1989. Effort de pêche et production des pêcheries artisanales martiniquaises. Document
scientifique n° 22, 95 p.
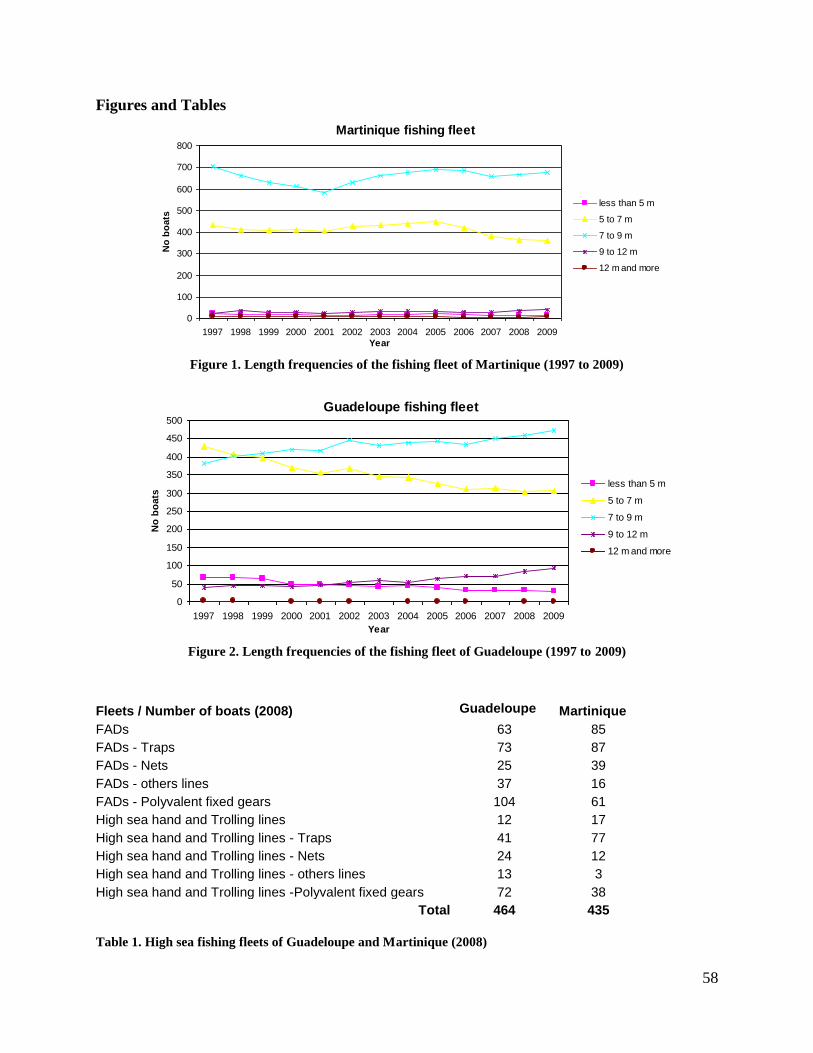
58
Figures and Tables
Martinique fishing fleet
0
100
200
300
400
500
600
700
800
1997 1998 1999 2000 2001 2002 2003 2004 2005 2006 2007 2008 2009
Year
No
bo
ats
less than 5 m
5 to 7 m
7 to 9 m
9 to 12 m
12 m and more
Figure 1. Length frequencies of the fishing fleet of Martinique (1997 to 2009)
Guadeloupe fishing fleet
0
50
100
150
200
250
300
350
400
450
500
1997 1998 1999 2000 2001 2002 2003 2004 2005 2006 2007 2008 2009
Year
No
bo
ats
less than 5 m
5 to 7 m
7 to 9 m
9 to 12 m
12 m and more
Figure 2. Length frequencies of the fishing fleet of Guadeloupe (1997 to 2009)
Table 1. High sea fishing fleets of Guadeloupe and Martinique (2008)
Fleets / Number of boats (2008) Guadeloupe Martinique
FADs 63 85
FADs - Traps 73 87
FADs - Nets 25 39
FADs - others lines 37 16
FADs - Polyvalent fixed gears 104 61
High sea hand and Trolling lines 12 17
High sea hand and Trolling lines - Traps 41 77
High sea hand and Trolling lines - Nets 24 12
High sea hand and Trolling lines - others lines 13 3
High sea hand and Trolling lines -Polyvalent fixed gears 72 38
Total 464 435
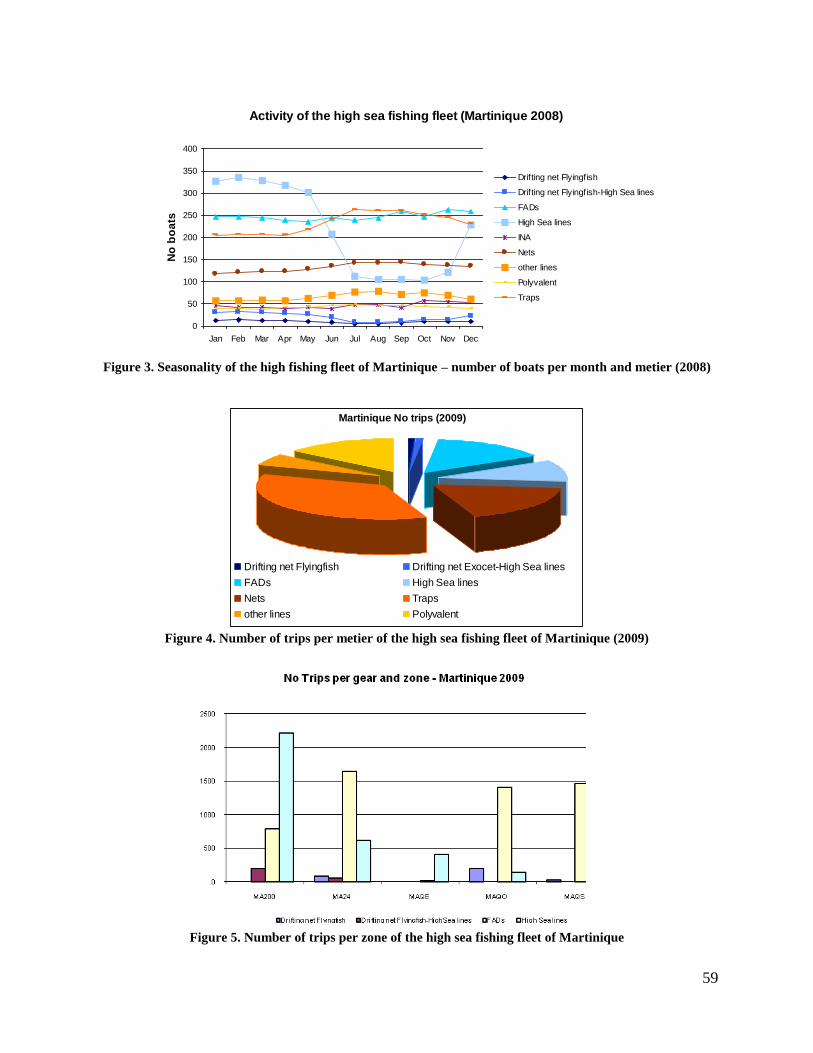
59
Activity of the high sea fishing fleet (Martinique 2008)
0
50
100
150
200
250
300
350
400
Jan Feb Mar Apr May Jun Jul Aug Sep Oct Nov Dec
No
bo
ats
Drifting net Flyingfish
Drifting net Flyingfish-High Sea lines
FADs
High Sea lines
INA
Nets
other lines
Polyvalent
Traps
Figure 3. Seasonality of the high fishing fleet of Martinique – number of boats per month and metier (2008)
Martinique No trips (2009)
Drifting net Flyingfish Drifting net Exocet-High Sea lines
FADs High Sea lines
Nets Traps
other lines Polyvalent
Figure 4. Number of trips per metier of the high sea fishing fleet of Martinique (2009)
Figure 5. Number of trips per zone of the high sea fishing fleet of Martinique
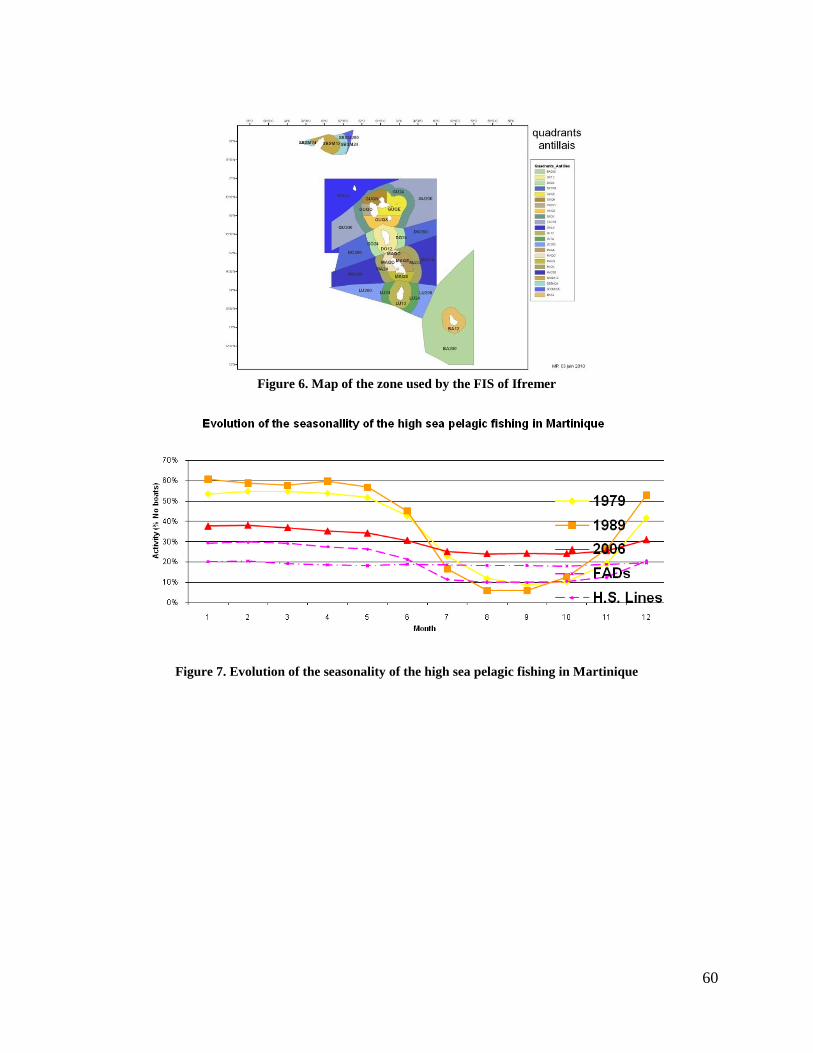
60
Figure 6. Map of the zone used by the FIS of Ifremer
Figure 7. Evolution of the seasonality of the high sea pelagic fishing in Martinique
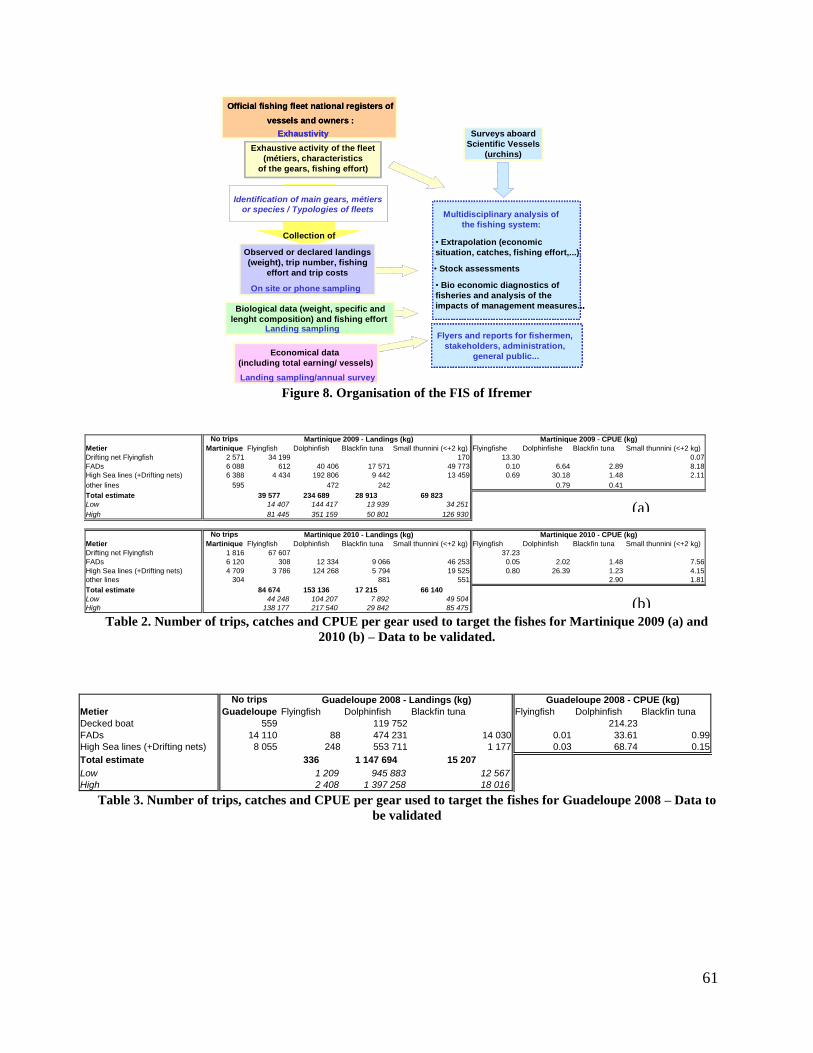
61
Official fishing fleet national registers of
vessels and owners :
Exhaustivity
Exhaustive activity of the fleet
(métiers, characteristics
of the gears, fishing effort)
Identification of main gears, métiers
or species / Typologies of fleets
Surveys aboard
Scientific Vessels
(urchins)
Multidisciplinary analysis of
the fishing system:
• Extrapolation (economic
situation, catches, fishing effort,...)
• Stock assessments
• Bio economic diagnostics of
fisheries and analysis of the
impacts of management measures...
Flyers and reports for fishermen,
stakeholders, administration,
general public...
Observed or declared landings
(weight), trip number, fishing
effort and trip costs
On site or phone sampling
Collection of
Biological data (weight, specific and
lenght composition) and fishing effort Landing sampling
Economical data
(including total earning/ vessels)
Landing sampling/annual survey
Official fishing fleet national registers of
vessels and owners :
Exhaustivity
Exhaustive activity of the fleet
(métiers, characteristics
of the gears, fishing effort)
Identification of main gears, métiers
or species / Typologies of fleets
Surveys aboard
Scientific Vessels
(urchins)
Multidisciplinary analysis of
the fishing system:
• Extrapolation (economic
situation, catches, fishing effort,...)
• Stock assessments
• Bio economic diagnostics of
fisheries and analysis of the
impacts of management measures...
Flyers and reports for fishermen,
stakeholders, administration,
general public...
Observed or declared landings
(weight), trip number, fishing
effort and trip costs
On site or phone sampling
Collection of
Biological data (weight, specific and
lenght composition) and fishing effort Landing sampling
Economical data
(including total earning/ vessels)
Landing sampling/annual survey Figure 8. Organisation of the FIS of Ifremer
Metier Flyingfish Dolphinfish Blackfin tuna Small thunnini (<+2 kg) Flyingfishe Dolphinfishe Blackfin tuna Small thunnini (<+2 kg)
Drifting net Flyingfish 2 571 34 199 170 13.30 0.07
FADs 6 088 612 40 406 17 571 49 773 0.10 6.64 2.89 8.18
High Sea lines (+Drifting nets) 6 388 4 434 192 806 9 442 13 459 0.69 30.18 1.48 2.11
other lines 595 472 242 0.79 0.41
Total estimate 39 577 234 689 28 913 69 823
Low 14 407 144 417 13 939 34 251
High 81 445 351 159 50 801 126 930
Metier Flyingfish Dolphinfish Blackfin tuna Small thunnini (<+2 kg) Flyingfish Dolphinfish Blackfin tuna Small thunnini (<+2 kg)
Drifting net Flyingfish 1 816 67 607 37.23
FADs 6 120 308 12 334 9 066 46 253 0.05 2.02 1.48 7.56
High Sea lines (+Drifting nets) 4 709 3 786 124 268 5 794 19 525 0.80 26.39 1.23 4.15
other lines 304 881 551 2.90 1.81
Total estimate 84 674 153 136 17 215 66 140
Low 44 248 104 207 7 892 49 504
High 138 177 217 540 29 842 85 475
Martinique 2009 - CPUE (kg)Martinique 2009 - Landings (kg)
No trips
Martinique
Martinique 2010 - Landings (kg) Martinique 2010 - CPUE (kg)
No trips
Martinique
Table 2. Number of trips, catches and CPUE per gear used to target the fishes for Martinique 2009 (a) and
2010 (b) – Data to be validated.
Metier Flyingfish Dolphinfish Blackfin tuna Flyingfish Dolphinfish Blackfin tuna
Decked boat 559 119 752 214.23
FADs 14 110 88 474 231 14 030 0.01 33.61 0.99
High Sea lines (+Drifting nets) 8 055 248 553 711 1 177 0.03 68.74 0.15
Total estimate 336 1 147 694 15 207
Low 1 209 945 883 12 567
High 2 408 1 397 258 18 016
No trips
Guadeloupe
Guadeloupe 2008 - CPUE (kg)Guadeloupe 2008 - Landings (kg)
Table 3. Number of trips, catches and CPUE per gear used to target the fishes for Guadeloupe 2008 – Data to
be validated
(a)
(b)
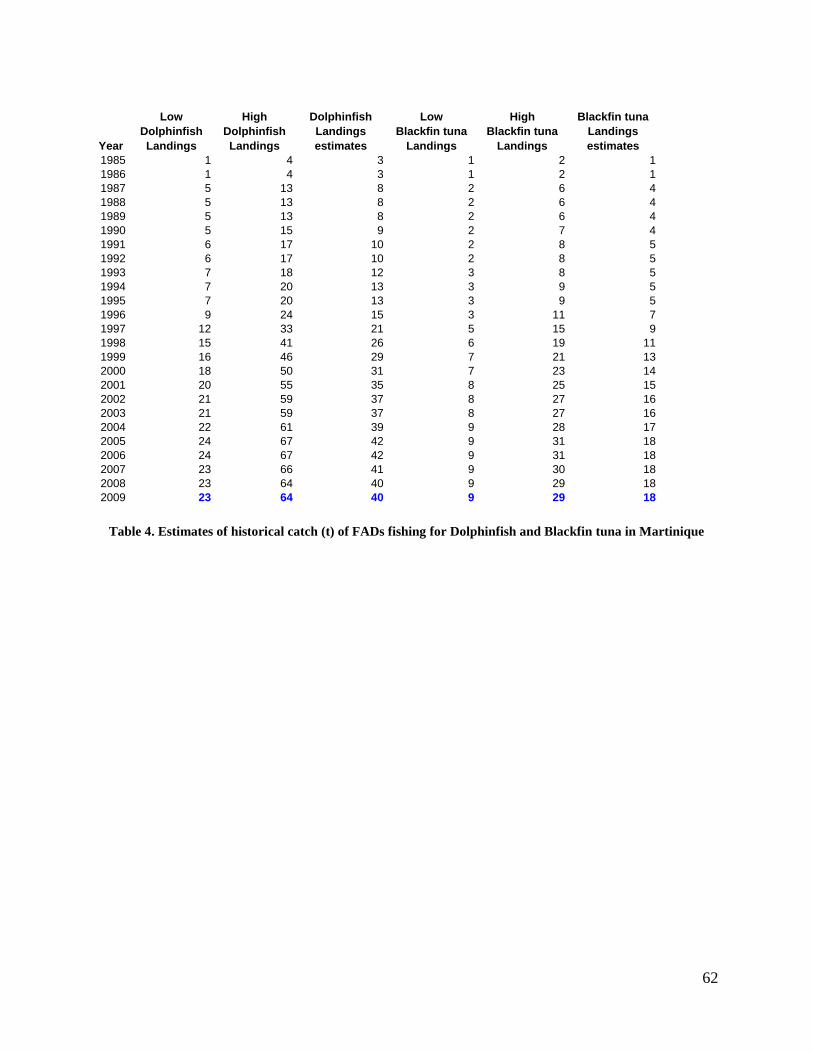
62
Year
Low
Dolphinfish
Landings
High
Dolphinfish
Landings
Dolphinfish
Landings
estimates
Low
Blackfin tuna
Landings
High
Blackfin tuna
Landings
Blackfin tuna
Landings
estimates
1985 1 4 3 1 2 1
1986 1 4 3 1 2 1
1987 5 13 8 2 6 4
1988 5 13 8 2 6 4
1989 5 13 8 2 6 4
1990 5 15 9 2 7 4
1991 6 17 10 2 8 5
1992 6 17 10 2 8 5
1993 7 18 12 3 8 5
1994 7 20 13 3 9 5
1995 7 20 13 3 9 5
1996 9 24 15 3 11 7
1997 12 33 21 5 15 9
1998 15 41 26 6 19 11
1999 16 46 29 7 21 13
2000 18 50 31 7 23 14
2001 20 55 35 8 25 15
2002 21 59 37 8 27 16
2003 21 59 37 8 27 16
2004 22 61 39 9 28 17
2005 24 67 42 9 31 18
2006 24 67 42 9 31 18
2007 23 66 41 9 30 18
2008 23 64 40 9 29 18
2009 23 64 40 9 29 18
Table 4. Estimates of historical catch (t) of FADs fishing for Dolphinfish and Blackfin tuna in Martinique
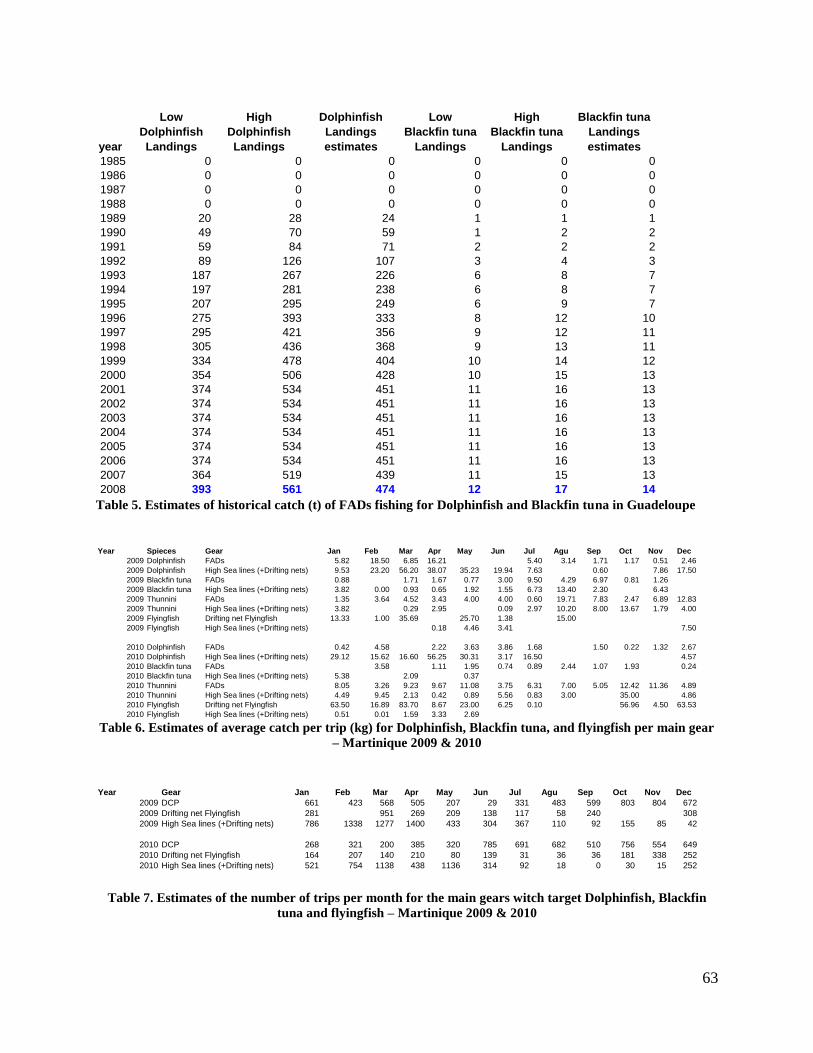
63
year
Low
Dolphinfish
Landings
High
Dolphinfish
Landings
Dolphinfish
Landings
estimates
Low
Blackfin tuna
Landings
High
Blackfin tuna
Landings
Blackfin tuna
Landings
estimates
1985 0 0 0 0 0 0
1986 0 0 0 0 0 0
1987 0 0 0 0 0 0
1988 0 0 0 0 0 0
1989 20 28 24 1 1 1
1990 49 70 59 1 2 2
1991 59 84 71 2 2 2
1992 89 126 107 3 4 3
1993 187 267 226 6 8 7
1994 197 281 238 6 8 7
1995 207 295 249 6 9 7
1996 275 393 333 8 12 10
1997 295 421 356 9 12 11
1998 305 436 368 9 13 11
1999 334 478 404 10 14 12
2000 354 506 428 10 15 13
2001 374 534 451 11 16 13
2002 374 534 451 11 16 13
2003 374 534 451 11 16 13
2004 374 534 451 11 16 13
2005 374 534 451 11 16 13
2006 374 534 451 11 16 13
2007 364 519 439 11 15 13
2008 393 561 474 12 17 14 Table 5. Estimates of historical catch (t) of FADs fishing for Dolphinfish and Blackfin tuna in Guadeloupe
Year Spieces Gear Jan Feb Mar Apr May Jun Jul Agu Sep Oct Nov Dec
2009 Dolphinfish FADs 5.82 18.50 6.85 16.21 5.40 3.14 1.71 1.17 0.51 2.46
2009 Dolphinfish High Sea lines (+Drifting nets) 9.53 23.20 56.20 38.07 35.23 19.94 7.63 0.60 7.86 17.50
2009 Blackfin tuna FADs 0.88 1.71 1.67 0.77 3.00 9.50 4.29 6.97 0.81 1.26
2009 Blackfin tuna High Sea lines (+Drifting nets) 3.82 0.00 0.93 0.65 1.92 1.55 6.73 13.40 2.30 6.43
2009 Thunnini FADs 1.35 3.64 4.52 3.43 4.00 4.00 0.60 19.71 7.83 2.47 6.89 12.83
2009 Thunnini High Sea lines (+Drifting nets) 3.82 0.29 2.95 0.09 2.97 10.20 8.00 13.67 1.79 4.00
2009 Flyingfish Drifting net Flyingfish 13.33 1.00 35.69 25.70 1.38 15.00
2009 Flyingfish High Sea lines (+Drifting nets) 0.18 4.46 3.41 7.50
2010 Dolphinfish FADs 0.42 4.58 2.22 3.63 3.86 1.68 1.50 0.22 1.32 2.67
2010 Dolphinfish High Sea lines (+Drifting nets) 29.12 15.62 16.60 56.25 30.31 3.17 16.50 4.57
2010 Blackfin tuna FADs 3.58 1.11 1.95 0.74 0.89 2.44 1.07 1.93 0.24
2010 Blackfin tuna High Sea lines (+Drifting nets) 5.38 2.09 0.37
2010 Thunnini FADs 8.05 3.26 9.23 9.67 11.08 3.75 6.31 7.00 5.05 12.42 11.36 4.89
2010 Thunnini High Sea lines (+Drifting nets) 4.49 9.45 2.13 0.42 0.89 5.56 0.83 3.00 35.00 4.86
2010 Flyingfish Drifting net Flyingfish 63.50 16.89 83.70 8.67 23.00 6.25 0.10 56.96 4.50 63.53
2010 Flyingfish High Sea lines (+Drifting nets) 0.51 0.01 1.59 3.33 2.69 Table 6. Estimates of average catch per trip (kg) for Dolphinfish, Blackfin tuna, and flyingfish per main gear
– Martinique 2009 & 2010
Year Gear Jan Feb Mar Apr May Jun Jul Agu Sep Oct Nov Dec
2009 DCP 661 423 568 505 207 29 331 483 599 803 804 672
2009 Drifting net Flyingfish 281 951 269 209 138 117 58 240 308
2009 High Sea lines (+Drifting nets) 786 1338 1277 1400 433 304 367 110 92 155 85 42
2010 DCP 268 321 200 385 320 785 691 682 510 756 554 649
2010 Drifting net Flyingfish 164 207 140 210 80 139 31 36 36 181 338 252
2010 High Sea lines (+Drifting nets) 521 754 1138 438 1136 314 92 18 0 30 15 252
Table 7. Estimates of the number of trips per month for the main gears witch target Dolphinfish, Blackfin
tuna and flyingfish – Martinique 2009 & 2010
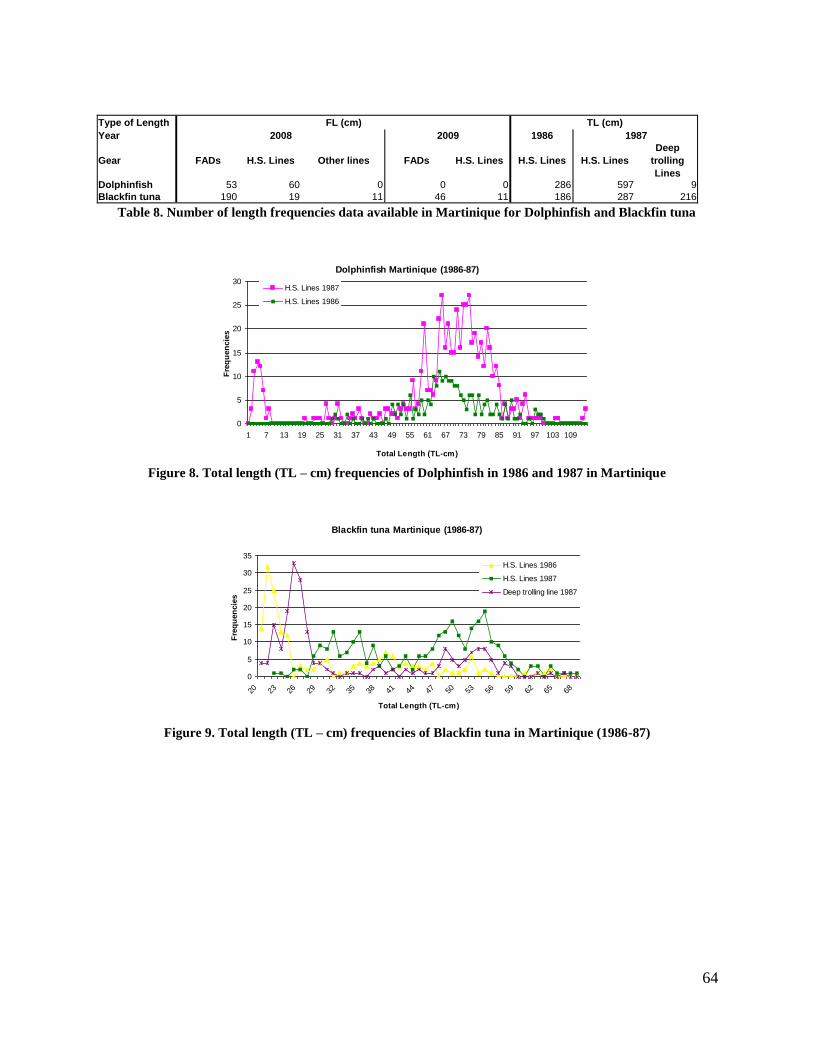
64
Type of Length
Year 1986
Gear FADs H.S. Lines Other lines FADs H.S. Lines H.S. Lines H.S. Lines
Deep
trolling
LinesDolphinfish 53 60 0 0 0 286 597 9
Blackfin tuna 190 19 11 46 11 186 287 216
20092008
FL (cm)
1987
TL (cm)
Table 8. Number of length frequencies data available in Martinique for Dolphinfish and Blackfin tuna
Dolphinfish Martinique (1986-87)
0
5
10
15
20
25
30
1 7 13 19 25 31 37 43 49 55 61 67 73 79 85 91 97 103 109
Total Length (TL-cm)
Fre
qu
en
cie
s
H.S. Lines 1987
H.S. Lines 1986
Figure 8. Total length (TL – cm) frequencies of Dolphinfish in 1986 and 1987 in Martinique
Blackfin tuna Martinique (1986-87)
0
5
10
15
20
25
30
35
20 23 26 29 32 35 38 41 44 47 50 53 56 59 62 65 68
Total Length (TL-cm)
Fre
qu
en
cie
s
H.S. Lines 1986
H.S. Lines 1987
Deep trolling line 1987
Figure 9. Total length (TL – cm) frequencies of Blackfin tuna in Martinique (1986-87)
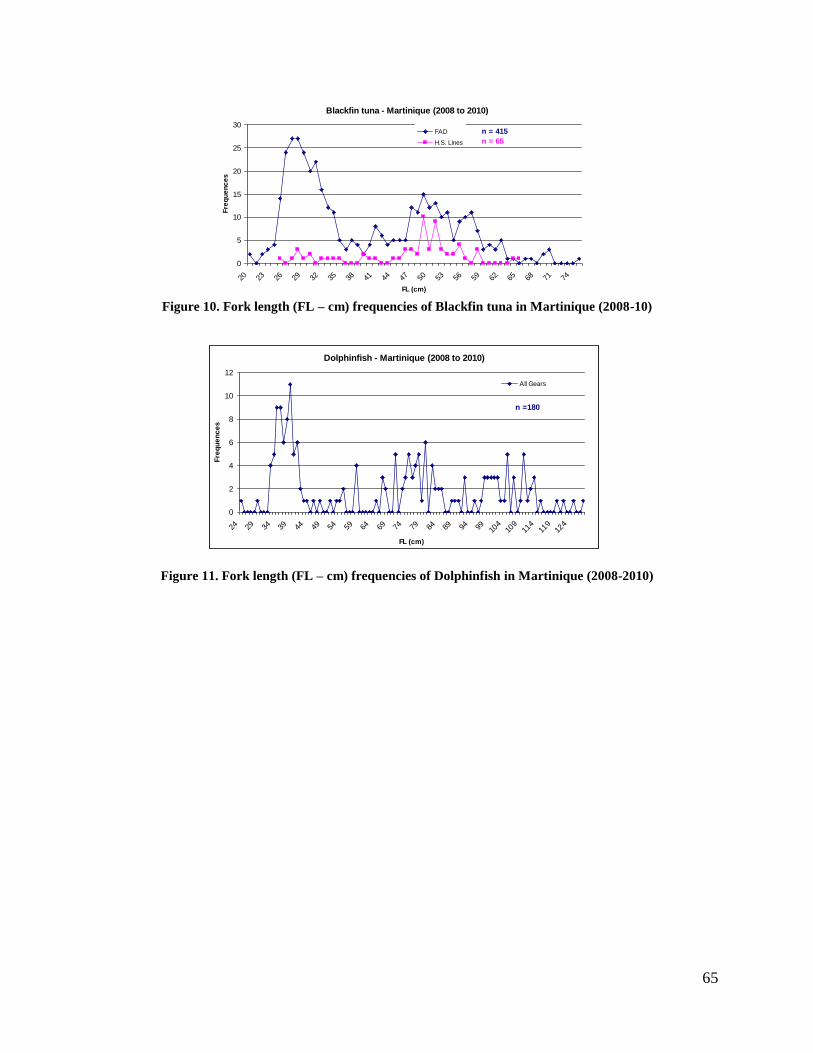
65
Blackfin tuna - Martinique (2008 to 2010)
0
5
10
15
20
25
30
20 23 26 29 32 35 38 41 44 47 50 53 56 59 62 65 68 71 74
FL (cm)
Fre
qu
en
ce
s
FAD
H.S. Lines
n = 415
n = 65
Figure 10. Fork length (FL – cm) frequencies of Blackfin tuna in Martinique (2008-10)
Figure 11. Fork length (FL – cm) frequencies of Dolphinfish in Martinique (2008-2010)
Dolphinfish - Martinique (2008 to 2010)
0
2
4
6
8
10
12
24 29 34 39 44 49 54 59 64 69 74 79 84 89 94 99 104
109
114
119
124
FL (cm)
Fre
qu
en
ce
s
All Gears
n =180
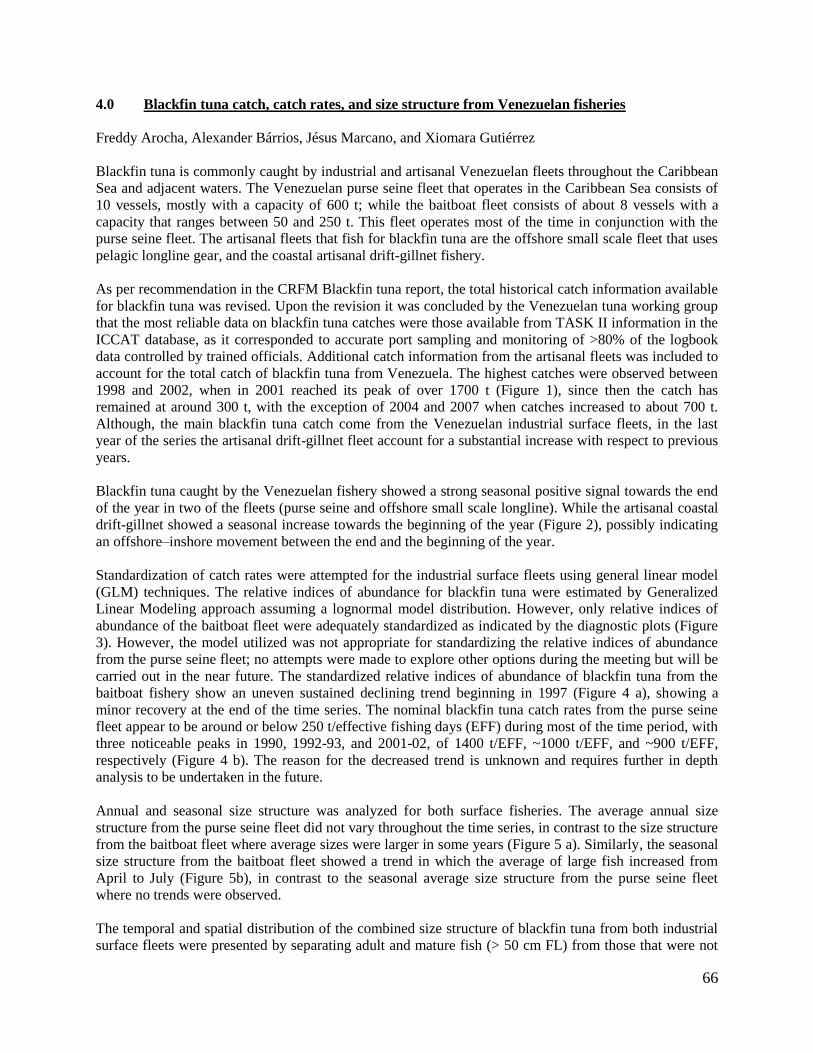
66
4.0 Blackfin tuna catch, catch rates, and size structure from Venezuelan fisheries
Freddy Arocha, Alexander Bárrios, Jésus Marcano, and Xiomara Gutiérrez
Blackfin tuna is commonly caught by industrial and artisanal Venezuelan fleets throughout the Caribbean
Sea and adjacent waters. The Venezuelan purse seine fleet that operates in the Caribbean Sea consists of
10 vessels, mostly with a capacity of 600 t; while the baitboat fleet consists of about 8 vessels with a
capacity that ranges between 50 and 250 t. This fleet operates most of the time in conjunction with the
purse seine fleet. The artisanal fleets that fish for blackfin tuna are the offshore small scale fleet that uses
pelagic longline gear, and the coastal artisanal drift-gillnet fishery.
As per recommendation in the CRFM Blackfin tuna report, the total historical catch information available
for blackfin tuna was revised. Upon the revision it was concluded by the Venezuelan tuna working group
that the most reliable data on blackfin tuna catches were those available from TASK II information in the
ICCAT database, as it corresponded to accurate port sampling and monitoring of >80% of the logbook
data controlled by trained officials. Additional catch information from the artisanal fleets was included to
account for the total catch of blackfin tuna from Venezuela. The highest catches were observed between
1998 and 2002, when in 2001 reached its peak of over 1700 t (Figure 1), since then the catch has
remained at around 300 t, with the exception of 2004 and 2007 when catches increased to about 700 t.
Although, the main blackfin tuna catch come from the Venezuelan industrial surface fleets, in the last
year of the series the artisanal drift-gillnet fleet account for a substantial increase with respect to previous
years.
Blackfin tuna caught by the Venezuelan fishery showed a strong seasonal positive signal towards the end
of the year in two of the fleets (purse seine and offshore small scale longline). While the artisanal coastal
drift-gillnet showed a seasonal increase towards the beginning of the year (Figure 2), possibly indicating
an offshore–inshore movement between the end and the beginning of the year.
Standardization of catch rates were attempted for the industrial surface fleets using general linear model
(GLM) techniques. The relative indices of abundance for blackfin tuna were estimated by Generalized
Linear Modeling approach assuming a lognormal model distribution. However, only relative indices of
abundance of the baitboat fleet were adequately standardized as indicated by the diagnostic plots (Figure
3). However, the model utilized was not appropriate for standardizing the relative indices of abundance
from the purse seine fleet; no attempts were made to explore other options during the meeting but will be
carried out in the near future. The standardized relative indices of abundance of blackfin tuna from the
baitboat fishery show an uneven sustained declining trend beginning in 1997 (Figure 4 a), showing a
minor recovery at the end of the time series. The nominal blackfin tuna catch rates from the purse seine
fleet appear to be around or below 250 t/effective fishing days (EFF) during most of the time period, with
three noticeable peaks in 1990, 1992-93, and 2001-02, of 1400 t/EFF, ~1000 t/EFF, and ~900 t/EFF,
respectively (Figure 4 b). The reason for the decreased trend is unknown and requires further in depth
analysis to be undertaken in the future.
Annual and seasonal size structure was analyzed for both surface fisheries. The average annual size
structure from the purse seine fleet did not vary throughout the time series, in contrast to the size structure
from the baitboat fleet where average sizes were larger in some years (Figure 5 a). Similarly, the seasonal
size structure from the baitboat fleet showed a trend in which the average of large fish increased from
April to July (Figure 5b), in contrast to the seasonal average size structure from the purse seine fleet
where no trends were observed.
The temporal and spatial distribution of the combined size structure of blackfin tuna from both industrial
surface fleets were presented by separating adult and mature fish (> 50 cm FL) from those that were not
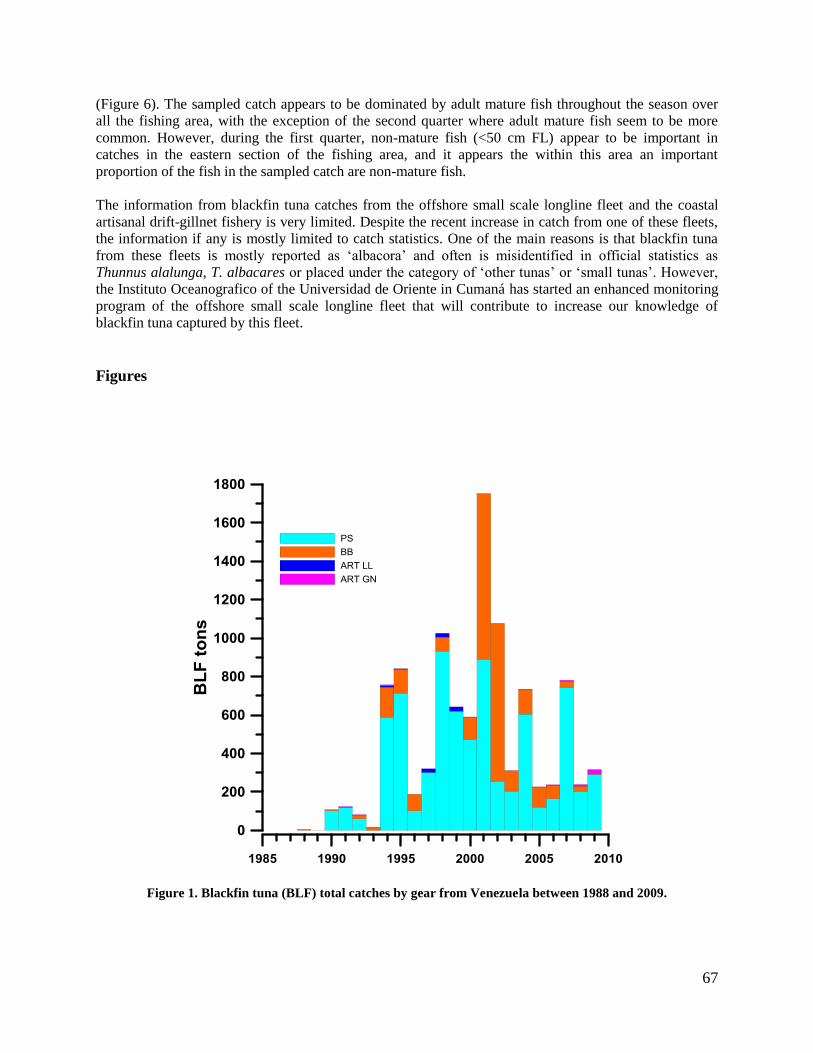
67
(Figure 6). The sampled catch appears to be dominated by adult mature fish throughout the season over
all the fishing area, with the exception of the second quarter where adult mature fish seem to be more
common. However, during the first quarter, non-mature fish (<50 cm FL) appear to be important in
catches in the eastern section of the fishing area, and it appears the within this area an important
proportion of the fish in the sampled catch are non-mature fish.
The information from blackfin tuna catches from the offshore small scale longline fleet and the coastal
artisanal drift-gillnet fishery is very limited. Despite the recent increase in catch from one of these fleets,
the information if any is mostly limited to catch statistics. One of the main reasons is that blackfin tuna
from these fleets is mostly reported as ‘albacora’ and often is misidentified in official statistics as
Thunnus alalunga, T. albacares or placed under the category of ‘other tunas’ or ‘small tunas’. However,
the Instituto Oceanografico of the Universidad de Oriente in Cumaná has started an enhanced monitoring
program of the offshore small scale longline fleet that will contribute to increase our knowledge of
blackfin tuna captured by this fleet.
Figures
Figure 1. Blackfin tuna (BLF) total catches by gear from Venezuela between 1988 and 2009.
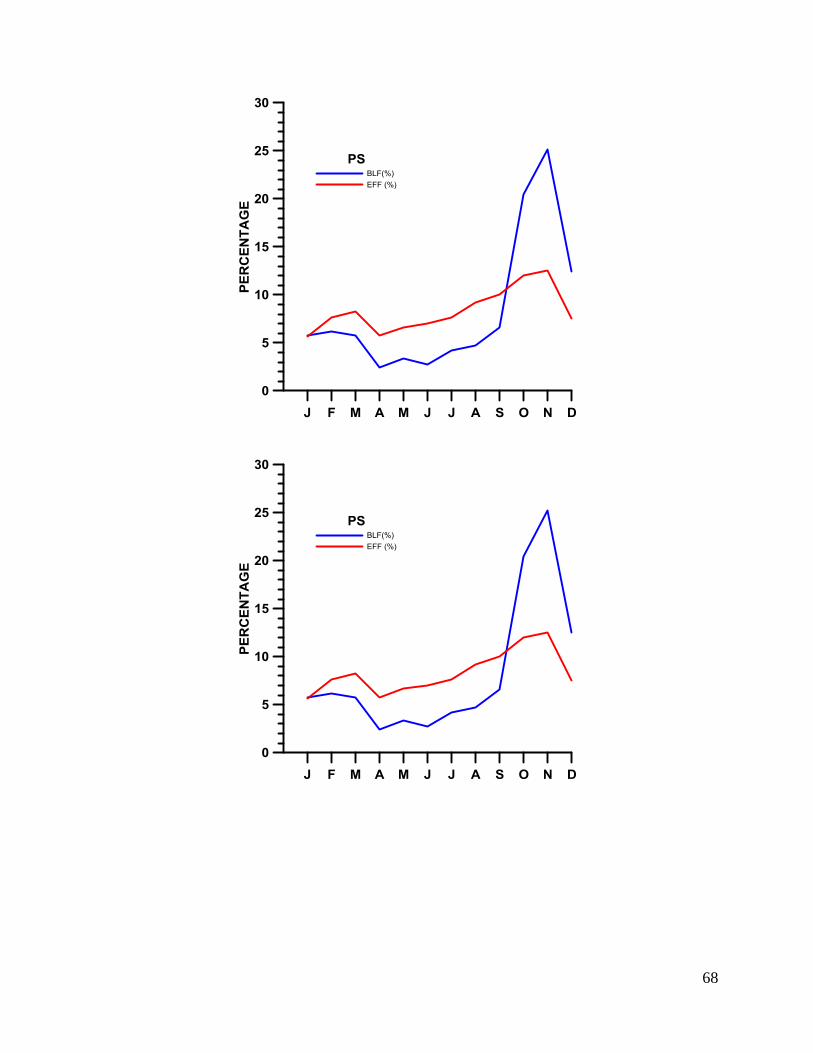
68
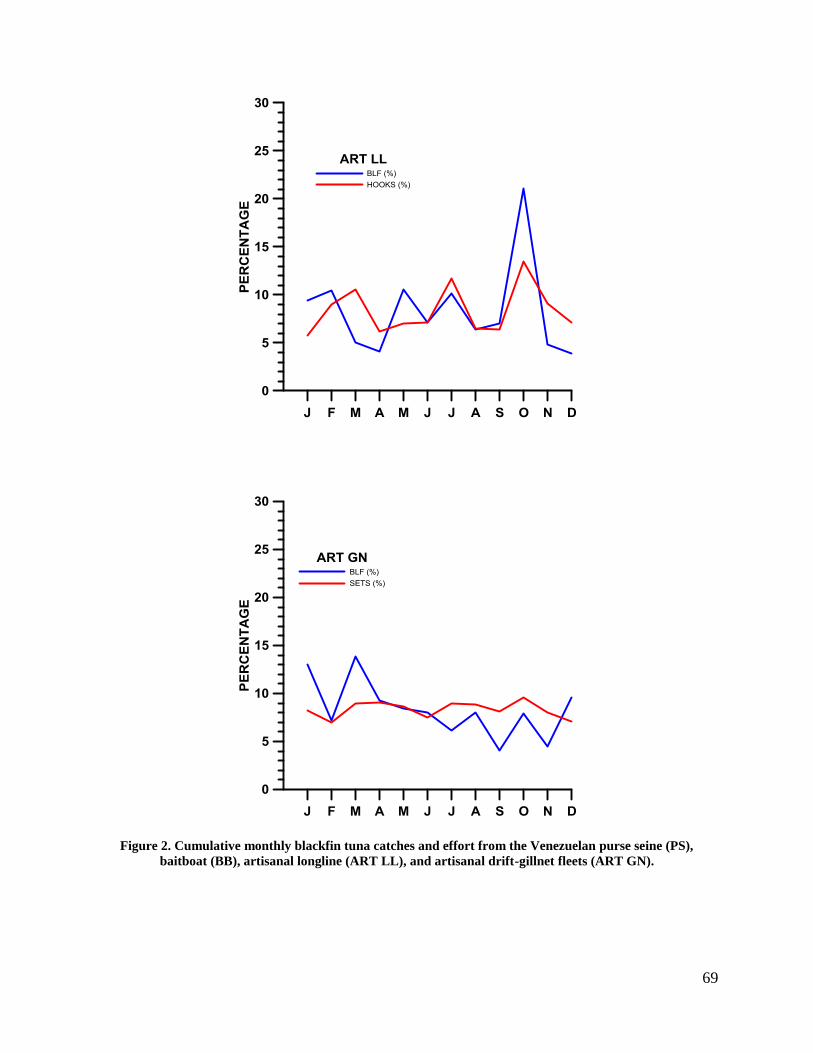
69
Figure 2. Cumulative monthly blackfin tuna catches and effort from the Venezuelan purse seine (PS),
baitboat (BB), artisanal longline (ART LL), and artisanal drift-gillnet fleets (ART GN).
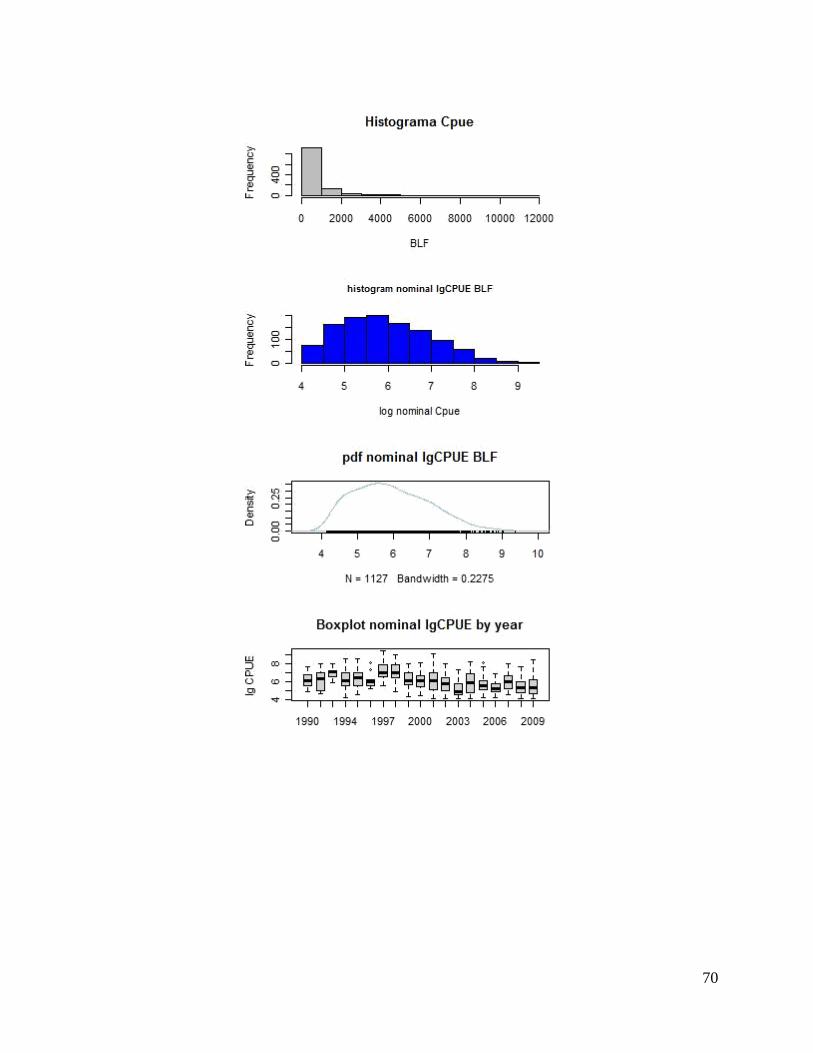
70
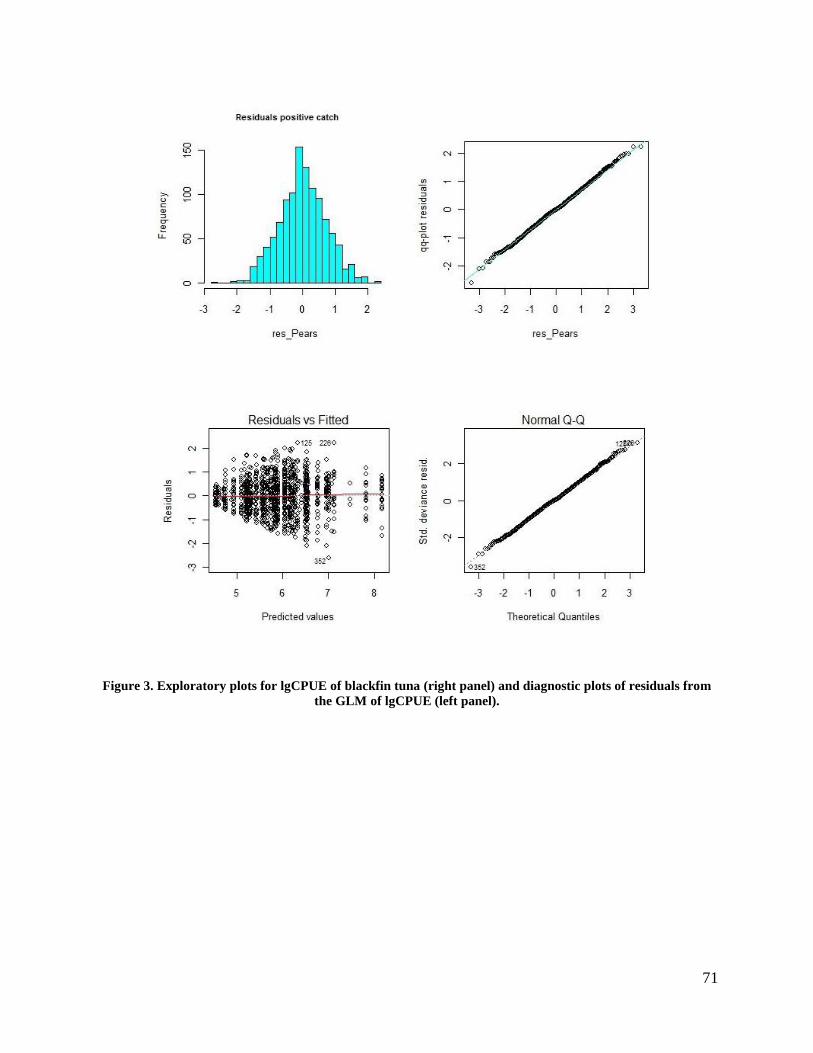
71
Figure 3. Exploratory plots for lgCPUE of blackfin tuna (right panel) and diagnostic plots of residuals from
the GLM of lgCPUE (left panel).
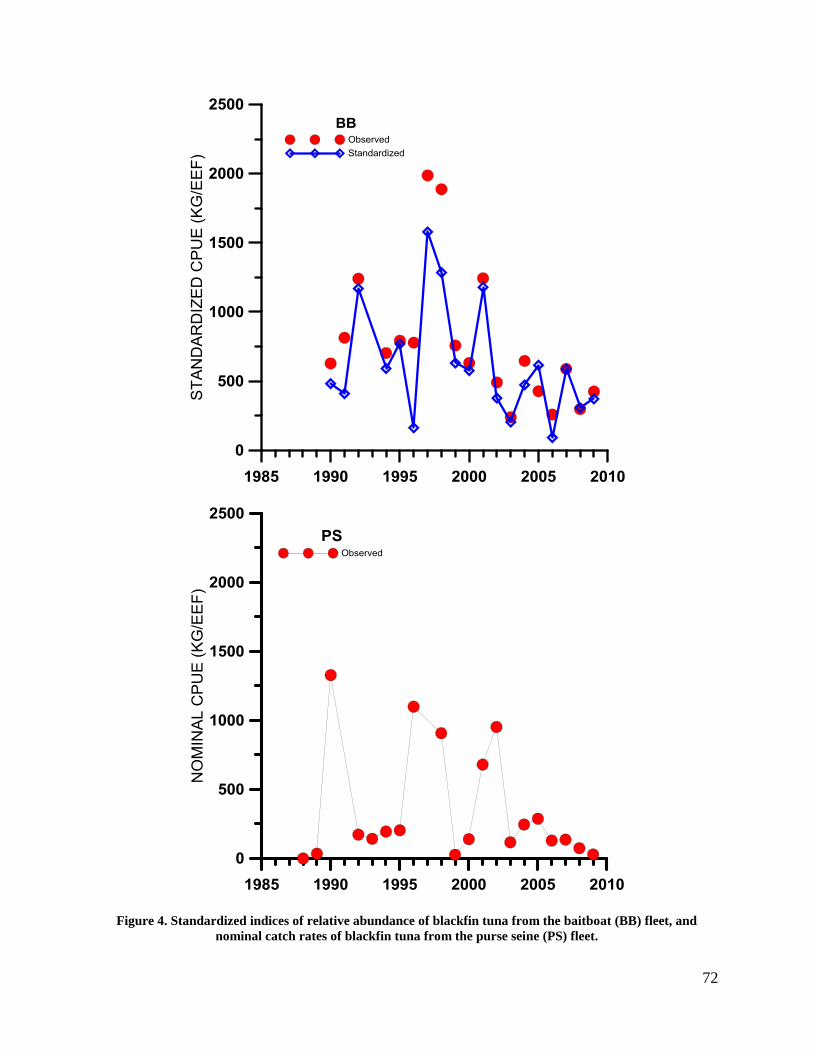
72
Figure 4. Standardized indices of relative abundance of blackfin tuna from the baitboat (BB) fleet, and
nominal catch rates of blackfin tuna from the purse seine (PS) fleet.
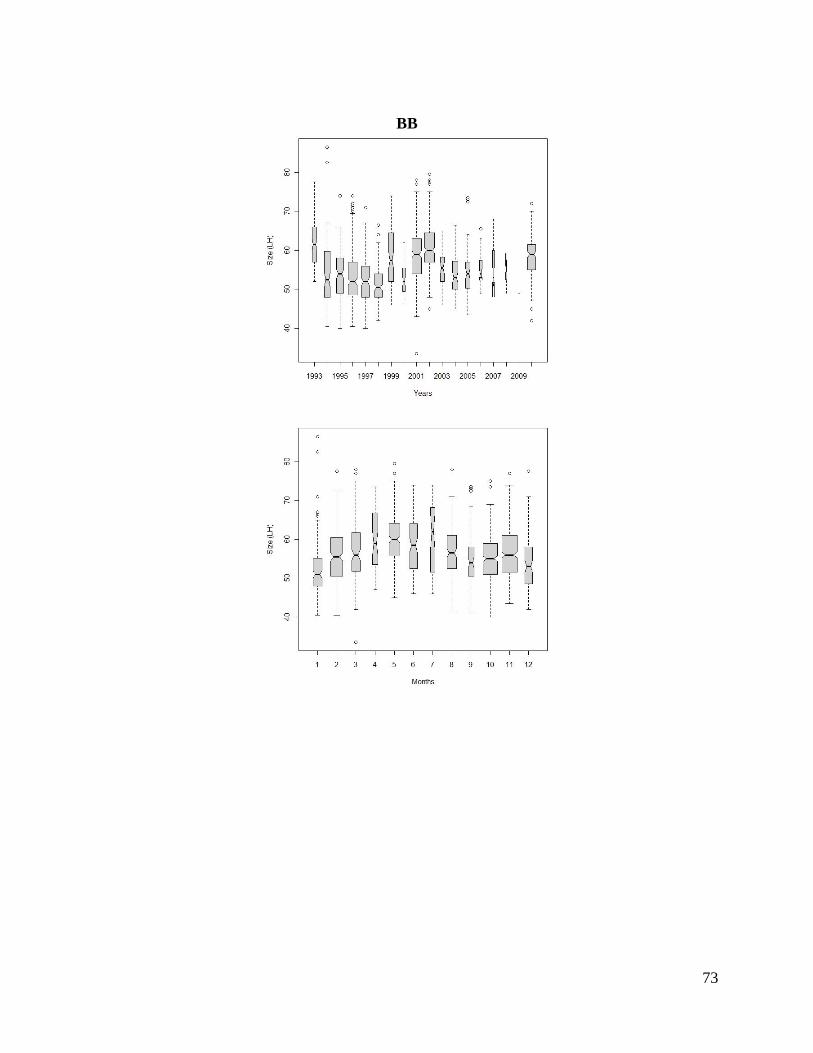
73
BB
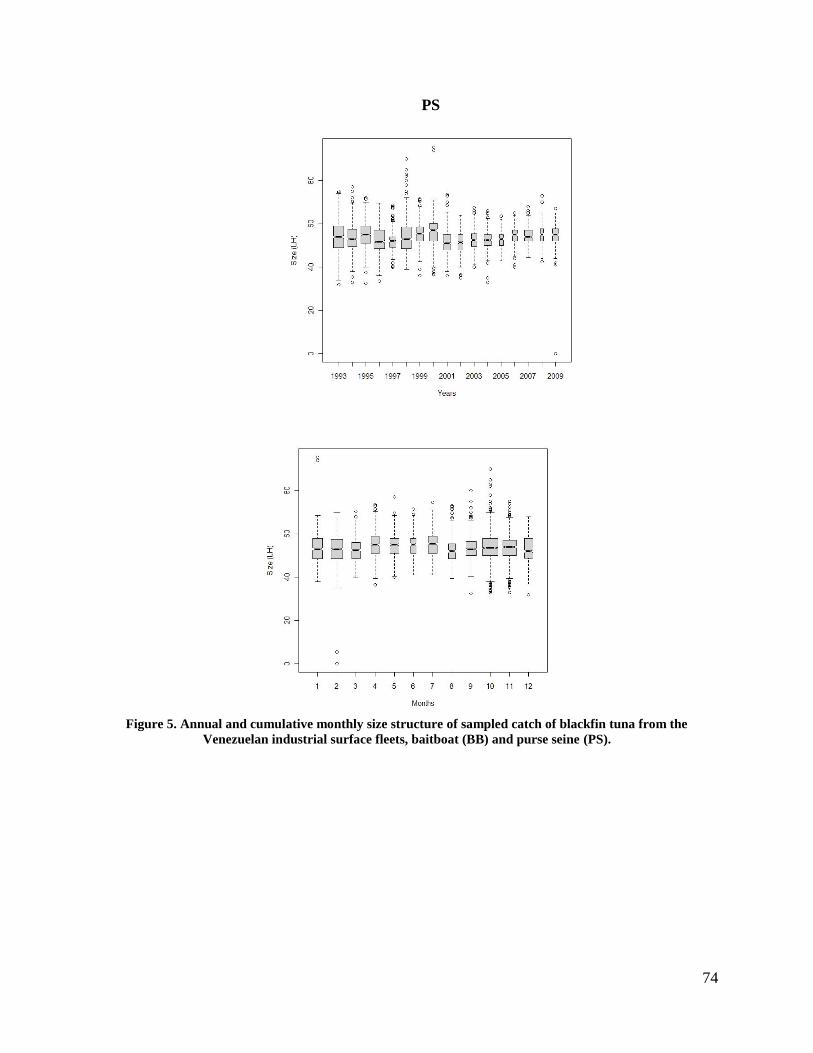
74
PS
Figure 5. Annual and cumulative monthly size structure of sampled catch of blackfin tuna from the
Venezuelan industrial surface fleets, baitboat (BB) and purse seine (PS).
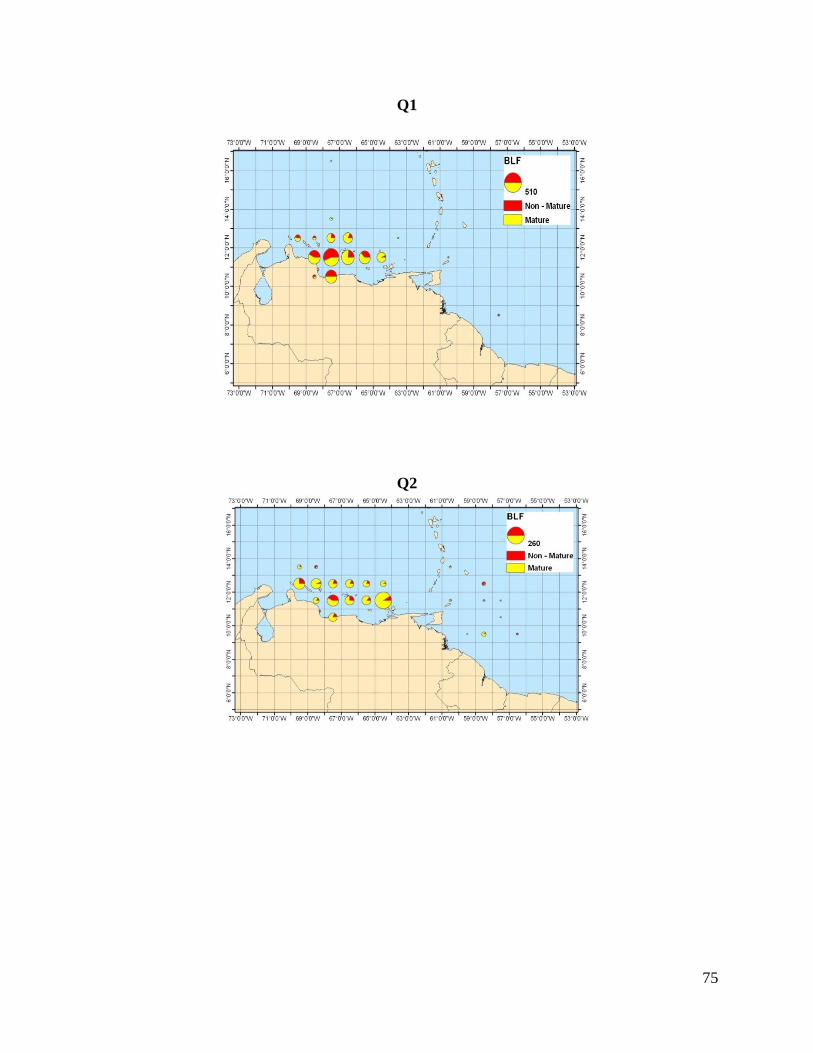
75
Q1
Q2
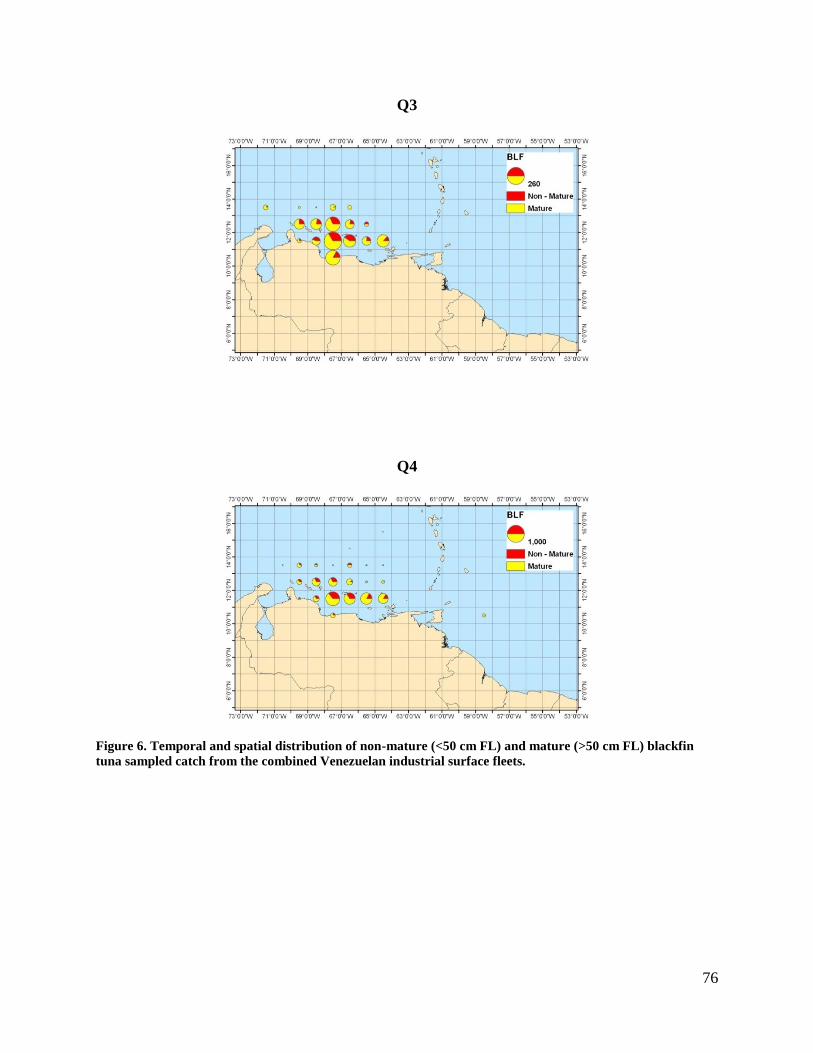
76
Q3
Q4
Figure 6. Temporal and spatial distribution of non-mature (<50 cm FL) and mature (>50 cm FL) blackfin
tuna sampled catch from the combined Venezuelan industrial surface fleets.

1