Embed Size (px)
Citation preview
Proposal for a
National Vehicle
Scrappage Fund
February 2017
2
Summary
The Mayor has made tackling London’s toxic air crisis a top priority. Already, the Mayor has
announced ambitious plans to bring forward the introduction of the Ultra Low Emission
Zone (ULEZ), expand it to the North and South Circular Roads and beyond, and green the
capital’s bus fleet, as well as introduce a new alert system during periods of the worst
pollution.
But the Mayor’s powers have a limit. Diesel cars – many of which were purchased in good
faith – contribute massively to London’s current air pollution (similar to other UK cities).
That’s why without a clear plan to tackle emissions from diesel vehicles, the city’s air will
not improve.
In his manifesto the Mayor committed to put forward a proposal to government for a
National Vehicle Scrappage Fund to support his efforts to improve air quality in the capital;
this is the fulfilment of that commitment.
The proposal is for government to create a National Vehicle Scrappage Fund, which can be
accessed by cities that implement Clean Air Zones. A framework has been created which
can be used by those cities to submit a bid to government to fund their scrappage schemes.
The fund would be used to pay for three key proposals that will help individuals and
businesses least able to afford to comply with the government’s Clean Air Zones and
guarantee reductions in emissions. This will enable the government to have greater
confidence that it will fulfil its legal obligation to comply with European legal pollution
limits as soon as practically possible.
The data currently available is for London; therefore this proposal uses London as an
example city scheme. This package amounts to a maximum total cost of £515 million in
London over a two year period. The cost of other UK cities will be known once the data
becomes available.
Proposal A – payments of £3,500 to scrap up to 70,000 older polluting vans and minibuses
and a national leasing guarantor fund, to support charities and small businesses (total cost
of £245 million in London);
Proposal B – urban ‘mobility credit’ valued at £2,000 to help low income households in
cities scrap up to 130,000 polluting cars (£260 million in London); and
Proposal C – payments of £1,000, in addition to other incentives, to help scrap up to
10,000 older polluting purpose built taxis (£10 million in London).
The cost of these proposals is stated before taking into account industry participation,
which has the scope to make a significant reduction in the amount to be funded by
government. In order to maximise the potential benefit and increase value for money, it’s
key that the manufacturing, leasing and car club sectors work in close partnership with local
authorities to deliver these proposals.
3
The government estimate the financial cost to businesses of implementing Clean Air Zones
to be £851m1 (although this is likely to increase subject to the publication of a new national
air quality plan). A vehicle scrappage scheme rebalances this cost away from the individual
to the general wider population as a whole – unlocking significant emission reductions while
reducing the cost for those least able to afford the changes, such as small businesses,
charities, schools and low income households. This is in addition to the estimated annual
economic cost of the health impacts associated with long term exposure to poor air quality,
which is estimated to be up to £3.7billion2 in London alone.
This proposal does not seek to replicate the scrappage model that operated from 2009. We
have deliberately sought to address the challenges faced by government in implementing
previous schemes. It adopts a targeted, city-led, time-limited approach which is expected
to minimise risks and simplify administration for government and, in doing so, provide
greater assurance that the UK will achieve compliance with legal limits for nitrogen dioxide
(NO2).
Ridding our city of the most polluting vehicles will make a real difference to air quality. But
the national system of Vehicle Excise Duty still incentivises people to buy diesel vehicles.
Nearly half of new car sales in the UK are diesel vehicles. It is only right that government
review this policy immediately in order to incentivise the buying of cleaner vehicles.
This proposal shows that a National Vehicle Scrappage Fund can be delivered in a cost
effective way that helps achieve broader government policy including promoting sustainable
transport as well as positioning the UK as a world leader in cleaner vehicles as set out in the
government’s own industrial strategy. The influence that individual UK cities have on the
new vehicle market is limited, so it is only by the government working with the UK’s local
authorities and Mayors that we can tackle this problem.
1 Net Direct Cost to Business over 10 years is £851m, this uses a 2016 price base and a 2020 Present Value Base Year.
Source – Defra Impact Assessment (26th May 2016) – “Committed Clean Air Zone Impact Assessment” 2 Kings College London, 2015 http://www.kcl.ac.uk/lsm/research/divisions/aes/research/ERG/research-
projects/HIAinLondonKingsReport14072015final.pdf
4
1. The case for a National Vehicle
Scrappage Fund
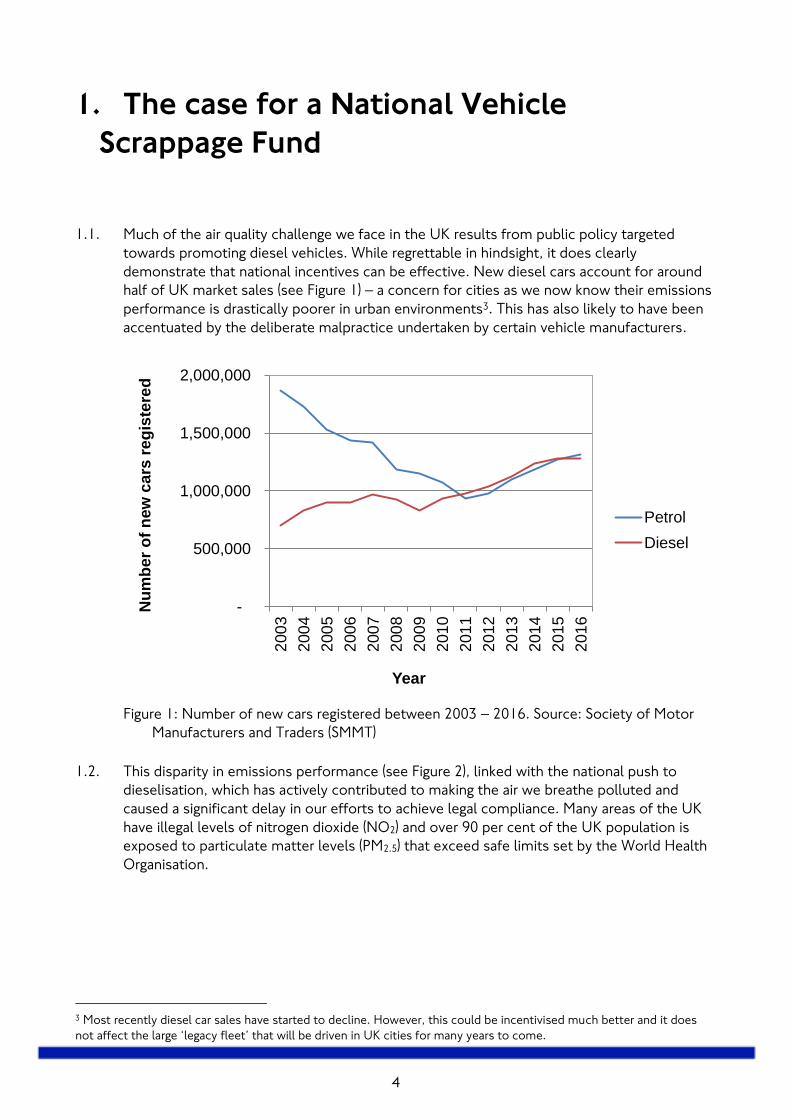
1.1. Much of the air quality challenge we face in the UK results from public policy targeted
towards promoting diesel vehicles. While regrettable in hindsight, it does clearly
demonstrate that national incentives can be effective. New diesel cars account for around
half of UK market sales (see Figure 1) – a concern for cities as we now know their emissions
performance is drastically poorer in urban environments3. This has also likely to have been
accentuated by the deliberate malpractice undertaken by certain vehicle manufacturers.
Figure 1: Number of new cars registered between 2003 – 2016. Source: Society of Motor
Manufacturers and Traders (SMMT)
1.2. This disparity in emissions performance (see Figure 2), linked with the national push to
dieselisation, which has actively contributed to making the air we breathe polluted and
caused a significant delay in our efforts to achieve legal compliance. Many areas of the UK
have illegal levels of nitrogen dioxide (NO2) and over 90 per cent of the UK population is
exposed to particulate matter levels (PM2.5) that exceed safe limits set by the World Health
Organisation.
3 Most recently diesel car sales have started to decline. However, this could be incentivised much better and it does
not affect the large ‘legacy fleet’ that will be driven in UK cities for many years to come.
-
500,000
1,000,000
1,500,000
2,000,000
200
3
200
4
200
5
200
6
200
7
200
8
200
9
201
0
201
1
201
2
201
3
201
4
201
5
201
6
Nu
mb
er
of
ne
w c
ars
re
gis
tere
d
Year
Petrol
Diesel
5
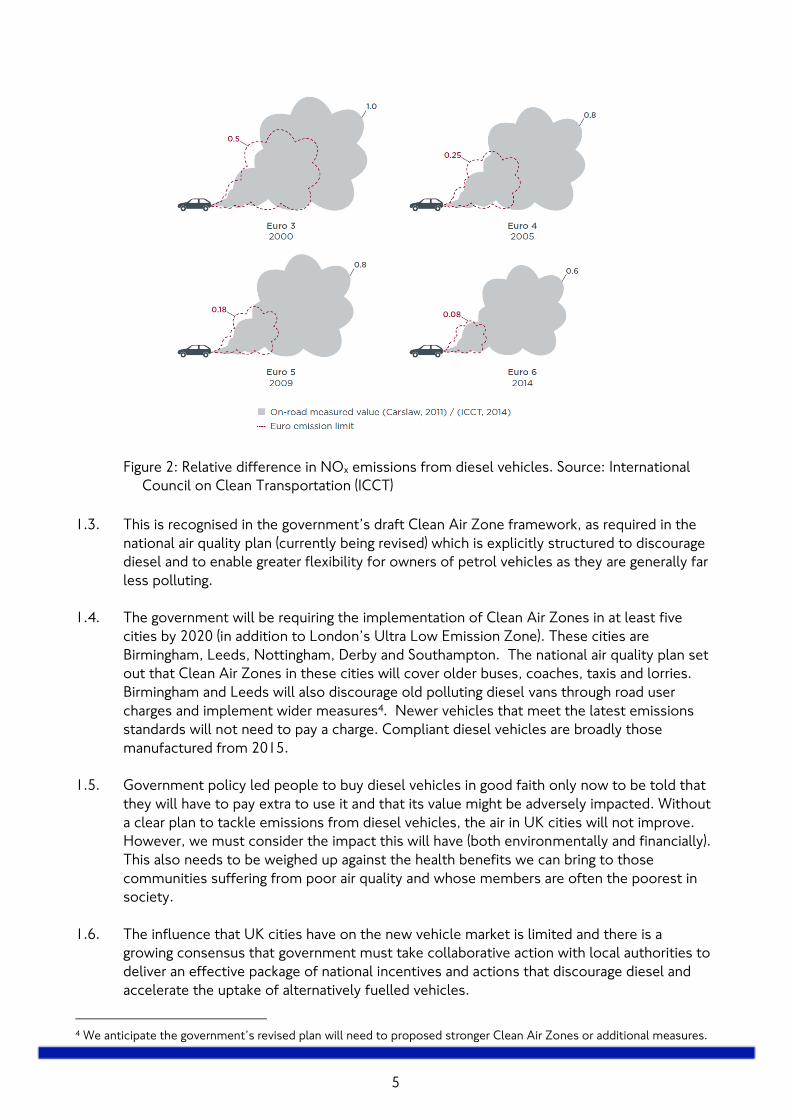
Figure 2: Relative difference in NOx emissions from diesel vehicles. Source: International
Council on Clean Transportation (ICCT)
1.3. This is recognised in the government’s draft Clean Air Zone framework, as required in the
national air quality plan (currently being revised) which is explicitly structured to discourage
diesel and to enable greater flexibility for owners of petrol vehicles as they are generally far
less polluting.
1.4. The government will be requiring the implementation of Clean Air Zones in at least five
cities by 2020 (in addition to London’s Ultra Low Emission Zone). These cities are
Birmingham, Leeds, Nottingham, Derby and Southampton. The national air quality plan set
out that Clean Air Zones in these cities will cover older buses, coaches, taxis and lorries.
Birmingham and Leeds will also discourage old polluting diesel vans through road user
charges and implement wider measures4. Newer vehicles that meet the latest emissions
standards will not need to pay a charge. Compliant diesel vehicles are broadly those
manufactured from 2015.
1.5. Government policy led people to buy diesel vehicles in good faith only now to be told that
they will have to pay extra to use it and that its value might be adversely impacted. Without
a clear plan to tackle emissions from diesel vehicles, the air in UK cities will not improve.
However, we must consider the impact this will have (both environmentally and financially).
This also needs to be weighed up against the health benefits we can bring to those
communities suffering from poor air quality and whose members are often the poorest in
society.
1.6. The influence that UK cities have on the new vehicle market is limited and there is a
growing consensus that government must take collaborative action with local authorities to
deliver an effective package of national incentives and actions that discourage diesel and
accelerate the uptake of alternatively fuelled vehicles.
4 We anticipate the government’s revised plan will need to proposed stronger Clean Air Zones or additional measures.
6
1.7. Crucially, a National Vehicle Scrappage Fund would be an important part of such a package.
The extent to which targeted schemes can be taken forward is driven by the financial
support available from government. It could enable more ambitious or quicker
implementation of Clean Air Zones by mitigating the financial impact of these interventions
on individual vehicle owners, including London’s Ultra Low Emission Zone. It would help
individuals and businesses least able to comply with the necessary vehicle emissions
standards and guarantee reductions in emissions.
1.8. To be successful, targeted scrappage schemes would require a committed level of national
funding made to cities. However, it is our intention that, through a targeted approach and
reliance on external contributions to cost (eg from industry), the fund would demonstrate
value for money by minimising the net cost to government. Likewise, the fund would need
to be accompanied by bold and effective policies at a city level, such as the Clean Air
Zones. Only through concerted and coordinated action at all levels of government can the
legal requirement to comply with NO2 limits be achieved.
7
2. Support for scrappage
2.1. The proposal for a National Vehicle Scrappage Fund has been put forward in a number of
different iterations over the past few years as a means to improve air quality in the UK.
Most notably, in 2014, the RAC Foundation and the Environment Audit Committee
recommended that the government should consider a national vehicle scrappage scheme to
deal with the problem of existing diesel vehicles56.
2.2. This view was later endorsed by leading think tanks Policy Exchange and the Institute for
Public Policy Research in both their reports on recommended measures to clean up
London’s air, published in 201678. However, it is widely accepted that a scrappage scheme
needs to be targeted in order to ensure value for money and the necessary emissions
reductions are secured.
2.3. In summer 2016, the Mayor held a consultation on a number of proposals to improve air
quality in London much sooner than planned. Over two thirds of Londoners responded in
favour of his proposal for a National Vehicle Scrappage Fund, alongside a wide variety of
stakeholders as part of a recent consultation undertaken by TfL, including Greenpeace,
Federation of Small Businesses, Freight Transport Association, London Councils, New West
End Company, Private Hire Board, Royal Mail Group and several London boroughs.
5 http://www.racfoundation.org/media-centre/dealing-with-poor-air-quality-time-ditch-dirty-diesel-press-release 6 http://www.parliament.uk/documents/commons-committees/environmental-audit/HC-212-for-web.pdf 7 https://policyexchange.org.uk/publication/up-in-the-air-how-to-solve-londons-air-quality-crisis-part-2/ 8 http://www.ippr.org/publications/lethal-and-illegal-londons-air-pollution-crisis
8
3. Learning from past scrappage schemes
3.1. Scrappage schemes were introduced in 13 EU countries in 2009, the majority of which
aimed to support the automotive industry during the financial crisis. Such incentives had
been widely implemented previously as well, driven by environmental objectives and/or
generating improvements in road safety.
3.2. Our research has followed an approach carried out by Leheyda & Verboven (2013) and
focused on schemes undertaken in Belgium, France, Germany, Greece, Italy, the
Netherlands, Portugal, Spain and the UK, which combined represent 90% of the car sales in
the EU (Belgium did not introduce a scrapping scheme in 2009 but is used as a control
country to frame the analysis on change in sales from the scrapping policies.)
3.3. Most of these schemes were designed as “cash-for-replacement”, providing a bonus
conditional on a specific kind of replacement, typically a new or younger (more fuel-
efficient) model. However, incentives introduced by Greece and the Netherlands could be
categorised as “cash-for-scrappage” schemes, that did not impose any condition on the age
of a replacement car and/ or obligation to purchase a replacement car (although Greece
permitted both types of schemes).
3.4. The budget for each scheme varied considerably between countries and incentives were
typically financed by national government departments alongside contributions from
industry (e.g. 50:50 incentive in the UK). Importantly, the main impact of these schemes
was in terms of temporarily stabilising car sales, particularly in countries with targeted
schemes: without the schemes in 2009, total sales would have been 17.4 per cent lower in
countries with targeted schemes and 14.8 per cent lower in countries with non-targeted
schemes. Further information can be found in Appendix 1.
3.5. It is important to note that this proposal does not seek to replicate the scrappage model
that operated from 2009. We are aware of the administrative and other challenges faced by
the government in implementing this scheme. As is set out in the following chapters, our
proposal adopts a targeted, city-led, time-limited approach which is expected to minimise
these risks and simplify administration for government.
9
4. A national framework
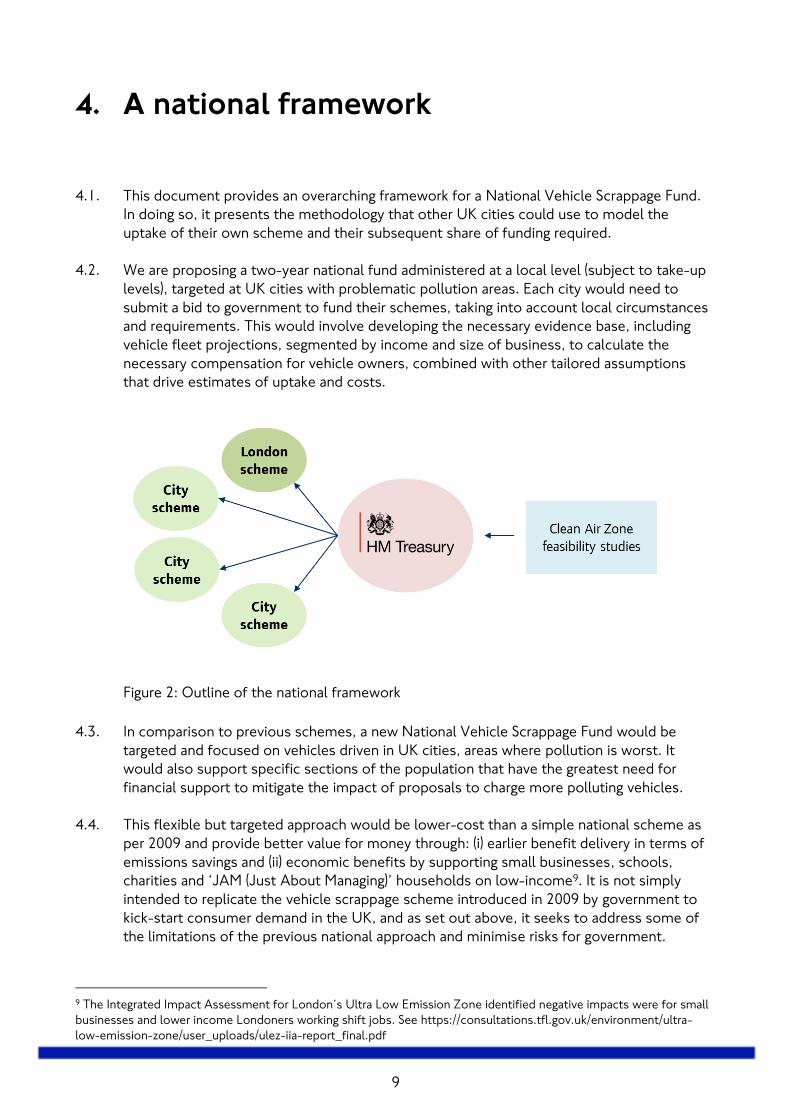
4.1. This document provides an overarching framework for a National Vehicle Scrappage Fund.
In doing so, it presents the methodology that other UK cities could use to model the
uptake of their own scheme and their subsequent share of funding required.
4.2. We are proposing a two-year national fund administered at a local level (subject to take-up
levels), targeted at UK cities with problematic pollution areas. Each city would need to
submit a bid to government to fund their schemes, taking into account local circumstances
and requirements. This would involve developing the necessary evidence base, including
vehicle fleet projections, segmented by income and size of business, to calculate the
necessary compensation for vehicle owners, combined with other tailored assumptions
that drive estimates of uptake and costs.
Figure 2: Outline of the national framework
4.3. In comparison to previous schemes, a new National Vehicle Scrappage Fund would be
targeted and focused on vehicles driven in UK cities, areas where pollution is worst. It
would also support specific sections of the population that have the greatest need for
financial support to mitigate the impact of proposals to charge more polluting vehicles.
4.4. This flexible but targeted approach would be lower-cost than a simple national scheme as
per 2009 and provide better value for money through: (i) earlier benefit delivery in terms of
emissions savings and (ii) economic benefits by supporting small businesses, schools,
charities and ‘JAM (Just About Managing)’ households on low-income9. It is not simply
intended to replicate the vehicle scrappage scheme introduced in 2009 by government to
kick-start consumer demand in the UK, and as set out above, it seeks to address some of
the limitations of the previous national approach and minimise risks for government.
9 The Integrated Impact Assessment for London’s Ultra Low Emission Zone identified negative impacts were for small
businesses and lower income Londoners working shift jobs. See https://consultations.tfl.gov.uk/environment/ultra-
low-emission-zone/user_uploads/ulez-iia-report_final.pdf
10
4.5. This means helping people to comply with new Clean Air Zones and removing older,
polluting vehicles from the UK’s most polluted towns and cities, based on three principles:
Mitigate the financial impact of Clean Air Zones, particularly on those
disproportionately affected;
Target businesses and residents of cities with the worst pollution; and
Accelerate the pace of emissions savings.
4.6. In doing so, we will help to secure the reduction in emissions necessary for the government
to meet air quality limits as soon as possible.
4.7. Our proposal for a national framework is underpinned by a high level model that other cities
are able to use and input into. The modelling provided in this proposal only covers London
as it has not been possible to source the required data from the other Clean Air Zone cities
in our timescales.
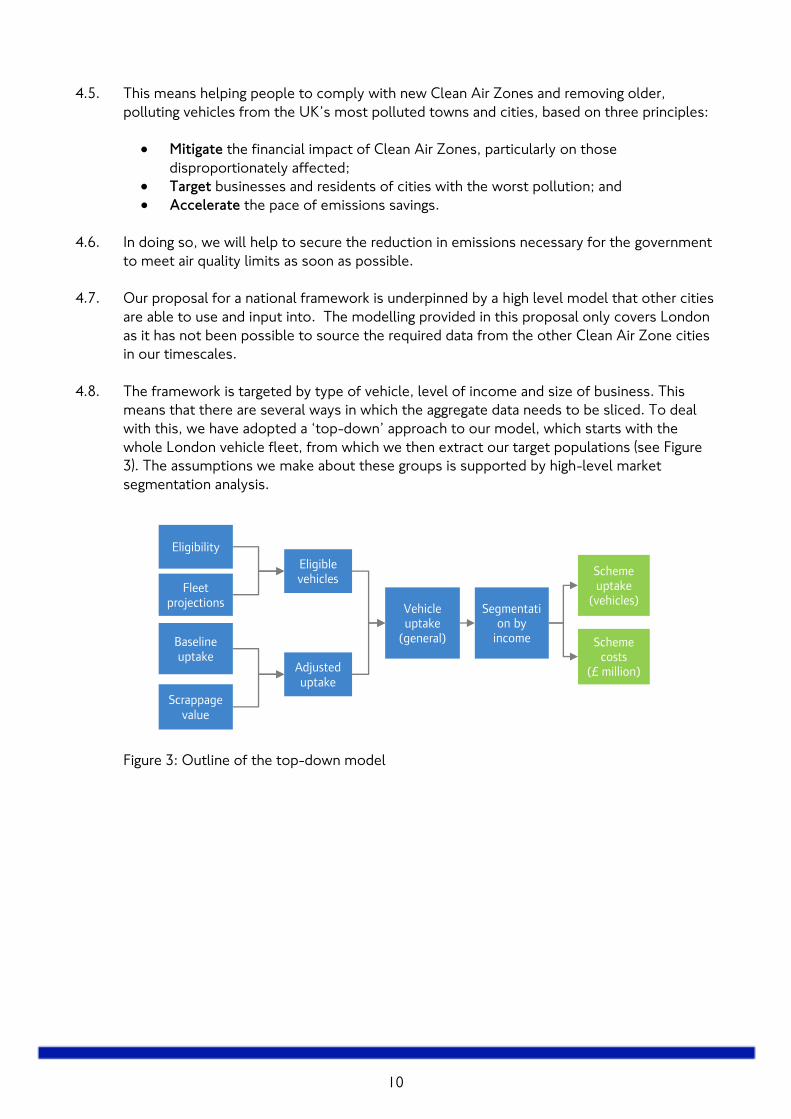
4.8. The framework is targeted by type of vehicle, level of income and size of business. This
means that there are several ways in which the aggregate data needs to be sliced. To deal
with this, we have adopted a ‘top-down’ approach to our model, which starts with the
whole London vehicle fleet, from which we then extract our target populations (see Figure
3). The assumptions we make about these groups is supported by high-level market
segmentation analysis.
Figure 3: Outline of the top-down model
Vehicle uptake
(general)
Segmentation by
income
Eligible vehicles
Eligibility
Fleet projections
Baseline uptake
Scrappage value
Adjusted uptake
Scheme uptake
(vehicles)
Scheme costs
(£ million)
11
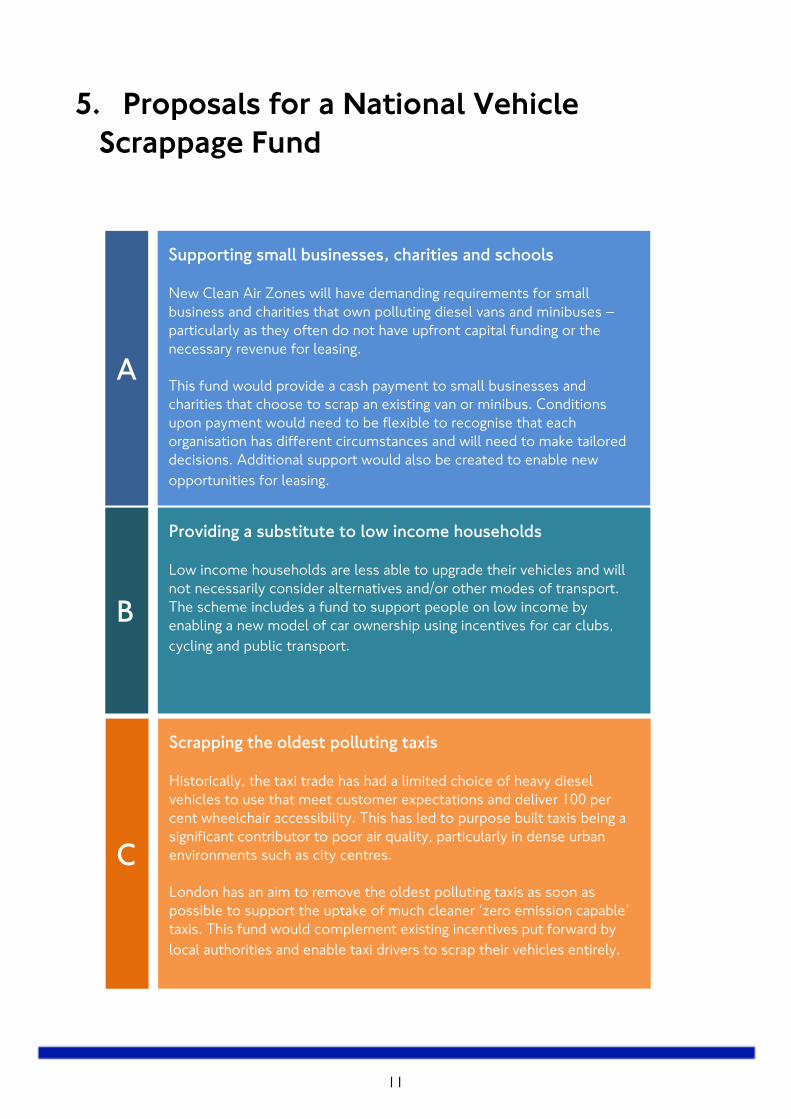
5. Proposals for a National Vehicle
Scrappage Fund
Supporting small businesses, charities and schools
New Clean Air Zones will have demanding requirements for small
business and charities that own polluting diesel vans and minibuses –
particularly as they often do not have upfront capital funding or the
necessary revenue for leasing.
This fund would provide a cash payment to small businesses and
charities that choose to scrap an existing van or minibus. Conditions
upon payment would need to be flexible to recognise that each
organisation has different circumstances and will need to make tailored
decisions. Additional support would also be created to enable new
opportunities for leasing.
A
Scrapping the oldest polluting taxis
Historically, the taxi trade has had a limited choice of heavy diesel
vehicles to use that meet customer expectations and deliver 100 per
cent wheelchair accessibility. This has led to purpose built taxis being a
significant contributor to poor air quality, particularly in dense urban
environments such as city centres.
London has an aim to remove the oldest polluting taxis as soon as
possible to support the uptake of much cleaner ‘zero emission capable’
taxis. This fund would complement existing incentives put forward by
local authorities and enable taxi drivers to scrap their vehicles entirely.
C
Providing a substitute to low income households
Low income households are less able to upgrade their vehicles and will
not necessarily consider alternatives and/or other modes of transport.
The scheme includes a fund to support people on low income by
enabling a new model of car ownership using incentives for car clubs,
cycling and public transport.
B
12
6. Proposal A: A national fund to support
small businesses, charities and schools
6.1. The use of light commercial vehicles has been increasing in absolute terms and as a
proportion of total traffic in UK cities over recent years, particularly owing to an increased
demand from e-commerce.
6.2. In 2014, the RAC Foundation estimated around one in ten of all vehicles on the UK’s roads
is a van, with van traffic predicted to double by 204010. This trend has been seen in London,
where vans were responsible for 14 per cent of kilometres travelled by all motorised road
vehicles in 2015, compared to 10 per cent in 1993.
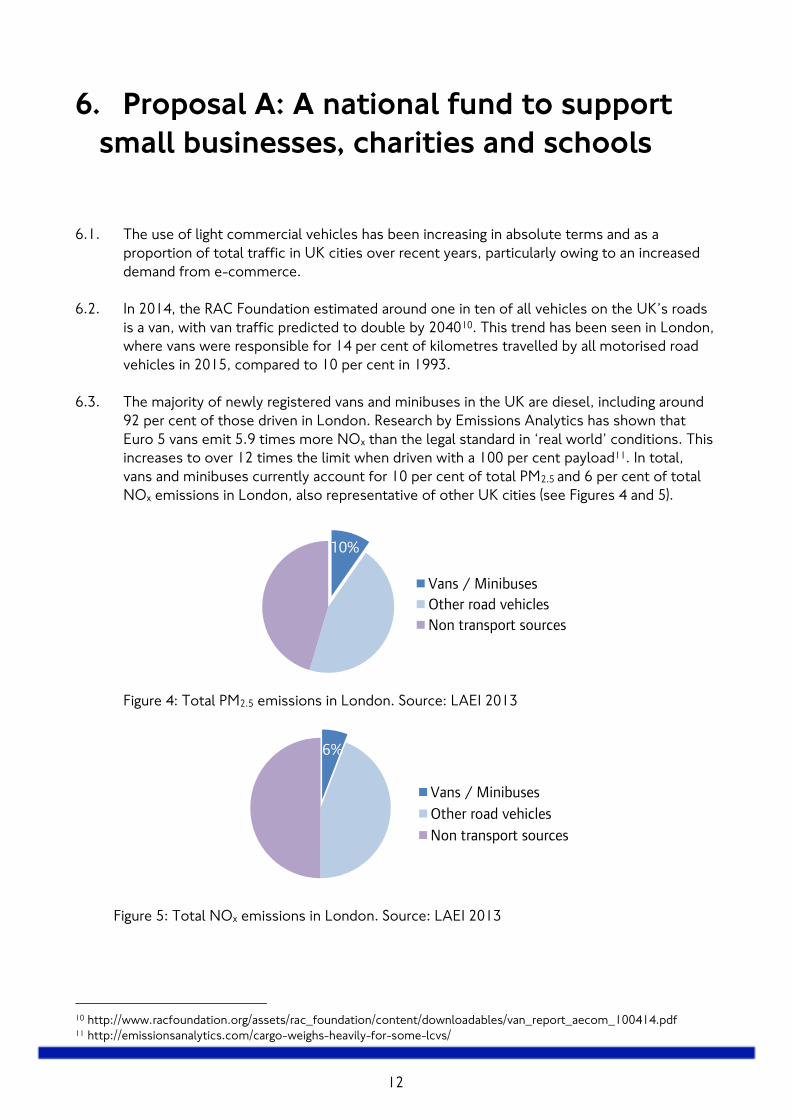
6.3. The majority of newly registered vans and minibuses in the UK are diesel, including around
92 per cent of those driven in London. Research by Emissions Analytics has shown that
Euro 5 vans emit 5.9 times more NOx than the legal standard in ‘real world’ conditions. This
increases to over 12 times the limit when driven with a 100 per cent payload11. In total,
vans and minibuses currently account for 10 per cent of total PM2.5 and 6 per cent of total
NOx emissions in London, also representative of other UK cities (see Figures 4 and 5).
Figure 4: Total PM2.5 emissions in London. Source: LAEI 2013
Figure 5: Total NOx emissions in London. Source: LAEI 2013
10 http://www.racfoundation.org/assets/rac_foundation/content/downloadables/van_report_aecom_100414.pdf 11 http://emissionsanalytics.com/cargo-weighs-heavily-for-some-lcvs/
10%
Vans / Minibuses
Other road vehicles
Non transport sources
6%
Vans / Minibuses
Other road vehicles
Non transport sources
13
6.4. Vans are often relied on by small businesses as an essential vehicle and primarily used for
commercial activity, with small profit margins. Minibuses are often an essential vehicle for
charities that transport people and enable them to live independently, participate in their
community and to access education, employment, health and other services. It is often less
plausible to switch to walking, cycling and public transport, which means road charges have
a material effect on the affordability of running these services.
6.5. The government’s draft Clean Air Zone framework proposes that only the latest Euro 6
diesel vans and minibuses are allowed to be driven in a number of UK cities without
incurring a charge. The Euro 6 vehicle emission standard has been required for newly
registered vans and minibuses since September 2016 (2015 for new models). Overall,
average NOx emissions from Euro 6 vans are down 35 per cent compared to Euro 512.
6.6. Owing to the timescales, there is likely only to be a limited, cheaper, second-hand market
of Euro 6 vans when the Government’s Clean Air Zones are introduced by 2020. This is
particularly as the leasing market contributes heavily to the second-hand van market,
renewing up to a third of its vehicles each year, with a typical lease lasting between 4-5
years.
6.7. It is estimated around 55 per cent of vans and minibuses driven in London on an average
day in 2019 would not comply with Euro 6 standards13. A National Vehicle Scrappage Fund
is therefore proposed to help small businesses and charities bridge the gap to either buy a
second-hand Euro 6 compliant vehicle or lease a compliant vehicle, depending on individual
circumstances. The van and minibus market is quite specialised and they typically have
rapid depreciation, which means uptake could be strong depending on the exact value of
compensation.
Scrappage payment fund
6.8. We have calculated that a payment of £3,500 in exchange for scrapping a pre-Euro 6 diesel
van would help to bridge the gap for small businesses and charities and provide fair
compensation required to scrap an existing van to then purchase a compliant vehicle. Take-
up assumptions apply to vans and small businesses, however, we believe this can also be
applied to include minibuses for schools and charities.
6.9. This amount has been calculated based on the cost of a second-hand compliant vehicle net
of savings made by avoiding Clean Air Zone charges and the scrap value of the vehicle. We
assume that regardless of age, vehicle owners will always get an end-of-life value from a
dealer when they scrap their vehicle on top of the cash incentive payment14. Eligibility of
the organisation would be addressed via existing mechanisms, such as payroll and tax
status.
12 Taken from results as part of the Emissions Analytics van testing programme 13 https://consultations.tfl.gov.uk/environment/air-quality-consultation-phase-2/user_uploads/consultation-
information-document.pdf-1 14 The end of life value for vans is based on an analysis of depreciation provided by Parkers
14
6.10. The model developed by Cambridge Economic Policy Associates (CEPA), on behalf of
Transport for London, has been designed to enable each city region to input analysis from
their Clean Air Zone feasibility studies. It provides a template for development in other
cities but is currently designed for London. The policies introduced elsewhere are likely to
be specific so the model will need some development for each city. This then provides a
‘bid’ with an evidence base into a national fund based on local circumstances.
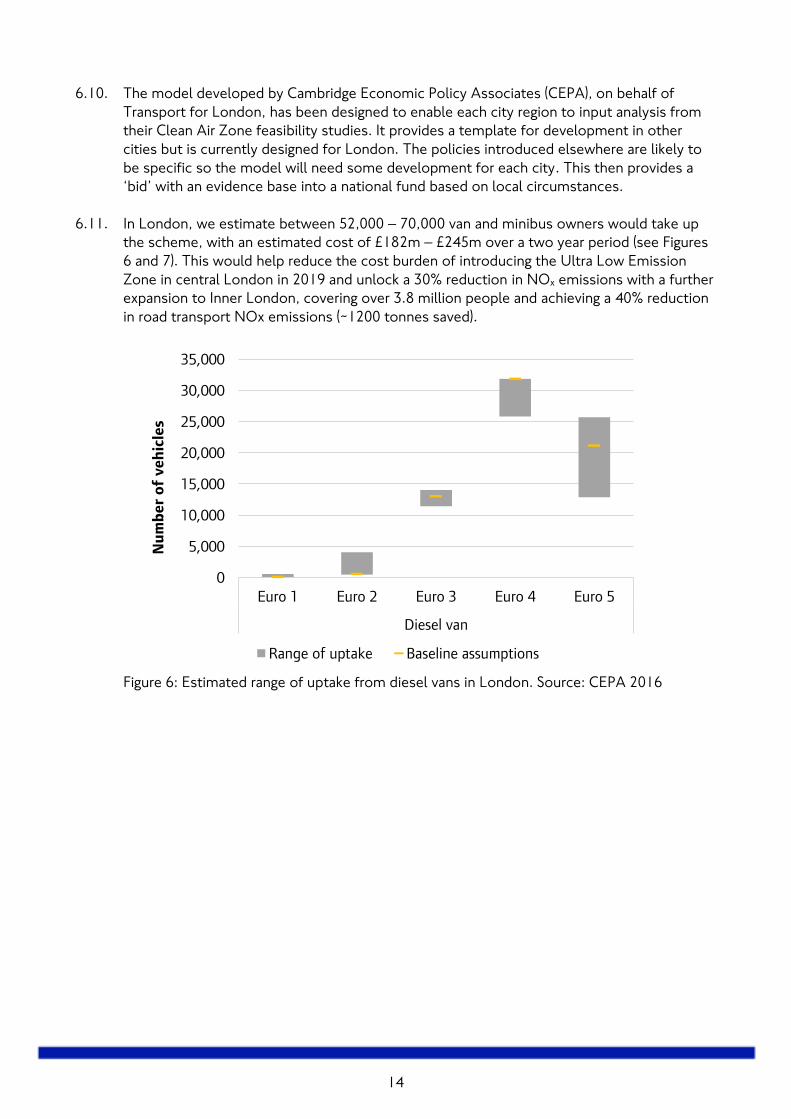
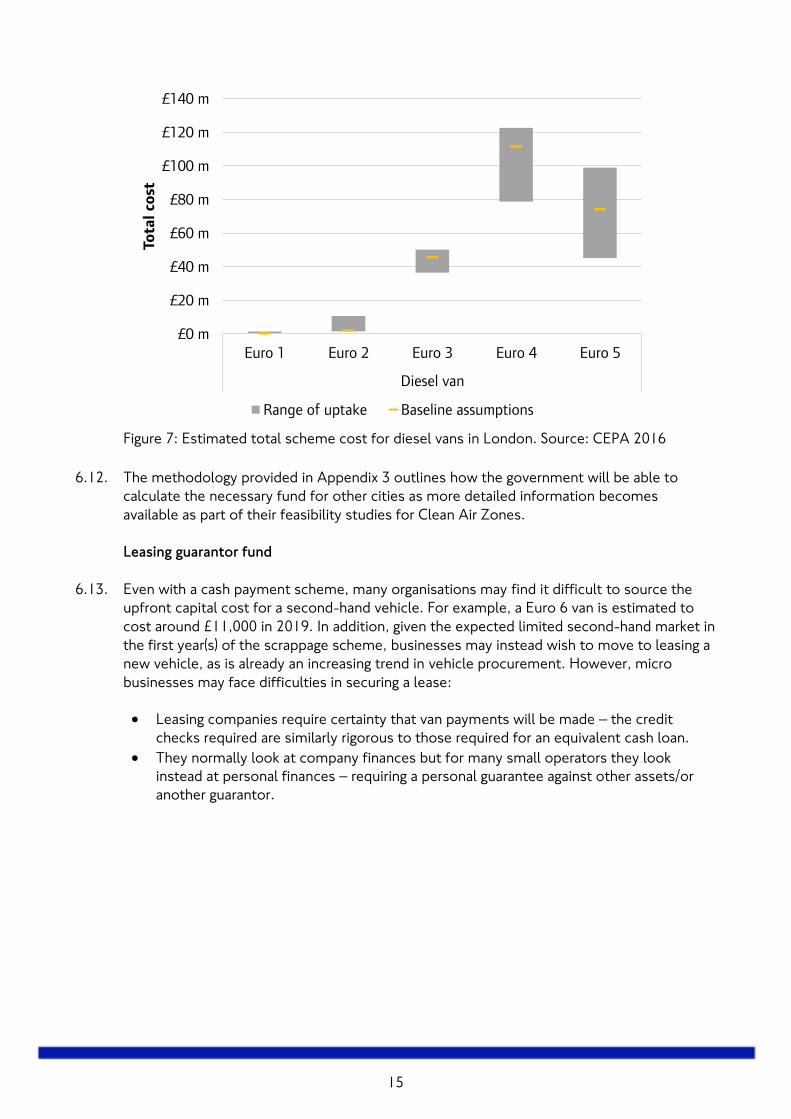
6.11. In London, we estimate between 52,000 – 70,000 van and minibus owners would take up
the scheme, with an estimated cost of £182m – £245m over a two year period (see Figures
6 and 7). This would help reduce the cost burden of introducing the Ultra Low Emission
Zone in central London in 2019 and unlock a 30% reduction in NOx emissions with a further
expansion to Inner London, covering over 3.8 million people and achieving a 40% reduction
in road transport NOx emissions (~1200 tonnes saved).
Figure 6: Estimated range of uptake from diesel vans in London. Source: CEPA 2016
0
5,000
10,000
15,000
20,000
25,000
30,000
35,000
Euro 1 Euro 2 Euro 3 Euro 4 Euro 5
Diesel van
Nu
mb
er
of
veh
icle
s
Range of uptake Baseline assumptions
15
Figure 7: Estimated total scheme cost for diesel vans in London. Source: CEPA 2016
6.12. The methodology provided in Appendix 3 outlines how the government will be able to
calculate the necessary fund for other cities as more detailed information becomes
available as part of their feasibility studies for Clean Air Zones.
Leasing guarantor fund
6.13. Even with a cash payment scheme, many organisations may find it difficult to source the
upfront capital cost for a second-hand vehicle. For example, a Euro 6 van is estimated to
cost around £11,000 in 2019. In addition, given the expected limited second-hand market in
the first year(s) of the scrappage scheme, businesses may instead wish to move to leasing a
new vehicle, as is already an increasing trend in vehicle procurement. However, micro
businesses may face difficulties in securing a lease:
Leasing companies require certainty that van payments will be made – the credit
checks required are similarly rigorous to those required for an equivalent cash loan.
They normally look at company finances but for many small operators they look
instead at personal finances – requiring a personal guarantee against other assets/or
another guarantor.
£0 m
£20 m
£40 m
£60 m
£80 m
£100 m
£120 m
£140 m
Euro 1 Euro 2 Euro 3 Euro 4 Euro 5
Diesel van
To
tal co
st
Range of uptake Baseline assumptions
16
6.14. It will therefore be important to address the creditworthiness issue if the leasing market is
to become a reliable alternative option for micro businesses. Payments to van owners could
help reduce monthly leasing payments but there is also an opportunity (and appetite from
industry) to create an insurance product that could be funded from the payment and/ or
fund a form of limited guarantee scheme. This could be run alongside the cash payment
scheme with further support for charities and small businesses willing to enter into new
leasing arrangements.
6.15. Discussions with the British Vehicle Rental & Leasing Association have identified an
opportunity to explore a leasing guarantor fund, with the financial underpinning of
government. This would have the potential to satisfy the Financial Conduct Authority to
issue credit to small businesses which could not normally have access to this finance, as
the leasing payments would be guaranteed by the fund. As this fund is predicated on
financial risk then there would be less demand on upfront capital investment by
government.
Fleet renewal fund
6.16. A National Vehicle Scrappage Fund should also maximise the opportunity to support the
uptake of ultra low emission vehicles and particularly new products requiring an economic
stimulus, such as plug-in hybrid vans and minibuses.
6.17. The government might also consider the interaction between the scrappage payment and
plug-in van grants and what additional incentives could be put in place to help switch to
much cleaner vehicles. Support could be provided that is less reliant on the scrapping of a
vehicle but rather fleet growth and/or trialling new cleaner vehicles in city centres, including
measures to break down barriers related to charging infrastructure. However, this would not
be a substitute for the scrappage payment, nor explicitly linked as a condition for payment
as businesses will require flexibility.
17
7. Proposal B: A national fund to support
low income households
7.1. Analysis carried out on behalf of the Greater London Authority and published in 2016
shows the health effects of air pollution are seen disproportionately in the most vulnerable
and deprived communities. Among the top 10 per cent of London’s most deprived areas,
half have NO2 levels exceeding legal limits. For the 10 per cent least deprived areas, only
one per cent experience illegal NO2 concentrations.
7.2. An expanded Ultra Low Emission Zone to Inner London would affect around 3.8 million
people in London. The more deprived areas in this area also correspond with those where
the average compliance of cars is lower. Around 65 per cent to 70 per cent of cars
registered in deprived areas are expected to comply with the emission standards, when
compared to the overall average of around 75 per cent.
7.3. Other research has indicated that past incentive schemes (eg grants from the Office for Low
Emission Vehicles) don’t often reach lower income sectors of the community. This
proposal is aiming to support those who are materially adversely affected by Clean Air
Zones.
7.4. When developing a scheme to support low income households, we also need to take into
account the significant value that car owners place on their vehicle and that they are willing
to bear the high cost of ownership (eg because it is a true necessity, or through lifestyle
choice or even inertia).
7.5. This unfortunately means that many low-income households would consider paying Clean
Air Zone charges despite pressure on finances. This proposal focuses on a national fund to
support low income households to scrap their car and to encourage mode-shift to public
transport and shared car ownership. For example, credit towards public transport, cycle hire
and car club or car rental schemes – a ‘mobility package’.
7.6. Limiting the availability of a payment to car owners in low income households reduces
overall scheme cost because a national scheme for car owners would be prohibitively
expensive and unwarranted. It would also reduce levels of car ownership and potentially
boost both public transport use and car club use in areas where they are needed most (ie
cities). However, we accept it is more difficult to clearly identify the target group – some
form of means test may be required. We have defined this as households with income
below 60 per cent of the median income after housing costs.
18
7.7. Based on London’s Poverty Profile 2015, we have calculated that 27 per cent of households
in London are low-income15. In the base case we assume this share is constant across Euro
standards but we note this is unlikely to be the case. We conducted sensitivities around this
to reflect our hypothesis that low-income households may on average own older vehicles,
but may also own fewer cars than other income groups.
7.8. Our results indicate that a ‘mobility credit’ valued at £2,000 could be effective at
encouraging low income households to scrap their car. This amount takes into account the
value of cycle hire membership, car rental/hire costs and public transport fares. This is
catered to costs in London and would need to be refined for other cities.
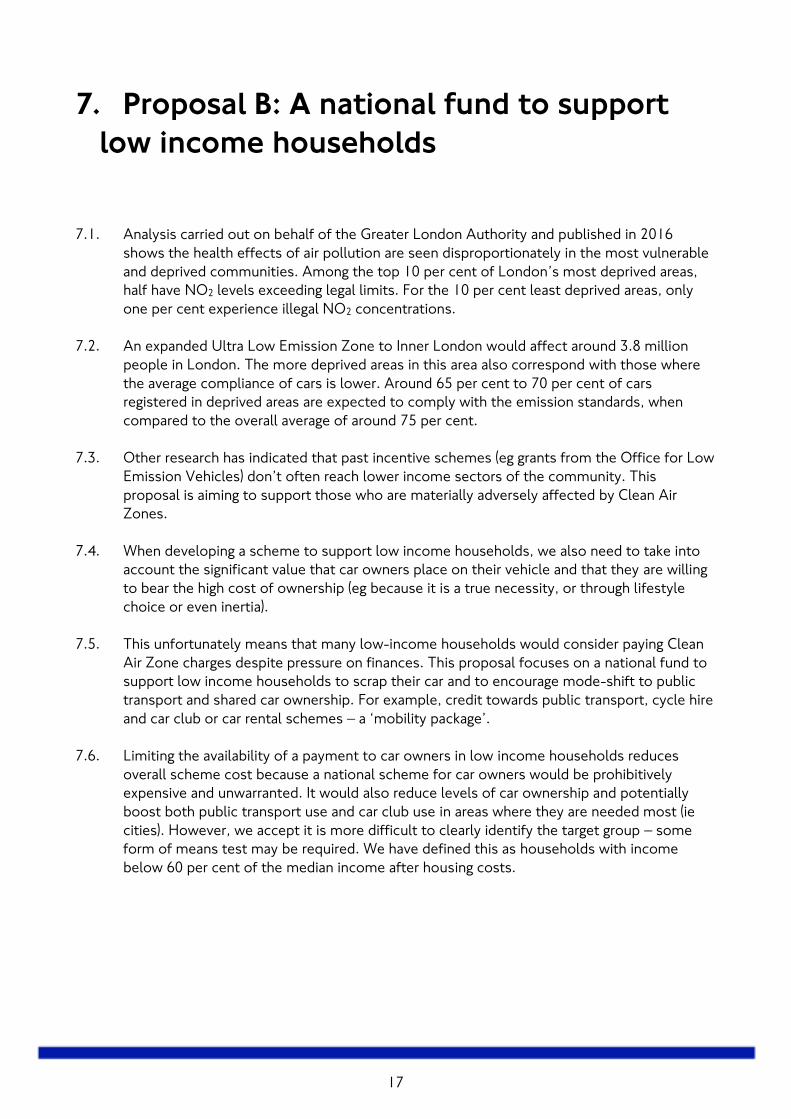
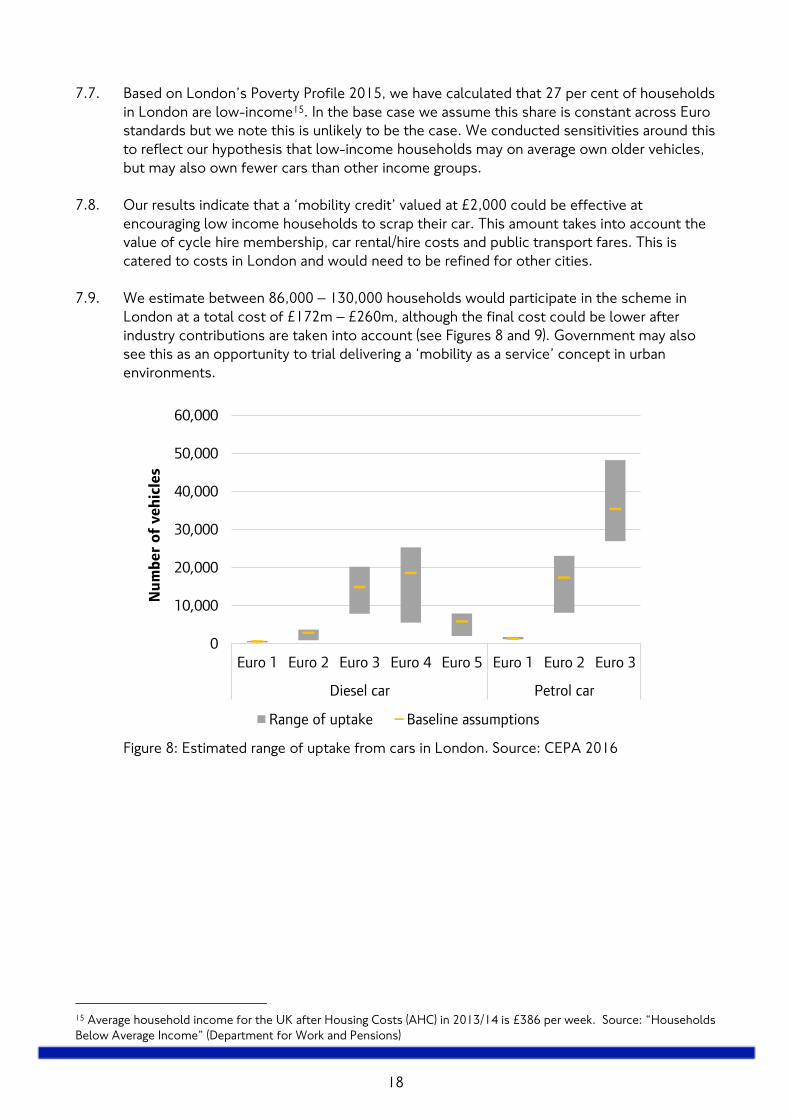
7.9. We estimate between 86,000 – 130,000 households would participate in the scheme in
London at a total cost of £172m – £260m, although the final cost could be lower after
industry contributions are taken into account (see Figures 8 and 9). Government may also
see this as an opportunity to trial delivering a ‘mobility as a service’ concept in urban
environments.
Figure 8: Estimated range of uptake from cars in London. Source: CEPA 2016
15 Average household income for the UK after Housing Costs (AHC) in 2013/14 is £386 per week. Source: “Households
Below Average Income” (Department for Work and Pensions)
0
10,000
20,000
30,000
40,000
50,000
60,000
Euro 1 Euro 2 Euro 3 Euro 4 Euro 5 Euro 1 Euro 2 Euro 3
Diesel car Petrol car
Nu
mb
er
of
veh
icle
s
Range of uptake Baseline assumptions
19
Figure 9: Estimated total scheme cost for cars in London. Source: CEPA 2016.
£0 m
£20 m
£40 m
£60 m
£80 m
£100 m
£120 m
Euro 1 Euro 2 Euro 3 Euro 4 Euro 5 Euro 1 Euro 2 Euro 3
Diesel car Petrol car
To
tal co
st
Range of uptake Baseline assumptions
20
8. Proposal C: A national fund for older,
polluting taxis
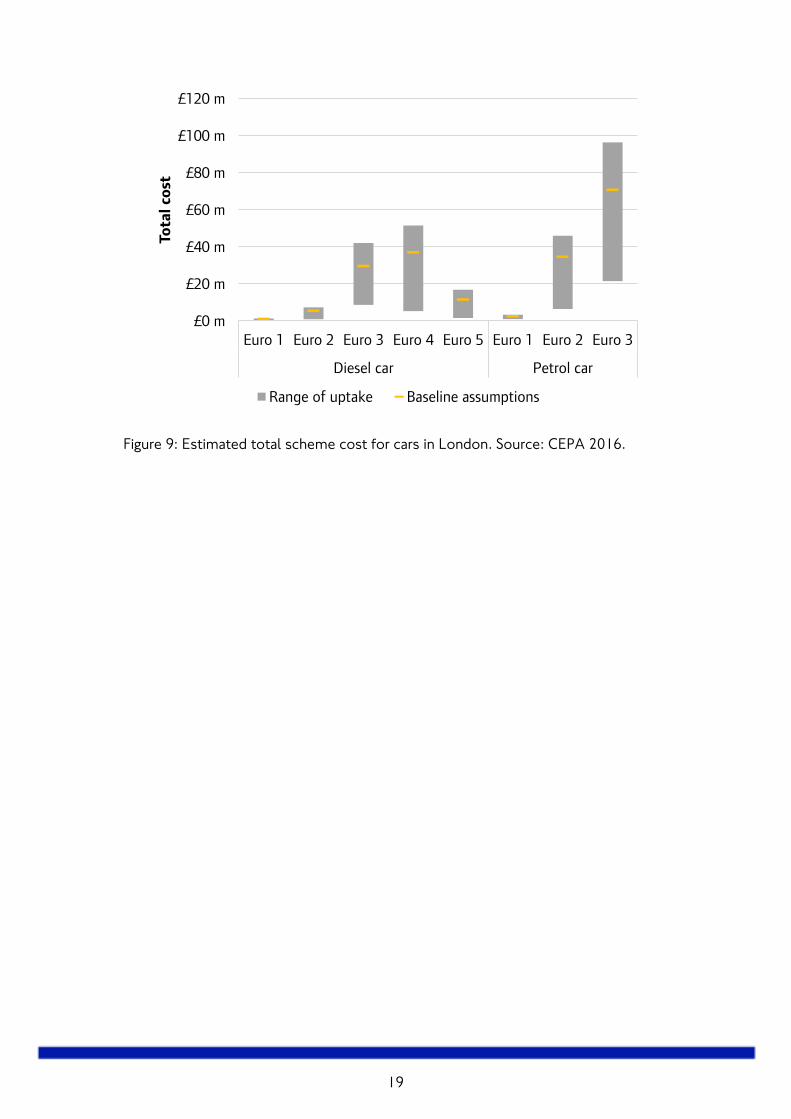
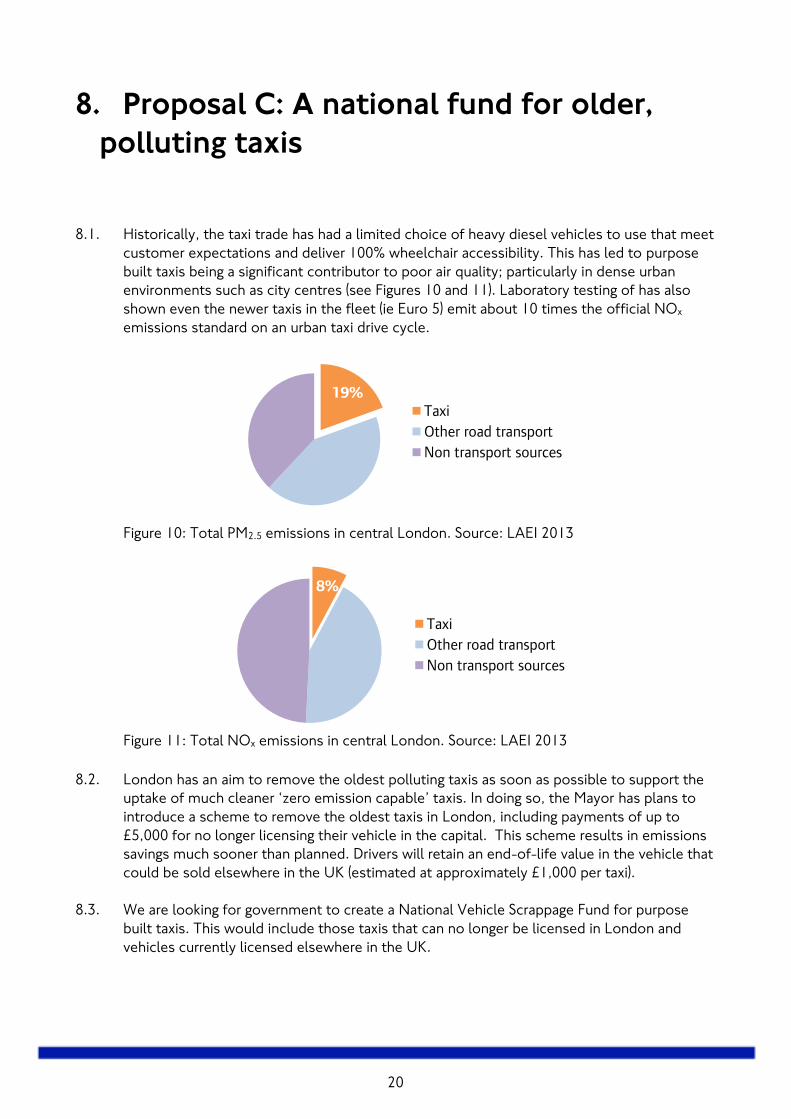
8.1. Historically, the taxi trade has had a limited choice of heavy diesel vehicles to use that meet
customer expectations and deliver 100% wheelchair accessibility. This has led to purpose
built taxis being a significant contributor to poor air quality; particularly in dense urban
environments such as city centres (see Figures 10 and 11). Laboratory testing of has also
shown even the newer taxis in the fleet (ie Euro 5) emit about 10 times the official NOx
emissions standard on an urban taxi drive cycle.
Figure 10: Total PM2.5 emissions in central London. Source: LAEI 2013
Figure 11: Total NOx emissions in central London. Source: LAEI 2013
8.2. London has an aim to remove the oldest polluting taxis as soon as possible to support the
uptake of much cleaner ‘zero emission capable’ taxis. In doing so, the Mayor has plans to
introduce a scheme to remove the oldest taxis in London, including payments of up to
£5,000 for no longer licensing their vehicle in the capital. This scheme results in emissions
savings much sooner than planned. Drivers will retain an end-of-life value in the vehicle that
could be sold elsewhere in the UK (estimated at approximately £1,000 per taxi).
8.3. We are looking for government to create a National Vehicle Scrappage Fund for purpose
built taxis. This would include those taxis that can no longer be licensed in London and
vehicles currently licensed elsewhere in the UK.
19%
Taxi
Other road transport
Non transport sources
8%
Taxi
Other road transport
Non transport sources
21
8.4. This amount is based on the £10m required for taxis anticipated to leave the London
market as a result of the Mayor’s own support (approximately 10,000 vehicles). In addition,
previous research has shown there are around 8,000 – 10,000 taxis licensed outside
London, which could also be eligible for the fund depending on how much value remains in
the vehicle (ie the age of the vehicle). A conservative figure would be a further £5m but this
would be reliant on further evidence to be submitted by other city regions where this is
justified.
22
9. Administration, funding and working with
industry
Administration
9.1. This proposal provides the national framework to enable city and local authorities to outline
their requirements to government and to secure funding for a scrappage scheme in their
local vicinity. For example, in London we have identified a combined scheme valued at
£515m, which will support owners of vans, cars and taxis. This would vary in other cities
according to the policies being implemented and requirements set out by the final national
Clean Air Zone framework.
9.2. In comparison to previous scrappage schemes, a new fund would be targeted and focused
on vehicles driven in UK cities, areas where pollution is worst, and support specific
populations that have the greatest need for financial support to mitigate the impact of new
road user charges.
9.3. Whilst the administration of the fund would be undertaken by government, we anticipate
the administration of each local scheme to be undertaken by the local authority in
partnership with the necessary industry bodies. Cities would submit proposals to fund their
own scrappage schemes, which take into account local circumstances and requirements.
9.4. We have held early engagement with the professional body representing car recyclers, the
Motor Vehicle Dismantlers’ Association of Great Britain (MVDA), in the development of this
framework. It is expected that local scrappage payments would be provided upon receipt of
a certificate of destruction issued by an Authorised Treatment Facility (ATF) on behalf of
the Driver and Vehicle Licensing Authority (DVLA). ATF licences are issued by the
Environment Agency to ensure that scrapped vehicles are recycled appropriately including
battery acid, gearbox oil and engine parts.
9.5. As the proposal is worked up further, we will also be reviewing whether there are any state
aid and competition law implications to consider.
Funding and working with industry
9.6. The following potential sources could be used, as a fair and efficient way of generating
funding:
Vehicle Excise Duty – changing vehicle purchasing choices by reforming the levels of
duty paid according to pollutants.
Industry – beneficiaries of the targeted schemes providing matched funding or
in-kind support
23
9.7. A reform of Vehicle Excise Duty is drastically needed to curb the trend of dieselisation in
our cities. This would also be a prime opportunity to generate income for a national
scrappage fund. The Mayor has previously proposed a 20% premium for new diesel cars on
the first year and standard rate until 2021, when stricter real world emissions testing
become mandatory. Similarly, increasing and extending the company car tax surcharge for
diesel would also help to support a ‘polluter pays’ principle.
9.8. Many factors have led to the increase in emissions from diesel vehicles – including the
recent emissions scandal. It is important that vehicle manufacturers also play a part in this
proposal, including having a role in contributing to the fund.
9.9. There are opportunities for industry participation that would increase the value for money
for government. Initial conversations with the car club and car rental industry have indicated
that industry would be willing to participate in schemes such as that being proposed (ie
Proposal B). This may involve contributions in kind such as waiving membership fees, which
will bring down the funding required from government (ie not £2,000 per vehicle in total).
9.10. There are also wider industry benefits of this proposed fund. Each targeted intervention
has the potential to change behaviours, and significantly impact private car ownership. In
order to maximise this, it is key that the car club and car rental industry work in close
partnership with local authorities.
24
Appendix 1 – Assessment of European
scrappage schemes (CEPA consultancy on
behalf of TfL)
Design of scheme
• Duration. Schemes have run for several years in countries such as Portugal, whereas other
countries have implemented them over a short time-frame to temporarily stimulate
demand (eg UK and Germany during the crisis). While schemes are phased out gradually in
some countries (eg France), they end more abruptly in other cases (eg Germany).
• Size. Size of incentives and available govt. budget varies across schemes; Germany
implemented the largest program. In 2009, with an overall budget of EUR 5bn and subsidies
of EUR 2,500. Incentives are typically financed by govt. but car manufacturers may also
contribute (eg 50:50 incentive in the UK).
• Targeted vs. non-targeted schemes. France, Italy, Portugal and Spain introduced targeted
schemes, providing a subsidy only if the new car satisfied certain eligibility criteria (mainly
based on CO2 emissions). Germany, Greece, Netherlands and the UK introduced non-
targeted schemes, providing a subsidy regardless of the new car purchased.
• Age. The scheme may impose conditions on the age of vehicles that can be scrapped.
Portugal implemented the lowest minimum age requirement (8 years), while the highest age
threshold is 15 years, implemented in France in 2008 and 2011. By narrowing the eligible
base for the scheme, a higher threshold may reduce overall impact in terms of the number
of vehicles sold, ceteris paribus, but may yield higher environmental benefits by ensuring
that the most polluting cars are scrapped.
• Complexity. Schemes are simple and transparent in some countries, for example, Germany
provided a price discount of EUR 2,500 for any type of new car purchased. Others are more
complex where for instance, subsidies depend on the type of vehicle. In Greece, the size of
incentives varied from EUR 1,500 to EUR 3,200 for cars, depending on engine
displacement.
25
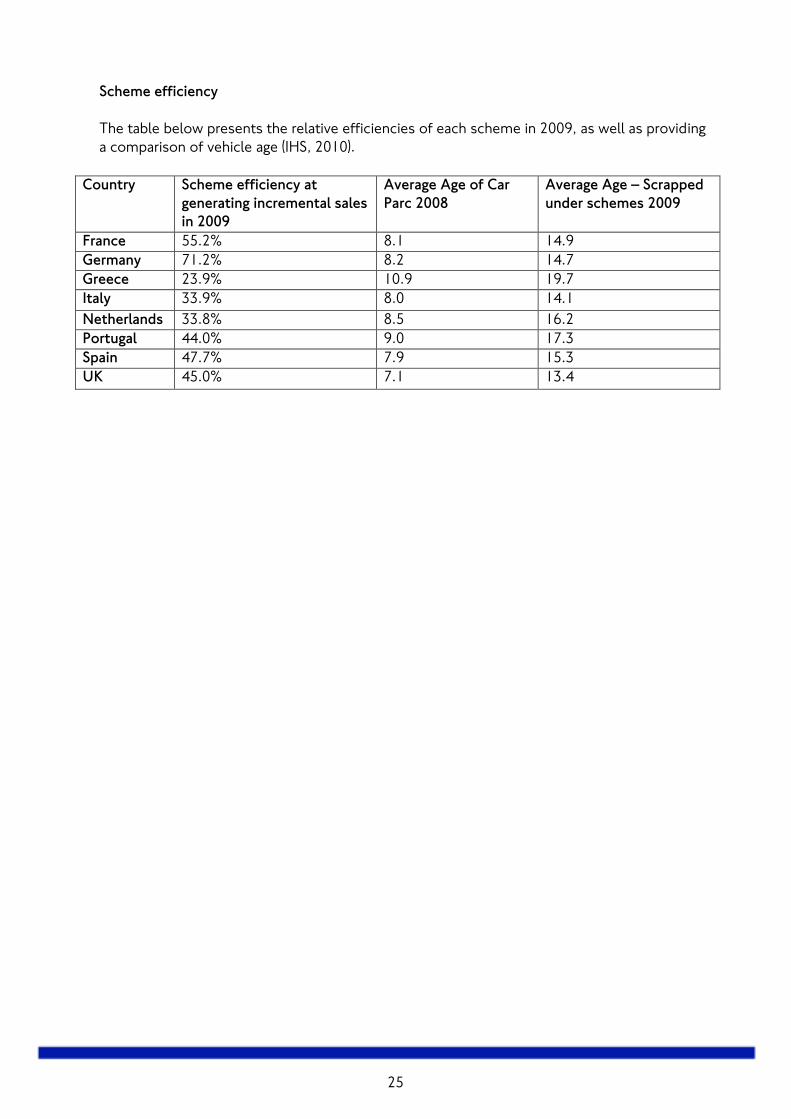
Scheme efficiency
The table below presents the relative efficiencies of each scheme in 2009, as well as providing
a comparison of vehicle age (IHS, 2010).
Country Scheme efficiency at
generating incremental sales
in 2009
Average Age of Car
Parc 2008
Average Age – Scrapped
under schemes 2009
France 55.2% 8.1 14.9
Germany 71.2% 8.2 14.7
Greece 23.9% 10.9 19.7
Italy 33.9% 8.0 14.1
Netherlands 33.8% 8.5 16.2
Portugal 44.0% 9.0 17.3
Spain 47.7% 7.9 15.3
UK 45.0% 7.1 13.4
26
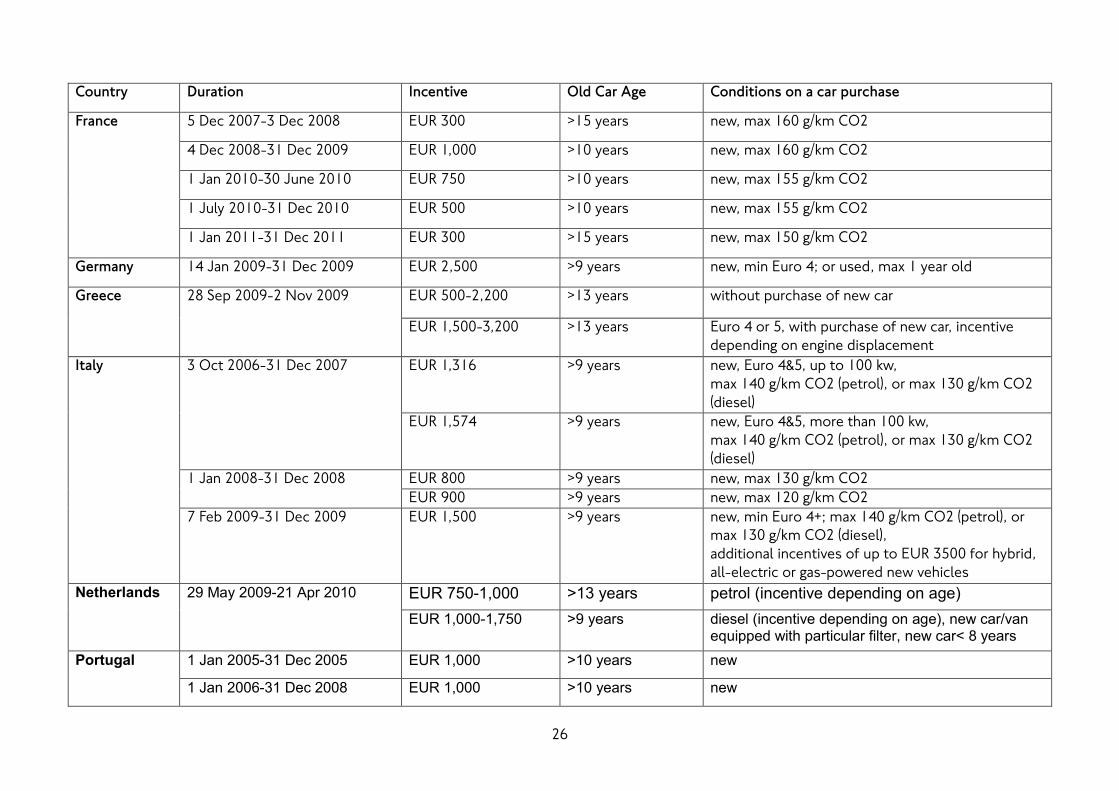
Country Duration Incentive Old Car Age Conditions on a car purchase
France 5 Dec 2007-3 Dec 2008 EUR 300 >15 years new, max 160 g/km CO2
4 Dec 2008-31 Dec 2009 EUR 1,000 >10 years new, max 160 g/km CO2
1 Jan 2010-30 June 2010 EUR 750 >10 years new, max 155 g/km CO2
1 July 2010-31 Dec 2010 EUR 500 >10 years new, max 155 g/km CO2
1 Jan 2011-31 Dec 2011 EUR 300 >15 years new, max 150 g/km CO2
Germany 14 Jan 2009-31 Dec 2009 EUR 2,500 >9 years new, min Euro 4; or used, max 1 year old
Greece 28 Sep 2009-2 Nov 2009 EUR 500-2,200 >13 years without purchase of new car
EUR 1,500-3,200 >13 years Euro 4 or 5, with purchase of new car, incentive
depending on engine displacement
Italy 3 Oct 2006-31 Dec 2007 EUR 1,316 >9 years new, Euro 4&5, up to 100 kw,
max 140 g/km CO2 (petrol), or max 130 g/km CO2
(diesel)
EUR 1,574 >9 years new, Euro 4&5, more than 100 kw,
max 140 g/km CO2 (petrol), or max 130 g/km CO2
(diesel)
1 Jan 2008-31 Dec 2008 EUR 800 >9 years new, max 130 g/km CO2
EUR 900 >9 years new, max 120 g/km CO2
7 Feb 2009-31 Dec 2009 EUR 1,500 >9 years new, min Euro 4+; max 140 g/km CO2 (petrol), or
max 130 g/km CO2 (diesel),
additional incentives of up to EUR 3500 for hybrid,
all-electric or gas-powered new vehicles
Netherlands 29 May 2009-21 Apr 2010 EUR 750-1,000 >13 years petrol (incentive depending on age) EUR 1,000-1,750 >9 years diesel (incentive depending on age), new car/van
equipped with particular filter, new car< 8 years Portugal 1 Jan 2005-31 Dec 2005 EUR 1,000 >10 years new
1 Jan 2006-31 Dec 2008 EUR 1,000 >10 years new
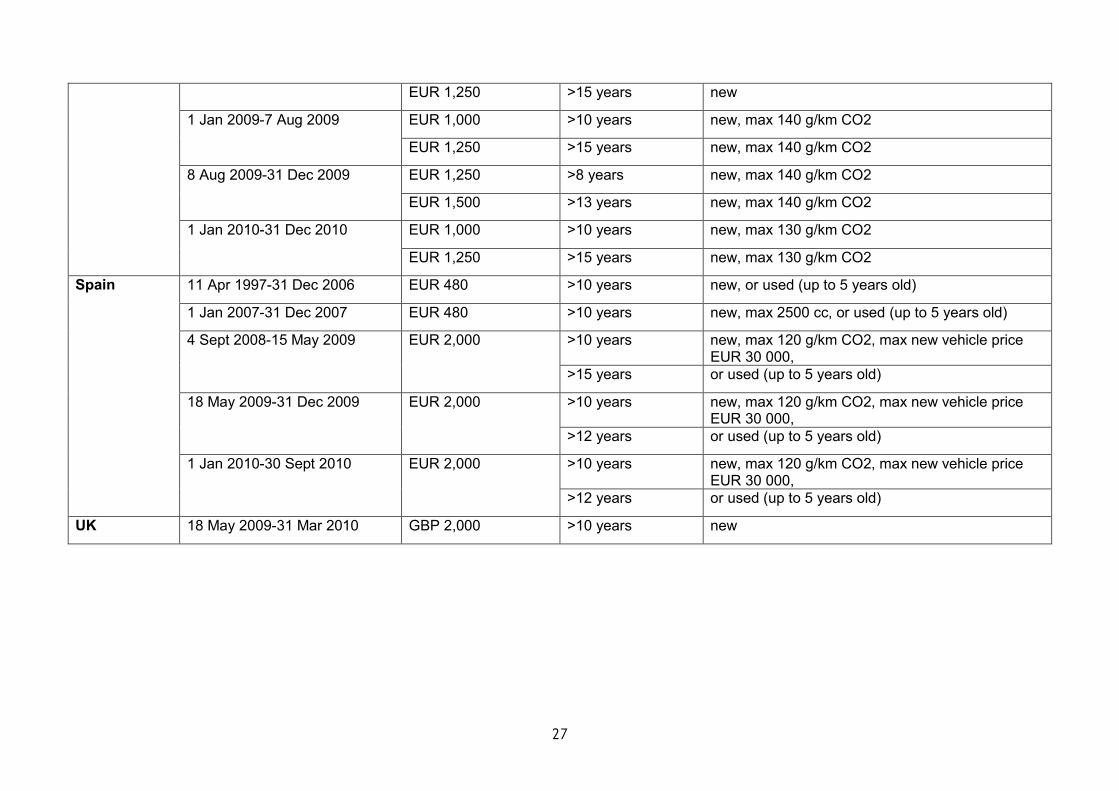
27
EUR 1,250 >15 years new 1 Jan 2009-7 Aug 2009 EUR 1,000 >10 years new, max 140 g/km CO2
EUR 1,250 >15 years new, max 140 g/km CO2 8 Aug 2009-31 Dec 2009 EUR 1,250 >8 years new, max 140 g/km CO2
EUR 1,500 >13 years new, max 140 g/km CO2 1 Jan 2010-31 Dec 2010 EUR 1,000 >10 years new, max 130 g/km CO2
EUR 1,250 >15 years new, max 130 g/km CO2 Spain 11 Apr 1997-31 Dec 2006 EUR 480 >10 years new, or used (up to 5 years old)
1 Jan 2007-31 Dec 2007 EUR 480 >10 years new, max 2500 cc, or used (up to 5 years old) 4 Sept 2008-15 May 2009 EUR 2,000 >10 years new, max 120 g/km CO2, max new vehicle price
EUR 30 000, >15 years or used (up to 5 years old)
18 May 2009-31 Dec 2009 EUR 2,000 >10 years new, max 120 g/km CO2, max new vehicle price EUR 30 000,
>12 years or used (up to 5 years old) 1 Jan 2010-30 Sept 2010 EUR 2,000 >10 years new, max 120 g/km CO2, max new vehicle price
EUR 30 000, >12 years or used (up to 5 years old)
UK 18 May 2009-31 Mar 2010 GBP 2,000 >10 years new
28
Impact of the schemes (Leheyda & Verboven, 2013)
The main impact has been in terms of temporarily stabilising car sales, particularly in countries with
targeted schemes: without the schemes in 2009, total sales would have been 17.4% lower in
countries with targeted schemes, and 14.8% lower in countries with non-targeted schemes.
In terms of elasticities, a 1% point subsidy is estimated to raise car sales by 1.4% for cars under
non-targeted schemes, and by 2.8% for eligible cars under targeted schemes. The findings indicate
a limited impact on average fuel consumption of new purchased cars: without the schemes,
average fuel consumption would have been 1.3% higher in countries with targeted schemes and
0.5% higher in countries with non-targeted schemes.
There have been limited crowding out effects: With regard to targeted schemes, sales of non-
eligible cars were not affected during the period in which the scheme was effective. Inter-temporal
substitution effects were small. However, there have been various competitive and trade effects:
Scrapping subsidies benefited domestic car brands more than foreign car brands in the case
of non-targeted schemes (e.g. Germany and UK), but not for targeted schemes (France and
Italy),
Premium brands gained less from subsidies than volume brands, but only in targeted
schemes.
Small cars (from the subcompact and compact segments) benefit under both types of
schemes, whereas large cars (from the standard and luxury market segments) only benefit
under targeted schemes (i.e. when they meet the environmental eligibility criteria.
Lessons learned
Temporal substitution: there may be substitution from non-eligible cars to eligible cars
under targeted schemes; or a substitution effect between different types of cars, e.g. from
large to small cars regardless of the type of scheme
Inter-temporal substitution: (i) there may be an anticipatory effect whereby there is a
reduction in sales before the scheme starts, as the consumer delays purchase of a vehicle
that he would have bought anyways, in anticipation of the introduction of the scrapping
program; and/ or (ii) there may be a pull-forward effect, whereby scrapping incentives induce
sales of vehicles that would have otherwise taken place in the near future, resulting in a
sharp decline in sales once the schemes are ended.
Competitive and trade effects
Scrapping schemes may result in distortions of competition and trade:
There may be a distortion of the market structure, as the scheme may redistribute market
shares of different firms or across different market segments; for instance smaller and
cheaper cars may be more attractive given size of incentives.
Scrapping schemes can affect trade flows and location decisions, e.g. the scheme could
result in in uneven plant utilisation if is only attractive for specific models of a car producer.
Scrapping schemes which are de facto selective can result in subsidy competitions between
countries, whereby each country links incentives to environmental conditions, favouring
domestic over foreign producers.
29
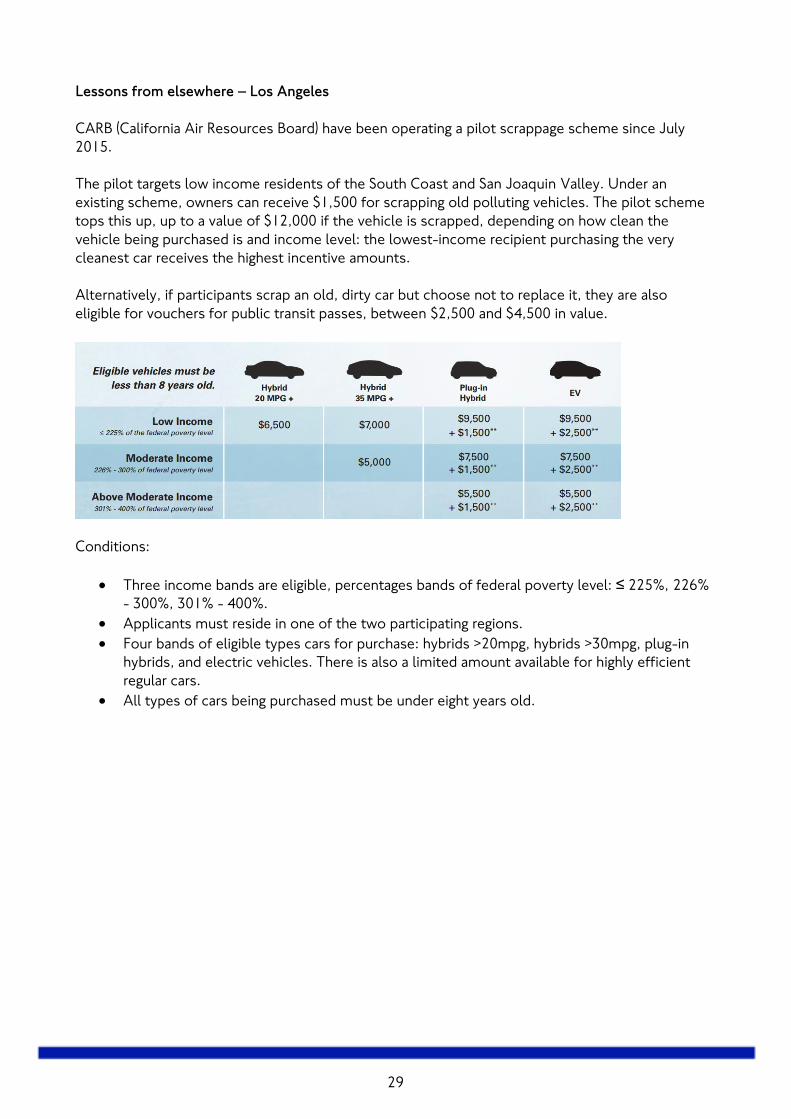
Lessons from elsewhere – Los Angeles
CARB (California Air Resources Board) have been operating a pilot scrappage scheme since July
2015.
The pilot targets low income residents of the South Coast and San Joaquin Valley. Under an
existing scheme, owners can receive $1,500 for scrapping old polluting vehicles. The pilot scheme
tops this up, up to a value of $12,000 if the vehicle is scrapped, depending on how clean the
vehicle being purchased is and income level: the lowest-income recipient purchasing the very
cleanest car receives the highest incentive amounts.
Alternatively, if participants scrap an old, dirty car but choose not to replace it, they are also
eligible for vouchers for public transit passes, between $2,500 and $4,500 in value.
Conditions:
Three income bands are eligible, percentages bands of federal poverty level: ≤ 225%, 226%
- 300%, 301% - 400%.
Applicants must reside in one of the two participating regions.
Four bands of eligible types cars for purchase: hybrids >20mpg, hybrids >30mpg, plug-in
hybrids, and electric vehicles. There is also a limited amount available for highly efficient
regular cars.
All types of cars being purchased must be under eight years old.
30
Appendix 2 – Calculating the uptake of
Proposal A and Proposal B
To calculate the uptake of the scrappage scheme we defined some key concepts:
Residual value. This refers to the potential resale value of a vehicle, in the second hand
market. As vehicles age, their resale value decreases. For our purposes, we made an
assumption about the rate of depreciation, and the initial value of the vehicle, in order to
determine the residual value of a car/ van.
End-of-life value. This refers to the residual value of a vehicle at the end of its useful life. In
other words, it is the minimum value of a vehicle, which one would receive for sending their
vehicle to the scrap yard. We assume that this is always positive, and that vehicle owners
receive this amount in addition to the incentive payment from the scheme.
Economic endowment effect. This is a common effect in which owners value their
possessions (in this case a vehicle) at a level which is higher than the residual value. This
means that to convince a private owner to scrap their car, they require compensation
greater than its second-hand value.
Residual value
To estimate the uptake of the two proposals we first calculated the average residual value of the
vehicle and determined a range around this value (end-of life value being the minimum value).
Depending on where the incentive value of the scheme falls in that range, a % of vehicle owners
would be interested in the scheme.
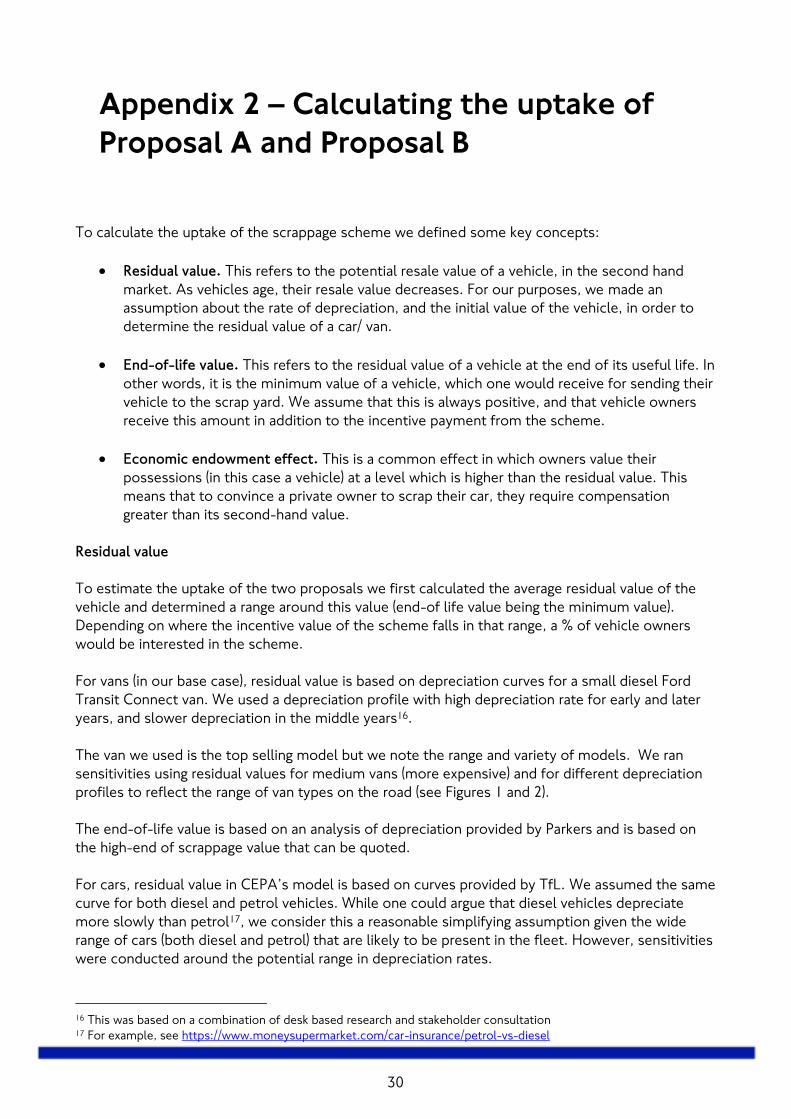
For vans (in our base case), residual value is based on depreciation curves for a small diesel Ford
Transit Connect van. We used a depreciation profile with high depreciation rate for early and later
years, and slower depreciation in the middle years16.
The van we used is the top selling model but we note the range and variety of models. We ran
sensitivities using residual values for medium vans (more expensive) and for different depreciation
profiles to reflect the range of van types on the road (see Figures 1 and 2).
The end-of-life value is based on an analysis of depreciation provided by Parkers and is based on
the high-end of scrappage value that can be quoted.
For cars, residual value in CEPA’s model is based on curves provided by TfL. We assumed the same
curve for both diesel and petrol vehicles. While one could argue that diesel vehicles depreciate
more slowly than petrol17, we consider this a reasonable simplifying assumption given the wide
range of cars (both diesel and petrol) that are likely to be present in the fleet. However, sensitivities
were conducted around the potential range in depreciation rates.
16 This was based on a combination of desk based research and stakeholder consultation 17 For example, see https://www.moneysupermarket.com/car-insurance/petrol-vs-diesel
31
Figure 1: Residual value and end-of-life value used for vans (assumed for minibuses)
Figure 2: Residual value and end-of-life value for cars
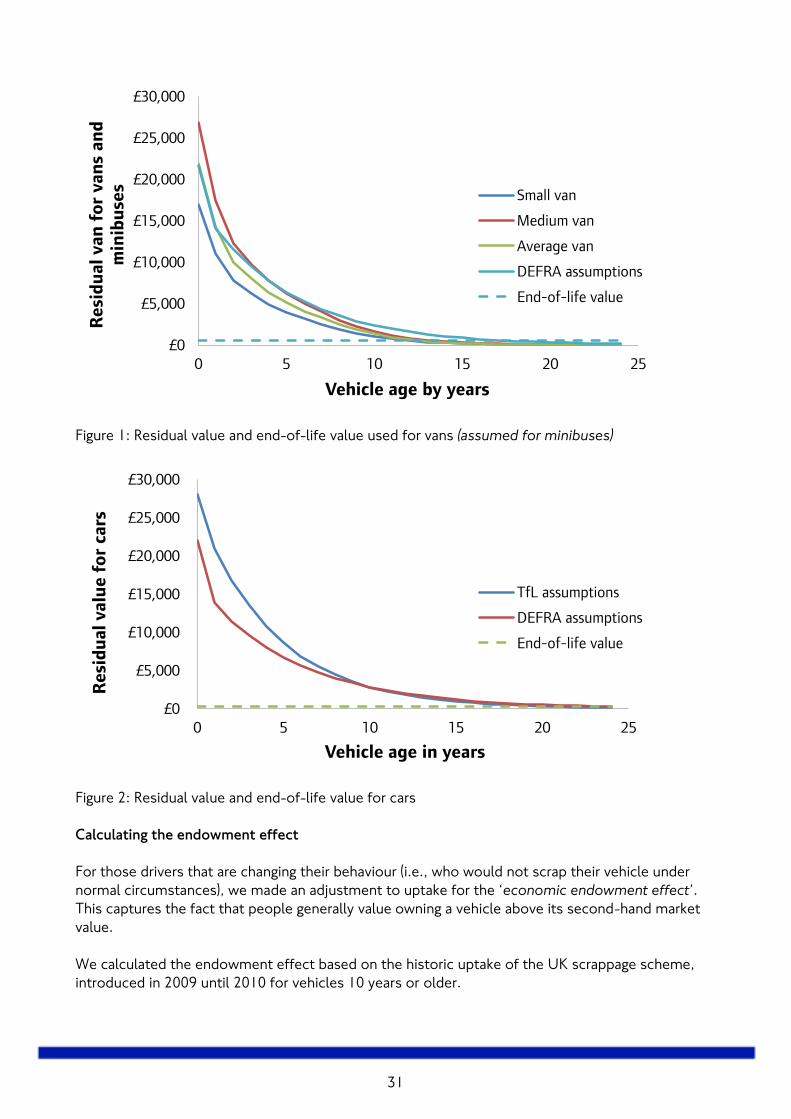
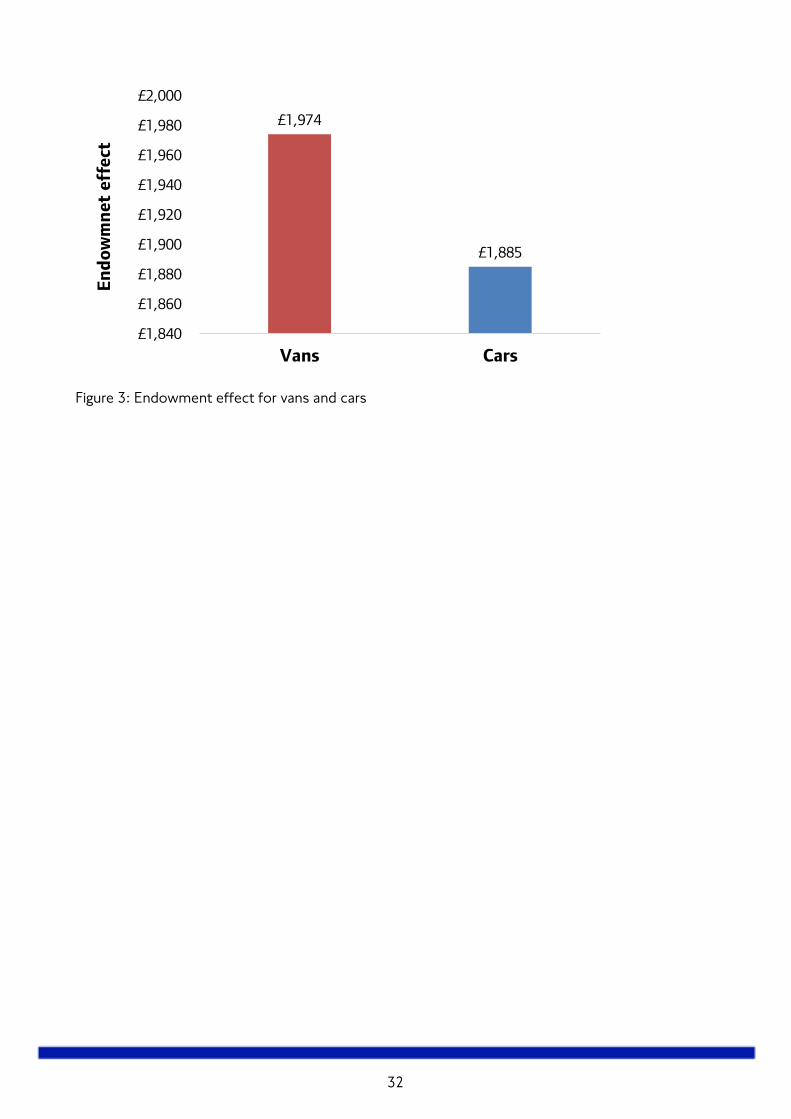
Calculating the endowment effect
For those drivers that are changing their behaviour (i.e., who would not scrap their vehicle under
normal circumstances), we made an adjustment to uptake for the ‘economic endowment effect’.
This captures the fact that people generally value owning a vehicle above its second-hand market
value.
We calculated the endowment effect based on the historic uptake of the UK scrappage scheme,
introduced in 2009 until 2010 for vehicles 10 years or older.
£0
£5,000
£10,000
£15,000
£20,000
£25,000
£30,000
0 5 10 15 20 25
Resi
du
al van
fo
r van
s an
d
min
ibu
ses
Vehicle age by years
Small van
Medium van
Average van
DEFRA assumptions
End-of-life value
£0
£5,000
£10,000
£15,000
£20,000
£25,000
£30,000
0 5 10 15 20 25
Resi
du
al valu
e f
or
cars
Vehicle age in years
TfL assumptions
DEFRA assumptions
End-of-life value
32
Figure 3: Endowment effect for vans and cars
£1,974
£1,885
£1,840
£1,860
£1,880
£1,900
£1,920
£1,940
£1,960
£1,980
£2,000
Vans Cars
En
do
wm
net
eff
ect
33
Appendix 3 – Modelling assumptions
(London scheme)
Assumption Central case Sensitivities Description
SCRAPPAGE SCHEME POLICIES
Eligibility criteria
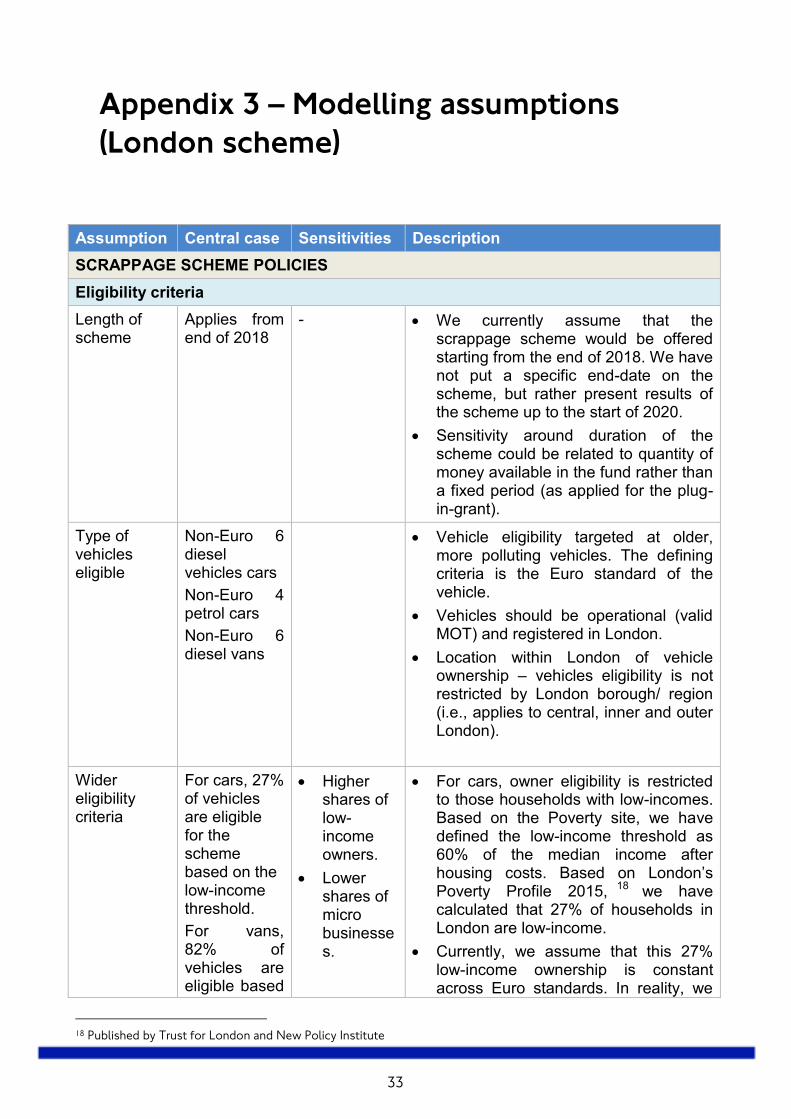
Length of scheme
Applies from end of 2018
- We currently assume that the scrappage scheme would be offered starting from the end of 2018. We have not put a specific end-date on the scheme, but rather present results of the scheme up to the start of 2020.
Sensitivity around duration of the scheme could be related to quantity of money available in the fund rather than a fixed period (as applied for the plug-in-grant).
Type of vehicles eligible
Non-Euro 6 diesel vehicles cars
Non-Euro 4 petrol cars
Non-Euro 6 diesel vans
Vehicle eligibility targeted at older, more polluting vehicles. The defining criteria is the Euro standard of the vehicle.
Vehicles should be operational (valid MOT) and registered in London.
Location within London of vehicle ownership – vehicles eligibility is not restricted by London borough/ region (i.e., applies to central, inner and outer London).
Wider eligibility criteria
For cars, 27% of vehicles are eligible for the scheme based on the low-income threshold.
For vans, 82% of vehicles are eligible based
Higher shares of low-income owners.
Lower shares of micro businesses.
For cars, owner eligibility is restricted to those households with low-incomes. Based on the Poverty site, we have defined the low-income threshold as 60% of the median income after housing costs. Based on London’s Poverty Profile 2015, 18 we have calculated that 27% of households in London are low-income.
Currently, we assume that this 27% low-income ownership is constant across Euro standards. In reality, we
18 Published by Trust for London and New Policy Institute
34
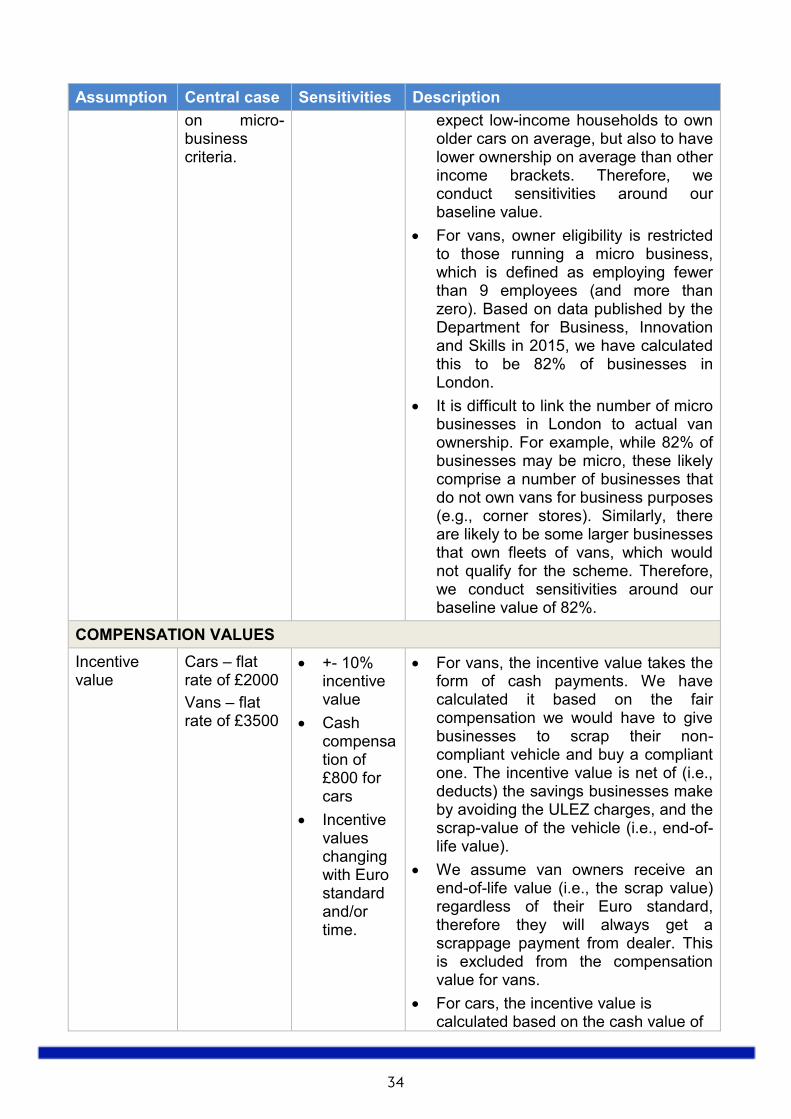
Assumption Central case Sensitivities Description
on micro-business criteria.
expect low-income households to own older cars on average, but also to have lower ownership on average than other income brackets. Therefore, we conduct sensitivities around our baseline value.
For vans, owner eligibility is restricted to those running a micro business, which is defined as employing fewer than 9 employees (and more than zero). Based on data published by the Department for Business, Innovation and Skills in 2015, we have calculated this to be 82% of businesses in London.
It is difficult to link the number of micro businesses in London to actual van ownership. For example, while 82% of businesses may be micro, these likely comprise a number of businesses that do not own vans for business purposes (e.g., corner stores). Similarly, there are likely to be some larger businesses that own fleets of vans, which would not qualify for the scheme. Therefore, we conduct sensitivities around our baseline value of 82%.
COMPENSATION VALUES
Incentive value
Cars – flat rate of £2000
Vans – flat rate of £3500
+- 10% incentive value
Cash compensation of £800 for cars
Incentive values changing with Euro standard and/or time.
For vans, the incentive value takes the form of cash payments. We have calculated it based on the fair compensation we would have to give businesses to scrap their non-compliant vehicle and buy a compliant one. The incentive value is net of (i.e., deducts) the savings businesses make by avoiding the ULEZ charges, and the scrap-value of the vehicle (i.e., end-of-life value).
We assume van owners receive an end-of-life value (i.e., the scrap value) regardless of their Euro standard, therefore they will always get a scrappage payment from dealer. This is excluded from the compensation value for vans.
For cars, the incentive value is calculated based on the cash value of
35
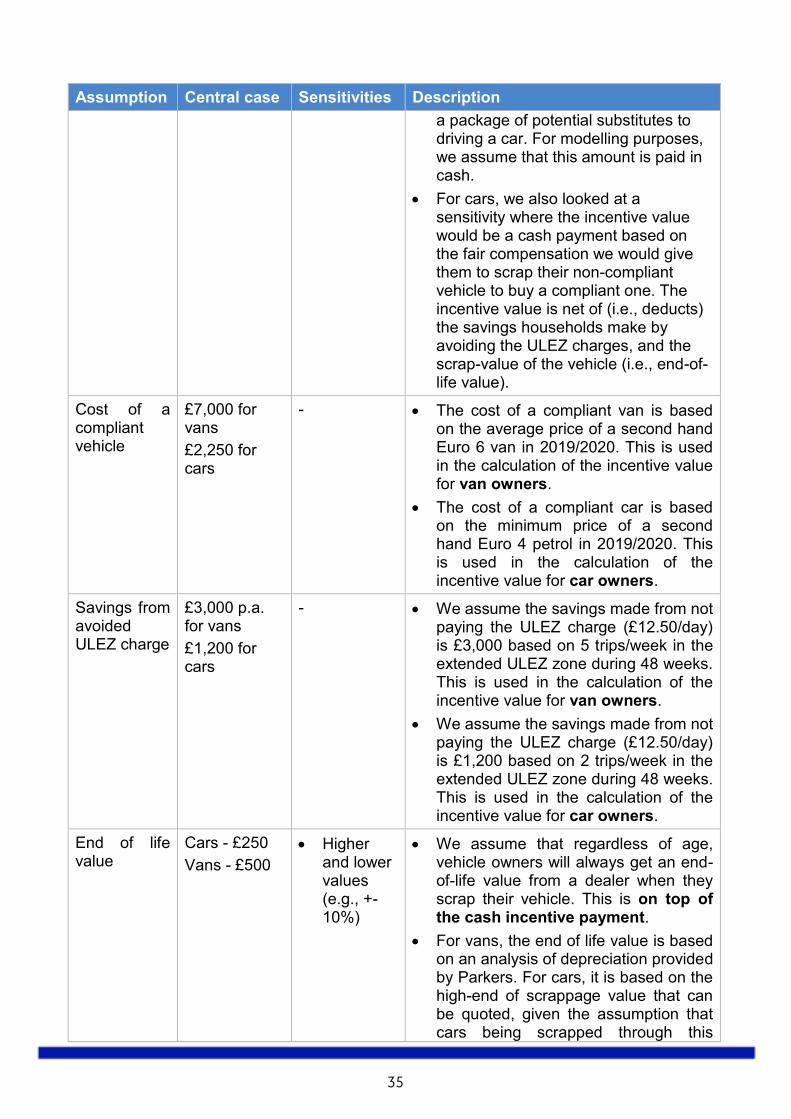
Assumption Central case Sensitivities Description
a package of potential substitutes to driving a car. For modelling purposes, we assume that this amount is paid in cash.
For cars, we also looked at a sensitivity where the incentive value would be a cash payment based on the fair compensation we would give them to scrap their non-compliant vehicle to buy a compliant one. The incentive value is net of (i.e., deducts) the savings households make by avoiding the ULEZ charges, and the scrap-value of the vehicle (i.e., end-of-life value).
Cost of a compliant vehicle
£7,000 for vans
£2,250 for cars
- The cost of a compliant van is based on the average price of a second hand Euro 6 van in 2019/2020. This is used in the calculation of the incentive value for van owners.
The cost of a compliant car is based on the minimum price of a second hand Euro 4 petrol in 2019/2020. This is used in the calculation of the incentive value for car owners.
Savings from avoided ULEZ charge
£3,000 p.a. for vans
£1,200 for cars
- We assume the savings made from not paying the ULEZ charge (£12.50/day) is £3,000 based on 5 trips/week in the extended ULEZ zone during 48 weeks. This is used in the calculation of the incentive value for van owners.
We assume the savings made from not paying the ULEZ charge (£12.50/day) is £1,200 based on 2 trips/week in the extended ULEZ zone during 48 weeks. This is used in the calculation of the incentive value for car owners.
End of life value
Cars - £250
Vans - £500
Higher and lower values (e.g., +-10%)
We assume that regardless of age, vehicle owners will always get an end-of-life value from a dealer when they scrap their vehicle. This is on top of the cash incentive payment.
For vans, the end of life value is based on an analysis of depreciation provided by Parkers. For cars, it is based on the high-end of scrappage value that can be quoted, given the assumption that cars being scrapped through this
36
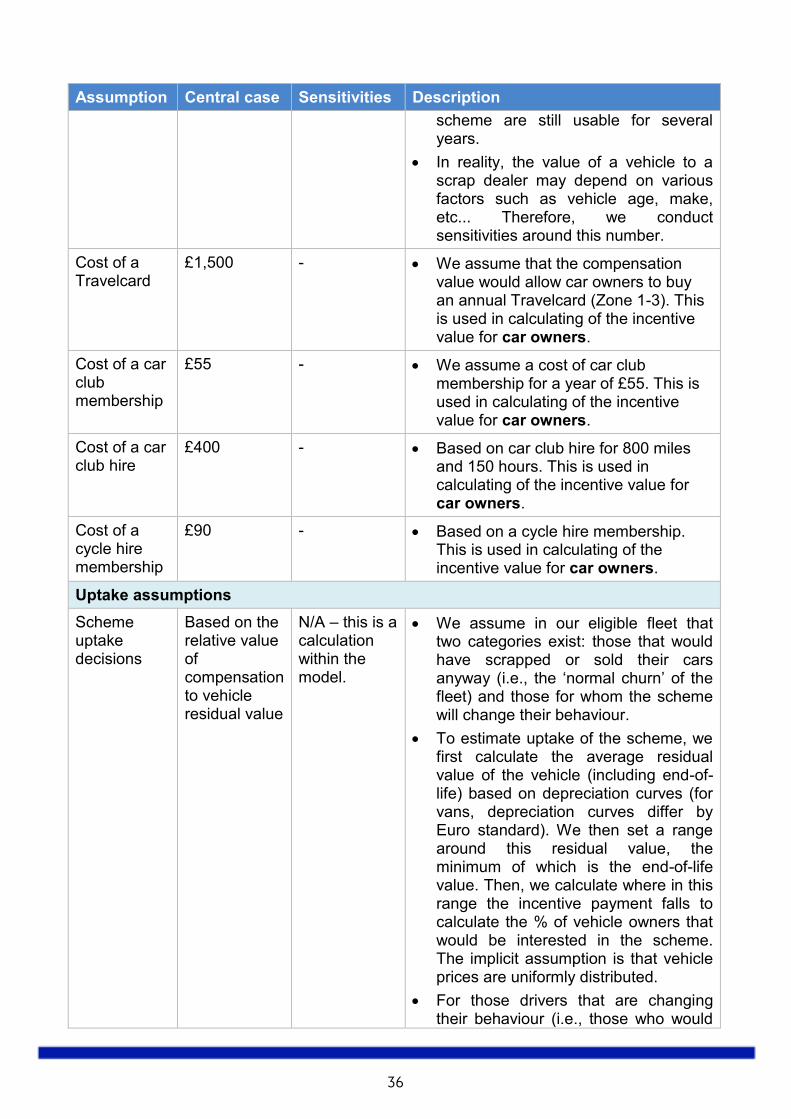
Assumption Central case Sensitivities Description
scheme are still usable for several years.
In reality, the value of a vehicle to a scrap dealer may depend on various factors such as vehicle age, make, etc... Therefore, we conduct sensitivities around this number.
Cost of a Travelcard
£1,500 - We assume that the compensation value would allow car owners to buy an annual Travelcard (Zone 1-3). This is used in calculating of the incentive value for car owners.
Cost of a car club membership
£55 - We assume a cost of car club membership for a year of £55. This is used in calculating of the incentive value for car owners.
Cost of a car club hire
£400 - Based on car club hire for 800 miles and 150 hours. This is used in calculating of the incentive value for car owners.
Cost of a cycle hire membership
£90 - Based on a cycle hire membership. This is used in calculating of the incentive value for car owners.
Uptake assumptions
Scheme uptake decisions
Based on the relative value of compensation to vehicle residual value
N/A – this is a calculation within the model.
We assume in our eligible fleet that two categories exist: those that would have scrapped or sold their cars anyway (i.e., the ‘normal churn’ of the fleet) and those for whom the scheme will change their behaviour.
To estimate uptake of the scheme, we first calculate the average residual value of the vehicle (including end-of-life) based on depreciation curves (for vans, depreciation curves differ by Euro standard). We then set a range around this residual value, the minimum of which is the end-of-life value. Then, we calculate where in this range the incentive payment falls to calculate the % of vehicle owners that would be interested in the scheme. The implicit assumption is that vehicle prices are uniformly distributed.
For those drivers that are changing their behaviour (i.e., those who would
37
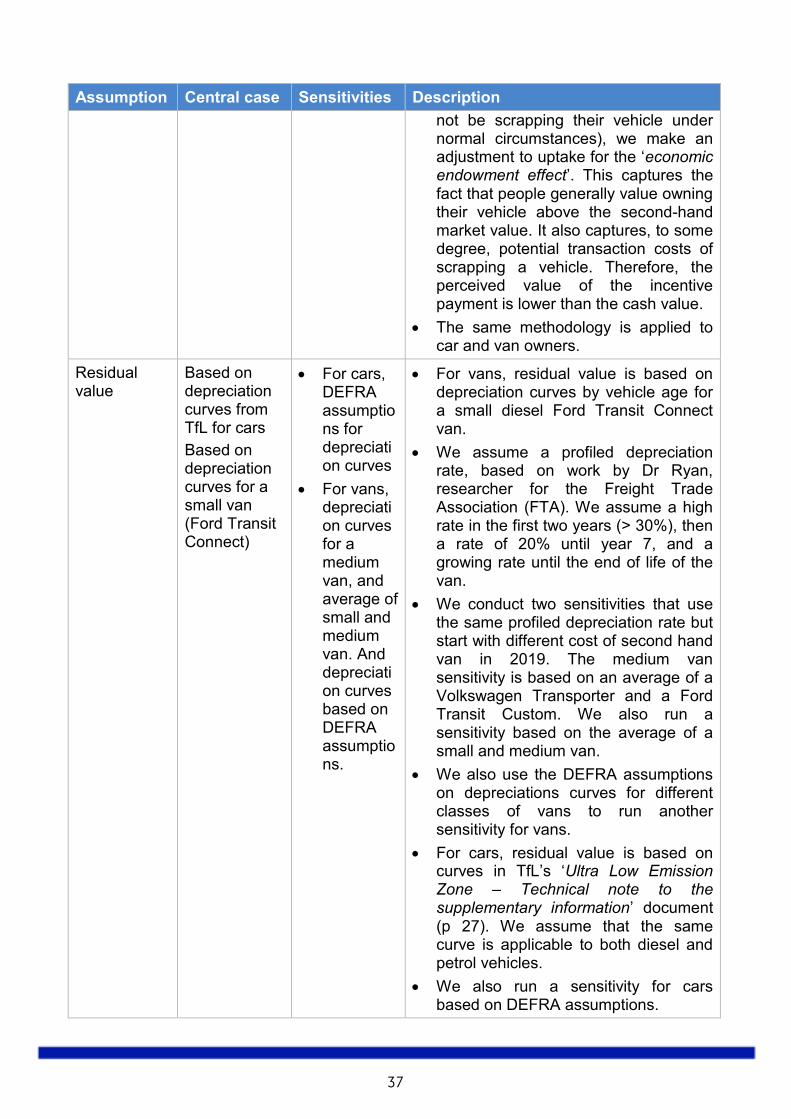
Assumption Central case Sensitivities Description
not be scrapping their vehicle under normal circumstances), we make an adjustment to uptake for the ‘economic endowment effect’. This captures the fact that people generally value owning their vehicle above the second-hand market value. It also captures, to some degree, potential transaction costs of scrapping a vehicle. Therefore, the perceived value of the incentive payment is lower than the cash value.
The same methodology is applied to car and van owners.
Residual value
Based on depreciation curves from TfL for cars
Based on depreciation curves for a small van (Ford Transit Connect)
For cars, DEFRA assumptions for depreciation curves
For vans, depreciation curves for a medium van, and average of small and medium van. And depreciation curves based on DEFRA assumptions.
For vans, residual value is based on depreciation curves by vehicle age for a small diesel Ford Transit Connect van.
We assume a profiled depreciation rate, based on work by Dr Ryan, researcher for the Freight Trade Association (FTA). We assume a high rate in the first two years (> 30%), then a rate of 20% until year 7, and a growing rate until the end of life of the van.
We conduct two sensitivities that use the same profiled depreciation rate but start with different cost of second hand van in 2019. The medium van sensitivity is based on an average of a Volkswagen Transporter and a Ford Transit Custom. We also run a sensitivity based on the average of a small and medium van.
We also use the DEFRA assumptions on depreciations curves for different classes of vans to run another sensitivity for vans.
For cars, residual value is based on curves in TfL’s ‘Ultra Low Emission Zone – Technical note to the supplementary information’ document (p 27). We assume that the same curve is applicable to both diesel and petrol vehicles.
We also run a sensitivity for cars based on DEFRA assumptions.
38
Assumption Central case Sensitivities Description
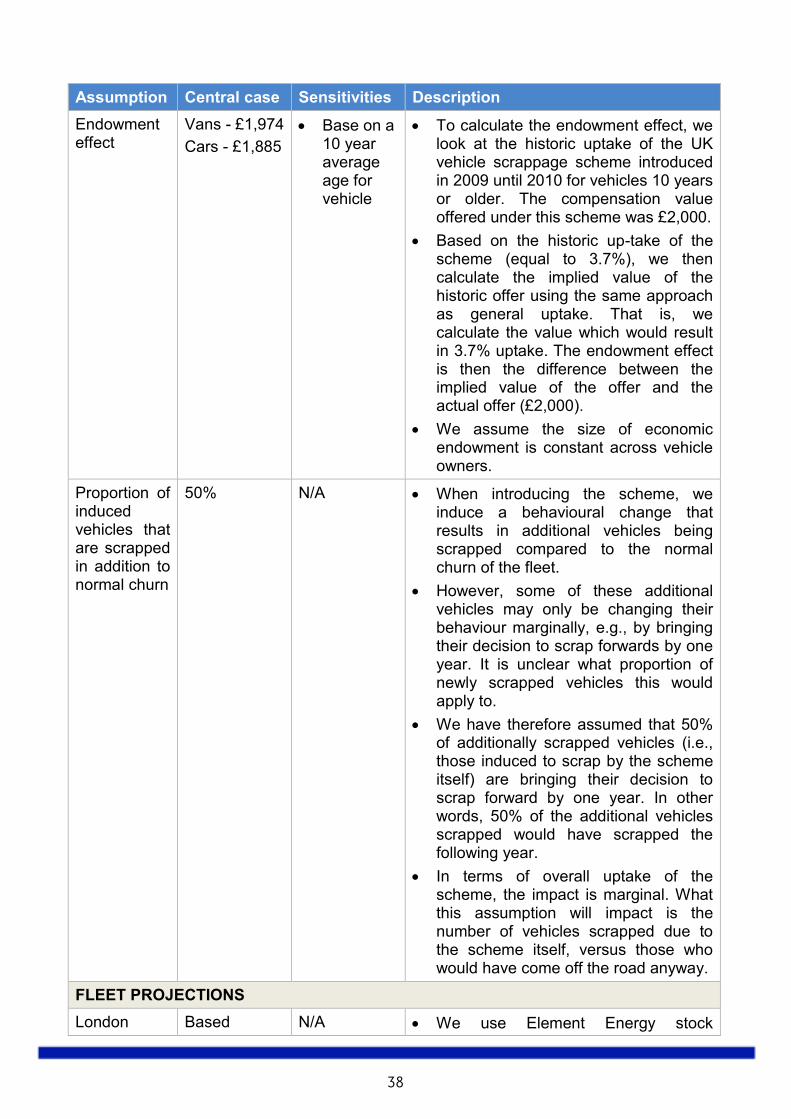
Endowment effect
Vans - £1,974
Cars - £1,885
Base on a 10 year average age for vehicle
To calculate the endowment effect, we look at the historic uptake of the UK vehicle scrappage scheme introduced in 2009 until 2010 for vehicles 10 years or older. The compensation value offered under this scheme was £2,000.
Based on the historic up-take of the scheme (equal to 3.7%), we then calculate the implied value of the historic offer using the same approach as general uptake. That is, we calculate the value which would result in 3.7% uptake. The endowment effect is then the difference between the implied value of the offer and the actual offer (£2,000).
We assume the size of economic endowment is constant across vehicle owners.
Proportion of induced vehicles that are scrapped in addition to normal churn
50% N/A When introducing the scheme, we induce a behavioural change that results in additional vehicles being scrapped compared to the normal churn of the fleet.
However, some of these additional vehicles may only be changing their behaviour marginally, e.g., by bringing their decision to scrap forwards by one year. It is unclear what proportion of newly scrapped vehicles this would apply to.
We have therefore assumed that 50% of additionally scrapped vehicles (i.e., those induced to scrap by the scheme itself) are bringing their decision to scrap forward by one year. In other words, 50% of the additional vehicles scrapped would have scrapped the following year.
In terms of overall uptake of the scheme, the impact is marginal. What this assumption will impact is the number of vehicles scrapped due to the scheme itself, versus those who would have come off the road anyway.
FLEET PROJECTIONS
London Based N/A We use Element Energy stock
39
Assumption Central case Sensitivities Description
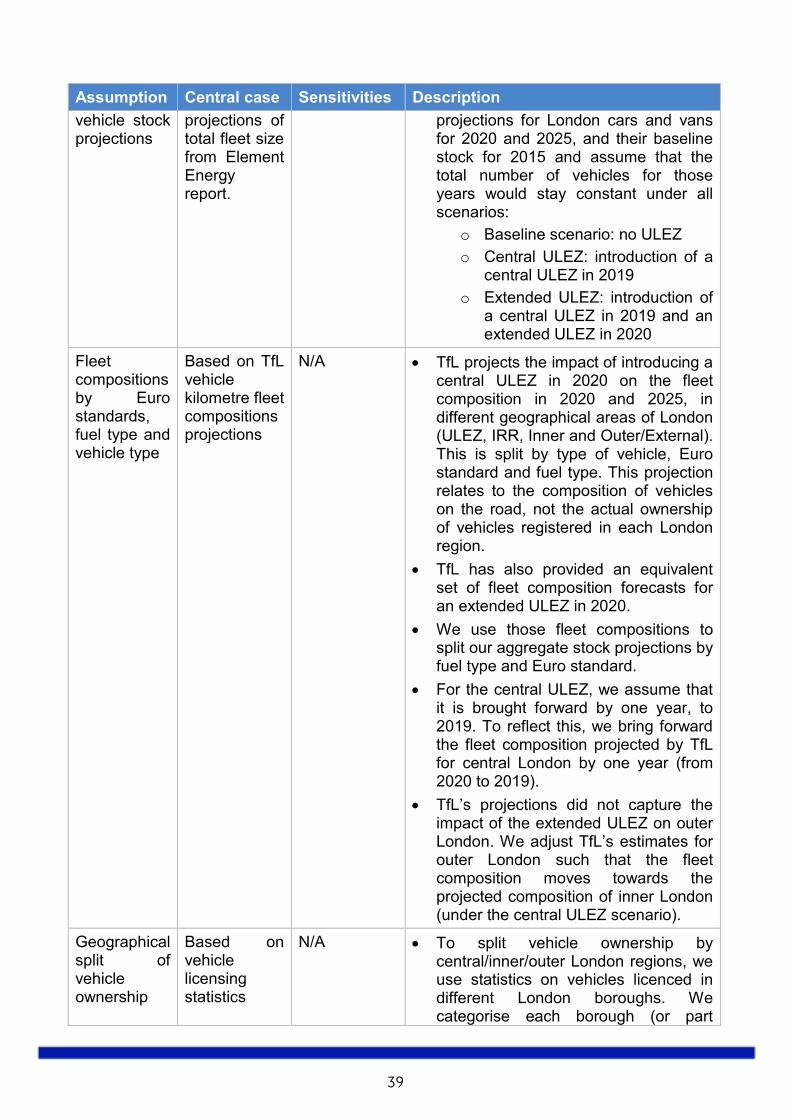
vehicle stock projections
projections of total fleet size from Element Energy report.
projections for London cars and vans for 2020 and 2025, and their baseline stock for 2015 and assume that the total number of vehicles for those years would stay constant under all scenarios:
o Baseline scenario: no ULEZ
o Central ULEZ: introduction of a central ULEZ in 2019
o Extended ULEZ: introduction of a central ULEZ in 2019 and an extended ULEZ in 2020
Fleet compositions by Euro standards, fuel type and vehicle type
Based on TfL vehicle kilometre fleet compositions projections
N/A TfL projects the impact of introducing a central ULEZ in 2020 on the fleet composition in 2020 and 2025, in different geographical areas of London (ULEZ, IRR, Inner and Outer/External). This is split by type of vehicle, Euro standard and fuel type. This projection relates to the composition of vehicles on the road, not the actual ownership of vehicles registered in each London region.
TfL has also provided an equivalent set of fleet composition forecasts for an extended ULEZ in 2020.
We use those fleet compositions to split our aggregate stock projections by fuel type and Euro standard.
For the central ULEZ, we assume that it is brought forward by one year, to 2019. To reflect this, we bring forward the fleet composition projected by TfL for central London by one year (from 2020 to 2019).
TfL’s projections did not capture the impact of the extended ULEZ on outer London. We adjust TfL’s estimates for outer London such that the fleet composition moves towards the projected composition of inner London (under the central ULEZ scenario).
Geographical split of vehicle ownership
Based on vehicle licensing statistics
N/A To split vehicle ownership by central/inner/outer London regions, we use statistics on vehicles licenced in different London boroughs. We categorise each borough (or part
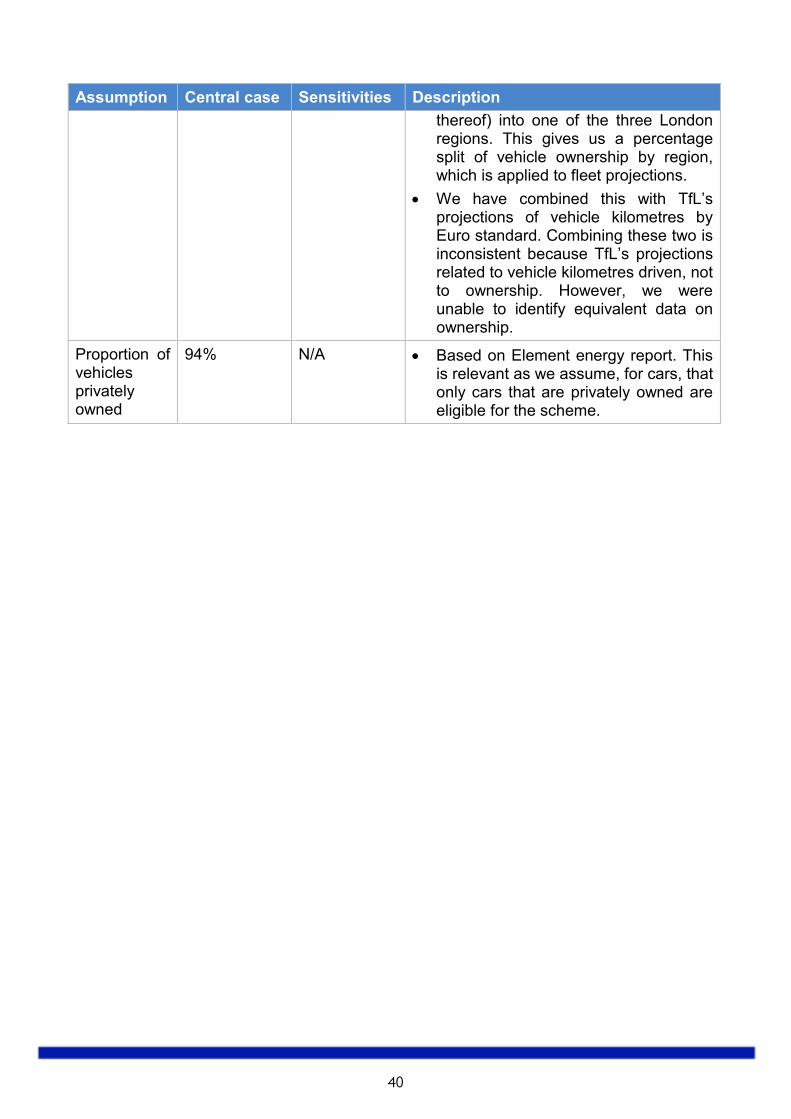
40
Assumption Central case Sensitivities Description
thereof) into one of the three London regions. This gives us a percentage split of vehicle ownership by region, which is applied to fleet projections.
We have combined this with TfL’s projections of vehicle kilometres by Euro standard. Combining these two is inconsistent because TfL’s projections related to vehicle kilometres driven, not to ownership. However, we were unable to identify equivalent data on ownership.
Proportion of vehicles privately owned
94% N/A Based on Element energy report. This is relevant as we assume, for cars, that only cars that are privately owned are eligible for the scheme.