Embed Size (px)
Citation preview

Attachment 1
Proposal for The Construction of Power Plant
Using Non-marketable Coals

i
Contents Figures ............................................................................................................................................. ii Tables .............................................................................................................................................. iii 1 Survey on Power Infrastructure in the Province of East Kalimantan....................................... 1 2 Power Supply and Demand...................................................................................................... 6 3 Review of Fuel for Power Generation ................................................................................... 12 4 Selection of Power Plant Construction site............................................................................ 18 5 Non-Marketable Coal Transportation Cost ............................................................................ 23 6 Investigation of Power Generating Capacity ......................................................................... 25 7 Load Flow Analysis ............................................................................................................... 27 8 Coal Handling System ........................................................................................................... 30 9 Power Plant Concept.............................................................................................................. 31 10 Outline of Power Plant....................................................................................................... 33
10.1 Investigation of the Climatic Conditions for Design ..................................................... 33 10.2 Investigation of Coal Mixing......................................................................................... 35 10.3 Boiler Specifications...................................................................................................... 36 10.4 Review of Combustion System ..................................................................................... 37 10.5 Air Supply System......................................................................................................... 38 10.6 Combustion Gas Control ............................................................................................... 39 10.7 Desulfurization in the Furnace....................................................................................... 39 10.8 Steam Turbine System................................................................................................... 40 10.9 Condenser System ......................................................................................................... 40 10.10 Generator and Single-line Drawing ............................................................................. 40 10.11 Cooling Water System ................................................................................................. 41 10.12 Limestone Feed System............................................................................................... 42 10.13 Wastewater Treatment System..................................................................................... 42 10.14 Ash Treatment System................................................................................................. 43 10.15 Central Control Room and DCS System ..................................................................... 46
11 Investigation of Internal Power Consumption ................................................................... 47 12 Heat Balance Analysis ....................................................................................................... 48 13 Power Plant Plot Plan......................................................................................................... 49 14 Power Transmission Line Study......................................................................................... 50 15 Economics of the Proposed Power Plant ........................................................................... 51
15.1 ODA-based Feasibility Study ........................................................................................ 51 15.2 IPP-based Economics Study ...................................................................................... 54 15.3 Economic IRR (without Tax)......................................................................................... 56
16 Cement Market................................................................................................................... 58 17 Environmental Performance Data...................................................................................... 60 18 Schedule............................................................................................................................. 61 19 Further Works .................................................................................................................... 62 Attachments ................................................................................................................................... 63

ii
Figures
Fig. 1 Service Area of PT. PLN (PERSERO) wil. KALTIM ............................................ 1 Fig. 2 Mahakam 150 kV Transmission System 2006........................................................ 3 Fig. 3 Daily Curve of System Mahakam March 3rd 2005 ................................................. 5 Fig. 4 Aging of Diesel Power Generator Mahakam Systems............................................ 6 Fig. 5 Diesel Generator Retirement Program Mahakam System ...................................... 7 Fig. 6 Locations of New Power Plants ............................................................................ 10 Fig. 7 Power Supply and Demand Forecast .................................................................... 11 Fig. 8 Non Marketable Fine Coal Ash Contents ............................................................. 13 Fig. 9 Non Marketable Fine Coal Sulfur Contents.......................................................... 13 Fig. 10 Non Marketable Dirty Coal Ash Contents .......................................................... 15 Fig. 11 Non Marketable Dirty Coal Sulfur Contents....................................................... 15 Fig. 12 Power Plant Site Selection .................................................................................. 20 Fig. 13 Power Plant Site Selection-PT Bukit Baiduri ..................................................... 21 Fig. 14 Site for Power Plant Construction Bukit Baiduri Energi Coal Mine .................. 22 Fig. 15 Non Marketable Coal Gathering Cost................................................................. 23 Fig. 16 Proposed Fuel Supply System ............................................................................ 24 Fig. 17 Fuel Choices Available in East Kalimantan (2006 September) .......................... 26 Fig. 18 Single Line Diagram System Mahakam Extension (10 Year Plan in 2006) ....... 27 Fig. 19 Single-Line Diagram Mahakam System (Revised Ten Year Plan 2006) ............ 29 Fig. 20 Coal Handling System ........................................................................................ 30 Fig. 21 General Idea of the Boiler Selection ................................................................... 32 Fig. 22 Average Ambient Temperature (1982-2004 Samarinda City)............................. 33 Fig. 23 Max. Ambient Temperature (1978-2005 Samarinda City).................................. 34 Fig. 24 Average Relative Humidity SAMARINDA (1982-2004) ................................... 34 Fig. 25 Fuel Cost for Power Generation ......................................................................... 36 Fig. 26 Water Supply System 2x50 MW Mahakam Project............................................ 41 Fig. 27 Cooling Tower Water Balance 2x50 MW ........................................................... 42 Fig. 28 Waste Water Treatment ....................................................................................... 43 Fig. 29 Circulated Fluidized Boiler 50 MW Ash Recovery ............................................ 44 Fig. 30 Coal Ash Utilization............................................................................................ 44 Fig. 31 Synergy within Industries ................................................................................... 46 Fig. 32 Proposed Transmission Line Route..................................................................... 50 Fig. 33 Equal Amortization Calculation (Principal Payment and Interest Payment) ...... 53 Fig. 34 Tonasa Cement Supply System (Kalimantan /Surawesi Area) ........................... 58 Fig. 35 Tonasa Cement Distribution System in Samarinda Area .................................... 59

iii
Tables
Table 1 Existing Power Generators Power Supply............................................................ 2 Table 2 Tariff 2004 ............................................................................................................ 3 Table 3 Power Demands 2006 June .................................................................................. 4 Table 4 PLN Power Supply Plan (10 Years) 2006............................................................. 7 Table 5 PLN Power Supply Plan (10 Years) Reviewed Dec.2006 .................................... 9 Table 6 Transmission Grid Extension Plan ....................................................................... 9 Table 7 Power Supply and Demand Forecast.................................................................. 10 Table 8 Average Physical Properties of Non-marketable Fine Coal ............................... 14 Table 9 Average Physical Properties of Dirty Coal ......................................................... 16 Table 10 Typical Supplement Coal Properties ................................................................ 17 Table 11 Power Plant Site Selection................................................................................ 22 Table 12 Substation Extension ........................................................................................ 29 Table 13 Coal Mixture Study (2x50 MW Units)............................................................. 35 Table 14 Comparison of prices of the different fuels per unit power output................... 36 Table 15 Preliminary Boiler Sizing (50 MW Unit) ......................................................... 37 Table 16 Preliminary Material Balance (50 MW Unit)................................................... 38 Table 17 Target waste water quality proposed for the power plant ................................. 43 Table 18 Cement Composition Comparison ................................................................... 45 Table 19 Internal Power Consumption............................................................................ 47 Table 20 Project Cost (Preliminary Estimation).............................................................. 52 Table 21 Power Tariff Calculation................................................................................... 54 Table 22 Cash Flow Based on IPP Financial Arrangement (F-IRR) ............................... 55 Table 23 Tariff Based on IPP Financial Arrangement ..................................................... 55 Table 24 E-IRR Cash Flow (7.0 US Cent/kWh) ............................................................. 56 Table 25 E-IRR Cash Flow (6.0 US Cents/kWh)............................................................ 57 Table 26 E-IRR Cash Flow (5.0 US Cents/kWh)............................................................ 57
1
1 Survey on Power Infrastructure in the Province of East Kalimantan
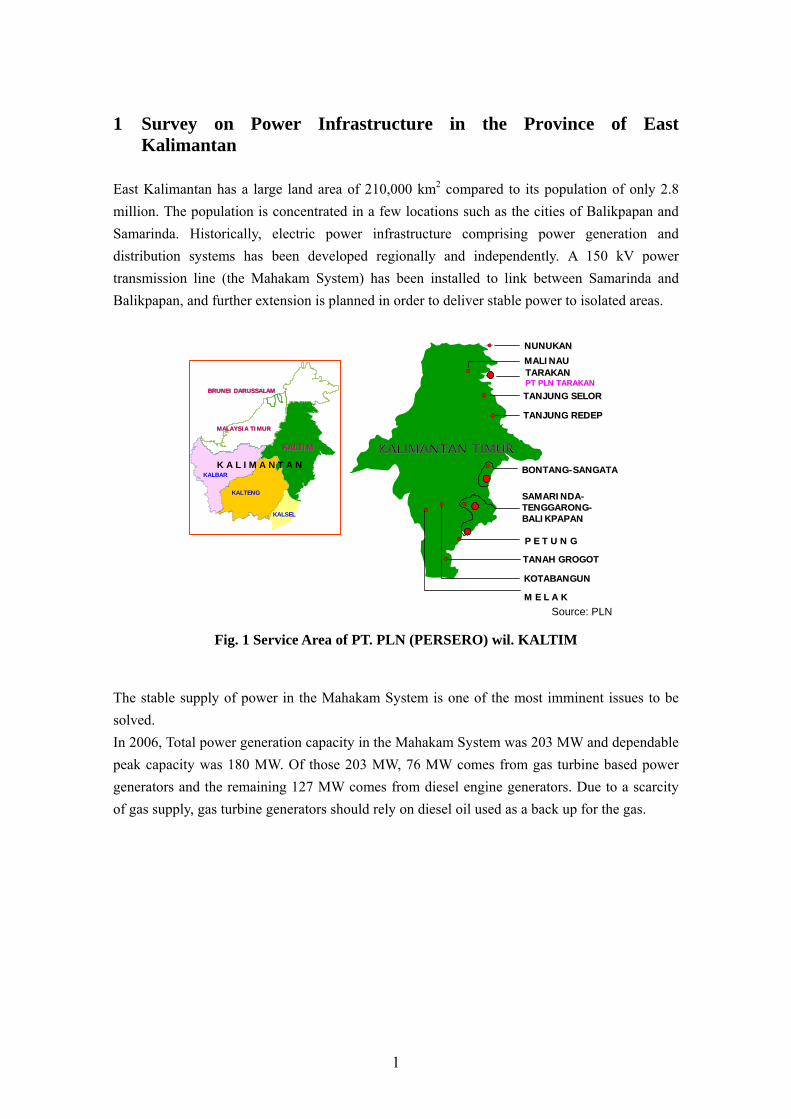
East Kalimantan has a large land area of 210,000 km2 compared to its population of only 2.8 million. The population is concentrated in a few locations such as the cities of Balikpapan and Samarinda. Historically, electric power infrastructure comprising power generation and distribution systems has been developed regionally and independently. A 150 kV power transmission line (the Mahakam System) has been installed to link between Samarinda and Balikpapan, and further extension is planned in order to deliver stable power to isolated areas.
TARAKANTARAKANPT PLN TARAKANPT PLN TARAKAN
BONTANGBONTANG--SANGATASANGATA
SAMARINDASAMARINDA--TENGGARONGTENGGARONG--BALIKPAPANBALIKPAPAN
KOTABANGUNKOTABANGUN
P E T U N GP E T U N G
M E L A KM E L A K
TANAH GROGOTTANAH GROGOT
TANJUNG REDEPTANJUNG REDEP
TANJUNG SELORTANJUNG SELOR
MALINAUMALINAUNUNUKANNUNUKAN
KALBAR
KALTENG
KALSEL
KALTIMKALTIM
K A L I M A N T A N
BRUNEI DARUSSALAMBRUNEI DARUSSALAM
MALAYSIA TIMURMALAYSIA TIMUR
Source: PLN
Fig. 1 Service Area of PT. PLN (PERSERO) wil. KALTIM
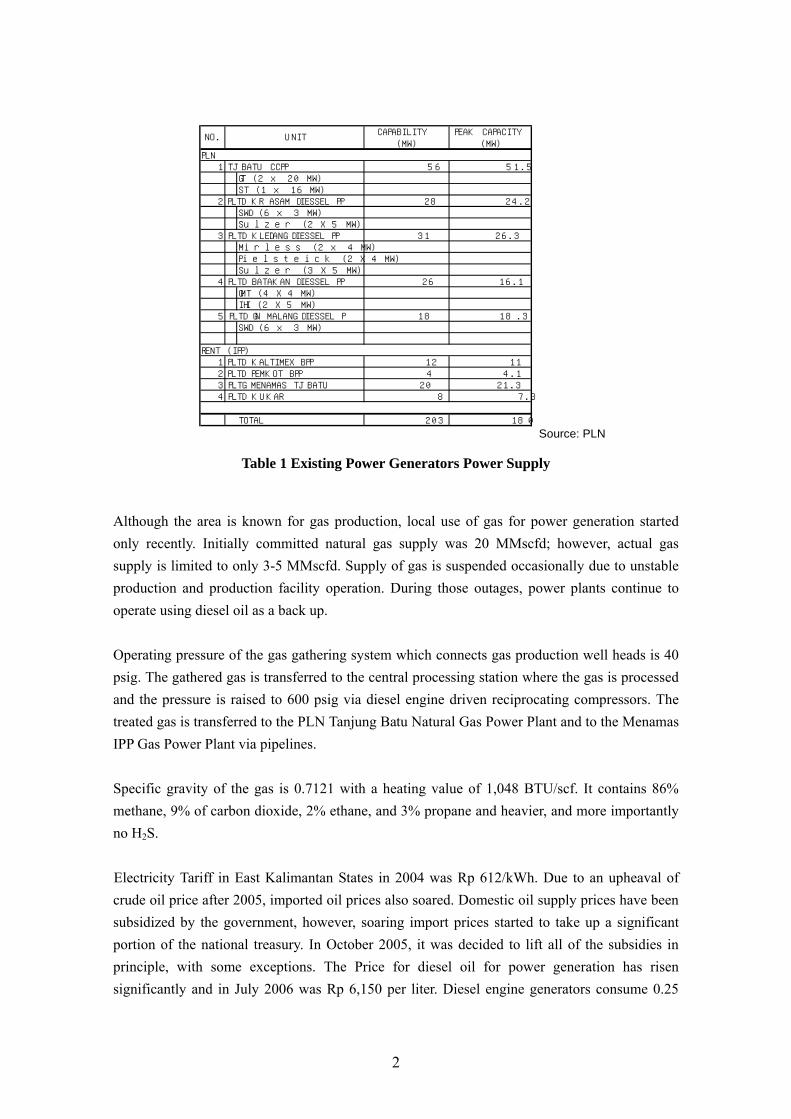
The stable supply of power in the Mahakam System is one of the most imminent issues to be solved. In 2006, Total power generation capacity in the Mahakam System was 203 MW and dependable peak capacity was 180 MW. Of those 203 MW, 76 MW comes from gas turbine based power generators and the remaining 127 MW comes from diesel engine generators. Due to a scarcity of gas supply, gas turbine generators should rely on diesel oil used as a back up for the gas.
2
CAPABILITY PEAK CAPACITY(MW) (MW)
PLN1 TJ BATU CCPP 56 51.5
GT (2 x 20 MW)ST (1 x 16 MW)
2 PLTD KR ASAM DIESSEL PP 28 24.2SWD (6 x 3 MW)Sulzer (2 X 5 MW)
3 PLTD KLEDANG DIESSEL PP 31 26.3Mirless (2 x 4 MW)Pielsteick (2 X 4 MW)Sulzer (3 X 5 MW)
4 PLTD BATAKAN DIESSEL PP 26 16.1GMT (4 X 4 MW)IHI (2 X 5 MW)
5 PLTD GN MALANG DIESSEL P 18 18.3SWD (6 x 3 MW)
RENT (IPP)1 PLTD KALTIMEX BPP 12 112 PLTD PEMKOT BPP 4 4.13 PLTG MENAMAS TJ BATU 20 21.34 PLTD KUKAR 8 7.3
TOTAL 203 180
NO. UNIT
Source: PLN
Table 1 Existing Power Generators Power Supply
Although the area is known for gas production, local use of gas for power generation started only recently. Initially committed natural gas supply was 20 MMscfd; however, actual gas supply is limited to only 3-5 MMscfd. Supply of gas is suspended occasionally due to unstable production and production facility operation. During those outages, power plants continue to operate using diesel oil as a back up. Operating pressure of the gas gathering system which connects gas production well heads is 40 psig. The gathered gas is transferred to the central processing station where the gas is processed and the pressure is raised to 600 psig via diesel engine driven reciprocating compressors. The treated gas is transferred to the PLN Tanjung Batu Natural Gas Power Plant and to the Menamas IPP Gas Power Plant via pipelines. Specific gravity of the gas is 0.7121 with a heating value of 1,048 BTU/scf. It contains 86% methane, 9% of carbon dioxide, 2% ethane, and 3% propane and heavier, and more importantly no H2S. Electricity Tariff in East Kalimantan States in 2004 was Rp 612/kWh. Due to an upheaval of crude oil price after 2005, imported oil prices also soared. Domestic oil supply prices have been subsidized by the government, however, soaring import prices started to take up a significant portion of the national treasury. In October 2005, it was decided to lift all of the subsidies in principle, with some exceptions. The Price for diesel oil for power generation has risen significantly and in July 2006 was Rp 6,150 per liter. Diesel engine generators consume 0.25

3
liter of diesel oil to generate one kWh of power. This corresponds to Rp 1,537 per kWh just for fuel cost, and is two and one half times the electricity tariff in the region. Budget deficit is accumulating minute by minute by operating the diesel power plants.
Table 2 Tariff 2004
9
612AVERAGE679PUBLIC610INDUSTRIAL706BUSINESS564RESIDENTIAL
Rp/kWhTARIFF
Note :Diesel Generator 0.25 L/kWh = 6150 x 0.25 Rp/kWh
= 1,537 Rp/kWh
PLN can not recover even fuel (Diesel) cost from the tariff
Fuel Cost 1,537
Source: PLN A 150 kV transmission line between Balikpapan City and Samarinda City has been installed as a major electricity transmission infrastructure. Present total power cable length installed for 150 kV systems is 269 km, 20 kV systems are 4,094 km, and 400 V systems are 4,226 km. Following is a simplified schematic drawing of the Mahakam System showing the 150 kV transmission lines.
Gl. Industri
Gl. Manggarsari
Gl. Giri Rejo
GI. Harapan Baru
GI. Tengkawang
GI. Bukuan
PLTGU Tanjing Batu
BALIKPAPAN
SAMARINDA
Source: PLN
Fig. 2 Mahakam 150 kV Transmission System 2006

4
Electricity demand in the Province of East Kalimantan is growing at a rate of 7% per annum. The Mahakam System supplies power to 440,000 customers with the total contractual supply capacity of 678 MVA. However, 45,000 new customers, with 114 MVA of contract capacity are wait listed.
Table 3 Power Demands 2006 June
114.375 MVA45.129672,9 MVA439.063TOTAL
20.083 MVA69073,5 MVA12.095PUBLIC
4.580 MVA43558 MVA239INDUSTRIAL
60.562 MVA15.139175,8 MVA25.643COMERCIAL
29.150 MVA28.865365,6 MVA401.086RESIDENTIAL
WAITING LISTCONSUMER
Source: PLN
Mahakam System has a relatively small variation between peak and bottom power load in a day. Peak time is limited to a few hours in the evening. This profile shows that industrial users are not using Mahakam System and may be relying on their own power generation facilities. Once stable power supply is established, the number of industrial customers will increase and peak load might shift from night to day time and power demand would increase greatly.

5
Source: PLN
Fig. 3 Daily Curve of System Mahakam March 3rd 2005
6
2 Power Supply and Demand
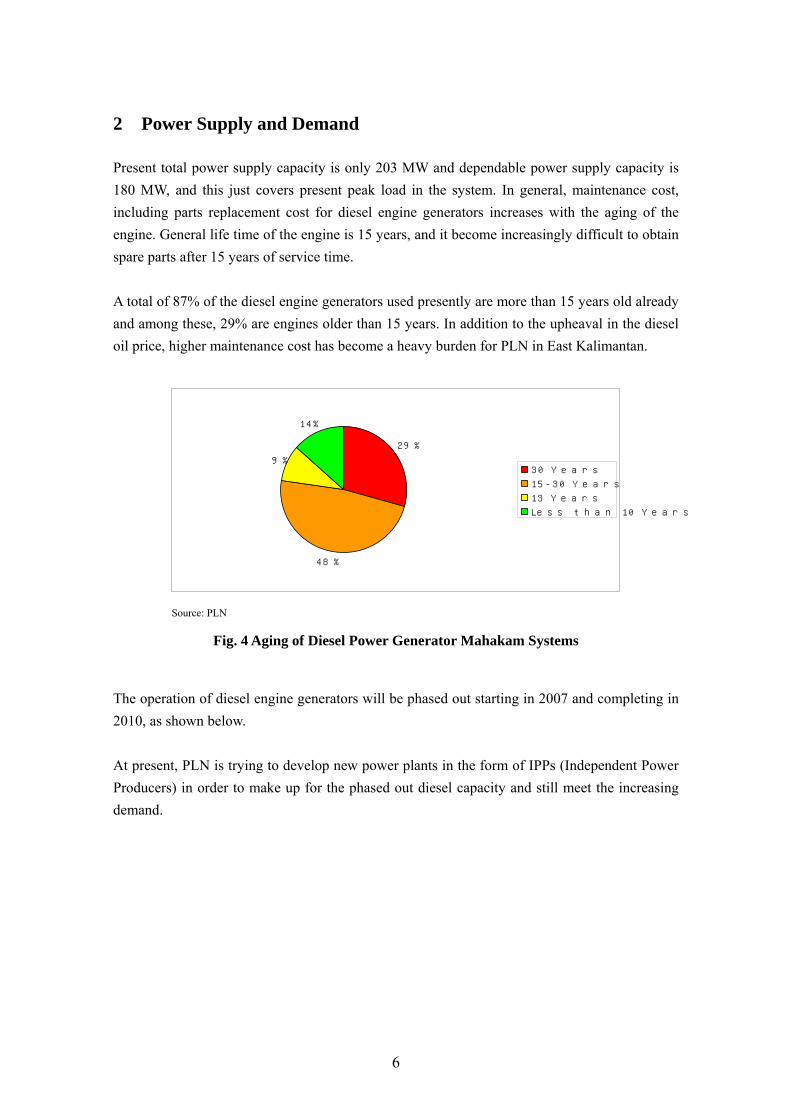
Present total power supply capacity is only 203 MW and dependable power supply capacity is 180 MW, and this just covers present peak load in the system. In general, maintenance cost, including parts replacement cost for diesel engine generators increases with the aging of the engine. General life time of the engine is 15 years, and it become increasingly difficult to obtain spare parts after 15 years of service time. A total of 87% of the diesel engine generators used presently are more than 15 years old already and among these, 29% are engines older than 15 years. In addition to the upheaval in the diesel oil price, higher maintenance cost has become a heavy burden for PLN in East Kalimantan.
29%
48%
9%
14%
30 Years
15-30 Years
13 Years
Less than 10 Years
Source: PLN
Fig. 4 Aging of Diesel Power Generator Mahakam Systems
The operation of diesel engine generators will be phased out starting in 2007 and completing in 2010, as shown below. At present, PLN is trying to develop new power plants in the form of IPPs (Independent Power Producers) in order to make up for the phased out diesel capacity and still meet the increasing demand.

7
PLTD Retirement Schedule & Supply Capacity (MW)
127
75
26
00
20
40
60
80
100
120
140
2007 2008 2009 2010
Year
MW
CAPABILITY RETIREMENT(MW) (Year)
PLTD KR ASAM DIESSEL PP 28 2008PLTD KALTIMEX BPP 12 2008PLTD KUKAR 8 2008PLTD PEMKOT BPP 4 2008PLTD KLEDANG DIESSEL PP 31 2009PLTD GN MALANG DIESSEL P 18 2009PLTD BATAKAN DIESSEL PP 26 2010
TOTAL 127
UNIT
Source: PLN
Fig. 5 Diesel Generator Retirement Program Mahakam System
PLN is planning to install new power plants to supplement the retired diesel engine generators and also to meet the increasing power demands in the system. Following is the 10 year power supply plan presented in 2006 by PLN.
Table 4 PLN Power Supply Plan (10 Years) 2006
Coal
Gas
Gas
Biomass
Gas
Gas
Coal
Coal
Gas
Coal
Fuel
2013100PLTGU
201550PLTG
2010302 X 15KuaroPLTU Biomass
201565PLTU
2009/101502 X 75BontangPLTGU Bontang
2009802 x 40SenipahPLTG Balikpapan
2008/09502 X 25BukuanPLTU Mulut Tambang
2008/091202 X 60TJ BatuPLTU Kaltim
2008201 X 20TJ BatuPLTG Menamas
2007/08502 X 25TJ BatuPLTU TJ Batu
TotalUnitYear
Capacity (MW)LocationProject
Source: PLN Among these listed projects, two 25 MW installations for PLTU Tanjung Batu were scheduled to be commissioned in the end 2005. However, the construction work is suspended due to a delay of financial closure. According to recent information, the facilities are rescheduled to complete one unit in 2007 and 2008 for the second unit.
8
The No. 1 Unit of the PLTG Menamas using a 20 MW gas turbine generator has already been completed and is operational. Because of a shortage in natural gas supply, however, diesel fuel is used for power generation. The No. 2 Unit is scheduled to start operation in 2008, and supply of natural gas should be secured. Two 60 MW units for PLTU Kaltim are planned near the existing Embalut Substation in Tanjung Batu. Further power plant construction plans until 2010 include PLTU Mulut Tambang, PLTG Balikpapan, PLTGU Bontang, and PLTU Biomass. However these projects will depend also on the schedule for the construction of the new power transmission lines. The power project development plans for the period after 2010 rely on the utilization of natural gas. In view of the gas supply security in terms of price and supply reliability, it will be more advantageous to utilize coals in the area. In recognition of this situation, PLN is considering to change direction in future electric power development in favor of coal-based power plants. In this survey, the above 10-year plan was examined through Load Flow Analysis. Since the majority of new projects are located in the north part of the Mahakam System, it may not be feasible to implement the 10-year plan as it was planned. They would necessitate a major expansion of the existing substations and a large capacitor to accommodate a voltage reduction in the southern districts around Balikpapan. In discussion with PLN Balikpapan, it was revealed that the 10-year plan has been reviewed. The PLTU Kaltim 2x60 MW units of TJ Batu will be moved to Penajam and the PLTU Mulut Tambang 2x25 MW units of Bukuan to Samboja. This would result in a dramatic improvement in the power balance between the south and north. It would also make it possible to build a 100 MW power plant near Samarinda in 2012. To increase the transmission capacity and also improve the transmission stability, a loop configuration is also recommended by installing a 47 km transmission line between Bukuan and Senipha. Table 5 shows the results of the study conducted jointly with PLN Balikpapan.
9
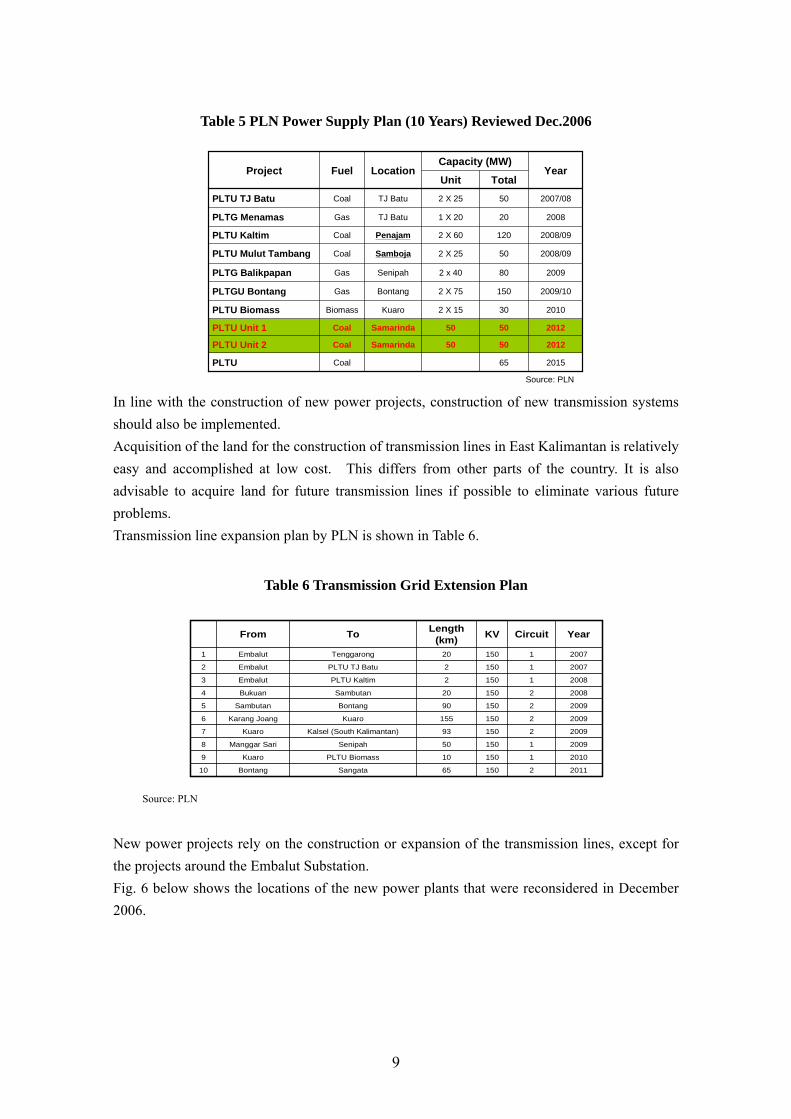
Table 5 PLN Power Supply Plan (10 Years) Reviewed Dec.2006
Coal
Coal
Coal
Biomass
Gas
Gas
Coal
Coal
Gas
Coal
Fuel
20125050SamarindaPLTU Unit 1
20125050SamarindaPLTU Unit 2
2010302 X 15KuaroPLTU Biomass
201565PLTU
2009/101502 X 75BontangPLTGU Bontang
2009802 x 40SenipahPLTG Balikpapan
2008/09502 X 25SambojaPLTU Mulut Tambang
2008/091202 X 60PenajamPLTU Kaltim
2008201 X 20TJ BatuPLTG Menamas
2007/08502 X 25TJ BatuPLTU TJ Batu
TotalUnitYear
Capacity (MW)LocationProject
Source: PLN In line with the construction of new power projects, construction of new transmission systems should also be implemented. Acquisition of the land for the construction of transmission lines in East Kalimantan is relatively easy and accomplished at low cost. This differs from other parts of the country. It is also advisable to acquire land for future transmission lines if possible to eliminate various future problems. Transmission line expansion plan by PLN is shown in Table 6.
Table 6 Transmission Grid Extension Plan
2011 2 150 65 SangataBontang10
2010 1 150 10 PLTU BiomassKuaro9
2009 1 150 50 SenipahManggar Sari8
2009 2 150 93 Kalsel (South Kalimantan)Kuaro7
2009 2 150 155 KuaroKarang Joang6
2009 2 150 90 BontangSambutan5
2008 2 150 20 SambutanBukuan4
2008 1 150 2 PLTU KaltimEmbalut3
2007 1 150 2 PLTU TJ BatuEmbalut2
2007 1 150 20 TenggarongEmbalut1
YearCircuitKVLength (km)ToFrom
Source: PLN
New power projects rely on the construction or expansion of the transmission lines, except for the projects around the Embalut Substation. Fig. 6 below shows the locations of the new power plants that were reconsidered in December 2006.

10
D
D
D
D
D
U
U
G
G
U D
D
G
D
U
Kuaro
PLTGU2 x 75 MWBONTANG
Ren 2009/10
PLTG2 x 40 MWSENIPAHRen 2008
PLTU KALTIM2 x 60 MW
Ren 2008/09
PLTU BIOMASS30 MW
Ren 2010
Senipah
Embalut
Sambutan
PLTU2 x 25 MW
INDONESIA POWER
Ren 2008/09
U
PLTU2 x 50 MW
SAMARINDARen 20012
G
PLTGU MENAMAS
20 MWTJ BATURen 2008
PLTU2 x 25 MWTJ BATURen 2007
Source: PLN
Fig. 6 Locations of New Power Plants
Table 7 shows the power supply and demand forecast for the Mahakam System, including expansion of the power supply area and new power projects.
Table 7 Power Supply and Demand Forecast
No. NAMA 2006 2007 2008 2009 2010 2011 2012 2013 2014 2015 2016Demand
1 Mahakam System 2006 200 203 205 223 249 281 309 340 375 414 4562 Mahakam System Extention 0 9 24 62 70 104 115 126 139 154 1693 Total Peak Load Forecast 200 213 229 286 319 385 423 466 514 567 6254 Requred Capacity (20 % Margin) 239 255 274 343 383 462 508 559 616 680 750
Supply1 Existing 203 203 203 151 102 76 76 76 76 76 762 PLTD Retirement 0 0 -52 -49 -26 0 0 0 0 0 03 Existing Total 203 203 151 102 76 76 76 76 76 76 764 Scheduled Future Project
PLTU TJ Batu 50 50 50 50 50 50 50 50 50 50PLTG Menamas 20 20 20 20 20 20 20 20 20PLTU Kaltim 60 120 120 120 120 120 120 120 120PLTU Mulut Tambang 25 50 50 50 50 50 50 50 50PLTG Balikpapan 80 80 80 80 80 80 80 80PLTGU Bontang 75 150 150 150 150 150 150 150PLTU Biomass 30 30 30 30 30 30 30PLTU Samarinda Proposed 100 100 100 100 100PLTU 65 65
6 Total Supply Capacity 203 253 306 497 576 576 676 676 676 741 741 Source: PLN
Fig. 7 shows the total power supply capacity, peak load and the required capacity.

11
Power Supply and Demand Forecast
0100200300400500600700800
2006 2007 2008 2009 2010 2011 2012 2013 2014 2015 2016
Year
MW
Total Supply Capacity Total Peak Load Forecast Requred Capacity (20 % Margin)
Source: PLN
Fig. 7 Power Supply and Demand Forecast
It is clear that the addition of 100-150 MW new power capacity will be required in the Mahakam System in 2012-2015.

12
3 Review of Fuel for Power Generation
Proposed Power Plants should be designed to fully utilize non-marketable fine coals and dirty coals. These coals are known as pollutants of the river environment and need to be eliminated. Non-marketable fine coal is currently generated on a scale of 400,000 tons per annum. Although the definite quantities have not been confirmed yet because of the closure of coalmines and the opening of new coal mines in the future, it can be forecast that the minimum amount at the present is around 100,000 tons per annum. Dirty coal output is estimated to amount to 5- 10% of total coal production and is likely to be produced in large quantities. Since non-marketable fine coal is essentially a serious factor of environmental pollution, the dirty coal usage quantities will be determined on the premise that the entire amount of fine coals are utilized at that time. The physical properties of the non-marketable coal as a fuel (calorific content, ash content, sulfur content, etc.) vary significantly. While, even for the same non-marketable coal, there are variations according the locations from which the non-marketable coal comes, the ash tends to have a low melting point. In contrast, the ash of dirty coal tends to have a high melting point. One of the most important factors in the design of power plants is the heating value of the coal, and this may vary between 1,500 kcal/kg and 6,000 kcal/kg. It is therefore necessary to adjust the total heating value using a reference coal with known properties (for supplemental combustion adjustment) for stable power generation and incinerating these non marketable coals. (1) Non-marketable fine coal The results of analysis of non-marketable fine coal have shown that the heating value may vary significantly from 1,500 kcal/kg to 4,500 kcal/kg. Presuming, however, that the coal has a regular distribution, the average calorific value is 2,920 kcal/kg (AR). The average ash content is 24.7% (AR). The type of sulfur is actually divided into combustible sulfur and incombustible sulfur compounds. In these calculations, the total sulfur content is used as the basis and the average sulfur content becomes 1% (AR). As ash has a low fusion temperature, caution is required in the operation. Fig. 8 shows the relationship between the ash content and the heating value (AR) based on non-marketable fine coal sample tests. Fig. 9 shows the sulfur content of each sample. Table 8 gives the average physical properties of non-marketable fine coal.

13
Non Marketable Fine Coal
0
500
1000
1500
2000
2500
3000
3500
4000
4500
5000
0 10 20 30 40 50 60 70
Ash (%)
As
Receiv
ed
(kcal/
kg)
Source: PLN
Fig. 8 Non Marketable Fine Coal Ash Contents
Non Marketable Fine Coal
0
0.5
1
1.5
2
2.5
3
3.5
1 2 3 4 5 6 7 8 9 10 11 12 13 14 15
Samples
Sulfur
%
Source: PLN
Fig. 9 Non Marketable Fine Coal Sulfur Contents

14
Table 8 Average Physical Properties of Non-marketable Fine Coal
ADB 3935AR 2920AR 31
Inherent Moisture (%) ADB 7.90Ash (%) ADB 33.30Volatile (%) ADB 29.90Fixed Carbon ADB 30.50Fuel Ratio (%) ADB 1.02Total Sulfur (%) ADB 1.35Carbon (%) DB 48.00Hydrogen (%) DB 3.45Nitrogen (%) DB 1.13Oxygen DB 12.63Total Sulfur (%) DB 1.40Combustible Sulfur (%) DB 0.60Non-Combustible Sulfur (%) DB 0.80Chloride DB 0.01 and lessSiO2 (%) DB 61.50Al2O3 (%) DB 12.90Fe2O3 (%) DB 6.74CaO (%) DB 8.44MgO (%) DB 1.39Na2O (%) DB 0.97K2O (%) DB 1.25TiO2 (%) DB 0.75SO3 (%) DB 3.22P2O5 DB 0.12Oxidizing ConditionInitial Deformation Temp. (Deg C) 1135Softening Temp. (Deg C) 1140Hemispherical Temp. (Deg C) 1220Fluid Temp. (Deg C) 1490Reducing ConditionInitial Deformation Temp. (Deg C) 1070Softening Temp. (Deg C) 1090Hemispherical Temp. (Deg C) 1140Fluid Temp. (Deg C) 1450
HHV (kcal/kg)HHV (kcal/kg)
Total Moisture (%)
Non Marketable Fine Coal
Prox.Analysis
UltimateAnalysis
Ash Analysi
AshFusibilityTemperat
ure
Source: PLN
(2) Dirty Coal Result of the analysis of dirty coal samples have shown that the heating value varies significantly from 2,000 kcal/kg to 6,000 kcal/kg. Presuming, however, that the coal has a regular distribution, the average calorific value is 3,840 kcal/kg (AR). The average ash content is 20.7% (AR). As stated in the previous section, total sulfur content is used as the basis and the average sulfur content is 0.67% (AR). In contrast to non-marketable fine coal, non-marketable dirty coal is characterized as having a higher ash fusion temperature. Fig. 10 shows the relationship between the ash content and the heating value (AR) based on non-marketable dirty coal samples analysis. Fig. 9 shows the sulfur content of each sample.

15
Table 9 gives the average physical properties of non-marketable dirty coal.
Dirty Coal
0
1000
2000
3000
4000
5000
6000
7000
0 10 20 30 40 50 60
Ash (%)
As
Rece
ived
(kc
al/kg
)
Source: PLN
Fig. 10 Non Marketable Dirty Coal Ash Contents
Dirty Coal
0
0.5
1
1.5
2
2.5
3
1 2 3 4 5 6 7 8 9 10 11
Samples
Sul
fur
%
Source: PLN
Fig. 11 Non Marketable Dirty Coal Sulfur Contents

16
Table 9 Average Physical Properties of Dirty Coal
ADB 5601AR 3840AR 20
Inherent Moisture (%) ADB 10.00Ash (%) ADB 30.20Volatile (%) ADB 29.80Fixed Carbon ADB 30.50Fuel Ratio (%) ADB 1.02Total Sulfur (%) ADB 0.97Carbon (%) DB 48.00Hydrogen (%) DB 3.45Nitrogen (%) DB 1.13Oxygen DB 12.63Total Sulfur (%) DB 1.10Combustible Sulfur (%) DB 0.50Non-Combustible Sulfur (%) DB 0.60Chloride DB 0.01 and lessSiO2 (%) DB 64.52Al2O3 (%) DB 20.35Fe2O3 (%) DB 3.29CaO (%) DB 1.50MgO (%) DB 1.62Na2O (%) DB 1.48K2O (%) DB 2.22TiO2 (%) DB 0.88SO3 (%) DB 0.85P2O5 DB 2.32
Initial Deformation Temp. (Deg C)Softening Temp. (Deg C)Hemispherical Temp. (Deg C)Fluid Temp. (Deg C)
Initial Deformation Temp. (Deg C) 1380Softening Temp. (Deg C) 1420Hemispherical Temp. (Deg C) 1450Fluid Temp. (Deg C) 1500
Oxidizing Condition
Reducing Condition
Non Marketable Dirty Coal
Prox.Analysis
UltimateAnalysis
Ash Analysi
AshFusibilityTemperat
ure
HHV (kcal/kg)HHV (kcal/kg)
Total Moisture (%)
Source: PLN
(3) Supplement Coal Supplemental Coal with known physical properties should be utilized to achieve steady combustion when using a coal with unstable properties. For the purpose of power generation, about half of the heating output has to be supplied by a supplement coal. In this Project, it is proposed to utilize low rank coals as supplement coal as it is available abundantly in the project area. Table 10 shows the physical properties of the coal that can be used as the supplement coal.

17
Table 10 Typical Supplement Coal Properties
ADB 5600AR 5000AR 25
Inherent Moisture (%) ADB 17Ash (%) ADB 5Volatile (%) ADB 39Fixed Carbon ADB 39Fuel Ratio (%) ADBTotal Sulfur (%) ADB 0.6Carbon (%) DB 72.62Hydrogen (%) DB 4.06Nitrogen (%) DB 1.54Oxygen DB 21Total Sulfur (%) DB 0.78Combustible Sulfur (%) DBNon-Combustible Sulfur (%) DBChloride DBSiO2 (%) DB 34.31Al2O3 (%) DB 27.9Fe2O3 (%) DB 17.57CaO (%) DB 9.02MgO (%) DB 0.95Na2O (%) DB 0.49K2O (%) DB 0.8TiO2 (%) DB 1.37SO3 (%) DB 5.98P2O5 DB 0.94
Initial Deformation Temp. (Deg C)Softening Temp. (Deg C)Hemispherical Temp. (Deg C)Fluid Temp. (Deg C)
Initial Deformation Temp. (Deg C) 1200Softening Temp. (Deg C) 1220Hemispherical Temp. (Deg C) 1240Fluid Temp. (Deg C) 1250
HHV (kcal/kg)HHV (kcal/kg)
Total Moisture (%)
Supplement Coal
Oxidizing Condition
Reducing Condition
Prox.Analysis
UltimateAnalysis
Ash Analysi
AshFusibilityTemperat
ure
Source: PLN
18
4 Selection of Power Plant Construction site
A power plant as a part of the energy infrastructure has an operational service life of over 30 years. It is therefore very important to study a range of different factors and aspects when selecting the construction site for a power plant as listed below.
Fuel transport costs Access to plant site including fuel and material delivery Access to power transmission systems or substations Soil conditions and possibility of water (flood) damage Water availability (No possibility of ingress of sea water) Proximity to a center of power demand Land acquisition Ensuring recycling/reuse of coal ash or securing land for ash disposal Understanding and cooperation of local people
Present coal transportation uses river systems. Transportation of coal on public roads by trucks is prohibited by law. As a result, fuel transport depends primarily on river barges. For the ease of fuel delivery, the power plant location should therefore be accessible by river barges. A site facing a river is also desirable for water pumping. Location of the water intake should be free from the risk of seawater back-flow in the river system. The power plant should be connected to the existing power transmission network. The location of the construction site should be preferably near an existing substation. If the location of the power plant is distant from any substations, it may take more time and money to acquire the land for the power transmission lines, and may impact the overall construction schedule. It is also important to take the stability of the system and future expandability fully into account in the design of the transmission systems. It is not desirable to connect a large scale power plant into branch lines in which multiple power plants are already connected. A location adjacent to a river is prone to the risk of flooding. Construction in a location liable to flood damage should be avoided, since the power plant is required to run even under emergency or abnormal conditions. It is also important to select a location where soil is solid and hard and capable of supporting heavy rotary machinery. River side locations tend to necessitate the long pipes through the soft alluvial layers to reach the bed rock. The soil condition has a major impact on the construction costs and schedule.

19
Land acquisition is a tedious problem. Public land without any future plan is preferable. If public land is not available, the land with clear and simple ownership is desirable. It is also necessary to resolve the issue of ash handling and disposal from coal-fired power plants. Coal ash is widely used as a material for cement or as an aggregate by the construction industry. By cooperating with the cement industry, it will be possible to achieve the Zero-Emission Concept from a Coal Power Plant. When it is not possible to enlist the cooperation with the cement industry the only alternative is to acquire landfills for ash disposal as an industrial waste. In this case, a statutory duty for the management and operation of the landfill will persist for 30 years after the power plant has been taken out of operation. At present, BPPT and the Indonesia Cement Association are carrying out a detailed survey on ash utilization. Generally, the ash of Indonesian coal has very low heavy metals content and not reachable. It is believed that it would not become an environmental or health hazard. At present, there is a great demand for coal ash and it is expected that the project will be able to achieve the Zero Emission goal. The most important factor is to enlist the understanding and cooperation of the local people around the construction site. As shown in Fig. 12 five candidate locations were surveyed under this Study. (1) Old ferry terminal site (Owned by Samarinda City) (2) Land owned by Daya Desar Corporation (Samarinda acting as mediator) (3) Land owned by Kiyani Lestari Corporation (Samarinda acting as mediator) (4) Land privately owned by Balik Buaya (Samarinda acting as mediator) (5) Bukit Baiduri Coalmine (Owned by the Provincial government and leased to the Coalmine)

20
Gl. Harapan
Gl. Bukuan
Gl. Tenkawang
1. Old Ferry Terminal2. Daya Besar
3. Kiyani Lestari4. Balik Buaya
5. Bukit Baiduri
Source: PLN
Fig. 12 Power Plant Site Selection
(1) Old ferry terminal site (Owned by Samarinda City) The Samarinda City-owned old ferry terminal is the old landing place for the ferry crossing the Mahakam River. This ferry terminal was used before the Mahakam Bridge was built. At present, the interior part is an empty plot/football ground, and the riverbanks flanking the Balikpapan – Samarinda Road are used as a mooring area for the ships and barges, and partly as a timber storage yard for the nearby plywood factory. Because the land is owned by the City of Samarinda the acquisition of the land will not be a problem. On the other hand, however, the ground area is only about 5 ha and this is a little too small for a power plant construction site. The residential area has extended around the land and therefore the site will not be a candidate for the construction of the power station. (2) Land owned by Daya Desar Corporation (Samarinda City acting as mediator) The land is owned by Daya Desar Corporation, and the size of the area is 17 ha. Presumably, the company purchased this plot to build a new factory but has not started the construction work yet. At present, it is rented out as farming land. The City of Samarinda can act as proxy in the negotiations for the acquisition of the land. Furthermore, the plot adjoins P.T. Semen Tunasa, which is a cement-packaging factory. Considering the potential for synergy with the cement factory, it does seem an ideal choice. Yet, the ground is unfavorable. When the cement-packaging factory was built, more than 50m of piles were necessary. (3) Land owned by Kiyani Lestari Corporation(Samarinda acting as mediator) The land plot owned by PT. Kiyani Lestari Corporation was a plywood production plant that stopped operation in 2004. Because the factory equipment and the land were used as collateral for raising the loan on the property from the bank, all assets are now entrusted to the courts. It

21
would be possible for the City of Samarinda to act as proxy in the land purchasing negotiations (auction sale, etc.). The size of the plot is 20 ha. It is located near the Samarinda Container Port, and its position is not so unfavorable but the shape of the plot is long and narrow, with the part facing the river being rather narrow. Also, the pump station of the Samarinda Water Works is positioned in the part facing the river. The reliance on river transport may cause a problem. There are also land access problems as it is necessary for land transport to pass through the residential housing estate to access the site. (4) Land privately owned by Balik Buaya (Samarinda acting as mediator) The land plot in the Balik Buaya area is in private ownership and has a size of about 10ha. It offers a possibility to secure a large ground area when the adjacent land is included. Among the candidate sites, it is located farthest downstream. The plot is currently a secondary forest. In 1997, saline water (seawater) back flowed to this point. There is no residential habitation in the vicinity. (5) Bukit Baiduri Coalmine (Owned by the Provincial government and leased to the Coalmine) PT. Bukit Baiduri is a coalmine company. The property rights of the land belong to the regional government, and the land is leased to this company. The property will be returned to the local government after termination of the coal mining in the area. The old coal shipping area of this land, now used as a coal storage yard, is considered as a candidate site. There are no problems with the land acquisition, water intake, soil condition and ash landfill, and it is considered to satisfy all conditions required for the selection of the site for the power plant. Fig. 13 is a photo of the Site.
Old Coal Export Facilities
Open Cut Mine for Ash Disposal
Perfect Site for Power Plant but Transmission Line need to cross The River
Source: PLN
Fig. 13 Power Plant Site Selection-PT Bukit Baiduri
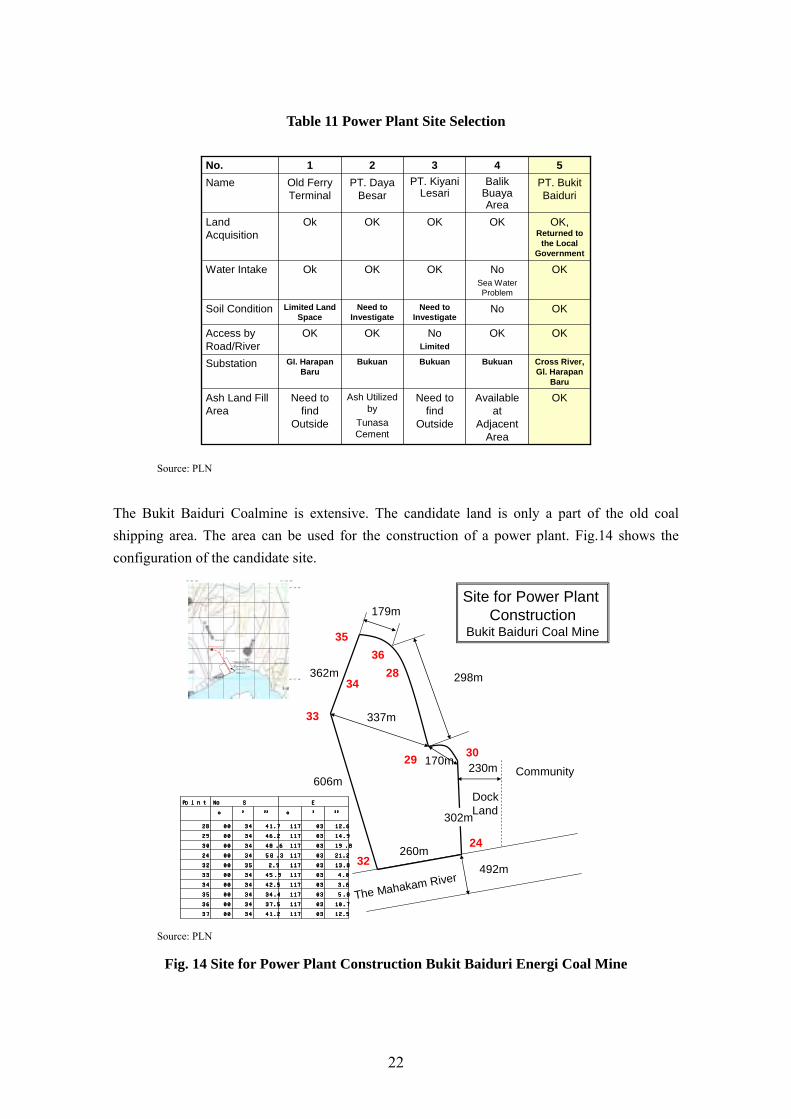
Table 11 shows the results of an overall assessment of the five candidate sites above.
22
Table 11 Power Plant Site Selection
Cross River, Gl. Harapan
Baru
BukuanBukuanBukuanGI. HarapanBaru
Substation
OKOKNoLimited
OKOKAccess by Road/River
OKNoNeed to Investigate
Need to Investigate
Limited Land Space
Soil Condition
54321No.
Need to find
Outside
OK
OK
PT. KiyaniLesari
OKAvailableat
Adjacent Area
Ash Utilized by
TunasaCement
Need to find
Outside
Ash Land Fill Area
OKNoSea Water Problem
OKOkWater Intake
OK, Returned to
the Local Government
OKOKOkLand Acquisition
PT. BukitBaiduri
BalikBuayaArea
PT. DayaBesar
Old Ferry Terminal
Name
Source: PLN
The Bukit Baiduri Coalmine is extensive. The candidate land is only a part of the old coal shipping area. The area can be used for the construction of a power plant. Fig.14 shows the configuration of the candidate site.
606m
362m
337m
170m
260m
302m
230m Community
179m
298m
492m
The Mahakam River32
33
34
3536
28
29 30
24
DockLand
Site for Power Plant Construction
Bukit Baiduri Coal Mine
12.5 03 117 41.2 34 0037
10.7 03 117 37.5 34 0036
5.8 03 117 34.4 34 0035
3.6 03 117 42.5 34 0034
4.0 03 117 45.9 34 0033
13.8 03 117 2.9 35 0032
21.2 03 117 58.3 34 0024
19.8 03 117 48.6 34 0030
14.9 03 117 46.2 34 0029
12.6 03 117 41.7 34 0028
”’°”’°
ESPoint No
12.5 03 117 41.2 34 0037
10.7 03 117 37.5 34 0036
5.8 03 117 34.4 34 0035
3.6 03 117 42.5 34 0034
4.0 03 117 45.9 34 0033
13.8 03 117 2.9 35 0032
21.2 03 117 58.3 34 0024
19.8 03 117 48.6 34 0030
14.9 03 117 46.2 34 0029
12.6 03 117 41.7 34 0028
”’°”’°
ESPoint No
117 ゚ 03’ 00” 117 ゚ 04’ 00”
00 ゚ 34’ 00”
00 ゚ 35’ 00”
Rice field
Rice field
Dockyard
WP, BBE
・Residential area ・Plywood plant
Sampling point
Source: PLN
Fig. 14 Site for Power Plant Construction Bukit Baiduri Energi Coal Mine

23
5 Non-Marketable Coal Transportation Cost
Transportation of non-marketable coal is not permitted over public roads and it is delivered by river barge. Fine non-marketable coal is generated in the coal washery plants at the river side. It has been confirmed that this fine non-marketable coal can be transported by ordinary barges. An important factor to create a sustainable gathering system for this non-marketable coal is the introduction of incentive payments. As shown in Fig. 15, the barge loading cost for fine non-marketable coal is 3 USD/ton, the barge transportation costs are 3 USD/ton and the barge unloading cost is 0.7 USD/ton. To ensure commercial sustainability, an incentive of 2 USD/ton is assumed to be necessary. Consequently, the delivery cost of fine non-marketable coal is 8.7 USD/ton. Transportation of dirty coal starts from the mining site. The cost breakdown is shown below. In the case of dirty coal, the mining costs at the mining site are 0.7 USD/ton, transportation to the riverside and handling costs are 4 USD/ton. Barge loading and unloading cost are the same as for fine coal. Delivery cost of this dirty coal at the power plant site is 13.4 USD/ton, inclusive of 2.0 USD/ton of incentive.
0.0 0.70.0
4.0
3.0
3.0
3.0
3.0
0.7
0.7
2.0
2.0
0.0
2.0
4.0
6.0
8.0
10.0
12.0
14.0
16.0
Fine Coal Dirty Coal
US $
/to
n
Incentive
Barge Unloading Cost
Barge Transportation Cost
Barge Loading Cost
Mining Site Handling Cost
Mining Cost
8.7
13.4
Source: PLN
Fig. 15 Non Marketable Coal Gathering Cost
Once these non marketable coals are utilized for power generation, such non-marketable coals will be priced as stated above. In view of the coal purchasers or power plant operators, quality and price of such will be examined. Question of “what they paid for and who is the guarantor of the quality” should be answered. In the long run, coal supply terms and conditions should be documented in the form of a “Fuel Supply Agreement”.
24
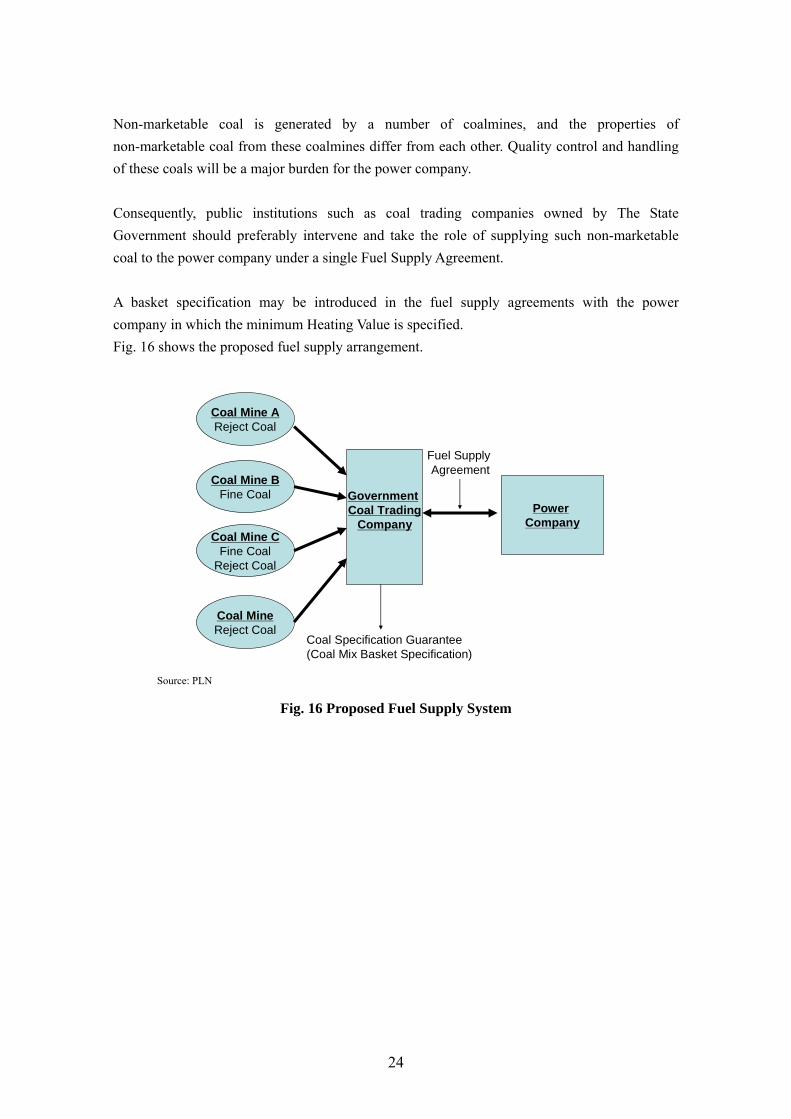
Non-marketable coal is generated by a number of coalmines, and the properties of non-marketable coal from these coalmines differ from each other. Quality control and handling of these coals will be a major burden for the power company. Consequently, public institutions such as coal trading companies owned by The State Government should preferably intervene and take the role of supplying such non-marketable coal to the power company under a single Fuel Supply Agreement. A basket specification may be introduced in the fuel supply agreements with the power company in which the minimum Heating Value is specified. Fig. 16 shows the proposed fuel supply arrangement.
Coal Mine AReject Coal
Coal Mine BFine Coal
Coal Mine CFine Coal
Reject Coal
Coal MineReject Coal
Government Coal Trading
CompanyPower
Company
Coal Specification Guarantee(Coal Mix Basket Specification)
Fuel Supply Agreement
Source: PLN
Fig. 16 Proposed Fuel Supply System

25
6 Investigation of Power Generating Capacity
Following are the general steps to be taken in the decision making for optimum power generation capacity in a given grid system. Power Supply and Demand Forecast System Capacity and Stability via Load Flow Analysis Non marketable coal availability and cost of delivery Economics In accordance with the power supply and demand forecast by PLN, 150 MW of new power supply capacity will be required in 2012-2015, and this requirement has been included in the 2006 Ten-Year Plan. This plan envisages the use of natural gas as the power fuel. However, considering the unstable supply of gas and unknown future gas price situation, a coal based power plant is a highly viable option and is considered to be a realistic choice. Based on the original PLN Ten-Year Plan, a Load Flow Analysis was carried out assuming that new power generation capacity of 2x75 MW (150 MW, start of operation 2012-2015) is assumed in the Samarinda area. In this study, the computer program known as Power System Simulator for Engineers (PSS/E) version 29.4 was used, assisted by PLN JASER-SKT and BPPT. The result suggested that the Original Ten-Year Plan may not necessarily be feasible in view of transmission capacity and power balance. The first investigation results were submitted to PLN Balikpapan in October 2006. PLN reviewed its power development plan based on the report and prepared a new power development plan in December 2006 without changing the framework of the original Ten-Year Plan. After a series of trial and error modifications, significant improvement on the power generation plan and transmission system has been demonstrated. New power generating capacity of 2x50 MW is confirmed in the Samarinda area and transmission capacity and stability is improved significantly with a minimum investment cost. In the study, a loop configuration between Balikpapan and Samarinda is proposed by installing a 47 km long transmission line between the Bukuan and the Sehnipha substations. Economics in this study include the investment for this 47 km transmission line. Access to the power fuel is an important factor of the power plant economics. The fuel availability or supply capacity and delivery price are important factors to decide the power capacity and economics. As a result of investigation, enough fuel to support 100 MW or 150 MW power plant is confirmed in the Samarinda area, at the lowest cost.
26
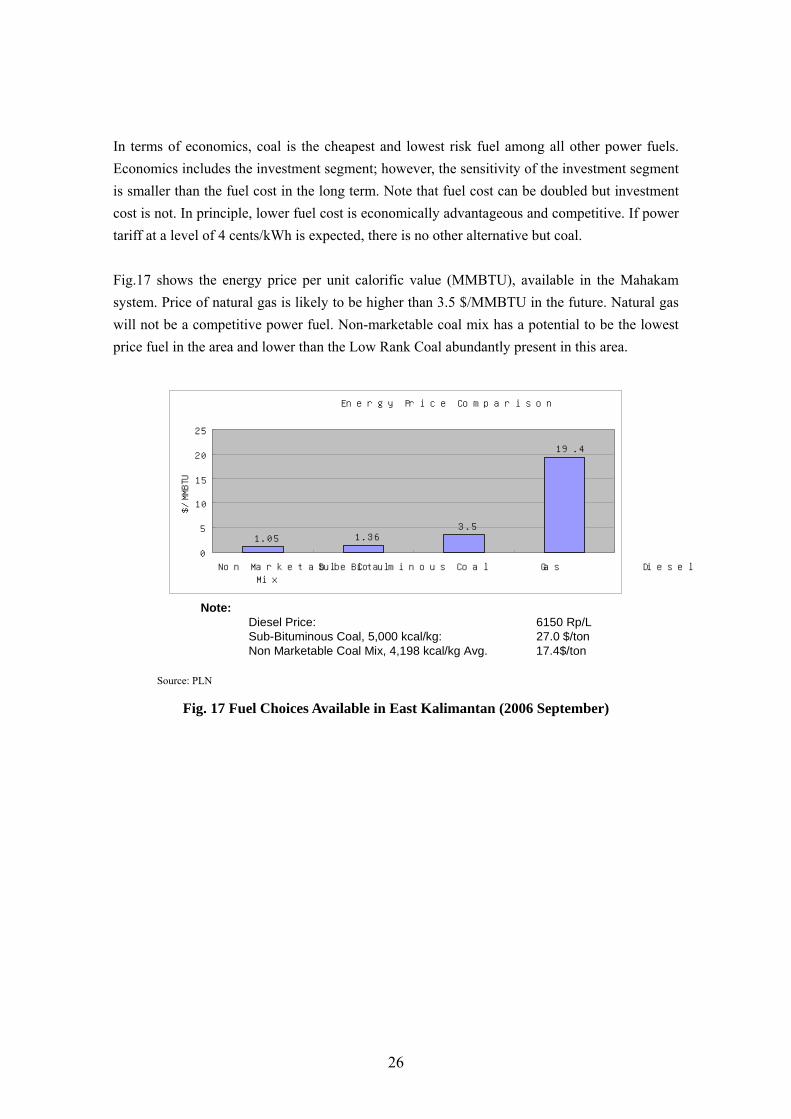
In terms of economics, coal is the cheapest and lowest risk fuel among all other power fuels. Economics includes the investment segment; however, the sensitivity of the investment segment is smaller than the fuel cost in the long term. Note that fuel cost can be doubled but investment cost is not. In principle, lower fuel cost is economically advantageous and competitive. If power tariff at a level of 4 cents/kWh is expected, there is no other alternative but coal. Fig.17 shows the energy price per unit calorific value (MMBTU), available in the Mahakam system. Price of natural gas is likely to be higher than 3.5 $/MMBTU in the future. Natural gas will not be a competitive power fuel. Non-marketable coal mix has a potential to be the lowest price fuel in the area and lower than the Low Rank Coal abundantly present in this area.
Energy Price Comparison
1.05 1.363.5
19.4
0
5
10
15
20
25
Non Marketable CoalMix
Sub Bituminous Coal Gas Diesel
$/M
MB
TU
Note:Diesel Price: 6150 Rp/LSub-Bituminous Coal, 5,000 kcal/kg: 27.0 $/ton Non Marketable Coal Mix, 4,198 kcal/kg Avg. 17.4$/ton
Source: PLN
Fig. 17 Fuel Choices Available in East Kalimantan (2006 September)
27
7 Load Flow Analysis
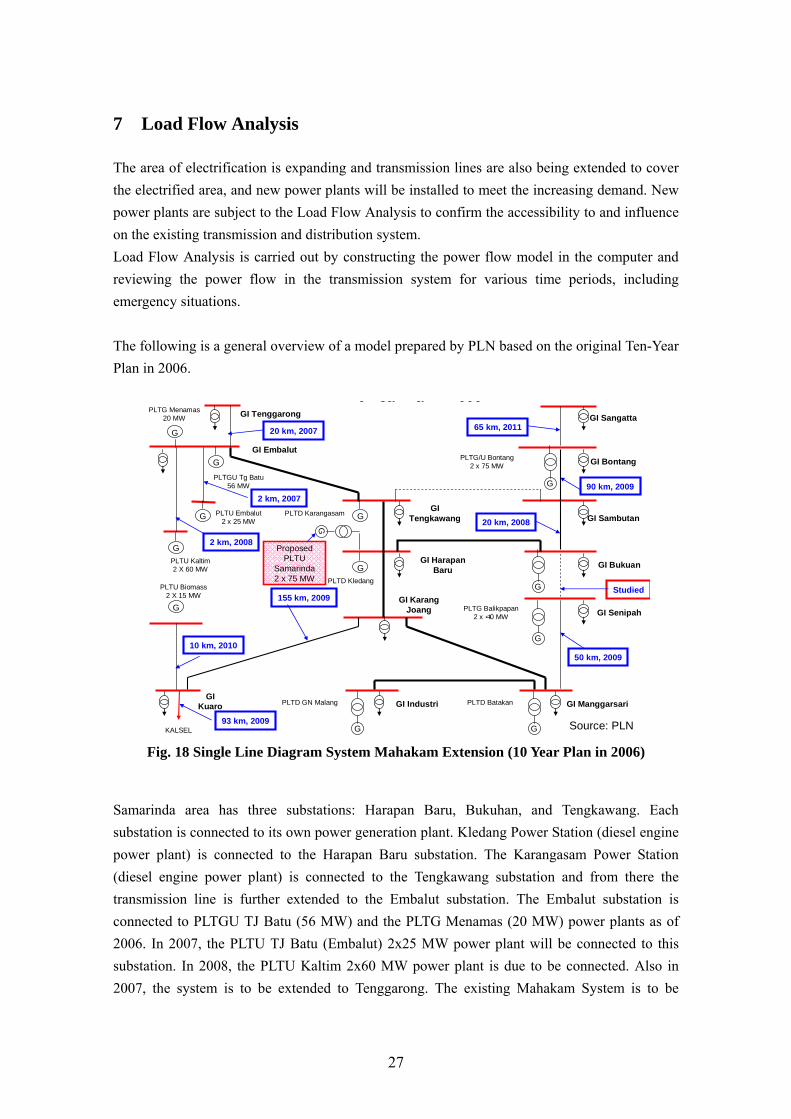
The area of electrification is expanding and transmission lines are also being extended to cover the electrified area, and new power plants will be installed to meet the increasing demand. New power plants are subject to the Load Flow Analysis to confirm the accessibility to and influence on the existing transmission and distribution system. Load Flow Analysis is carried out by constructing the power flow model in the computer and reviewing the power flow in the transmission system for various time periods, including emergency situations. The following is a general overview of a model prepared by PLN based on the original Ten-Year Plan in 2006.
GI IndustriGI
Kuaro
G
KALSEL
PLTU Biomass2 X 15 MW
GI ManggarsariPLTD GN Malang PLTD Batakan
GI KarangJoang GI SenipahPLTG Balikpapan
2 x 40 MW
GI Bukuan
PLTD Kledang
GI HarapanBaru
GI SambutanGI
TengkawangPLTD Karangasam
PLTGU Tg Batu56 MW
PLTU Embalut2 x 25 MW
PLTU Kaltim2 X 60 MW
GI BontangPLTG/U Bontang2 x 75 MW
GI SangattaGI Tenggarong
GI Embalut
G
G
G
G
G
0 ea a 006
G
PLTG Menamas20 MW
G G
G
G
20 km, 2007
2 km, 2007
2 km, 2008
155 km, 2009
10 km, 2010
93 km, 2009
50 km, 2009
65 km, 2011
90 km, 2009
20 km, 2008
Studied
Source: PLN
G
G
ProposedPLTU
Samarinda2 x 75 MW
Fig. 18 Single Line Diagram System Mahakam Extension (10 Year Plan in 2006)
Samarinda area has three substations: Harapan Baru, Bukuhan, and Tengkawang. Each substation is connected to its own power generation plant. Kledang Power Station (diesel engine power plant) is connected to the Harapan Baru substation. The Karangasam Power Station (diesel engine power plant) is connected to the Tengkawang substation and from there the transmission line is further extended to the Embalut substation. The Embalut substation is connected to PLTGU TJ Batu (56 MW) and the PLTG Menamas (20 MW) power plants as of 2006. In 2007, the PLTU TJ Batu (Embalut) 2x25 MW power plant will be connected to this substation. In 2008, the PLTU Kaltim 2x60 MW power plant is due to be connected. Also in 2007, the system is to be extended to Tenggarong. The existing Mahakam System is to be
28
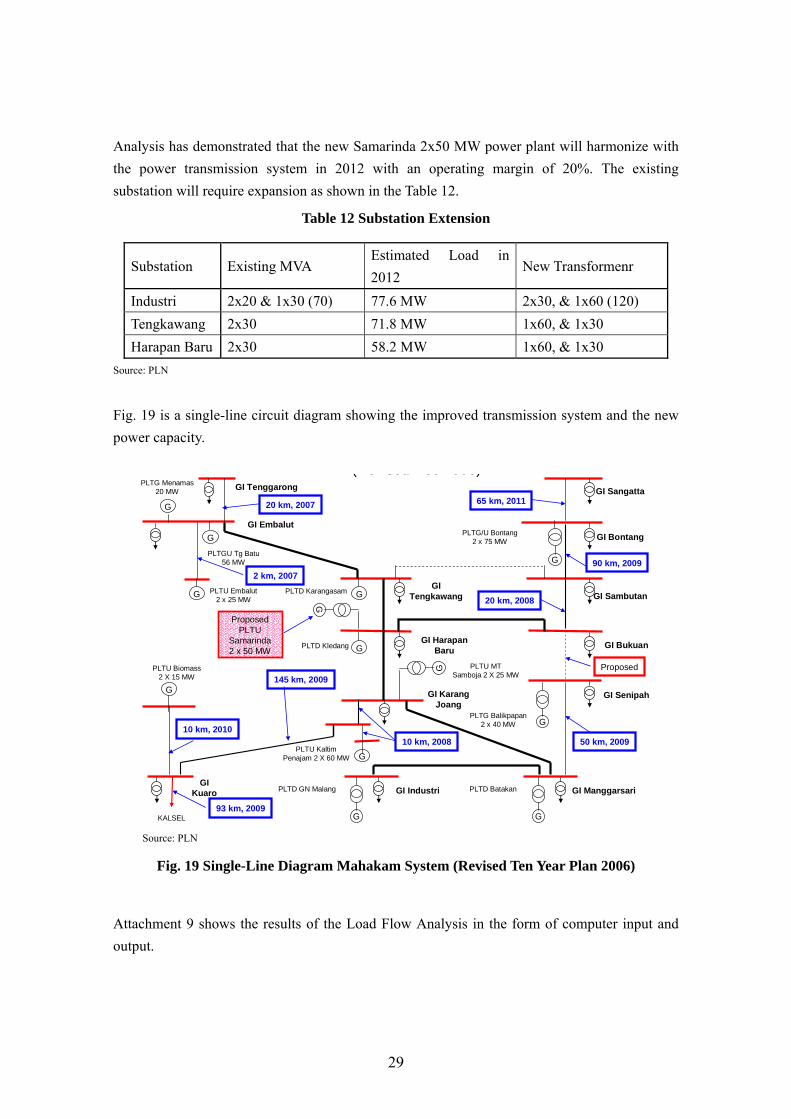
further extended from the Bakuan substation to Sambutan in 2008, to Bontang in 2009, and to Sangatta in 2011. In 2008/9, there are plans to build the PLTU Mulut Tambang 2x25 MW power plant around Sambutan and construct the PLTGU 2x75 MW power plant in Bontang in 2009. Balikpapan also has three substations: Karang Joang, Manggarsari, and Industri. The Karang Joang substation is connected to the Harapan Baru substation of Samarinda via a 75 km long, 150 kV transmission line. The transmission line is due to be extended from Karang Joang to Kuaro in 2009 and further to the South Kalimantan System. Construction of a new transmission line from the Kuaro substation to the Kuaro PLTU Biomass 2x15 MW power plant via a 10 km transmission line is scheduled in 2010. The Industri substation is connected to the GN Malang Power Station (diesel engine power plant). Manggarsari substation is connected to the Batakan Power Station (diesel engine power plant). The transmission line is to be extended from Manggasari to Senipah where the new PLTG Balikpapan 2x40 MW power plant is planned for 2009. As a result of the analysis, the Ten-Year Plan for 2006 will show the following problems by 2011, before introduction of new power capacity. (1) The Samarinda Harapan Baru and Tengkawang substations will be over capacity (2) The Balikpapan Manggasari and Industri substations will be over capacity. (3) A 100 MVAR capacitor needs to be installed to restore the voltage at Balikpapan. (4) There will be high transmission losses exceeding 2% of total power output. The analysis suggested that even if the original Ten-Year Plan is implemented, it will still be physically difficult to accommodate additional new power capacity in the system after 2012. To stabilize and increase capacity of the Mahakam System, relocation of planned power projects and loop configuration of the transmission system were recommended. PLN reexamined the entire system and improved the system as follows, after a series of trial and error redesigns and several trials of load flow analysis. (1) The PLTU Kaltim 2x60 MW plant will be relocated from Embalut (TJ Batu) to Penajam in the southern parts of Balikpapan and will be connected to the Girirejo substation. (2) The PLTU Mulut Tambang 2x25 MW plant will be relocated from Sanbutanor Bukuan to Samboja in the northern parts of Balikpapan and will be connected to the Girirejo substation. (3) A new 47 km long transmission line between Senipha and Bukuan substation will be installed to form a loop configuration between Samarinda and Balikpapan. (4) The Industri, Tengkawang, and Harapan Baru substation will be expanded. (5) New capacity of 2x50 MW can be installed in 2012 and connected to the Samarinda Harapan Baru substation.
29
Analysis has demonstrated that the new Samarinda 2x50 MW power plant will harmonize with the power transmission system in 2012 with an operating margin of 20%. The existing substation will require expansion as shown in the Table 12.
Table 12 Substation Extension
Substation Existing MVA Estimated Load in 2012
New Transformenr
Industri 2x20 & 1x30 (70) 77.6 MW 2x30, & 1x60 (120) Tengkawang 2x30 71.8 MW 1x60, & 1x30 Harapan Baru 2x30 58.2 MW 1x60, & 1x30
Source: PLN
Fig. 19 is a single-line circuit diagram showing the improved transmission system and the new power capacity.
GI IndustriGI
Kuaro
G
KALSEL
PLTU Biomass2 X 15 MW
GI ManggarsariPLTD GN Malang PLTD Batakan
GI KarangJoang
GI Senipah
PLTG Balikpapan2 x 40 MW
GI BukuanPLTD KledangGI Harapan
Baru
GI SambutanGI
TengkawangPLTD Karangasam
PLTGU Tg Batu56 MW
PLTU Embalut2 x 25 MW
PLTU KaltimPenajam 2 X 60 MW
GI BontangPLTG/U Bontang2 x 75 MW
GI SangattaGI Tenggarong
GI Embalut
G
G
G
G
G
( e sed ec 006)
G
PLTG Menamas20 MW
G G
G
G
20 km, 2007
2 km, 2007
10 km, 2008
145 km, 2009
10 km, 2010
93 km, 2009
50 km, 2009
65 km, 2011
90 km, 2009
20 km, 2008
Proposed
ProposedPLTU
Samarinda2 x 50 MW
PLTU MTSamboja 2 X 25 MW
G
G
Source: PLN
Fig. 19 Single-Line Diagram Mahakam System (Revised Ten Year Plan 2006)
Attachment 9 shows the results of the Load Flow Analysis in the form of computer input and output.
30
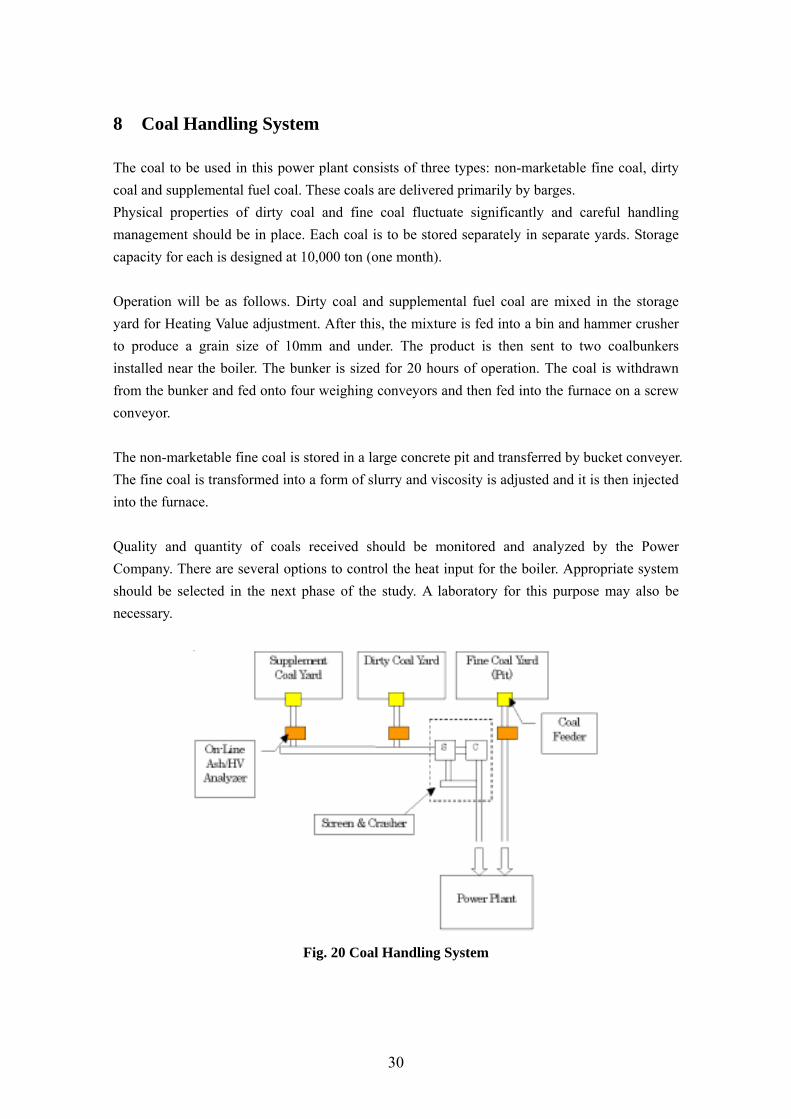
8 Coal Handling System
The coal to be used in this power plant consists of three types: non-marketable fine coal, dirty coal and supplemental fuel coal. These coals are delivered primarily by barges. Physical properties of dirty coal and fine coal fluctuate significantly and careful handling management should be in place. Each coal is to be stored separately in separate yards. Storage capacity for each is designed at 10,000 ton (one month). Operation will be as follows. Dirty coal and supplemental fuel coal are mixed in the storage yard for Heating Value adjustment. After this, the mixture is fed into a bin and hammer crusher to produce a grain size of 10mm and under. The product is then sent to two coalbunkers installed near the boiler. The bunker is sized for 20 hours of operation. The coal is withdrawn from the bunker and fed onto four weighing conveyors and then fed into the furnace on a screw conveyor. The non-marketable fine coal is stored in a large concrete pit and transferred by bucket conveyer. The fine coal is transformed into a form of slurry and viscosity is adjusted and it is then injected into the furnace. Quality and quantity of coals received should be monitored and analyzed by the Power Company. There are several options to control the heat input for the boiler. Appropriate system should be selected in the next phase of the study. A laboratory for this purpose may also be necessary.
Fig. 20 Coal Handling System
31
9 Power Plant Concept
The concepts of the proposed power plant will be as follows. · Capable of utilizing all types of coal fuel, including non-marketable coal. · Environmentally friendly power generating system · Supplying the electricity at the lowest cost Since the properties of non-marketable fine/dirty coals, especially heating values, vary from lot to lot and site to site, combustion performance will not be stable if it is burned as it is. In order to stabilize the combustion performance, use of the higher and stable heating value coal, called supplemental coal, will be required. The supplemental coal can be a low-rank coal, which is abundantly present in the area. To ensure stable combustion in the furnace, feed rate of each fuel is controlled to meet the boiler performance. Non-marketable coal with a high water and ash content are difficult to burn and therefore require a longer combustion or reaction time. For the environmental aspect, special care must be exercised to protect the riparian environment as the power facilities are built on the river side. Discharge of hot cooling water would impact the ecological system of the river. For this reason, a circulating cooling water system will be employed and no hot effluent water will be discharged to the river. The proposed power plant is to be equipped with internal desulfurization (de-SOx) systems to minimize the SOx emission level. Limestone powder is injected in the furnace with the coals and the sulfur in the coal reacts with the limestone to form gypsum (calcium sulfate) and this is recovered as part of the coal ash. To reduce NOx emission levels, a relatively low combustion temperature will serve to lower the level of NOx generation. The use of non-marketable fine coal and dirty coal will help reduce the fuel cost, and power generation cost can also be lowered. A CFB (Circulated Fluidized Bed Boiler) is recommended. It is suitable to combust low-heating value fuels in an efficient manner for complete combustion. There are two types of circulated fluidized-bed boilers: the internally circulating type or the externally circulating type. The internally circulating type is in general used for municipal waste incineration and waste heat can be recovered as electric power. Scale of the power generation is small. The scale of power generation is a maximum of around 10-30 MW. The application field of the externally circulating system is wide. A variety of fuels, including biomass, lignite, and also industrial waste can be combusted in an efficient manner. In the burning process, unburned carbon is rejected and returned back to the combustion section until

32
complete combustion is achieved. Only Flue gas with fine fly ash can pass through the cyclone to the boiler section. The largest CFB application is a lignite based power plant with 460 MW super critical boiler turbine generators in Europe. CFB can control the combustion gas temperature. This feature serves to reduce the NOx formation and also avoids reaching ash fusion temperature. If the combustion gas temperature exceeds the ash fusion temperature, these ashes will cling to the surface of the tubes and boiler walls, and as a result, maintenance cost will be higher and reliability of the boiler will be lower. Stoker type boiler is generally used for small scale power plant, however, this type will not be suitable for low caloric value coals or high ash content coals, which are difficult to combust. Pulverized boilers can combust high caloric value coals at a high efficiency and economically suitable for large scale power plant. In order to compete economically with a large scale pulverized coal boiler, small or middle scale boilers should use the combination of low priced coals, i.e, low calorie and high ash and sulfur coals, and CFBs. General idea of the boiler selection is shown as follows:
Source: JICA Study Team
Fig. 21 General Idea of the Boiler Selection

33
10 Outline of Power Plant
This proposed power plant utilizes non-marketable fine coal and dirty coals as power generation fuels. These coals have a high ash content, high moisture, and therefore low heating value. These are not saleable on the market. The type of the boiler proposed for this project is a CFB (circulated fluidized bed). This boiler is capable of combusting the above type of fuels in an efficient and stable manner to ensure steady steam generation. To achieve stable power generation from the use of these fuels, use of a stable coal with a little higher heating value, called supplemental coal, will be required. Use of low rank coal (lignite) is recommended for this purpose. Lignite is abundantly present around the proposed construction site. To meet the requirement of stable power supply, 50% of the total energy will be provided by the supplemental coal. Attachment 4 is a process flow sheet showing the power generating system proposed for this project. Attachment 5 shows the fine coal injection system.
10.1 Investigation of the Climatic Conditions for Design
The climatic condition should be established to design the power station. The climatic data is provided by the meteorological station in Samarinda City. An accurate understanding of the climatic conditions at the construction site is very important for the optimization of the facility. In accordance with the obtained data, the average ambient temperatures from 1982 to 2004 were as follows:
26.826.7
27.0
27.2
27.0
26.6
26.2
26.5
26.6
26.9 26.9
26.7
25.6
25.8
26.0
26.2
26.4
26.6
26.8
27.0
27.2
27.4
JAN FEB MAR APR MEI JUN JUL AUG SEP OKT NOP DES
Deg
C
Source: PLN
Fig. 22 Average Ambient Temperature (1982-2004 Samarinda City)
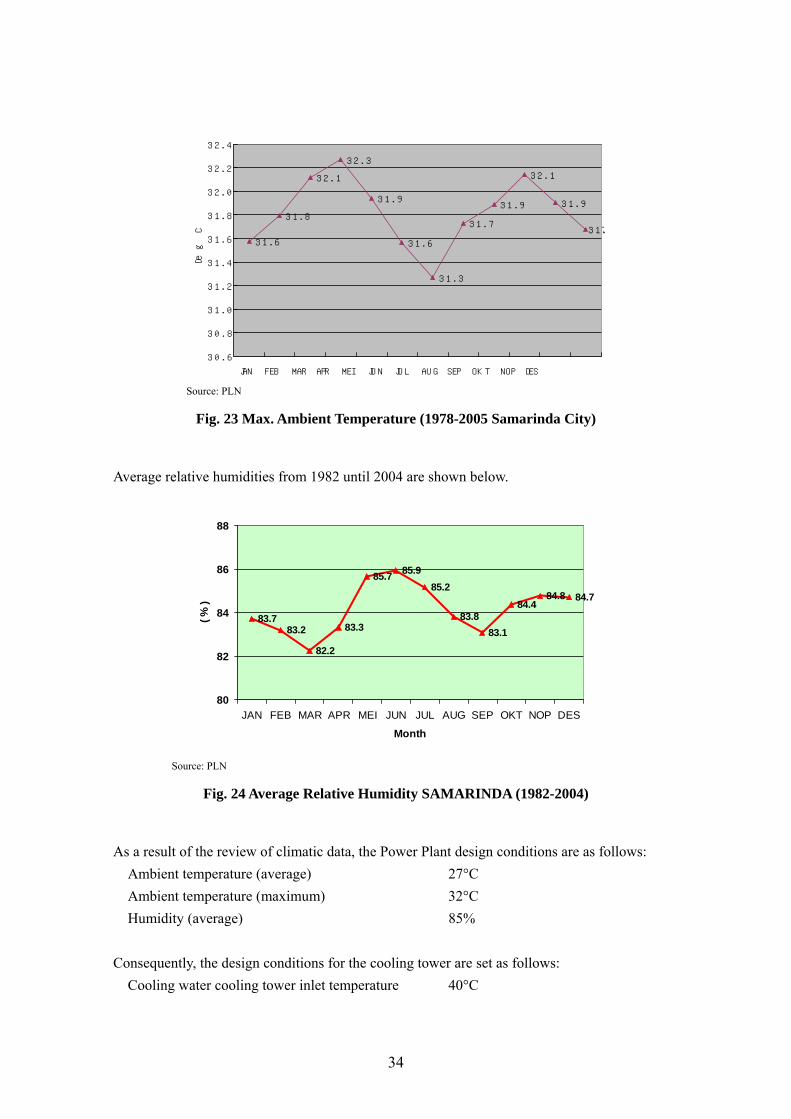
The maximum average temperatures from 1978 until 2005 are shown below.
34
31.6
31.8
32.1
32.3
31.9
31.6
31.3
31.7
31.9
32.1
31.9
31.7
30.6
30.8
31.0
31.2
31.4
31.6
31.8
32.0
32.2
32.4
JAN FEB MAR APR MEI JUN JUL AUG SEP OKT NOP DES
Deg
C
Source: PLN
Fig. 23 Max. Ambient Temperature (1978-2005 Samarinda City)
Average relative humidities from 1982 until 2004 are shown below.
83.783.2
82.2
83.3
85.7 85.985.2
83.883.1
84.484.8 84.7
80
82
84
86
88
JAN FEB MAR APR MEI JUN JUL AUG SEP OKT NOP DES
Month
( %
)
Source: PLN
Fig. 24 Average Relative Humidity SAMARINDA (1982-2004)
As a result of the review of climatic data, the Power Plant design conditions are as follows:
Ambient temperature (average) 27°C Ambient temperature (maximum) 32°C Humidity (average) 85%
Consequently, the design conditions for the cooling tower are set as follows:
Cooling water cooling tower inlet temperature 40°C

35
Cooling water cooling tower outlet temperature 30°C Condenser pressure 8.7 kPA
10.2 Investigation of Coal Mixing
In order to combust three types of fuel with different specifications in a stable manner it is necessary to determine, in broad terms, their mixing ratio by taking into consideration the particular properties of each type of coal. It is also necessary to take the gathering or delivery costs of these fuels into account. Table 13 shows the calculation results for the coal mix proportions for the base case of a 2x50 MW power plant. The capacity factor (availability) is assumed to be 75%.
Table 13 Coal Mixture Study (2x50 MW Units)
MainUnitItem
190,202176,963100,000t/yTotal Annual Fuel Consumption
222-No. of Unit
95,10188,48150,000t/yAnnual Fuel Consumption
11.8911.066.25t/hAverage Fuel Feed Rate
82%Average Boiler Load
8,000h/yOperating Hours
75%Operation (Capacity) Factor
14.4813.477.61t/hRated Fuel Feed Rate
4,7013,5752,615kcal/kgFuel Heating Value, LHV-AR
5,0003,8402,920kcal/kgFuel Heating Value, HHV-AR
68.048.119.9106 kcal/h
503515%Heat Input per Fuel
Supplement CoalDirty CoalFine CoalUnitItem
136.1106 kcal/h
158.3MWthFuel Heat Input
35%Power Generation Efficiency
90%Boiler Efficiency
39%Turbine Plant Efficiency
55.6MWeGross Power Output
10%Aux. Power Ratio
50MWeNet Power Output
Source: PLN
The coal-mix ratio on a weight basis is: 21% non-marketable fine coal, 39% dirty coal, and 41% supplemental coal. The utilization of this mix of these non-marketable coals also has economic advantages. The non-marketable fine coal has an average heating value of 2,920 kcal/kg. The gathering costs for this coal is 8.7 USD/ton, including the gathering incentive. Dirty coal has an average heating value of 3,840 kcal/kg and the gathering cost for this coal is 13.4 USD/ton. These are mixed

36
with the 5,000 kcal/kg heating value low-rank coal. Delivery price of this low rank coal at site is 27 USD/ton. Table 14 shows the summary of the coal mix. Average heating value of the coal mix is 4,198 kcal/kg and the price is 17.4 USD/ton.
Table 14 Comparison of prices of the different fuels per unit power output
Coal Mix Kcal/kg $/ton ton/year wt %Non Marketable Fine Coal 2,920 8.7 100,000 21.4Non Marketable Dirty Coal 3,840 13.4 177,000 37.9Supplement Low Rank Coal 5,000 27 190,000 40.7
Average 4,198 17.4 - - Source: PLN
Comparison of the fuel cost per unit power output (kWh) shows that a mixture of non-marketable coal, dirty coal, and supplemental coal will be able to offer electric power at 1.15 cent/kWh, the lowest fuel cost. On the other hand, low rank coal with 5,000 kcal/kg at 27 USD/ton corresponds to 1.41 US cents/kWh. This demonstrates that use of a coal mix will be economically more advantageous than the use of any other competing fuels.
1.411.15
0
0.2
0.4
0.6
0.8
1
1.2
1.4
1.6
Coal Mix 100% Supplemental Coal
Cent/
kWh
Source: PLN
Fig. 25 Fuel Cost for Power Generation
10.3 Boiler Specifications
The coal that remains unburned in the combustion process is separated in a cyclone which is mounted at the boiler outlet (high-temperature duct inlet) and returned to the combustion section for complete combustion. Only flue gas and a fine fly-ash particulate pass through the cyclone and high temperature duct to the boiler section. This arrangement is ideal for the complete combustion of poor combustibility coals, i.e., high-ash or high-moisture coals. The boiler is
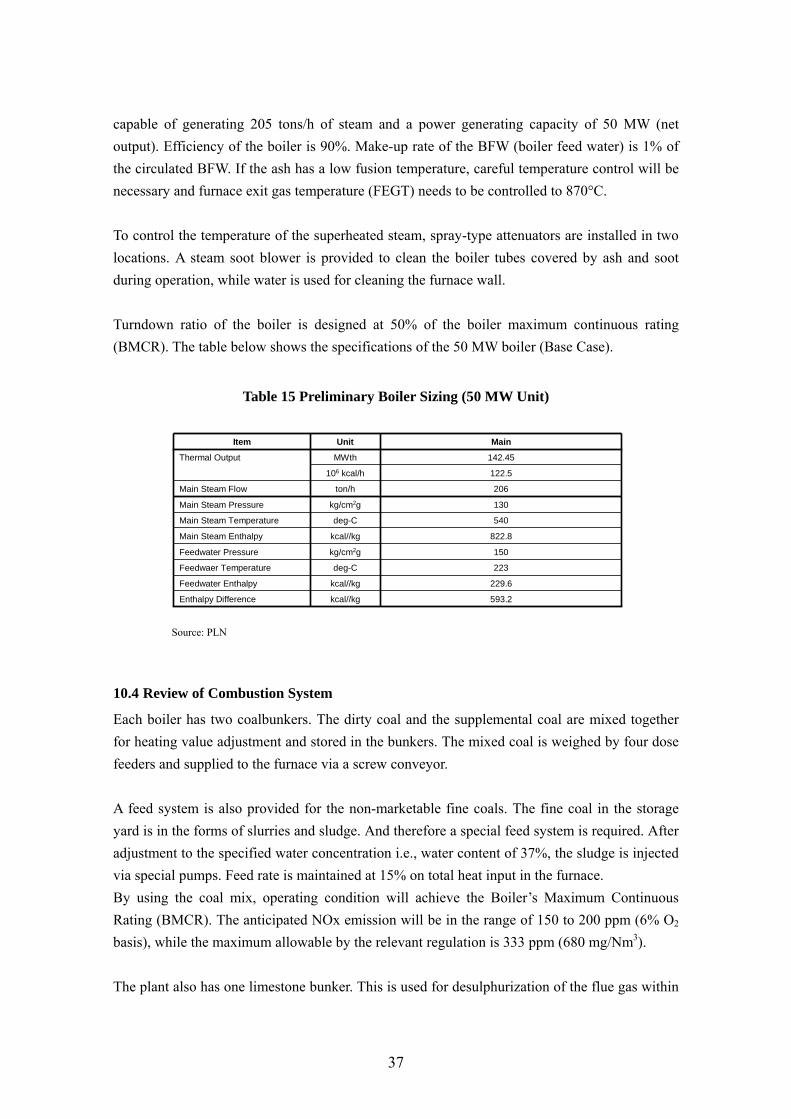
37
capable of generating 205 tons/h of steam and a power generating capacity of 50 MW (net output). Efficiency of the boiler is 90%. Make-up rate of the BFW (boiler feed water) is 1% of the circulated BFW. If the ash has a low fusion temperature, careful temperature control will be necessary and furnace exit gas temperature (FEGT) needs to be controlled to 870°C. To control the temperature of the superheated steam, spray-type attenuators are installed in two locations. A steam soot blower is provided to clean the boiler tubes covered by ash and soot during operation, while water is used for cleaning the furnace wall. Turndown ratio of the boiler is designed at 50% of the boiler maximum continuous rating (BMCR). The table below shows the specifications of the 50 MW boiler (Base Case).
Table 15 Preliminary Boiler Sizing (50 MW Unit)
593.2kcal//kgEnthalpy Difference
223deg-CFeedwaer Temperature
150kg/cm2gFeedwater Pressure
229.6kcal//kgFeedwater Enthalpy
MainUnitItem
822.8kcal//kgMain Steam Enthalpy
540deg-CMain Steam Temperature
130kg/cm2gMain Steam Pressure
206ton/hMain Steam Flow
122.5106 kcal/h
142.45MWthThermal Output
Source: PLN
10.4 Review of Combustion System
Each boiler has two coalbunkers. The dirty coal and the supplemental coal are mixed together for heating value adjustment and stored in the bunkers. The mixed coal is weighed by four dose feeders and supplied to the furnace via a screw conveyor. A feed system is also provided for the non-marketable fine coals. The fine coal in the storage yard is in the forms of slurries and sludge. And therefore a special feed system is required. After adjustment to the specified water concentration i.e., water content of 37%, the sludge is injected via special pumps. Feed rate is maintained at 15% on total heat input in the furnace. By using the coal mix, operating condition will achieve the Boiler’s Maximum Continuous Rating (BMCR). The anticipated NOx emission will be in the range of 150 to 200 ppm (6% O2 basis), while the maximum allowable by the relevant regulation is 333 ppm (680 mg/Nm3). The plant also has one limestone bunker. This is used for desulphurization of the flue gas within
38
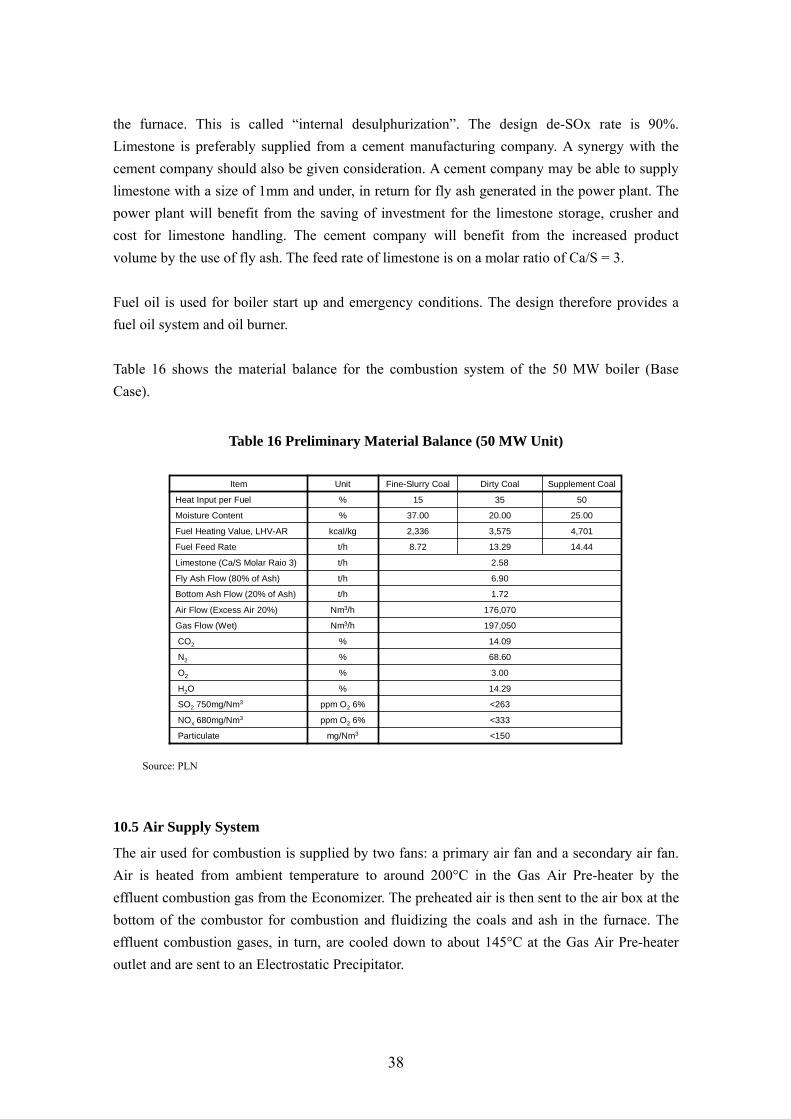
the furnace. This is called “internal desulphurization”. The design de-SOx rate is 90%. Limestone is preferably supplied from a cement manufacturing company. A synergy with the cement company should also be given consideration. A cement company may be able to supply limestone with a size of 1mm and under, in return for fly ash generated in the power plant. The power plant will benefit from the saving of investment for the limestone storage, crusher and cost for limestone handling. The cement company will benefit from the increased product volume by the use of fly ash. The feed rate of limestone is on a molar ratio of Ca/S = 3. Fuel oil is used for boiler start up and emergency conditions. The design therefore provides a fuel oil system and oil burner. Table 16 shows the material balance for the combustion system of the 50 MW boiler (Base Case).
Table 16 Preliminary Material Balance (50 MW Unit)
<150mg/Nm3Particulate
14.29%H2O
3.00%O2
68.60%N2
<333ppm O2 6%NOx 680mg/Nm3
<263ppm O2 6%SO2 750mg/Nm3
14.09%CO2
197,050Nm3/hGas Flow (Wet)
176,070Nm3/hAir Flow (Excess Air 20%)
1.72t/hBottom Ash Flow (20% of Ash)
6.90t/hFly Ash Flow (80% of Ash)
2.58t/hLimestone (Ca/S Molar Raio 3)
14.4413.298.72t/hFuel Feed Rate
4,7013,5752,336kcal/kgFuel Heating Value, LHV-AR
25.0020.0037.00%Moisture Content
503515%Heat Input per Fuel
Supplement CoalDirty CoalFine-Slurry CoalUnitItem
Source: PLN
10.5 Air Supply System
The air used for combustion is supplied by two fans: a primary air fan and a secondary air fan. Air is heated from ambient temperature to around 200°C in the Gas Air Pre-heater by the effluent combustion gas from the Economizer. The preheated air is then sent to the air box at the bottom of the combustor for combustion and fluidizing the coals and ash in the furnace. The effluent combustion gases, in turn, are cooled down to about 145°C at the Gas Air Pre-heater outlet and are sent to an Electrostatic Precipitator.
39
If the temperature of the effluent combustion gas falls to 135°C or below, the temperature is raised by steam heaters installed at the outlets of the primary and secondary fans. In this manner, equipment corrosion due to the condensation of water/sulfur oxides can be avoided.
10.6 Combustion Gas Control
The temperature of the combustion effluent gases from the combustion furnace is controlled to 870°C. This temperature is lower than the ash fusion temperature and prevents the molten ash from clinging to boiler tubes and boiler walls. Controlling the combustion temperature also serves to minimize the formation of NOx. This temperature will promote the desulphurization reactions with the limestone to form gypsum in the furnace. The combustion effluent gases pass through the steam generating section, the economizer section and the air heating section. In this process, they are cooled down to roughly 145°C. They are then sent to an Electrostatic Precipitator to remove the fly-ash particulate from the effluent gas. Recovery rate of the fly-ash is 99%. After EP, the gases are released to the atmosphere via a common exhaust stack. The exhaust stack is shared by two boilers. It will have a height of 60 m and discharge velocity of 20 m/sec during 100% BMCR (Boiler Maximum Continuous Rating) operations. The combustion effluent gas is desulfurized in the furnace. Limestone is fed into the combustion furnace together with the coals. Sulfur oxides formed in the combustion process are converted to gypsum for recovery as a bottom ash or fly ash.
10.7 Desulfurization in the Furnace
The limestone in the furnace reacts with the sulfur oxides formed from the sulfur in the coal in the combustion process in accordance with the following chemical reactions: Calcinations of limestone CaCO3 + heat → CaO + CO2 Note that the amount of carbon dioxide generated in this reaction is very small in comparison with the total CO2 emission volume. Reaction with sulfur oxide CaO + 1/2O2 + SO2 (Gas) → CaSO4 (solid) + heat The calcium sulfate formed in this reaction is known as chemically stable gypsum. As the

40
reactions take place in a continuous manner, the limestone is continuously fed into the furnace together with the coal. The reaction with sulfur oxides requires an excess of limestone. The required limestone feed rate depends on the sulfur oxide concentration, the properties of the limestone and the prevailing temperature conditions. In this case the limestone feed rate is controlled in such a manner that the molar ratio of Ca/S becomes 3. The ideal reaction temperature is 850-900°C. The gypsum (CaSO4) that is formed is recovered as bottom ash or fly-ash. The proportion of gypsum recovered as bottom ash usually tends to be higher than as fly-ash. In this case, however, equal amounts of gypsum in bottom ash and fly-ash are assumed.
10.8 Steam Turbine System
The proposed 50 MW steam turbine is a single casing type and has five condensate extraction nozzles. The amount of steam generation is 205 tons/h (without make-up it is 201.5 tons/h). The steam pressure is 131 kg/cm2A and the steam temperature is 540°C. The turbine rotation speed is 3000rpm. The condenser is of the Shell & Tube type and operating pressure is 0.091 kg/cm2A. Turbine efficiency is 39%, the highest efficiency achievable in this class.
10.9 Condenser System
The condenser is of the Shell & Tube type. A cleanliness factor of 85% is used for the design. Cooling water is used as a coolant. A closed circulating cooling water system with the use of a cooling tower is employed. The exhaust steam from the steam turbine is cooled in the condenser to form condensate water. Operating pressure of the condenser is 0.091 kg/cm2A. The cooling water inlet temperature to the condenser is 30°C and outlet temperature is 40°C. Condensate water from the steam is collected in a hot well with a capacity of 5 minutes resident time. The condensate is pumped from the hot well, by the condensate pump, via a low-pressure boiler feed water header to the deaerator. The condensate is heated by the steam extracted from the steam turbine before entering the deaerator. The condensate from the deaerator is pressurized by the boiler feed water (BFW) pump and heated further by the steam extract from the steam turbine and then sent to the economizer.
10.10 Generator and Single-line Drawing
The generator is a three-phase AC, excitation, synchronized type with a generating capacity of 55.6 MW. The output is 11 kV/50Hz. Attachment 6 shows a single-line circuit diagram.

41
10.11 Cooling Water System
Cooling water is used to cool the exhaust steam from the steam turbine and to cool the bearings of rotating equipment. The raw water is taken from the Mahakam River. It is stored in a water storage pond. The water from this water storage pond passes through a clarifloculator to remove sediments to produce a clear water. Most of this water is used for cooling of the condensers.
Raw Water Intake & Pump
Station
Boiler Feed Water Make-up
200 m3/d
Drinking Water
(Office & Colony)
200 m3/d
Utility Water
200 m3/d
Fire Water 200m3/h
Cooling Tower Make-up
8,640 m3/d
Demine Water
Storage
500m3
Deminelizer
12m3/hx2
Filter Water
Storage
600m3
Filter
Aeration &
Clarifloculator
9,240 m3/d
Clarified
Water
Storage
6000m3
Water Clarification Water Filter Water Filter
Water Pond 20,000 m3
River
Raw Water Supply Pump
Station
Source: JICA Study Team
Fig. 26 Water Supply System 2x50 MW Mahakam Project
For a 2x50 MW power generating system, 432,000 m3/day of cooling water is circulated and serves to cool the condenser and the bearings of rotating equipment. Of this, 7,200 m3/day of water is lost in the form of vapor and 160 m3/day escapes to the atmosphere. In order to maintain the quality of the cooling water 1,280 m3/day of water (concentrating rate is set at 6) is discharged as blow water. The cooling water from the condenser is heated to 40°C. The cooling tower is a forced-draft type to provide flexibility in operation. The heated cooling water flows down from the top of the cooling tower through the packing to the cooling water basin. Hot cooling water is in contact with air. Part of the water is evaporated and extracts the latent heat from the hot water, and cools itself in this process. The water is cooled down to 30°C and collected in a cooling water basin and recycled to the condenser by a cooling water pump. Fig. 25 shows the cooling water balance.

42
Cooling Tower
CondenserUnit A/B
Concentration Rate: 6
Water Makeup8,640m3/d
Evaporation7,200m3/d
Drift160m3/d
Blow Down 1,280m3/d
Circulating Water432,000m3/d
Source: JICA Study Team
Fig. 27 Cooling Tower Water Balance 2x50 MW
10.12 Limestone Feed System
Limestone is fed into the furnace for the purpose of recovering the sulfur contained in the coal in a chemically stable form. The limestone with a grain size of 1 mm or under is supplied by a cement manufacturing company. The limestone particulates are transported by air and injected into the furnace. A high-pressure blower is used for the transportation. The feed rate is controlled to meet the specified ratio to react with the SOx to minimize the emissions.
10.13 Wastewater Treatment System
The most serious concern with regard to the discharge of wastewater from a coal-fired power plant is the releasing of hot cooling water to the river environment. Hot cooling water would have a serious impact on the riparian ecology. It is proposed to use a circulating cooling water system, which does not discharge hot cooling water to the environment. Most of the wastewater discharged from the power plant is rainwater from the coal yard, water from the water treatment system, and cooling water blow-down, as well as boiler feed water blow-down. Oily water is treated in the CPI separator, and an activated carbon filter and sand filter. Waste water is gathered in the waste water basin and pH controlled, and released to the river if the waste water quality meets the relevant regulations and standards. Fig. 26 is a waste water flow diagram proposed for this project.
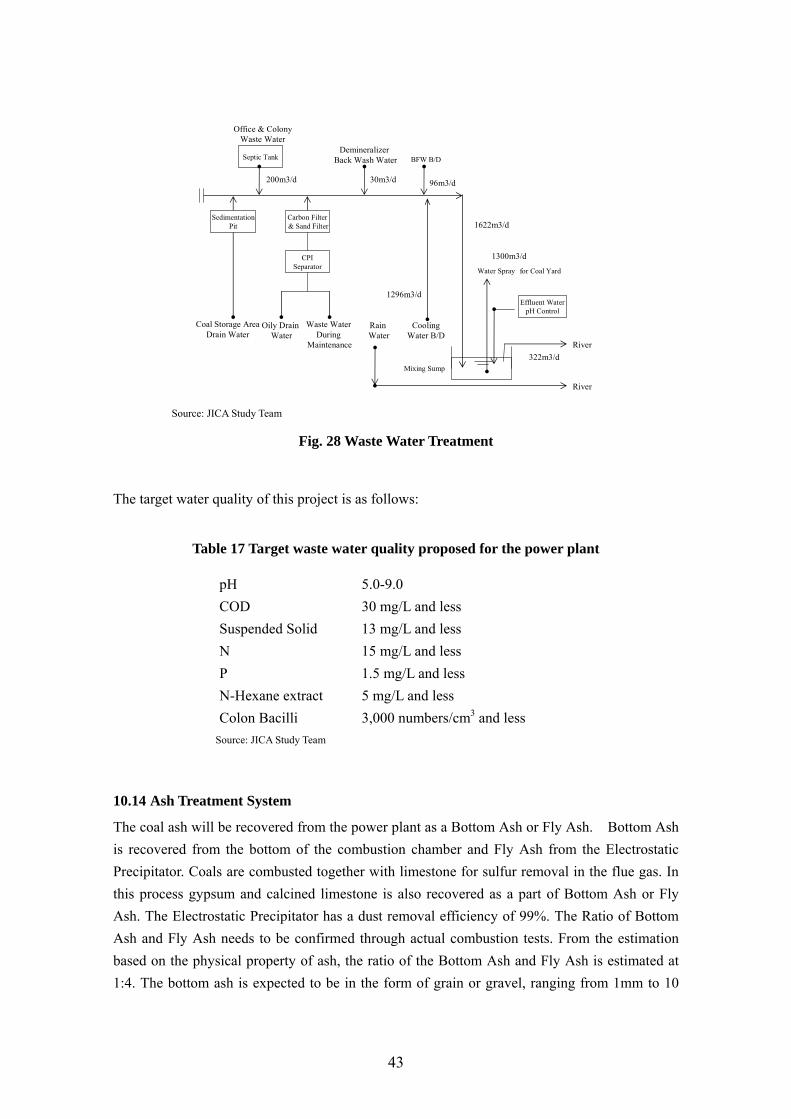
43
River
CoolingWater B/D
RainWater
Carbon Filter& Sand Filter
Oily Drain Water
Waste Water During
Maintenance
CPISeparator
Coal Storage AreaDrain Water
SedimentationPit
Office & ColonyWaste Water
Effluent WaterpH Control
DemineralizerBack Wash Water BFW B/DSeptic Tank
Water Spray for Coal Yard
Mixing Sump
River
200m3/d 30m3/d 96m3/d
1296m3/d
1622m3/d
1300m3/d
322m3/d
Source: JICA Study Team
Fig. 28 Waste Water Treatment
The target water quality of this project is as follows:
Table 17 Target waste water quality proposed for the power plant
pH 5.0-9.0 COD 30 mg/L and less Suspended Solid 13 mg/L and less N 15 mg/L and less P 1.5 mg/L and less N-Hexane extract 5 mg/L and less Colon Bacilli 3,000 numbers/cm3 and less
Source: JICA Study Team
10.14 Ash Treatment System
The coal ash will be recovered from the power plant as a Bottom Ash or Fly Ash. Bottom Ash is recovered from the bottom of the combustion chamber and Fly Ash from the Electrostatic Precipitator. Coals are combusted together with limestone for sulfur removal in the flue gas. In this process gypsum and calcined limestone is also recovered as a part of Bottom Ash or Fly Ash. The Electrostatic Precipitator has a dust removal efficiency of 99%. The Ratio of Bottom Ash and Fly Ash needs to be confirmed through actual combustion tests. From the estimation based on the physical property of ash, the ratio of the Bottom Ash and Fly Ash is estimated at 1:4. The bottom ash is expected to be in the form of grain or gravel, ranging from 1mm to 10
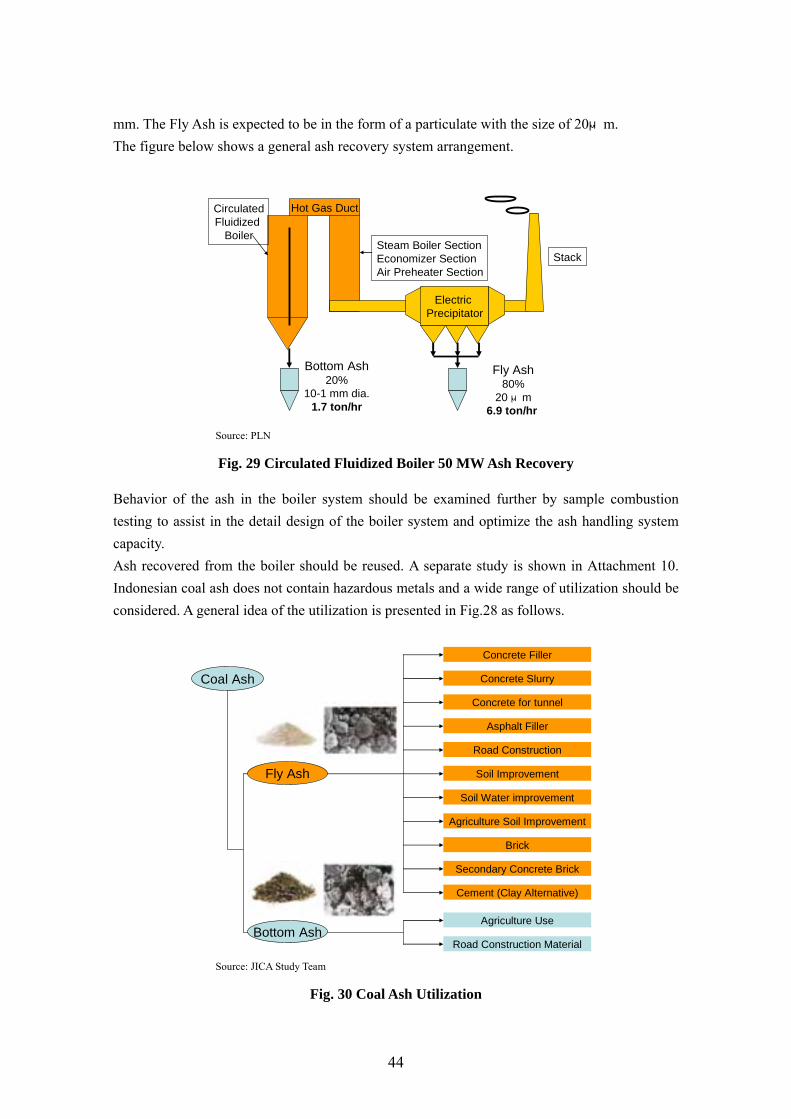
44
mm. The Fly Ash is expected to be in the form of a particulate with the size of 20μm. The figure below shows a general ash recovery system arrangement.
Hot Gas Duct
Electric Precipitator
Bottom Ash20%
10-1 mm dia.1.7 ton/hr
Fly Ash80%
20 μm6.9 ton/hr
Steam Boiler SectionEconomizer SectionAir Preheater Section
CirculatedFluidized
Boiler
Stack
Source: PLN
Fig. 29 Circulated Fluidized Boiler 50 MW Ash Recovery
Behavior of the ash in the boiler system should be examined further by sample combustion testing to assist in the detail design of the boiler system and optimize the ash handling system capacity. Ash recovered from the boiler should be reused. A separate study is shown in Attachment 10. Indonesian coal ash does not contain hazardous metals and a wide range of utilization should be considered. A general idea of the utilization is presented in Fig.28 as follows.
Road Construction Material
Agriculture Use
Cement (Clay Alternative)
Concrete Filler
Concrete Slurry
Concrete for tunnel
Asphalt Filler
Soil Improvement
Road Construction
Soil Water improvement
Agriculture Soil Improvement
Brick
Secondary Concrete Brick
Bottom Ash
Coal Ash
Fly Ash
Source: JICA Study Team
Fig. 30 Coal Ash Utilization

45
Bottom Ash is used as a road construction material and for various applications in the agricultural industry. A major potential user of the Fly Ash is the Cement Manufacturing Industry. It is used in the cement manufacturing processes as a clay substitute. There are three major raw material ingredients to manufacture cement: Limestone, Clay, and Silica. Coal Ash (Fly Ash) has similar properties to the clay and can be used as one of the cement ingredients. Table 18 is a Comparison of the Cement Composition and Coal Ash (Fly Ash).
Table 18 Cement Composition Comparison
40~65
70~95
45~80
~4
20~23
SiO2
Chemical Composition
0.5~2.05~203~1010~30Fly AshCoal Ash
0.5~3.0~2~52~10Silica
2~6~53~1010~30Clay
~0.247~55~2~2Lime StoneCementIngredients
0.3~0.763~652.5~3.63.8~5.8Portland Cement Composition
Na2OeqCaOFe2O3Al2O3
Source: Japan Cement Association
The advantage of using Fly Ash instead of Clay lies in the energy saving in the cement manufacturing. Clay requires a lot of energy to remove crystallized water but Crystallized water in the Fly Ash is already removed in the boiler. This means that given the same input of energy, the cement production output will be increased if Fly Ash is used instead of Clay. A Cement Company can also manufacture Fly Ash mixed cement as one of the varieties of cement products. This type of cement is used for casting applications to construct large cement structures due to its higher fluidity. Power plants require limestone (1 mm and under) in the desulphurization process of flue gas from the combustion furnace and this can be supplied by the Cement Manufacturing Company. And in return, the power plant supplies coal ash to the Cement Manufacturing Company. Good synergy between the Power Plant and the Cement Industry is expected as shown in Fig. 29 The following benefits are expected by the parties: · The power plant can save the investment and handling cost to manufacture powder limestone
(1 mm under) · The cement industry can increase the cement production and manufacture a variety of cement
products.

46
Cement Industry Coal Power Plant
Civil ConstructionCement Mix AgricultureIndustries
Lime Stone
Fly Ash
Bottom AshLand Fill
Unutilized Ash
To be MinimizedFly Ash
Source: PLN
Fig. 31 Synergy within Industries
Fly Ash can also be mixed directly with cement to improve the fluidity of the cement. This is not only effective in the construction of cast cement structures such as dams and large foundation construction but also be utilized for spray-on applications, such as rock stabilization in the construction of tunnels. Fly Ash can also be used as a soil-improvement agent.
10.15 Central Control Room and DCS System
This Project uses a Distributed Control System (DCS) to control the entire plant operation and monitor the environment and safety. This system is installed in the central control room and the operator controls each unit through an interface based on CTR. The central control room accommodates control panels for auxiliary equipment such as utilities. It is also equipped with panels for controlling soot blower systems that are independent of operation and safety-related equipment such as fire pumps or system panels related to environmental monitoring systems and furnace safeguards.
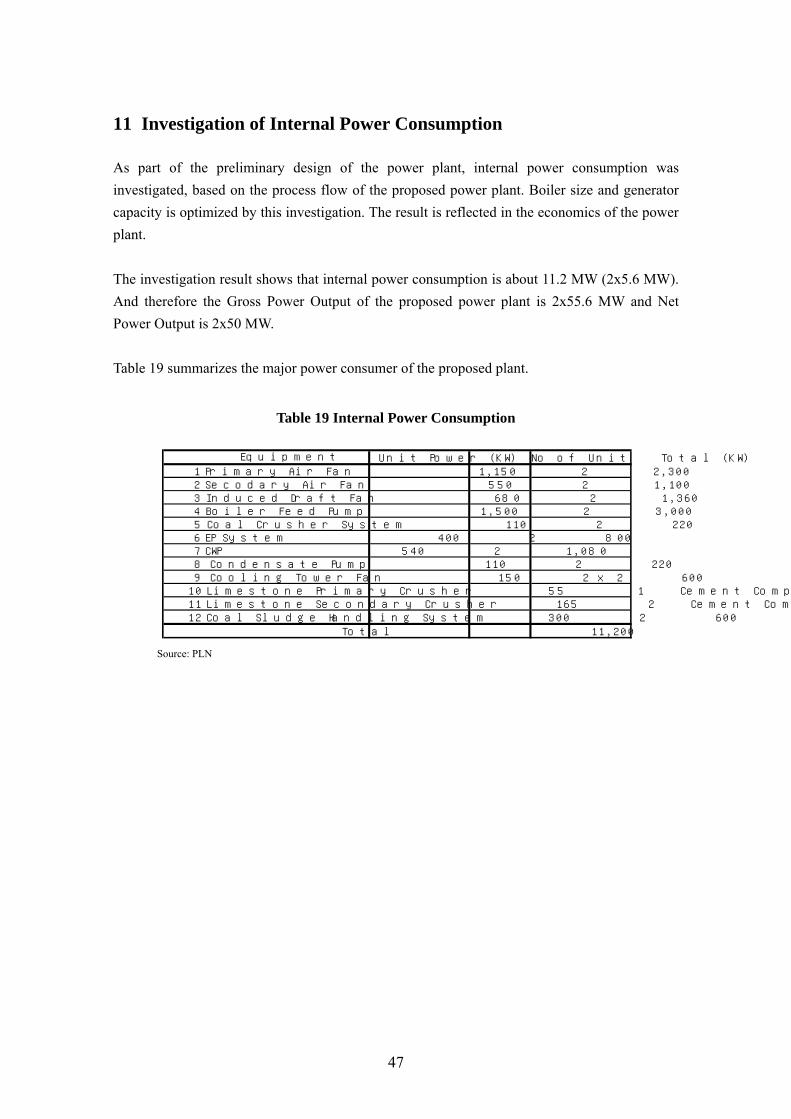
47
11 Investigation of Internal Power Consumption
As part of the preliminary design of the power plant, internal power consumption was investigated, based on the process flow of the proposed power plant. Boiler size and generator capacity is optimized by this investigation. The result is reflected in the economics of the power plant. The investigation result shows that internal power consumption is about 11.2 MW (2x5.6 MW). And therefore the Gross Power Output of the proposed power plant is 2x55.6 MW and Net Power Output is 2x50 MW. Table 19 summarizes the major power consumer of the proposed plant.
Table 19 Internal Power Consumption
Unit Power (KW) No of Unit Total (KW)1 Primary Air Fan 1,150 2 2,3002 Secodary Air Fan 550 2 1,1003 Induced Draft Fan 680 2 1,3604 Boiler Feed Pump 1,500 2 3,0005 Coal Crusher System 110 2 2206 EP System 400 2 8007 CWP 540 2 1,0808 Condensate Pump 110 2 2209 Cooling Tower Fan 150 2 x 2 600
10 Limestone Primary Crusher 55 1 Cement Company11 Limestone Secondary Crusher 165 2 Cement Company12 Coal Sludge Handling System 300 2 600
Total 11,200
Equipment
Source: PLN

48
12 Heat Balance Analysis
A CFB (Circulated Fluidized Bed) system is proposed in this study. Based on the load flow analysis, the transmission system will be able to accommodate 2x50 MW power units in 2012. Through the design optimization process, gross power generation capacity is determined to be 2x55.6 MW. With this capacity size, the casing type of the steam turbine will be a single casing. Five extracts are proposed to attain higher steam turbine efficiency. (Efficiency of a 3 extract steam turbine is 0.5 % points lower than that of 5 extracts.) Optimized design pressure and temperature conditions are: ・ The main steam condition will be set at 540°C and 131 kg/cm2A at the boiler outlet. ・ The boiler feed water supply condition will be at 223°C and 149 kg/cm2A. ・ Condenser pressure will be 0.09 kg/cm2A. ・ The main steam flow rate will be 2x205.1 ton/h. The results of the heat balance analysis are shown in Attachment 3.

49
13 Power Plant Plot Plan
The power plant consists of various facilities. These include auxiliary equipment and offsite coal handling facilities as follows: · Water intake pump station and water storage pond · Coal yard and handling facilities · Limestone handling facilities · Boiler and steam turbine power generating facilities · Flue gas discharge system including electrostatic precipitator · Ash handling facilities · Water clarifier and water treatment facility · Cooling water system and cooling tower · Wastewater treatment facility · Switch yard and power transmission line, and associated substation · Central control room · Spare parts store and work shop · Coal laboratory · Offices · Housing for employees These facilities need to be logically laid out given the shape of the land. Attachment 1 shows the overall Plot Plan and Attachment 2 presents the equipment layout.
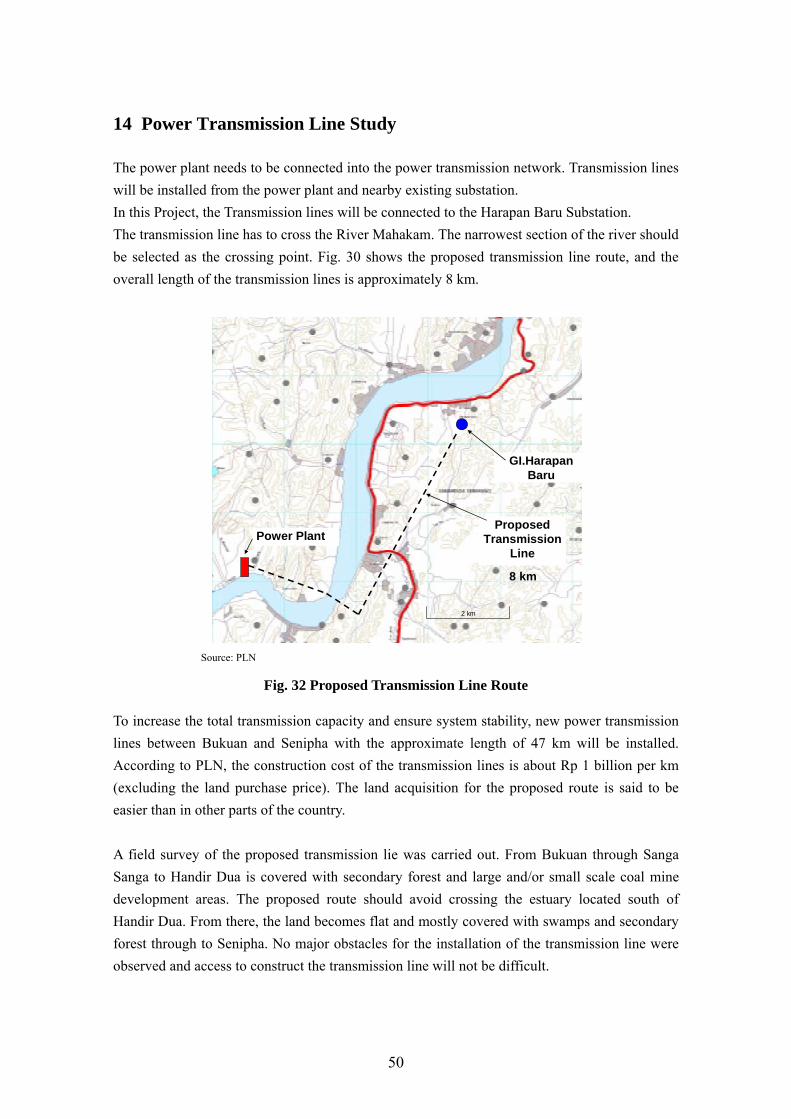
50
14 Power Transmission Line Study
The power plant needs to be connected into the power transmission network. Transmission lines will be installed from the power plant and nearby existing substation. In this Project, the Transmission lines will be connected to the Harapan Baru Substation. The transmission line has to cross the River Mahakam. The narrowest section of the river should be selected as the crossing point. Fig. 30 shows the proposed transmission line route, and the overall length of the transmission lines is approximately 8 km.
ProposedTransmission
Line
GI.HarapanBaru
Power Plant
8 km
2 km
Source: PLN
Fig. 32 Proposed Transmission Line Route
To increase the total transmission capacity and ensure system stability, new power transmission lines between Bukuan and Senipha with the approximate length of 47 km will be installed. According to PLN, the construction cost of the transmission lines is about Rp 1 billion per km (excluding the land purchase price). The land acquisition for the proposed route is said to be easier than in other parts of the country. A field survey of the proposed transmission lie was carried out. From Bukuan through Sanga Sanga to Handir Dua is covered with secondary forest and large and/or small scale coal mine development areas. The proposed route should avoid crossing the estuary located south of Handir Dua. From there, the land becomes flat and mostly covered with swamps and secondary forest through to Senipha. No major obstacles for the installation of the transmission line were observed and access to construct the transmission line will not be difficult.

51
15 Economics of the Proposed Power Plant
According to the PLN plan of 2006, the existing diesel engine driven power generators, mostly owned by PLN, will be gradually taken out of service by 2010. PLN will therefore need to relay on the Independent Power Producers (IPP) for a significant part of the power generation. If, however, the system operators do not have dependable power generation facilities, the operation of the system might suffer from instability. This study assumes that PLN has responsibility to expand the electrification area and supply stable power to the entire east Kalimantan area. To fulfill that responsibility, the existing power transmission system should be continuously extended and power stations should be constructed based on the appropriate power supply plan. The proposed power plant construction plan therefore includes a transmission infrastructure reinforcement plan and the power plant is designed to operate more than 30 years as a center piece of the electric power infrastructure in the area. PLN is assumed to be an owner of the project and construction budget is assumed to be a soft loan or Official Development Assistance (ODA). In this section, the ODA based power tariff was calculated. To compare the economics of the projects between the IPP case and the PLN case, IRR for both cases are calculated.
15.1 ODA-based Feasibility Study
The power tariff calculations are based on the following conditions. · Gross Power Generation Capacity (MW) 2x55.6 MW · Net Power Output (MW) 2x50 MW · Power Generation Efficiency (LVH) 35% · Internal Power Consumption 2x5.5 MW · Capacity Utilization Factor (availability) of power plant 80% · Construction Period 3 years · Total Operating Costs (% share of CAPEX) 4.0% · Grace Period of the Loan Repayment 3 years · Loan Length, including Grace Period 40 years · Depreciation (straight-line depreciation method) 40 years · Average Interest Rate (ODA Sub-lease) 6% · Exchange rate (Rp/USD) 9,000 · Exchange rate (Yen/USD) 110 · Mixed Coal Price 17.9 USD/ton
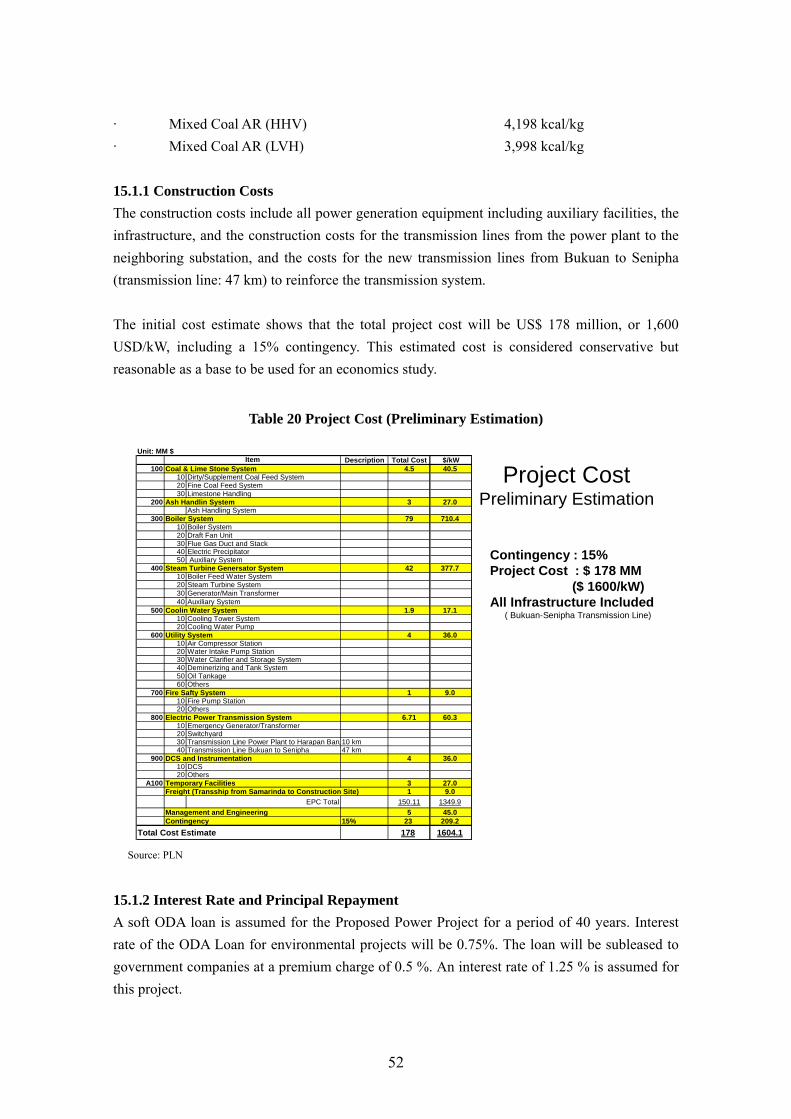
52
· Mixed Coal AR (HHV) 4,198 kcal/kg · Mixed Coal AR (LVH) 3,998 kcal/kg 15.1.1 Construction Costs The construction costs include all power generation equipment including auxiliary facilities, the infrastructure, and the construction costs for the transmission lines from the power plant to the neighboring substation, and the costs for the new transmission lines from Bukuan to Senipha (transmission line: 47 km) to reinforce the transmission system. The initial cost estimate shows that the total project cost will be US$ 178 million, or 1,600 USD/kW, including a 15% contingency. This estimated cost is considered conservative but reasonable as a base to be used for an economics study.
Table 20 Project Cost (Preliminary Estimation)
Unit: MM $ Description Total Cost $/kW
100 Coal & Lime Stone System 4.5 40.510 Dirty/Supplement Coal Feed System20 Fine Coal Feed System30 Limestone Handling
200 Ash Handlin System 3 27.0Ash Handling System
300 Boiler System 79 710.410 Boiler System20 Draft Fan Unit30 Flue Gas Duct and Stack40 Electric Precipitator50 Auxiliary System
400 Steam Turbine Genersator System 42 377.710 Boiler Feed Water System20 Steam Turbine System30 Generator/Main Transformer40 Auxiliary System
500 Coolin Water System 1.9 17.110 Cooling Tower System20 Cooling Water Pump
600 Utility System 4 36.010 Air Compressor Station20 Water Intake Pump Station30 Water Clarifier and Storage System40 Deminerizing and Tank System50 Oil Tankage60 Others
700 Fire Safty System 1 9.010 Fire Pump Station20 Others
800 Electric Power Transmission System 6.71 60.310 Emergency Generator/Transformer20 Switchyard 30 Transmission Line Power Plant to Harapan Baru10 km40 Transmission Line Bukuan to Senipha 47 km
900 DCS and Instrumentation 4 36.010 DCS20 Others
A100 Temporary Facilities 3 27.0Freight (Transship from Samarinda to Construction Site) 1 9.0
EPC Total 150.11 1349.9Management and Engineering 5 45.0Contingency 15% 23 209.2
Total Cost Estimate 178 1604.1
Item
Project CostPreliminary Estimation
Contingency : 15%Project Cost : $ 178 MM
($ 1600/kW) All Infrastructure Included
( Bukuan-Senipha Transmission Line)
Source: PLN
15.1.2 Interest Rate and Principal Repayment A soft ODA loan is assumed for the Proposed Power Project for a period of 40 years. Interest rate of the ODA Loan for environmental projects will be 0.75%. The loan will be subleased to government companies at a premium charge of 0.5 %. An interest rate of 1.25 % is assumed for this project.
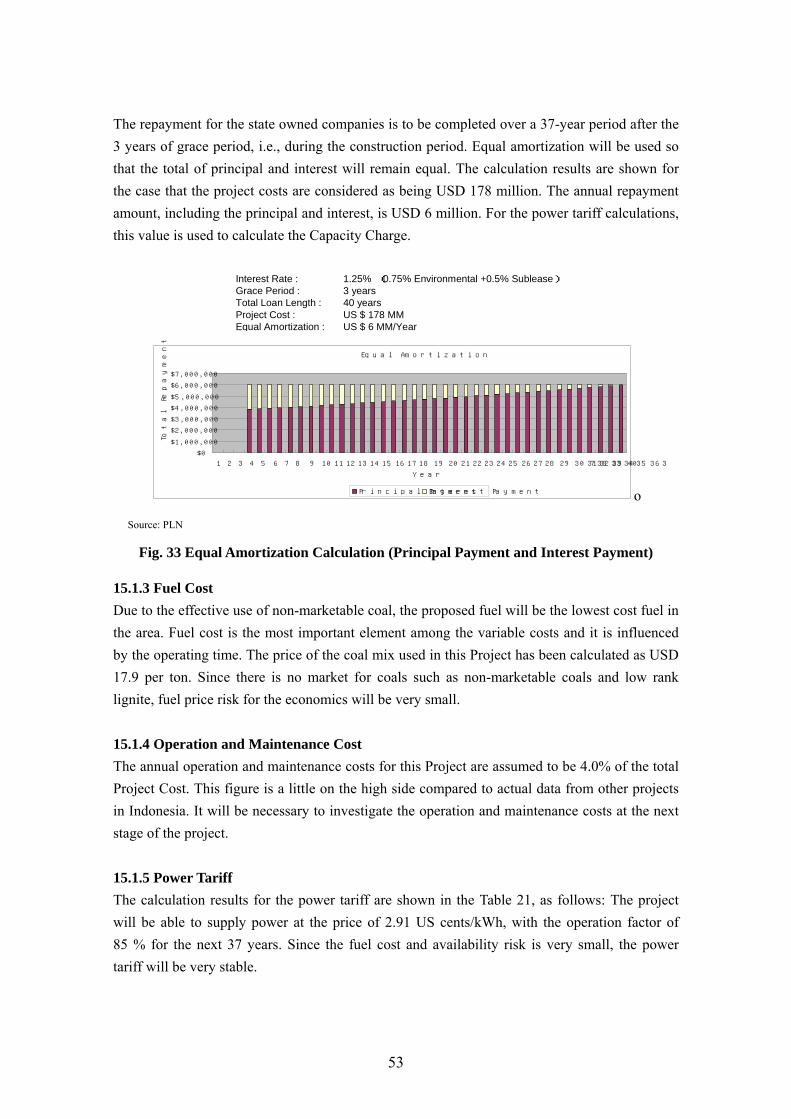
53
The repayment for the state owned companies is to be completed over a 37-year period after the 3 years of grace period, i.e., during the construction period. Equal amortization will be used so that the total of principal and interest will remain equal. The calculation results are shown for the case that the project costs are considered as being USD 178 million. The annual repayment amount, including the principal and interest, is USD 6 million. For the power tariff calculations, this value is used to calculate the Capacity Charge.
Interest Rate : 1.25% (0.75% Environmental +0.5% Sublease)Grace Period : 3 years Total Loan Length : 40 yearsProject Cost : US $ 178 MM Equal Amortization : US $ 6 MM/Year
Equal Amortization
$0
$1,000,000
$2,000,000
$3,000,000
$4,000,000
$5,000,000
$6,000,000
$7,000,000
1 2 3 4 5 6 7 8 9 10 11 12 13 14 15 16 17 18 19 20 21 22 23 24 25 26 27 28 29 30 31 32 33 34 35 36 37 38 39 40
Year
Tota
l Repa
yment
Principal Payment Interest Payment o
Source: PLN
Fig. 33 Equal Amortization Calculation (Principal Payment and Interest Payment)
15.1.3 Fuel Cost Due to the effective use of non-marketable coal, the proposed fuel will be the lowest cost fuel in the area. Fuel cost is the most important element among the variable costs and it is influenced by the operating time. The price of the coal mix used in this Project has been calculated as USD 17.9 per ton. Since there is no market for coals such as non-marketable coals and low rank lignite, fuel price risk for the economics will be very small. 15.1.4 Operation and Maintenance Cost The annual operation and maintenance costs for this Project are assumed to be 4.0% of the total Project Cost. This figure is a little on the high side compared to actual data from other projects in Indonesia. It will be necessary to investigate the operation and maintenance costs at the next stage of the project. 15.1.5 Power Tariff The calculation results for the power tariff are shown in the Table 21, as follows: The project will be able to supply power at the price of 2.91 US cents/kWh, with the operation factor of 85 % for the next 37 years. Since the fuel cost and availability risk is very small, the power tariff will be very stable.

54
Table 21 Power Tariff Calculation
2.91 Total
0.96 Operation & Maintenance
1.15Fuel Charge
0.81 Capacity Charge
US¢/kWh
NoteOperation Factor : 85%Capacity Charge : Annual Loan PaymentFuel Charge : Coal Mix Price @ Plant SiteOperation & Maintenance: 4 % of Project Cost
15.2 IPP-based Economics Study
For comparison with the ODA case, the feasibility of the IPP case was studied. The project condition is the same as the ODA case and includes transmission reinforcement infrastructures. 15.2.1 IPP Economics Study Data In order to secure investment funding from the private sector, considerable returns must be secured without cutting back the required expenses for operation and maintenance and environmental standards. Economics conditions used for the study are shown below. 100% owner funding is considered to calculate the Project IRR. The overview below shows the economic feasibility study results. A long-term (10 year) interest rate of 10% for loans from private banks in Indonesia is assumed as a reference. Project Life (Years) 30 Depreciation (Years) 15 Corporate Tax Rate (%) 30 Long Term Commercial Bank Interest (%) 10 Loan Period (Years) 10 15.2.2 Cash Flow The cash flow calculation based on 7.0 US cents/kWh (630 Rp/kWh) is shown below. This level of tariff will be able to satisfy the potential investors.
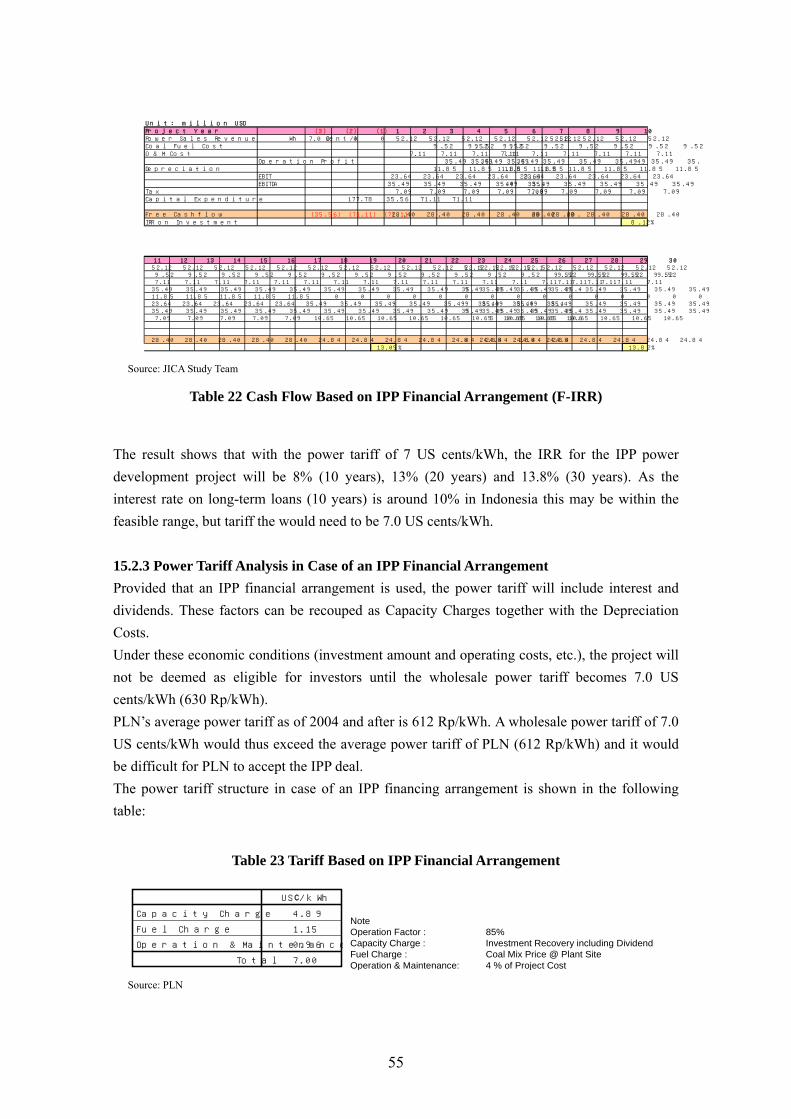
55
Unit: million USDProject Year (3) (2) (1) 1 2 3 4 5 6 7 8 9 10Power Sales Revenue 7.0 Cent/kWh 0 0 0 52.12 52.12 52.12 52.12 52.12 52.12 52.12 52.12 52.12 52.12Coal Fuel Cost 9.52 9.52 9.52 9.52 9.52 9.52 9.52 9.52 9.52 9.52O & M Cost 7.11 7.11 7.11 7.11 7.11 7.11 7.11 7.11 7.11 7.11
Operation Profit 35.49 35.49 35.49 35.49 35.49 35.49 35.49 35.49 35.49 35.49Depreciation 11.85 11.85 11.85 11.85 11.85 11.85 11.85 11.85 11.85 11.85
EBIT 23.64 23.64 23.64 23.64 23.64 23.64 23.64 23.64 23.64 23.64EBITDA 35.49 35.49 35.49 35.49 35.49 35.49 35.49 35.49 35.49 35.49
Tax 7.09 7.09 7.09 7.09 7.09 7.09 7.09 7.09 7.09 7.09Capital Expenditure 177.78 35.56 71.11 71.11
Free Cashflow (35.56) (71.11) (71.11) 28.40 28.40 28.40 28.40 28.40 28.40 28.40 28.40 28.40 28.40IRR on Investment 8.12%
11 12 13 14 15 16 17 18 19 20 21 22 23 24 25 26 27 28 29 3052.12 52.12 52.12 52.12 52.12 52.12 52.12 52.12 52.12 52.12 52.12 52.12 52.12 52.12 52.12 52.12 52.12 52.12 52.12 52.129.52 9.52 9.52 9.52 9.52 9.52 9.52 9.52 9.52 9.52 9.52 9.52 9.52 9.52 9.52 9.52 9.52 9.52 9.52 9.527.11 7.11 7.11 7.11 7.11 7.11 7.11 7.11 7.11 7.11 7.11 7.11 7.11 7.11 7.11 7.11 7.11 7.11 7.11 7.11
35.49 35.49 35.49 35.49 35.49 35.49 35.49 35.49 35.49 35.49 35.49 35.49 35.49 35.49 35.49 35.49 35.49 35.49 35.49 35.4911.85 11.85 11.85 11.85 11.85 0 0 0 0 0 0 0 0 0 0 0 0 0 0 023.64 23.64 23.64 23.64 23.64 35.49 35.49 35.49 35.49 35.49 35.49 35.49 35.49 35.49 35.49 35.49 35.49 35.49 35.49 35.4935.49 35.49 35.49 35.49 35.49 35.49 35.49 35.49 35.49 35.49 35.49 35.49 35.49 35.49 35.49 35.49 35.49 35.49 35.49 35.497.09 7.09 7.09 7.09 7.09 10.65 10.65 10.65 10.65 10.65 10.65 10.65 10.65 10.65 10.65 10.65 10.65 10.65 10.65 10.65
28.40 28.40 28.40 28.40 28.40 24.84 24.84 24.84 24.84 24.84 24.84 24.84 24.84 24.84 24.84 24.84 24.84 24.84 24.84 24.8413.05% 13.82%
Source: JICA Study Team
Table 22 Cash Flow Based on IPP Financial Arrangement (F-IRR)
The result shows that with the power tariff of 7 US cents/kWh, the IRR for the IPP power development project will be 8% (10 years), 13% (20 years) and 13.8% (30 years). As the interest rate on long-term loans (10 years) is around 10% in Indonesia this may be within the feasible range, but tariff the would need to be 7.0 US cents/kWh. 15.2.3 Power Tariff Analysis in Case of an IPP Financial Arrangement Provided that an IPP financial arrangement is used, the power tariff will include interest and dividends. These factors can be recouped as Capacity Charges together with the Depreciation Costs. Under these economic conditions (investment amount and operating costs, etc.), the project will not be deemed as eligible for investors until the wholesale power tariff becomes 7.0 US cents/kWh (630 Rp/kWh). PLN’s average power tariff as of 2004 and after is 612 Rp/kWh. A wholesale power tariff of 7.0 US cents/kWh would thus exceed the average power tariff of PLN (612 Rp/kWh) and it would be difficult for PLN to accept the IPP deal. The power tariff structure in case of an IPP financing arrangement is shown in the following table:
Table 23 Tariff Based on IPP Financial Arrangement
7.00 Total
0.96 Operation & Maintenance
1.15Fuel Charge
4.89 Capacity Charge
US¢/kWh
NoteOperation Factor : 85%Capacity Charge : Investment Recovery including DividendFuel Charge : Coal Mix Price @ Plant SiteOperation & Maintenance: 4 % of Project Cost
Source: PLN
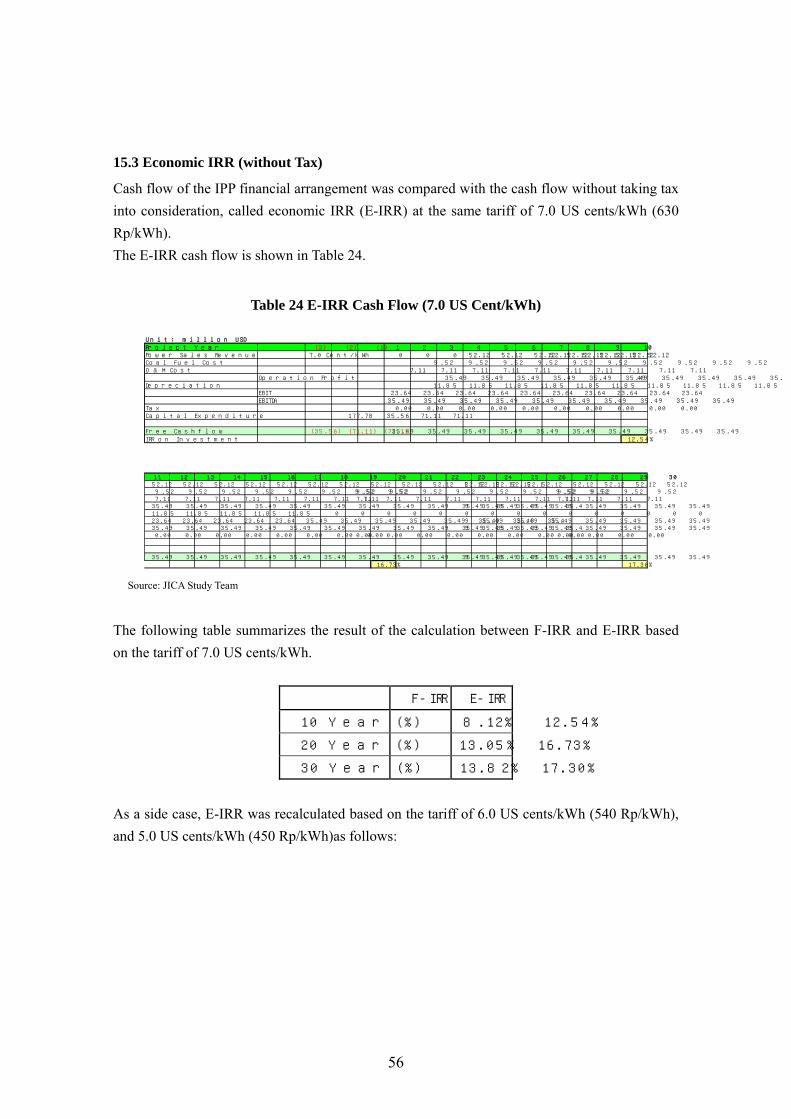
56
15.3 Economic IRR (without Tax)
Cash flow of the IPP financial arrangement was compared with the cash flow without taking tax into consideration, called economic IRR (E-IRR) at the same tariff of 7.0 US cents/kWh (630 Rp/kWh). The E-IRR cash flow is shown in Table 24.
Table 24 E-IRR Cash Flow (7.0 US Cent/kWh)
Unit: million USDProject Year (3) (2) (1) 1 2 3 4 5 6 7 8 9 10Power Sales Revenue 7.0 Cent/kWh 0 0 0 52.12 52.12 52.12 52.12 52.12 52.12 52.12 52.12 52.12 52.12Coal Fuel Cost 9.52 9.52 9.52 9.52 9.52 9.52 9.52 9.52 9.52 9.52O & M Cost 7.11 7.11 7.11 7.11 7.11 7.11 7.11 7.11 7.11 7.11
Operation Profit 35.49 35.49 35.49 35.49 35.49 35.49 35.49 35.49 35.49 35.49Depreciation 11.85 11.85 11.85 11.85 11.85 11.85 11.85 11.85 11.85 11.85
EBIT 23.64 23.64 23.64 23.64 23.64 23.64 23.64 23.64 23.64 23.64EBITDA 35.49 35.49 35.49 35.49 35.49 35.49 35.49 35.49 35.49 35.49
Tax 0.00 0.00 0.00 0.00 0.00 0.00 0.00 0.00 0.00 0.00Capital Expenditure 177.78 35.56 71.11 71.11
Free Cashflow (35.56) (71.11) (71.11) 35.49 35.49 35.49 35.49 35.49 35.49 35.49 35.49 35.49 35.49IRR on Investment 12.54%
11 12 13 14 15 16 17 18 19 20 21 22 23 24 25 26 27 28 29 3052.12 52.12 52.12 52.12 52.12 52.12 52.12 52.12 52.12 52.12 52.12 52.12 52.12 52.12 52.12 52.12 52.12 52.12 52.12 52.129.52 9.52 9.52 9.52 9.52 9.52 9.52 9.52 9.52 9.52 9.52 9.52 9.52 9.52 9.52 9.52 9.52 9.52 9.52 9.527.11 7.11 7.11 7.11 7.11 7.11 7.11 7.11 7.11 7.11 7.11 7.11 7.11 7.11 7.11 7.11 7.11 7.11 7.11 7.11
35.49 35.49 35.49 35.49 35.49 35.49 35.49 35.49 35.49 35.49 35.49 35.49 35.49 35.49 35.49 35.49 35.49 35.49 35.49 35.4911.85 11.85 11.85 11.85 11.85 0 0 0 0 0 0 0 0 0 0 0 0 0 0 023.64 23.64 23.64 23.64 23.64 35.49 35.49 35.49 35.49 35.49 35.49 35.49 35.49 35.49 35.49 35.49 35.49 35.49 35.49 35.4935.49 35.49 35.49 35.49 35.49 35.49 35.49 35.49 35.49 35.49 35.49 35.49 35.49 35.49 35.49 35.49 35.49 35.49 35.49 35.490.00 0.00 0.00 0.00 0.00 0.00 0.00 0.00 0.00 0.00 0.00 0.00 0.00 0.00 0.00 0.00 0.00 0.00 0.00 0.00
35.49 35.49 35.49 35.49 35.49 35.49 35.49 35.49 35.49 35.49 35.49 35.49 35.49 35.49 35.49 35.49 35.49 35.49 35.49 35.4916.73% 17.30%
Source: JICA Study Team
The following table summarizes the result of the calculation between F-IRR and E-IRR based on the tariff of 7.0 US cents/kWh.
F-IRR E-IRR
10 Year (%) 8.12% 12.54%
20 Year (%) 13.05% 16.73%
30 Year (%) 13.82% 17.30%
As a side case, E-IRR was recalculated based on the tariff of 6.0 US cents/kWh (540 Rp/kWh), and 5.0 US cents/kWh (450 Rp/kWh)as follows:

57
Table 25 E-IRR Cash Flow (6.0 US Cents/kWh)
11 12 13 14 15 16 17 18 19 20 21 22 23 24 25 26 27 28 29 3044.68 44.68 44.68 44.68 44.68 44.68 44.68 44.68 44.68 44.68 44.68 44.68 44.68 44.68 44.68 44.68 44.68 44.68 44.68 44.689.52 9.52 9.52 9.52 9.52 9.52 9.52 9.52 9.52 9.52 9.52 9.52 9.52 9.52 9.52 9.52 9.52 9.52 9.52 9.527.11 7.11 7.11 7.11 7.11 7.11 7.11 7.11 7.11 7.11 7.11 7.11 7.11 7.11 7.11 7.11 7.11 7.11 7.11 7.11
28.04 28.04 28.04 28.04 28.04 28.04 28.04 28.04 28.04 28.04 28.04 28.04 28.04 28.04 28.04 28.04 28.04 28.04 28.04 28.0411.85 11.85 11.85 11.85 11.85 0 0 0 0 0 0 0 0 0 0 0 0 0 0 016.19 16.19 16.19 16.19 16.19 28.04 28.04 28.04 28.04 28.04 28.04 28.04 28.04 28.04 28.04 28.04 28.04 28.04 28.04 28.0428.04 28.04 28.04 28.04 28.04 28.04 28.04 28.04 28.04 28.04 28.04 28.04 28.04 28.04 28.04 28.04 28.04 28.04 28.04 28.040.00 0.00 0.00 0.00 0.00 0.00 0.00 0.00 0.00 0.00 0.00 0.00 0.00 0.00 0.00 0.00 0.00 0.00 0.00 0.00
28.04 28.04 28.04 28.04 28.04 28.04 28.04 28.04 28.04 28.04 28.04 28.04 28.04 28.04 28.04 28.04 28.04 28.04 28.04 28.0413.01% 13.86%
Unit: million USDProject Year (3) (2) (1) 1 2 3 4 5 6 7 8 9 10Power Sales Revenue 6.0 Cent/kWh 0 0 0 44.68 44.68 44.68 44.68 44.68 44.68 44.68 44.68 44.68 44.68Coal Fuel Cost 9.52 9.52 9.52 9.52 9.52 9.52 9.52 9.52 9.52 9.52O & M Cost 7.11 7.11 7.11 7.11 7.11 7.11 7.11 7.11 7.11 7.11
Operation Profit 28.04 28.04 28.04 28.04 28.04 28.04 28.04 28.04 28.04 28.04Depreciation 11.85 11.85 11.85 11.85 11.85 11.85 11.85 11.85 11.85 11.85
EBIT 16.19 16.19 16.19 16.19 16.19 16.19 16.19 16.19 16.19 16.19EBITDA 28.04 28.04 28.04 28.04 28.04 28.04 28.04 28.04 28.04 28.04
Tax 0.00 0.00 0.00 0.00 0.00 0.00 0.00 0.00 0.00 0.00Capital Expenditure 177.78 35.56 71.11 71.11
Free Cashflow (35.56) (71.11) (71.11) 28.04 28.04 28.04 28.04 28.04 28.04 28.04 28.04 28.04 28.04IRR on Investment 7.88%
Source: JICA Study Team
Table 26 E-IRR Cash Flow (5.0 US Cents/kWh)
11 12 13 14 15 16 17 18 19 20 21 22 23 24 25 26 27 28 29 3037.23 37.23 37.23 37.23 37.23 37.23 37.23 37.23 37.23 37.23 37.23 37.23 37.23 37.23 37.23 37.23 37.23 37.23 37.23 37.239.52 9.52 9.52 9.52 9.52 9.52 9.52 9.52 9.52 9.52 9.52 9.52 9.52 9.52 9.52 9.52 9.52 9.52 9.52 9.527.11 7.11 7.11 7.11 7.11 7.11 7.11 7.11 7.11 7.11 7.11 7.11 7.11 7.11 7.11 7.11 7.11 7.11 7.11 7.11
20.60 20.60 20.60 20.60 20.60 20.60 20.60 20.60 20.60 20.60 20.60 20.60 20.60 20.60 20.60 20.60 20.60 20.60 20.60 20.6011.85 11.85 11.85 11.85 11.85 0 0 0 0 0 0 0 0 0 0 0 0 0 0 08.74 8.74 8.74 8.74 8.74 20.60 20.60 20.60 20.60 20.60 20.60 20.60 20.60 20.60 20.60 20.60 20.60 20.60 20.60 20.60
20.60 20.60 20.60 20.60 20.60 20.60 20.60 20.60 20.60 20.60 20.60 20.60 20.60 20.60 20.60 20.60 20.60 20.60 20.60 20.600.00 0.00 0.00 0.00 0.00 0.00 0.00 0.00 0.00 0.00 0.00 0.00 0.00 0.00 0.00 0.00 0.00 0.00 0.00 0.00
20.60 20.60 20.60 20.60 20.60 20.60 20.60 20.60 20.60 20.60 20.60 20.60 20.60 20.60 20.60 20.60 20.60 20.60 20.60 20.608.81% 10.10%
Unit: million USDProject Year (3) (2) (1) 1 2 3 4 5 6 7 8 9 10Power Sales Revenue 5.0 Cent/kWh 0 0 0 37.23 37.23 37.23 37.23 37.23 37.23 37.23 37.23 37.23 37.23Coal Fuel Cost 9.52 9.52 9.52 9.52 9.52 9.52 9.52 9.52 9.52 9.52O & M Cost 7.11 7.11 7.11 7.11 7.11 7.11 7.11 7.11 7.11 7.11
Operation Profit 20.60 20.60 20.60 20.60 20.60 20.60 20.60 20.60 20.60 20.60Depreciation 11.85 11.85 11.85 11.85 11.85 11.85 11.85 11.85 11.85 11.85
EBIT 8.74 8.74 8.74 8.74 8.74 8.74 8.74 8.74 8.74 8.74EBITDA 20.60 20.60 20.60 20.60 20.60 20.60 20.60 20.60 20.60 20.60
Tax 0.00 0.00 0.00 0.00 0.00 0.00 0.00 0.00 0.00 0.00Capital Expenditure 177.78 35.56 71.11 71.11
Free Cashflow (35.56) (71.11) (71.11) 20.60 20.60 20.60 20.60 20.60 20.60 20.60 20.60 20.60 20.60IRR on Investment 2.40%
Source: JICA Study Team
Resultant IRR is as follows:
E-IRR 6 US ¢/kWh
E-IRR 5 US ¢/kWh
10 Year (%) 7.86% 2.40% 20 Year (%) 13.01% 8.81% 30 Year (%) 13.86% 10.10%
As a conclusion, it may be difficult for the private sector to build and operate the same project as proposed herewith. It is recommended to use a soft ODA loan for this project.

58
16 Cement Market
At present, cement is supplied to East Kalimantan by the State run Tonasa Cement Corporation. Tonasa Cement manufactures their product in Pangkep, in the southern part of Surawesi Island, near a limestone mine. Their manufacturing plant has a total of four units: three units using a Dry Process and 1 unit using a Wet Process. Annual production capacity is 4 million tons. The cement products are distributed to the various regions through the cement-packaging plants. Locations of these cement packing plants include Makassar, Bitung, Bali, Banjarmasin, Ambon, Donggala and Samarinda. The following provides an overview of the cement distribution system.
Cement Manufacturing Plant
Pangkep, Sulawesi
Packing Plant Makassar
Packing Plant Celukang Bawang Bali
Packing Plant Banjarmasin Kalsel
Packing Plant Samarinda Kaltim
Packing Plant Bitung Sulut
Packing Plant Donggala Sulteng
Packing Plant Ambon Maluku
3 Units (Dry) in operation1 Unit (Wet) idle
Capacity:4,000,000 ton/year
Source: PLN
Fig. 34 Tonasa Cement Supply System (Kalimantan /Surawesi Area)
Tonasa has four types of cement products. However, fly ash cement is not always marketed due to a shortage of the fly ash blend stocks in the area. Portland cement Jenis 1 (OPC): Ordinary cement Portland composite cement (PCC): 15% fly-ash, 5% limestone Portland Pozzolan cement (PPC): 10% fly-ash Fly-ash cement (if ash is available): 40% fly-ash In 2005, roughly 250,000 tons of cement products were sold in Samarinda City. A total of 27% is sold mainly to the private ready-mixed concrete firms and the remaining 73% is packaged in paper bags for supply to construction companies.

59
Silo: 6,000 ton x 2 (40m)Capacity: 2 x 360,000 ton/yearSales: 30,000 ton/MonthMarket: OPC (70%)
PCC (15-20%)PPC (10-15%)
Packing Plant Samarinda Kaltim
Concrete SupplierSamarinda Ready Mix
Concrete SupplierArta Mix
Concrete SupplierBorneo Ready Mix
Concrete SupplierMawar Ready Mix
Concrete SupplierLuhribu
Concrete SupplierDira Mix
Concrete SupplierSEP
Concrete SupplierKalimantan Ready Mix
出典: PLN
Fig. 35 Tonasa Cement Distribution System in Samarinda Area
The amount of Fly Ash generation by this proposed project is estimated at 46,000 tons per annum. This figure corresponds to 2% of the Tonasa Cement production capacity. The amount of Bottom Ash production is estimated at around 11,000 tons a year. At present, aggregate and gravels are delivered from South Kalimantan, Surawesi and even Malaysia. Bottom Ash will also be in a high demand under such circumstances. In conclusion, Fly Ash and Bottom Ash demand is very high and the CFB boiler will be able to generate a quality of ash suitable for various applications.
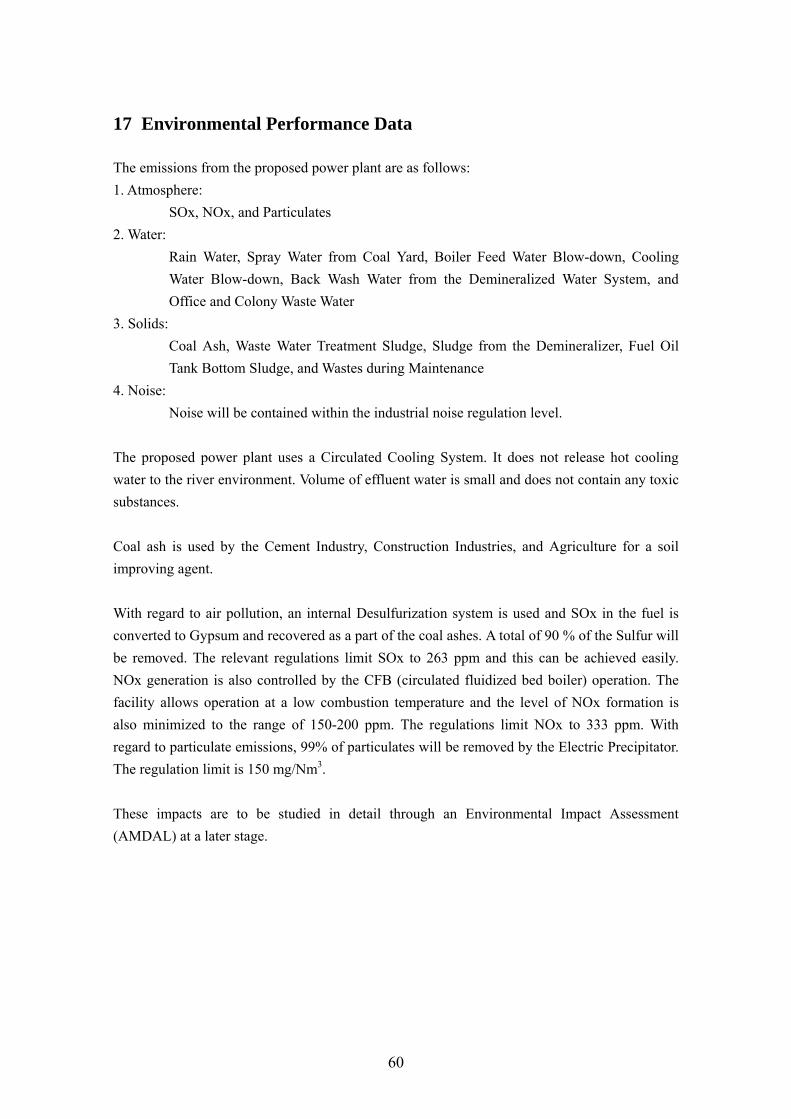
60
17 Environmental Performance Data
The emissions from the proposed power plant are as follows: 1. Atmosphere:
SOx, NOx, and Particulates 2. Water:
Rain Water, Spray Water from Coal Yard, Boiler Feed Water Blow-down, Cooling Water Blow-down, Back Wash Water from the Demineralized Water System, and Office and Colony Waste Water
3. Solids: Coal Ash, Waste Water Treatment Sludge, Sludge from the Demineralizer, Fuel Oil Tank Bottom Sludge, and Wastes during Maintenance
4. Noise: Noise will be contained within the industrial noise regulation level.
The proposed power plant uses a Circulated Cooling System. It does not release hot cooling water to the river environment. Volume of effluent water is small and does not contain any toxic substances. Coal ash is used by the Cement Industry, Construction Industries, and Agriculture for a soil improving agent. With regard to air pollution, an internal Desulfurization system is used and SOx in the fuel is converted to Gypsum and recovered as a part of the coal ashes. A total of 90 % of the Sulfur will be removed. The relevant regulations limit SOx to 263 ppm and this can be achieved easily. NOx generation is also controlled by the CFB (circulated fluidized bed boiler) operation. The facility allows operation at a low combustion temperature and the level of NOx formation is also minimized to the range of 150-200 ppm. The regulations limit NOx to 333 ppm. With regard to particulate emissions, 99% of particulates will be removed by the Electric Precipitator. The regulation limit is 150 mg/Nm3. These impacts are to be studied in detail through an Environmental Impact Assessment (AMDAL) at a later stage.
61
18 Schedule
The proposed power plant construction schedule was also investigated. Based on the PLN Ten-Year Plan prepared in 2006, the timing for the startup will be January 2012, based on ODA financial arrangements. Major milestones in the project execution are as follows: (1) PLN Ten Year Plan listed (Reviewed in December 2006) (2) Preparation stage for construction, including Basic Engineering and confirmation of
the Feasibility FS AMDAL Power Purchase Agreement (If Applicable) Fuel Supply Agreement Preparation of Various Approval Documents Procedure of Funding Arrangement Process Selection of Consultants and/or Contractors
(3) Start of Detailed Design (May 2009) (4) Construction (June 2009-December 2011) (5) Commissioning and Commencement of the Commercial Operation (January 2012 or
thereafter)

62
19 Further Works
Further works to complete the Feasibility Study of the Project are listed as follows: 1. Local boring survey 2. Combustion tests using coal samples 3. Ash Sample Analysis 4. Prepare Equipment Specifications and Detailed Construction Cost Study 5. Review of the Construction Schedule
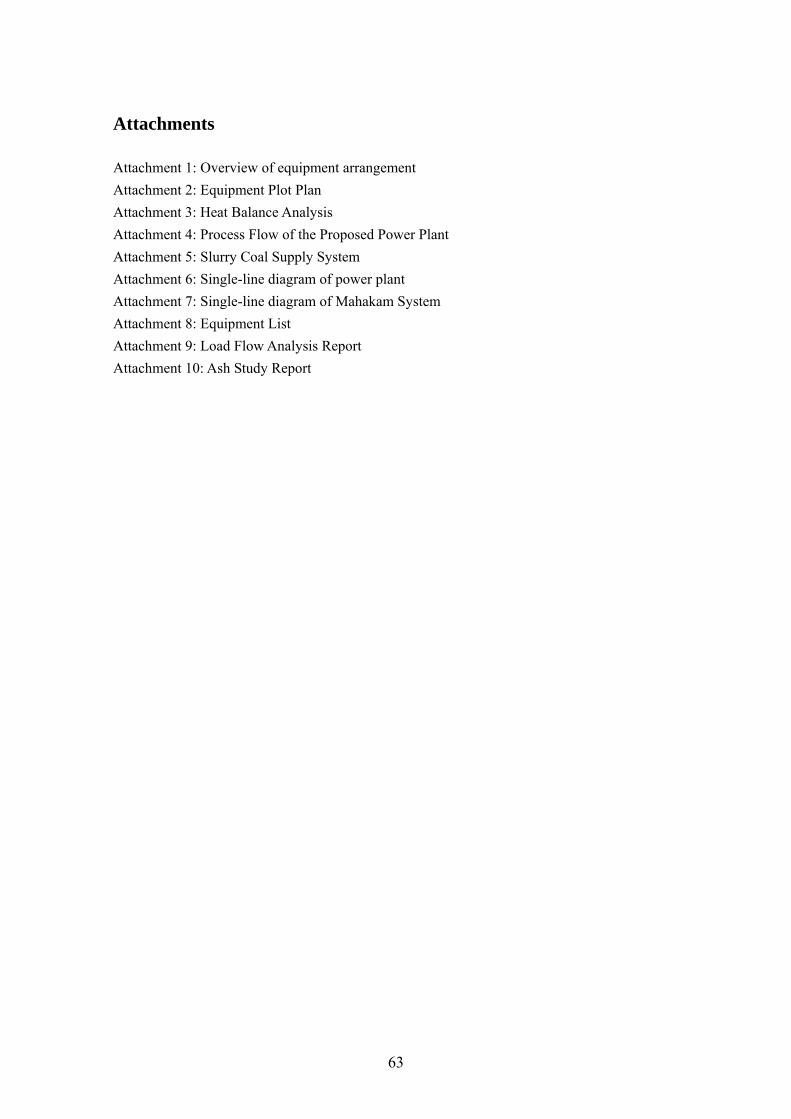
63
Attachments
Attachment 1: Overview of equipment arrangement Attachment 2: Equipment Plot Plan Attachment 3: Heat Balance Analysis Attachment 4: Process Flow of the Proposed Power Plant Attachment 5: Slurry Coal Supply System Attachment 6: Single-line diagram of power plant Attachment 7: Single-line diagram of Mahakam System Attachment 8: Equipment List Attachment 9: Load Flow Analysis Report Attachment 10: Ash Study Report
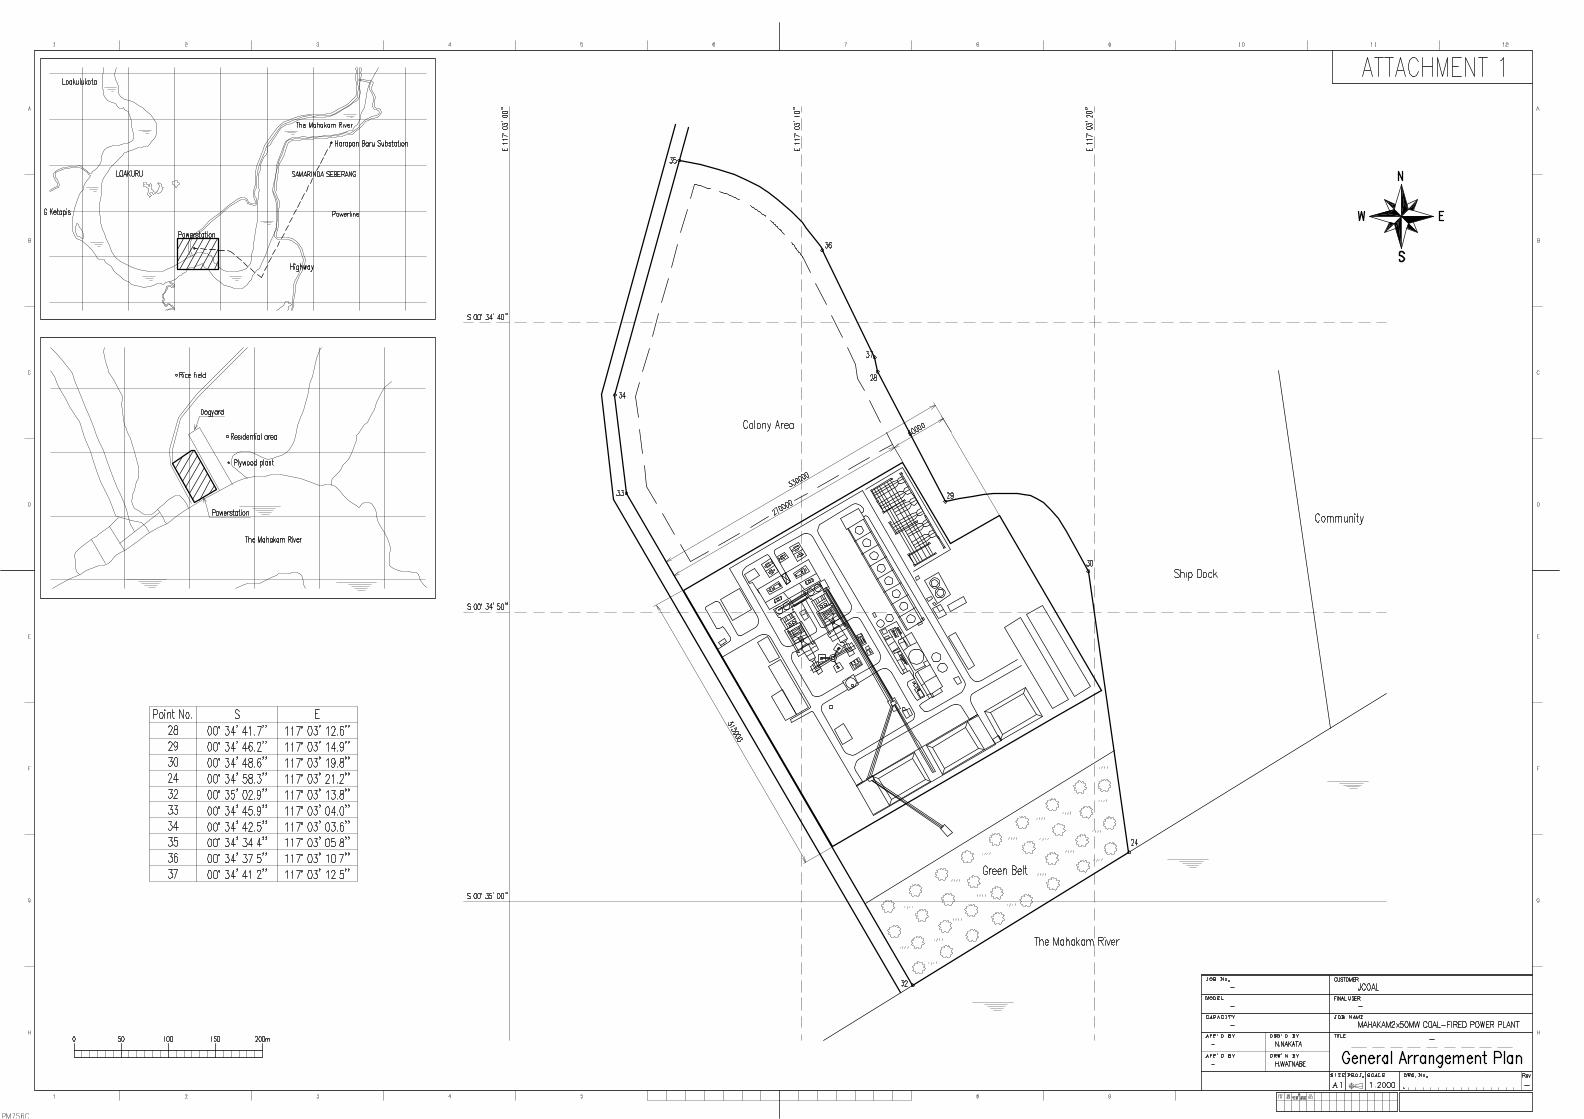
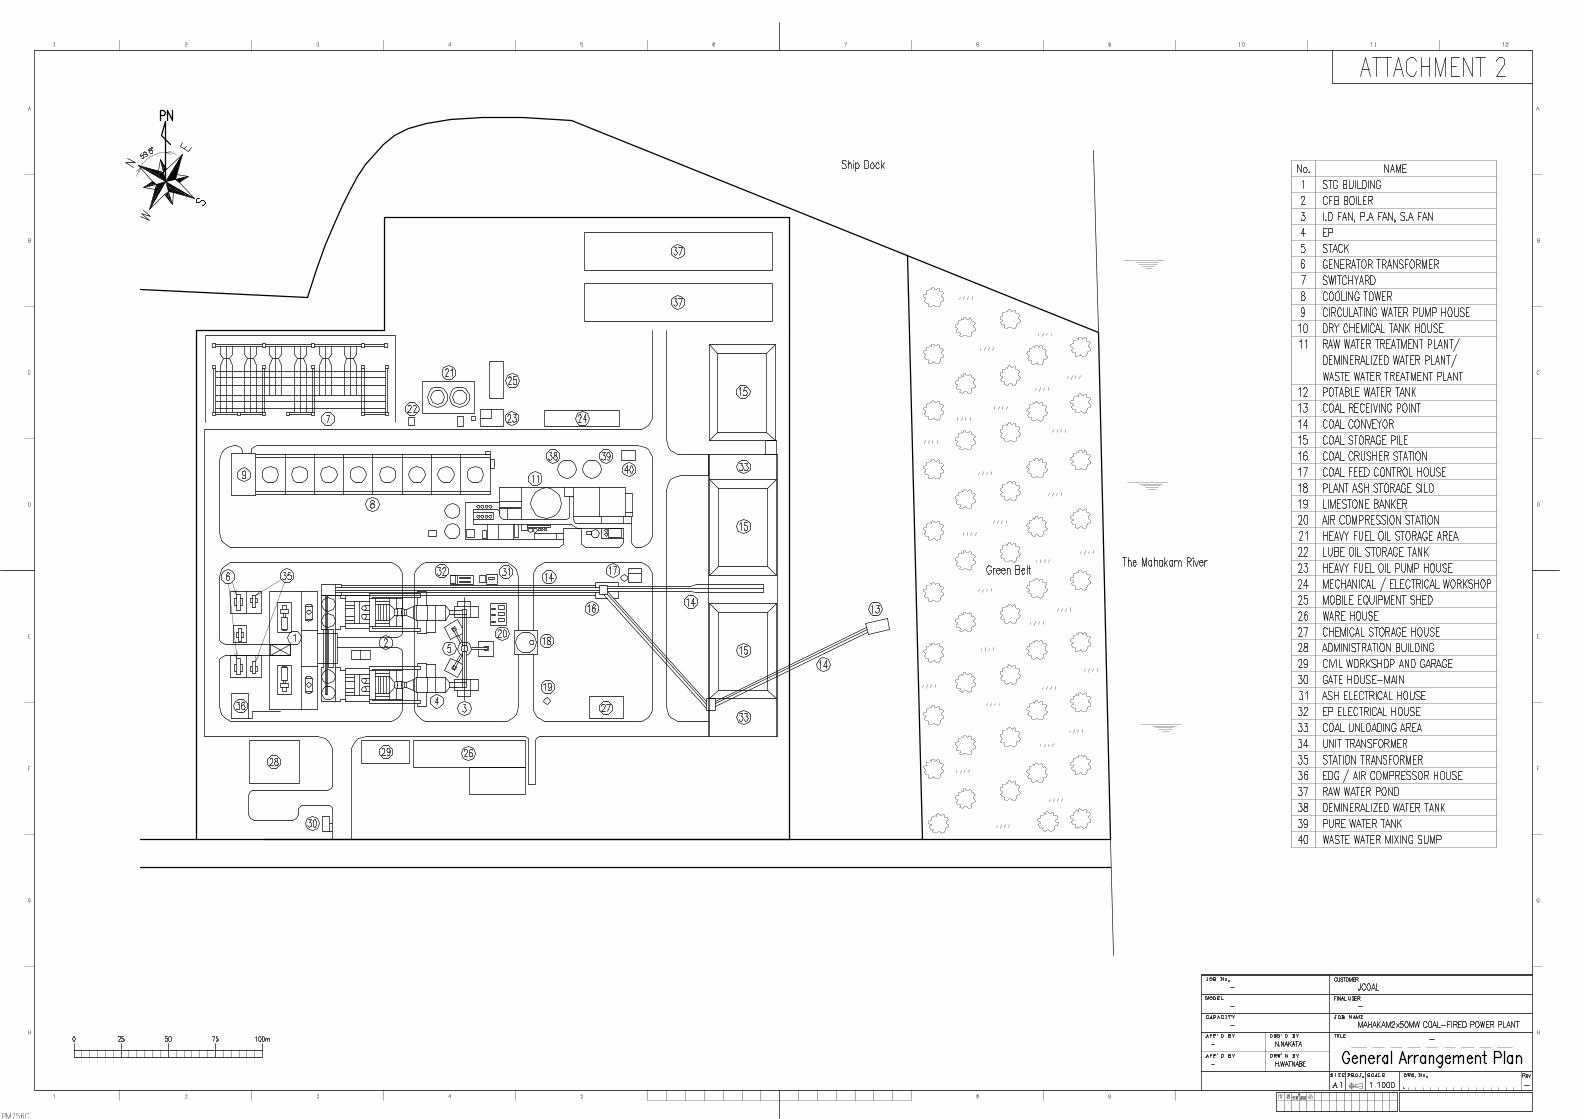
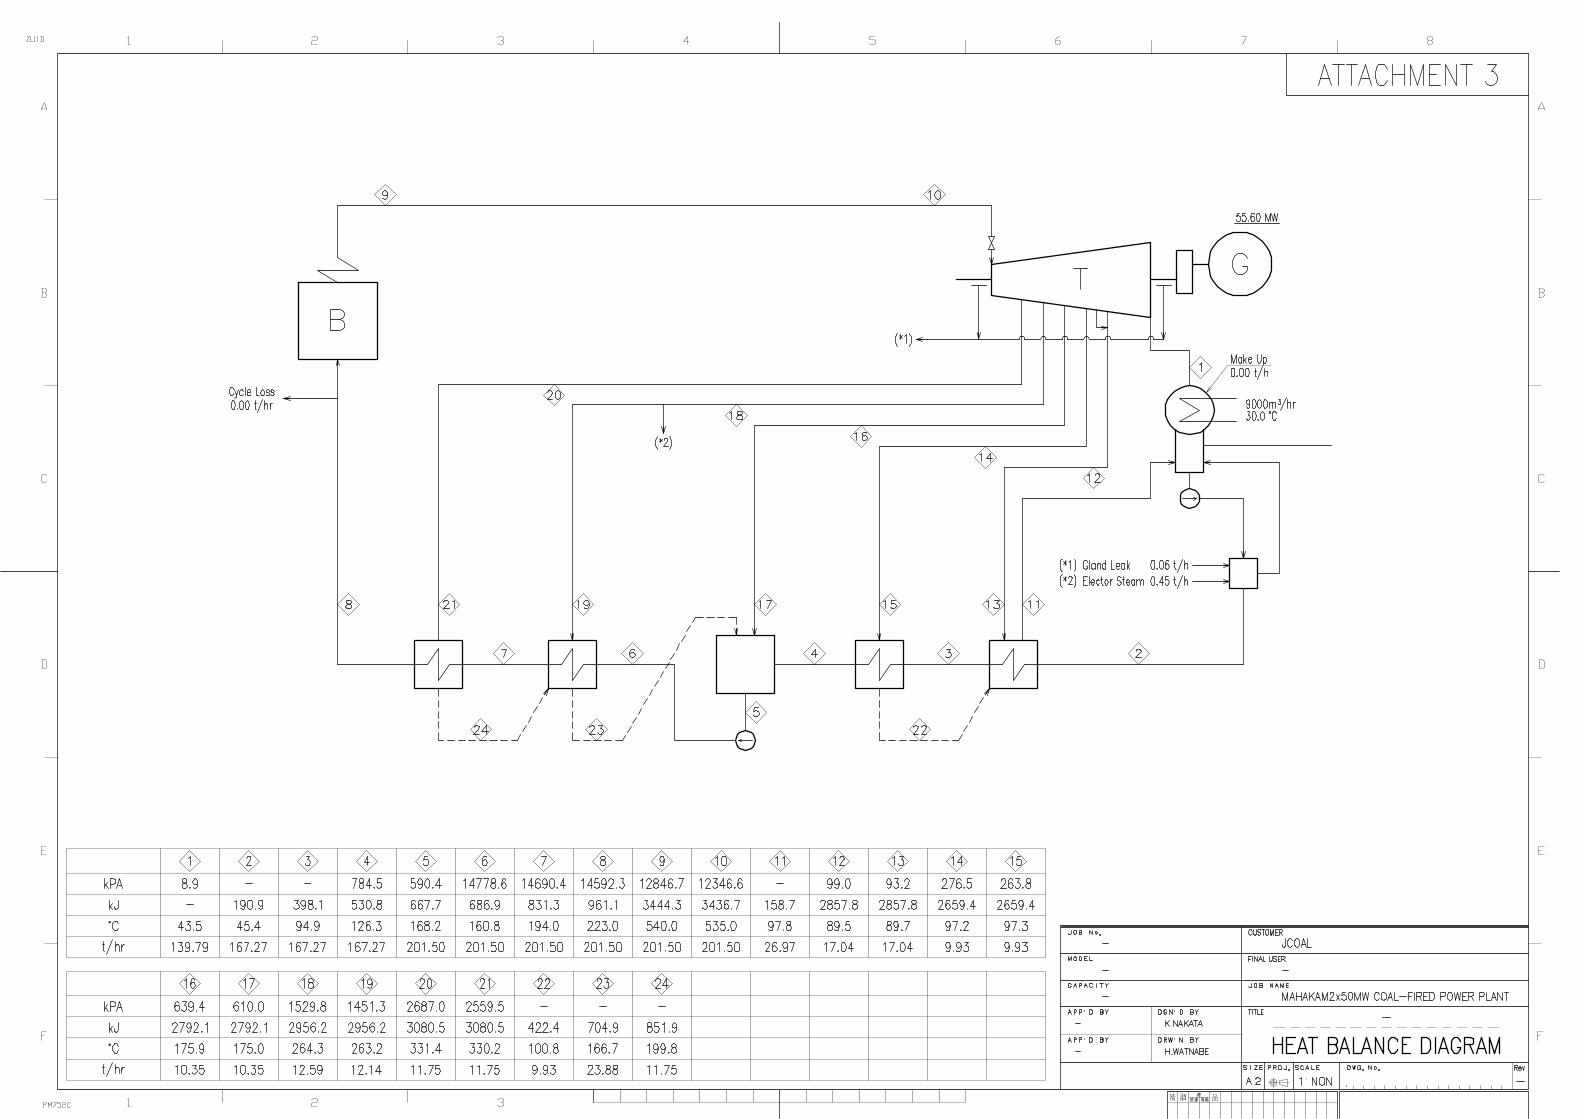

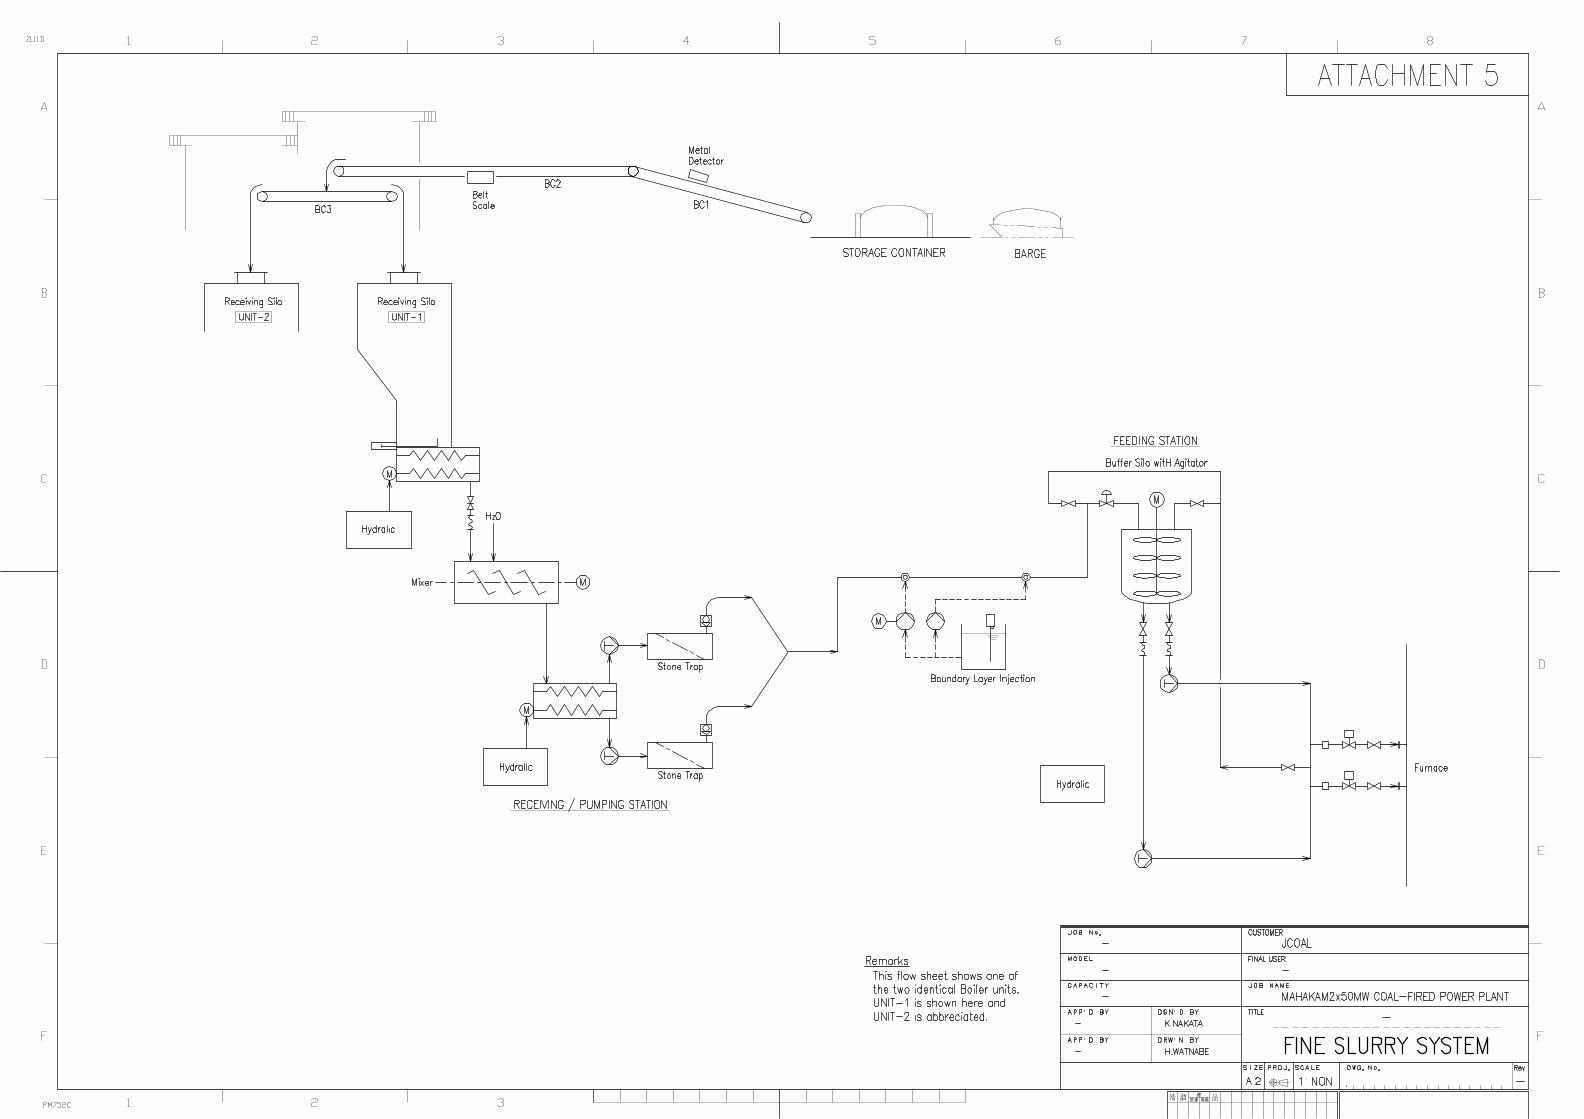
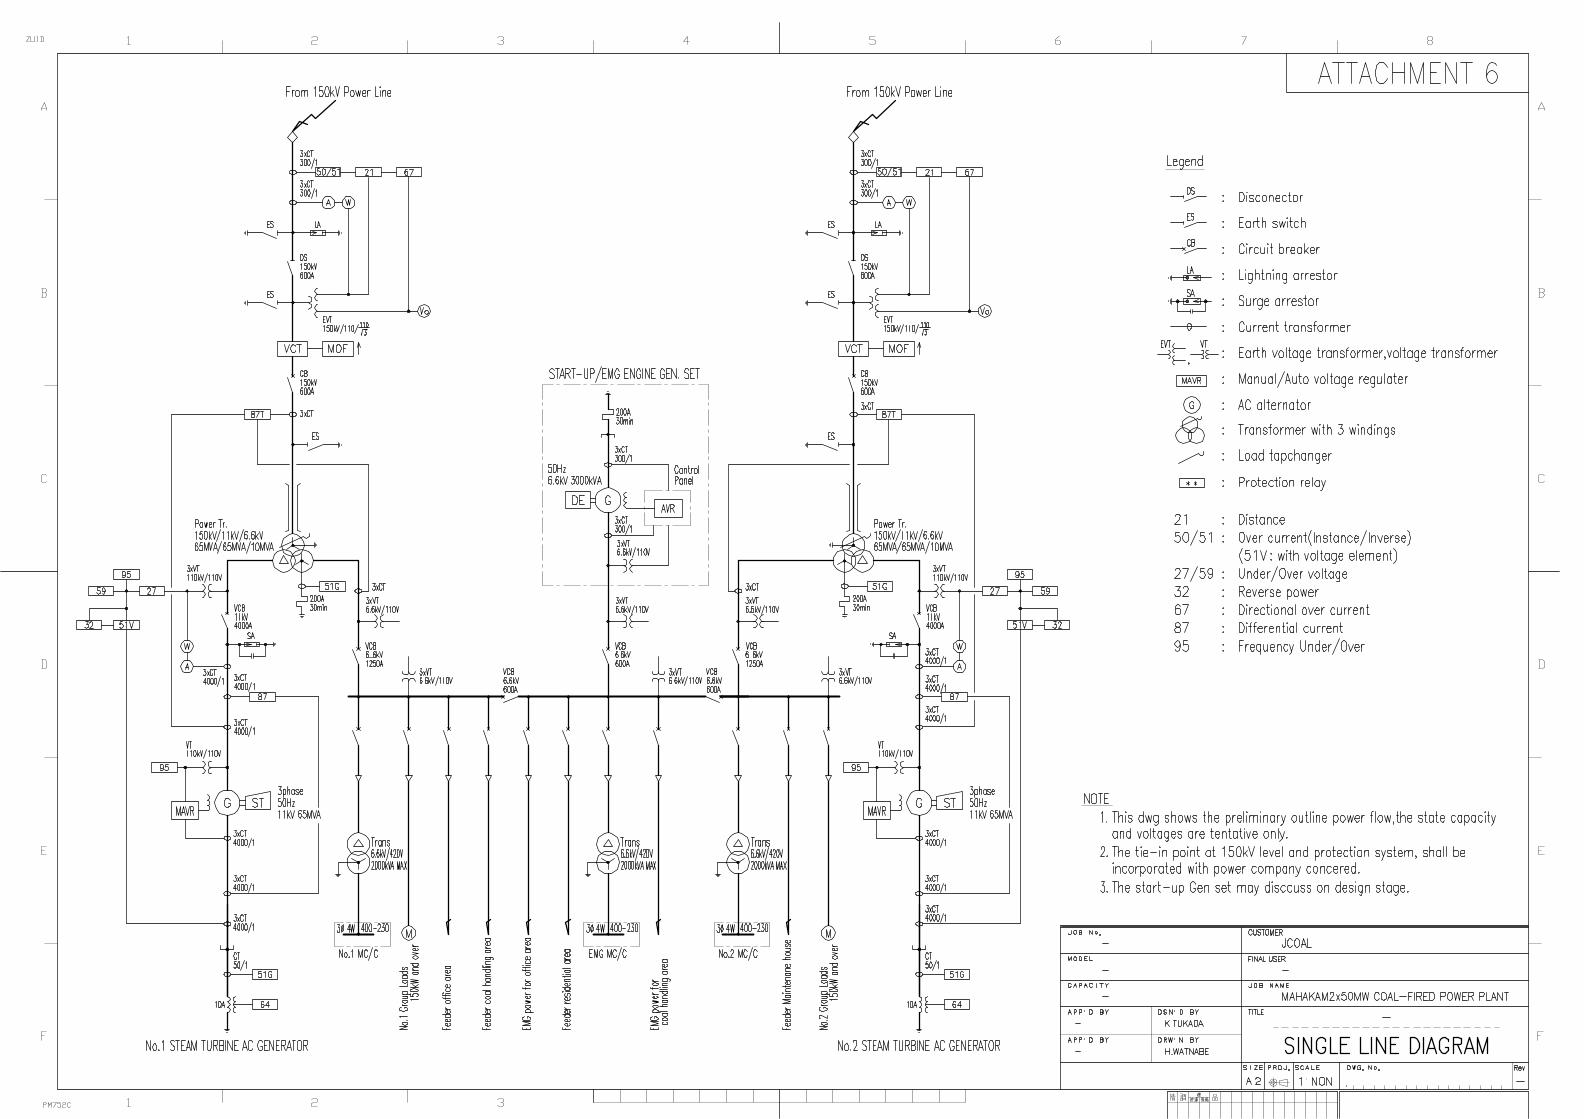
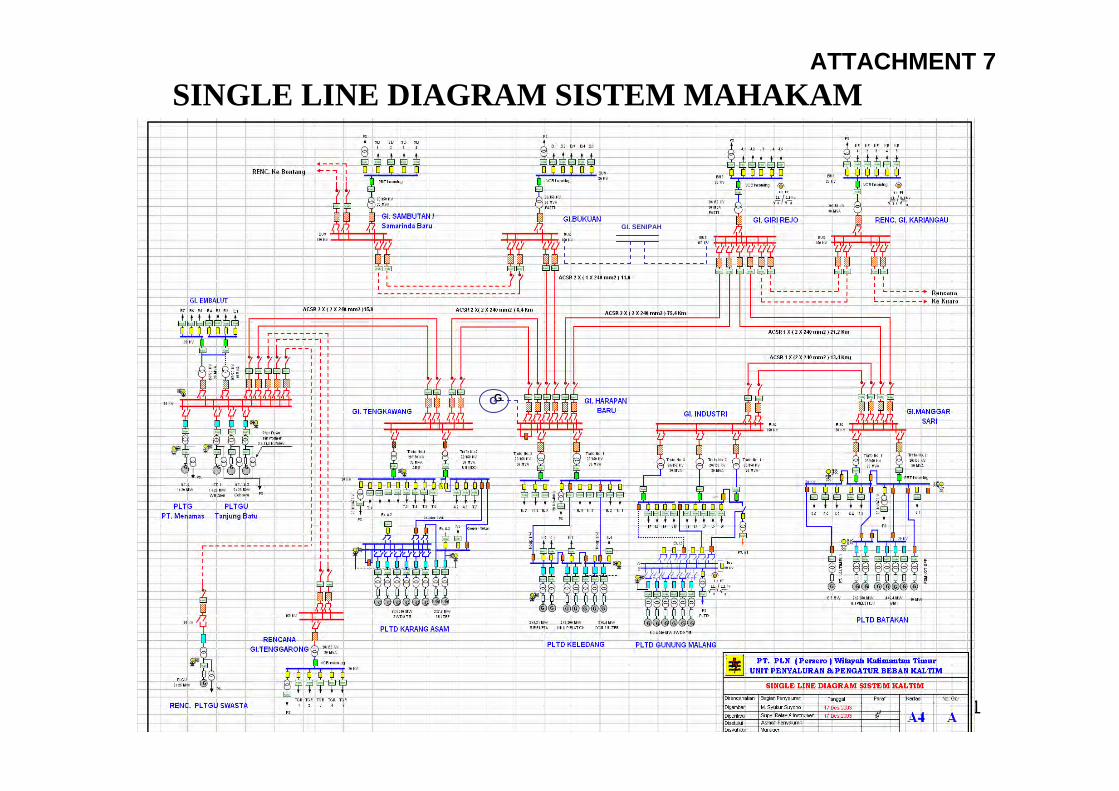
1
SINGLE LINE DIAGRAM SISTEM MAHAKAM
GI. SENIPAH
GG
ATTACHMENT 7
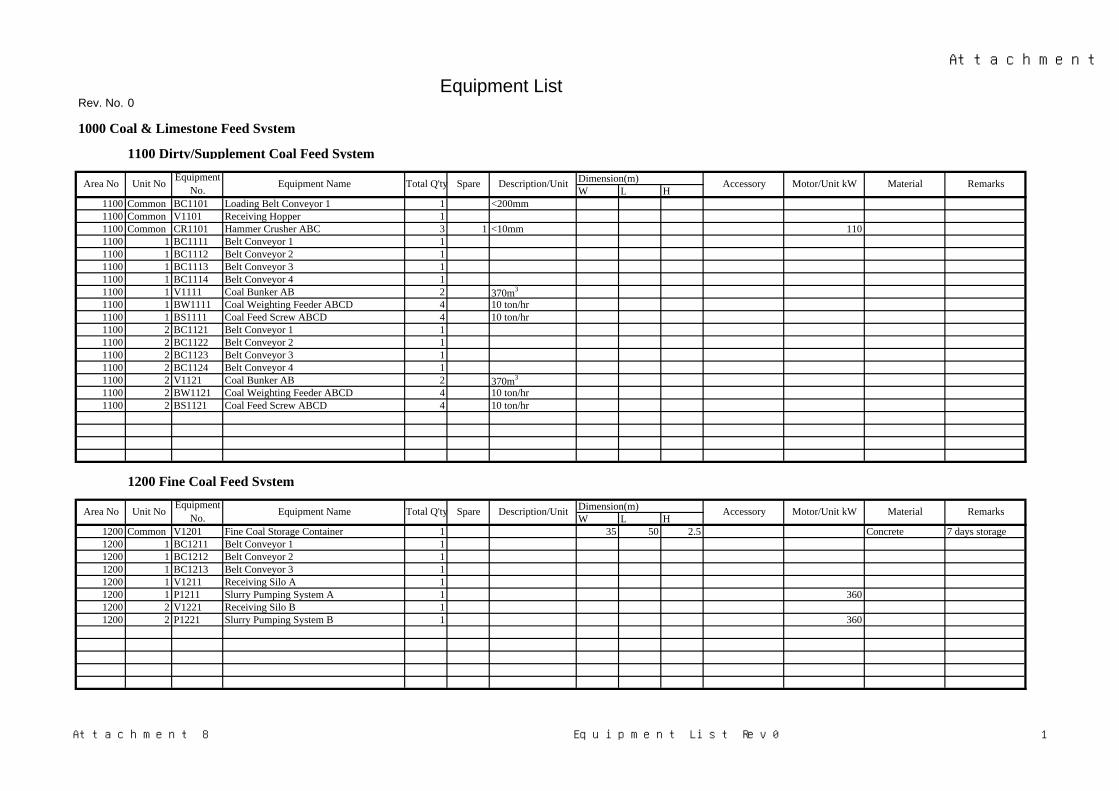
Attachment 8
Rev. No. 0
1000 Coal & Limestone Feed System
1100 Dirty/Supplement Coal Feed System
Dimension(m)W L H
1100 Common BC1101 Loading Belt Conveyor 1 1 <200mm1100 Common V1101 Receiving Hopper 11100 Common CR1101 Hammer Crusher ABC 3 1 <10mm 1101100 1 BC1111 Belt Conveyor 1 11100 1 BC1112 Belt Conveyor 2 11100 1 BC1113 Belt Conveyor 3 11100 1 BC1114 Belt Conveyor 4 11100 1 V1111 Coal Bunker AB 2 370m3
1100 1 BW1111 Coal Weighting Feeder ABCD 4 10 ton/hr1100 1 BS1111 Coal Feed Screw ABCD 4 10 ton/hr1100 2 BC1121 Belt Conveyor 1 11100 2 BC1122 Belt Conveyor 2 11100 2 BC1123 Belt Conveyor 3 11100 2 BC1124 Belt Conveyor 4 11100 2 V1121 Coal Bunker AB 2 370m3
1100 2 BW1121 Coal Weighting Feeder ABCD 4 10 ton/hr1100 2 BS1121 Coal Feed Screw ABCD 4 10 ton/hr
1200 Fine Coal Feed System
Dimension(m)W L H
1200 Common V1201 Fine Coal Storage Container 1 35 50 2.5 Concrete 7 days storage1200 1 BC1211 Belt Conveyor 1 11200 1 BC1212 Belt Conveyor 2 11200 1 BC1213 Belt Conveyor 3 11200 1 V1211 Receiving Silo A 11200 1 P1211 Slurry Pumping System A 1 3601200 2 V1221 Receiving Silo B 11200 2 P1221 Slurry Pumping System B 1 360
Motor/Unit kW Material RemarksTotal Q'ty Spare Description/Unit AccessoryArea No Unit No EquipmentNo. Equipment Name
Motor/Unit kW Material Remarks
Equipment List
Area No Total Q'ty Spare Description/UnitEquipmentNo. Equipment NameUnit No Accessory
Attachment 8 Equipment List Rev0 1
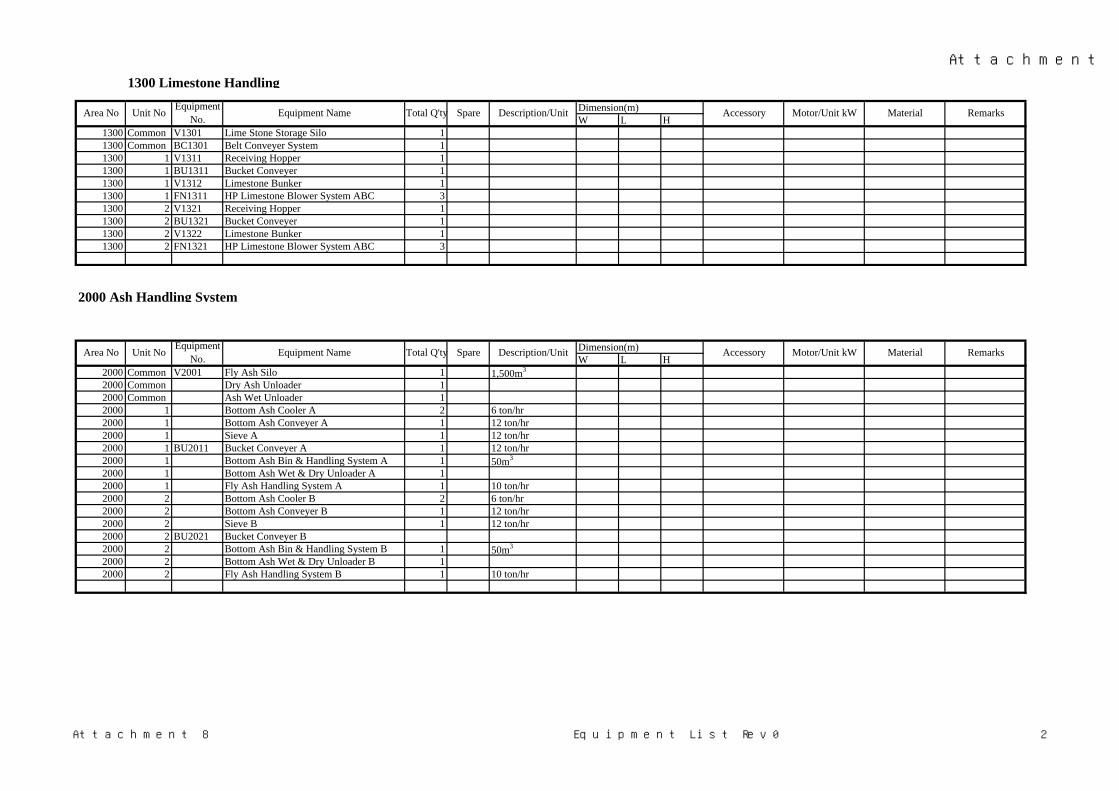
Attachment 8
1300 Limestone Handling
Dimension(m)W L H
1300 Common V1301 Lime Stone Storage Silo 11300 Common BC1301 Belt Conveyer System 11300 1 V1311 Receiving Hopper 11300 1 BU1311 Bucket Conveyer 11300 1 V1312 Limestone Bunker 11300 1 FN1311 HP Limestone Blower System ABC 31300 2 V1321 Receiving Hopper 11300 2 BU1321 Bucket Conveyer 11300 2 V1322 Limestone Bunker 11300 2 FN1321 HP Limestone Blower System ABC 3
2000 Ash Handling System
Dimension(m)W L H
2000 Common V2001 Fly Ash Silo 1 1,500m3
2000 Common Dry Ash Unloader 12000 Common Ash Wet Unloader 12000 1 Bottom Ash Cooler A 2 6 ton/hr2000 1 Bottom Ash Conveyer A 1 12 ton/hr2000 1 Sieve A 1 12 ton/hr2000 1 BU2011 Bucket Conveyer A 1 12 ton/hr2000 1 Bottom Ash Bin & Handling System A 1 50m3
2000 1 Bottom Ash Wet & Dry Unloader A 12000 1 Fly Ash Handling System A 1 10 ton/hr2000 2 Bottom Ash Cooler B 2 6 ton/hr2000 2 Bottom Ash Conveyer B 1 12 ton/hr2000 2 Sieve B 1 12 ton/hr2000 2 BU2021 Bucket Conveyer B2000 2 Bottom Ash Bin & Handling System B 1 50m3
2000 2 Bottom Ash Wet & Dry Unloader B 12000 2 Fly Ash Handling System B 1 10 ton/hr
Motor/Unit kW Material RemarksTotal Q'ty Spare Description/Unit AccessoryArea No Unit No EquipmentNo. Equipment Name
Accessory Motor/Unit kW Material RemarksArea No Unit No EquipmentNo. Equipment Name Total Q'ty Spare Description/Unit
Attachment 8 Equipment List Rev0 2

Attachment 8
3000 Boiler System
3100 Boiler SystemEQUIPMENT LIST
Dimension(m)W L H
3100 1 F3111 Boiler System 1 CFB, 500,365 MJ/hr, 205 ton/hr3100 1 Oil Burner 13100 1 FN3111 HP Ash Blower ABC 33100 2 F3121 Boiler System 1 CFB, 500,365 MJ/hr, 205 ton/hr3100 2 Oil Burner 13100 2 FN3121 HP Ash Blower ABC 3
3200 Draft UnitEQUIPMENT LIST
Dimension(m)W L H
3200 1 FN3211 Primary Air Fan 1 1612m3/mx3000m motor,common bed 11503200 1 FN3212 Secondary Air Fan 1 1612m3/mx600mm motor,common bed 5503200 1 FN3213 Induced Draft Fan 1 5028m3/mx600mm motor,common bed 6803200 2 FN3221 Primary Air Fan 1 1612m3/mx3000m motor,common bed 11503200 2 FN3222 Secondary Air Fan 1 1612m3/mx600mm motor,common bed 5503200 2 FN3223 Induced Draft Fan 1 5028m3/mx600mm motor,common bed 680
3300 Flue Gas SystemEQUIPMENT LIST
Dimension(m)W L H
3300 1 EP3311 Electric Precipitator 1 400 kVA3300 2 EP3321 Electric Precipitator 1 400 kVA3300 Common Stack 1 60 m, 20 m/s
Accessory Motor/Unit kW Material Remarks
Motor/Unit kW Material Remarks
Area No Unit No EquipmentNo. Equipment Name Total Q'ty Spare Description/Unit
Total Q'ty Spare Description/Unit AccessoryArea No Unit No EquipmentNo. Equipment Name
Accessory Motor/Unit kW Material RemarksArea No Unit No EquipmentNo. Equipment Name Total Q'ty Spare Description/Unit
Attachment 8 Equipment List Rev0 3

Attachment 8
4000 Steam Turbine Generator System
4100 Boiler Feed Water SystemEQUIPMENT LIST
Dimension(m)W L H
4100 1 P4111 Condensate Pump A 2 1 167m3/hx120m 1104100 1 E4111 No1 LP Heater A 1 34,658 MJ/hr, 167.27 ton/hr4100 1 E4112 No2 LP Heater A 1 22,197 MJ/hr, 167.27 ton/hr4100 1 E4113 No1 HP Heater A 1 29,097 MJ/hr, 201.5 ton/hr4100 1 E4114 No2 HP Heater A 1 26,155 MJ/hr, 201.5 ton/hr4100 1 P4112 Boiler Feed Pump A 2 1 202m3/hx1400mx1 15004100 1 D4111 Dearator A4100 2 P4121 Condensate Pump B 2 1 167m3/hx120m 1104100 2 E4121 No1 LP Heater B 1 34,659 MJ/hr, 167.27 ton/hr4100 2 E4122 No2 LP Heater B 1 22,198 MJ/hr, 167.27 ton/hr4100 2 E4123 No1 HP Heater B 1 29,098 MJ/hr, 201.5 ton/hr4100 2 E4124 No2 HP Heater B 1 26,156 MJ/hr, 201.5 ton/hr4100 2 P4122 Boiler Feed Pump B 2 1 202m3/hx1400mx1 15004100 2 D4121 Dearator B
4200 Steam Turbine SystemEQUIPMENT LIST
Dimension(m)W L H
4200 1 ST4211 Steam Turbine A 1 535 ℃, 12346.6 MPA, 201.5 ton/hr, 8.9 kPA@ exhaust, 5 extracts4200 1 E4211 Condenser A 14200 2 ST4221 Steam Turbine B 1 535 ℃, 12346.6 MPA, 201.5 ton/hr, 8.9 kPA@ exhaust, 5 extracts4200 2 E4221 Condenser B 1
Accessory Motor/Unit kW Material Remarks
Motor/Unit kW Material Remarks
Area No Unit No EquipmentNo. Equipment Name Total Q'ty Spare Description/Unit
Total Q'ty Spare Description/Unit AccessoryArea No Unit No EquipmentNo. Equipment Name
Attachment 8 Equipment List Rev0 4
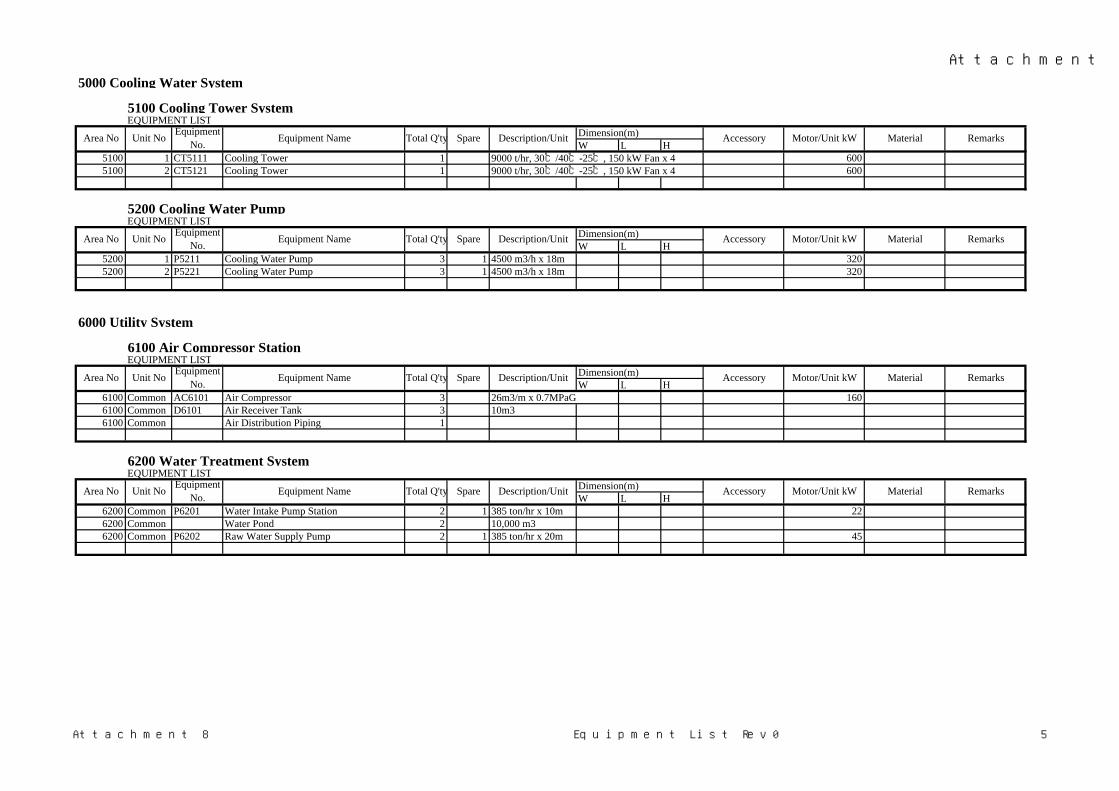
Attachment 8
5000 Cooling Water System
5100 Cooling Tower SystemEQUIPMENT LIST
Dimension(m)W L H
5100 1 CT5111 Cooling Tower 1 9000 t/hr, 30℃/40℃-25℃, 150 kW Fan x 4 6005100 2 CT5121 Cooling Tower 1 9000 t/hr, 30℃/40℃-25℃, 150 kW Fan x 4 600
5200 Cooling Water PumpEQUIPMENT LIST
Dimension(m)W L H
5200 1 P5211 Cooling Water Pump 3 1 4500 m3/h x 18m 3205200 2 P5221 Cooling Water Pump 3 1 4500 m3/h x 18m 320
6000 Utility System
6100 Air Compressor StationEQUIPMENT LIST
Dimension(m)W L H
6100 Common AC6101 Air Compressor 3 26m3/m x 0.7MPaG 1606100 Common D6101 Air Receiver Tank 3 10m36100 Common Air Distribution Piping 1
6200 Water Treatment SystemEQUIPMENT LIST
Dimension(m)W L H
6200 Common P6201 Water Intake Pump Station 2 1 385 ton/hr x 10m 226200 Common Water Pond 2 10,000 m36200 Common P6202 Raw Water Supply Pump 2 1 385 ton/hr x 20m 45
Motor/Unit kW Material RemarksTotal Q'ty Spare Description/Unit AccessoryArea No Unit No EquipmentNo. Equipment Name
Motor/Unit kW Material RemarksTotal Q'ty Spare Description/Unit AccessoryArea No Unit No EquipmentNo. Equipment Name
Accessory Motor/Unit kW Material Remarks
Motor/Unit kW Material Remarks
Area No Unit No EquipmentNo. Equipment Name Total Q'ty Spare Description/Unit
Total Q'ty Spare Description/Unit AccessoryArea No Unit No EquipmentNo. Equipment Name
Attachment 8 Equipment List Rev0 5
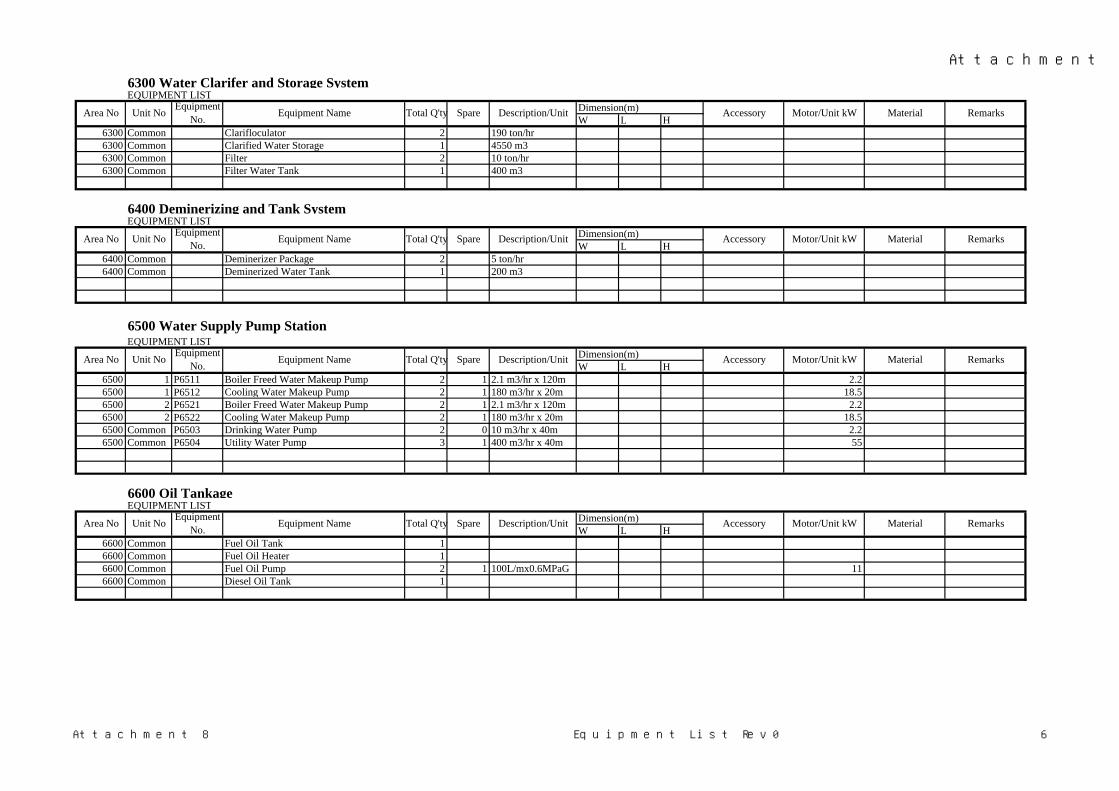
Attachment 8
6300 Water Clarifer and Storage SystemEQUIPMENT LIST
Dimension(m)W L H
6300 Common Clarifloculator 2 190 ton/hr6300 Common Clarified Water Storage 1 4550 m36300 Common Filter 2 10 ton/hr6300 Common Filter Water Tank 1 400 m3
6400 Deminerizing and Tank SystemEQUIPMENT LIST
Dimension(m)W L H
6400 Common Deminerizer Package 2 5 ton/hr6400 Common Deminerized Water Tank 1 200 m3
6500 Water Supply Pump StationEQUIPMENT LIST
Dimension(m)W L H
6500 1 P6511 Boiler Freed Water Makeup Pump 2 1 2.1 m3/hr x 120m 2.26500 1 P6512 Cooling Water Makeup Pump 2 1 180 m3/hr x 20m 18.56500 2 P6521 Boiler Freed Water Makeup Pump 2 1 2.1 m3/hr x 120m 2.26500 2 P6522 Cooling Water Makeup Pump 2 1 180 m3/hr x 20m 18.56500 Common P6503 Drinking Water Pump 2 0 10 m3/hr x 40m 2.26500 Common P6504 Utility Water Pump 3 1 400 m3/hr x 40m 55
6600 Oil TankageEQUIPMENT LIST
Dimension(m)W L H
6600 Common Fuel Oil Tank 16600 Common Fuel Oil Heater 16600 Common Fuel Oil Pump 2 1 100L/mx0.6MPaG 116600 Common Diesel Oil Tank 1
Motor/Unit kW Material RemarksTotal Q'ty Spare Description/Unit AccessoryArea No Unit No EquipmentNo. Equipment Name
Accessory Motor/Unit kW Material RemarksArea No Unit No EquipmentNo. Equipment Name Total Q'ty Spare Description/Unit
Motor/Unit kW Material RemarksTotal Q'ty Spare Description/Unit AccessoryArea No Unit No EquipmentNo. Equipment Name
Accessory Motor/Unit kW Material RemarksArea No Unit No EquipmentNo. Equipment Name Total Q'ty Spare Description/Unit
Attachment 8 Equipment List Rev0 6

Attachment 8
7000 Fire Pump Station
7100 Fire Pump StationEQUIPMENT LIST
Dimension(m)W L H
7100 Common Fire Pump7100 P7101 Motor Driven 1 200m3/hr x 80m 907100 P7102 Diesel Driven 1 200m3/hr x 80m 120PS7100 P7103 Pressurized Pump 1 10m3/hr x 80m 5.5
8000 Electric Power Transmission System
8100 Generator/TransformerEQUIPMENT LIST
Dimension(m)W L H
8100 1 Electric Generator A 1 55.6 MW, 50 Hz, 11kV, 65 MVA8100 1 Main Transformer A 1 150 kV,65MVA/11kV, 65MVA/6.6 kV,10 MVA8100 1 Startup/Emergency Engine Generator Set A 1 50 Hz, 6.6kV, 3000kVA8100 2 Electric Generator B 1 55.6 MW, 50 Hz, 11kV, 66 MVA8100 2 Main Transformer B 1 150 kV,65MVA/11kV, 65MVA/6.6 kV,10 MVA8100 2 Startup/Emergency Engine Generator Set B 1 50 Hz, 6.6kV, 3000kVA
8200 Switchyard and TransmissionEQUIPMENT LIST
Dimension(m)W L H
8200 Common Switchyard 1 Open, 2 Circuits, 150 kV, 600A
8200 Common Transmission Line 10 km
Accessory Motor/Unit kW Material Remarks
Motor/Unit kW Material Remarks
Area No Unit No EquipmentNo. Equipment Name Total Q'ty Spare Description/Unit
Total Q'ty Spare Description/Unit AccessoryArea No Unit No EquipmentNo. Equipment Name
Accessory Motor/Unit kW Material RemarksArea No Unit No EquipmentNo. Equipment Name Total Q'ty Spare Description/Unit
Attachment 8 Equipment List Rev0 7

Attachment 9
REPORT
LOAD FLOW ANALYSIS MAHAKAM SYSTEM, EAST KALIMANTAN
REVISION
11 December 2006
LOAD FLOW ANALYSIS MAHAKAM SYSTEM, EAST KALIMANTAN
TABLE OF CONTENTS REPORT OF POWER SYSTEM ANALYSIS OF MAHAKAM SYSTEM
1. PREFACE 2. SCOPE OF WORK
3. TECHNICAL DATA 4. JOB EXECUTION
4.1. EXISTING CONDITION OF MAHAKAM SYSTEM YEAR 2006
4.2. LOAD FLOW ANALYSIS OF MAHAKAM SYSTEM YEAR 2011 4.3. LOAD FLOW ANALYSIS OF MAHAKAM SYSTEM YEAR 2012
5. CONCLUSION
6. ATTACHMENTS
ATTACHMENT I : LOAD FLOW ANALYSIS OUTPUT RESULTS
ATTACHMENT II : TECHNICAL DATA

Attachment 9
LFA MAHAKAM SYSTEM 1
REPORT OF LOAD FLOW ANALYSIS OF MAHAKAM SYSTEM, EAST KALIMANTAN
1. PREFACE
PT. Engrowth Indonesia and PT. PLN (Persero) Jasa Sertifikasi have conducted
inspection and evaluation of Mahakam electrical system for the purpose of feasibility study for the construction of PLTU (Coal Fired Power Plant) Mahakam 2 x 50 MW located in Kutai Kartanegara, east Kalimantan.
Power flow analysis is the calculation of voltage, current, power and power factor or reactive power in several buses in an electrical network during normal operation whether it is still operating or future condition. The assessment of these parameters is important due to the changes in the electrical system caused by load changes, generation schedule, and transmission line configuration changes. There are various calculation methods which are usually used in load flow analysis with the help of computer that will answer the following questions: - How real and reactive power flow in a system at certain condition - Whether the transmission line, power transformer and other equipment are
still adequate to supply the required amount of electricity - How the voltage level in every bus behaves
Hence, based on the above explanation, load flow analysis study has the following functions:
a. For the development planning of an electrical power system
b. To get a good pattern of electrical power system operation
c. To determine losses in an electrical power system

Attachment 9
LFA MAHAKAM SYSTEM 2
2. SCOPE OF WORK
The scope of work of this inspection and evaluation of Mahakam electrical system covers:
- Revision of Power System in year 2012 with the revised data as follows:
o PLTU Kaltim 2 x 60 MW is connected to Substation Girirejo, before is Substation Embalut
o PLTU Mulut Tambang 2 x 25 MW is connected to Substation Girirejo, before is Substation Sambutan
o Proposed PLTU Mahakam 2 X 50 MW is connected to Substation Harapan Baru, before is Substation Bukuan
3. TECHNICAL DATA
The data used for this study are attached Attachment I as follows:
- Basic data such as generator data, transmission line data, transformer data, obtained from the data collection by PLN Balikpapan, East Kalimantan.
- Table of Mahakam load system.
4. JOB EXECUTION
4.1. EXISTING CONDITION OF MAHAKAM SYSTEM YEAR 2006
Base on table of Mahakam load system, peak load of Mahakam system in year 2006 is 199.53 MW, but total existing power generation is only 203 MW as shown in figure 1 below:

Attachment 9
LFA MAHAKAM SYSTEM 3
Figure 1. One line diagram of Mahakam system
At current time almost all generated power in Mahakam system is diesel generated power plant (PLTD).
To make the study much easier to analyze, the Mahakam System will be divided into a couple sub system areas, as follows:
- Area 1 ; sub system Samarinda
- Area 2 ; sub system Balikpapan
4.2. LOAD FLOW ANALYSIS OF MAHAKAM SYSTEM YEAR 2006 This Power flow analyze is needed to bring us a complete picture of the whole
system condition before PLTU Mahakam integrated into the Mahakam system. It was planned that PLTU Mahakam will be implemented into the system in the year of 2012.
a. Power generation and Load System of Mahakam Year 2006.
Power flow analysis is carried out during the peak load condition, 199.53 MW. From the analysis and calculation is clearly stated that with 15 operating machines, a power of 200.2 MW is generated, see Table 1 below:
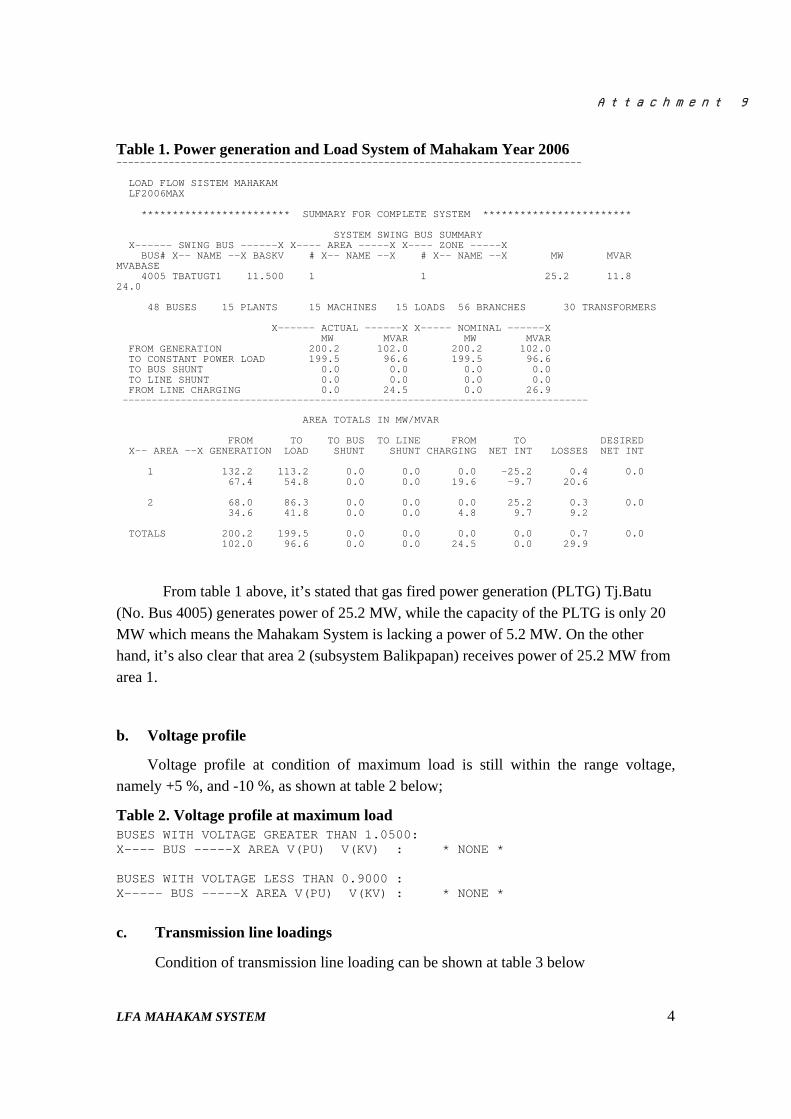
Attachment 9
LFA MAHAKAM SYSTEM 4
Table 1. Power generation and Load System of Mahakam Year 2006 -------------------------------------------------------------------------------- LOAD FLOW SISTEM MAHAKAM LF2006MAX ************************ SUMMARY FOR COMPLETE SYSTEM ************************ SYSTEM SWING BUS SUMMARY X------ SWING BUS ------X X---- AREA -----X X---- ZONE -----X BUS# X-- NAME --X BASKV # X-- NAME --X # X-- NAME --X MW MVAR MVABASE 4005 TBATUGT1 11.500 1 1 25.2 11.8 24.0 48 BUSES 15 PLANTS 15 MACHINES 15 LOADS 56 BRANCHES 30 TRANSFORMERS X------ ACTUAL ------X X----- NOMINAL ------X MW MVAR MW MVAR FROM GENERATION 200.2 102.0 200.2 102.0 TO CONSTANT POWER LOAD 199.5 96.6 199.5 96.6 TO BUS SHUNT 0.0 0.0 0.0 0.0 TO LINE SHUNT 0.0 0.0 0.0 0.0 FROM LINE CHARGING 0.0 24.5 0.0 26.9 -------------------------------------------------------------------------------- AREA TOTALS IN MW/MVAR FROM TO TO BUS TO LINE FROM TO DESIRED X-- AREA --X GENERATION LOAD SHUNT SHUNT CHARGING NET INT LOSSES NET INT 1 132.2 113.2 0.0 0.0 0.0 -25.2 0.4 0.0 67.4 54.8 0.0 0.0 19.6 -9.7 20.6 2 68.0 86.3 0.0 0.0 0.0 25.2 0.3 0.0 34.6 41.8 0.0 0.0 4.8 9.7 9.2 TOTALS 200.2 199.5 0.0 0.0 0.0 0.0 0.7 0.0 102.0 96.6 0.0 0.0 24.5 0.0 29.9
From table 1 above, it’s stated that gas fired power generation (PLTG) Tj.Batu
(No. Bus 4005) generates power of 25.2 MW, while the capacity of the PLTG is only 20 MW which means the Mahakam System is lacking a power of 5.2 MW. On the other hand, it’s also clear that area 2 (subsystem Balikpapan) receives power of 25.2 MW from area 1.
b. Voltage profile
Voltage profile at condition of maximum load is still within the range voltage, namely +5 %, and -10 %, as shown at table 2 below;
Table 2. Voltage profile at maximum load BUSES WITH VOLTAGE GREATER THAN 1.0500: X---- BUS -----X AREA V(PU) V(KV) : * NONE * BUSES WITH VOLTAGE LESS THAN 0.9000 : X----- BUS -----X AREA V(PU) V(KV) : * NONE * c. Transmission line loadings
Condition of transmission line loading can be shown at table 3 below
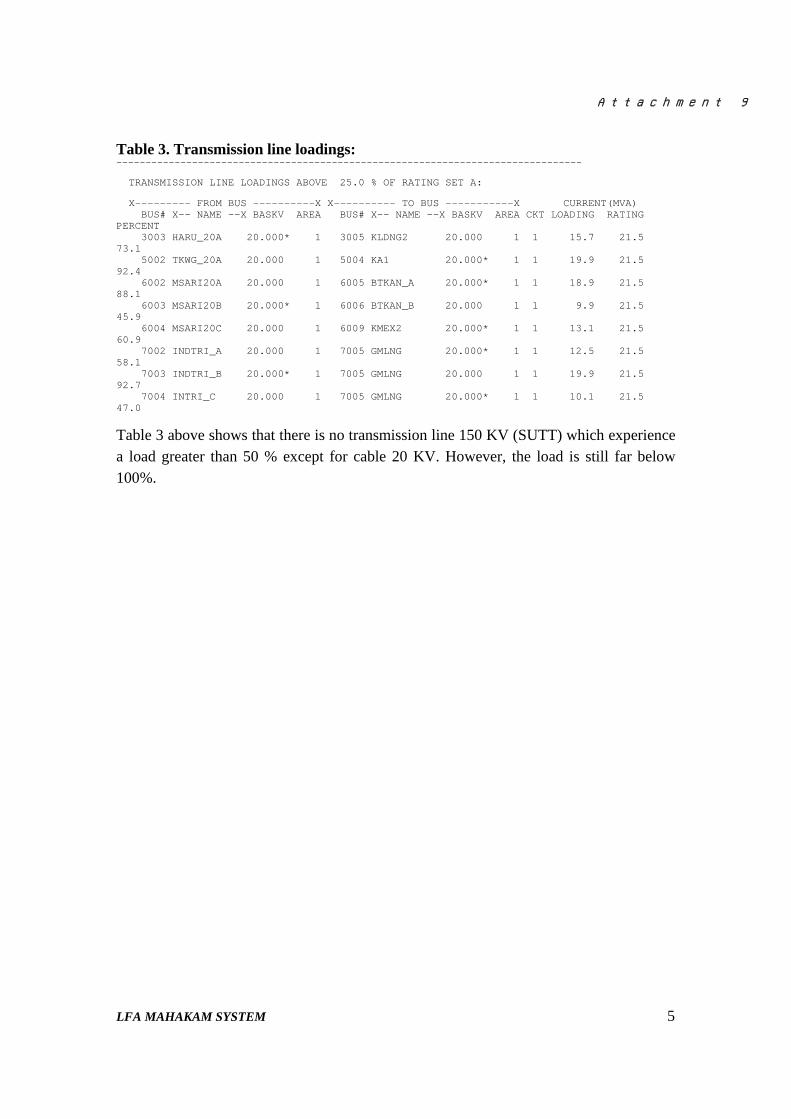
Attachment 9
LFA MAHAKAM SYSTEM 5
Table 3. Transmission line loadings: -------------------------------------------------------------------------------- TRANSMISSION LINE LOADINGS ABOVE 25.0 % OF RATING SET A: X--------- FROM BUS ----------X X---------- TO BUS -----------X CURRENT(MVA) BUS# X-- NAME --X BASKV AREA BUS# X-- NAME --X BASKV AREA CKT LOADING RATING PERCENT 3003 HARU_20A 20.000* 1 3005 KLDNG2 20.000 1 1 15.7 21.5 73.1 5002 TKWG_20A 20.000 1 5004 KA1 20.000* 1 1 19.9 21.5 92.4 6002 MSARI20A 20.000 1 6005 BTKAN_A 20.000* 1 1 18.9 21.5 88.1 6003 MSARI20B 20.000* 1 6006 BTKAN_B 20.000 1 1 9.9 21.5 45.9 6004 MSARI20C 20.000 1 6009 KMEX2 20.000* 1 1 13.1 21.5 60.9 7002 INDTRI_A 20.000 1 7005 GMLNG 20.000* 1 1 12.5 21.5 58.1 7003 INDTRI_B 20.000* 1 7005 GMLNG 20.000 1 1 19.9 21.5 92.7 7004 INTRI_C 20.000 1 7005 GMLNG 20.000* 1 1 10.1 21.5 47.0 Table 3 above shows that there is no transmission line 150 KV (SUTT) which experience a load greater than 50 % except for cable 20 KV. However, the load is still far below 100%.

Attachment 9
LFA MAHAKAM SYSTEM 6
4.3. LOAD FLOW ANALYSIS OF MAHAKAM SYSTEM YEAR 2011
In year 2011 the system will change significantly. All new power supplies integrated into the system will give up to 500 MW of power. The total power produce by Mahakam System will then reach 576 MW, while the prediction of the peak load in 2011 is assumed around 385.324 MW
a. Power generation and Load System of Mahakam Year 2011.
Power flow analysis is carried out during the peak load condition, 385.324 MW. From the analysis and calculation is clearly stated that with 16 operating machines, a power of 390.9 MW is generated, see Table 4 below:
Table 4. Power generation and Load System of Mahakam Year 2011 ------------------------------------------------------------------------------- -------------------------------------------------------------------------------- ************************ SUMMARY FOR COMPLETE SYSTEM ************************ SYSTEM SWING BUS SUMMARY X------ SWING BUS ------X X---- AREA -----X X---- ZONE -----X BUS# X-- NAME --X BASKV # X-- NAME --X # X-- NAME --X MW MVAR MVABASE 9021 PLTU KALTIM1 11.000 1 1 -77.1 36.7 75.0 58 BUSES 16 PLANTS 16 MACHINES 20 LOADS 74 BRANCHES 44 TRANSFORMERS
AREA TOTALS IN MW/MVAR FROM TO TO BUS TO LINE FROM TO DESIRED X-- AREA --X GENERATION LOAD SHUNT SHUNT CHARGING NET INT LOSSES NET INT 1 280.9 218.2 0.0 0.0 0.0 34.4 4.0 0.0 205.1 103.2 0.0 0.0 24.0 26.1 88.1 2 110.0 167.3 0.0 0.0 0.0 -34.4 1.4 0.0 54.8 80.0 0.0 0.0 28.1 -26.1 40.7 TOTALS 390.9 385.5 0.0 0.0 0.0 0.0 5.4 0.0 259.9 183.2 0.0 0.0 52.1 0.0 128.8
There is a power transmission of 34.4 MW from area 1 to area 2, at peak load, the total losses can reach 5.4 MW or 1.38 % from total generated power (Table 4).
Here, the swing bus receives -77.1 MW, while the capacity of PLTU kaltim1 (Bus 9021) is 60 MW, which results into an excess of power of 137.1 MW.
b. Voltage profile
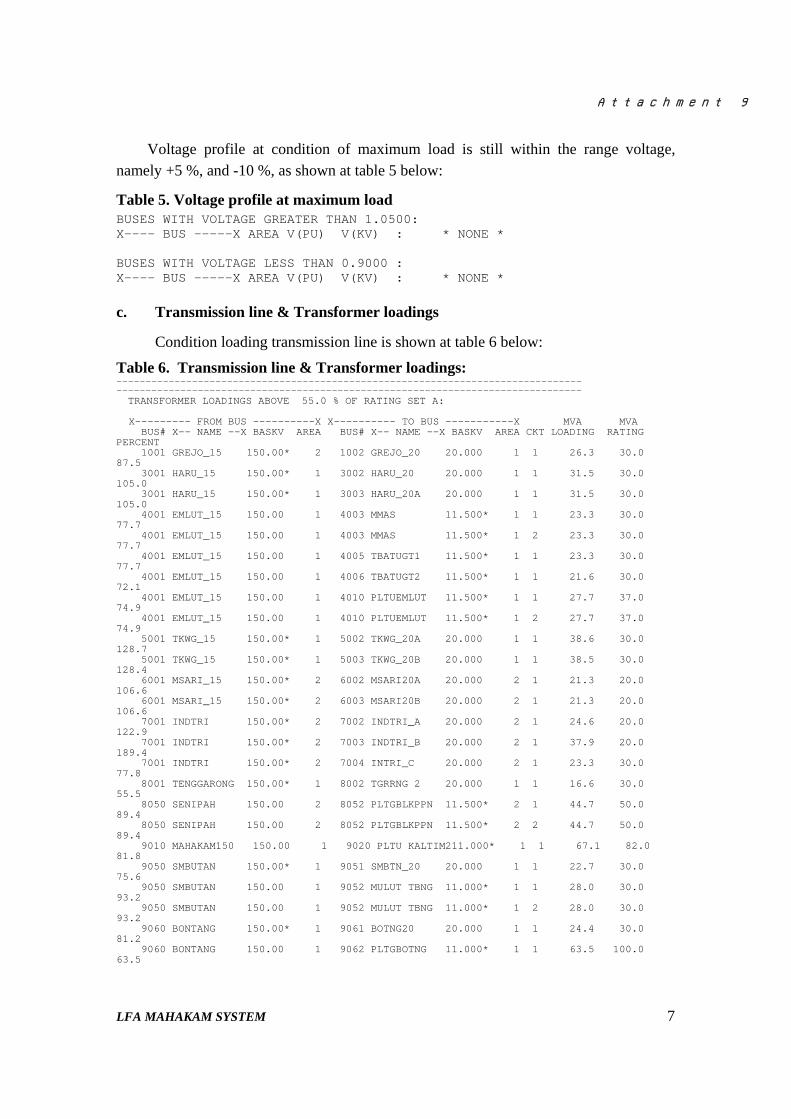
Attachment 9
LFA MAHAKAM SYSTEM 7
Voltage profile at condition of maximum load is still within the range voltage, namely +5 %, and -10 %, as shown at table 5 below:
Table 5. Voltage profile at maximum load BUSES WITH VOLTAGE GREATER THAN 1.0500: X---- BUS -----X AREA V(PU) V(KV) : * NONE * BUSES WITH VOLTAGE LESS THAN 0.9000 : X---- BUS -----X AREA V(PU) V(KV) : * NONE *
c. Transmission line & Transformer loadings
Condition loading transmission line is shown at table 6 below:
Table 6. Transmission line & Transformer loadings: -------------------------------------------------------------------------------- -------------------------------------------------------------------------------- TRANSFORMER LOADINGS ABOVE 55.0 % OF RATING SET A: X--------- FROM BUS ----------X X---------- TO BUS -----------X MVA MVA BUS# X-- NAME --X BASKV AREA BUS# X-- NAME --X BASKV AREA CKT LOADING RATING PERCENT 1001 GREJO_15 150.00* 2 1002 GREJO_20 20.000 1 1 26.3 30.0 87.5 3001 HARU_15 150.00* 1 3002 HARU_20 20.000 1 1 31.5 30.0 105.0 3001 HARU_15 150.00* 1 3003 HARU_20A 20.000 1 1 31.5 30.0 105.0 4001 EMLUT_15 150.00 1 4003 MMAS 11.500* 1 1 23.3 30.0 77.7 4001 EMLUT_15 150.00 1 4003 MMAS 11.500* 1 2 23.3 30.0 77.7 4001 EMLUT_15 150.00 1 4005 TBATUGT1 11.500* 1 1 23.3 30.0 77.7 4001 EMLUT_15 150.00 1 4006 TBATUGT2 11.500* 1 1 21.6 30.0 72.1 4001 EMLUT_15 150.00 1 4010 PLTUEMLUT 11.500* 1 1 27.7 37.0 74.9 4001 EMLUT_15 150.00 1 4010 PLTUEMLUT 11.500* 1 2 27.7 37.0 74.9 5001 TKWG_15 150.00* 1 5002 TKWG_20A 20.000 1 1 38.6 30.0 128.7 5001 TKWG_15 150.00* 1 5003 TKWG_20B 20.000 1 1 38.5 30.0 128.4 6001 MSARI_15 150.00* 2 6002 MSARI20A 20.000 2 1 21.3 20.0 106.6 6001 MSARI_15 150.00* 2 6003 MSARI20B 20.000 2 1 21.3 20.0 106.6 7001 INDTRI 150.00* 2 7002 INDTRI_A 20.000 2 1 24.6 20.0 122.9 7001 INDTRI 150.00* 2 7003 INDTRI_B 20.000 2 1 37.9 20.0 189.4 7001 INDTRI 150.00* 2 7004 INTRI_C 20.000 2 1 23.3 30.0 77.8 8001 TENGGARONG 150.00* 1 8002 TGRRNG 2 20.000 1 1 16.6 30.0 55.5 8050 SENIPAH 150.00 2 8052 PLTGBLKPPN 11.500* 2 1 44.7 50.0 89.4 8050 SENIPAH 150.00 2 8052 PLTGBLKPPN 11.500* 2 2 44.7 50.0 89.4 9010 MAHAKAM150 150.00 1 9020 PLTU KALTIM211.000* 1 1 67.1 82.0 81.8 9050 SMBUTAN 150.00* 1 9051 SMBTN_20 20.000 1 1 22.7 30.0 75.6 9050 SMBUTAN 150.00 1 9052 MULUT TBNG 11.000* 1 1 28.0 30.0 93.2 9050 SMBUTAN 150.00 1 9052 MULUT TBNG 11.000* 1 2 28.0 30.0 93.2 9060 BONTANG 150.00* 1 9061 BOTNG20 20.000 1 1 24.4 30.0 81.2 9060 BONTANG 150.00 1 9062 PLTGBOTNG 11.000* 1 1 63.5 100.0 63.5

Attachment 9
LFA MAHAKAM SYSTEM 8
9060 BONTANG 150.00 1 9062 PLTGBOTNG 11.000* 1 2 63.5 100.0 63.5 9090 KUARO 150.00 2 9092 PLTUBIOMAS 11.000* 2 1 16.7 20.0 83.6 9090 KUARO 150.00 2 9092 PLTUBIOMAS 11.000* 2 2 16.7 20.0 83.6
We can see here in table 6 that the transformer load in SS Industri, SS Manggarsari, SS Harapan Baru and SS Tengkawang is over 100% of their capacities. To overcome the power flow problem, an action should be carried out:
- Replace the overload transformers or add more new transformers.
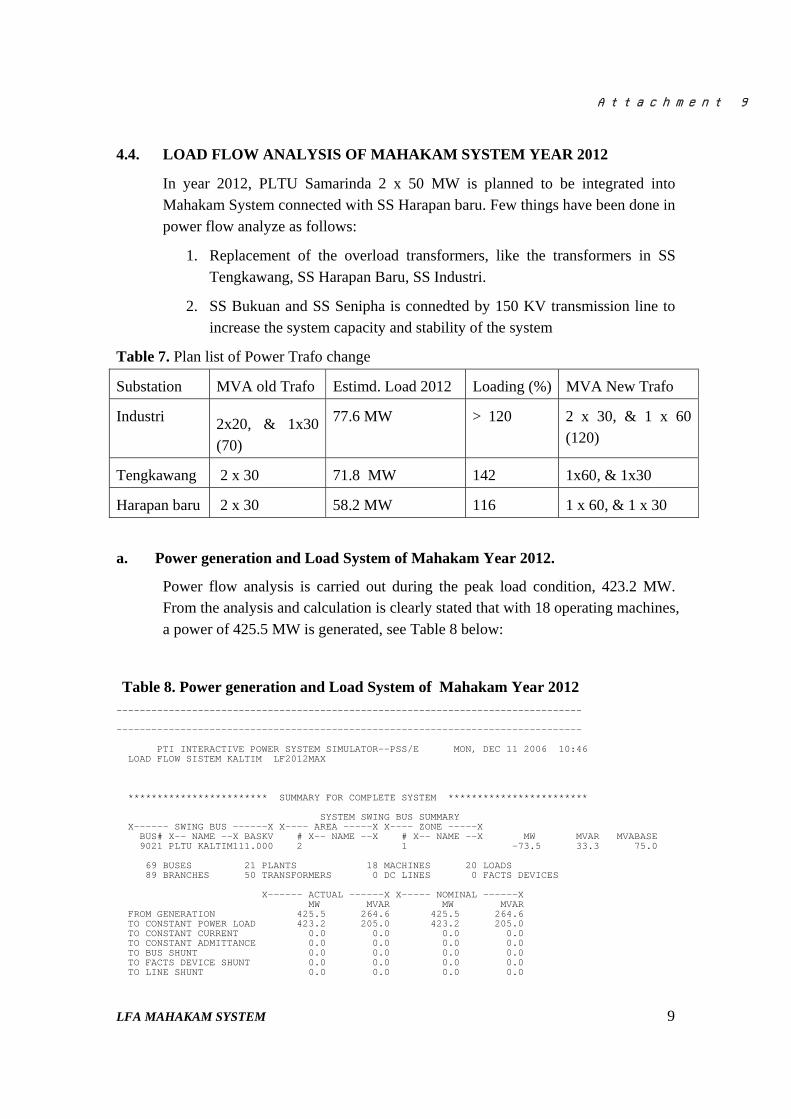
Attachment 9
LFA MAHAKAM SYSTEM 9
4.4. LOAD FLOW ANALYSIS OF MAHAKAM SYSTEM YEAR 2012
In year 2012, PLTU Samarinda 2 x 50 MW is planned to be integrated into Mahakam System connected with SS Harapan baru. Few things have been done in power flow analyze as follows:
1. Replacement of the overload transformers, like the transformers in SS Tengkawang, SS Harapan Baru, SS Industri.
2. SS Bukuan and SS Senipha is connedted by 150 KV transmission line to increase the system capacity and stability of the system
Table 7. Plan list of Power Trafo change
Substation MVA old Trafo Estimd. Load 2012 Loading (%) MVA New Trafo
Industri 2x20, & 1x30 (70)
77.6 MW > 120
2 x 30, & 1 x 60 (120)
Tengkawang 2 x 30 71.8 MW 142 1x60, & 1x30
Harapan baru 2 x 30 58.2 MW 116 1 x 60, & 1 x 30
a. Power generation and Load System of Mahakam Year 2012.
Power flow analysis is carried out during the peak load condition, 423.2 MW. From the analysis and calculation is clearly stated that with 18 operating machines, a power of 425.5 MW is generated, see Table 8 below:
Table 8. Power generation and Load System of Mahakam Year 2012 -------------------------------------------------------------------------------- -------------------------------------------------------------------------------- PTI INTERACTIVE POWER SYSTEM SIMULATOR--PSS/E MON, DEC 11 2006 10:46 LOAD FLOW SISTEM KALTIM LF2012MAX ************************ SUMMARY FOR COMPLETE SYSTEM ************************ SYSTEM SWING BUS SUMMARY X------ SWING BUS ------X X---- AREA -----X X---- ZONE -----X BUS# X-- NAME --X BASKV # X-- NAME --X # X-- NAME --X MW MVAR MVABASE 9021 PLTU KALTIM111.000 2 1 -73.5 33.3 75.0 69 BUSES 21 PLANTS 18 MACHINES 20 LOADS 89 BRANCHES 50 TRANSFORMERS 0 DC LINES 0 FACTS DEVICES X------ ACTUAL ------X X----- NOMINAL ------X MW MVAR MW MVAR FROM GENERATION 425.5 264.6 425.5 264.6 TO CONSTANT POWER LOAD 423.2 205.0 423.2 205.0 TO CONSTANT CURRENT 0.0 0.0 0.0 0.0 TO CONSTANT ADMITTANCE 0.0 0.0 0.0 0.0 TO BUS SHUNT 0.0 0.0 0.0 0.0 TO FACTS DEVICE SHUNT 0.0 0.0 0.0 0.0 TO LINE SHUNT 0.0 0.0 0.0 0.0
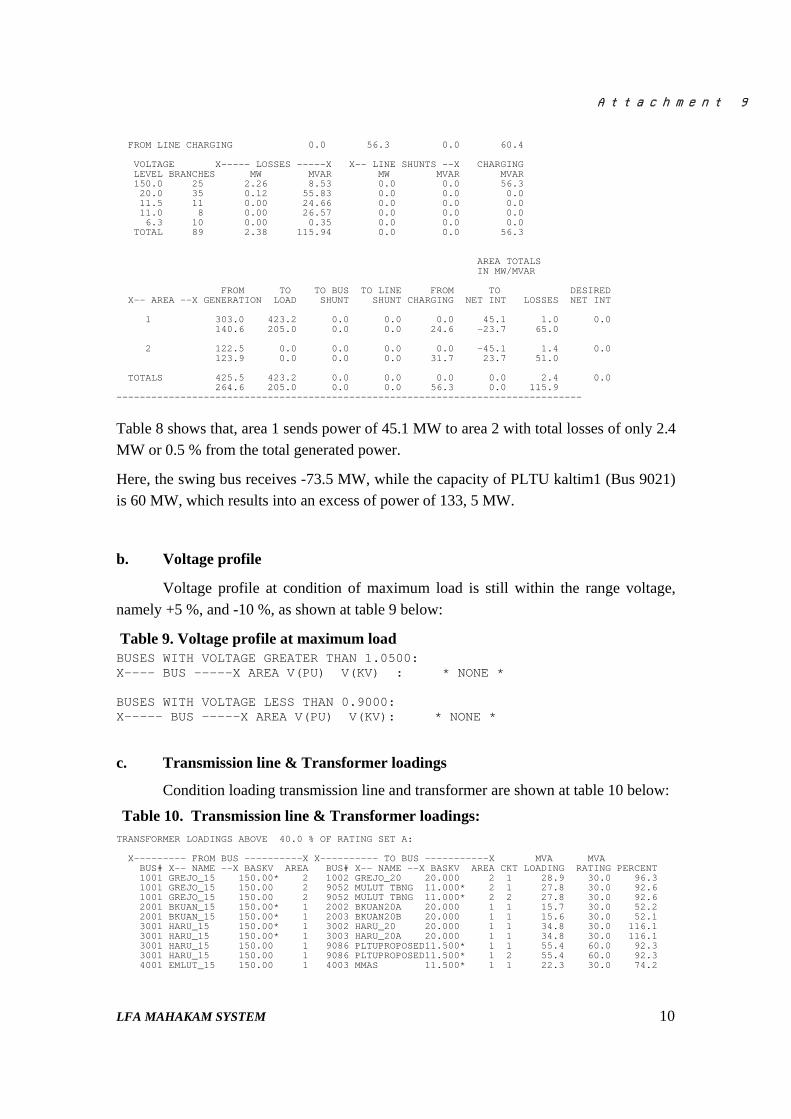
Attachment 9
LFA MAHAKAM SYSTEM 10
FROM LINE CHARGING 0.0 56.3 0.0 60.4 VOLTAGE X----- LOSSES -----X X-- LINE SHUNTS --X CHARGING LEVEL BRANCHES MW MVAR MW MVAR MVAR 150.0 25 2.26 8.53 0.0 0.0 56.3 20.0 35 0.12 55.83 0.0 0.0 0.0 11.5 11 0.00 24.66 0.0 0.0 0.0 11.0 8 0.00 26.57 0.0 0.0 0.0 6.3 10 0.00 0.35 0.0 0.0 0.0 TOTAL 89 2.38 115.94 0.0 0.0 56.3 AREA TOTALS IN MW/MVAR FROM TO TO BUS TO LINE FROM TO DESIRED X-- AREA --X GENERATION LOAD SHUNT SHUNT CHARGING NET INT LOSSES NET INT 1 303.0 423.2 0.0 0.0 0.0 45.1 1.0 0.0 140.6 205.0 0.0 0.0 24.6 -23.7 65.0 2 122.5 0.0 0.0 0.0 0.0 -45.1 1.4 0.0 123.9 0.0 0.0 0.0 31.7 23.7 51.0 TOTALS 425.5 423.2 0.0 0.0 0.0 0.0 2.4 0.0 264.6 205.0 0.0 0.0 56.3 0.0 115.9 --------------------------------------------------------------------------------
Table 8 shows that, area 1 sends power of 45.1 MW to area 2 with total losses of only 2.4 MW or 0.5 % from the total generated power.
Here, the swing bus receives -73.5 MW, while the capacity of PLTU kaltim1 (Bus 9021) is 60 MW, which results into an excess of power of 133, 5 MW.
b. Voltage profile
Voltage profile at condition of maximum load is still within the range voltage, namely +5 %, and -10 %, as shown at table 9 below:
Table 9. Voltage profile at maximum load BUSES WITH VOLTAGE GREATER THAN 1.0500: X---- BUS -----X AREA V(PU) V(KV) : * NONE * BUSES WITH VOLTAGE LESS THAN 0.9000: X----- BUS -----X AREA V(PU) V(KV): * NONE * c. Transmission line & Transformer loadings
Condition loading transmission line and transformer are shown at table 10 below:
Table 10. Transmission line & Transformer loadings: TRANSFORMER LOADINGS ABOVE 40.0 % OF RATING SET A: X--------- FROM BUS ----------X X---------- TO BUS -----------X MVA MVA BUS# X-- NAME --X BASKV AREA BUS# X-- NAME --X BASKV AREA CKT LOADING RATING PERCENT 1001 GREJO_15 150.00* 2 1002 GREJO_20 20.000 2 1 28.9 30.0 96.3 1001 GREJO_15 150.00 2 9052 MULUT TBNG 11.000* 2 1 27.8 30.0 92.6 1001 GREJO_15 150.00 2 9052 MULUT TBNG 11.000* 2 2 27.8 30.0 92.6 2001 BKUAN_15 150.00* 1 2002 BKUAN20A 20.000 1 1 15.7 30.0 52.2 2001 BKUAN_15 150.00* 1 2003 BKUAN20B 20.000 1 1 15.6 30.0 52.1 3001 HARU_15 150.00* 1 3002 HARU_20 20.000 1 1 34.8 30.0 116.1 3001 HARU_15 150.00* 1 3003 HARU_20A 20.000 1 1 34.8 30.0 116.1 3001 HARU_15 150.00 1 9086 PLTUPROPOSED11.500* 1 1 55.4 60.0 92.3 3001 HARU_15 150.00 1 9086 PLTUPROPOSED11.500* 1 2 55.4 60.0 92.3 4001 EMLUT_15 150.00 1 4003 MMAS 11.500* 1 1 22.3 30.0 74.2
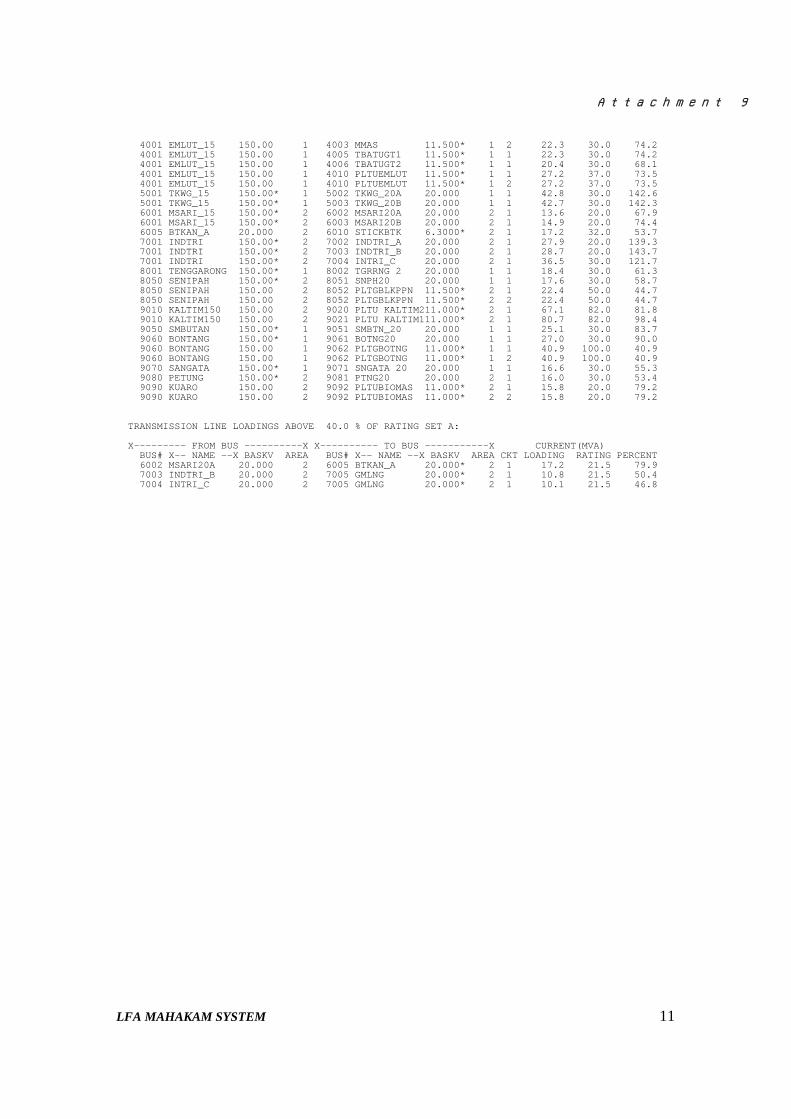
Attachment 9
LFA MAHAKAM SYSTEM 11
4001 EMLUT_15 150.00 1 4003 MMAS 11.500* 1 2 22.3 30.0 74.2 4001 EMLUT_15 150.00 1 4005 TBATUGT1 11.500* 1 1 22.3 30.0 74.2 4001 EMLUT_15 150.00 1 4006 TBATUGT2 11.500* 1 1 20.4 30.0 68.1 4001 EMLUT_15 150.00 1 4010 PLTUEMLUT 11.500* 1 1 27.2 37.0 73.5 4001 EMLUT_15 150.00 1 4010 PLTUEMLUT 11.500* 1 2 27.2 37.0 73.5 5001 TKWG_15 150.00* 1 5002 TKWG_20A 20.000 1 1 42.8 30.0 142.6 5001 TKWG_15 150.00* 1 5003 TKWG_20B 20.000 1 1 42.7 30.0 142.3 6001 MSARI_15 150.00* 2 6002 MSARI20A 20.000 2 1 13.6 20.0 67.9 6001 MSARI_15 150.00* 2 6003 MSARI20B 20.000 2 1 14.9 20.0 74.4 6005 BTKAN_A 20.000 2 6010 STICKBTK 6.3000* 2 1 17.2 32.0 53.7 7001 INDTRI 150.00* 2 7002 INDTRI_A 20.000 2 1 27.9 20.0 139.3 7001 INDTRI 150.00* 2 7003 INDTRI_B 20.000 2 1 28.7 20.0 143.7 7001 INDTRI 150.00* 2 7004 INTRI_C 20.000 2 1 36.5 30.0 121.7 8001 TENGGARONG 150.00* 1 8002 TGRRNG 2 20.000 1 1 18.4 30.0 61.3 8050 SENIPAH 150.00* 2 8051 SNPH20 20.000 1 1 17.6 30.0 58.7 8050 SENIPAH 150.00 2 8052 PLTGBLKPPN 11.500* 2 1 22.4 50.0 44.7 8050 SENIPAH 150.00 2 8052 PLTGBLKPPN 11.500* 2 2 22.4 50.0 44.7 9010 KALTIM150 150.00 2 9020 PLTU KALTIM211.000* 2 1 67.1 82.0 81.8 9010 KALTIM150 150.00 2 9021 PLTU KALTIM111.000* 2 1 80.7 82.0 98.4 9050 SMBUTAN 150.00* 1 9051 SMBTN_20 20.000 1 1 25.1 30.0 83.7 9060 BONTANG 150.00* 1 9061 BOTNG20 20.000 1 1 27.0 30.0 90.0 9060 BONTANG 150.00 1 9062 PLTGBOTNG 11.000* 1 1 40.9 100.0 40.9 9060 BONTANG 150.00 1 9062 PLTGBOTNG 11.000* 1 2 40.9 100.0 40.9 9070 SANGATA 150.00* 1 9071 SNGATA 20 20.000 1 1 16.6 30.0 55.3 9080 PETUNG 150.00* 2 9081 PTNG20 20.000 2 1 16.0 30.0 53.4 9090 KUARO 150.00 2 9092 PLTUBIOMAS 11.000* 2 1 15.8 20.0 79.2 9090 KUARO 150.00 2 9092 PLTUBIOMAS 11.000* 2 2 15.8 20.0 79.2 TRANSMISSION LINE LOADINGS ABOVE 40.0 % OF RATING SET A: X--------- FROM BUS ----------X X---------- TO BUS -----------X CURRENT(MVA) BUS# X-- NAME --X BASKV AREA BUS# X-- NAME --X BASKV AREA CKT LOADING RATING PERCENT 6002 MSARI20A 20.000 2 6005 BTKAN_A 20.000* 2 1 17.2 21.5 79.9 7003 INDTRI_B 20.000 2 7005 GMLNG 20.000* 2 1 10.8 21.5 50.4 7004 INTRI_C 20.000 2 7005 GMLNG 20.000* 2 1 10.1 21.5 46.8

Attachment 9
LFA MAHAKAM SYSTEM 12
5. CONCLUSION
5.1 The total capacity of generator existed in year 2012 will reach 676 MW, while the peak load is predicted to be around 423.2 MW, so that the Mahakam System will have an excess of power of 133.5 MW, or 20 % capacity margin.
5.2 Loop configuration between Samarinda and Balikpapan by installing transmission line from SS Bukuan to Senipa will improve the system power capacity and improve the stability of the system.
5.3 Based on power flow analyze of year 2011, there will be a few Substation (SS) which experience an overload of Transformators until over 100% of their capacities, such as SS Industri, SS Manggarsari, SS Tengkawang and SS Harapan Baru. It should be replaced and installed new Trafo.
5.4 Integrating of PLTU Mahakam 2 x 50 MW to Substation Harapan Baru will bring an excellent configuration on the Mahakam Electrical System and stability of power flow.
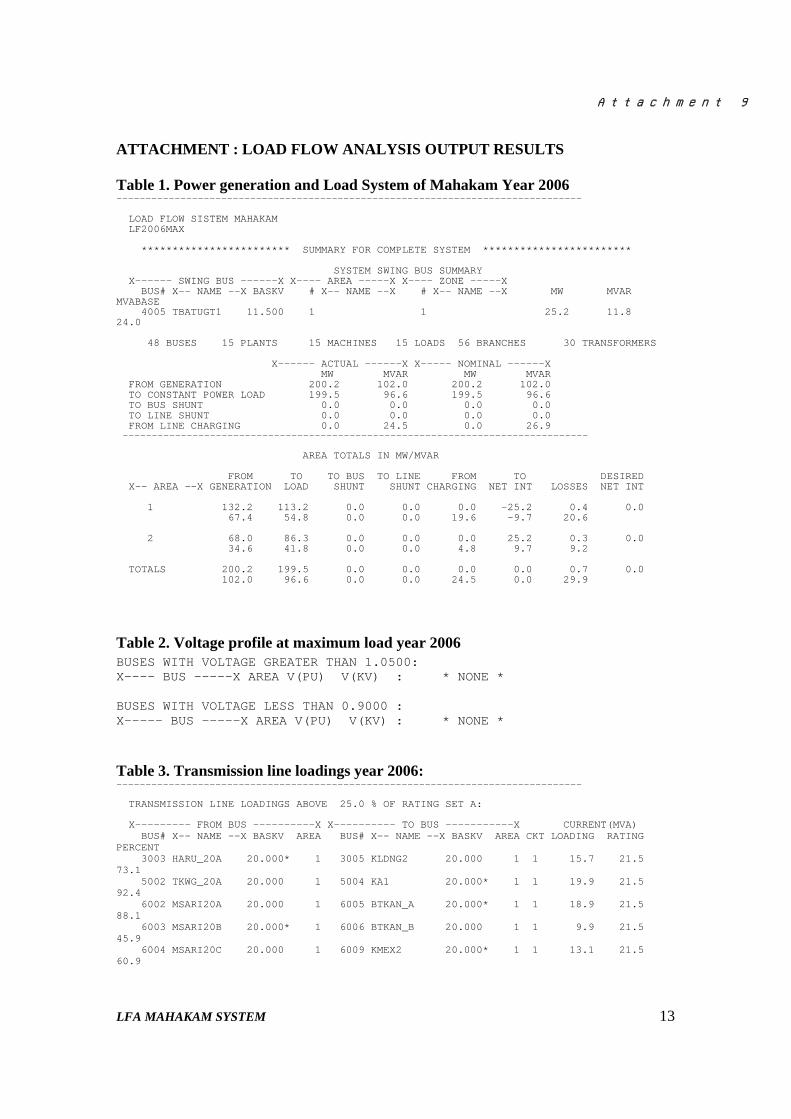
Attachment 9
LFA MAHAKAM SYSTEM 13
ATTACHMENT : LOAD FLOW ANALYSIS OUTPUT RESULTS Table 1. Power generation and Load System of Mahakam Year 2006 -------------------------------------------------------------------------------- LOAD FLOW SISTEM MAHAKAM LF2006MAX ************************ SUMMARY FOR COMPLETE SYSTEM ************************ SYSTEM SWING BUS SUMMARY X------ SWING BUS ------X X---- AREA -----X X---- ZONE -----X BUS# X-- NAME --X BASKV # X-- NAME --X # X-- NAME --X MW MVAR MVABASE 4005 TBATUGT1 11.500 1 1 25.2 11.8 24.0 48 BUSES 15 PLANTS 15 MACHINES 15 LOADS 56 BRANCHES 30 TRANSFORMERS X------ ACTUAL ------X X----- NOMINAL ------X MW MVAR MW MVAR FROM GENERATION 200.2 102.0 200.2 102.0 TO CONSTANT POWER LOAD 199.5 96.6 199.5 96.6 TO BUS SHUNT 0.0 0.0 0.0 0.0 TO LINE SHUNT 0.0 0.0 0.0 0.0 FROM LINE CHARGING 0.0 24.5 0.0 26.9 -------------------------------------------------------------------------------- AREA TOTALS IN MW/MVAR FROM TO TO BUS TO LINE FROM TO DESIRED X-- AREA --X GENERATION LOAD SHUNT SHUNT CHARGING NET INT LOSSES NET INT 1 132.2 113.2 0.0 0.0 0.0 -25.2 0.4 0.0 67.4 54.8 0.0 0.0 19.6 -9.7 20.6 2 68.0 86.3 0.0 0.0 0.0 25.2 0.3 0.0 34.6 41.8 0.0 0.0 4.8 9.7 9.2 TOTALS 200.2 199.5 0.0 0.0 0.0 0.0 0.7 0.0 102.0 96.6 0.0 0.0 24.5 0.0 29.9
Table 2. Voltage profile at maximum load year 2006 BUSES WITH VOLTAGE GREATER THAN 1.0500: X---- BUS -----X AREA V(PU) V(KV) : * NONE * BUSES WITH VOLTAGE LESS THAN 0.9000 : X----- BUS -----X AREA V(PU) V(KV) : * NONE *
Table 3. Transmission line loadings year 2006: -------------------------------------------------------------------------------- TRANSMISSION LINE LOADINGS ABOVE 25.0 % OF RATING SET A: X--------- FROM BUS ----------X X---------- TO BUS -----------X CURRENT(MVA) BUS# X-- NAME --X BASKV AREA BUS# X-- NAME --X BASKV AREA CKT LOADING RATING PERCENT 3003 HARU_20A 20.000* 1 3005 KLDNG2 20.000 1 1 15.7 21.5 73.1 5002 TKWG_20A 20.000 1 5004 KA1 20.000* 1 1 19.9 21.5 92.4 6002 MSARI20A 20.000 1 6005 BTKAN_A 20.000* 1 1 18.9 21.5 88.1 6003 MSARI20B 20.000* 1 6006 BTKAN_B 20.000 1 1 9.9 21.5 45.9 6004 MSARI20C 20.000 1 6009 KMEX2 20.000* 1 1 13.1 21.5 60.9

Attachment 9
LFA MAHAKAM SYSTEM 14
7002 INDTRI_A 20.000 1 7005 GMLNG 20.000* 1 1 12.5 21.5 58.1 7003 INDTRI_B 20.000* 1 7005 GMLNG 20.000 1 1 19.9 21.5 92.7 7004 INTRI_C 20.000 1 7005 GMLNG 20.000* 1 1 10.1 21.5 47.0
Table 4. Power generation and Load System of Mahakam Year 2011 ------------------------------------------------------------------------------- -------------------------------------------------------------------------------- ************************ SUMMARY FOR COMPLETE SYSTEM ************************ SYSTEM SWING BUS SUMMARY X------ SWING BUS ------X X---- AREA -----X X---- ZONE -----X BUS# X-- NAME --X BASKV # X-- NAME --X # X-- NAME --X MW MVAR MVABASE 9021 PLTU KALTIM1 11.000 1 1 -77.1 36.7 75.0 58 BUSES 16 PLANTS 16 MACHINES 20 LOADS 74 BRANCHES 44 TRANSFORMERS
AREA TOTALS IN MW/MVAR FROM TO TO BUS TO LINE FROM TO DESIRED X-- AREA --X GENERATION LOAD SHUNT SHUNT CHARGING NET INT LOSSES NET INT 1 280.9 218.2 0.0 0.0 0.0 34.4 4.0 0.0 205.1 103.2 0.0 0.0 24.0 26.1 88.1 2 110.0 167.3 0.0 0.0 0.0 -34.4 1.4 0.0 54.8 80.0 0.0 0.0 28.1 -26.1 40.7 TOTALS 390.9 385.5 0.0 0.0 0.0 0.0 5.4 0.0 259.9 183.2 0.0 0.0 52.1 0.0 128.8
Table 5. Voltage profile at maximum load year 2011 BUSES WITH VOLTAGE GREATER THAN 1.0500: X---- BUS -----X AREA V(PU) V(KV) : * NONE * BUSES WITH VOLTAGE LESS THAN 0.9000 : X---- BUS -----X AREA V(PU) V(KV) : * NONE *

Attachment 9
LFA MAHAKAM SYSTEM 15
Table 6. Transmission line & Transformer loadings year 2011: -------------------------------------------------------------------------------- -------------------------------------------------------------------------------- TRANSFORMER LOADINGS ABOVE 55.0 % OF RATING SET A: X--------- FROM BUS ----------X X---------- TO BUS -----------X MVA MVA BUS# X-- NAME --X BASKV AREA BUS# X-- NAME --X BASKV AREA CKT LOADING RATING PERCENT 1001 GREJO_15 150.00* 2 1002 GREJO_20 20.000 1 1 26.3 30.0 87.5 3001 HARU_15 150.00* 1 3002 HARU_20 20.000 1 1 31.5 30.0 105.0 3001 HARU_15 150.00* 1 3003 HARU_20A 20.000 1 1 31.5 30.0 105.0 4001 EMLUT_15 150.00 1 4003 MMAS 11.500* 1 1 23.3 30.0 77.7 4001 EMLUT_15 150.00 1 4003 MMAS 11.500* 1 2 23.3 30.0 77.7 4001 EMLUT_15 150.00 1 4005 TBATUGT1 11.500* 1 1 23.3 30.0 77.7 4001 EMLUT_15 150.00 1 4006 TBATUGT2 11.500* 1 1 21.6 30.0 72.1 4001 EMLUT_15 150.00 1 4010 PLTUEMLUT 11.500* 1 1 27.7 37.0 74.9 4001 EMLUT_15 150.00 1 4010 PLTUEMLUT 11.500* 1 2 27.7 37.0 74.9 5001 TKWG_15 150.00* 1 5002 TKWG_20A 20.000 1 1 38.6 30.0 128.7 5001 TKWG_15 150.00* 1 5003 TKWG_20B 20.000 1 1 38.5 30.0 128.4 6001 MSARI_15 150.00* 2 6002 MSARI20A 20.000 2 1 21.3 20.0 106.6 6001 MSARI_15 150.00* 2 6003 MSARI20B 20.000 2 1 21.3 20.0 106.6 7001 INDTRI 150.00* 2 7002 INDTRI_A 20.000 2 1 24.6 20.0 122.9 7001 INDTRI 150.00* 2 7003 INDTRI_B 20.000 2 1 37.9 20.0 189.4 7001 INDTRI 150.00* 2 7004 INTRI_C 20.000 2 1 23.3 30.0 77.8 8001 TENGGARONG 150.00* 1 8002 TGRRNG 2 20.000 1 1 16.6 30.0 55.5 8050 SENIPAH 150.00 2 8052 PLTGBLKPPN 11.500* 2 1 44.7 50.0 89.4 8050 SENIPAH 150.00 2 8052 PLTGBLKPPN 11.500* 2 2 44.7 50.0 89.4 9010 MAHAKAM150 150.00 1 9020 PLTU KALTIM211.000* 1 1 67.1 82.0 81.8 9050 SMBUTAN 150.00* 1 9051 SMBTN_20 20.000 1 1 22.7 30.0 75.6 9050 SMBUTAN 150.00 1 9052 MULUT TBNG 11.000* 1 1 28.0 30.0 93.2 9050 SMBUTAN 150.00 1 9052 MULUT TBNG 11.000* 1 2 28.0 30.0 93.2 9060 BONTANG 150.00* 1 9061 BOTNG20 20.000 1 1 24.4 30.0 81.2 9060 BONTANG 150.00 1 9062 PLTGBOTNG 11.000* 1 1 63.5 100.0 63.5 9060 BONTANG 150.00 1 9062 PLTGBOTNG 11.000* 1 2 63.5 100.0 63.5 9090 KUARO 150.00 2 9092 PLTUBIOMAS 11.000* 2 1 16.7 20.0 83.6 9090 KUARO 150.00 2 9092 PLTUBIOMAS 11.000* 2 2 16.7 20.0 83.6
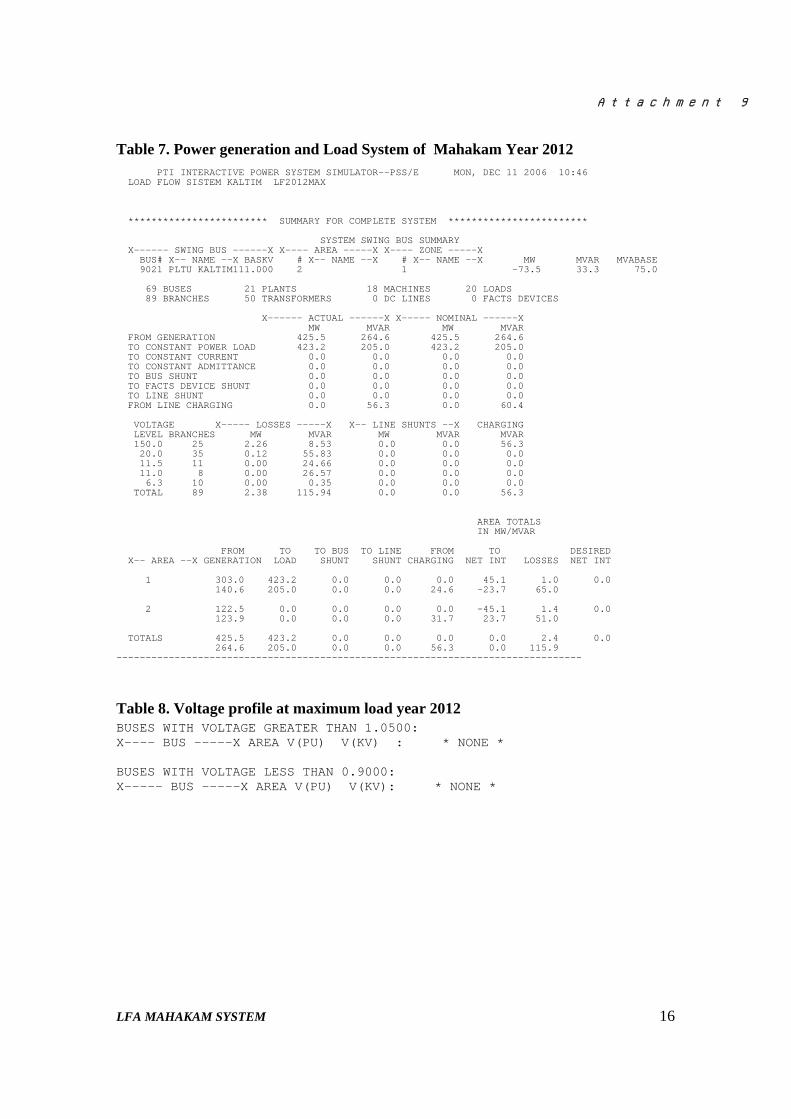
Attachment 9
LFA MAHAKAM SYSTEM 16
Table 7. Power generation and Load System of Mahakam Year 2012 PTI INTERACTIVE POWER SYSTEM SIMULATOR--PSS/E MON, DEC 11 2006 10:46 LOAD FLOW SISTEM KALTIM LF2012MAX ************************ SUMMARY FOR COMPLETE SYSTEM ************************ SYSTEM SWING BUS SUMMARY X------ SWING BUS ------X X---- AREA -----X X---- ZONE -----X BUS# X-- NAME --X BASKV # X-- NAME --X # X-- NAME --X MW MVAR MVABASE 9021 PLTU KALTIM111.000 2 1 -73.5 33.3 75.0 69 BUSES 21 PLANTS 18 MACHINES 20 LOADS 89 BRANCHES 50 TRANSFORMERS 0 DC LINES 0 FACTS DEVICES X------ ACTUAL ------X X----- NOMINAL ------X MW MVAR MW MVAR FROM GENERATION 425.5 264.6 425.5 264.6 TO CONSTANT POWER LOAD 423.2 205.0 423.2 205.0 TO CONSTANT CURRENT 0.0 0.0 0.0 0.0 TO CONSTANT ADMITTANCE 0.0 0.0 0.0 0.0 TO BUS SHUNT 0.0 0.0 0.0 0.0 TO FACTS DEVICE SHUNT 0.0 0.0 0.0 0.0 TO LINE SHUNT 0.0 0.0 0.0 0.0 FROM LINE CHARGING 0.0 56.3 0.0 60.4 VOLTAGE X----- LOSSES -----X X-- LINE SHUNTS --X CHARGING LEVEL BRANCHES MW MVAR MW MVAR MVAR 150.0 25 2.26 8.53 0.0 0.0 56.3 20.0 35 0.12 55.83 0.0 0.0 0.0 11.5 11 0.00 24.66 0.0 0.0 0.0 11.0 8 0.00 26.57 0.0 0.0 0.0 6.3 10 0.00 0.35 0.0 0.0 0.0 TOTAL 89 2.38 115.94 0.0 0.0 56.3 AREA TOTALS IN MW/MVAR FROM TO TO BUS TO LINE FROM TO DESIRED X-- AREA --X GENERATION LOAD SHUNT SHUNT CHARGING NET INT LOSSES NET INT 1 303.0 423.2 0.0 0.0 0.0 45.1 1.0 0.0 140.6 205.0 0.0 0.0 24.6 -23.7 65.0 2 122.5 0.0 0.0 0.0 0.0 -45.1 1.4 0.0 123.9 0.0 0.0 0.0 31.7 23.7 51.0 TOTALS 425.5 423.2 0.0 0.0 0.0 0.0 2.4 0.0 264.6 205.0 0.0 0.0 56.3 0.0 115.9 --------------------------------------------------------------------------------
Table 8. Voltage profile at maximum load year 2012 BUSES WITH VOLTAGE GREATER THAN 1.0500: X---- BUS -----X AREA V(PU) V(KV) : * NONE * BUSES WITH VOLTAGE LESS THAN 0.9000: X----- BUS -----X AREA V(PU) V(KV): * NONE *
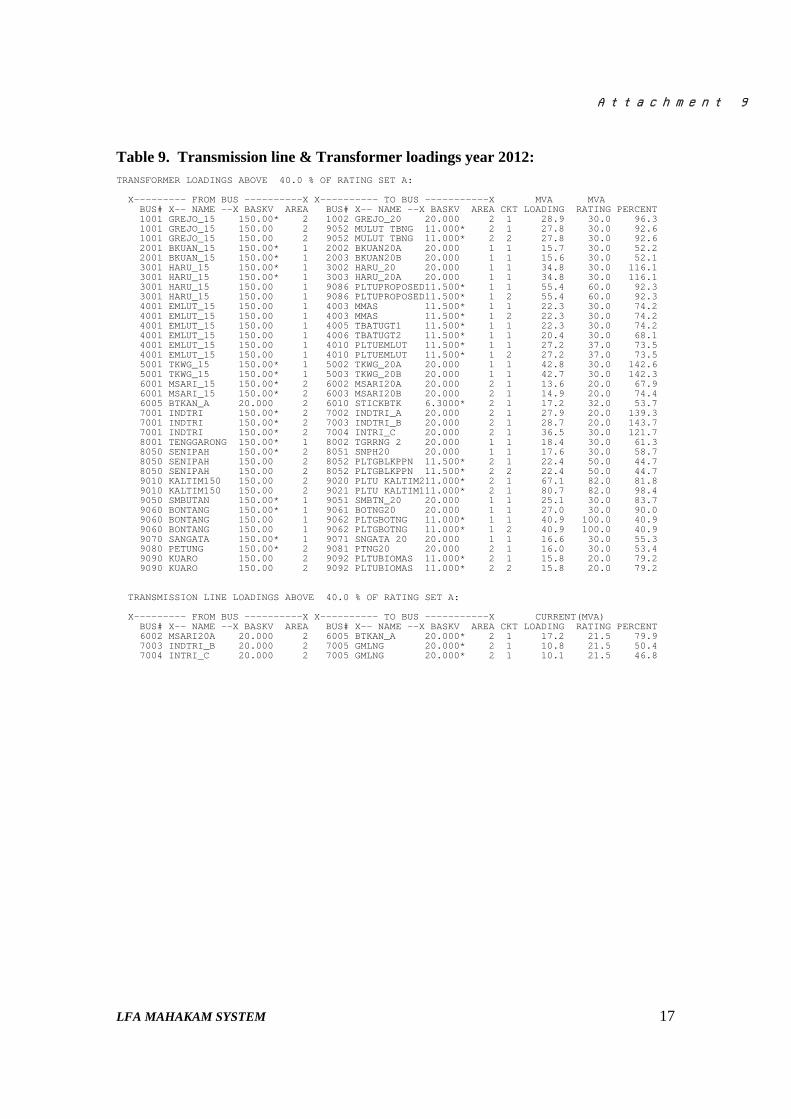
Attachment 9
LFA MAHAKAM SYSTEM 17
Table 9. Transmission line & Transformer loadings year 2012: TRANSFORMER LOADINGS ABOVE 40.0 % OF RATING SET A: X--------- FROM BUS ----------X X---------- TO BUS -----------X MVA MVA BUS# X-- NAME --X BASKV AREA BUS# X-- NAME --X BASKV AREA CKT LOADING RATING PERCENT 1001 GREJO_15 150.00* 2 1002 GREJO_20 20.000 2 1 28.9 30.0 96.3 1001 GREJO_15 150.00 2 9052 MULUT TBNG 11.000* 2 1 27.8 30.0 92.6 1001 GREJO_15 150.00 2 9052 MULUT TBNG 11.000* 2 2 27.8 30.0 92.6 2001 BKUAN_15 150.00* 1 2002 BKUAN20A 20.000 1 1 15.7 30.0 52.2 2001 BKUAN_15 150.00* 1 2003 BKUAN20B 20.000 1 1 15.6 30.0 52.1 3001 HARU_15 150.00* 1 3002 HARU_20 20.000 1 1 34.8 30.0 116.1 3001 HARU_15 150.00* 1 3003 HARU_20A 20.000 1 1 34.8 30.0 116.1 3001 HARU_15 150.00 1 9086 PLTUPROPOSED11.500* 1 1 55.4 60.0 92.3 3001 HARU_15 150.00 1 9086 PLTUPROPOSED11.500* 1 2 55.4 60.0 92.3 4001 EMLUT_15 150.00 1 4003 MMAS 11.500* 1 1 22.3 30.0 74.2 4001 EMLUT_15 150.00 1 4003 MMAS 11.500* 1 2 22.3 30.0 74.2 4001 EMLUT_15 150.00 1 4005 TBATUGT1 11.500* 1 1 22.3 30.0 74.2 4001 EMLUT_15 150.00 1 4006 TBATUGT2 11.500* 1 1 20.4 30.0 68.1 4001 EMLUT_15 150.00 1 4010 PLTUEMLUT 11.500* 1 1 27.2 37.0 73.5 4001 EMLUT_15 150.00 1 4010 PLTUEMLUT 11.500* 1 2 27.2 37.0 73.5 5001 TKWG_15 150.00* 1 5002 TKWG_20A 20.000 1 1 42.8 30.0 142.6 5001 TKWG_15 150.00* 1 5003 TKWG_20B 20.000 1 1 42.7 30.0 142.3 6001 MSARI_15 150.00* 2 6002 MSARI20A 20.000 2 1 13.6 20.0 67.9 6001 MSARI_15 150.00* 2 6003 MSARI20B 20.000 2 1 14.9 20.0 74.4 6005 BTKAN_A 20.000 2 6010 STICKBTK 6.3000* 2 1 17.2 32.0 53.7 7001 INDTRI 150.00* 2 7002 INDTRI_A 20.000 2 1 27.9 20.0 139.3 7001 INDTRI 150.00* 2 7003 INDTRI_B 20.000 2 1 28.7 20.0 143.7 7001 INDTRI 150.00* 2 7004 INTRI_C 20.000 2 1 36.5 30.0 121.7 8001 TENGGARONG 150.00* 1 8002 TGRRNG 2 20.000 1 1 18.4 30.0 61.3 8050 SENIPAH 150.00* 2 8051 SNPH20 20.000 1 1 17.6 30.0 58.7 8050 SENIPAH 150.00 2 8052 PLTGBLKPPN 11.500* 2 1 22.4 50.0 44.7 8050 SENIPAH 150.00 2 8052 PLTGBLKPPN 11.500* 2 2 22.4 50.0 44.7 9010 KALTIM150 150.00 2 9020 PLTU KALTIM211.000* 2 1 67.1 82.0 81.8 9010 KALTIM150 150.00 2 9021 PLTU KALTIM111.000* 2 1 80.7 82.0 98.4 9050 SMBUTAN 150.00* 1 9051 SMBTN_20 20.000 1 1 25.1 30.0 83.7 9060 BONTANG 150.00* 1 9061 BOTNG20 20.000 1 1 27.0 30.0 90.0 9060 BONTANG 150.00 1 9062 PLTGBOTNG 11.000* 1 1 40.9 100.0 40.9 9060 BONTANG 150.00 1 9062 PLTGBOTNG 11.000* 1 2 40.9 100.0 40.9 9070 SANGATA 150.00* 1 9071 SNGATA 20 20.000 1 1 16.6 30.0 55.3 9080 PETUNG 150.00* 2 9081 PTNG20 20.000 2 1 16.0 30.0 53.4 9090 KUARO 150.00 2 9092 PLTUBIOMAS 11.000* 2 1 15.8 20.0 79.2 9090 KUARO 150.00 2 9092 PLTUBIOMAS 11.000* 2 2 15.8 20.0 79.2 TRANSMISSION LINE LOADINGS ABOVE 40.0 % OF RATING SET A: X--------- FROM BUS ----------X X---------- TO BUS -----------X CURRENT(MVA) BUS# X-- NAME --X BASKV AREA BUS# X-- NAME --X BASKV AREA CKT LOADING RATING PERCENT 6002 MSARI20A 20.000 2 6005 BTKAN_A 20.000* 2 1 17.2 21.5 79.9 7003 INDTRI_B 20.000 2 7005 GMLNG 20.000* 2 1 10.8 21.5 50.4 7004 INTRI_C 20.000 2 7005 GMLNG 20.000* 2 1 10.1 21.5 46.8

Attachment 9 Data
1
ATTACHMENT -------------------------------------------------------------------------------- PTI INTERACTIVE POWER SYSTEM SIMULATOR--PSS/E MON, DEC 11 2006 10:47 LOAD FLOW SISTEM KALTIM LF2006MAX X------- FROM BUS ------X AREA VOLT GEN LOAD SHUNT X---------- TO BUS ----------X TRANSFORMER RATING BUS# X-- NAME --X BASKV ZONE PU/KV ANGLE MW/MVAR MW/MVAR MW/MVAR BUS# X-- NAME --X BASKV AREA CKT MW MVAR RATIO ANGLE AMPS %I SET A 1001 GREJO_15 150.00 2 0.9597 35.8 0.0 0.0 0.0 --------------------------------------------------------------------------------- 1 143.96 0.0 0.0 0.0 1002 GREJO_20 20.000 2 1 24.7 15.0 0.925LK 116 100 30M 3001 HARU_15 150.00 1 1 -30.0 2.2 121 15 816A 3001 HARU_15 150.00 1 2 -30.0 2.2 121 15 816A 6001 MSARI_15 150.00 2 1 38.6 27.9 191 23 816A 6001 MSARI_15 150.00 2 2 38.6 27.9 191 23 816A 9010 KALTIM150 150.00 2 1 13.5 -49.0 204 34 600A 9052 MULUT TBNG 11.000 2 1 -25.0 -9.2 1.000LK 30.0LK 107 93 30M 9052 MULUT TBNG 11.000 2 2 -25.0 -9.2 1.000LK 30.0LK 107 93 30M 9080 PETUNG 150.00 2 1 -2.6 -3.9 19 9080 PETUNG 150.00 2 2 -2.6 -3.9 19 1002 GREJO_20 20.000 2 0.9894 30.8 0.0 24.7 0.0 --------------------------------------------------------------------------------- 1 19.789 0.0 12.2 0.0 1001 GREJO_15 150.00 2 1 -24.7 -12.2 1.000UN 804 93 30M 2001 BKUAN_15 150.00 1 0.9596 37.7 0.0 0.0 0.0 --------------------------------------------------------------------------------- 1 143.94 0.0 0.0 0.0 2002 BKUAN20A 20.000 1 1 13.6 7.8 1.000LK 63 54 30M 2003 BKUAN20B 20.000 1 1 13.6 7.8 1.000LK 63 54 30M 3001 HARU_15 150.00 1 1 -5.6 -3.8 27 5 600A 3001 HARU_15 150.00 1 2 -5.6 -3.8 27 5 600A 9050 SMBUTAN 150.00 1 1 -7.9 -4.0 36 4 816A 9050 SMBUTAN 150.00 1 2 -7.9 -4.0 36 4 816A 2002 BKUAN20A 20.000 1 0.9269 33.9 0.0 13.6 0.0 --------------------------------------------------------------------------------- 1 18.538 0.0 6.7 0.0 2001 BKUAN_15 150.00 1 1 -13.6 -6.7 1.000UN 471 54 30M 2003 BKUAN20B 20.000 1 0.9276 34.0 0.0 13.6 0.0 --------------------------------------------------------------------------------- 1 18.552 0.0 6.7 0.0 2001 BKUAN_15 150.00 1 1 -13.6 -6.7 1.000UN 470 54 30M 3001 HARU_15 150.00 1 0.9608 37.7 0.0 0.0 0.0 --------------------------------------------------------------------------------- 1 144.12 0.0 0.0 0.0 1001 GREJO_15 150.00 2 1 30.2 -7.5 125 15 816A 1001 GREJO_15 150.00 2 2 30.2 -7.5 125 15 816A 2001 BKUAN_15 150.00 1 1 5.6 3.2 26 4 600A 2001 BKUAN_15 150.00 1 2 5.6 3.2 26 4 600A 3002 HARU_20 20.000 1 1 29.1 19.1 0.925LK 139 121 30M 3003 HARU_20A 20.000 1 1 29.1 19.1 0.925LK 139 121 30M 5001 TKWG_15 150.00 1 1 -15.0 3.4 62 8 816A 5001 TKWG_15 150.00 1 2 -15.0 3.4 62 8 816A 9086 PLTUPROPOSED11.500 1 1 -50.0 -18.2 1.000LK 30.0LK 213 92 60M 9086 PLTUPROPOSED11.500 1 2 -50.0 -18.2 1.000LK 30.0LK 213 92 60M 3002 HARU_20 20.000 1 0.9677 30.7 0.0 29.1 0.0 --------------------------------------------------------------------------------- 1 19.354 0.0 14.4 0.0 3001 HARU_15 150.00 1 1 -29.1 -14.4 1.000UN 968 112 30M 3004 KLDNG1 20.000 1 1 0.0 0.0 0 0 621A 3003 HARU_20A 20.000 1 0.9677 30.7 0.0 29.1 0.0 --------------------------------------------------------------------------------- 1 19.354 0.0 14.4 0.0 3001 HARU_15 150.00 1 1 -29.1 -14.4 1.000UN 968 112 30M 3005 KLDNG2 20.000 1 1 0.0 0.0 0 0 621A 3004 KLDNG1 20.000 1 0.9677 30.7 0.0 0.0 0.0 --------------------------------------------------------------------------------- 1 19.354 0.0 0.0 0.0 3002 HARU_20 20.000 1 1 0.0 0.0 0 0 621A 3006 MLESS 6.3000 1 1 0.0 0.0 1.000LK 150.0LK 0 0 10M 3005 KLDNG2 20.000 1 0.9677 30.7 0.0 0.0 0.0 --------------------------------------------------------------------------------- 1 19.354 0.0 0.0 0.0 3003 HARU_20A 20.000 1 1 0.0 0.0 0 0 621A 3007 PLSTICK 6.3000 1 1 0.0 0.0 1.000LK 150.0LK 0 0 10M

Attachment 9 Data
2
3008 CCMSLZR 6.3000 1 1 0.0 0.0 1.000LK 150.0LK 0 0 17M 3006 MLESS 6.3000 1 0.9677 -119.3 0.0 0.0 0.0 --------------------------------------------------------------------------------- 1 6.0966 0.0 0.0 0.0 3004 KLDNG1 20.000 1 1 0.0 0.0 1.000UN 0 0 10M 3007 PLSTICK 6.3000 1 0.9677 -119.3 0.0 0.0 0.0 --------------------------------------------------------------------------------- 1 6.0966 0.0 0.0 0.0 3005 KLDNG2 20.000 1 1 0.0 0.0 1.000UN 0 0 10M 3008 CCMSLZR 6.3000 1 0.9677 -119.3 0.0 0.0 0.0 --------------------------------------------------------------------------------- 1 6.0966 0.0 0.0 0.0 3005 KLDNG2 20.000 1 1 0.0 0.0 1.000UN 0 0 17M 4001 EMLUT_15 150.00 1 0.9687 38.8 0.0 0.0 0.0 --------------------------------------------------------------------------------- 1 145.30 0.0 0.0 0.0 4002 EMLUT_20 20.000 1 1 9.8 5.3 0.925LK 44 38 30M 4003 MMAS 11.500 1 1 -20.0 -8.1 1.000LK 30.0LK 86 74 30M 4003 MMAS 11.500 1 2 -20.0 -8.1 1.000LK 30.0LK 86 74 30M 4004 TJBATUST 11.500 1 1 0.0 0.0 1.000LK 30.0LK 0 0 30M 4005 TBATUGT1 11.500 1 1 -20.0 -8.1 1.000LK 30.0LK 86 74 30M 4006 TBATUGT2 11.500 1 1 -18.0 -8.2 1.000LK 30.0LK 79 68 30M 4010 PLTUEMLUT 11.500 1 1 -25.0 -8.3 1.000LK 30.0LK 105 73 37M 4010 PLTUEMLUT 11.500 1 2 -25.0 -8.3 1.000LK 30.0LK 105 73 37M 5001 TKWG_15 150.00 1 1 51.1 17.7 215 26 816A 5001 TKWG_15 150.00 1 2 51.1 17.7 215 26 816A 8001 TENGGARONG 150.00 1 1 16.0 8.3 71 12 600A 4002 EMLUT_20 20.000 1 1.0247 36.4 0.0 9.8 0.0 --------------------------------------------------------------------------------- 1 20.493 0.0 4.8 0.0 4001 EMLUT_15 150.00 1 1 -9.8 -4.8 1.000UN 307 35 30M 4007 KUKAR 20.000 1 1 0.0 0.0 0 0 621A 4003 MMAS 11.500 1 1.0000 12.8 40.0 0.0 0.0 --------------------------------------------------------------------------------- 1 11.500 19.6R 0.0 0.0 4001 EMLUT_15 150.00 1 1 20.0 9.8 1.000UN 1118 74 30M 4001 EMLUT_15 150.00 1 2 20.0 9.8 1.000UN 1118 74 30M 4004 TJBATUST 11.500 1 0.9687 8.8 0.0 0.0 0.0 --------------------------------------------------------------------------------- 1 11.140 0.0 0.0 0.0 4001 EMLUT_15 150.00 1 1 0.0 0.0 1.000UN 0 0 30M 4005 TBATUGT1 11.500 1 1.0000 12.8 20.0 0.0 0.0 --------------------------------------------------------------------------------- 1 11.500 9.8R 0.0 0.0 4001 EMLUT_15 150.00 1 1 20.0 9.8 1.000UN 1118 74 30M 4006 TBATUGT2 11.500 1 1.0000 12.4 18.0 0.0 0.0 --------------------------------------------------------------------------------- 1 11.500 9.6R 0.0 0.0 4001 EMLUT_15 150.00 1 1 18.0 9.6 1.000UN 1025 68 30M 4007 KUKAR 20.000 1 1.0247 36.4 0.0 0.0 0.0 --------------------------------------------------------------------------------- 1 20.493 0.0 0.0 0.0 4002 EMLUT_20 20.000 1 1 0.0 0.0 0 0 621A 4008 PLTDKUKAR 6.3000 1 1 0.0 0.0 1.000LK 150.0LK 0 0 10M 4008 PLTDKUKAR 6.3000 1 1.0247 -113.6 0.0 0.0 0.0 --------------------------------------------------------------------------------- 1 6.4553 0.0 0.0 0.0 4007 KUKAR 20.000 1 1 0.0 0.0 1.000UN 0 0 10M 4010 PLTUEMLUT 11.500 1 1.0000 13.6 50.0 0.0 0.0 --------------------------------------------------------------------------------- 1 11.500 21.4R 0.0 0.0 4001 EMLUT_15 150.00 1 1 25.0 10.7 1.000UN 1365 73 37M 4001 EMLUT_15 150.00 1 2 25.0 10.7 1.000UN 1365 73 37M 5001 TKWG_15 150.00 1 0.9602 38.1 0.0 0.0 0.0 --------------------------------------------------------------------------------- 1 144.03 0.0 0.0 0.0 3001 HARU_15 150.00 1 1 15.0 -5.5 64 8 816A 3001 HARU_15 150.00 1 2 15.0 -5.5 64 8 816A 4001 EMLUT_15 150.00 1 1 -50.9 -17.7 216 26 816A 4001 EMLUT_15 150.00 1 2 -50.9 -17.7 216 26 816A 5002 TKWG_20A 20.000 1 1 35.9 23.3 0.925LK 172 149 30M 5003 TKWG_20B 20.000 1 1 35.9 23.1 0.925LK 171 148 30M 5002 TKWG_20A 20.000 1 0.9574 29.7 0.0 35.9 0.0 --------------------------------------------------------------------------------- 1 19.148 0.0 16.4 0.0 5001 TKWG_15 150.00 1 1 -35.9 -16.4 1.000UN 1190 137 30M 5004 KA1 20.000 1 1 0.0 0.0 0 0 621A 5003 TKWG_20B 20.000 1 0.9599 29.9 0.0 35.9 0.0 --------------------------------------------------------------------------------- 1 19.198 0.0 16.4 0.0 5001 TKWG_15 150.00 1 1 -35.9 -16.4 1.000UN 1187 137 30M 5005 KA2 20.000 1 1 0.0 0.0 0 0 621A 5004 KA1 20.000 1 0.9574 29.7 0.0 0.0 0.0 --------------------------------------------------------------------------------- 1 19.148 0.0 0.0 0.0 5002 TKWG_20A 20.000 1 1 0.0 0.0 0 0 621A
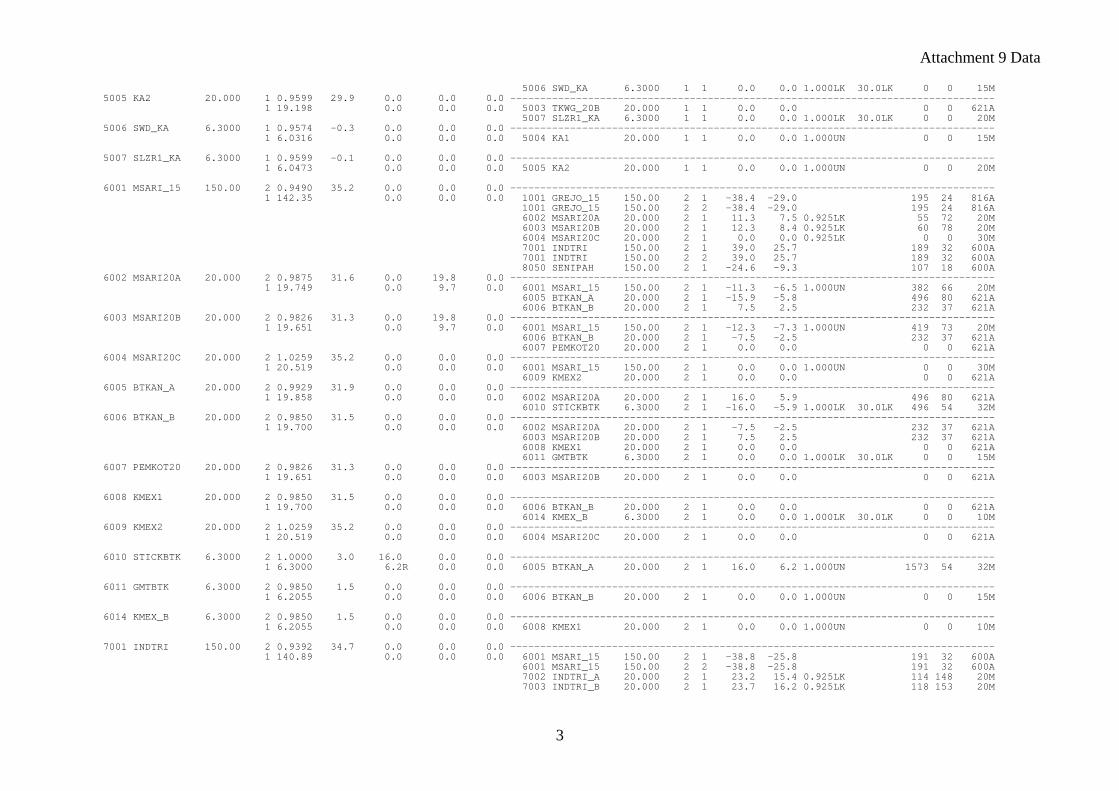
Attachment 9 Data
3
5006 SWD_KA 6.3000 1 1 0.0 0.0 1.000LK 30.0LK 0 0 15M 5005 KA2 20.000 1 0.9599 29.9 0.0 0.0 0.0 --------------------------------------------------------------------------------- 1 19.198 0.0 0.0 0.0 5003 TKWG_20B 20.000 1 1 0.0 0.0 0 0 621A 5007 SLZR1_KA 6.3000 1 1 0.0 0.0 1.000LK 30.0LK 0 0 20M 5006 SWD_KA 6.3000 1 0.9574 -0.3 0.0 0.0 0.0 --------------------------------------------------------------------------------- 1 6.0316 0.0 0.0 0.0 5004 KA1 20.000 1 1 0.0 0.0 1.000UN 0 0 15M 5007 SLZR1_KA 6.3000 1 0.9599 -0.1 0.0 0.0 0.0 --------------------------------------------------------------------------------- 1 6.0473 0.0 0.0 0.0 5005 KA2 20.000 1 1 0.0 0.0 1.000UN 0 0 20M 6001 MSARI_15 150.00 2 0.9490 35.2 0.0 0.0 0.0 --------------------------------------------------------------------------------- 1 142.35 0.0 0.0 0.0 1001 GREJO_15 150.00 2 1 -38.4 -29.0 195 24 816A 1001 GREJO_15 150.00 2 2 -38.4 -29.0 195 24 816A 6002 MSARI20A 20.000 2 1 11.3 7.5 0.925LK 55 72 20M 6003 MSARI20B 20.000 2 1 12.3 8.4 0.925LK 60 78 20M 6004 MSARI20C 20.000 2 1 0.0 0.0 0.925LK 0 0 30M 7001 INDTRI 150.00 2 1 39.0 25.7 189 32 600A 7001 INDTRI 150.00 2 2 39.0 25.7 189 32 600A 8050 SENIPAH 150.00 2 1 -24.6 -9.3 107 18 600A 6002 MSARI20A 20.000 2 0.9875 31.6 0.0 19.8 0.0 --------------------------------------------------------------------------------- 1 19.749 0.0 9.7 0.0 6001 MSARI_15 150.00 2 1 -11.3 -6.5 1.000UN 382 66 20M 6005 BTKAN_A 20.000 2 1 -15.9 -5.8 496 80 621A 6006 BTKAN_B 20.000 2 1 7.5 2.5 232 37 621A 6003 MSARI20B 20.000 2 0.9826 31.3 0.0 19.8 0.0 --------------------------------------------------------------------------------- 1 19.651 0.0 9.7 0.0 6001 MSARI_15 150.00 2 1 -12.3 -7.3 1.000UN 419 73 20M 6006 BTKAN_B 20.000 2 1 -7.5 -2.5 232 37 621A 6007 PEMKOT20 20.000 2 1 0.0 0.0 0 0 621A 6004 MSARI20C 20.000 2 1.0259 35.2 0.0 0.0 0.0 --------------------------------------------------------------------------------- 1 20.519 0.0 0.0 0.0 6001 MSARI_15 150.00 2 1 0.0 0.0 1.000UN 0 0 30M 6009 KMEX2 20.000 2 1 0.0 0.0 0 0 621A 6005 BTKAN_A 20.000 2 0.9929 31.9 0.0 0.0 0.0 --------------------------------------------------------------------------------- 1 19.858 0.0 0.0 0.0 6002 MSARI20A 20.000 2 1 16.0 5.9 496 80 621A 6010 STICKBTK 6.3000 2 1 -16.0 -5.9 1.000LK 30.0LK 496 54 32M 6006 BTKAN_B 20.000 2 0.9850 31.5 0.0 0.0 0.0 --------------------------------------------------------------------------------- 1 19.700 0.0 0.0 0.0 6002 MSARI20A 20.000 2 1 -7.5 -2.5 232 37 621A 6003 MSARI20B 20.000 2 1 7.5 2.5 232 37 621A 6008 KMEX1 20.000 2 1 0.0 0.0 0 0 621A 6011 GMTBTK 6.3000 2 1 0.0 0.0 1.000LK 30.0LK 0 0 15M 6007 PEMKOT20 20.000 2 0.9826 31.3 0.0 0.0 0.0 --------------------------------------------------------------------------------- 1 19.651 0.0 0.0 0.0 6003 MSARI20B 20.000 2 1 0.0 0.0 0 0 621A 6008 KMEX1 20.000 2 0.9850 31.5 0.0 0.0 0.0 --------------------------------------------------------------------------------- 1 19.700 0.0 0.0 0.0 6006 BTKAN_B 20.000 2 1 0.0 0.0 0 0 621A 6014 KMEX_B 6.3000 2 1 0.0 0.0 1.000LK 30.0LK 0 0 10M 6009 KMEX2 20.000 2 1.0259 35.2 0.0 0.0 0.0 --------------------------------------------------------------------------------- 1 20.519 0.0 0.0 0.0 6004 MSARI20C 20.000 2 1 0.0 0.0 0 0 621A 6010 STICKBTK 6.3000 2 1.0000 3.0 16.0 0.0 0.0 --------------------------------------------------------------------------------- 1 6.3000 6.2R 0.0 0.0 6005 BTKAN_A 20.000 2 1 16.0 6.2 1.000UN 1573 54 32M 6011 GMTBTK 6.3000 2 0.9850 1.5 0.0 0.0 0.0 --------------------------------------------------------------------------------- 1 6.2055 0.0 0.0 0.0 6006 BTKAN_B 20.000 2 1 0.0 0.0 1.000UN 0 0 15M 6014 KMEX_B 6.3000 2 0.9850 1.5 0.0 0.0 0.0 --------------------------------------------------------------------------------- 1 6.2055 0.0 0.0 0.0 6008 KMEX1 20.000 2 1 0.0 0.0 1.000UN 0 0 10M 7001 INDTRI 150.00 2 0.9392 34.7 0.0 0.0 0.0 --------------------------------------------------------------------------------- 1 140.89 0.0 0.0 0.0 6001 MSARI_15 150.00 2 1 -38.8 -25.8 191 32 600A 6001 MSARI_15 150.00 2 2 -38.8 -25.8 191 32 600A 7002 INDTRI_A 20.000 2 1 23.2 15.4 0.925LK 114 148 20M 7003 INDTRI_B 20.000 2 1 23.7 16.2 0.925LK 118 153 20M
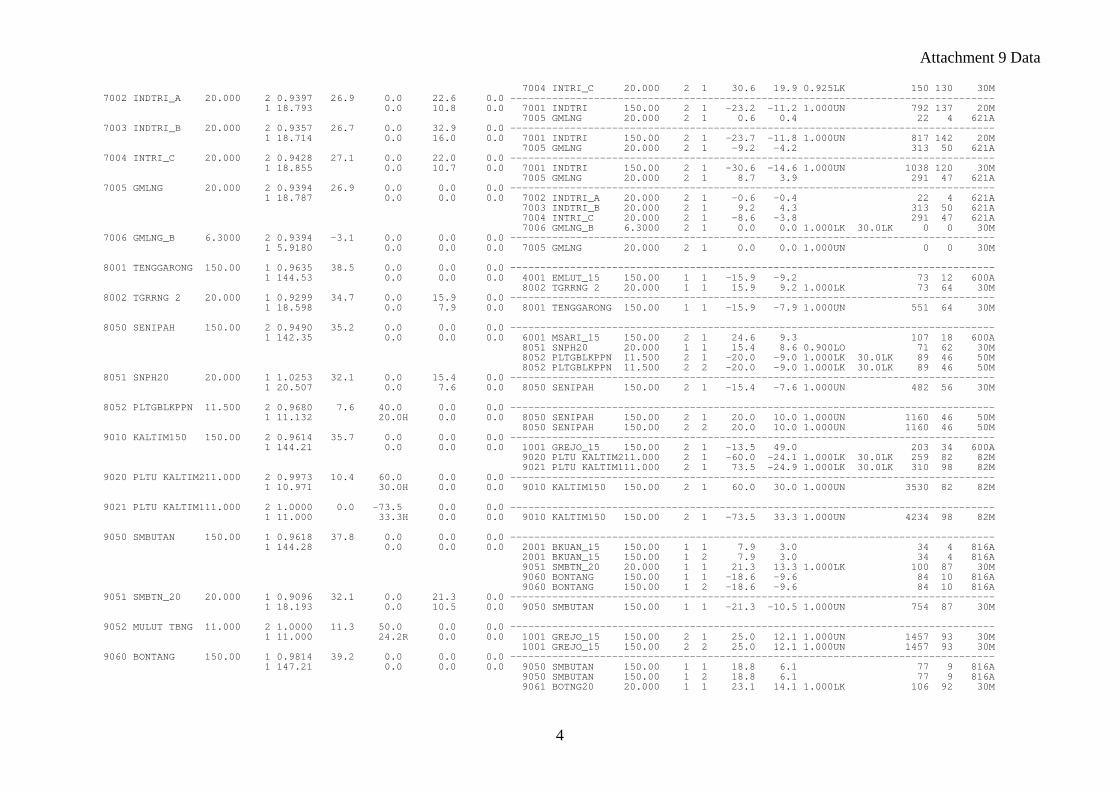
Attachment 9 Data
4
7004 INTRI_C 20.000 2 1 30.6 19.9 0.925LK 150 130 30M 7002 INDTRI_A 20.000 2 0.9397 26.9 0.0 22.6 0.0 --------------------------------------------------------------------------------- 1 18.793 0.0 10.8 0.0 7001 INDTRI 150.00 2 1 -23.2 -11.2 1.000UN 792 137 20M 7005 GMLNG 20.000 2 1 0.6 0.4 22 4 621A 7003 INDTRI_B 20.000 2 0.9357 26.7 0.0 32.9 0.0 --------------------------------------------------------------------------------- 1 18.714 0.0 16.0 0.0 7001 INDTRI 150.00 2 1 -23.7 -11.8 1.000UN 817 142 20M 7005 GMLNG 20.000 2 1 -9.2 -4.2 313 50 621A 7004 INTRI_C 20.000 2 0.9428 27.1 0.0 22.0 0.0 --------------------------------------------------------------------------------- 1 18.855 0.0 10.7 0.0 7001 INDTRI 150.00 2 1 -30.6 -14.6 1.000UN 1038 120 30M 7005 GMLNG 20.000 2 1 8.7 3.9 291 47 621A 7005 GMLNG 20.000 2 0.9394 26.9 0.0 0.0 0.0 --------------------------------------------------------------------------------- 1 18.787 0.0 0.0 0.0 7002 INDTRI_A 20.000 2 1 -0.6 -0.4 22 4 621A 7003 INDTRI_B 20.000 2 1 9.2 4.3 313 50 621A 7004 INTRI_C 20.000 2 1 -8.6 -3.8 291 47 621A 7006 GMLNG_B 6.3000 2 1 0.0 0.0 1.000LK 30.0LK 0 0 30M 7006 GMLNG_B 6.3000 2 0.9394 -3.1 0.0 0.0 0.0 --------------------------------------------------------------------------------- 1 5.9180 0.0 0.0 0.0 7005 GMLNG 20.000 2 1 0.0 0.0 1.000UN 0 0 30M 8001 TENGGARONG 150.00 1 0.9635 38.5 0.0 0.0 0.0 --------------------------------------------------------------------------------- 1 144.53 0.0 0.0 0.0 4001 EMLUT_15 150.00 1 1 -15.9 -9.2 73 12 600A 8002 TGRRNG 2 20.000 1 1 15.9 9.2 1.000LK 73 64 30M 8002 TGRRNG 2 20.000 1 0.9299 34.7 0.0 15.9 0.0 --------------------------------------------------------------------------------- 1 18.598 0.0 7.9 0.0 8001 TENGGARONG 150.00 1 1 -15.9 -7.9 1.000UN 551 64 30M 8050 SENIPAH 150.00 2 0.9490 35.2 0.0 0.0 0.0 --------------------------------------------------------------------------------- 1 142.35 0.0 0.0 0.0 6001 MSARI_15 150.00 2 1 24.6 9.3 107 18 600A 8051 SNPH20 20.000 1 1 15.4 8.6 0.900LO 71 62 30M 8052 PLTGBLKPPN 11.500 2 1 -20.0 -9.0 1.000LK 30.0LK 89 46 50M 8052 PLTGBLKPPN 11.500 2 2 -20.0 -9.0 1.000LK 30.0LK 89 46 50M 8051 SNPH20 20.000 1 1.0253 32.1 0.0 15.4 0.0 --------------------------------------------------------------------------------- 1 20.507 0.0 7.6 0.0 8050 SENIPAH 150.00 2 1 -15.4 -7.6 1.000UN 482 56 30M 8052 PLTGBLKPPN 11.500 2 0.9680 7.6 40.0 0.0 0.0 --------------------------------------------------------------------------------- 1 11.132 20.0H 0.0 0.0 8050 SENIPAH 150.00 2 1 20.0 10.0 1.000UN 1160 46 50M 8050 SENIPAH 150.00 2 2 20.0 10.0 1.000UN 1160 46 50M 9010 KALTIM150 150.00 2 0.9614 35.7 0.0 0.0 0.0 --------------------------------------------------------------------------------- 1 144.21 0.0 0.0 0.0 1001 GREJO_15 150.00 2 1 -13.5 49.0 203 34 600A 9020 PLTU KALTIM211.000 2 1 -60.0 -24.1 1.000LK 30.0LK 259 82 82M 9021 PLTU KALTIM111.000 2 1 73.5 -24.9 1.000LK 30.0LK 310 98 82M 9020 PLTU KALTIM211.000 2 0.9973 10.4 60.0 0.0 0.0 --------------------------------------------------------------------------------- 1 10.971 30.0H 0.0 0.0 9010 KALTIM150 150.00 2 1 60.0 30.0 1.000UN 3530 82 82M 9021 PLTU KALTIM111.000 2 1.0000 0.0 -73.5 0.0 0.0 --------------------------------------------------------------------------------- 1 11.000 33.3H 0.0 0.0 9010 KALTIM150 150.00 2 1 -73.5 33.3 1.000UN 4234 98 82M 9050 SMBUTAN 150.00 1 0.9618 37.8 0.0 0.0 0.0 --------------------------------------------------------------------------------- 1 144.28 0.0 0.0 0.0 2001 BKUAN_15 150.00 1 1 7.9 3.0 34 4 816A 2001 BKUAN_15 150.00 1 2 7.9 3.0 34 4 816A 9051 SMBTN_20 20.000 1 1 21.3 13.3 1.000LK 100 87 30M 9060 BONTANG 150.00 1 1 -18.6 -9.6 84 10 816A 9060 BONTANG 150.00 1 2 -18.6 -9.6 84 10 816A 9051 SMBTN_20 20.000 1 0.9096 32.1 0.0 21.3 0.0 --------------------------------------------------------------------------------- 1 18.193 0.0 10.5 0.0 9050 SMBUTAN 150.00 1 1 -21.3 -10.5 1.000UN 754 87 30M 9052 MULUT TBNG 11.000 2 1.0000 11.3 50.0 0.0 0.0 --------------------------------------------------------------------------------- 1 11.000 24.2R 0.0 0.0 1001 GREJO_15 150.00 2 1 25.0 12.1 1.000UN 1457 93 30M 1001 GREJO_15 150.00 2 2 25.0 12.1 1.000UN 1457 93 30M 9060 BONTANG 150.00 1 0.9814 39.2 0.0 0.0 0.0 --------------------------------------------------------------------------------- 1 147.21 0.0 0.0 0.0 9050 SMBUTAN 150.00 1 1 18.8 6.1 77 9 816A 9050 SMBUTAN 150.00 1 2 18.8 6.1 77 9 816A 9061 BOTNG20 20.000 1 1 23.1 14.1 1.000LK 106 92 30M
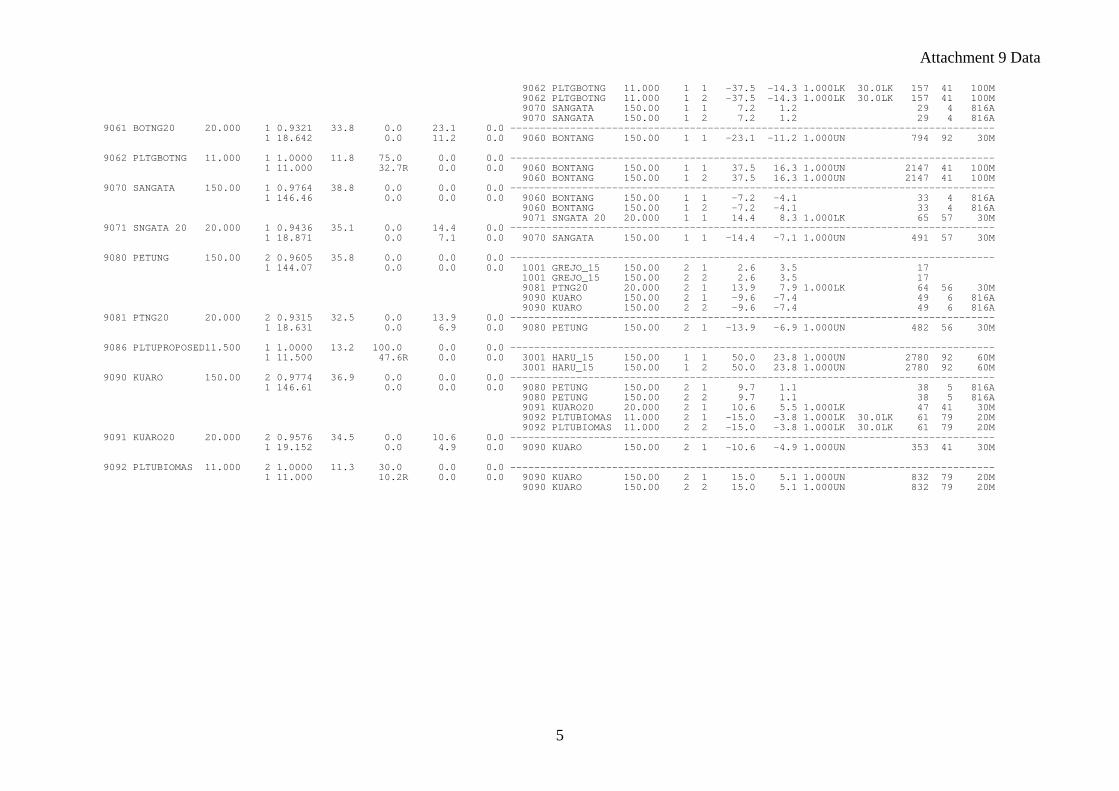
Attachment 9 Data
5
9062 PLTGBOTNG 11.000 1 1 -37.5 -14.3 1.000LK 30.0LK 157 41 100M 9062 PLTGBOTNG 11.000 1 2 -37.5 -14.3 1.000LK 30.0LK 157 41 100M 9070 SANGATA 150.00 1 1 7.2 1.2 29 4 816A 9070 SANGATA 150.00 1 2 7.2 1.2 29 4 816A 9061 BOTNG20 20.000 1 0.9321 33.8 0.0 23.1 0.0 --------------------------------------------------------------------------------- 1 18.642 0.0 11.2 0.0 9060 BONTANG 150.00 1 1 -23.1 -11.2 1.000UN 794 92 30M 9062 PLTGBOTNG 11.000 1 1.0000 11.8 75.0 0.0 0.0 --------------------------------------------------------------------------------- 1 11.000 32.7R 0.0 0.0 9060 BONTANG 150.00 1 1 37.5 16.3 1.000UN 2147 41 100M 9060 BONTANG 150.00 1 2 37.5 16.3 1.000UN 2147 41 100M 9070 SANGATA 150.00 1 0.9764 38.8 0.0 0.0 0.0 --------------------------------------------------------------------------------- 1 146.46 0.0 0.0 0.0 9060 BONTANG 150.00 1 1 -7.2 -4.1 33 4 816A 9060 BONTANG 150.00 1 2 -7.2 -4.1 33 4 816A 9071 SNGATA 20 20.000 1 1 14.4 8.3 1.000LK 65 57 30M 9071 SNGATA 20 20.000 1 0.9436 35.1 0.0 14.4 0.0 --------------------------------------------------------------------------------- 1 18.871 0.0 7.1 0.0 9070 SANGATA 150.00 1 1 -14.4 -7.1 1.000UN 491 57 30M 9080 PETUNG 150.00 2 0.9605 35.8 0.0 0.0 0.0 --------------------------------------------------------------------------------- 1 144.07 0.0 0.0 0.0 1001 GREJO_15 150.00 2 1 2.6 3.5 17 1001 GREJO_15 150.00 2 2 2.6 3.5 17 9081 PTNG20 20.000 2 1 13.9 7.9 1.000LK 64 56 30M 9090 KUARO 150.00 2 1 -9.6 -7.4 49 6 816A 9090 KUARO 150.00 2 2 -9.6 -7.4 49 6 816A 9081 PTNG20 20.000 2 0.9315 32.5 0.0 13.9 0.0 --------------------------------------------------------------------------------- 1 18.631 0.0 6.9 0.0 9080 PETUNG 150.00 2 1 -13.9 -6.9 1.000UN 482 56 30M 9086 PLTUPROPOSED11.500 1 1.0000 13.2 100.0 0.0 0.0 --------------------------------------------------------------------------------- 1 11.500 47.6R 0.0 0.0 3001 HARU_15 150.00 1 1 50.0 23.8 1.000UN 2780 92 60M 3001 HARU_15 150.00 1 2 50.0 23.8 1.000UN 2780 92 60M 9090 KUARO 150.00 2 0.9774 36.9 0.0 0.0 0.0 --------------------------------------------------------------------------------- 1 146.61 0.0 0.0 0.0 9080 PETUNG 150.00 2 1 9.7 1.1 38 5 816A 9080 PETUNG 150.00 2 2 9.7 1.1 38 5 816A 9091 KUARO20 20.000 2 1 10.6 5.5 1.000LK 47 41 30M 9092 PLTUBIOMAS 11.000 2 1 -15.0 -3.8 1.000LK 30.0LK 61 79 20M 9092 PLTUBIOMAS 11.000 2 2 -15.0 -3.8 1.000LK 30.0LK 61 79 20M 9091 KUARO20 20.000 2 0.9576 34.5 0.0 10.6 0.0 --------------------------------------------------------------------------------- 1 19.152 0.0 4.9 0.0 9090 KUARO 150.00 2 1 -10.6 -4.9 1.000UN 353 41 30M 9092 PLTUBIOMAS 11.000 2 1.0000 11.3 30.0 0.0 0.0 --------------------------------------------------------------------------------- 1 11.000 10.2R 0.0 0.0 9090 KUARO 150.00 2 1 15.0 5.1 1.000UN 832 79 20M 9090 KUARO 150.00 2 2 15.0 5.1 1.000UN 832 79 20M
Attachment 10
ASH UTILIZATION STUDY IN INDONESIA
ASH UTILIZATION STUDY IN INDONESIA
TABLE OF CONTENTS
I. Preface II. Investigation of policy, law and regulation related to Ash handling
and utilizing in Indonesia
III. Investigation of the procedure from ministry of environment for ash handling company
IV. Recommendation by ministry of environment related to permit of
ash handling company
V. Nature of some Indonesian coal ash and its possible utilization: - Some Indonesian coal ash characteristics - Current status of ash utilization in Indonesia - Possible utilization
VI. Potential demand of coal ash in:
- Cement industry - Infrastructure - Agriculture
VII. Ash Utilization Standard:
- Ash Mix Standard
VIII. Possible Organization to Promote Ash Utilization
IX. Conclusion and Recommendation

ASH UTILIZATION STUDY 1
REPORT OF ASH UTILIZATION STUDY IN INDONESIA
I. PREFACE
PT. En-Growth Indonesia has conducted the study to investigate the
potential of utilizing coal ash (bottom ash and fly ash) produced from
combustion process in Indonesia. During the study continuous consultation
meetings with relevant government institutions, industries such as coal
miners, power generations, and cement industries have been conducted. In
addition to that, PT. En-Growth Indonesia also conducted meetings with
related industry associations, such as Cement Industry Association and Coal
Mining Association to broaden its perspective.
Scopes of the study are:
1) Investigation on policy, law and regulation related to Ash handling
and utilizing in Indonesia, and the procedure from ministry of
environment for ash handling company
2) Investigation on the nature of some Indonesian coal ash and its
possible utilization, potential demand of coal ash in some industries,
and Ash Utilization Standard
Coal Potential and its Mineable Reserves
It is perceived that more than 984 billion tons of proven coal reserves
are found throughout the world where the biggest reserves are located in 70
countries. Assuming that the production rate of hard coal in 2004 was
around 4.63 billion tons per year and 79 million per year for brown coal,
then estimation of coal reserves can last around 164 years. Figure-1 shows
the world coal reserves at end of 2005 (billion tons)
In Indonesia, most of its coal deposits are distributed mainly in
Sumatra and Kalimantan islands. The location of coal deposit along with
their mineable reserves and potential amount is shown in Table 1.
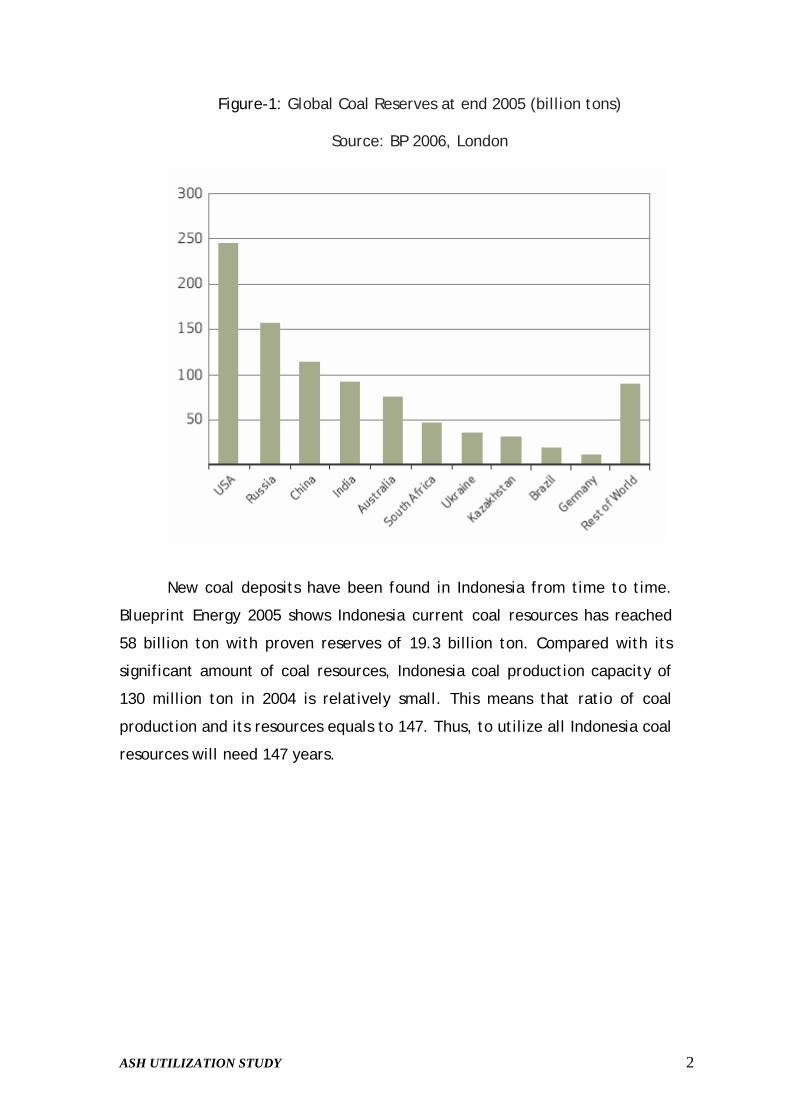
ASH UTILIZATION STUDY 2
Figure-1: Global Coal Reserves at end 2005 (billion tons)
Source: BP 2006, London
New coal deposits have been found in Indonesia from time to time.
Blueprint Energy 2005 shows Indonesia current coal resources has reached
58 billion ton with proven reserves of 19.3 billion ton. Compared with its
significant amount of coal resources, Indonesia coal production capacity of
130 million ton in 2004 is relatively small. This means that ratio of coal
production and its resources equals to 147. Thus, to utilize all Indonesia coal
resources will need 147 years.

ASH UTILIZATION STUDY 3
Table 1. Potential Reserves Of Coal
X 106 ton
Resources
PROVINCE Minable Reserves
Measured Indicated Inferred Hypothetic Total 1 Banten 0.00 0.00 0.00 13.75 0.00 0.00 2 Central Java 0.00 0.00 0.00 0.82 0.00 0.82 3 East Java 0.00 0.00 0.00 0.08 0.00 0.08 4
Nangroe Aceh Darusalam 0.00 90.40 13.40 346.35 0.00 450.15
5 North Sumatera 0.00 19.97 0.00 7.00 0.00 26.97 6 Riau
15.15 336.32 0.00
1,720.60
0.00
2,057.22
7 West Sumatra 36.07 181.24 42.72
475.94 19.19 719.09
8 Bengkulu
21.12 62.18 7.95
113.09 15.15 198.37
9 Jambi
9.00 94.22 36.32
1,462.03 0.00
1,592.57
10 South Sumatra
2,653.98 1,970.75
19,946.48
323.17 0.00
22.240.40
11 Lampung 0.00 0.00 0.00
106.95 0.00 106.95
12 West Kalimantan
0.00
1.48 1.32
482.60 42.12 527.52
13 Central Kalimantan
48.59 194.02 5.08
1,200.11
0.00
1,399.21
14 South Kalimantan
1,787.32 3,109.21
155.08
5,410.27
0.00
8,674.56
15 East Kalimantan
2,410.33 6,385.13
325.21
12,401.11 456.34
19,567.79
16 South Sulawesi
0.06 21.20
0.00
110.81 0.00 132.01
17 Central Sulawesi 0.00 0.00 0.00 0.00 0.00 0.00 18 Papua 0.00 0.00 0.00 138.30 0.00 138.30
TOTAL 6,981.62 12,466.42 20,533.56 24,314.96 532.80 57,847.74
Source : Indonesia Coal Resources, reserves, and calorific value, 2005
Coal Production and Future Projection
Coal production in Indonesia has greatly changed in the past 10 years
as shown in Table 2. Previously most Indonesian coals produced are for
exports, and only small amount is for domestic market. The low domestic
consumption of coal has been predominantly due to low price of oil which
make the industries preferred to use oil rather than coal which was not
subsidized. Recently the government of Indonesia drastically reduced the
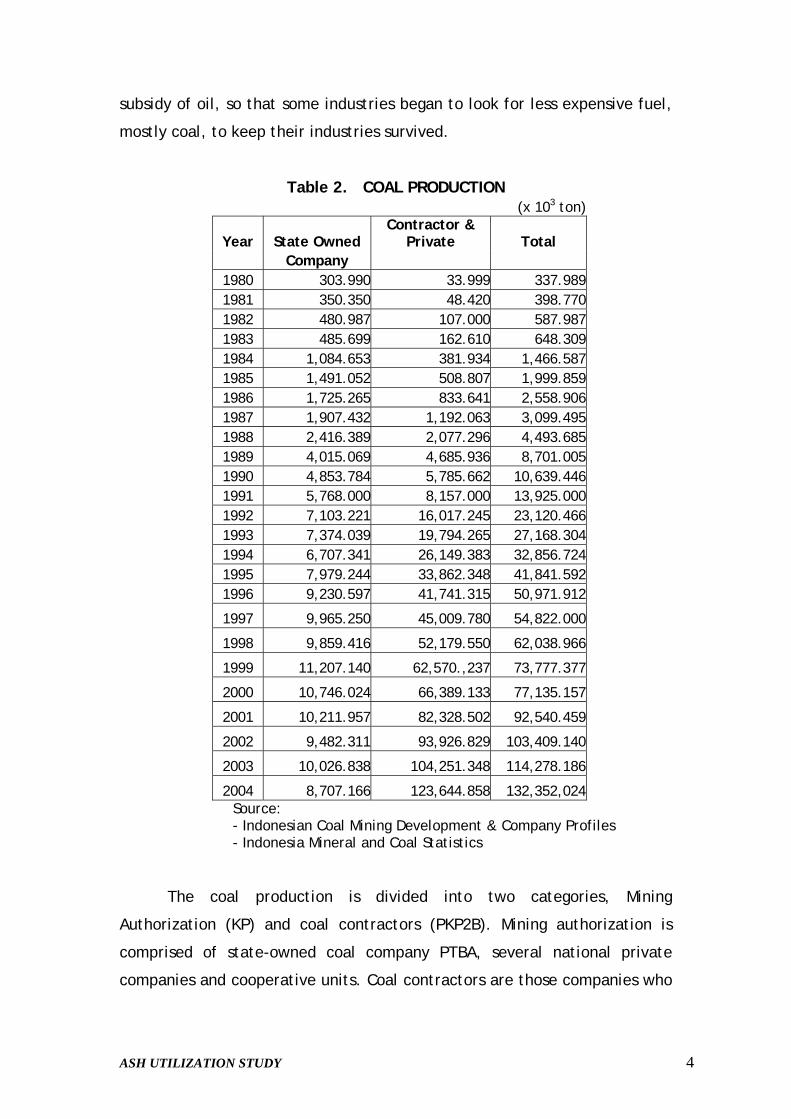
ASH UTILIZATION STUDY 4
subsidy of oil, so that some industries began to look for less expensive fuel,
mostly coal, to keep their industries survived.
Table 2. COAL PRODUCTION (x 103 ton)
Year State Owned Contractor &
Private Total Company
1980 303.990 33.999 337.9891981 350.350 48.420 398.7701982 480.987 107.000 587.9871983 485.699 162.610 648.3091984 1,084.653 381.934 1,466.5871985 1,491.052 508.807 1,999.8591986 1,725.265 833.641 2,558.9061987 1,907.432 1,192.063 3,099.4951988 2,416.389 2,077.296 4,493.6851989 4,015.069 4,685.936 8,701.0051990 4,853.784 5,785.662 10,639.4461991 5,768.000 8,157.000 13,925.0001992 7,103.221 16,017.245 23,120.4661993 7,374.039 19,794.265 27,168.3041994 6,707.341 26,149.383 32,856.7241995 7,979.244 33,862.348 41,841.5921996 9,230.597 41,741.315 50,971.912
1997 9,965.250 45,009.780 54,822.000
1998 9,859.416 52,179.550 62,038.966
1999 11,207.140 62,570.,237 73,777.377
2000 10,746.024 66,389.133 77,135.157
2001 10,211.957 82,328.502 92,540.459
2002 9,482.311 93,926.829 103,409.140
2003 10,026.838 104,251.348 114,278.186
2004 8,707.166 123,644.858 132,352,024Source: - Indonesian Coal Mining Development & Company Profiles - Indonesia Mineral and Coal Statistics
The coal production is divided into two categories, Mining
Authorization (KP) and coal contractors (PKP2B). Mining authorization is
comprised of state-owned coal company PTBA, several national private
companies and cooperative units. Coal contractors are those companies who
ASH UTILIZATION STUDY 5
has production sharing contract with the government, comprised of
contractors from first to forth generation.
The production of mining authorization has not significantly increased
within the last 5 years (2000 – 2005), only 3 million tons compared with
those from coal contractors reaching 64 million tons. This significant
increase is attributable to high demand of coal from Asian countries and this
trend would continue to grow in the near future due to high rate of oil price.
It is predicted that the total production of coal in 2009 would probably
reach 181 million tons, dominated by contractor share 87% of the total.
Coal production of the contractors mainly comes from PT. Kaltim
Prima Coal 40 million tons, PT. Adaro 30 million tons, PT. Arutmin Indonesia
20 million tons, PT. Kideco Jaya Agung 18 million tons and Berau Coal 12
million tons. These 5 big coal contractors are of the first generation
companies.
There are hundreds of coal producers in Indonesia, particularly after
the government issued autonomy bill few years ago, in which mining license
is no longer issued by the central government, but regency or local
government. Since then, the total annual production capacity has increased
significantly from 27.8 million ton in 1993 to 114.3 million in 2003. About
30.7 million ton is used domestically, while the remaining is for export
mainly to Asian countries such as Japan, Taiwan, Hong Kong, China, Korea,
India, Thailand, Malaysia and so on. Major domestic coal users in Indonesia
are power plant (74%), followed by cement industry (16%), pulp (3%),
metallurgy (1%) and other industries (6%).
Coal Utilization in Indonesia
The fast growing of coal demand in Indonesia was mainly driven by
the two largest coal consumers, i.e. power generation and cement
industries, even though other industries such as pulp and paper, metallurgy,
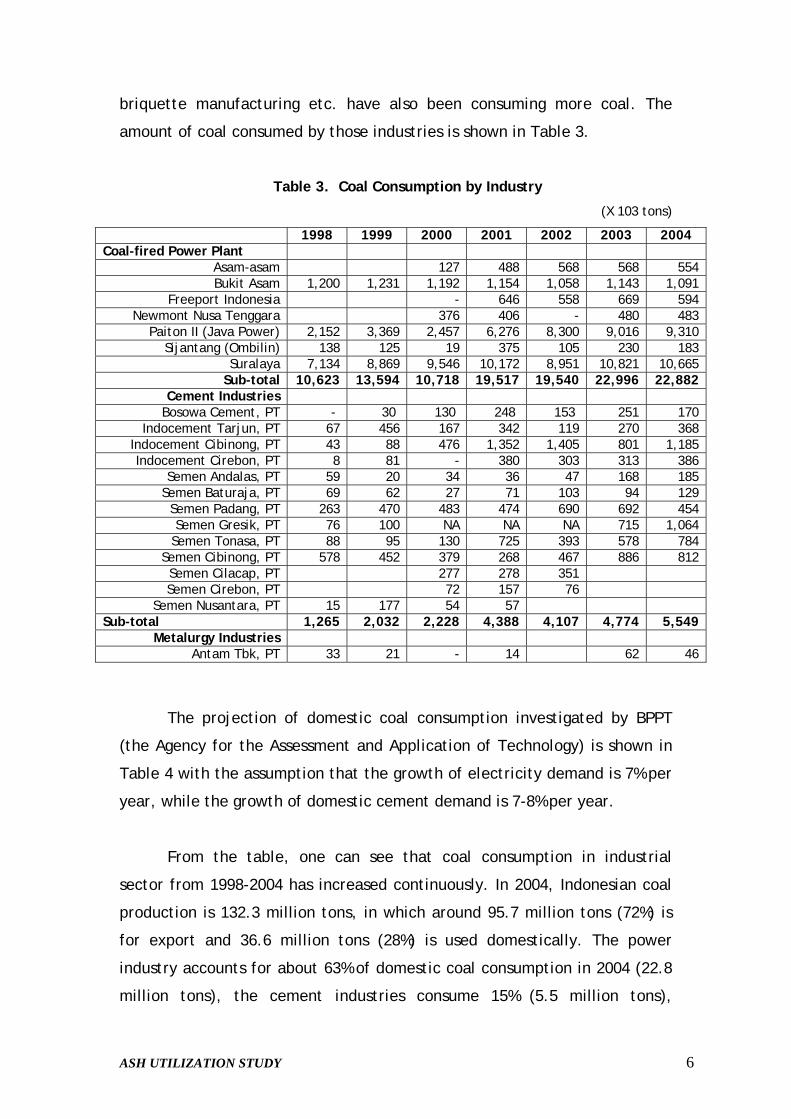
ASH UTILIZATION STUDY 6
briquette manufacturing etc. have also been consuming more coal. The
amount of coal consumed by those industries is shown in Table 3.
Table 3. Coal Consumption by Industry
(X 103 tons)
1998 1999 2000 2001 2002 2003 2004 Coal-fired Power Plant
Asam-asam 127 488 568 568 554 Bukit Asam 1,200 1,231 1,192 1,154 1,058 1,143 1,091
Freeport Indonesia - 646 558 669 594 Newmont Nusa Tenggara 376 406 - 480 483
Paiton II (Java Power) 2,152 3,369 2,457 6,276 8,300 9,016 9,310 Sijantang (Ombilin) 138 125 19 375 105 230 183
Suralaya 7,134 8,869 9,546 10,172 8,951 10,821 10,665 Sub-total 10,623 13,594 10,718 19,517 19,540 22,996 22,882
Cement Industries Bosowa Cement, PT - 30 130 248 153 251 170
Indocement Tarjun, PT 67 456 167 342 119 270 368 Indocement Cibinong, PT 43 88 476 1,352 1,405 801 1,185 Indocement Cirebon, PT 8 81 - 380 303 313 386
Semen Andalas, PT 59 20 34 36 47 168 185 Semen Baturaja, PT 69 62 27 71 103 94 129
Semen Padang, PT 263 470 483 474 690 692 454 Semen Gresik, PT 76 100 NA NA NA 715 1,064
Semen Tonasa, PT 88 95 130 725 393 578 784 Semen Cibinong, PT 578 452 379 268 467 886 812 Semen Cilacap, PT 277 278 351 Semen Cirebon, PT 72 157 76
Semen Nusantara, PT 15 177 54 57 Sub-total 1,265 2,032 2,228 4,388 4,107 4,774 5,549
Metalurgy Industries Antam Tbk, PT 33 21 - 14 62 46
The projection of domestic coal consumption investigated by BPPT
(the Agency for the Assessment and Application of Technology) is shown in
Table 4 with the assumption that the growth of electricity demand is 7% per
year, while the growth of domestic cement demand is 7-8% per year.
From the table, one can see that coal consumption in industrial
sector from 1998-2004 has increased continuously. In 2004, Indonesian coal
production is 132.3 million tons, in which around 95.7 million tons (72%) is
for export and 36.6 million tons (28%) is used domestically. The power
industry accounts for about 63% of domestic coal consumption in 2004 (22.8
million tons), the cement industries consume 15% (5.5 million tons),
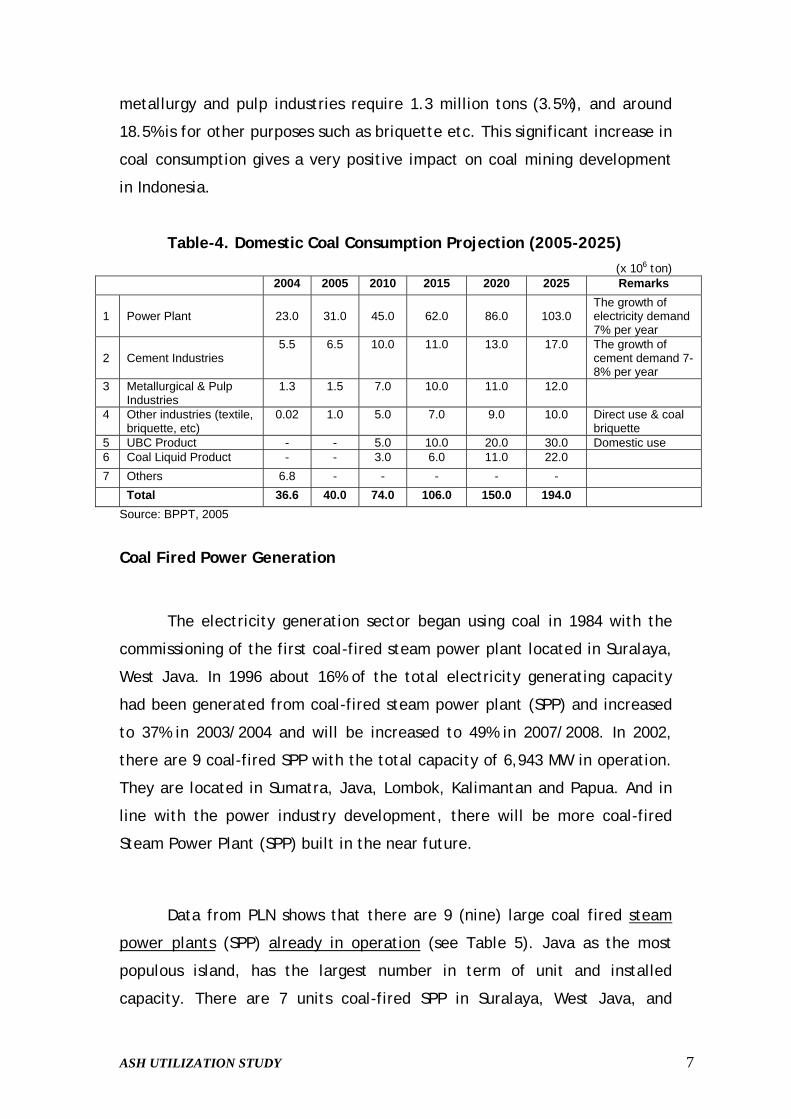
ASH UTILIZATION STUDY 7
metallurgy and pulp industries require 1.3 million tons (3.5%), and around
18.5% is for other purposes such as briquette etc. This significant increase in
coal consumption gives a very positive impact on coal mining development
in Indonesia.
Table-4. Domestic Coal Consumption Projection (2005-2025) (x 106 ton)
2004 2005 2010 2015 2020 2025 Remarks 1
Power Plant
23.0
31.0
45.0
62.0
86.0
103.0
The growth of electricity demand 7% per year
2
Cement Industries
5.5 6.5 10.0 11.0 13.0 17.0 The growth of cement demand 7-8% per year
3 Metallurgical & Pulp Industries
1.3 1.5 7.0 10.0 11.0 12.0 4 Other industries (textile,
briquette, etc) 0.02 1.0 5.0 7.0 9.0 10.0 Direct use & coal
briquette 5 UBC Product - - 5.0 10.0 20.0 30.0 Domestic use 6 Coal Liquid Product - - 3.0 6.0 11.0 22.0 7 Others 6.8 - - - - - Total 36.6 40.0 74.0 106.0 150.0 194.0
Source: BPPT, 2005
Coal Fired Power Generation
The electricity generation sector began using coal in 1984 with the
commissioning of the first coal-fired steam power plant located in Suralaya,
West Java. In 1996 about 16% of the total electricity generating capacity
had been generated from coal-fired steam power plant (SPP) and increased
to 37% in 2003/2004 and will be increased to 49% in 2007/2008. In 2002,
there are 9 coal-fired SPP with the total capacity of 6,943 MW in operation.
They are located in Sumatra, Java, Lombok, Kalimantan and Papua. And in
line with the power industry development, there will be more coal-fired
Steam Power Plant (SPP) built in the near future.
Data from PLN shows that there are 9 (nine) large coal fired steam
power plants (SPP) already in operation (see Table 5). Java as the most
populous island, has the largest number in term of unit and installed
capacity. There are 7 units coal-fired SPP in Suralaya, West Java, and

ASH UTILIZATION STUDY 8
another 7 units in Paiton, East Java constitutes of approximately 5,800 MW
installed capacity.
While data from the Department of Energy and Mineral Resources
(2005) shows that Suralaya (PT Indonesia Power) is the biggest coal fired
power plant in Indonesia, consumes around 10.7 million ton coal per year
(2004) or 46.6% of the total coal consumption in power generation (22.9
million/year). The second biggest coal consumer is Paiton power (PT YTL
East Java), consumes about 9.3 million ton coal/year. The remaining 12.7%
is consumed by another five power generations
In Sumatra there are two coal-fired SPP located in Ombilin, West
Sumatra and Bukit Asam, South Sumatra. Ombilin SPP has 2 x 100 MW
Turbine Generator, while Bukit Asam has 2 x 65 MW generating units. Other
coal fired SPP are in West Nusa Tenggara, Kalimantan, and Papua. The
Newmont SPP in West Nusa Tenggara has installed capacity of 4 x 28 MW
Turbine Generator, serving the Newmont mining complex in Lombok Island.
In the Asam-Asam SPP, Banjarmasin, South Kalimantan 2 x 65 MW units is
installed to serve the South Kalimantan PLN system. In Papua, the Freeport
SPP operates 2 x 60 MW installed capacity to electrify mainly the Freeport
mining complex.
Table 5. Coal-Fired Power Plant in Indonesia
Description of Coal Used No. Power Station Name
Location Ope rationTime
Genera ting
Capacity (MW)
Generating
Capacity (%)
Coal Annual
Consumption
(103 ton)
Typical Quality
Name of Coal Reserve
Domestic/ Import
Sumatra 1 Bukit Asam S-Sumatra 1987 2 x 65 =
130 36-38 1,153 Bitumi
nous Tanj. Enim
domestic
2 Ombilin W-Sumatra 1996 2 x 100= 200
35-38 700 Bitumi nous
Ombilin domestic
Java 3 Suralaya 1-4 W-Java 1984 4 x 400
=1600 30 – 35 5,100
4 Suralaya 5-7 W-Java 3 x 600 =1800 35 - 38 5,070
Bituminous, Sub-bituminous
Bukit Asam (60%), Jorong, Berau, Kideco Arutmin
domestic
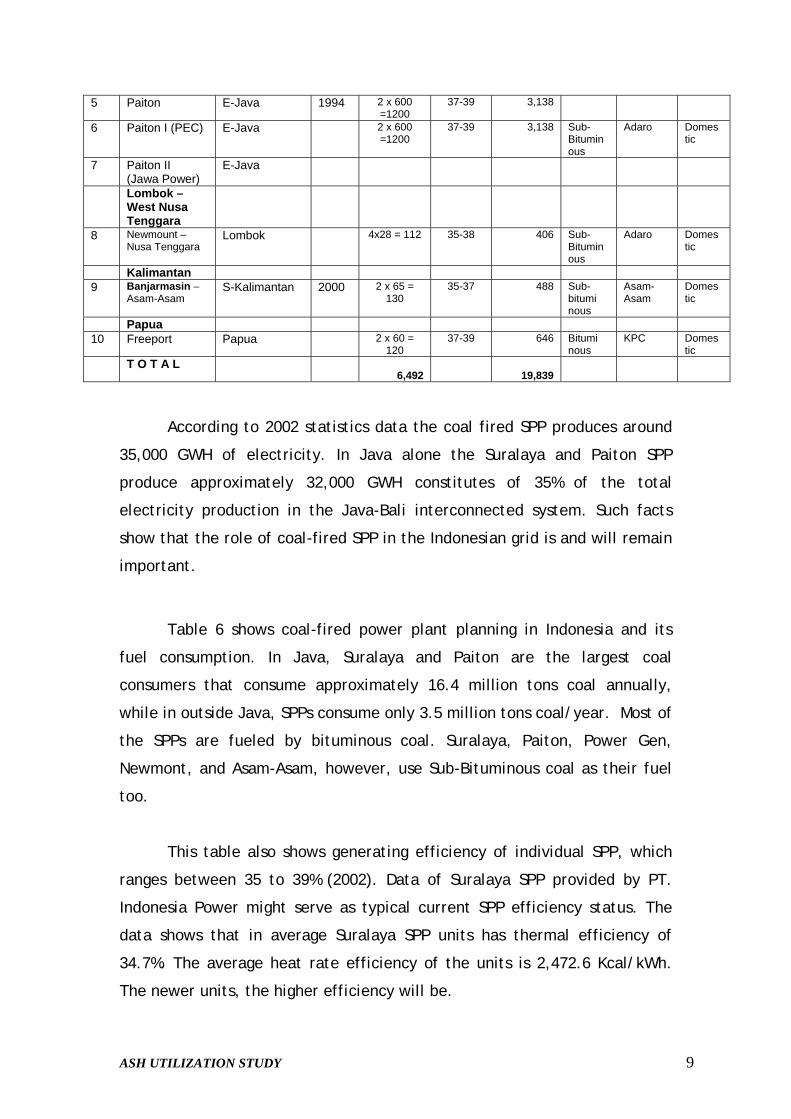
ASH UTILIZATION STUDY 9
5 Paiton E-Java 1994 2 x 600 =1200
37-39 3,138
6 Paiton I (PEC) E-Java 2 x 600 =1200
37-39 3,138 Sub-Bituminous
Adaro Domestic
7 Paiton II (Jawa Power)
E-Java
Lombok – West Nusa Tenggara
8 Newmount – Nusa Tenggara
Lombok 4x28 = 112 35-38 406 Sub-Bituminous
Adaro Domestic
Kalimantan 9 Banjarmasin –
Asam-Asam S-Kalimantan 2000 2 x 65 =
130 35-37 488 Sub-
bitumi nous
Asam-Asam
Domestic
Papua 10 Freeport Papua 2 x 60 =
120 37-39 646 Bitumi
nous KPC Domes
tic T O T A L
6,492
19,839
According to 2002 statistics data the coal fired SPP produces around
35,000 GWH of electricity. In Java alone the Suralaya and Paiton SPP
produce approximately 32,000 GWH constitutes of 35% of the total
electricity production in the Java-Bali interconnected system. Such facts
show that the role of coal-fired SPP in the Indonesian grid is and will remain
important.
Table 6 shows coal-fired power plant planning in Indonesia and its
fuel consumption. In Java, Suralaya and Paiton are the largest coal
consumers that consume approximately 16.4 million tons coal annually,
while in outside Java, SPPs consume only 3.5 million tons coal/year. Most of
the SPPs are fueled by bituminous coal. Suralaya, Paiton, Power Gen,
Newmont, and Asam-Asam, however, use Sub-Bituminous coal as their fuel
too.
This table also shows generating efficiency of individual SPP, which
ranges between 35 to 39% (2002). Data of Suralaya SPP provided by PT.
Indonesia Power might serve as typical current SPP efficiency status. The
data shows that in average Suralaya SPP units has thermal efficiency of
34.7%. The average heat rate efficiency of the units is 2,472.6 Kcal/kWh.
The newer units, the higher efficiency will be.

ASH UTILIZATION STUDY 10
The Power supply using coal as fuel not only produces electrical
energy but also coal ash. When coal is burnt in the boilers this produces
steam, hence able to move the turbines to produce electricity. The ash
produced by burnt coal consists of bottom ash and fly ash. According to the
Government Law of the Republic of Indonesia No. 18 Year 1999 coal ash is
categorized as hazardous and poisonous waste (B3). This is the reason why
PT Engrowth Indonesia is working together with BPPT, the Indonesian
Cement Association, PT Semen Tonasa, Suralaya Steam Power Plant and the
Indonesian Power Body to implement studies to utilize coal ash in Indonesia.
According to data derived from TekMIRA, the fly ash from coal ash
waste will increase – Steam Power Plant year 2000 produced 1.66 million
tons of waste, and it is estimated that year 2006 will accumulate to 2
million tons.
The coal burning system is usually divided into 2 systems: fluidized
bed and fixed bed or grate systems. Aside from the three systems
mentioned earlier, another system is also known as the spouted bed system
or known as the sprayed bed system.
Fluidized bed is a system where air is blown from beneath using a
blower so that the hard objects/elements on top will have a similar
character like fluid. The fluidized technique is the most efficient technique
to produce energy. Sand or corundum which acts as the heat medium is
initially heated using kerosene/oil. After the sand’s temperature reaches
coal burning temperature (300oC), coal will be induced. This system
produces fly ash and bottom ash. The fluidized bed technology is commonly
used at Steam Generated Power Plants. The weight composition of fly ash
and bottom ash is (80 - 90%) compared to (10 - 20%).

ASH UTILIZATION STUDY 11
Table 6. Coal Fired Power Plant Planning
No Name Location Capacity (MW)
Operation
Time
Coal Cons. (ton/y)
Coal Type Coal Mining
1 PLTU Tanjung Jati B
Jepara-Central Java 1320 2005 4,162,752
Sub Bitumi-nous
East and S.Kalimantan
2 PLTU Cilacap Cilacap-Central Java 450 2006 1,419,120
Sub Bitumi-nous
East and S.Kalimantan
3 PLTU Tarahan #1&2 Tarahan-Lampung 200 2007 770,880
Sub Bitumi-nous
Bengkulu, S. Sumatra,Riau
4 PLTU Tarahan #3&4 Tarahan-Lampung 200 2006 770,880
Sub Bitumi-nous
Bengkulu, S. Sumatra,Riau
5 PLTU Labuan Angin Sibolga-N. Sumatra 230 2007 1,047,696 Lignite
Bengkulu, S. Sumatra,Riau
6 PLTU Amurang Menado-N. Sulawesi 110 2006 346,896
Sub Bitumi-nous
E.Kalimantan, S.Kalimantan
7 PLTU Sibolga Sibolga-Sumut 200 2006 630,720
Sub Bitumi-nous
Bengkulu, S. Sumatra,Riau
8 PLTU Cilegon Cilegon-Banten 450 2008 1,419,120
Sub Bitumi-nous
S. Sumatra, S.Kalimantan, Bengkulu
9 PLTU MT Peranap Riau 500 2007 2,277,600 Lignite Riau
10 PLTU Banjarsari South Sumatera 200 2007 911,040
Sub Bitumi-nous South Sumatra
11 PLTU Lubuk Linggau
South Sumatera 130 2007 592,176
Sub Bitumi-nous South Sumatra
12 PLTU Sarolangon Jambi 14 2005 63,773
Sub Bitumi-nous Jambi
13 PLTU Bangka Bangka 30 2006 136,656
Sub Bitumi-nous Riau
14 PLTU MT Lati East Kalimantan 14 2003 68,678
Reject Coal
East Kalimantan
15 PLTU MT Sangata East Kalimantan 14 2004 68,678
Reject Coal
East Kalimantan
16 PLTU Sintang Central Kalimantan 14 2005 68,678
Reject Coal
South Kalimantan
17 PLTU Kupang NTT 30 2005 136,656
Sub Bituminous
South Kalimantan
18 PLTU Palu South East Sulawesi 30 2005 136,656
Sub Bituminous
East & South Kalimantan
The fixed bed system or grate system is a burning technique where
coal is put on a conveyor belt or grate. This system is not that efficient
since the coals do not burn thoroughly, carbon residue can still be found.
Source : Coal Demand Projection for Electricity, 2003
ASH UTILIZATION STUDY 12
The ash – especially bottom ash, formed by this technique still has Calirific
value around 3,000 kkal/kg. In China, bottom ash is used as fuel for iron
smiths (the iron/metal industry). The fixed bed system technology is used by
many textile industries as a steam generator. The weight composition of fly
ash and bottom ash generated by this system is (15-25%) compared to (75-
85%).
Coal fuel is mainly used for Steam Power Plants. This tendency today
is caused by the rise of diesel fuel making many industries switching to coal
as their fuel to produce steam with remnants of fly ash and bottom ash (5-
10%). The percentage of fly ash and bottom ash produced is: fly ash (80-90%)
and bottom ash (10-20%): [source: PJB Paiton]. The chemical composition of
fly ash is usually as follows:
SiO2 : 52. 00%
Al2O3 : 31. 86%
Fe2O3 : 4. 89%
CaO : 2. 68%
MgO : 4. 66%
ASH UTILIZATION STUDY 13
Cement Industry
There are nine cement factories in Indonesia with total capacity of
almost 47.5 million ton/year as shown at Table 7. The three biggest
companies with total capacity of more than 37 million ton are located in
Java; they are PT Semen Gresik, PT Indocement Tunggal Prakarsa, Tbk. and
PT Semen Cibinong. Other three companies are located in Sumatra, namely
PT Semen Padang, PT Semen Baturaja and PT Semen Andalas Indonesia;
their total capacity is 8 million ton/year. The remaining are PT Semen
Tonasa (3.48 million ton/year) in Pangkep, South Sulawesi, PT Semen Bosowa
Maros (1.8 million ton/year) in South Sulawesi and PT Semen Kupang (570
thousand ton/year) in Kupang, East Nusa Tenggara. Attachment II Shows the
production, consumption and export capacities of Cement in Indonesia
According to the Indonesia Cement and Concrete Institute, and the
Indonesian Cement Association, cement demand per capita in Indonesia is
very low, only about 125 kg/person/year, while in developed countries the
demand per capita could reach around 1000 kg/person/year. Just for a
comparison, cement demand per capita in Malaysia, before economy crisis
in 1998 was already 600 kg/person/year. Cement in Indonesia is mainly used
for the housing not for road/infrastructure facility. Concrete road is much
cheaper than asphalt road especially when the oil price is very high and,
now asphalt must be imported too, but fly ash can be used as asphalt filler.
As an energy intensive industry, cost of energy is very dominant for
cement factory, so does distribution cost, particularly when cement must be
transported across the sea. For this reason, cement is mostly sold for
domestic market, very few is exported to Asian countries.
Total coal consumption in cement factories is around 5.5 million ton
annually, with the major consumers are those factories located in Java. Coal
is mainly supplied from PT Arutmin (Mulia Coal), PTBA and some other
mining companies in South Kalimantan.
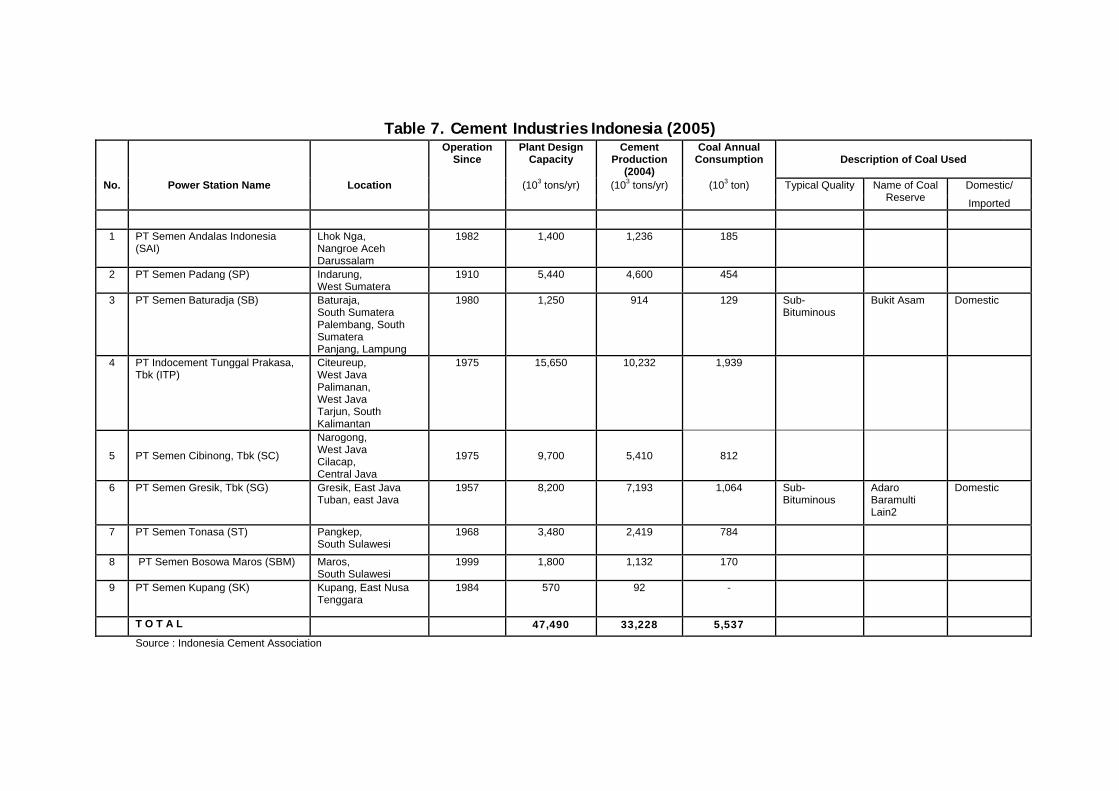
Table 7. Cement Industries Indonesia (2005) Operation
Since Plant Design
Capacity Cement
Production (2004)
Coal Annual Consumption Description of Coal Used
No. Power Station Name Location (103 tons/yr) (103 tons/yr) (103 ton) Domestic/
Typical Quality Name of Coal Reserve Imported
1 PT Semen Andalas Indonesia (SAI)
Lhok Nga, Nangroe Aceh Darussalam
1982 1,400 1,236 185
2 PT Semen Padang (SP) Indarung, West Sumatera
1910 5,440 4,600 454
3 PT Semen Baturadja (SB) Baturaja, South Sumatera Palembang, South Sumatera Panjang, Lampung
1980 1,250 914 129 Sub-Bituminous
Bukit Asam Domestic
4 PT Indocement Tunggal Prakasa, Tbk (ITP)
Citeureup, West Java Palimanan, West Java Tarjun, South Kalimantan
1975 15,650 10,232 1,939
5 PT Semen Cibinong, Tbk (SC)
Narogong, West Java Cilacap, Central Java
1975 9,700 5,410 812
6 PT Semen Gresik, Tbk (SG) Gresik, East Java Tuban, east Java
1957 8,200 7,193 1,064 Sub-Bituminous
Adaro Baramulti Lain2
Domestic
7 PT Semen Tonasa (ST) Pangkep, South Sulawesi
1968 3,480 2,419 784
8 PT Semen Bosowa Maros (SBM) Maros, South Sulawesi
1999 1,800 1,132 170
9 PT Semen Kupang (SK) Kupang, East Nusa Tenggara
1984 570 92 -
T O T A L 47,490 33,228 5,537
Source : Indonesia Cement Association

ASH UTILIZATION STUDY 15
Typically, coal specification used in cement industry is as follows:
• Total Moisture 17% max
• Inherent moisture 8% max
• Ash 12% max
• Volatile matter 45%
• Fixed carbon by different
• Sulfur 1% max
• Size 10-50 mm
• Calorific value 5,800 kcal/kg
(higher CV is preferable, e.g. 6,200-6,500 kcal/kg)
PT Cement Gresik consumes about 3,000 ton/day coal from different
quality between 5,000 to 6,500 kcal/kg, while Narogong plant of PT Semen
Cibinong consumes around 2,500 ton coal/day with calorific value of 4,500
kcal/kg up
PT Indocement Tunggal Perkasa Tbk, which currently has 3 factories
in operation, consumes approximately 7,500 ton coal/day or 2.5 million
ton/year from PT Bukit Asam, PT Adaro and some smaller coal producers in
Kalimantan with calorific values vary between 5,000 - 6,500 kcal/kg. This
coal is used for processing only, not for combustion in the factory. Data
released by PT Indocement shows that for every ton cement produced, the
factory requires around 150 kg coal and about 100 kw electricity.
Basically, cement factory can burn all kind of coal, the most
important thing is that the quality must be kept constant, disregard to the
amount of ash. The maximum ash in coal that can be accepted by cement
factory is 25%.
Indocement is the only cement factory which owns its power
generation that can supply 2/3 part of total electricity required or 120 MW.
The remaining of 60 MW is supplied by PLN. Indocement has a factory

ASH UTILIZATION STUDY 16
located near by mining area in Batulicin. Its coal consumption per year is 2.5
million ton (5,800 kcal/kg)
Coal price FOB barge supplied to Indocement are as follows:
From big miners: USD 25-30/ton
From small miners/cooperatives: USD 20-22/ton
Price FOB vessel is USD 4/ton higher than FOB barge.
For Indocement, Suralaya is the major fly-ash supplier, while cement
Gresik gets fly-ash from Paiton power generation. Indocement also gets
some small amount of ash from PT Indah Kiat. Total ash required by
Indocement is about 10,000-15,000 ton/month with transportation cost of
Rp 70,000/ton.
The Chairman of the Indonesia Cement Association concerns very
much with the hiking of the world and domestic oil price that have serious
negative impact to local industry, in particular those high intensive energy
users. For cement industry, this sharp increase in energy price has caused
considerable increase in production and distribution costs, which finally will
push the price of cement up too.
Cement cannot be substituted; therefore cement industry must be
kept sustained and profitable. Efforts to solve problems in cement industry
have been made; among others is promoting regulation on power wastes
utilization for cement production. Instead of purchasing ash with expensive
price, wastes ash producer should pay money to cement factory for
treatment. Such regulation has been applied in many countries, and should
be applied in Indonesia too. This regulation can finally reduce the
production cost of cement.
Industry has urged the government to provide incentive so that they
could survive amid rising prices for fuel. If no help was given to industry,

ASH UTILIZATION STUDY 17
many companies would have gone out of business, or would be on the brink
of collapse, and finally thousands of people would lose their jobs.
Unfortunately, the government even had mentioned previously that fuel
prices will be raised gradually to bring them in line with market prices
between the end of 2006 and the end of 2007
ASH UTILIZATION STUDY 18
II. INVESTIGATION OF POLICY, LAW AND REGULATION RELATED TO
ASH HANDLING AND UTILIZATION IN INDONESIA
The Environment Minister is drafting 4(four) State Minister to the
Environment Law which will evidently be used for implementing
decentralization for B3 (Hazardous and Poisonous Waste) and B3 Waste
Management. This regulation is meant to convey “guidance” for the regions,
so B3 and B3 Waste management can be operated directly in regions.
The 4 (four) Minister Regulations being drafted are among others:
• Environment Minister Reg. on Technical Prerequisites to Store &
Gather B3 Waste
• Environment Minister Reg. on Rules & Regulations and Technical
Prerequisites to Store & Gather B3 Waste
• Environment Minister Reg. on License Mechanism for Activities to
Store & Gather B3 Waste
• Environment Minister Reg. on Decisions of Funding Licenses to
Manage B3 Waste for the Storing & Gathering Activities
The table of regulations for B3 Waste Management is:
1. RI Gov. Reg. No.74 Year 2001 B3 Waste Management
2. RI Gov. Reg. No.19 Year 1999 B3 Waste Management
3. RI Gov. Reg. No.12 Year 1995 Gov. Reg. Change No.19/1994
4. RI Gov. Reg. No.18 Year 1999 B3 Waste Management
5. RI Gov. Reg. No.85 Year 1999 Gov. Reg. Change No.18/1999
6. SE Bapedal 08/SE/02/97 Lubricating Oil Waste
7. BAPEDAL Head Decision
No. KEP-02/BAPEDAL/09/1995 B3 Waste Documents
8. BAPEDAL Head Decision
No. KEP-05/BAPEDAL/09/1995 Symbol & Label of B3 Waste
9. BAPEDAL Head Decision
No. KEP-01/BAPEDAL/1995 Regulations and Technical
Prerequisites of Storage &
Collecting B3 Waste

ASH UTILIZATION STUDY 19
10. BAPEDAL Head Decision
No. KEP-03/BAPEDAL/1995 Technical Prerequisites of B3
Waste Management
11. BAPEDAL Head Decision
No.KEP-04/BAPEDAL/1995 Guidelines of Piling Prerequisites,
Prerequisites for Waste Dump
Location for B3 Waste
12. BAPEDAL Head Decision
No.KEP-68/BAPEDAL/1994 Guidelines to Acquire License, to
Store, Collect, Operate
Equipment to Manage the end
result of B3 Waste Management
& Piling
13. BAPEDAL Head Decision
No.KEP-255/BAPEDAL/1994 Storing & Piling Lubricating Oil
Residue
Waste included in B3 Waste is waste that fulfills one or more of the
following characteristics:
a. Easily explodes
b. Flammable
c. Reactive
d. Poisonous
e. Infectious
f. Corrosive, and
g. The other wastes, if tested with the toxic method is known to be one
of the B3 Waste type;
Type B3 Waste includes:
a. B3 Waste is from a non-specific source
b. B3 Waste is from a specific source
c. B3 Waste is from expired, spilled, chemicals, retaining chemical
packages, and thrown-out products that do not meet specifications;
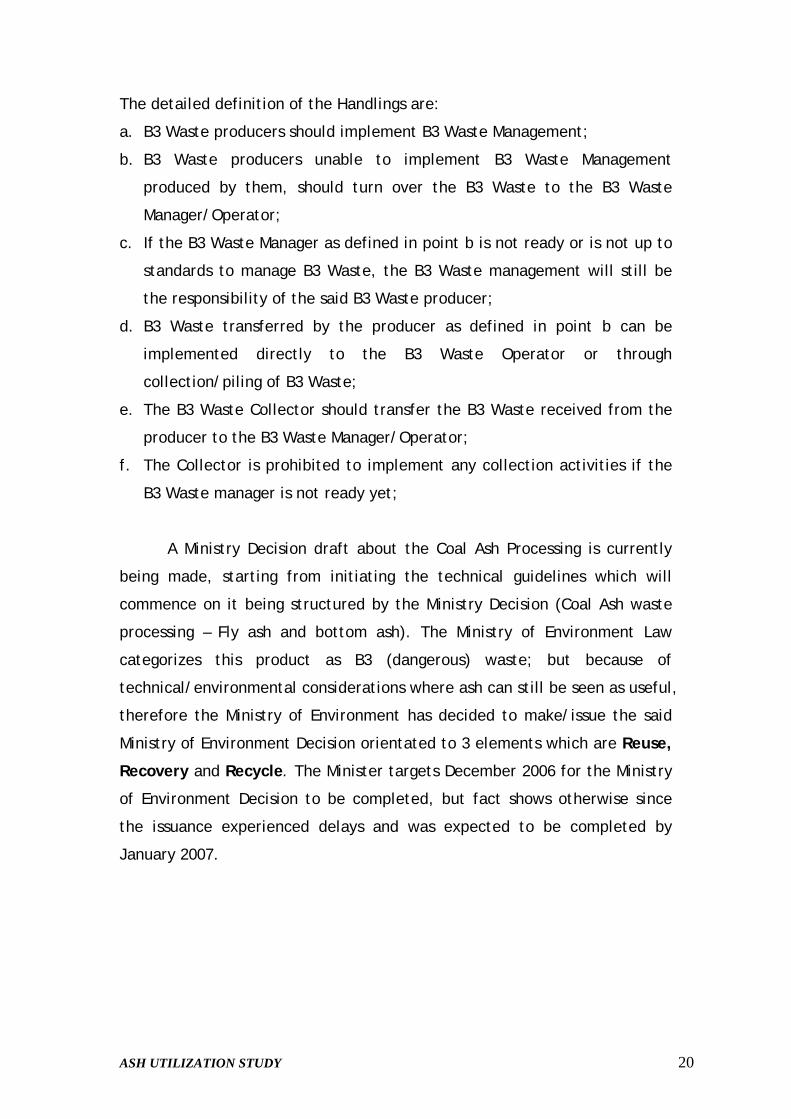
ASH UTILIZATION STUDY 20
The detailed definition of the Handlings are:
a. B3 Waste producers should implement B3 Waste Management;
b. B3 Waste producers unable to implement B3 Waste Management
produced by them, should turn over the B3 Waste to the B3 Waste
Manager/Operator;
c. If the B3 Waste Manager as defined in point b is not ready or is not up to
standards to manage B3 Waste, the B3 Waste management will still be
the responsibility of the said B3 Waste producer;
d. B3 Waste transferred by the producer as defined in point b can be
implemented directly to the B3 Waste Operator or through
collection/piling of B3 Waste;
e. The B3 Waste Collector should transfer the B3 Waste received from the
producer to the B3 Waste Manager/Operator;
f. The Collector is prohibited to implement any collection activities if the
B3 Waste manager is not ready yet;
A Ministry Decision draft about the Coal Ash Processing is currently
being made, starting from initiating the technical guidelines which will
commence on it being structured by the Ministry Decision (Coal Ash waste
processing – Fly ash and bottom ash). The Ministry of Environment Law
categorizes this product as B3 (dangerous) waste; but because of
technical/environmental considerations where ash can still be seen as useful,
therefore the Ministry of Environment has decided to make/issue the said
Ministry of Environment Decision orientated to 3 elements which are Reuse,
Recovery and Recycle. The Minister targets December 2006 for the Ministry
of Environment Decision to be completed, but fact shows otherwise since
the issuance experienced delays and was expected to be completed by
January 2007.

ASH UTILIZATION STUDY 21
The Ministry Environment Decision technical structure includes the
use of fly/bottom ash as follows:
1. As a substitute for basic material for cement
2. As building construction material: paving block, cone-block roof tiles
and secondary brick.
3. To substitute fuel. In this case, fly ash still containing unburned
carbon (carbon remains resulting from incomplete burning) in quite a
large quantity, which is usually from the textile industries which
generally uses boilers made in China. Ash that still contains a lot of
unburned carbon is called coal combustion product (CCP). The CCP
calorie value is only 3,000 kcal/kg since it should be blended with
raw coal that has a high calorie value of 6,500-6,800 kcal/kg if it is to
be used as fuel for industry – for example, fuel for the cement
industry.
Meanwhile, the ash cannot be directly utilized as basic material for
cement (cement mix) requesting <5% LOI (zero expectation is called
for), since it does contain a considerable amount of carbon (LOI~25%;
LOI = fixed carbon). Ash containing Silica (SiO2) is the type that is
mainly hoped for other contents like CaO, Fe2O3 and Al2O3 are also
expected.
This Ministry Decision does not accommodate the use of ash for roads
and fertilizer since slight internal disagreements between the researchers
and officials are still found. Therefore, it was decided that the regulation
will be implemented in stages; accommodating the 3 elements above and 2
other elements are still pending since deliberations have not yet been met.
Permit issues for companies that want to move in this business
category are required to acquire license/permit from the Ministry of
Environment since ash is still categorized as B3 waste (the Ministry of
Environment is working together with the Department of Industry and the
Joint Work MoU has been signed).

ASH UTILIZATION STUDY 22
Basically, after the Ministry of Environment Decision is issued, then
permit application and process for coal ash businesses will be much easier,
or at least much easier than the former cases, for example, HOLCIM case,
the company which has coal ash processing business. HOLCIM has applied for
such a permit to manage and process coal ash waste and will be working
together with PT Indocement to process ash waste from the textile industry
to settle cases concerning ash from the industries to utilize it in the correct
manner.
Most importantly, and the most difficult part is, according to the
Ministry of Environment, control – so the focus is after the issuance of the
Ministry of Environment Decision and not at the agreement level but control.
If diversions should be met in the implementation of the Ministry of
Environment Decision, then it should be reported to the Department of
Industry that has issued such a work/business permit – therefore, this
Department should also abolish the permit/license.
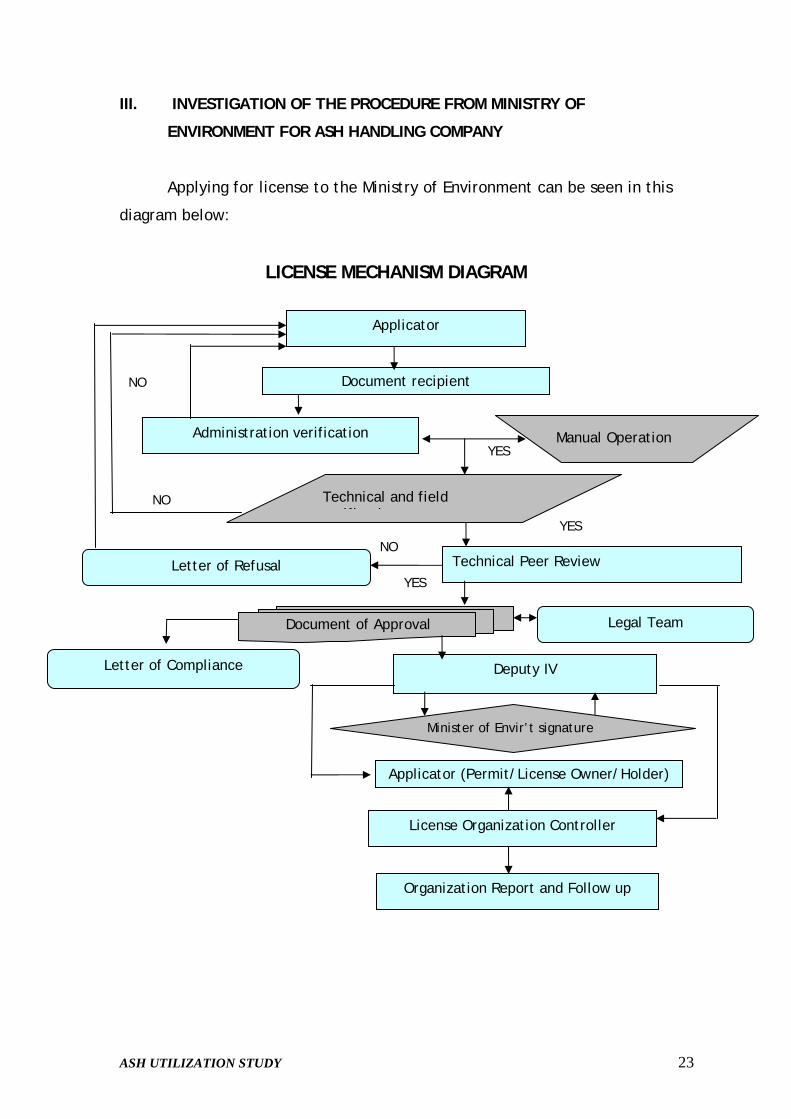
ASH UTILIZATION STUDY 23
III. INVESTIGATION OF THE PROCEDURE FROM MINISTRY OF
ENVIRONMENT FOR ASH HANDLING COMPANY
Applying for license to the Ministry of Environment can be seen in this
diagram below:
LICENSE MECHANISM DIAGRAM
Technical and field ifi i
Technical Peer Review
Document of Approval Legal Team
Deputy IV
NO
NO
YES
YES
YES
Administration verification
NO
Applicator
Document recipient
Letter of Refusal
Letter of Compliance
Manual Operation
Minister of Envir’t signature
Applicator (Permit/License Owner/Holder)
License Organization Controller
Organization Report and Follow up
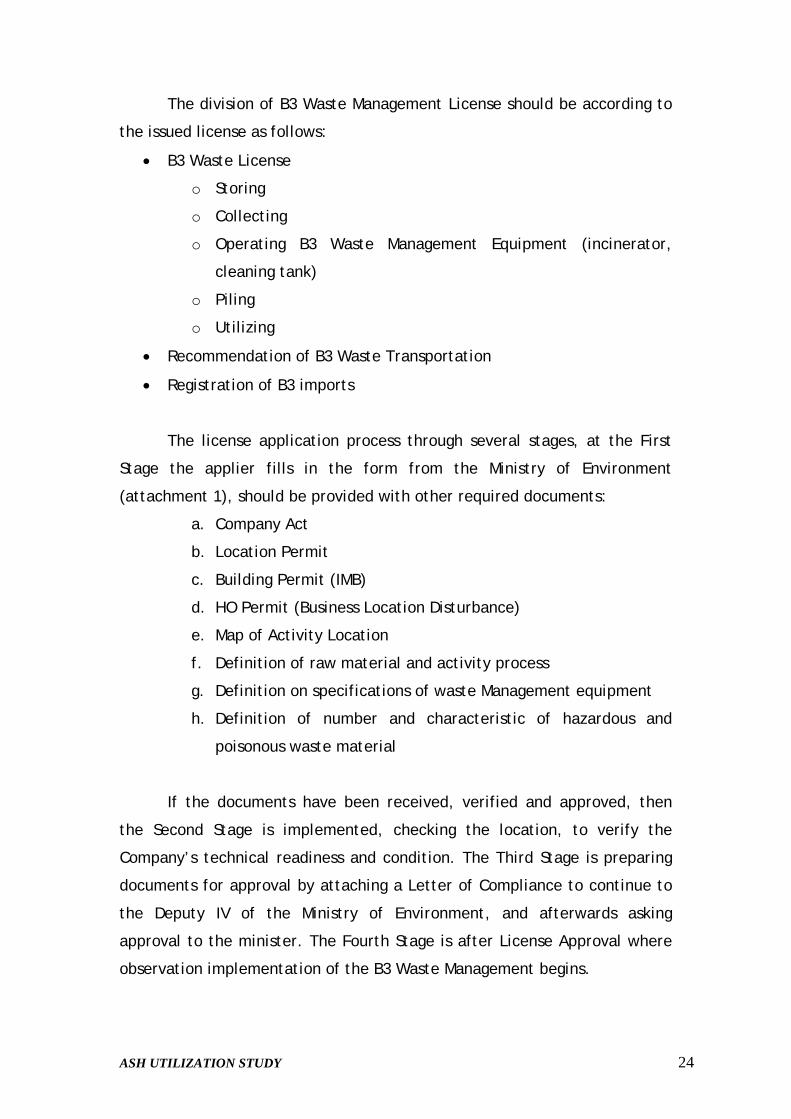
ASH UTILIZATION STUDY 24
The division of B3 Waste Management License should be according to
the issued license as follows:
• B3 Waste License
o Storing
o Collecting
o Operating B3 Waste Management Equipment (incinerator,
cleaning tank)
o Piling
o Utilizing
• Recommendation of B3 Waste Transportation
• Registration of B3 imports
The license application process through several stages, at the First
Stage the applier fills in the form from the Ministry of Environment
(attachment 1), should be provided with other required documents:
a. Company Act
b. Location Permit
c. Building Permit (IMB)
d. HO Permit (Business Location Disturbance)
e. Map of Activity Location
f. Definition of raw material and activity process
g. Definition on specifications of waste Management equipment
h. Definition of number and characteristic of hazardous and
poisonous waste material
If the documents have been received, verified and approved, then
the Second Stage is implemented, checking the location, to verify the
Company’s technical readiness and condition. The Third Stage is preparing
documents for approval by attaching a Letter of Compliance to continue to
the Deputy IV of the Ministry of Environment, and afterwards asking
approval to the minister. The Fourth Stage is after License Approval where
observation implementation of the B3 Waste Management begins.

ASH UTILIZATION STUDY 25
IV. RECOMMENDATION BY MINISTRY OF ENVIRONMENT RELATED TO
PERMIT OF ASH HANDLING COMPANY
License utilization fly/bottom ash prioritizing more to the cement
producers or direct usage to mixed concrete, which has been prepared by
Holcim cement. Recommendations provided should fulfill the criteria
according to Gov. Reg. No.12 year 1995 with following articles:
Article 21
Clause (1)
Each Business Establishment that are doing the following activities:
a. Collect and/or manage B3 waste should own a license from the Body
Head
b. Waste Impact Control. Transporting B3 Waste should own a license from
the Ministry of Communications after acquiring recommendations from
the Environmental Impact Agency Head
c. Use of B3 Waste should have a license from the related Government
Supervisory Institution, after acquiring the recommendation from the
Environmental Impact Agency Head
Clause (2)
The determination on regulations to acquire license as understood in clause
(1) point a is determined by the Environmental Impact Agency Head, clause
(1) point b Ministry of Communication Decision, and clause (1) point c
related Government Supervisory Institution.
Clause (3)
Integrated B3 Waste Management activities with main responsibilities
acquiring Management equipment operations and B3 Waste storage
recommendation issued by the Environmental Impact Control Agency and
implemented according to this Gov. Regulations Decision.

ASH UTILIZATION STUDY 26
Clause (4)
The criteria to acquire license as understood in clause (1) point a and clause
(2) is as follows:
1. Owning an Act of Establishment as a legal business establishment
validated by an authorized institution.
2. The name and address of the business establishment applying for the
license
3. The activities implemented
4. Activity location
5. Name and address of the body in charge/responsible of the activities
6. Raw material and activity process used – equipment specifications of
waste Management operation
7. amount and characteristic of B3 Waste collected, transported or
operated
8. Structure of waste canal/pipes, waste Management, and temporary
storage of B3 waste before being processed and placed at the piling
location after being processed
9. pollution prevention equipment for liquid waste, emission and processing
of B3 waste
Article 22
Clause (1)
Location for B3 waste Process permit is given by the Regency/Municipality
Land Office Head according to the organization plan after acquiring
recommendation form the Environmental Impact Control Agency
Clause (2)
Recommendation as understood in clause (1) based o the study result of
environmental impact and technical feasibility study like geo-hydraulic from
the proposed location.

ASH UTILIZATION STUDY 27
Article 23
Clause (1)
B3 Waste Management activities should make an environment impact
analysis, environment Management plan, and environment observation plan
Clause (2)
The approved environment impact analysis, environment Management plan
and environment observation plan documents are proposed with the
operations permit application as mentioned in Article 21 to the Environment
Impact Observation Body.
Clause (3)
The Decision approval upon the environment impact, environment
Management plan and the environment observation plan analysis is issued by
the Environment Impact Body.
Article 24
Clause (1)
The Decision on permit application as stated in Article 21 clause (2) should
be submitted at least 30 (thirty) working days, starting from the approval of
the environment Management plan and the environment observation plan by
the authorized institution.
Clause (2)
Criteria and responsibility in the environment Management plan and the
environment observation plan by the authorized institution is an inseparable
part from the permit as understood in article 21.
Article 25
Clause (1)
If the B3 waste producer and utilizer also acts as the B3 waste processor and
the processing location and the main activity location is in the same place,

ASH UTILIZATION STUDY 28
then this should be made integrated with the analysis on the environment
impact for main activities.
Clause (2)
If the B3 waste is processed by the producer and utilzer of the B3 waste at
the main location, then only the environment Management plan and
environment observation plan that has been approved by the related
Supervisory Institution would be the one proposed to the Environment
Impact control Agency Head together with the recommendation application
as understood in Article 21 clause (3).
Clause (3)
The Decision on recommendation application as stated in clause (2) is issued
by the Environment Impact Control Agency Head at least 30 (thirty) days
since the receipt of the environment Management plan and the environment
observation plan that has been approved by the related Supervisory
Institution.
Clause (4)
The prerequisites and responsibilities in the environment Management plan
and the environment observation plan as mentioned in clause (2) is an
inseparable part from the recommendation mentioned in Article 21 clause
(3).
Article 26
Clause (1)
When the producer and the utilizer of B3 waste that acts as the B3 waste
Management and the processing location is different with the main activity,
then the regulation for the B3 waste Management activity would be the
validation of the Decision for the B3 Waste Management and this Gov.
Regulation.

ASH UTILIZATION STUDY 29
Clause (2)
For B3 waste utilizer activities, an analysis should be made on environment
impact
Clause (3)
The analysis document on environment impact should be proposed to the
Environment Impact Control Agency Head, and the approval on these
documents should be issued/given b the Environment Impact Control Agency
Head as well.
Clause (4)
The prerequisites and obligations stated in the environment Management
plan and the environment observation plan as approved by the Environment
Impact Control Agency Head becomes the criteria and obligation that should
be stated in and by because it is inseparable from the permit as understood
in Article 21 clause (1) point a.

ASH UTILIZATION STUDY 30
V. NATURE OF SOME INDONESIAN COAL ASH AND ITS POSSIBLE
UTILIZATION
The following table presents some Indonesian coal ash characteristics
Table-8: Some Indonesian coal ash characteristics Ash Analysis by Tekmira
Coal Power Plant Paiton Suralaya Asam Asam No. Composition Unit
FA BA FA BA FA BA 1 SiO2 % 41.30 51.10 51.30 62.20 44.40 87.80 2 Al2O3 % 29.50 17.94 34.60 25.50 27.00 4.43 3 Fe2O3 % 11.55 11.95 5.11 5.25 15.84 5.47 4 TiO2 % 1.25 1.36 0.13 0.13 1.44 0.27 5 CaO % 9.13 4.78 4.48 2.37 3.49 0.15 6 MgO % 2.46 1.98 1.81 1.20 2.32 0.30 7 K2O % 1.14 2.83 0.48 0.33 0.68 0.36 8 Na2O % 1.73 1.09 0.69 0.44 0.17 0.09 9 MnO2 % 0.04 0.08 0.20 0.18 0.22 0.05 10 SO3 % 0.82 0.25 tt tt 0.67 0.09 11 P2O5 % 0.24 0.27 - - 0.11 tt 12 LOI % 0.62 6.22 0.45 2.16 3.43 0.69 13 Pb ppm 80 40 tt tt 19 7 14 Zn ppm 230 130 90 30 896 61 15 As ppm - - - - 16 Ni ppm 180 100 tt tt 29.8 1.5 17 Cr ppm 120 240 50 40 66 54 18 Co ppm 130 240 50 40 19 Cd ppm tt - 90 70 5 1 20 Cu ppm 0.009 870 - - 523 63
- Current status of ash utilization in Indonesia
Fly/bottom ash is included in the Hazardous and Poisonous Waste
category (B3) which is according to the Gov. regulation No.74/2001. Looking
at the above situation and condition, we could say that the solution towards
the availability of fly/bottom ash and its utilization related to security &
safety towards the environment should be implemented according to the
handling and management procedure for B3 waste in place, the solution that
can be implemented is as follows:

ASH UTILIZATION STUDY 31
1. Fly ash/bottom ash originating from the fluidized bed system can be
used for:
a. Anti acid cement mix
b. Ready mix for asphalt and concrete (Asphalt / Concrete filler)
c. Paving block/secondary brick mix
2. Fly ash originated form fixed bed system can be directly used for point
1.a, b, c. While the bottom ash which are still in chunks should go
through the size reduction treatment before being used for other
purposes.
The Fly ash/bottom ash produced by the fluidized bed system
measuring 100-200 mesh (1 mesh = 1 hole/inch2). This size is relatively
small and light, while the bottom ash measures 20-50 mesh. Generally, the
fly ash/bottom ash size can directly be utilized in the cement
industry/factory as a substituted for trass rock/chunks by incorporating it in
the cement mill using the pneumatic system. Aside from using it in the
cement industry, the fly/bottom ash can also be used as ready mix for
asphalt, concrete and pressed as paving blocks or secondary brick. From an
empiric study by the environment ministry, the best composition for ready
mix paving blocks are as follows:
Lime : 40%
Fly ash : 10%
Sand : 40%
Cement : 10%
Too much ash may harm the strength of concrete or paving block.
The environment issues will rise from the bottom ash using the fixed
bed or grate system. The chunks are big. The Bottom ash still contains fixed
carbon (note: fixed carbon in coal with calories of 6500-6800 kkal/kg around
41-21%). If the bottom ash is directly dumped into the environment, then
sooner or later it will turn to Methane gas (CH4) which will eventually go up
in flames or explode by itself (self burning and self exploding). On the other
hand, if the material is to be used for the cement industry, then it would

ASH UTILIZATION STUDY 32
change the feeder design, so the cement industry will not be attracted to
use bottom ash.
The cement industry needs fly ash used as a substitute for trass rocks
having the character of pozzolanic for making anti acid cement (PPC). The
use of fly ash in a typical cement factory is approximately between 4-6%
weight of raw mill.
Chemical composition of fly ash as shown in the following table is
similar to that of clay used in cement factory.
Table-9: Chemical composition of clay used in cement industry and fly ash
Chemical Composition SiO2 Al2O3 Fe2O3 CaO Na2Oeq Portland Cement Composition
20~23 3.8~5.8 2.5~3.6 63~65 0.3~0.7
Lime Stone ~4 ~2 ~2 47~55 ~2 Clay 45~80 10~30 3~10 ~5 2~6
Cement Ingredients
Silica 70~95 2~10 ~5 ~2 0.5~3.0 Coal Ash Fly Ash 40~65 10~30 3~10 5~20 0.5~2.0 Source: Japan Cement Association
Cement as the cohesive element/material has been known since Early
Egyptian era which is calcination of impure gypsum. While calcination of
lime just started at Roman times. They used the material from Naples, Italy
– the Pozzoalu region where the name Pozzolano was originated.
Portland cement is divided into 5 types: Porland Cement I to V. Each
type has its specific mixture (according to the ASTM and SII standard – see
attachment). Mixture means the difference in chemical composition and the
cement’s physics character that is formed. The chemical difference of
several number of percent of calcium, silica, aluminum and iron as the main
formula element for cement and the physics difference for instance, loss of
ignition, strength of pressure, hydration heat, etcetera.
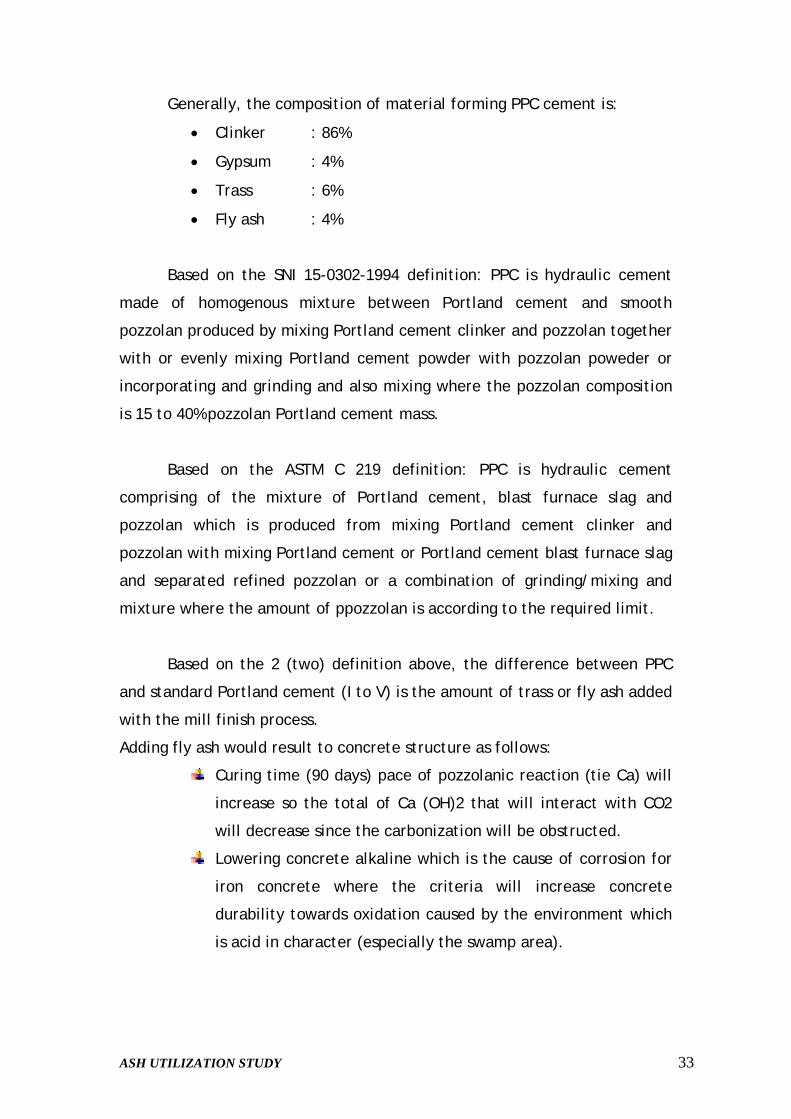
ASH UTILIZATION STUDY 33
Generally, the composition of material forming PPC cement is:
• Clinker : 86%
• Gypsum : 4%
• Trass : 6%
• Fly ash : 4%
Based on the SNI 15-0302-1994 definition: PPC is hydraulic cement
made of homogenous mixture between Portland cement and smooth
pozzolan produced by mixing Portland cement clinker and pozzolan together
with or evenly mixing Portland cement powder with pozzolan poweder or
incorporating and grinding and also mixing where the pozzolan composition
is 15 to 40% pozzolan Portland cement mass.
Based on the ASTM C 219 definition: PPC is hydraulic cement
comprising of the mixture of Portland cement, blast furnace slag and
pozzolan which is produced from mixing Portland cement clinker and
pozzolan with mixing Portland cement or Portland cement blast furnace slag
and separated refined pozzolan or a combination of grinding/mixing and
mixture where the amount of ppozzolan is according to the required limit.
Based on the 2 (two) definition above, the difference between PPC
and standard Portland cement (I to V) is the amount of trass or fly ash added
with the mill finish process.
Adding fly ash would result to concrete structure as follows:
Curing time (90 days) pace of pozzolanic reaction (tie Ca) will
increase so the total of Ca (OH)2 that will interact with CO2
will decrease since the carbonization will be obstructed.
Lowering concrete alkaline which is the cause of corrosion for
iron concrete where the criteria will increase concrete
durability towards oxidation caused by the environment which
is acid in character (especially the swamp area).

ASH UTILIZATION STUDY 34
- Possible Utilization
PT NNT Power Plant (Newmont Lesser Sunda Islands) produces around
580 tons of coal ash per month. While using coal ash that has been
processed around 25 tons per month. And for this reason, many tests using
coal ash for road pavement has been continuously conducted in the town of
Town Site that totals 300 meters of road with satisfactory results.
One road in Townsite which was constructed by utilizing fly ash from buring coal The suitability for ash utilization depends on several technical and economic
factors such as:
the chemical and physical properties of the ash;
controlled variability of the ash properties;
site specific factors, such as local land availability and local market for
building materials;
availability and quality of competing material and market structures;
availability of waste lands or marginal lands which need rehabilitation;
commercial experience in using the product.
Fly ash applications can be roughly categorized into low and high value
added applications. Their main difference is that in the latter category the
fly ash is either controlled or modified using advanced technologies,
whereas in the first predominantly raw materials are directly used. Low
value added applications mainly concern large scale use like land
reclamation, whereas high value added applications mainly refer to building

ASH UTILIZATION STUDY 35
materials. Table 10 presents an overview of available applications and
methods.
Table-10. Listing of large and small scale fly ash applications
Small scale application / building materials/high added value Cement: - Portland clinker - Portland filler - blast furnace
cement filler - slag filler - slag preparation - activated slag
cement
Concrete: - concrete mortar - plaster mortar - masonry mortar - foam concrete - dry mix - fly ash sand - concrete roads - concrete products:
flag-stone, paving stone, Kerb-stone, sewer pipe/pit, pile
Ceramics: - paving stones - bricks - roof tiles - porous tiles - polysil tiles - ceramic tiles &
paver blocks
Civil engineering applications: - asphalt filler - road
stabilization, sub-basis
- dikes - banks - industrial areas - hydraulic
engineering - road
construction: slopes, ramps, approach roads, concrete roads
Lime: - sand-lime /
calcium silicate brick
- insulation material
- cellular concrete
- gascon - masonry mortar - sewage sludge
stabilizer
FGD Gypsum: - indoor wall blocks - cardboard/fiberboard
self leveling floors retarding agent Miscellaneous: - zeolites -
Synthetic artificial gravel: - aardelite, a lime
bound artificial gravel
lytag, a sintered light weight synthetic gravel
Upgrading techniques: - calcining - sintering - wind shifting - sieving,
screening - grinding, milling - mixing, blending - drying - micronising
Large scale application/low added value - Use on agricultural land as fertilizer - Land reclamation for agriculture and forestry - Land reclamation for building - Application in large infrastructure works - Mine back filling (mine stowing) - Rehabilitation of uncontrolled landfills

ASH UTILIZATION STUDY 36
VI. POTENTIAL DEMAND OF COAL ASH
-Cement Industry
The data from the Department of Industry shows that national
cement production in 2004 reached 33 million tons while domestic
consumption totaled 29.3 tons. The 2005 consumption reached 32.2 million
tons. The needs are still lower than the national cement production capacity
that reached 47.49 million tons.
Table-11 below shows Indonesian cement production and the production
capacity in year 2004 (Source : Indonesia Cement Association)
No. Industry Name
Location Operation Since
Plant Design Capacity (103 Tons/Yr)
Cement Production (2004) (103 Tons/Yr)
Coal annual Consumption (103 Ton)
1 PT Semen Andalas Indonesia
Lhok Nga, Aceh
1982 1,400 1,236 185
2 PT Semen Padang
Indarung, West Sumatra
1910 5,440 4,600 454
3 PT Semen Baturadja
Baturaja, South Sumatera
1980 1,250 914 129
4 PT Indocement Tunggal Prakasa
Citeureup, West Java
1975 15,650 10,232 1,939
5 PT Semen Cibinong
Narogong, West Java
1975 9,700 5,410 812
6 PT Semen Gresik
Gresik, East Java
1957 8,200 7,193 1,064
7 PT Semen Tonasa
Pangkep, South Sulawesi
1968 3,480 2,419 784
8 PT Semen Bosowa Maros
Maros, South Sulawesi
1999 1,800 1,132 170
9 PT Semen Kupang
Kupang, East Nusa tenggara
1984 570 92 -
TOTAL 47,490
33,228 5,537

ASH UTILIZATION STUDY 37
Table-12: Indonesia Cement Specification
No. Type Production (%)
Fly Ash (%)
1 Portland Cement Type 1 (OPC) 70 0 2 Portland Composite Cement
(PCC), 5% limestone 15 15
3 Portland Pozzolan Cement (PPC) 15 10 4 Fly Ash Cement (if Ash is
Available) 0 40
Note: Total cement production is 32.2 million Tons in year 2005 From the above table we can see that PCC and PPC cement
production total 9.9 tons in 2005, while potential fly ash is utilized for
cement production of the PCC and PPC type which totals 2.48 tons.
The data from the Chemical, Agro and Forest Yield Directorate
General – Department of Industry assumes that average cement growth is
10%/year, therefore, the need for cement in year 2010 would rise to 52
million tons. This would mean the need for fly ash would increase to 3.9
million tons.
1.66
1.55
2 2.48
2.2
3.9
00.5
11.5
22.5
33.5
4(Mill. Ton)
2000 2005 2010
Ash Supply & Demand
SupplyDemand
One of the most profitable characteristic and component of fly ash is
its similarity to zeolite. The main component of coal fly ash is mullite
(3AI2O-3.2SiO2), quartz (SiO2), hematite (Fe2O3), magnetite (Fe3O4). Apart
from the minerals mentioned, we also find other minerals but to a smaller
amount, which enables fly ash to be the basic material of zeolite, which is a
porous material that can be used for many things; which among others are

ASH UTILIZATION STUDY 38
absorbent, as an ion replacement, molecule strainer, filler, fertilizer mix as
a release agent, catalyst as well as a catalyst culture.
-Infrastructure
Fly ash is also beneficial for Material Admixture for concrete
(concrete mix). Base on date from the Department of Public Works Year
2006, the national road network totals 34,506.5 Km.
Table-13: NATIONAL ROAD CONDITION 2006
NATIONAL ROAD CONDITION 2006 ( STATUS PER 1 JANUARY 2006 ) BASED ON IRI CRITERIA
ROAD CONDITION No Island /
Nasional Road
length (KM) Very good Good Moderate Not
good Minor
damage Severely damage
1 Sumatra 10,588.9 9,352.9 5,309.4 4,043.5 1,236.1 734.6 501.42 Java 4,996.7 4,676.7 2,886.9 1,789.8 320.1 237.8 82.2
3 Bali & Nusa Tenggara 2,376.5 2,032.2 1,244.5 787.7 344.3 298.1 46.2
4 Kalimantan 5,706.0 3,770.8 2,501.2 1,269.6 1,935.1 541.9 1,393.25 Sulawesi 7,091.5 5,822.4 3,699.2 2,123.2 1,269.1 610.5 658.6
6 Maluku & Maluku Utara 1,443.7 825.6 644.2 181.4 618.1 201.0 417.1
7 Papua 2,303.2 880.4 549.9 330.5 1,422.8 343.6 1,079.2Indonesia 34,506.5 27,360.916,835.4 10,525.5 7,145.5 2,967.6 4,178.0 Source: Directorate General Bina Marga-Department of Public Work
Notes: excluded Jakarta
According to the above data, severely damaged roads replaced with
material using concrete admixture, and assuming that 10% of fly/bottom ash
is mixed into this material, then approximately 250.68 m3 of fly/bottom ash
is needed for a road 6 meters long. This need will increase if the roads in
the provinces are also calculated.

ASH UTILIZATION STUDY 39
0
2000
4000
6000
8000
10000
12000
Road length (km)
LENGTH OF THE NATIONAL ROAD 2006 (KM)
SumatraJavaBali&NTKalimantanSulawesiMalukuPapua
The table 14 below shows the development of national roads and provinces
2000-2004:
Table-14: Data of roads Nationwide, Province and its development
National Province No
Province
2000 (Km)
2004 (Km)
Average Road
develop ment
Per year (%)
2000 (Km)
2004 (Km)
Average Road
develop ment
Per year (%)
(1) (2) (3) (4) (5) (6) (7) (8) 1 Nanggroe Aceh D 1,144.02 1,782.78 11.73 1,701.82 1,701.82 0.00 2 North Sumatra 1,305.96 2,098.05 12.58 2,919.72 2,752.50 -1.46 3 West Sumatra 871.95 1,200.09 8.31 1,288.41 1,130.73 -3.21 4 Riau 838.56 1,126.11 7.65 2.162.82 1,795.92 -4.54 5 Jambi 853.27 820.40 -0.98 1,566.68 1,525.40 -0.67 6 Bengkulu 1,006.95 1,290.24 6.39 1,624.99 1,621.33 -0.06 7 South Sumatra 750.43 736.44 -0.47 1,500.29 1,356.57 -2.49 8 Lampung 851.26 1,004.16 4.22 2,369.97 2,355.09 -0.16 9 Bangka Belitung 0,00 530.65 #REFI 912.59 511.48 -13.48 10 DKI Jakarta 153.50 122.38 -5.51 1,328.99 1,124.51 -4.09 11 West Java 1,062.22 1,140.69 1.80 1,994.41 2,141.23 1.79 12 Central Java 1,215.46 1,297.63 1.65 2,525.55 2,550.21 0.24 13 D.I. Yogyakarta 158.34 168.81 1.61 690.25 690.25 0.00 14 East Java 1,783.49 1,899.21 1.58 1,439.18 1,439.18 0.00 15 Banten 0.00 490.40 #REFI 456.43 372.25 -4.97 16 Bali 405.93 501.64 5.44 673.40 839.88 5.68 17 Nusa Tenggara
Barat 541.22
601.83 2.69 1,763.61 1,416.41 -5.33 18 Nusa Tenggara
Timur 1,121.85
1,273.02 3.21 2,939.86 2,626.92 -2.77
10,500.9
4,996.7
7,091.5
2,303.2
5,706.0
1,443.7
2,376.5

ASH UTILIZATION STUDY 40
19 West Kalimantan 1,006.62 1,575.32 11.85 1,788.96 627.64 -23.04 20 Central Kalimantan 1,707.53 1,714.95 0.11 1,059.26 771.56 -7.62 21 South Kalimantan 864.07 876.00 0.34 1,056.38 898.14 -3.98 22 East Kalimantan 1,226.21 1,539.70 5.86 1,640.07 1,442.07 -3.17 23 North Sulawesi 1,360.39 1,267.39 -1.75 1,310.52 740.57 -13.30 24 Central Sulawesi 1,592.99 1,806.46 3.19 2,037.06 1,976.81 -0.75 25 South Sulawesi 1,669.57 2,107.54 6.00 1,618.51 1,486.47 -2.11 26
South East Sulawesi 612.60
1,293.87 20.55 1,487.36
488.80 -24.29 27 Gorontalo 0.00 616.24 #REFI 468.22 284.22 -11.73 28 Maluku 464.68 985.46 20.68 1,611.87 997.7 -11.30 29 North Maluku 0.00 458.21 #REFI 688.93 586.74 -3.93 30 Papua 1,701.96 2,303.16 7.86 1,872.60 1,872.60 0.00
26,271.03 34,628.83
7.15 46,498.7
1 40,125.02
-3.62
SOURCE : - Length of National Road (2000): based on Kepmen PU No. 236A/KPTS/1997 - Length of National Road (2004): based on Kepmen Kimpraswil No. 376A/KPTS/2004 NOTES : Symbol #REFI: data is not available/the province was not exist yet and data in collumms 5 & 8 were from the Balai Literal Pusdatin
The data above shows estimation for 2010, where an additional of
2,475.96 km of roads is needed nationwide, with the assumption of road
construction using concrete admixture and 10% fly/bottom ash mix,
therefore, the need for fly/bottom ash will reach up to 148. 55 m3 for
additional road length of 6 meters.
This table below shows the percentage of type of road surface in
Indonesia for year 2000:
Table-15: Type of National Road Network
National Road Provincial Road Regency Road Island Asphalt
(%) Not
Aspal (%)
Total (%)
Asphalt (%)
Not Asphalt
(%) Total(%)
Asphalt (%)
Not Asphalt
(%) Total(%)
Sumatra 99,60 0,40 100 88,80 11,20 100 36,86 63,14 100Java 100 0 100 99,40 0,60 100 61,05 38,95 100Kalimantan 64,10 35,90 100 73,20 26,80 100 39,46 60,54 100Sulawesi 93,80 6,20 100 91,10 8,90 100 39,57 60,43 100Irian 41,40 58,60 100 65,50 34,50 100 17,34 82,66 100Others 98 2 100 84,42 15,58 100 39,36 60,64 100Indonesia 88,30 11,70 100 88,20 11,80 100 43,09 56,91 100
Source : IIRMA data year 2000

ASH UTILIZATION STUDY 41
Assuming that the national and provincial roads are not yet using
asphalt and concrete admix with 10% fly/bottom ash mix will be used, then
the need for fly/bottom ash would total 513.02 m3 for additional road
length of 6 meters.
-Agriculture
Up till now, coal ash has been significantly used for cement and
concrete industries, fillers for mining material and digging material as well
as other things. One of the benefits of coal ash which is being studied by
TekMIRA is to treat tailing soil originating from gold producing activities in
West Java. Tailing has characterization as basic compound and contains
several heavy metals. By adding fly ash to the tailing soil, it would
neutralize the heavy metal contents in soil. Eventually, the neutralized land
can be used for plantation or agricultural estate.
-Land application with fly ash use as fertilizer
This type of application is considered an attractive alternative for disposal
of fly ash compared to the current procedure of disposal. However, concern
of trace element contamination has been one factor that has limited
widespread land application. Another major limiting factor is the lack of
macro nutrients (notably nitrogen) in the ash, which is consequently of little
agronomic value. However, several studies has shown that the mixing of fly
ash with an organic waste product such as paper mill water, sewage sludge
or poultry litter can produce a balanced soil amendment with equivalent
nutrient availability to conventional fertilizers. Moreover, addition of fly ash
improves the water holding capacity and the structure of the soil.
-Land reclamation for forestry and agricultural development by covering
the soil with a fly ash layer.
Recent studies have revealed that fly ash is very similar to volcanic ash from
a morphological, physical and chemical point of view. Given enough time,
both ash types are predisposed to transform into a fertile soil. This
'naturalization process' is enhanced by the action of vegetation. If properly

ASH UTILIZATION STUDY 42
exploited and managed, these unique properties make fly ash a potential
resource for forestry and agriculture. This last point is of special importance
because some of the largest producers of coal fly ash (e.g. India and China)
have the greatest need for fertile soil and renewable energy.
-Land reclamation for developing building areas.
Building areas require consolidated soils. Advanced pumping systems are
now available which are able to transport low moisture fly ash over large
distances. Application of low moisture fly ash provides stable consolidated
soils in a relative short period of time.
-Mine back filling
Mine back filling has demonstrated to be an attractive option for those
plants located near the coal mine. Back filling of underground mines is
technically vulnerable and especially holds good potentials for those areas
where sand is scarce. Open cast mine filling can again be considered as land
reclamation.

ASH UTILIZATION STUDY 43
VII. ASH UTILIZATION STANDARD
The table 16 below shows data of fly/bottom ash utilization in Japan
in year 2000, the source is form the Japan Coal Energy Center (JCOAL).
Road Construction Material
Agriculture Use
Cement (Clay Alternative)
Concrete Filler
Concrete Slurry
Concrete for tunnel
Asphalt Filler
Soil Improvement
Road Construction
Soil Water improvement
Agriculture Soil Improvement
Brick
Secondary Concrete Brick
Bottom
Coal Ash
Fly Ash
Road Construction Material
Agriculture Use
Cement (Clay Alternative)
Concrete Filler
Concrete Slurry
Concrete for tunnel
Asphalt Filler
Soil Improvement
Road Construction
Soil Water improvement
Agriculture Soil Improvement
Brick
Secondary Concrete Brick
Bottom Ash
Coal Ash
Fly Ash
Road Construction Material
Agriculture Use
Cement (Clay Alternative)
Concrete Filler
Concrete Slurry
Concrete for tunnel
Asphalt Filler
Soil Improvement
Road Construction
Soil Water improvement
Agriculture Soil Improvement
Brick
Secondary Concrete Brick
Bottom Ash
Coal Ash
Fly Ash
Road Construction Material
Agriculture Use
Cement (Clay Alternative)
Concrete Filler
Concrete Slurry
Concrete for tunnel
Asphalt Filler
Soil Improvement
Road Construction
Soil Water improvement
Agriculture Soil Improvement
Brick
Secondary Concrete Brick
Bottom Ash
Coal Ash
Fly Ash
Road Construction Material
Agriculture Use
Cement (Clay Alternative)
Concrete Filler
Concrete Slurry
Concrete for tunnel
Asphalt Filler
Soil Improvement
Road Construction
Soil Water improvement
Agriculture Soil Improvement
Brick
Secondary Concrete Brick
Bottom Ash
Coal Ash
Fly Ash
Road Construction Material
Agriculture Use
Cement (Clay Alternative)
Concrete Filler
Concrete Slurry
Concrete for tunnel
Asphalt Filler
Soil Improvement
Road Construction
Soil Water improvement
Agriculture Soil Improvement
Brick
Secondary Concrete Brick
Bottom Ash
Coal Ash
Fly Ash
Road Construction Material
Agriculture Use
Cement (Clay Alternative)
Concrete Filler
Concrete Slurry
Concrete for tunnel
Asphalt Filler
Soil Improvement
Road Construction
Soil Water improvement
Agriculture Soil Improvement
Brick
Secondary Concrete Brick
Bottom Ash
Coal Ash
Fly Ash
Road Construction Material
Agriculture Use
Cement (Clay Alternative)
Concrete Filler
Concrete Slurry
Concrete for tunnel
Asphalt Filler
Soil Improvement
Road Construction
Soil Water improvement
Agriculture Soil Improvement
Brick
Secondary Concrete Brick
Bottom Ash
Coal Ash
Fly Ash
Road Construction Material
Agriculture Use
Cement (Clay Alternative)
Concrete Filler
Concrete Slurry
Concrete for tunnel
Asphalt Filler
Soil Improvement
Road Construction
Soil Water improvement
Agriculture Soil Improvement
Brick
Secondary Concrete Brick
Bottom Ash
Coal Ash
Fly Ash

ASH UTILIZATION STUDY 44
Table-16: Effective coal ash utilization in Japan by sector in fiscal 2000
(Unit: thousand tons)
Item Electric power utilities General industries Total Sector Contents Amount Ratio(%) Amount Ratio(%) Amount Ratio(%)
Cement Raw material 3,042 61.68 1,333 66.68 4,375 63.12 Admixture 189 3.83 185 9.25 374 5.4 Ready mixed 87 1.76 57 2.85 144 2.08 total 3,318 67.27 1,575 78.79 4,893 70.6Public works Soil treatment 96 1.95 45 2.25 141 2.03 Public works 121 2.45 24 1.2 145 2.09 Public works
for electric power
26 0.53 0 0 26 0.38
Sub-grade stabilization
65 1.32 31 1.55 96 1.39
Asphalt filler 3 0.06 0 0 3 0.04 Backfilling in
coal mines 291 5.9 0 0 291 4.2
Total 602 12.21 100 5 702 10.13Construction works
Construction board
198 4.01 109 5.45 307 4.43
Lightweight aggregate
28 0.57 0 0 28 0.4
Concrete product
27 0.55 2 0.1 29 0.42
Others 0 0 0 0 0 0 Total 0 0 0 0 0 0Agriculture, forestry & fisheries
Fertilizer 41 0.83 2 0.1 43 0.62
Soil improvement
9 0.18 70 3.5 79 1.14
Thawing material
0 0 22 1.1 22 0.32
Total 50 1.01 94 4.7 144 2.08 Sewage 2 0.04 1 0.05 3 0.04 Iron
manufacture 1 0.02 2 0.1 6 0.04
Others 706 14.31 116 5.8 822 11.86 Total 709 14.38 119 5.95 828 11.95Grand total 4,932 100 1,999 100 6,931 100
- Ash Mix Standard
Table of Indonesia Cement Specification Standard (source: Tonasa Cement,
Indocement)
Table-17: Cement Specification according to Indonesia Standard No. Type Production (%) Fly Ash (%)
1 Portland Cement Type 1 (OPC) 70 0 2 Portland Composite Cement (PCC),
5% limestone 15 15
3 Portland Pozzolan Cement (PPC) 15 10 4 Fly Ash Cement (if Ash is Available) 0 40 Source : Tonasa Cement, Indocement
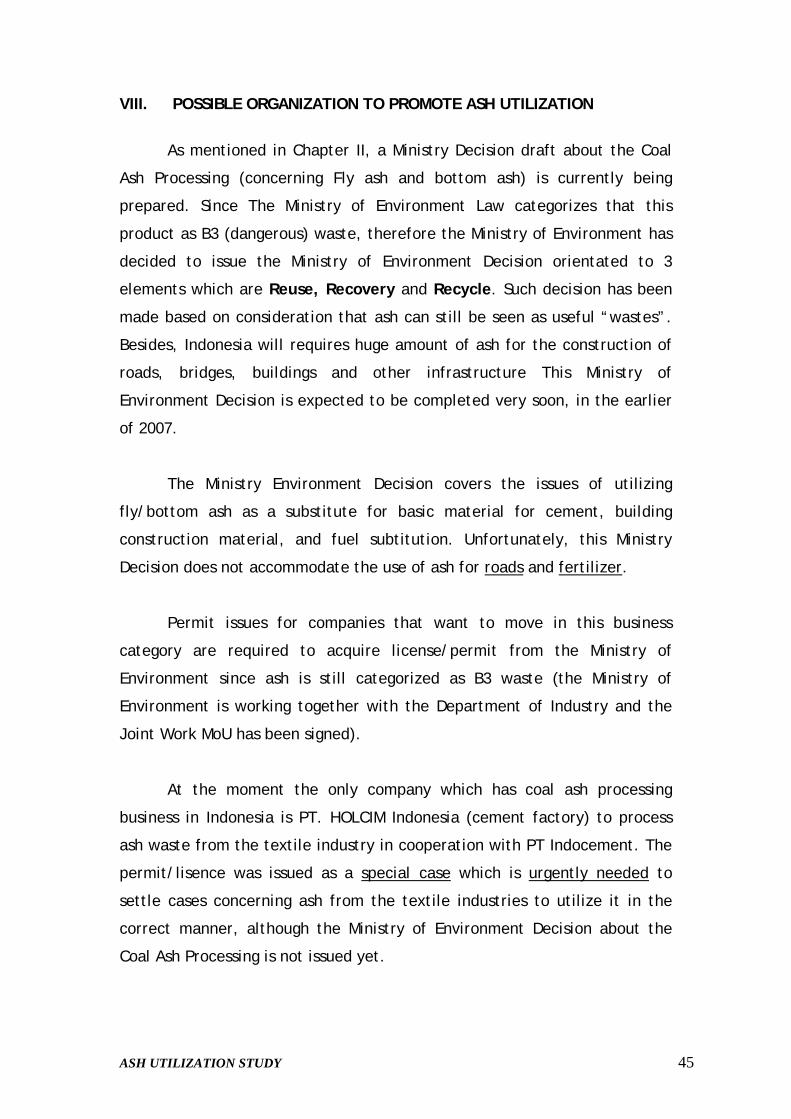
ASH UTILIZATION STUDY 45
VIII. POSSIBLE ORGANIZATION TO PROMOTE ASH UTILIZATION
As mentioned in Chapter II, a Ministry Decision draft about the Coal
Ash Processing (concerning Fly ash and bottom ash) is currently being
prepared. Since The Ministry of Environment Law categorizes that this
product as B3 (dangerous) waste, therefore the Ministry of Environment has
decided to issue the Ministry of Environment Decision orientated to 3
elements which are Reuse, Recovery and Recycle. Such decision has been
made based on consideration that ash can still be seen as useful “wastes”.
Besides, Indonesia will requires huge amount of ash for the construction of
roads, bridges, buildings and other infrastructure This Ministry of
Environment Decision is expected to be completed very soon, in the earlier
of 2007.
The Ministry Environment Decision covers the issues of utilizing
fly/bottom ash as a substitute for basic material for cement, building
construction material, and fuel subtitution. Unfortunately, this Ministry
Decision does not accommodate the use of ash for roads and fertilizer.
Permit issues for companies that want to move in this business
category are required to acquire license/permit from the Ministry of
Environment since ash is still categorized as B3 waste (the Ministry of
Environment is working together with the Department of Industry and the
Joint Work MoU has been signed).
At the moment the only company which has coal ash processing
business in Indonesia is PT. HOLCIM Indonesia (cement factory) to process
ash waste from the textile industry in cooperation with PT Indocement. The
permit/lisence was issued as a special case which is urgently needed to
settle cases concerning ash from the textile industries to utilize it in the
correct manner, although the Ministry of Environment Decision about the
Coal Ash Processing is not issued yet.
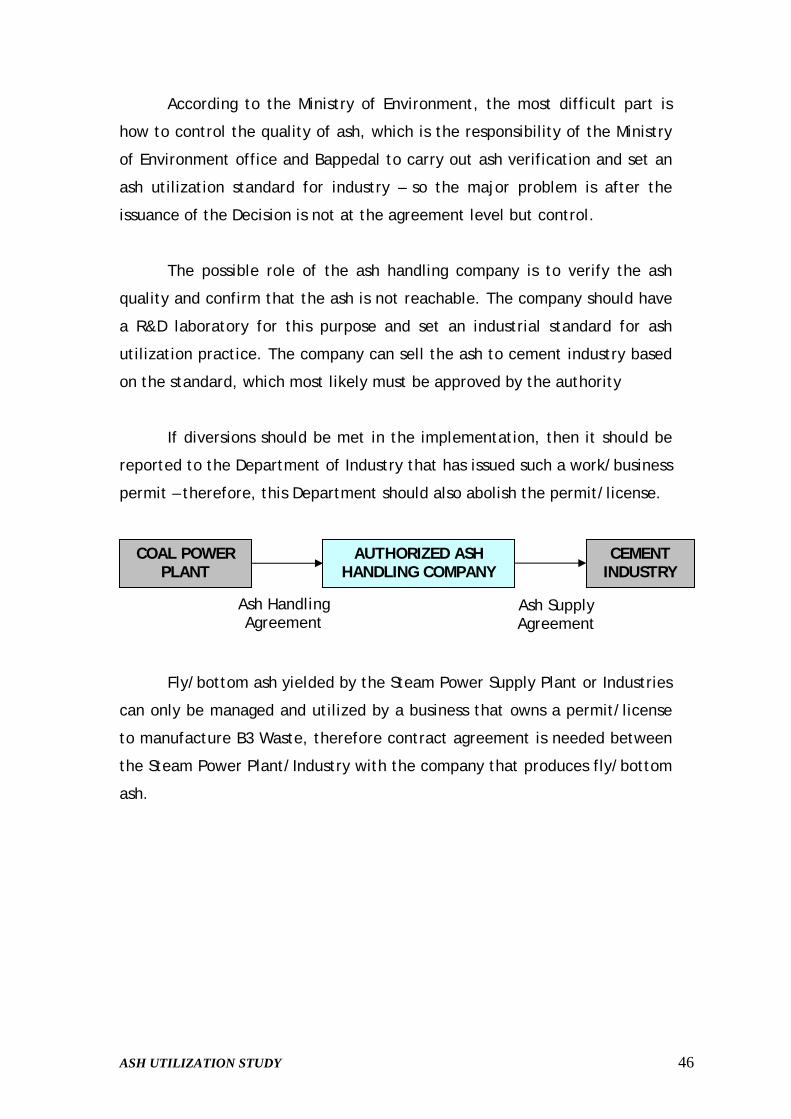
ASH UTILIZATION STUDY 46
According to the Ministry of Environment, the most difficult part is
how to control the quality of ash, which is the responsibility of the Ministry
of Environment office and Bappedal to carry out ash verification and set an
ash utilization standard for industry – so the major problem is after the
issuance of the Decision is not at the agreement level but control.
The possible role of the ash handling company is to verify the ash
quality and confirm that the ash is not reachable. The company should have
a R&D laboratory for this purpose and set an industrial standard for ash
utilization practice. The company can sell the ash to cement industry based
on the standard, which most likely must be approved by the authority
If diversions should be met in the implementation, then it should be
reported to the Department of Industry that has issued such a work/business
permit – therefore, this Department should also abolish the permit/license.
Fly/bottom ash yielded by the Steam Power Supply Plant or Industries
can only be managed and utilized by a business that owns a permit/license
to manufacture B3 Waste, therefore contract agreement is needed between
the Steam Power Plant/Industry with the company that produces fly/bottom
ash.
COAL POWER PLANT
AUTHORIZED ASH HANDLING COMPANY
CEMENT INDUSTRY
Ash Handling Agreement
Ash Supply Agreement

ASH UTILIZATION STUDY 47
ATTACHMENT 1
PERMIT APPLICATION FORM TO MANUFACTURE B3 WASTE
No…. To the Ministry of Environment
Attachment…. JAKARTA
Subject…..
With this letter we would like to apply a permit/license to
stock/collect/operate equipment to manufacture/stock end result)* of B3
Waste with the following data:
I. DEFINITION OF APPLICATION:
1.Application
a. Name of applicator/authorized person:
b. Address
c. Phone/Fax
2. Company
a. Name of applicator/authorized person:
b. Address
c. Phone/Fax
d. Type of business
e. Establishment Notary Act
f. Principle Agreement No.
g.Tax No.
h..Permits/license already acquired (location, Construction, HO and AMDAL)
II. LOCATION DEFINITION
1.Width
2.Location
3.Village
4.Subdistrict

ASH UTILIZATION STUDY 48
5.Regency/Manucipality
6.Province
III. B3 WASTE MANAGEMENT DEFINITION
1.Type of manufacture:
(stocking/ collecting/ processing and piling
end result)*
2.Specification of processor and equipment used
3.Amount, character of Waste being stocked/collected/processed/piled
4.Channel/pipe structure of B3 Waste Management
5.Prevention equipment for pollution of liquid waste and emission
6.Systems equipment for emergency cases
IV. PERMIT APPLICATION DOCUMENTS FOR THE MINISTRY OF
ENVIRONMENT
1.Company Establishment Notary Act
2.Location permit
3.Construction permit
4.HO Permit
5. AMDAL approval
6.Location activity map
7.Definiton on raw materials and activity process
8.Definition on waste Management equipment
9.Definition on number and character of B3 waste
Jakarta,………………..2007
Name and signature of applicator
Stamp duty
Copy to:…..
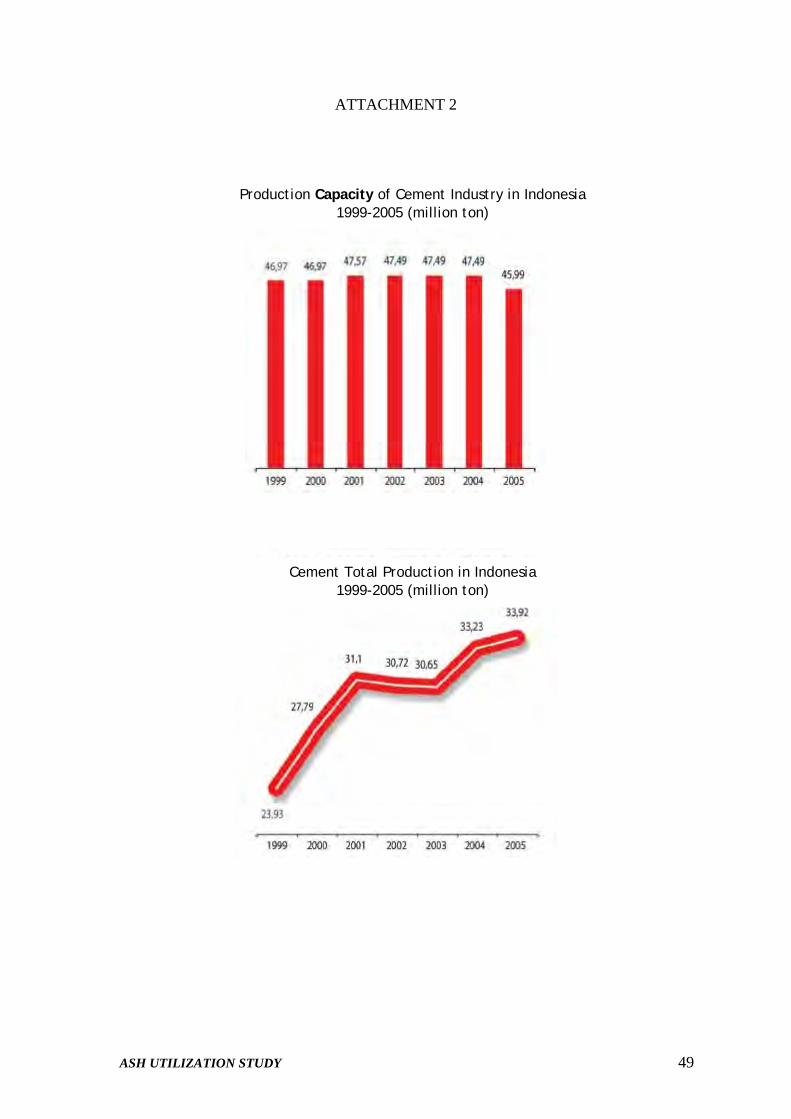
ASH UTILIZATION STUDY 49
ATTACHMENT 2
Production Capacity of Cement Industry in Indonesia 1999-2005 (million ton)
Cement Total Production in Indonesia 1999-2005 (million ton)

ASH UTILIZATION STUDY 50
Cement Consumption in Indonesia 1999-2005 (million ton)
Indonesia Cement Export 1999-2005 (million ton)

ASH UTILIZATION STUDY 51
Production Real of Cement Factory in 2005 (Million ton)
Total Sales of Indonesia Cement Factories In 2005 (million ton)
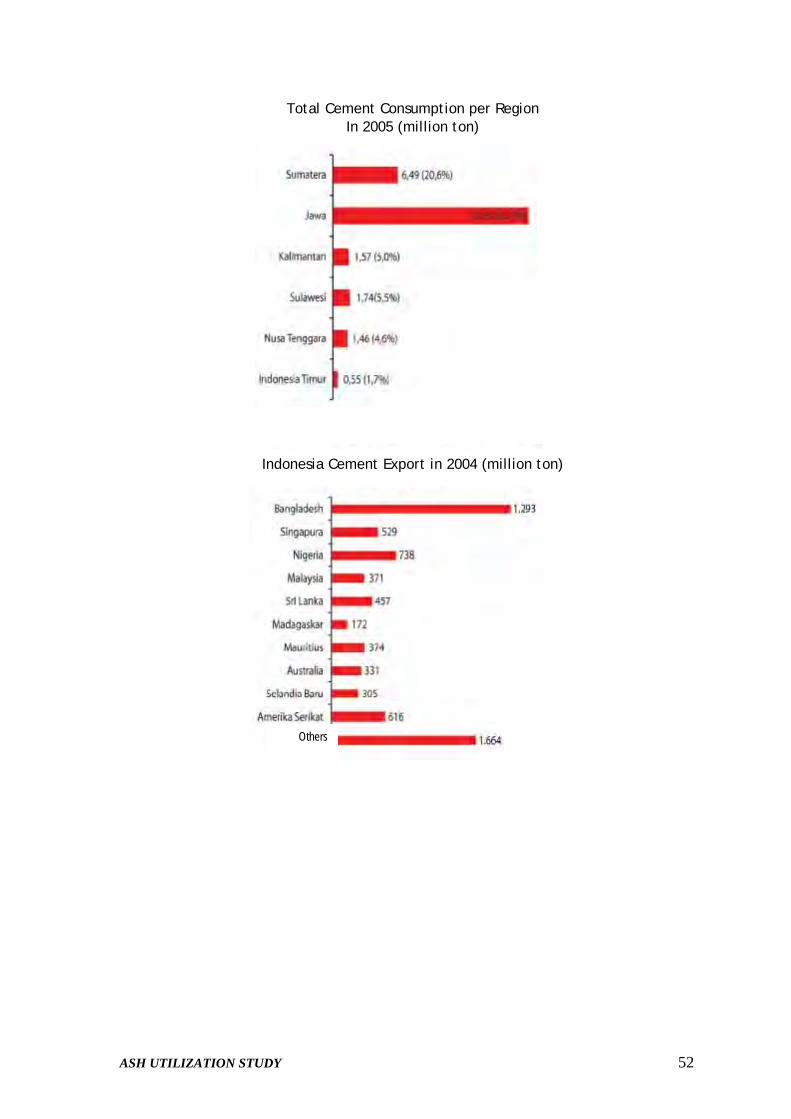
ASH UTILIZATION STUDY 52
Total Cement Consumption per Region In 2005 (million ton)
Indonesia Cement Export in 2004 (million ton)
Others
Attachment 2
Environmental and Social Considerations
for
Construction of the Power Plant
i
CONTENTS
CONTENTS............................................................................................................................... i
LIST of TABLES .................................................................................................................... iii
LIST of FIGURES................................................................................................................... iv
Chapter 1 Environmental and Social Considerations........................................................... 1
1.1 BACKGROUND ................................................................................................................................ 1 1.2 AMDAL SCHEDULE....................................................................................................................... 1 1.3 LEGISLATIONS AND STANDARD REGULATIONS .............................................................................. 1
1.3.1 Legislations ........................................................................................................................... 1 1.3.2 Government Regulations ....................................................................................................... 2 1.3.3 Ministerial Decrees................................................................................................................ 2 1.3.4 Decrees of the Head of Environmental Impact Control Agency (BAPEDAL) ..................... 3 1.3.5 Decree of Director General of Electricity.............................................................................. 3 1.3.6 Decrees of the Governor of East Kalimantan ........................................................................ 3
Chapter 2 SCOPE of EIA STUDY ......................................................................................... 4
2.1 THE EXTENSIVE AND SIGNIFICANT IMPACTS.................................................................................. 4 2.2 THE AREA OF EIA STUDY .............................................................................................................. 4
2.2.1 Project Boundary ................................................................................................................... 4 2.2.2 Social Boundary .................................................................................................................... 4 2.2.3 Ecological Boundary ............................................................................................................. 4 2.2.4 Administrative Boundary ...................................................................................................... 4
Chapter 3 METHODS of EIA STUDY .................................................................................. 6
3.1 METHODS OF DATA COLLECTION AND ANALYSIS.......................................................................... 6 3.2 CLIMATE, AIR QUALITY AND NOISE............................................................................................... 8
3.2.1 Climate .................................................................................................................................. 8 3.2.2 Air Quality............................................................................................................................. 8 3.2.3 Noise...................................................................................................................................... 8 3.2.4 Physiography and Geology.................................................................................................... 8 3.2.5 Space, Land and Soil ............................................................................................................. 9
3.3 BIOLOGICAL RESOURCES ............................................................................................................... 9 3.3.1 Flora....................................................................................................................................... 9 3.3.2 Fauna ................................................................................................................................... 10 3.3.3 Aquatic Biota....................................................................................................................... 10
3.4 SOCIETY, ECONOMY AND CULTURE ............................................................................................. 11 3.4.1 Public Health ....................................................................................................................... 11
3.5 EXTENSIVE AND SIGNIFICANT IMPACT ASSESSMENT METHOD .................................................... 11 3.5.1 Air Quality........................................................................................................................... 11 3.5.2 Noise.................................................................................................................................... 11 3.5.3 Water Quality ...................................................................................................................... 11 3.5.4 Electric Field and Magnetic Field Induction ....................................................................... 11

ii
Chapter 4 INITIAL ENVIRONMENTAL SETTING........................................................ 12
4.1 PHYSIO-CHEMICAL....................................................................................................................... 12 4.1.1 Climate ................................................................................................................................ 12 4.1.2 Air Quality........................................................................................................................... 13 4.1.3 Hydrology (Water Resources) ............................................................................................. 14
4.2 PHYSICAL CHARACTERISTICS ....................................................................................................... 15 4.2.2 Chemical characteristics ...................................................................................................... 16 4.2.3 Space and Land.................................................................................................................... 17
4.3 BIOLOGY (BIOLOGICAL RESOURCES) ........................................................................................... 17 4.3.1 Terrestrial Flora ................................................................................................................... 18 4.3.2 Terrestrial Fauna.................................................................................................................. 20 4.3.3 Aquatic Biota....................................................................................................................... 22
4.4 SOCIETY, ECONOMY AND CULTURE ............................................................................................. 24 4.4.1 General Description of the Study Area................................................................................ 24 4.4.2 RESPONDENT’S INCOME LEVEL ................................................................................. 27 4.4.3 Local Traditions................................................................................................................... 28 4.4.4 Social Processes................................................................................................................... 28 4.4.5 COMMUNITY’S PERCEPTIONS ..................................................................................... 28
4.5 PUBLIC HEALTH ........................................................................................................................... 29
Chapter 5 ASSESSMENT OF EXTENSIVE AND SIGNIFICANT IMPACTS.............. 31
5.1 PRE-CONSTRUCTION STAGE......................................................................................................... 31 5.2 CONSTRUCTION STAGE ................................................................................................................ 31 5.3 OPERATIONAL STAGE (POST CONSTRUCTION) ............................................................................. 31 5.4 POST-OPERATIONAL STAGE ......................................................................................................... 31
Chapter 6 EVALUATION OF EXTENSIVE AND SIGNIFICANT IMPACTS ............. 36
6.1 ANALYSIS OF EXTENSIVE AND SIGNIFICANT IMPACTS ................................................................. 36 6.1.1 Pre-Construction Stage ........................................................................................................ 36 6.1.2 Construction Stage............................................................................................................... 41 6.1.3 Operation Stage (Post-Construction Stage) ......................................................................... 50 6.1.4 Post-Operation Stage ........................................................................................................... 56
6.2 IMPACT ANALYSIS FOR ENVIRONMENTAL MANAGEMENT AND MONITORING.............................. 57 6.2.1 Environmental Component – Air Quality............................................................................ 57 6.2.2 Environmental Component – Noise..................................................................................... 57 6.2.3 Environmental Component – Water Resources and Quality ............................................... 57 6.2.4 Environmental Component – Space, Land and Soil ............................................................ 58 6.2.5 Environmental Component – Flora and Fauna .................................................................... 58 6.2.6 Environmental Component – Socio-Economic ................................................................... 59 6.2.7 Environmental Component – Socio-Cultural ...................................................................... 59 6.2.8 Environmental Component – Public Health ........................................................................ 59
Chapter 7 STAKEHOLDER MEETINGS .......................................................................... 60
7.1 THE OBJECTIVE OF THE STAKEHOLDER MEETINGS ........................................................................ 60 7.2 PUBLIC CONSULTANCY ................................................................................................................ 60
7.2.1 Loa Duri Ulu Village........................................................................................................... 60 7.2.2 Sungai Kunjang ................................................................................................................... 60
iii
LIST of TABLES
Table 1-1 AMDAL Schedule..................................................................................................... 1 Table 2-1 Matrix of Impact Interaction...................................................................................... 5 Table 3-1 Number of Samples and Consideration of Sampling Locations ............................... 6 Table 4-1 Condition of some climate elements........................................................................ 13 Table 4-2 Results of Air Quality Measurements...................................................................... 14 Table 4-3 Results of Water Quality Measurements ................................................................. 15 Table 4-4 Land-Uses in Kutai Kartanegara Regency............................................................... 17 Table 4-5 Type of Vegetation in Secondary Forests................................................................ 18 Table 4-6 Plant Species Found in the planned Project Site and Surrounds.............................. 19 Table 4-7 Diversity of Wildlife Species in the planned Project Site........................................ 21 Table 4-8 Results of Plankton Sampling.................................................................................. 23 Table 4-9 Results of Benthos Sampling................................................................................... 24 Table 4-10 Population of Loa Duri Ulu Village ...................................................................... 24 Table 4-11 Population according to age-group ........................................................................ 25 Table 4-12 Livelihoods ............................................................................................................ 25 Table 4-13 Population according to religion............................................................................ 25 Table 4-14 Population according to education level ................................................................ 26 Table 4-15 Education facilities ................................................................................................ 26 Table 4-16 Health facilities ...................................................................................................... 26 Table 4-17 Population growth.................................................................................................. 26 Table 4-18 Number of transportation vehicle in the village (2006)......................................... 27 Table 4-19 Respondents’ identity ............................................................................................ 27 Table 4-20 Income of community members ............................................................................ 28 Table 4-21 Community’s attitudes of the construction of power plant.................................... 29 Table 4-22 Benefits of the planned activity according to the respondents............................... 29 Table 4-23 Most frequent illness suffered by the respondent’s family members .................... 29 Table 4-24 Respondent’s toilet ................................................................................................ 30 Table 4-25 Respondent’s treatment of rubbish ........................................................................ 30 Table 4-26 Source of water for cooking................................................................................... 30 Table 4-27 Medication method when member of the family get sick...................................... 30 Table 5-1 Matrix Impact Interaction on Preconstruction Phase............................................... 32 Table 5-2 Matrix Impact Interaction on Construction Phase ................................................... 33 Table 5-3 Matrix Impact Interaction on Operational Phase ..................................................... 35 Table 6-1 Matrix Interaction of Extensive and Significant Impact on Preconstruction Phase. 40 Table 6-2 Matrix Interaction of Extensive and Significant Impact on Construction Phase .... 48 Table 6-3 Matrix Interaction of Extensive and Significant Impact on Operational Phase...... 55 Table 7-1 Attendees of public consultancy .............................................................................. 61

iv
LIST of FIGURES
Figure 3-1 Sampling Locations.................................................................................................. 7

EiA for Mahakam Coal-Fired Power Plant Project
1
Chapter 1 Environmental and Social Considerations
1.1 Background
In the JICA development study "The Master Plan Study on Pollution Risk Mitigation Program for Sustainable Coal Mine Development in East Kalimantan Province in the Republic of Indonesia", an IEE was executed the construction of the coal power plant to use the unsalable coal effectively was assumed was proposed. The implementation of AMDAL is described in the specification of the JICA study. However, AMDAL in the law of Indonesia is an EIA. The IEE study was implemented in this study because there is no project owner and this is a masterplan study. The preliminary AMDAL study is referred as "AMDAL" in this chapter.
1.2 AMDAL Schedule
Table 1-1 AMDAL Schedule
Stakeholder Meeting (AUDIENSI)ScopingAMDAL Study
Collection & Analysis of Secondary dataCollection & Analysis of Primary dataPublic Hearing
Stakeholder Meeting (Public Consultansi)Evaluation of Environmental ImpactsDraft Final ReportWorkshop (Jakarta & Samarinda)Final Report
2
Study of Legislations & Standard Regulations forAMDAL Study
Activities2006 2007
8 9 10 11 12 1
1.3 Legislations and Standard Regulations
This preliminary EIA study is backed up by the following legislations and regulations:
1.3.1 Legislations
Republic of Indonesia Law Number 5 Year 1960 on Basic Regulations of Agrarian Principles. Republic of Indonesia Law Number 6 Year 1968 in-conjunction with Law Number 12 Year 1970 on Domestic Capital Investment (PMDN) Republic of Indonesia Law Number 5 Year 1990 on Conservation of Living Natural Resource and its Ecosystem.

EiA for Mahakam Coal-Fired Power Plant Project
2
Republic of Indonesia Law Number 24 Year 1992 on Spatial Planning. Republic of Indonesia Law Number 23 Year 1997 on Management of the Living Environment. Republic of Indonesia Law Number 20 Year 2002 on Electric Power. Republic of Indonesia Law Number 22 Year 1999 on Regional Government.
1.3.2 Government Regulations
Government Regulation Number 18 Year 1999, in-conjunction with Government Regulation Number 85 Year 1995, on Management of Dangerous and Poisonous Materials. Government Regulation Number 41 Year 1999 on Air Pollution Control. Government Regulation Number 27 Year 1999 on Preliminary Environmental Impact Assessment. Government Regulation Number 82 Year 2001 on Management of Water Quality and Water Pollution Control.
1.3.3 Ministerial Decrees
State Minister for the Living Environment Decree Number 13 Year 1995 on Standard Quality of Emission of Stationary Source. State Minister for the Living Environment Decree Number 48 Year 1996 on Noise Level Standard. State Minister for the Living Environment Decree Number 49 Year 1996 on Standard Quality of Vibration Level. State Minister for the Living Environment Decree Number 45 Year 1997 on Standard Index of Air Pollutant. State Minister for the Living Environment Decree Number 17 Year 2001 on Types of Planned Business and/or Activity that Require Preliminary Environmental Impact Assessment Studies. State Minister for the Living Environment Decree Number 37 Year 2003 on Surface Water Quality Analysis and Sampling Method. Minister of Mining and energy Decree Number 0.1.P/47/PME/1992 on High Voltage Air Channel Open Space (SUTT) and Extra High Voltage Air Channel (SUTET) for Electric Power Distribution. Minister of Public Works Regulation Number 63 Year 1993 on River Border Line, River Use Area, River Authority Area, and Former River. Minister of Public Works Regulation Number 45 Year 1990 on Water Quality Control in Water Sources. Minister of Public Works Regulation Number 48 Year 1990 on Management of Water and/or Water Source in River Regions. Minister of Public Works Regulation Number 49 Year 1990 on Procedure and Requirements of the Water and/or Water Source Utilisation Permit.

EiA for Mahakam Coal-Fired Power Plant Project
3
1.3.4 Decrees of the Head of Environmental Impact Control Agency (BAPEDAL)
Head of BAPEDAL Decree Number Kep-056/BAPEDAL/1994 on Guideline for Determining the Magnitude of Significant Impact. Head of BAPEDAL Decree Number Kep-299/BAPEDAL/11/1995 on Technical Guideline for the Study of Social Aspect in Compilation of Preliminary Environmental Impact Assessment. Head of BAPEDAL Decree Number Kep-124/12/1997 on Guideline for the Study of Public Health Aspects in Compilation of Preliminary Environmental Impact Assessment. Head of BAPEDAL Decree Number 08 Year 2000 on Community Involvement and Information Disclosure in Preliminary Environmental Impact Assessment Process.
1.3.5 Decree of Director General of Electricity
Director General of Electricity and New Energy Decree Number 75-12/008/600.2/95 on Directive for Implementation Supervision of Environmental Management and Monitoring in Electric Power.
1.3.6 Decrees of the Governor of East Kalimantan
Governor of East Kalimantan Regulation Number 339 Year 1988 on Standard Quality of Emission on East Kalimantan Province. Governor of East Kalimantan Regulation Number 22 Year 1995 on Underground water limitation usage for industrial need on East Kalimantan Province. Governor of East Kalimantan Regulation Number 660 Year 2000 on Environmental standard laboratories on East Kalimantan Province.
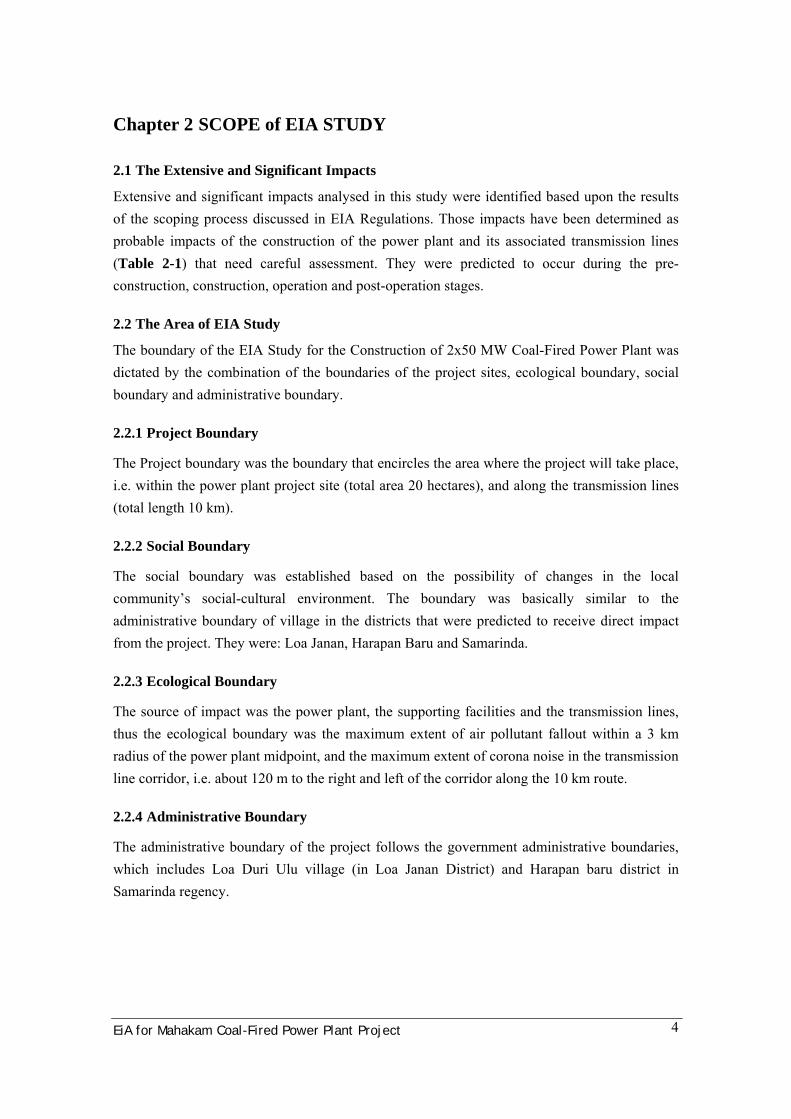
EiA for Mahakam Coal-Fired Power Plant Project
4
Chapter 2 SCOPE of EIA STUDY
2.1 The Extensive and Significant Impacts
Extensive and significant impacts analysed in this study were identified based upon the results of the scoping process discussed in EIA Regulations. Those impacts have been determined as probable impacts of the construction of the power plant and its associated transmission lines (Table 2-1) that need careful assessment. They were predicted to occur during the pre-construction, construction, operation and post-operation stages.
2.2 The Area of EIA Study
The boundary of the EIA Study for the Construction of 2x50 MW Coal-Fired Power Plant was dictated by the combination of the boundaries of the project sites, ecological boundary, social boundary and administrative boundary.
2.2.1 Project Boundary
The Project boundary was the boundary that encircles the area where the project will take place, i.e. within the power plant project site (total area 20 hectares), and along the transmission lines (total length 10 km).
2.2.2 Social Boundary
The social boundary was established based on the possibility of changes in the local community’s social-cultural environment. The boundary was basically similar to the administrative boundary of village in the districts that were predicted to receive direct impact from the project. They were: Loa Janan, Harapan Baru and Samarinda.
2.2.3 Ecological Boundary
The source of impact was the power plant, the supporting facilities and the transmission lines, thus the ecological boundary was the maximum extent of air pollutant fallout within a 3 km radius of the power plant midpoint, and the maximum extent of corona noise in the transmission line corridor, i.e. about 120 m to the right and left of the corridor along the 10 km route.
2.2.4 Administrative Boundary
The administrative boundary of the project follows the government administrative boundaries, which includes Loa Duri Ulu village (in Loa Janan District) and Harapan baru district in Samarinda regency.

EiA for Mahakam Coal-Fired Power Plant Project
5
Table 2-1 Matrix of Impact Interaction
ACTIVITY PHASEENVIRONMENTAL C0MPONENT 1 2 3 4 5 6 7 8 9 10 11 12 13 14 15 16 17 18 19 20 21 22 23 24 25 26 27 28 29 30 31 Note
1. General Survey1. Climate, Air Quality and Noisy 2. Activity Planning Socialisationa. Micro climate √ 3. Mappingb. Air Quality √ √ √ √ √ √ √ √ 4. PlanningC. Noise and Vibration √ √ √ √ √ √ √ √ √ √ √ √ √ √ 5. Land Aquisation2. Physiographic and Geology 6. Manpower Recruitmenta. Erotion √ 7. Jetty Constructionb. Land Stability √ √ 8. Manpower Mobilizationc. Ground Water √ 9. Loading Unloading3. Hidrology 10. Equipment Mobilizationa. Water Resources √ √ √ √ √ √ √ √ √ √ √ √ 11. Land Clearing and Land Preparationb. Water Resources Quality √ √ √ √ √ √ √ √ √ √ 12. Land Preparation For PLTUc. Sedimentation √ 13. Installation Developmentd. Sediment Quality √ √ √ 14. Freshwater Facility Installatione. Flood Hazard √ 15. Infrastructure Installation4. Space, Land and Soil 16. Tower Constructiona. Land Quality √ √ 17. Tower Settingb. Land Using √ √ 18. Cable Pulling and Settingc. Land Owner Status √ √ 19. Release Manpowerd. Physical and Chemist Soil Characteristic √ 20. Manpower Recruitment Operational Phasee. Land Scape √ √ √ √ 21. Coal Delivery5. Biology 22. Coal Pillinga. Secondary Forest Community √ √ 23. Water Intake and Water Inletb. Bushes Community √ √ 24. Coal Combustionc. Endemic Species 25. Fly-Ash Pillingd. Man Made Ecosystem √ √ 26. Coal Ash Deliverye. Wildlife Home Range √ √ 27. Bottom-Ash Pillingf. Freshwater Biotic Composition √ √ √ √ √ 28. Power Distributiong. Nekton √ √ √ √ √ 29. Power Plant & Transmission Line6. Social, Economic and Culture Facilities Maintenancea. Demography √ √ √ 30. Equipment and Material Maintenanceb. Sex Ration √ √ √ 31. Asset Deliverieablec. Demography Dispersal √ √ √ 32. Manpower Release Operational Phased. Manpower √ √ √ √ √ √e. Livelyhood √ √ √ √ √ √f. Traffic Hazard √ √g. Criminility √ √h. Live Style √ √ √i. Acceptibility √j. Perseption √ √ √ √ √ √ √k. Aculturation √7. Healtha. Health Infrastructure √b. Sanitation Hazard √ √ √
Preconstruction Construction Operation Pasca Oprs

EiA for Mahakam Coal-Fired Power Plant Project 6
Chapter 3 METHODS of EIA STUDY
3.1 Methods of Data Collection and Analysis
The collected data are primary and secondary data. They cover geophysics-chemical, biological, socio-economic and socio-cultural and public health aspects. Primary data were collected through direct observations, measurements and interviews in the field. While secondary data were gathered via literature studies and by collecting accessible documents from respective institutions or organizations. These secondary data included maps, district’s notes and reports, city and regency statistics, and relevant laws and regulations. The locations for direct observations and samples collection were selected by considering the following: (a) type of activities that were identified to cause possible impacts; (b) time of the implementation of the planned activities; (c) time interval of activities; (d) location and distribution of activities; and (e) representation of environmental characteristics in the study area. Sampling locations are presented in the following Table 3-1.
Table 3-1 Number of Samples and Consideration of Sampling Locations
Type of Sample Number of Sampling
Points Sampling Location
Consideration for Selecting Sampling
Location Air quality and noise
3 Port of PT BBE, Loa Duri Ulu Village and planned site for the power plant
Associated with: Environmental condition, company’s activities and settlement location
Water quality and aquatic biota
3 Benamang river, Merandai river, and Mahakam river
Associated with: Outlet and inlet of river-catchment system and the planned activities
Terrestrial biota 5 Around the planned power plant site
Associated with: Type of ecosystems and land coverage
Socio-economic, culture and public health
2 Loa Duri Ulu Village Associated with: Village location close to the planned project site
The sampling locations of air quality and noise, water, and flora & fauna are presented in Figure 3-1.
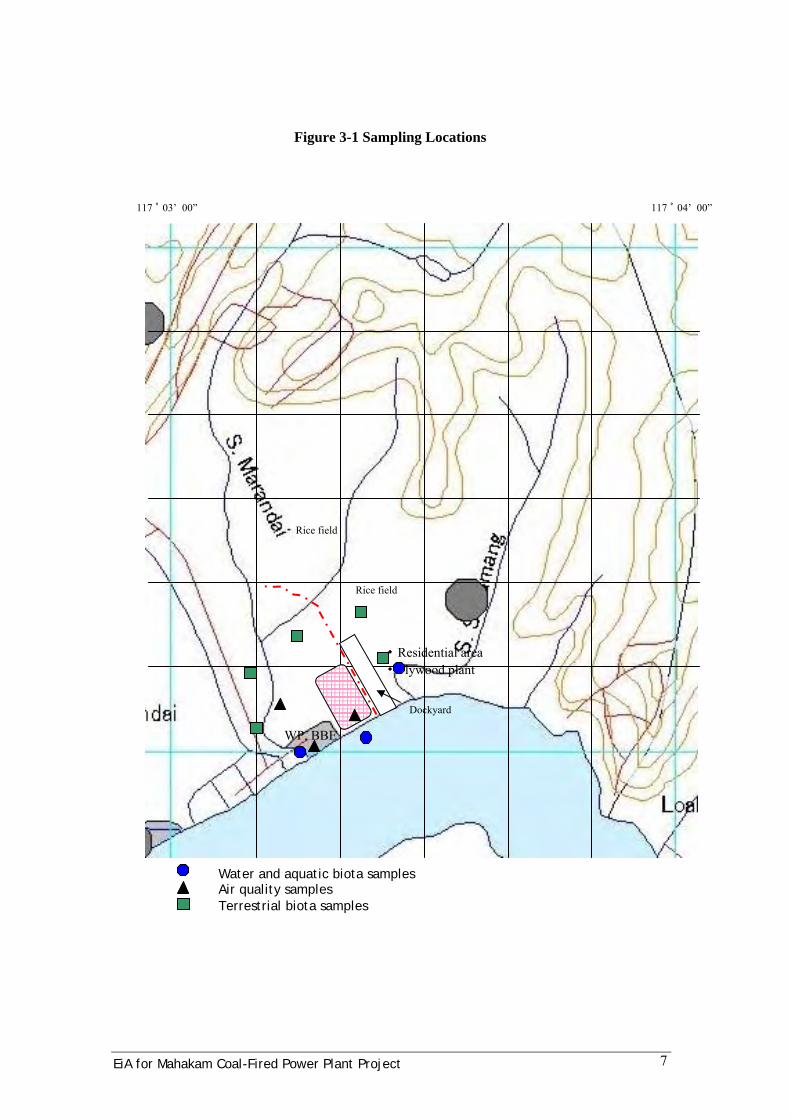
EiA for Mahakam Coal-Fired Power Plant Project 7
Figure 3-1 Sampling Locations
117 ゚ 03’ 00” 117 ゚ 04’ 00”
Rice field
Rice field
Dockyard
WP, BBE
・Residential area ・Plywood plant
Water and aquatic biota samples Air quality samples Terrestrial biota samples

EiA for Mahakam Coal-Fired Power Plant Project 8
3.2 Climate, Air Quality and Noise
3.2.1 Climate
Macro scale meteorological data of the study area was assembled by compiling secondary data from the Meteorology & Geophysics station. Statistical data analysis was done to seek average climatological conditions for the last ten years. In addition, micro scale meteorological data measurement was carried out simultaneously with the air sampling. They included ambient temperature, (air) barometric pressure, humidity, wind direction and velocity.
3.2.2 Air Quality
Data on air quality will be collected by utilizing secondary data from previous studies, and by field measurement for primary data.
3.2.3 Noise
Secondary data were obtained through environmental studies done previously by PT Bukit Baiduri Energy in areas near the study site. Primary data collection was conducted through direct measurement in the field, and refering to Governor of East Kalimantan Regulation Number 339 Year 1988 on Air Quality Standard and Noise Level Standard. A Sound Level Meter was used for noise measurement and the noise level is presented in dBA units. Sampling locations for noise measurement were the same as the sampling points for air quality measurements.
3.2.4 Physiography and Geology
The analysed physiography and geology components include topography, geology, geo-hydrology, and seismic information. Both secondary data and primary data from on-site field observations were used. Primary and secondary data of physiography, geology and geo-hydrology were collected using survey methods and review of literature in these aspects. Field surveys of the physiography and topography were aimed at obtaining data about specific parameters such as slope angle and topographic relief. Geology and hydrogeology data include lithological (soil and rock) parameters, geological structure, soil and rock characteristics which involve the technical nature of the soil/rocks in general.
3.2.4.1 Water Resource Potential
Both primary and secondary data were collected to build hydrological data of the study site. Primary data included parameters of river physical characteristics, water surface elevations, sedimentation levels, and water quality. Secondary data, among others, included river debit, flow patterns, and existing condition during the field survey.

EiA for Mahakam Coal-Fired Power Plant Project 9
3.2.4.2 Water Quality
The water quality data were collected through secondary data acquisition of previous studies and direct measurements in the field for primary data. Water samples were collected using water samplers. Water quality primary data was derived from composite samples taken in certain sampling points in Mahakam River, Merandai River, Benamang River, and from some wells surrounding the proposed project site. Results of river water sample analysis were compared to the Governor of East Kalimantan Decree Number 16 Year 2005 on Water Standard Quality for Rivers in East Kalimantan Province. For water sampled from wells, the evaluation referred to the Minister of Health Regulation Number 146/MENKES/PER/IX/1990.
3.2.4.3 River Sediment
Heavy metals measured in river sediment were mercury (Hg), cadmium (Cd), lead (Pb), and zinc (Zn). Sediment samples were only taken in Mahakam River, i.e. at a sampling point before, within and after the planned site for the power plant. These positions are aimed to collect sediment baseline data before the actual power plant operation is taking place.
3.2.5 Space, Land and Soil
Secondary data were used for spatial and land-use data, particularly current space and land uses, and ownership status of land that will be affected by the construction of the power plant and transmission network. Sources of data include reports on spatial planning of Kutai Kartanegara Regency and East Kalimantan Province. In addition, land-use map analysis was also conducted using data from the National Land Administration Agency (BPN) and Central Bureau of Statistics (BPS). Direct observations were employed to appraise the current situation of land and ownership status along the route of planned transmission lines. For soil physical and chemical properties both secondary and primary data were used. Soil sampling was done to identify soil profile and soil physical and chemical contents particularly those related to fertility. Soil analysis was carried out using standard methods recommended by the Centre for Soil Research in Bogor (1981).
3.3 Biological Resources
3.3.1 Flora
Collection of both natural and cultivated vegetation data which includes community types, and plant species and distribution, were carried out employing methods commonly used by the Directorate General of Forest Protection and Nature Conservation (Ditjen PHKA), the cruising method.

EiA for Mahakam Coal-Fired Power Plant Project 10
Every plant species found was recorded and its significance grade according to the modified Braun & Blanquet rule was calculated. Designation of protected plant species was done by referring to the list of protected plants published by the Directorate General of Forest Protection and Nature Conservation (Ditjen PHKA).
3.3.2 Fauna
Primary data were gathered through the cruising method, and the observation parameters were species, distribution and frequency. Primary data were also collected through interviews with local people, and secondary data were collected from nearby protected area offices. The observed terrestrial animals were mammals, birds, reptiles and amphibia. Using the data obtained, the habitat, distribution patterns, migration patterns, abundance, species composition, status and territoriality of animals were assessed. Designation of protected, threatened, endemic and specific animal species was done by referring to the list of protected animals published by the Directorate General of Forest Protection and Nature Conservation (Ditjen PHKA).
3.3.3 Aquatic Biota
3.3.3.1 Plankton and Benthos
Plankton were sampled by passing 50 liters of water, taken at specific sampling points, through a Wisconsin net (plankton net number 25) to obtain a 20 ml concentrated water sample, and preserved with 4% formaldehyde. Samples of benthos were collected using an Eckman Dredge with coverage of 0.15 x 0.15 m2. The samples were then passed through a standard sieve number 30 (US standard, 250 micron mesh-size) to separate the benthos from mud substrates. Sieve-retained benthos were transferred to plastic bottles and preserved with 4% formaldehyde. Plankton and benthos analysis is aimed to understand taxa (family, genus or species) composition, abundance and diversity. The diversity of both plankton and benthos was determined using the Shannon-Wiener diversity index.
3.3.3.2 Nekton
Nekton animals or fishes recorded in every sampling location were primarily those caught by local people either for consumption or for selling. Interviews were also carried out to get additional data on local fisheries. Unknown or unidentified species were collected for further systematic identification and determination at a Biological Laboratory.
EiA for Mahakam Coal-Fired Power Plant Project 11
3.4 Society, Economy and Culture
3.4.1 Public Health
Public health studies were done with reference to the Head of Environmental Impact Control Agency (BAPEDAL) Decree Number 124 Year 1997 on Guideline for the Study of Public Health Aspects in Compilation of EIA. Data were obtained through direct observation, secondary data acquisition, and interviews with the local community. The collected data were health resources, environmental sanitation, and community nutrition status, among others. Public health surveys were carried out in sub-districts and/or villages found within a three kilometers radius from the planned project site, particularly those living around the Mahakam Rivers, and near the planned transmission network. The analysis method was the environmental health impact analysis/assessment method.
3.5 Extensive and Significant Impact Assessment Method
3.5.1 Air Quality
Measurement of ambient air pollutant concentrations will be analysed using the Gaussian equation.
3.5.2 Noise
To assess impacts caused by noise, two aspects should be considered, i.e. (1) noise level accumulation resulting from a variety of sound sources, and (2) variation of noise level due to different distances to the source of noise being examined.
3.5.3 Water Quality
Assessment of the impacts on water quality will be done using a non-formal method, by comparing the present water quality with changes that occur throughout the pre-construction, construction, operational (post-construction) and post-operational stages. To measure the increase of water parameter concentration caused by an activity, the approach proposed by the Metcalfe formula will be implemented.
3.5.4 Electric Field and Magnetic Field Induction
Estimation of the magnitude of magnetic and electric fields was calculated. The results of the calculations were compared to standard quality published in 1998 by the International Commission on Non-Ionizing Radiation Protection (ICNIRP) which is also referred to by the World Health Organization (WHO).
EiA for Mahakam Coal-Fired Power Plant Project 12
Chapter 4 INITIAL ENVIRONMENTAL SETTING
The planned activity will take place in PT Bukit Baiduri Energy area. The power plant will be constructed in a vacant 20-hectares area. The lands for the proposed transmission lines’ towers are covered by poorly maintained cultivated plants, particularly palm trees.
4.1 Physio-Chemical
4.1.1 Climate
4.1.1.1 Climate Type and Precipitation
According to the Koppen classification, the area of Kutai Kartanegara and its surrounds can be classified as an Alpha type climate and is known as a “tropical rain area.” Schmidt & Ferguson, however, categorized the area as “Type A” climate (heavily wet). The study area has two seasons: rainy (between October and April), and dry (May to September). The annual average precipitation is between 14.6 and 243.8 mm. Total annual precipitation is 1,093.4 mm with daily average of 91.12 mm, and the number of days with precipitation per month ranges between nine and 20 days.
4.1.1.2 Air Temperature and Humidity
Climatologically, the air temperature and humidity in the study area fluctuate between 24.47 and 32.30 ºC and between 81.88 and 89.98%, respectively (data for the year 2005 from the Meteorology and Geophysics Agency (BMG) Station and Office of Agriculture and Food Crops at Samarinda).
4.1.1.3 Sunlight Intensity
Results of data analysis showed that the annual average sunlight intensity was 48.20 % with the sunlight intensity monthly average is ranging between 40.00 and 55.00 %.

EiA for Mahakam Coal-Fired Power Plant Project 13
Table 4-1 Condition of some climate elements Climate elements
Temperature (oC)
Month
*Precipitation (mm)
Number of day with
precipitation (day)
Max Min AverageHumidity
(%)
* Sunlight Intensity
(%)
January 124.80 17 31.36 21.88 25.18 85.52 50.60 February 98.40 17 33.03 22.49 26.77 85.11 51.60 March 52.60 16 34.02 22.85 26.82 85.24 51.60 April 14.60 11 32.86 23.28 26.39 88.97 53.20 May 77.20 21 33.03 23.46 26.49 89.98 45.80 June 65.40 20 30.65 21.49 24.47 84.11 42.60 July 37.80 10 31.25 21.55 26.20 86.12 48.00 August 79.00 17 33.30 22.31 26.24 87.10 55.00 September 20.20 9 34.20 21.88 26.34 81.88 48.50 October 243.80 20 33.11 22.56 26.14 84.12 40.90 November 139.80 20 32.68 22.90 26.03 85.45 40.60 December 139.80 20 32.68 22.90 26.03 85.45 40.00 TOTAL 1,093.4 218 392.2 269.5 313.1 1,029.0 Average 91.12 18 32.68 22.46 26.09 85.75 48.20
Source: Office of Agriculture and Food Crops, 2005, *Temindung Airport, 2006
4.1.1.4 Wind Velocity and Direction
Secondary data for one decade period (1988-1998) from the Meteorology and Geophysics Agency (BMG) Station at Temindung Airport, Samarinda indicated that the wind speed ranged between 4 and 6 knots. Data suggest that the dominant wind direction during January-April was from the northeast, during May-October from the south, and generally during November-December was blown to the west direction.
4.1.2 Air Quality
Air quality in the study areas was assessed based on samples collected in three locations: port of PT Bukit Baiduri Energi, Loa Duri Ulu Village of Loa Janan District, and the planned location of the plant. Results suggest that air quality in the study area was generally good and within tolerable limits or under thresholds of the government’s quality standard (Government Regulation 41/1999).
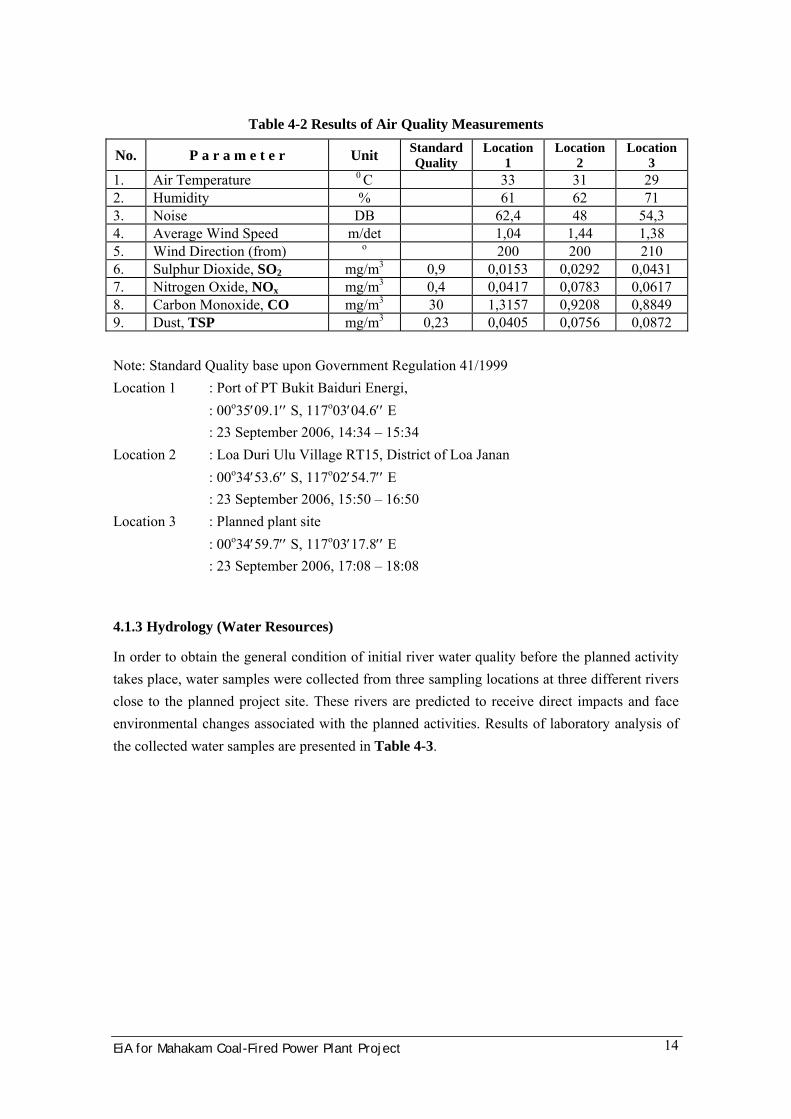
EiA for Mahakam Coal-Fired Power Plant Project 14
Table 4-2 Results of Air Quality Measurements
No. P a r a m e t e r Unit Standard Quality
Location 1
Location 2
Location 3
1. Air Temperature 0 C 33 31 29 2. Humidity % 61 62 71 3. Noise DB 62,4 48 54,3 4. Average Wind Speed m/det 1,04 1,44 1,38 5. Wind Direction (from) o 200 200 210 6. Sulphur Dioxide, SO2 mg/m3 0,9 0,0153 0,0292 0,0431 7. Nitrogen Oxide, NOx mg/m3 0,4 0,0417 0,0783 0,0617 8. Carbon Monoxide, CO mg/m3 30 1,3157 0,9208 0,8849 9. Dust, TSP mg/m3 0,23 0,0405 0,0756 0,0872 Note: Standard Quality base upon Government Regulation 41/1999 Location 1 : Port of PT Bukit Baiduri Energi, : 00o35′09.1′′ S, 117o03′04.6′′ E : 23 September 2006, 14:34 – 15:34 Location 2 : Loa Duri Ulu Village RT15, District of Loa Janan : 00o34′53.6′′ S, 117o02′54.7′′ E : 23 September 2006, 15:50 – 16:50 Location 3 : Planned plant site : 00o34′59.7′′ S, 117o03′17.8′′ E : 23 September 2006, 17:08 – 18:08
4.1.3 Hydrology (Water Resources)
In order to obtain the general condition of initial river water quality before the planned activity takes place, water samples were collected from three sampling locations at three different rivers close to the planned project site. These rivers are predicted to receive direct impacts and face environmental changes associated with the planned activities. Results of laboratory analysis of the collected water samples are presented in Table 4-3.
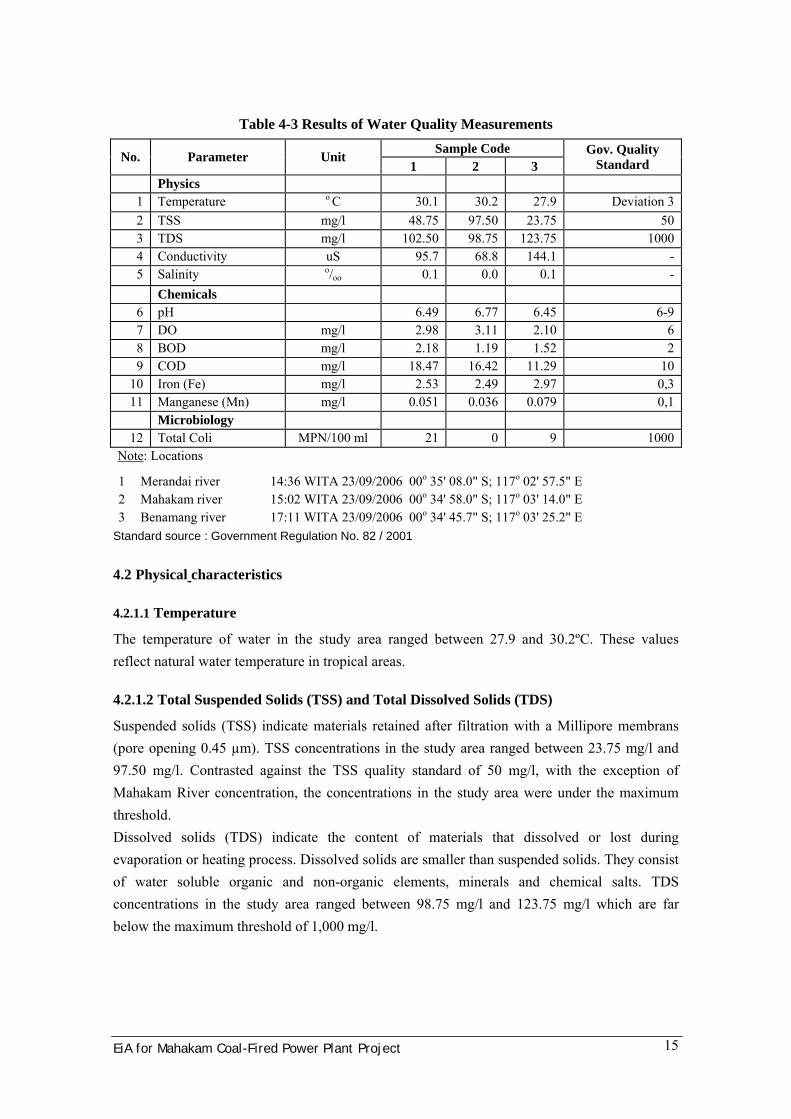
EiA for Mahakam Coal-Fired Power Plant Project 15
Table 4-3 Results of Water Quality Measurements Sample Code No. Parameter Unit
1 2 3 Gov. Quality
Standard Physics
1 Temperature o C 30.1 30.2 27.9 Deviation 32 TSS mg/l 48.75 97.50 23.75 503 TDS mg/l 102.50 98.75 123.75 10004 Conductivity uS 95.7 68.8 144.1 -5 Salinity o/oo 0.1 0.0 0.1 -
Chemicals 6 pH 6.49 6.77 6.45 6-97 DO mg/l 2.98 3.11 2.10 68 BOD mg/l 2.18 1.19 1.52 29 COD mg/l 18.47 16.42 11.29 10
10 Iron (Fe) mg/l 2.53 2.49 2.97 0,311 Manganese (Mn) mg/l 0.051 0.036 0.079 0,1
Microbiology 12 Total Coli MPN/100 ml 21 0 9 1000
Note: Locations 1 Merandai river 14:36 WITA 23/09/2006 00o 35' 08.0" S; 117o 02' 57.5" E 2 Mahakam river 15:02 WITA 23/09/2006 00o 34' 58.0" S; 117o 03' 14.0" E 3 Benamang river 17:11 WITA 23/09/2006 00o 34' 45.7" S; 117o 03' 25.2" E
Standard source : Government Regulation No. 82 / 2001
4.2 Physical characteristics
4.2.1.1 Temperature
The temperature of water in the study area ranged between 27.9 and 30.2ºC. These values reflect natural water temperature in tropical areas.
4.2.1.2 Total Suspended Solids (TSS) and Total Dissolved Solids (TDS)
Suspended solids (TSS) indicate materials retained after filtration with a Millipore membrans (pore opening 0.45 µm). TSS concentrations in the study area ranged between 23.75 mg/l and 97.50 mg/l. Contrasted against the TSS quality standard of 50 mg/l, with the exception of Mahakam River concentration, the concentrations in the study area were under the maximum threshold. Dissolved solids (TDS) indicate the content of materials that dissolved or lost during evaporation or heating process. Dissolved solids are smaller than suspended solids. They consist of water soluble organic and non-organic elements, minerals and chemical salts. TDS concentrations in the study area ranged between 98.75 mg/l and 123.75 mg/l which are far below the maximum threshold of 1,000 mg/l.
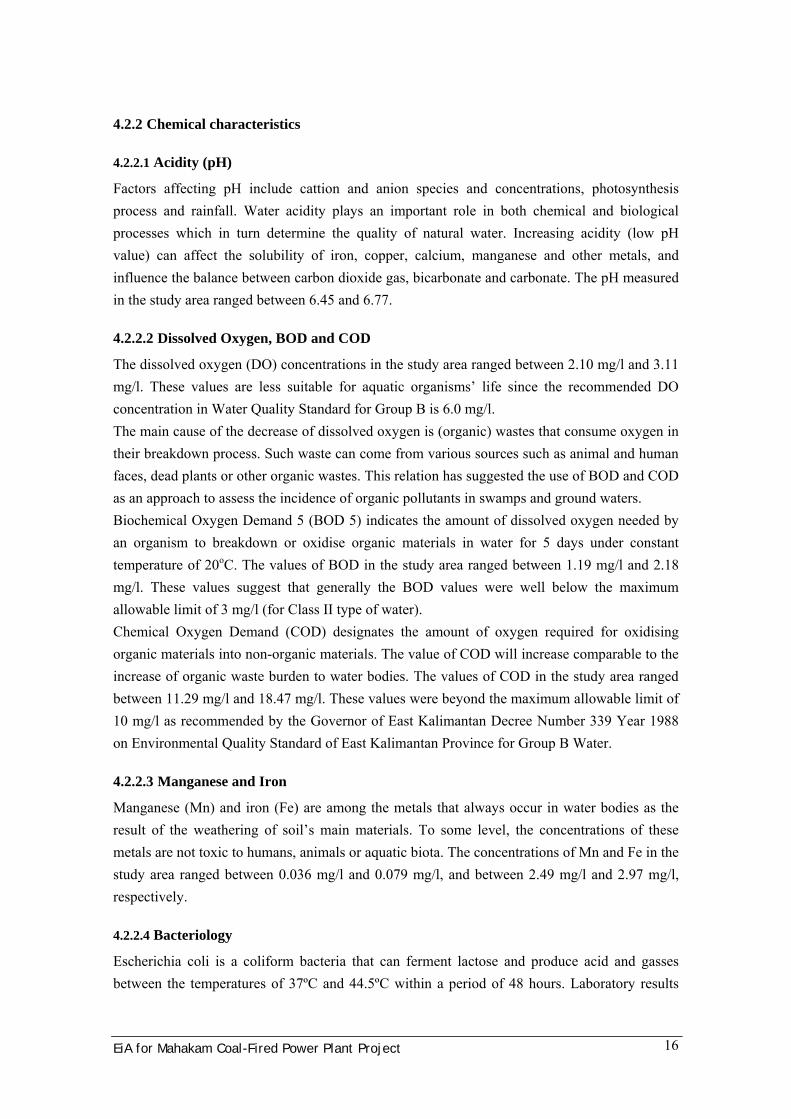
EiA for Mahakam Coal-Fired Power Plant Project 16
4.2.2 Chemical characteristics
4.2.2.1 Acidity (pH)
Factors affecting pH include cattion and anion species and concentrations, photosynthesis process and rainfall. Water acidity plays an important role in both chemical and biological processes which in turn determine the quality of natural water. Increasing acidity (low pH value) can affect the solubility of iron, copper, calcium, manganese and other metals, and influence the balance between carbon dioxide gas, bicarbonate and carbonate. The pH measured in the study area ranged between 6.45 and 6.77.
4.2.2.2 Dissolved Oxygen, BOD and COD
The dissolved oxygen (DO) concentrations in the study area ranged between 2.10 mg/l and 3.11 mg/l. These values are less suitable for aquatic organisms’ life since the recommended DO concentration in Water Quality Standard for Group B is 6.0 mg/l. The main cause of the decrease of dissolved oxygen is (organic) wastes that consume oxygen in their breakdown process. Such waste can come from various sources such as animal and human faces, dead plants or other organic wastes. This relation has suggested the use of BOD and COD as an approach to assess the incidence of organic pollutants in swamps and ground waters. Biochemical Oxygen Demand 5 (BOD 5) indicates the amount of dissolved oxygen needed by an organism to breakdown or oxidise organic materials in water for 5 days under constant temperature of 20oC. The values of BOD in the study area ranged between 1.19 mg/l and 2.18 mg/l. These values suggest that generally the BOD values were well below the maximum allowable limit of 3 mg/l (for Class II type of water). Chemical Oxygen Demand (COD) designates the amount of oxygen required for oxidising organic materials into non-organic materials. The value of COD will increase comparable to the increase of organic waste burden to water bodies. The values of COD in the study area ranged between 11.29 mg/l and 18.47 mg/l. These values were beyond the maximum allowable limit of 10 mg/l as recommended by the Governor of East Kalimantan Decree Number 339 Year 1988 on Environmental Quality Standard of East Kalimantan Province for Group B Water.
4.2.2.3 Manganese and Iron
Manganese (Mn) and iron (Fe) are among the metals that always occur in water bodies as the result of the weathering of soil’s main materials. To some level, the concentrations of these metals are not toxic to humans, animals or aquatic biota. The concentrations of Mn and Fe in the study area ranged between 0.036 mg/l and 0.079 mg/l, and between 2.49 mg/l and 2.97 mg/l, respectively.
4.2.2.4 Bacteriology
Escherichia coli is a coliform bacteria that can ferment lactose and produce acid and gasses between the temperatures of 37ºC and 44.5ºC within a period of 48 hours. Laboratory results
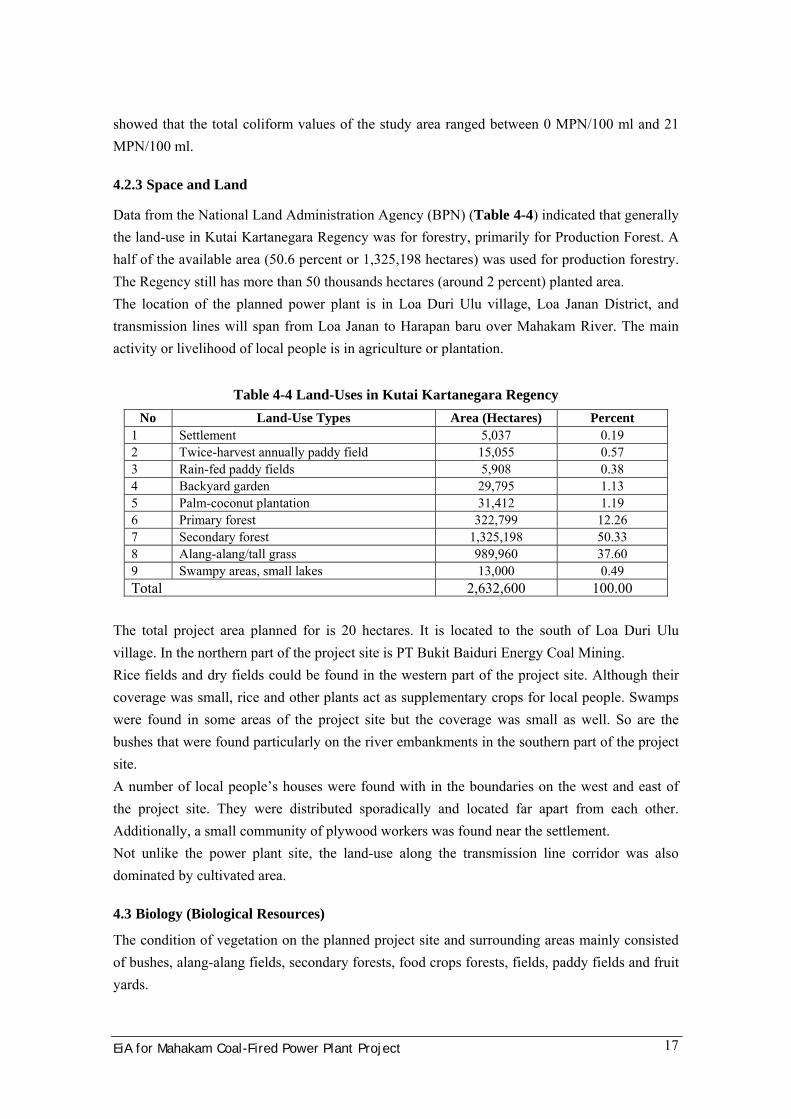
EiA for Mahakam Coal-Fired Power Plant Project 17
showed that the total coliform values of the study area ranged between 0 MPN/100 ml and 21 MPN/100 ml.
4.2.3 Space and Land
Data from the National Land Administration Agency (BPN) (Table 4-4) indicated that generally the land-use in Kutai Kartanegara Regency was for forestry, primarily for Production Forest. A half of the available area (50.6 percent or 1,325,198 hectares) was used for production forestry. The Regency still has more than 50 thousands hectares (around 2 percent) planted area. The location of the planned power plant is in Loa Duri Ulu village, Loa Janan District, and transmission lines will span from Loa Janan to Harapan baru over Mahakam River. The main activity or livelihood of local people is in agriculture or plantation.
Table 4-4 Land-Uses in Kutai Kartanegara Regency No Land-Use Types Area (Hectares) Percent
1 Settlement 5,037 0.19 2 Twice-harvest annually paddy field 15,055 0.57 3 Rain-fed paddy fields 5,908 0.38 4 Backyard garden 29,795 1.13 5 Palm-coconut plantation 31,412 1.19 6 Primary forest 322,799 12.26 7 Secondary forest 1,325,198 50.33 8 Alang-alang/tall grass 989,960 37.60 9 Swampy areas, small lakes 13,000 0.49 Total 2,632,600 100.00
The total project area planned for is 20 hectares. It is located to the south of Loa Duri Ulu village. In the northern part of the project site is PT Bukit Baiduri Energy Coal Mining. Rice fields and dry fields could be found in the western part of the project site. Although their coverage was small, rice and other plants act as supplementary crops for local people. Swamps were found in some areas of the project site but the coverage was small as well. So are the bushes that were found particularly on the river embankments in the southern part of the project site. A number of local people’s houses were found with in the boundaries on the west and east of the project site. They were distributed sporadically and located far apart from each other. Additionally, a small community of plywood workers was found near the settlement. Not unlike the power plant site, the land-use along the transmission line corridor was also dominated by cultivated area.
4.3 Biology (Biological Resources)
The condition of vegetation on the planned project site and surrounding areas mainly consisted of bushes, alang-alang fields, secondary forests, food crops forests, fields, paddy fields and fruit yards.

EiA for Mahakam Coal-Fired Power Plant Project 18
4.3.1 Terrestrial Flora
Based on the floral composition, climate conditions and geographical position, vegetation in the study area can be categorized as tropical rainforest. Generally, the floristic composition of the vegetation was dominated by agriculture and the plantation’s plant species. Floristic forest type was only small part of the whole planned project site. The type was young secondary forest.
4.3.1.1 Bush
This vegetation was found in the abandoned fields in the study area. It includes alang-alang (Imperata cilindrica) fields mixed with bush species such as bilam (Euporatorium palescens), karamunting (Melastoma sp.), fern (Pieredhopyilia sp.), and natural secondary forest species such as Homalanthus populneus, and betel (Piper aduncum) grow intermittently. Altogether, the variability of these vegetation types suggests that the genuine natural forests in the study area were already disturbed by either natural causes or human activities with high intensities.
4.3.1.2 Secondary forests
Secondary forests were characterized by pioneer plants in which the vegetation structure was mainly dominated by plants with three growth levels: seedlings, sapling and poles. Trees with stem diameter more than 50 cm were very rare. Plant species of these secondary forests are presented in the following table.
Table 4-5 Type of Vegetation in Secondary Forests No Scientific Name Local Name Frequency 1. Piper aduncum Sirih-sirih Abundant 2. Macaranga converta Mahang Infrequent 3. Pieredhopyilia sp. Paku-paku Infrequent 4. Vernonia sp. Merembung Infrequent 5. Milletia sp. Mali hutan Infrequent 6. Trema orientalis Trema Infrequent 7. Vitex pubescens Laban Infrequent 8. Homalanthus populneus Balik angin Infrequent 9. Artocarpus elasticus Terap Infrequent
Source: Primary data, 2006
4.3.1.3 Food crop forests
Food crop forests were found in the reclaimed lands of PT Bukit Baiduri Energi (PT BBE). The plants were fast growing species such as sengon (Paraserianthes falcataria) and acaccia spp. (Acacia mangium and Acacia auriculiformis) that do not need serious maintenance. In addition, plants planted by local people were found in areas surrounding the planned project site (i.e. in Loa Duri Village RT 14). They are jabon (Neolamarckia cadamba), jati (Tectona grandis), waru (Hibiscus sp.), and sonokembang (Pterocarpus sp.) among others.

EiA for Mahakam Coal-Fired Power Plant Project 19
4.3.1.4 Fields, paddy fields and fruit yards
Identification of crops cultivated by the local community, both at the planned project site and in the surrounding areas can be used as reference to manage and develop socio-economic aspects for improving the wellbeing of the local people. To the west and the north of the planned project site, paddy fields with total areas around 7 and 20 hectares, respectively, were found. While to the east, there was a 7 hectare land parcel that had been fenced by the owner with a pond, plantation and forestry vegetation, and a cow grazing area. The planted plants included among others, jabon, sengon, jati, and petai cina. In addition, various fruit trees planted by local people were also found in the study area.
Table 4-6 Plant Species Found in the planned Project Site and Surrounds No Local Name Scientific Name Fruited plants 1 Pisang – banana Musa paradisiaca 2 Nangka - jackfruit Artocarpus heterophyllus 3 Jeruk - orange Cytrus sp. 4 Pepaya – Papaya Carica papaya 5 Mangga - mangoes Mangifera indica 6 Sirsak – soursop Annonia murricaia 7 Jambu air - watery guava Eugenia sp. 8 Rambutan - hairy fruit Nephelium lappaceum 9 Jambu batu/biji – guava Psidium guajava
10 Petai Cina - Farchia marginallis 11 Belimbing – star fruit Averhoe carambola 12 Wanyi Mangifera sp. 13 Jarak – bush castor Jatropha curcas 14 Durian Durio zibhetinus 15 Kelapa – coconut Cocos nucifera 16 Mempelam Mangifera sp. 17 Kemiri – candle nut Aleurites mollucana 18 Jengkol Pithecelobium dulce 19 Salak - snakeskin fruit Salacca sp. 20 Nanas – pineapple Ananas comosus 21 Langsat – lanseh fruit Aglaia sp. 22 Sawo – sapodilla Achras zapota 23 Kedondong - Spondias cytherea Seasonal crops/vegetables 1 Padi – paddy/rice Oryza sativa 2 Tebu – sugarcane Sacharum sp. 3 Kacang Panjang – long bean Vigna sinensis 4 Bayam – spinach Amaranthus hybridus 5 Jahe – ginger Zingiber sp. 6 Jagung – corn Zea mays 7 Labu Putih – white pumpkin Lagenaria siceraria 8 Labu Merah – red pumpkin Cucurbita moschata 9 Singkong – cassava Manihot esculenta
10 Mentimun – cucumber Cucumis sativus 11 Lombok – hot chilli Capsium sp. 12 Merica/sahang – black pepper Piper nigrum 13 Kunyit Curcuma longa

EiA for Mahakam Coal-Fired Power Plant Project 20
14 Langkuas - galangale Lenguas galangal 15 Serai – lemon grass Andropogon nordus 16 Gambas Cucurbita sp. 17 Buncis – string bean Phaseolus vulgaris 18 Terong – eggplant Solanum melongena 19 Sawi – green mustard Brassica rugosa 20 Kangkung Ipomea aquatica Natural/Forestry/Plantation Plants 1 Sono kembang Pterocarpus sp. 2 Waru Hibiscus sp. 3 Akasia Acacia mangium, Ac. Auriculiformis 4 Laban Vitex pubescens 5 Pulai Alstonia scholaris. 6 Perupuk Lophopetalum sp. 7 Jati Tectona grandis 8 Kelapa sawit Elais guinensis 9 Jabon Neolamarckia cadamba
10 Sengon Paraserianthes falcataria 11 Keluwih Artocarpus integra 12 ketapang Terminolia Cattapa 13 Beringin Ficus benyamina. 14 Aren Arenga pinnata 15 Bambu Bambusa sp. 16 Simpur Dillenia reticulata 17 Jambu-jambu Eugenia sp 18 Karamunting Melastoma sp 19 Medang Litsea sp 20 Kopi hutan Nauclea sp. 21 Nanasian Callicarpa sp. 22 Kedang belung Milletia sirisia 23 Mali-mali Leea indica 24 Jengkol Pithecelobium dulce 25 Kapuk Ceiba petandra 26 Bungur Langerstroemia speciosa
Source: Primary data, 2006
4.3.2 Terrestrial Fauna
Observation of faunal occurrence in the planned project site was carried out through direct inventory and indirectly through interviews with local people. Direct observation was done by visual counting with or without binocular aid, and based on animal footprints and faeces. Interviews were conducted with the assistance of an animal identification guidebook to facilitate discussions. The following table presents the results of the observations on wildlife species diversity in the planned project site.

EiA for Mahakam Coal-Fired Power Plant Project 21
Table 4-7 Diversity of Wildlife Species in the planned Project Site No. Group/Animal Name Scientific Name Remarks I. Mammals 1. Kalong besar Pteropus vampyrus PTL 2. Trenggiling Manis javanica PTL/DL 3. Tikus ladang Rattus exulans PL 4. Tikus belukar Rattus tiomanicus PL 5. Tikus rumah Rattus tanezumi PL 6. Musang Martes sp. PTL 7. Babi hutan Sus barbatus PTL 8. Tupai Tupai gracilis PL 9. Landak Hystrix brachyura PTL/DL II. Primate 1. Monyet Macaca nemestrina PTL III. Reptiles 1. Biawak Varanus salvator PL 2. Ular sawah Phyton molurus PTL/DL 3. Ular kobra Ophiophagus sp. PTL 4. Ular air Enhydris enhydris PTL 5. Ular cincin Boiga dendrophila PTL 6. Ular hijau Dryphia sp. PTL 7. Kadal Mabonya multifasciata PL IV. Amphibians 1. Kodok tegalan Fejervarya limnocharis PL 2. Kodok kongkang Rana sp. PTL V. Aves 1. Belibis Aythya fuligula PTL 2. Belibis batu Dendrocygna javanica PTL 3. Puyuh Caturnix chinensis PL 4. Punai besar Treron capellei PTL 5. Punai kecil Treron olax PL 6. Punai gading Treren vernans PTL 7. Bubut Eudynamis scolopacea PL 8. Bubut alang-alang Centropus sinensis PL 9. Pelatuk Halcyon pileata PTL 10. Kutilang Setorais criniger PTL 11. Gelatik batu Parus major PTL 12. Kacer Copsychus saularis PTL 13. Murai batu Copsychus malabaricus PTL 14. Murai Chloropsis sonnerati PTL 15. Pipit Anthus sp. PL 16. Tiung Gracula religiosa PTL/DL 17. Jalak Sturnupostor jalla PTL 18. Tekukur Streptopelia bitorquata PL 19. Elang Gyps bengalensis PL 20. Burung hantu Otus spilocephalus PTL
Remarks:
PL : Direct observation
PTL : Indirect observation
DL : Protected species
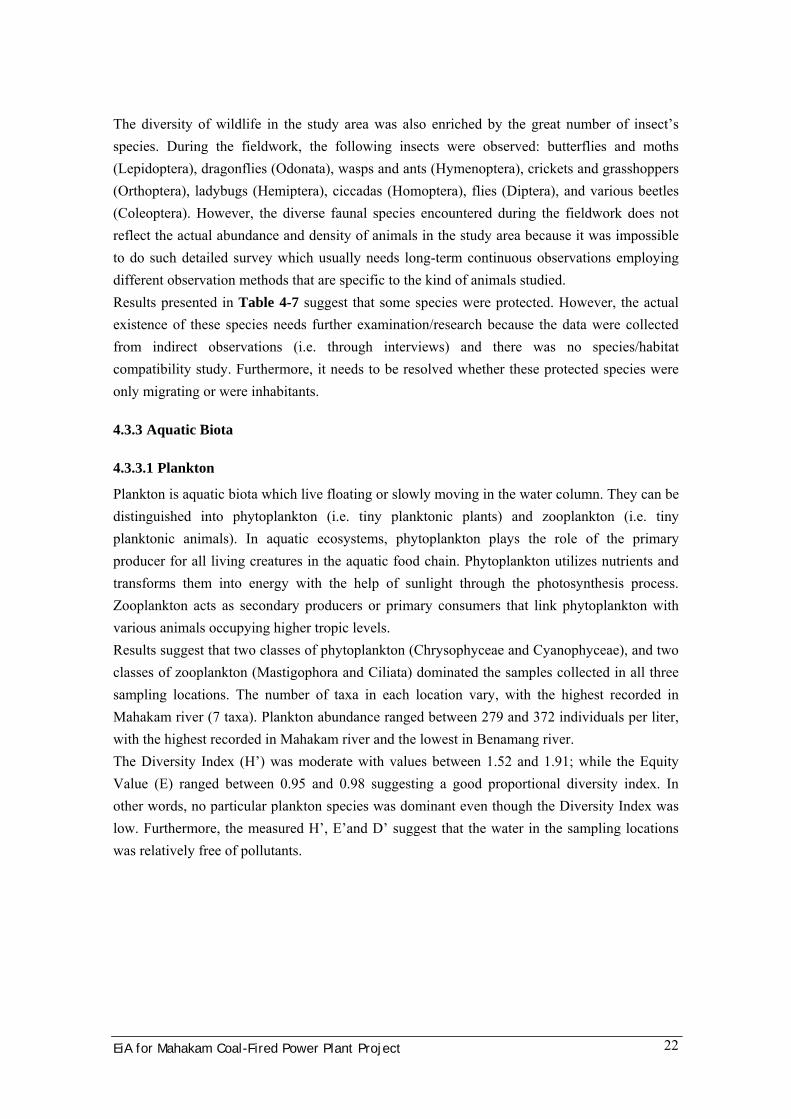
EiA for Mahakam Coal-Fired Power Plant Project 22
The diversity of wildlife in the study area was also enriched by the great number of insect’s species. During the fieldwork, the following insects were observed: butterflies and moths (Lepidoptera), dragonflies (Odonata), wasps and ants (Hymenoptera), crickets and grasshoppers (Orthoptera), ladybugs (Hemiptera), ciccadas (Homoptera), flies (Diptera), and various beetles (Coleoptera). However, the diverse faunal species encountered during the fieldwork does not reflect the actual abundance and density of animals in the study area because it was impossible to do such detailed survey which usually needs long-term continuous observations employing different observation methods that are specific to the kind of animals studied. Results presented in Table 4-7 suggest that some species were protected. However, the actual existence of these species needs further examination/research because the data were collected from indirect observations (i.e. through interviews) and there was no species/habitat compatibility study. Furthermore, it needs to be resolved whether these protected species were only migrating or were inhabitants.
4.3.3 Aquatic Biota
4.3.3.1 Plankton
Plankton is aquatic biota which live floating or slowly moving in the water column. They can be distinguished into phytoplankton (i.e. tiny planktonic plants) and zooplankton (i.e. tiny planktonic animals). In aquatic ecosystems, phytoplankton plays the role of the primary producer for all living creatures in the aquatic food chain. Phytoplankton utilizes nutrients and transforms them into energy with the help of sunlight through the photosynthesis process. Zooplankton acts as secondary producers or primary consumers that link phytoplankton with various animals occupying higher tropic levels. Results suggest that two classes of phytoplankton (Chrysophyceae and Cyanophyceae), and two classes of zooplankton (Mastigophora and Ciliata) dominated the samples collected in all three sampling locations. The number of taxa in each location vary, with the highest recorded in Mahakam river (7 taxa). Plankton abundance ranged between 279 and 372 individuals per liter, with the highest recorded in Mahakam river and the lowest in Benamang river. The Diversity Index (H’) was moderate with values between 1.52 and 1.91; while the Equity Value (E) ranged between 0.95 and 0.98 suggesting a good proportional diversity index. In other words, no particular plankton species was dominant even though the Diversity Index was low. Furthermore, the measured H’, E’and D’ suggest that the water in the sampling locations was relatively free of pollutants.
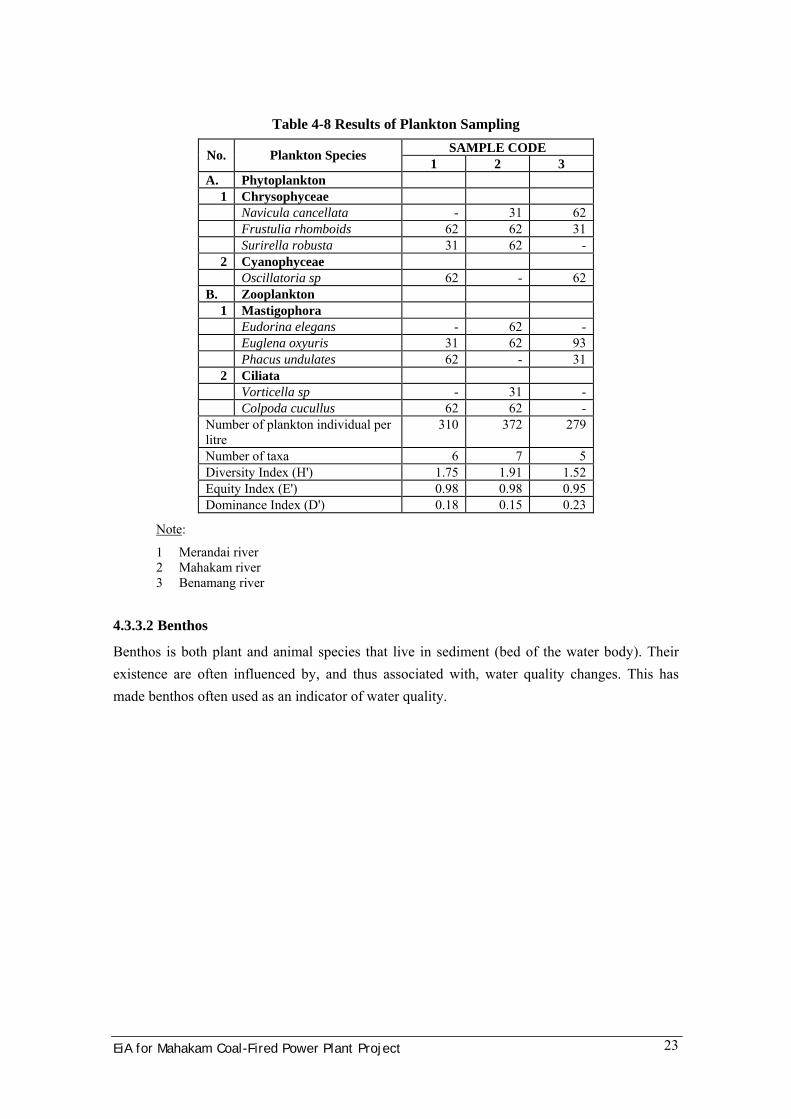
EiA for Mahakam Coal-Fired Power Plant Project 23
Table 4-8 Results of Plankton Sampling SAMPLE CODE No. Plankton Species 1 2 3
A. Phytoplankton 1 Chrysophyceae
Navicula cancellata - 31 62 Frustulia rhomboids 62 62 31 Surirella robusta 31 62 -
2 Cyanophyceae Oscillatoria sp 62 - 62 B. Zooplankton
1 Mastigophora Eudorina elegans - 62 - Euglena oxyuris 31 62 93 Phacus undulates 62 - 31
2 Ciliata Vorticella sp - 31 - Colpoda cucullus 62 62 - Number of plankton individual per litre
310 372 279
Number of taxa 6 7 5 Diversity Index (H') 1.75 1.91 1.52 Equity Index (E') 0.98 0.98 0.95 Dominance Index (D') 0.18 0.15 0.23
Note:
1 Merandai river 2 Mahakam river 3 Benamang river
4.3.3.2 Benthos
Benthos is both plant and animal species that live in sediment (bed of the water body). Their existence are often influenced by, and thus associated with, water quality changes. This has made benthos often used as an indicator of water quality.

EiA for Mahakam Coal-Fired Power Plant Project 24
Table 4-9 Results of Benthos Sampling Kode Sample No. Parameter 1 2 3
A Gastropoda Bratia sp - 26 - Compeloma integrum 13 - 13 Neritina reclivata 26 - - Pleurocera acuta 832 - - Pomatiopsis lapidaria 182 13 169 Litorira angulitera - - 78 Epitonium dalianum - 13 - B Pelecypoda Arcidens confragosus 39 - - C Oligochaeta Tubifex sp 130 - 364 D Insecta Chironomus 26 - 13 Number of benthos individuals per square-metres
195 52 546
Number of taxa 7 3 5 Diversity Index (H') 0.42 1.04 0.75 Equity Index (E') 0.22 0.95 0.47 Dominance Index (D') 0.48 0.38 0.41
Note:
1 Merandai river 2 Mahakam river 3 Benamang river
4.4 Society, Economy and Culture
4.4.1 General Description of the Study Area
The study area was Loa Duri Ulu Village, Loa Janan District, with a total village area of 12,225 hectares. The specification of the study location is as follows.
Merandai village: RT IV and V Pimping village: RT VII
Number of respondents was 12 and they were pre-determined particularly prominent local prominent persons.
Table 4-10 Population of Loa Duri Ulu Village Loa Duri Ulu Village Year Male Female Total # household
2004 4,579 3,228 7,807 4,072 2005 4,727 3,334 8,061 4,435 2006 4,819 3,357 8,176 4,701
Source: Office of the Head of Loa Duri Ulu Village, Kutai Kartanegara Regency

EiA for Mahakam Coal-Fired Power Plant Project 25
The village boundaries are: North : Loa Buah village : Loa Buah village South : Purwajaya village : Purwajaya village East : Loa Duri Ilir village : Loa Duri Ilir village West : Bakungan village : Bakungan village
Table 4-11 Population according to age-group Number Year Age group Male Female Total
1. Under 15 years 1,167 811 1,978 2. 16 – 55 years 3,472 2,414 5,886 3. Over 56 years 184 128 312
Total Number 4,823 3,353 8,176 Source: Office of the Head of Loa Duri Ulu Village, Kutai Kartanegara Regency
Table 4-12 Livelihoods Loa Duri Ulu Village No Livelihood Number (person)
1 Civil services 56 2 Armed forces 5 3 Private sectors 3,413 4 Entrepreneur/trader 515 5 Farmer 913 6 Craftmanship 25 7 Farm labourer - 8 Pensioner 32 9 Fishermen 42
10 Service sectors - 11 Other workers -
Total Number 5,001 Source: Office of the Head of Loa Duri Ulu Village, Kutai Kartanegara Regency
Table 4-13 Population according to religion Loa Duri Ulu Village No Religion Number (person)
1 Islam 5,091 2 Christian – Protestant 1,874 3 Christian – Catholic 842
Total Number 8,176 Source: Office of the Head of Loa Duri Ulu Village, Kutai Kartanegara Regency
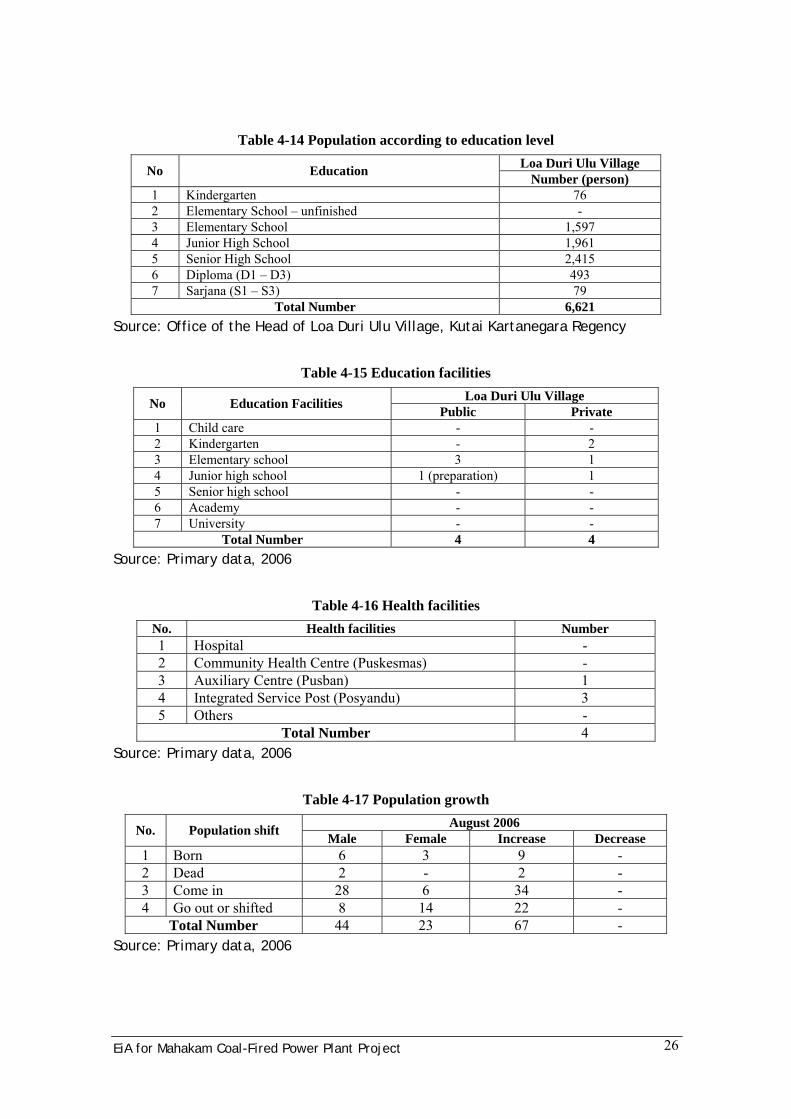
EiA for Mahakam Coal-Fired Power Plant Project 26
Table 4-14 Population according to education level Loa Duri Ulu Village No Education Number (person)
1 Kindergarten 76 2 Elementary School – unfinished - 3 Elementary School 1,597 4 Junior High School 1,961 5 Senior High School 2,415 6 Diploma (D1 – D3) 493 7 Sarjana (S1 – S3) 79
Total Number 6,621 Source: Office of the Head of Loa Duri Ulu Village, Kutai Kartanegara Regency
Table 4-15 Education facilities Loa Duri Ulu Village No Education Facilities Public Private
1 Child care - - 2 Kindergarten - 2 3 Elementary school 3 1 4 Junior high school 1 (preparation) 1 5 Senior high school - - 6 Academy - - 7 University - -
Total Number 4 4 Source: Primary data, 2006
Table 4-16 Health facilities No. Health facilities Number 1 Hospital - 2 Community Health Centre (Puskesmas) - 3 Auxiliary Centre (Pusban) 1 4 Integrated Service Post (Posyandu) 3 5 Others -
Total Number 4 Source: Primary data, 2006
Table 4-17 Population growth August 2006 No. Population shift Male Female Increase Decrease
1 Born 6 3 9 - 2 Dead 2 - 2 - 3 Come in 28 6 34 - 4 Go out or shifted 8 14 22 -
Total Number 44 23 67 - Source: Primary data, 2006

EiA for Mahakam Coal-Fired Power Plant Project 27
Table 4-18 Number of transportation vehicle in the village (2006) No. Type of vehicle Number
1. Official car - 2. Private car 42 3. Truck 15 4. Public transport (taxi) 17 5. Motorcycle 1,079 6. Motorised-boat 55 7. Non-motorised boat 25 8. Bicycle 232
Source: Office of the Village Head, 2006
4.4.2 RESPONDENT’S INCOME LEVEL
The respondents generally worked as employees of the nearby companies, farmers or in service sectors (motorcycle taxi driver, etc.). Their income level was as follows:
Table 4-19 Respondents’ identity Respondent
number Age Education* Main job Additional job Religion
1 62 Technical SrHS Hair Salon Builder Islam
2 41 JrHS Employee of Kalamur - Islam
3 40 Economic SrHS Employee of PT OTP - Islam
4 28 JrHS Meatball vendor Employee of Melapi Timber Islam
5 25 Islamic SrHS Mosque caretaker Employee of Kalamur Islam 6 40 JrHS 7 41 SrHS Company - Islam 8 45 SrHS Farmer - Islam 9 50 SrHS Farmer - Islam
10 52 SrHS Farmer Company Islam 11 38 SrHS Company - 12 45 SrHS Company Farmer Islam
Note: JrHS = Junior High School (SMP/SLTP); SrHS = Senior High School (SMA/SLTA)

EiA for Mahakam Coal-Fired Power Plant Project 28
Table 4-20 Income of community members Nomor Main livelihood Additional job RT Monthly income
1 Hair Salon Builder 3 15000002 Employee of Kalamur - 5 10000003 Employee of PT OTP - 4 1000000
4 Meatball vendor Employee of Melapi Timber 3 1300000
5 Mosque caretaker Employee of Kalamur 5 15000006 - 6 20000007 Company - 4 2000008 Farmer - 9000009 Farmer - 4 130000
10 Farmer Company 80000011 Company - 1 80000012 Company Farmer 1800000
Source: Primary data, 2006
4.4.3 Local Traditions
The dominant ethnic groups in the study area were: 1) Javanese, 2) Banjarnese, 3) Buginese, and 4) Kutainese. This ethnic diversity suggests that the culture at the study area was quite heterogenous. Therefore, local traditions reflect all these major ethnic groups. In practice, these ethnic groups have worked together and maintained mutual tolerance. One community’s problem encountered during the study was rampant drinking problems. High intensity drinking problems usually occur during weekends and at an alarming level that cause anxiety among the local community. The causes were probably the high level of unemployment and the region’s openness to outside influences that are not necessarily positive.
4.4.4 Social Processes
Generally, the local community could work with other communities. The main reason was that working together is mutually beneficial, and additionally the open outlook of the local society (i.e. being open to newcomers from other areas or parts of Indonesia). In addition, the assimilation process between the resident community and the non-native in the study area has worked well to date, particularly of those working in areas close to the companies. Assimilation could happen smoothly thanks to good communication and behavior, and similar faith/religion.
4.4.5 COMMUNITY’S PERCEPTIONS
Data regarding community’s perceptions are as follows:
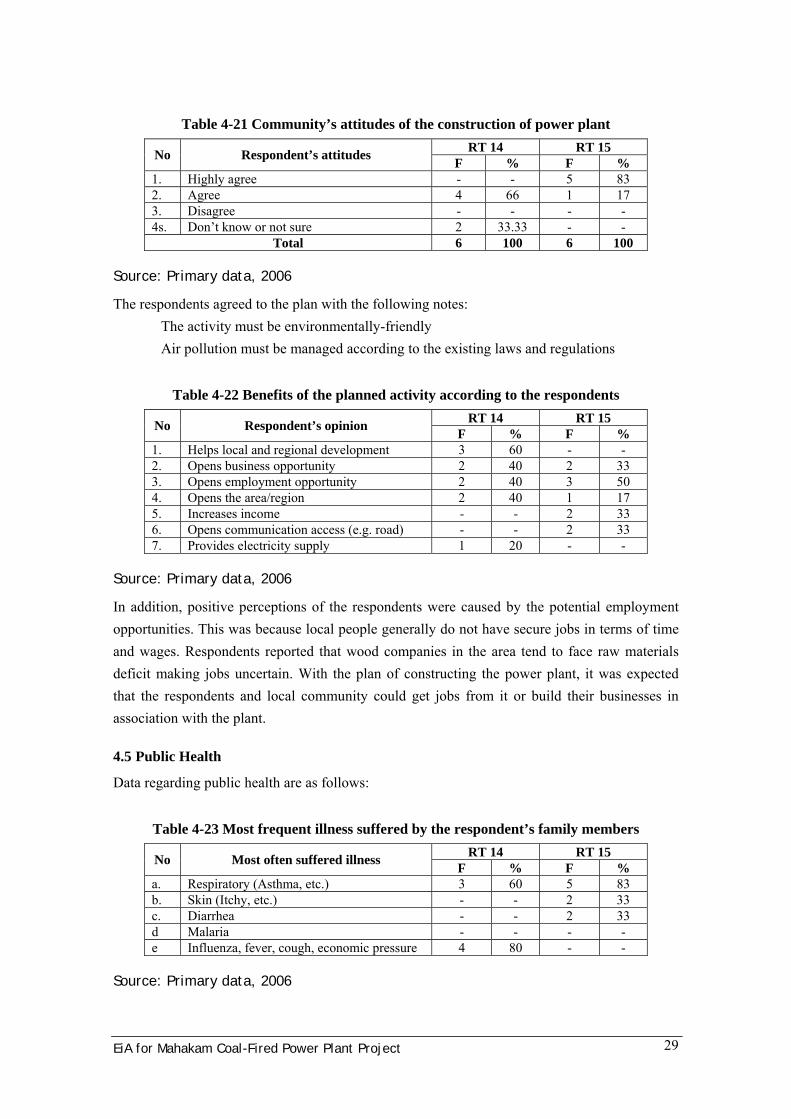
EiA for Mahakam Coal-Fired Power Plant Project 29
Table 4-21 Community’s attitudes of the construction of power plant RT 14 RT 15 No Respondent’s attitudes F % F %
1. Highly agree - - 5 83 2. Agree 4 66 1 17 3. Disagree - - - - 4s. Don’t know or not sure 2 33.33 - -
Total 6 100 6 100
Source: Primary data, 2006
The respondents agreed to the plan with the following notes: The activity must be environmentally-friendly Air pollution must be managed according to the existing laws and regulations
Table 4-22 Benefits of the planned activity according to the respondents RT 14 RT 15 No Respondent’s opinion F % F %
1. Helps local and regional development 3 60 - - 2. Opens business opportunity 2 40 2 33 3. Opens employment opportunity 2 40 3 50 4. Opens the area/region 2 40 1 17 5. Increases income - - 2 33 6. Opens communication access (e.g. road) - - 2 33 7. Provides electricity supply 1 20 - -
Source: Primary data, 2006
In addition, positive perceptions of the respondents were caused by the potential employment opportunities. This was because local people generally do not have secure jobs in terms of time and wages. Respondents reported that wood companies in the area tend to face raw materials deficit making jobs uncertain. With the plan of constructing the power plant, it was expected that the respondents and local community could get jobs from it or build their businesses in association with the plant.
4.5 Public Health
Data regarding public health are as follows:
Table 4-23 Most frequent illness suffered by the respondent’s family members RT 14 RT 15 No Most often suffered illness F % F %
a. Respiratory (Asthma, etc.) 3 60 5 83 b. Skin (Itchy, etc.) - - 2 33 c. Diarrhea - - 2 33 d Malaria - - - - e Influenza, fever, cough, economic pressure 4 80 - -
Source: Primary data, 2006

EiA for Mahakam Coal-Fired Power Plant Project 30
Table 4-24 Respondent’s toilet RT 14 RT 15 No Respondent’s toilet F % F %
a. River 1 17 1 17 b. In-house 5 83 5 83
Total 6 100 6 100
Source: Primary data, 2006
Table 4-25 Respondent’s treatment of rubbish RT 14 RT 15 No Treatment F % F %
1. By burning the rubbish 5 83 6 100 2. By throwing to the river 1 17 - -
Total 6 100 6 100
Source: Primary data, 2006
Table 4-26 Source of water for cooking RT 14 RT 15 No Source of water F % F %
1. Rain water - - 2 33 2. Well - - 1 17 3. River 1 20 1 17 4. Company (Samtraco) 4 80 - - 5. Company (BBE) - - 5 83
Source: Primary data, 2006
Table 4-27 Medication method when member of the family get sick RT 14 RT 15 No Medication method F % F %
1. Going to community health centre (puskesmas) 3 50 6 100
2. Company’s insurance (going to medical doctor) 3 50 - -
3. Sometime going to BBE/Company - - 2 33
Source: Primary data, 2006
Generally, the local community showed a high awareness of visiting the closest community health centre (puskesmas) to get treatment for their health problems. They also expressed their approval of the center’s services and medications, besides the affordable costs.
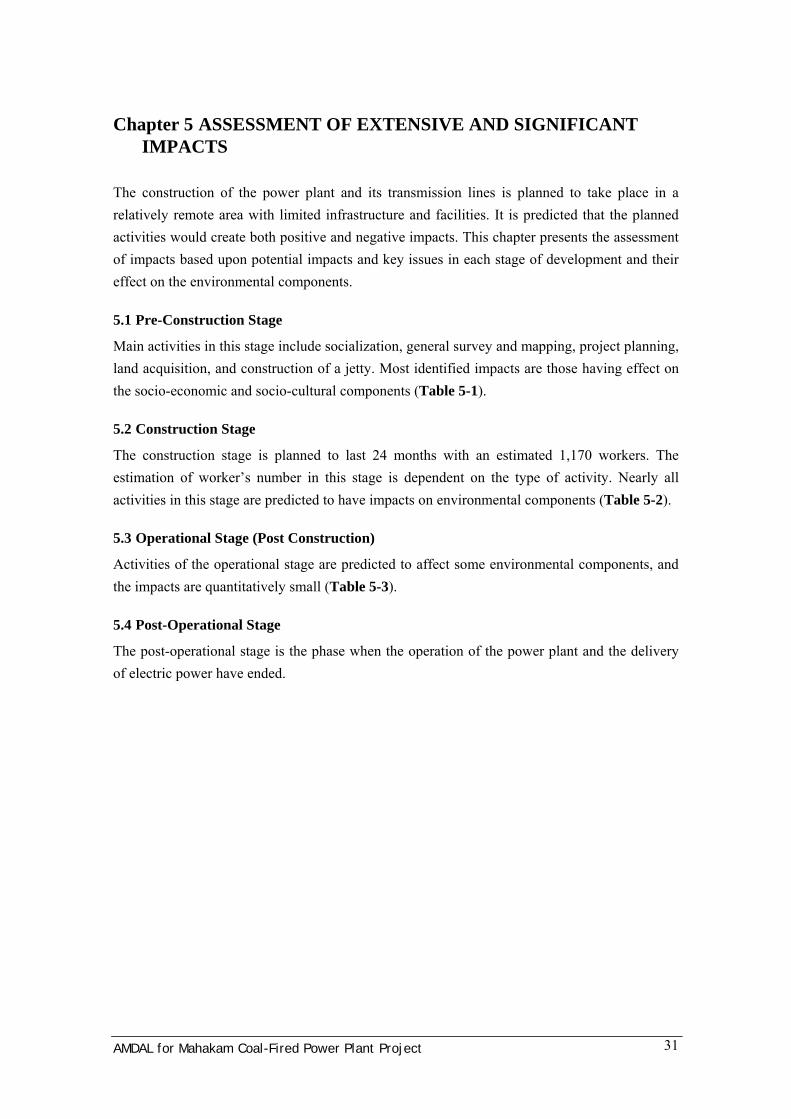
AMDAL for Mahakam Coal-Fired Power Plant Project 31
Chapter 5 ASSESSMENT OF EXTENSIVE AND SIGNIFICANT IMPACTS
The construction of the power plant and its transmission lines is planned to take place in a relatively remote area with limited infrastructure and facilities. It is predicted that the planned activities would create both positive and negative impacts. This chapter presents the assessment of impacts based upon potential impacts and key issues in each stage of development and their effect on the environmental components.
5.1 Pre-Construction Stage
Main activities in this stage include socialization, general survey and mapping, project planning, land acquisition, and construction of a jetty. Most identified impacts are those having effect on the socio-economic and socio-cultural components (Table 5-1).
5.2 Construction Stage
The construction stage is planned to last 24 months with an estimated 1,170 workers. The estimation of worker’s number in this stage is dependent on the type of activity. Nearly all activities in this stage are predicted to have impacts on environmental components (Table 5-2).
5.3 Operational Stage (Post Construction)
Activities of the operational stage are predicted to affect some environmental components, and the impacts are quantitatively small (Table 5-3).
5.4 Post-Operational Stage
The post-operational stage is the phase when the operation of the power plant and the delivery of electric power have ended.
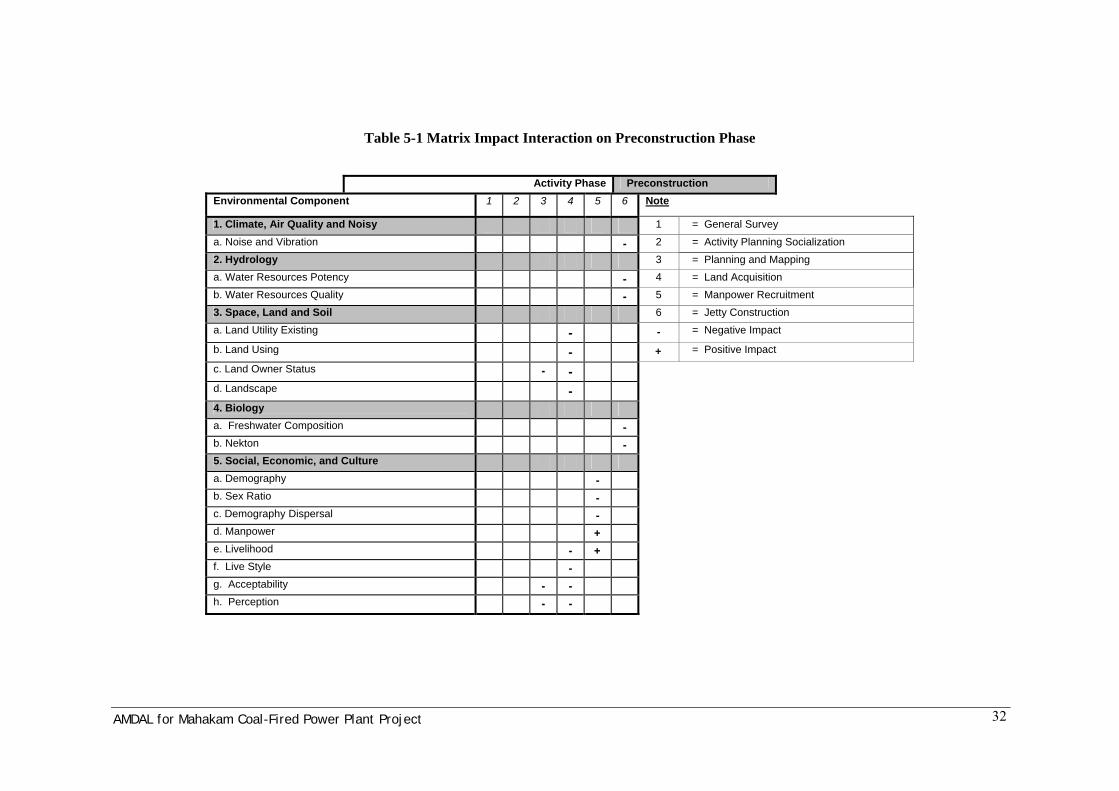
AMDAL for Mahakam Coal-Fired Power Plant Project 32
Table 5-1 Matrix Impact Interaction on Preconstruction Phase
Activity Phase Preconstruction Environmental Component 1 2 3 4 5 6 Note
1. Climate, Air Quality and Noisy 1 = General Survey
a. Noise and Vibration - 2 = Activity Planning Socialization 2. Hydrology 3 = Planning and Mapping a. Water Resources Potency - 4 = Land Acquisition b. Water Resources Quality - 5 = Manpower Recruitment 3. Space, Land and Soil 6 = Jetty Construction a. Land Utility Existing - - = Negative Impact
b. Land Using - + = Positive Impact
c. Land Owner Status - - d. Landscape - 4. Biology a. Freshwater Composition - b. Nekton - 5. Social, Economic, and Culture a. Demography - b. Sex Ratio - c. Demography Dispersal - d. Manpower + e. Livelihood - + f. Live Style - g. Acceptability - - h. Perception - -
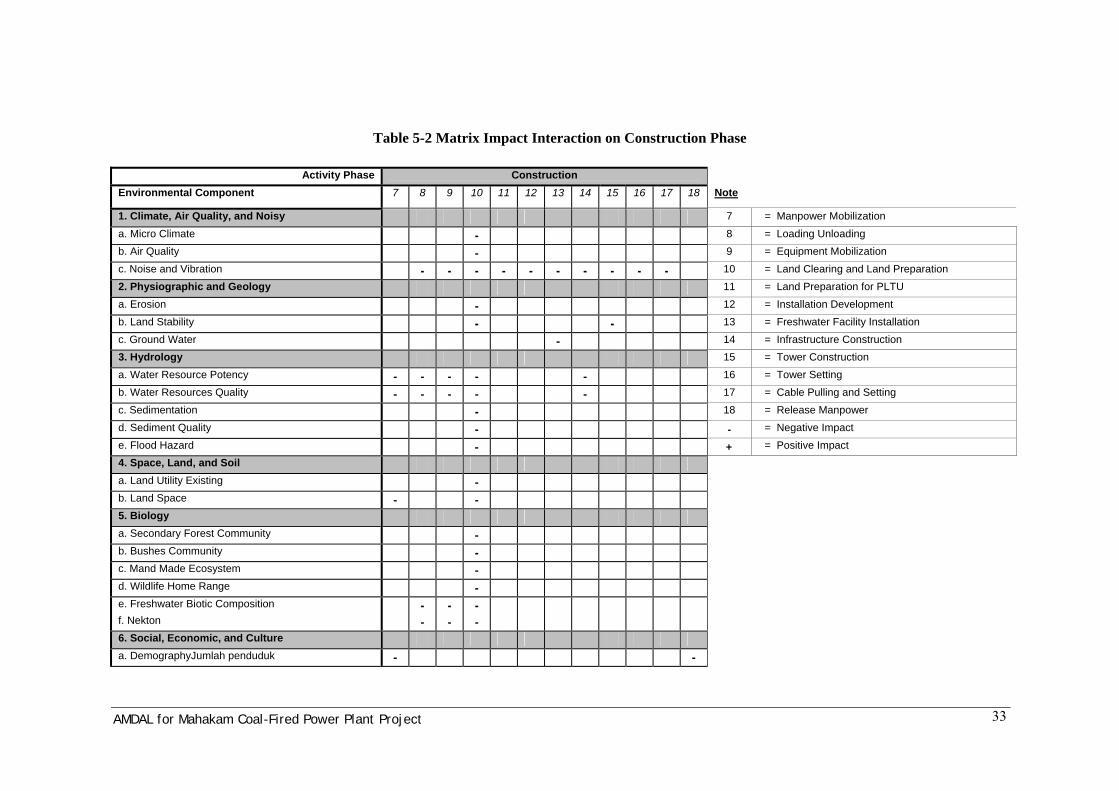
AMDAL for Mahakam Coal-Fired Power Plant Project 33
Table 5-2 Matrix Impact Interaction on Construction Phase
Activity Phase Construction Environmental Component 7 8 9 10 11 12 13 14 15 16 17 18 Note
1. Climate, Air Quality, and Noisy 7 = Manpower Mobilization
a. Micro Climate - 8 = Loading Unloading b. Air Quality - 9 = Equipment Mobilization c. Noise and Vibration - - - - - - - - - - 10 = Land Clearing and Land Preparation 2. Physiographic and Geology 11 = Land Preparation for PLTU a. Erosion - 12 = Installation Development b. Land Stability - - 13 = Freshwater Facility Installation c. Ground Water - 14 = Infrastructure Construction 3. Hydrology 15 = Tower Construction a. Water Resource Potency - - - - - 16 = Tower Setting b. Water Resources Quality - - - - - 17 = Cable Pulling and Setting c. Sedimentation - 18 = Release Manpower d. Sediment Quality - - = Negative Impact e. Flood Hazard - + = Positive Impact 4. Space, Land, and Soil a. Land Utility Existing - b. Land Space - - 5. Biology a. Secondary Forest Community - b. Bushes Community - c. Mand Made Ecosystem - d. Wildlife Home Range - e. Freshwater Biotic Composition - - - f. Nekton - - -
6. Social, Economic, and Culture a. DemographyJumlah penduduk - -

AMDAL for Mahakam Coal-Fired Power Plant Project 34
b. Sex Ratio - - c. Demography Dispersal - - d. Manpower + - e. Livelihood + - f. Traffic Hazard - - g. Criminality - - h. Live Style - - i. Acceptability - j. Perception - - - k. Acculturation - 7. Health a. Health Infrastructures - b. Sanitation Hazard -
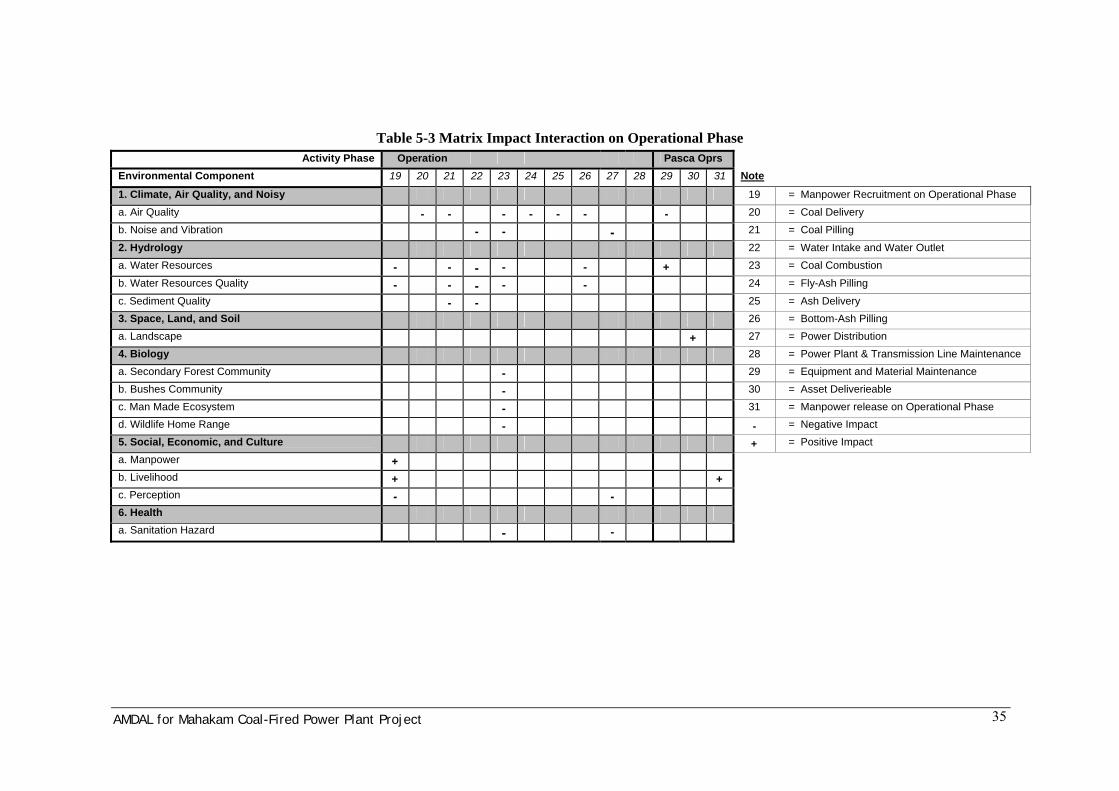
AMDAL for Mahakam Coal-Fired Power Plant Project 35
Table 5-3 Matrix Impact Interaction on Operational Phase Activity Phase Operation Pasca Oprs
Environmental Component 19 20 21 22 23 24 25 26 27 28 29 30 31 Note
1. Climate, Air Quality, and Noisy 19 = Manpower Recruitment on Operational Phase
a. Air Quality - - - - - - - 20 = Coal Delivery b. Noise and Vibration - - - 21 = Coal Pilling
2. Hydrology 22 = Water Intake and Water Outlet a. Water Resources - - - - - + 23 = Coal Combustion
b. Water Resources Quality - - - - - 24 = Fly-Ash Pilling
c. Sediment Quality - - 25 = Ash Delivery 3. Space, Land, and Soil 26 = Bottom-Ash Pilling a. Landscape + 27 = Power Distribution 4. Biology 28 = Power Plant & Transmission Line Maintenance a. Secondary Forest Community - 29 = Equipment and Material Maintenance b. Bushes Community - 30 = Asset Deliverieable c. Man Made Ecosystem - 31 = Manpower release on Operational Phase d. Wildlife Home Range - - = Negative Impact 5. Social, Economic, and Culture + = Positive Impact a. Manpower + b. Livelihood + + c. Perception - - 6. Health
a. Sanitation Hazard - -

AMDAL for Mahakam Coal-Fired Power Plant Project 36
Chapter 6 EVALUATION OF EXTENSIVE AND SIGNIFICANT IMPACTS
Development could result in both positive and negative changes. However, not all changes are followed by extensive and significant impacts. This chapter presents evaluation of changes associated with the construction of the power plant and its transmission lines, and is aimed to determine whether or not the changes would cause extensive and/or significant impacts. Moreover, the management guidelines to mitigate these impacts are described.
6.1 Analysis of Extensive and Significant Impacts
Description of impact evaluation is presented consecutively and corresponds to each development stage.
6.1.1 Pre-Construction Stage
6.1.1.1 Measurement, Mapping and Other Data Collection
These activities are aimed to collect data and information pertinent to the project site. The impacted environmental components are land ownership status, manpower affairs, community’s perceptions, and livelihood and production activities.
6.1.1.1.1 Land Ownership Status
As indicated in the previous chapter, the lands for the power plant are locally government-owned and have been used for coal mining.
6.1.1.1.2 Manpower Affairs
Pre-construction stage causes a positive impact on manpower issues but it will be insignificant in nature. This is because only 5-10 people local people will be involved and only for a short period of time. Involvement of the few select local people is not expected to create jealousy among the others.
6.1.1.1.3 Community Perceptions
Generally, local people were supportive toward the planned project. Visitations of the study team have increased positive perceptions and higher expectation for the realization of the project. However, the positive impact on local community’s perceptions is considered trivial since the project has not been realized yet and local involvement is relatively limited.
6.1.1.1.4 Livelihoods and Production Activities
The planned activities will have positive impacts on local people’s livelihood particularly to those working in the transportation sector. The use of river transportation vehicles by the study team has directly increased the boat’s owners’ and/or operators’ income since they received

AMDAL for Mahakam Coal-Fired Power Plant Project 37
higher than usual payment. However, the profits were temporary and short-lived, only for 5-10 days, and local involvement was limited, hence the impact is considered as insignificant.
6.1.1.2 Land Acquisition
6.1.1.2.1 Land Ownership Status
From the land ownership perspective, land acquisition could cause negative impacts. The transfer of land rights from existing owners to the project owner with necessary compensation could potentially provoke conflicts. Unsettled land compensation issues could cause vertical conflicts between local owners and the project owner, while unclear land boundaries could induce horizontal conflicts among local land owners. Concerning land acquisition for the transmission lines, different perceptions on land compensation issues between land owners and the project owner could also cause negative impacts as it potentially creates vertical conflict. Besides, the existence of transmission towers and prohibitions on cultivating the land underneath would devalue the price of land.
6.1.1.2.2 Land-Use
Construction and operation of the power plant would make the project site inaccessible to local people. The cut off of access could trigger conflicts with local communities. Impacts on land-use are cumulative and long-term, hence they are considered as negative, extensive and significant.
6.1.1.2.3 Spatial Planning
Land acquisition would impact spatial planning of the area as it will change the existing space pattern and structure, especially in Loa Janan District. However, such impact is not expected to take place in districts where transmission towers will be installed (i.e. in Harapan Baru Districts). According to the revised Spatial Planning of Kutai Kartanegara Regency Year 2002, the area of the project site was designated for coal mining. The construction of the power plant and the transmission lines will change the area function, i.e. for energy industry purposes. Nevertheless, such changes are possible as long as they abide by the prevailing government regulations. The impact, therefore, is not considered to become negative, not considered to become extensive and is considered to be insignificant.
6.1.1.2.4 Livelihood and Production Activities
Change of land ownership status will have negative impact on livelihood and production activities. Since only a few people would be affected, the negative impact on livelihood and production activities is considered as insignificant.
6.1.1.2.5 Lifestyle
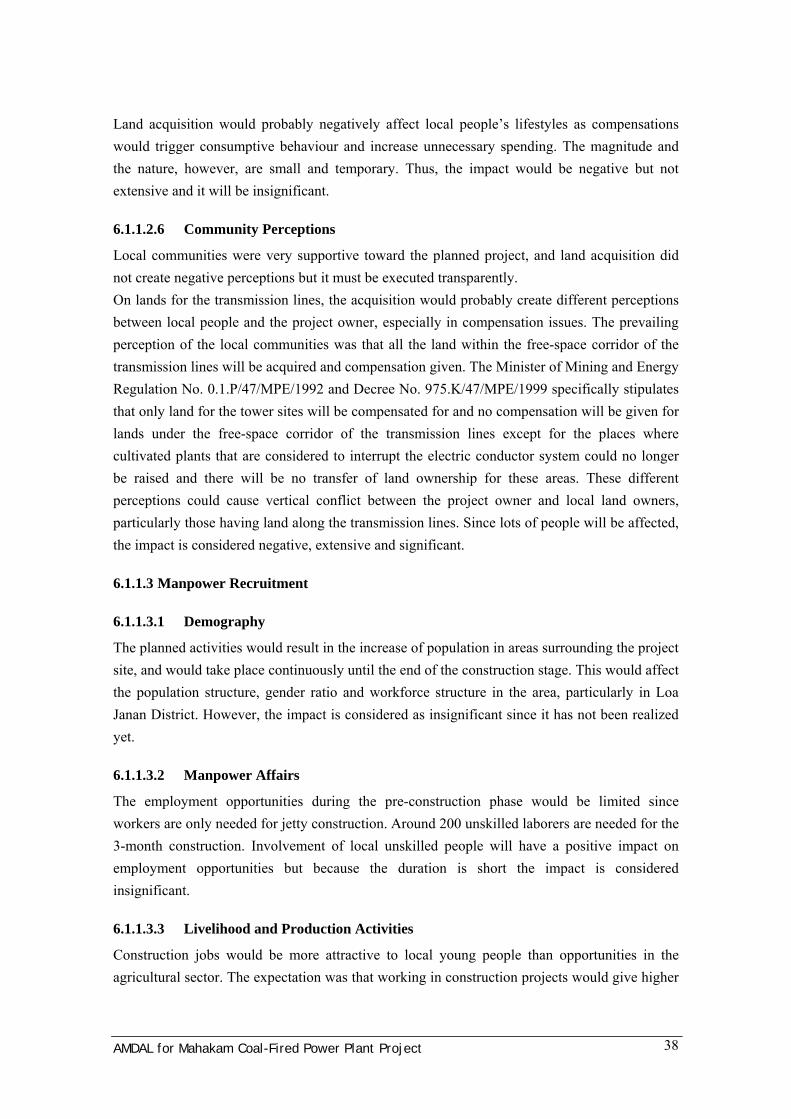
AMDAL for Mahakam Coal-Fired Power Plant Project 38
Land acquisition would probably negatively affect local people’s lifestyles as compensations would trigger consumptive behaviour and increase unnecessary spending. The magnitude and the nature, however, are small and temporary. Thus, the impact would be negative but not extensive and it will be insignificant.
6.1.1.2.6 Community Perceptions
Local communities were very supportive toward the planned project, and land acquisition did not create negative perceptions but it must be executed transparently. On lands for the transmission lines, the acquisition would probably create different perceptions between local people and the project owner, especially in compensation issues. The prevailing perception of the local communities was that all the land within the free-space corridor of the transmission lines will be acquired and compensation given. The Minister of Mining and Energy Regulation No. 0.1.P/47/MPE/1992 and Decree No. 975.K/47/MPE/1999 specifically stipulates that only land for the tower sites will be compensated for and no compensation will be given for lands under the free-space corridor of the transmission lines except for the places where cultivated plants that are considered to interrupt the electric conductor system could no longer be raised and there will be no transfer of land ownership for these areas. These different perceptions could cause vertical conflict between the project owner and local land owners, particularly those having land along the transmission lines. Since lots of people will be affected, the impact is considered negative, extensive and significant.
6.1.1.3 Manpower Recruitment
6.1.1.3.1 Demography
The planned activities would result in the increase of population in areas surrounding the project site, and would take place continuously until the end of the construction stage. This would affect the population structure, gender ratio and workforce structure in the area, particularly in Loa Janan District. However, the impact is considered as insignificant since it has not been realized yet.
6.1.1.3.2 Manpower Affairs
The employment opportunities during the pre-construction phase would be limited since workers are only needed for jetty construction. Around 200 unskilled laborers are needed for the 3-month construction. Involvement of local unskilled people will have a positive impact on employment opportunities but because the duration is short the impact is considered insignificant.
6.1.1.3.3 Livelihood and Production Activities
Construction jobs would be more attractive to local young people than opportunities in the agricultural sector. The expectation was that working in construction projects would give higher

AMDAL for Mahakam Coal-Fired Power Plant Project 39
income and better employment conditions. The impact, however, would be insignificant and not extensive since the opportunities are few and only a small number of outsiders are to be involved.
6.1.1.4 Construction of the Jetty
6.1.1.4.1 Noise
Construction of the jetty would produce noise with intensity reaching 74 dB (A) especially during the dredging, and installation of the jetty’s foundation and piles. That value exceeds the threshold value for an inhabited settlement but since the closest settlement is located about 500 meters away from the project site, the negative impact is considered to be insignificant.
6.1.1.4.2 Potential and Quality of Water Resources
Construction of the jetty will have an impact on water quality as it would stir and release the river’s sediment to the water column during dredging and pile installation. It was estimated that the concentration of total suspended solids (TSS) would increase 30% more than the current concentration. Besides, there are possibilities that other contaminants would also be released to the water column. The increase of TSS is predicted to decrease dissolved oxygen concentration by 0.5 to 2 mg/l in certain areas near the location of the jetty construction but this would return to normal (i.e. it is reversible) within a radius 10 meters of the activities. The increase of TSS would not affect local people as the jetty will be constructed in the lower reaches. The impact, therefore, is considered to be negative but not extensive and it is considered to be insignificant.
6.1.1.4.3 Aquatic Biota Resources
Construction of the jetty will have a negative impact on aquatic biota especially to the bottom dwelling organisms, the benthos. The impact will be temporary --only during construction activities-- and the benthos would recover once the construction is ended. Changes in water quality associated with the jetty construction would have an impact on species composition of plankton and nekton (fishes) but the impact is expected to be short-term and insignificant as they are mobile organisms (i.e. could avoid the impacted area and move to other areas). Similarly, the impact is reversible and plankton and nekton would easily recover once the construction is ended. The impact on benthos, plankton and nekton is considered to be negative but insignificant and not extensive.
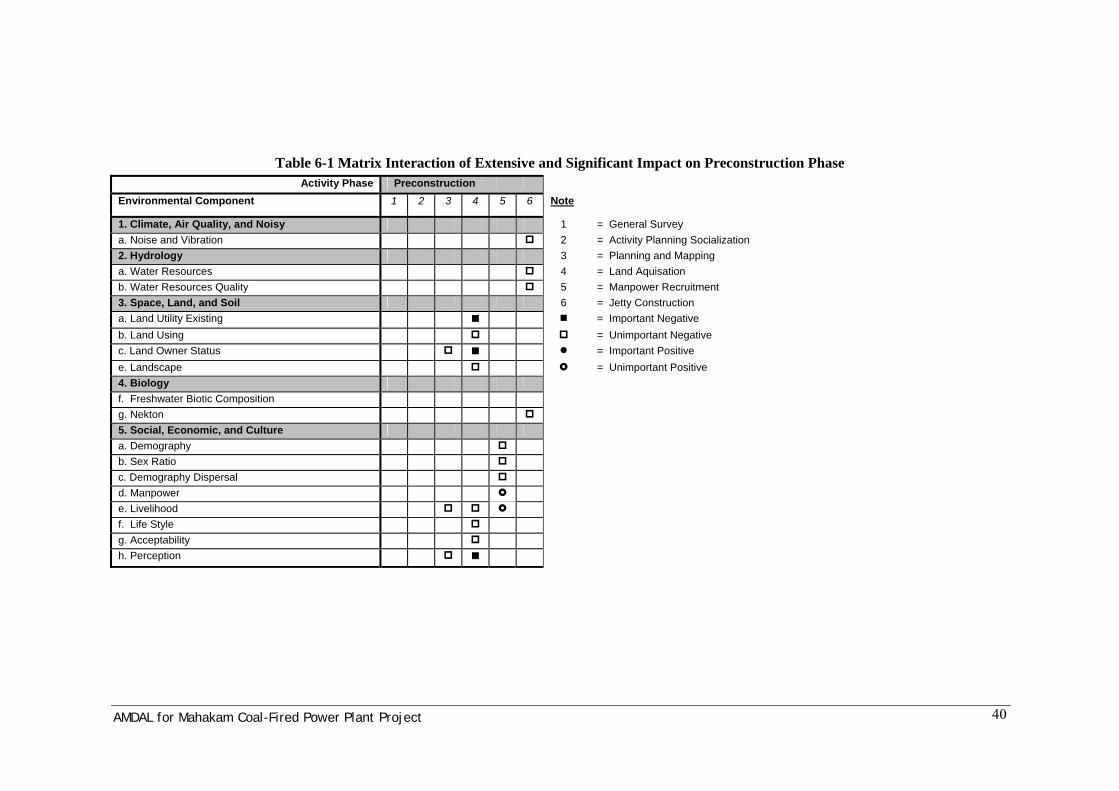
AMDAL for Mahakam Coal-Fired Power Plant Project 40
Table 6-1 Matrix Interaction of Extensive and Significant Impact on Preconstruction Phase Activity Phase Preconstruction
Environmental Component 1 2 3 4 5 6 Note
1. Climate, Air Quality, and Noisy 1 = General Survey a. Noise and Vibration 2 = Activity Planning Socialization 2. Hydrology 3 = Planning and Mapping a. Water Resources 4 = Land Aquisation b. Water Resources Quality 5 = Manpower Recruitment 3. Space, Land, and Soil 6 = Jetty Construction a. Land Utility Existing = Important Negative b. Land Using = Unimportant Negative c. Land Owner Status = Important Positive e. Landscape = Unimportant Positive 4. Biology
f. Freshwater Biotic Composition
g. Nekton
5. Social, Economic, and Culture a. Demography b. Sex Ratio c. Demography Dispersal d. Manpower e. Livelihood f. Life Style g. Acceptability h. Perception
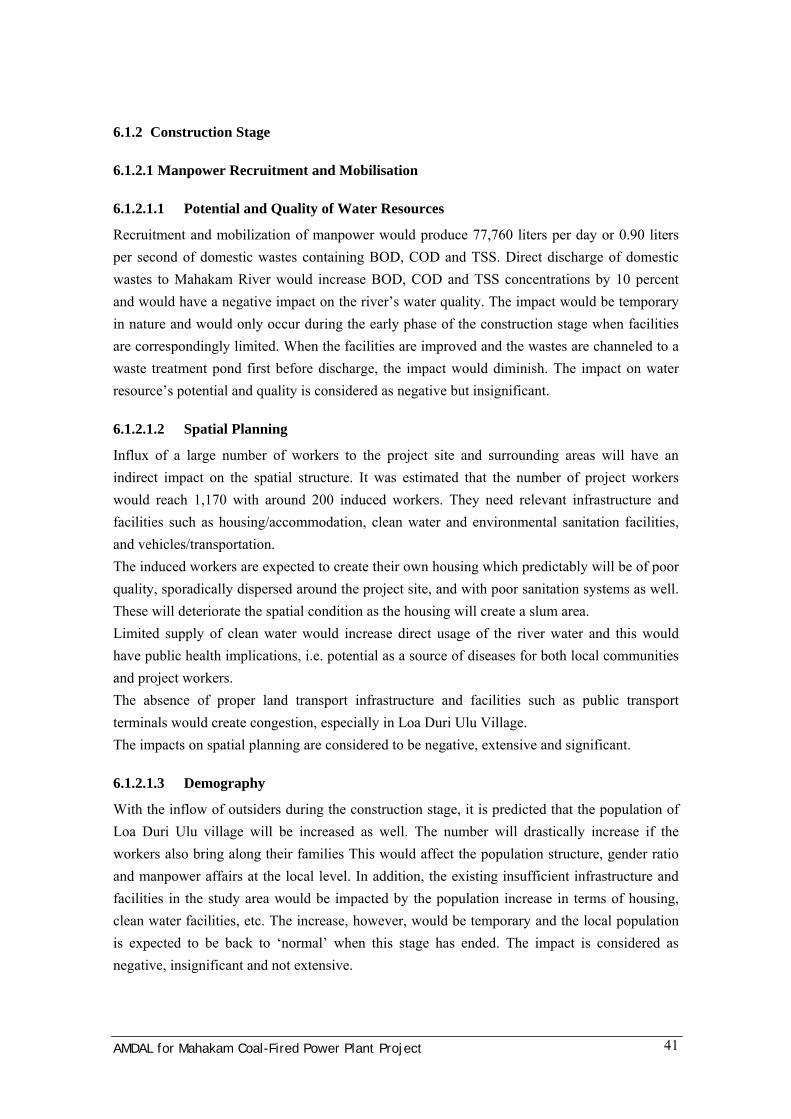
AMDAL for Mahakam Coal-Fired Power Plant Project 41
6.1.2 Construction Stage
6.1.2.1 Manpower Recruitment and Mobilisation
6.1.2.1.1 Potential and Quality of Water Resources
Recruitment and mobilization of manpower would produce 77,760 liters per day or 0.90 liters per second of domestic wastes containing BOD, COD and TSS. Direct discharge of domestic wastes to Mahakam River would increase BOD, COD and TSS concentrations by 10 percent and would have a negative impact on the river’s water quality. The impact would be temporary in nature and would only occur during the early phase of the construction stage when facilities are correspondingly limited. When the facilities are improved and the wastes are channeled to a waste treatment pond first before discharge, the impact would diminish. The impact on water resource’s potential and quality is considered as negative but insignificant.
6.1.2.1.2 Spatial Planning
Influx of a large number of workers to the project site and surrounding areas will have an indirect impact on the spatial structure. It was estimated that the number of project workers would reach 1,170 with around 200 induced workers. They need relevant infrastructure and facilities such as housing/accommodation, clean water and environmental sanitation facilities, and vehicles/transportation. The induced workers are expected to create their own housing which predictably will be of poor quality, sporadically dispersed around the project site, and with poor sanitation systems as well. These will deteriorate the spatial condition as the housing will create a slum area. Limited supply of clean water would increase direct usage of the river water and this would have public health implications, i.e. potential as a source of diseases for both local communities and project workers. The absence of proper land transport infrastructure and facilities such as public transport terminals would create congestion, especially in Loa Duri Ulu Village. The impacts on spatial planning are considered to be negative, extensive and significant.
6.1.2.1.3 Demography
With the inflow of outsiders during the construction stage, it is predicted that the population of Loa Duri Ulu village will be increased as well. The number will drastically increase if the workers also bring along their families This would affect the population structure, gender ratio and manpower affairs at the local level. In addition, the existing insufficient infrastructure and facilities in the study area would be impacted by the population increase in terms of housing, clean water facilities, etc. The increase, however, would be temporary and the local population is expected to be back to ‘normal’ when this stage has ended. The impact is considered as negative, insignificant and not extensive.
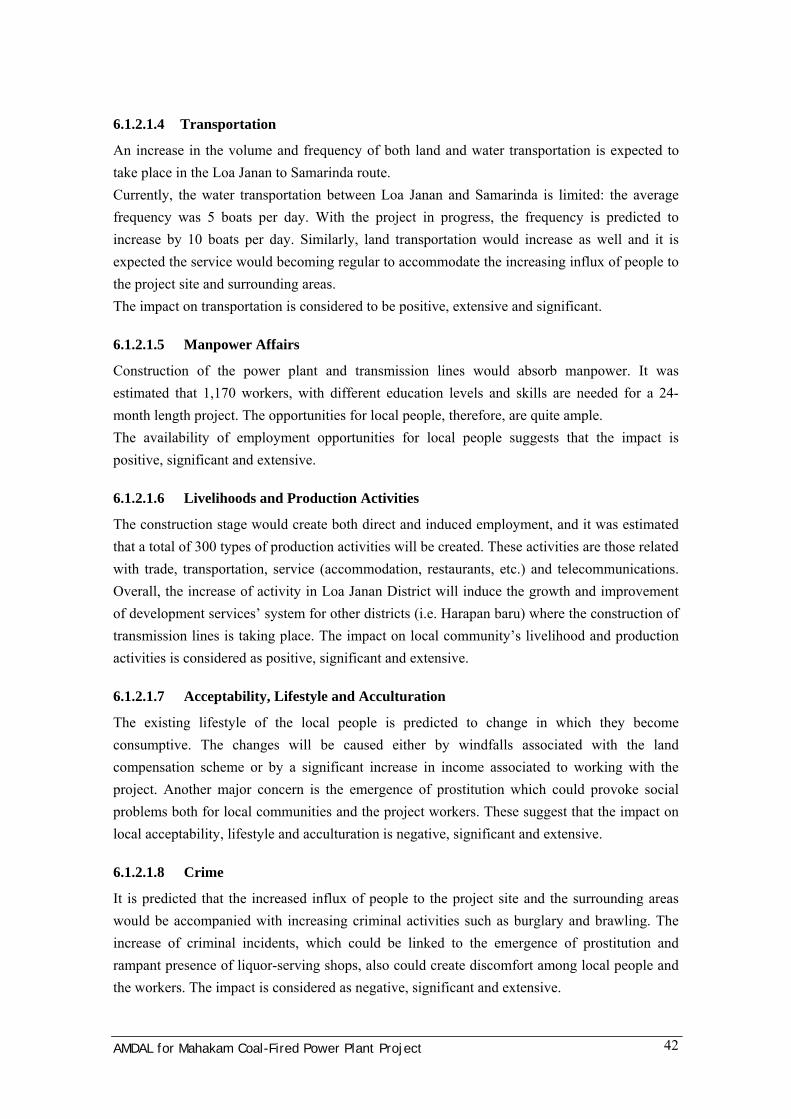
AMDAL for Mahakam Coal-Fired Power Plant Project 42
6.1.2.1.4 Transportation
An increase in the volume and frequency of both land and water transportation is expected to take place in the Loa Janan to Samarinda route. Currently, the water transportation between Loa Janan and Samarinda is limited: the average frequency was 5 boats per day. With the project in progress, the frequency is predicted to increase by 10 boats per day. Similarly, land transportation would increase as well and it is expected the service would becoming regular to accommodate the increasing influx of people to the project site and surrounding areas. The impact on transportation is considered to be positive, extensive and significant.
6.1.2.1.5 Manpower Affairs
Construction of the power plant and transmission lines would absorb manpower. It was estimated that 1,170 workers, with different education levels and skills are needed for a 24-month length project. The opportunities for local people, therefore, are quite ample. The availability of employment opportunities for local people suggests that the impact is positive, significant and extensive.
6.1.2.1.6 Livelihoods and Production Activities
The construction stage would create both direct and induced employment, and it was estimated that a total of 300 types of production activities will be created. These activities are those related with trade, transportation, service (accommodation, restaurants, etc.) and telecommunications. Overall, the increase of activity in Loa Janan District will induce the growth and improvement of development services’ system for other districts (i.e. Harapan baru) where the construction of transmission lines is taking place. The impact on local community’s livelihood and production activities is considered as positive, significant and extensive.
6.1.2.1.7 Acceptability, Lifestyle and Acculturation
The existing lifestyle of the local people is predicted to change in which they become consumptive. The changes will be caused either by windfalls associated with the land compensation scheme or by a significant increase in income associated to working with the project. Another major concern is the emergence of prostitution which could provoke social problems both for local communities and the project workers. These suggest that the impact on local acceptability, lifestyle and acculturation is negative, significant and extensive.
6.1.2.1.8 Crime
It is predicted that the increased influx of people to the project site and the surrounding areas would be accompanied with increasing criminal activities such as burglary and brawling. The increase of criminal incidents, which could be linked to the emergence of prostitution and rampant presence of liquor-serving shops, also could create discomfort among local people and the workers. The impact is considered as negative, significant and extensive.
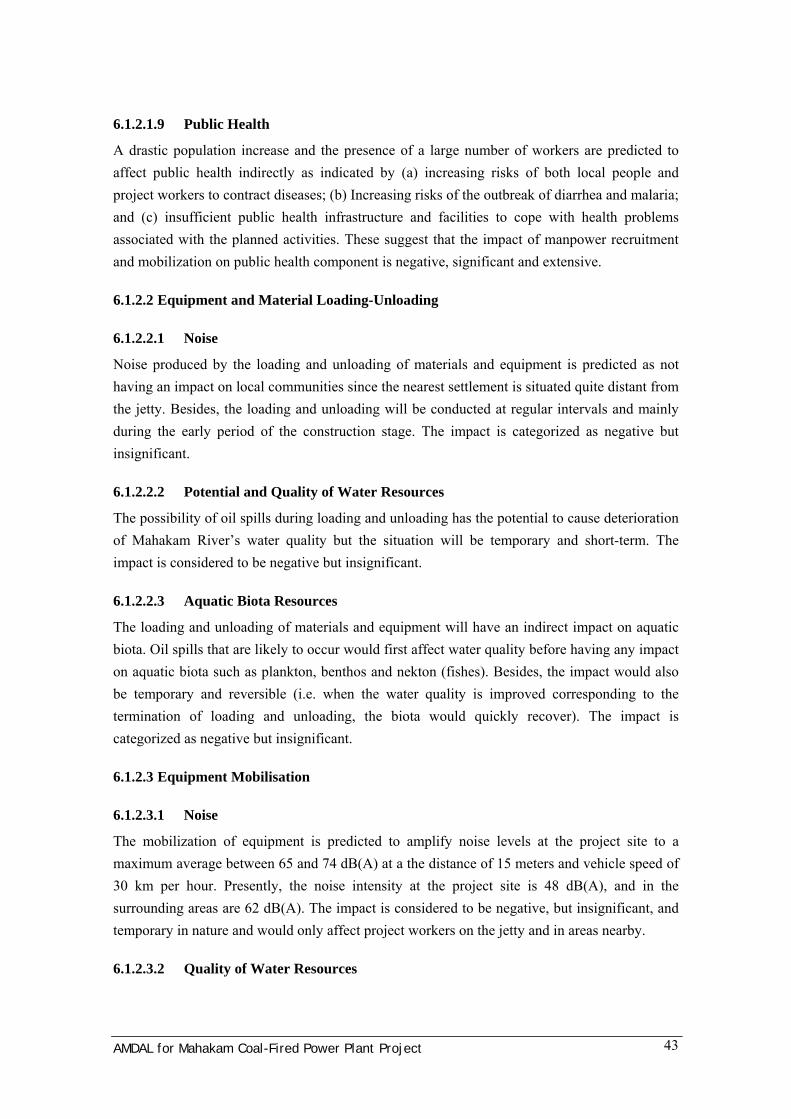
AMDAL for Mahakam Coal-Fired Power Plant Project 43
6.1.2.1.9 Public Health
A drastic population increase and the presence of a large number of workers are predicted to affect public health indirectly as indicated by (a) increasing risks of both local people and project workers to contract diseases; (b) Increasing risks of the outbreak of diarrhea and malaria; and (c) insufficient public health infrastructure and facilities to cope with health problems associated with the planned activities. These suggest that the impact of manpower recruitment and mobilization on public health component is negative, significant and extensive.
6.1.2.2 Equipment and Material Loading-Unloading
6.1.2.2.1 Noise
Noise produced by the loading and unloading of materials and equipment is predicted as not having an impact on local communities since the nearest settlement is situated quite distant from the jetty. Besides, the loading and unloading will be conducted at regular intervals and mainly during the early period of the construction stage. The impact is categorized as negative but insignificant.
6.1.2.2.2 Potential and Quality of Water Resources
The possibility of oil spills during loading and unloading has the potential to cause deterioration of Mahakam River’s water quality but the situation will be temporary and short-term. The impact is considered to be negative but insignificant.
6.1.2.2.3 Aquatic Biota Resources
The loading and unloading of materials and equipment will have an indirect impact on aquatic biota. Oil spills that are likely to occur would first affect water quality before having any impact on aquatic biota such as plankton, benthos and nekton (fishes). Besides, the impact would also be temporary and reversible (i.e. when the water quality is improved corresponding to the termination of loading and unloading, the biota would quickly recover). The impact is categorized as negative but insignificant.
6.1.2.3 Equipment Mobilisation
6.1.2.3.1 Noise
The mobilization of equipment is predicted to amplify noise levels at the project site to a maximum average between 65 and 74 dB(A) at a the distance of 15 meters and vehicle speed of 30 km per hour. Presently, the noise intensity at the project site is 48 dB(A), and in the surrounding areas are 62 dB(A). The impact is considered to be negative, but insignificant, and temporary in nature and would only affect project workers on the jetty and in areas nearby.
6.1.2.3.2 Quality of Water Resources

AMDAL for Mahakam Coal-Fired Power Plant Project 44
Equipments mobilization will have an impact on Mahakam River by deteriorating its water quality temporarily and for a short-term. The impact is considered to be negative but insignificant.
6.1.2.3.3 Aquatic Biota Resources
Similar to the loading and unloading of materials and equipment, the impact of equipment mobilization will have an indirect impact on aquatic biota. Oil spills that are likely to occur during the mobilization would first affect water quality before having an impact on aquatic biota such as plankton, benthos and nekton (fishes). Besides, the impact is not permanent and as reversible (i.e. when the water quality is improved corresponding to the termination of equipment mobilization, the biota would quickly recover). The impact is considered to be negative but insignificant.
6.1.2.3.4 Transportation
Equipment mobilization will have an indirect impact on transportation. This will be a consequence of the increasing influx of job-seekers and/or manpower from the surrounding areas to Loa Janan District, especially to Loa Duri Ulu villages. The increase of the traffic volume of river transportation would only happen on the route between Loa Janan and Samarinda (Loa Janan-Samarinda) but this is not necessarily caused by equipment mobilization. The impact is considered as negative but insignificant.
6.1.2.4 Land Clearing and Preparation
6.1.2.4.1 Micro-Climate and Air Quality
Change of micro-climate is primarily caused by increase of temperature due to loss of vegetation cover. Increase of temperature would affect soil surface evaporation causing soil to become dry and dusty. The impact is temporary and only in areas where land clearing and preparation takes place thus it is also reversible and not cumulative. The impact is therefore considered as negative, insignificant and not extensive.
6.1.2.4.2 Noise
The intensity of noise produced by land clearing and preparation exceeds the maximum allowable level of 45 dB(A) (during the day) and 40 dB(A) (during the night) for an inhabited settlement. The impact is temporary but the intensity will potentially have an impact on those exposed to it such as the workers and local people. The impact is categorized as negative and significant.
6.1.2.4.3 Quality of Water Resources
Land clearing and preparation will have an impact on the potential and quality of water resources and reduce water soil infiltration capacity of the soil. Increasing run-off would follow with an increase of suspended solids in the runoff water and because of the high rainfall in the
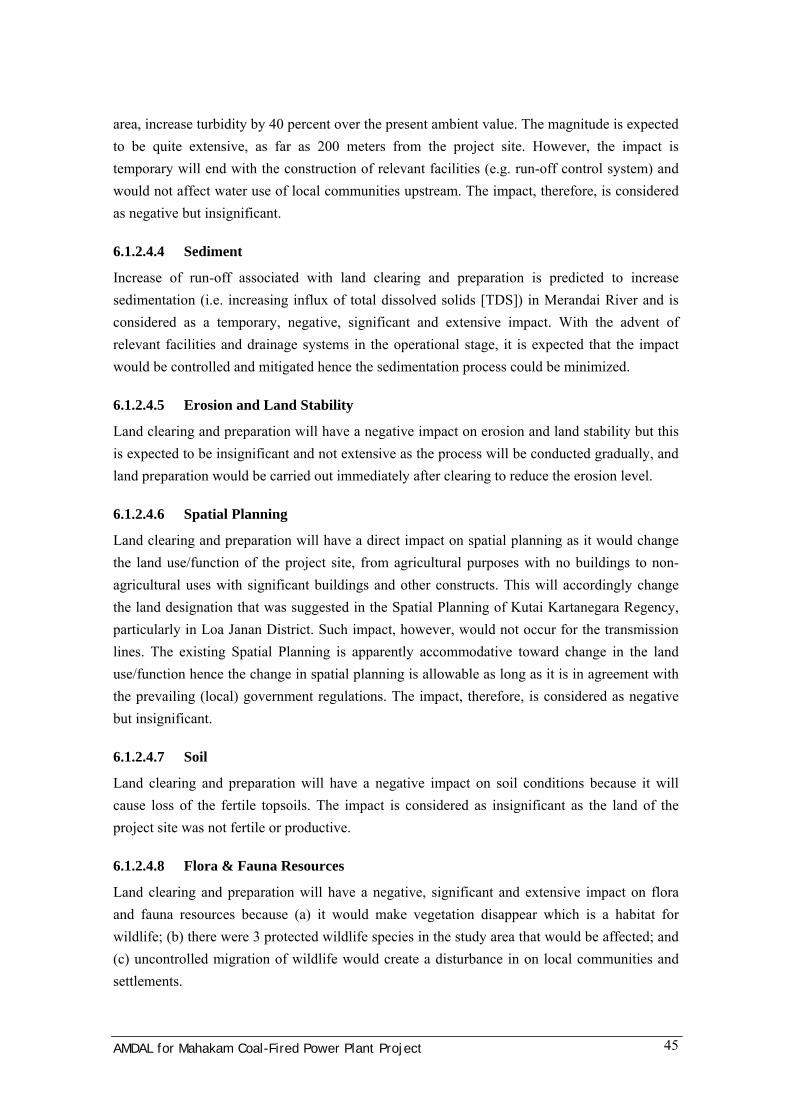
AMDAL for Mahakam Coal-Fired Power Plant Project 45
area, increase turbidity by 40 percent over the present ambient value. The magnitude is expected to be quite extensive, as far as 200 meters from the project site. However, the impact is temporary will end with the construction of relevant facilities (e.g. run-off control system) and would not affect water use of local communities upstream. The impact, therefore, is considered as negative but insignificant.
6.1.2.4.4 Sediment
Increase of run-off associated with land clearing and preparation is predicted to increase sedimentation (i.e. increasing influx of total dissolved solids [TDS]) in Merandai River and is considered as a temporary, negative, significant and extensive impact. With the advent of relevant facilities and drainage systems in the operational stage, it is expected that the impact would be controlled and mitigated hence the sedimentation process could be minimized.
6.1.2.4.5 Erosion and Land Stability
Land clearing and preparation will have a negative impact on erosion and land stability but this is expected to be insignificant and not extensive as the process will be conducted gradually, and land preparation would be carried out immediately after clearing to reduce the erosion level.
6.1.2.4.6 Spatial Planning
Land clearing and preparation will have a direct impact on spatial planning as it would change the land use/function of the project site, from agricultural purposes with no buildings to non-agricultural uses with significant buildings and other constructs. This will accordingly change the land designation that was suggested in the Spatial Planning of Kutai Kartanegara Regency, particularly in Loa Janan District. Such impact, however, would not occur for the transmission lines. The existing Spatial Planning is apparently accommodative toward change in the land use/function hence the change in spatial planning is allowable as long as it is in agreement with the prevailing (local) government regulations. The impact, therefore, is considered as negative but insignificant.
6.1.2.4.7 Soil
Land clearing and preparation will have a negative impact on soil conditions because it will cause loss of the fertile topsoils. The impact is considered as insignificant as the land of the project site was not fertile or productive.
6.1.2.4.8 Flora & Fauna Resources
Land clearing and preparation will have a negative, significant and extensive impact on flora and fauna resources because (a) it would make vegetation disappear which is a habitat for wildlife; (b) there were 3 protected wildlife species in the study area that would be affected; and (c) uncontrolled migration of wildlife would create a disturbance in on local communities and settlements.
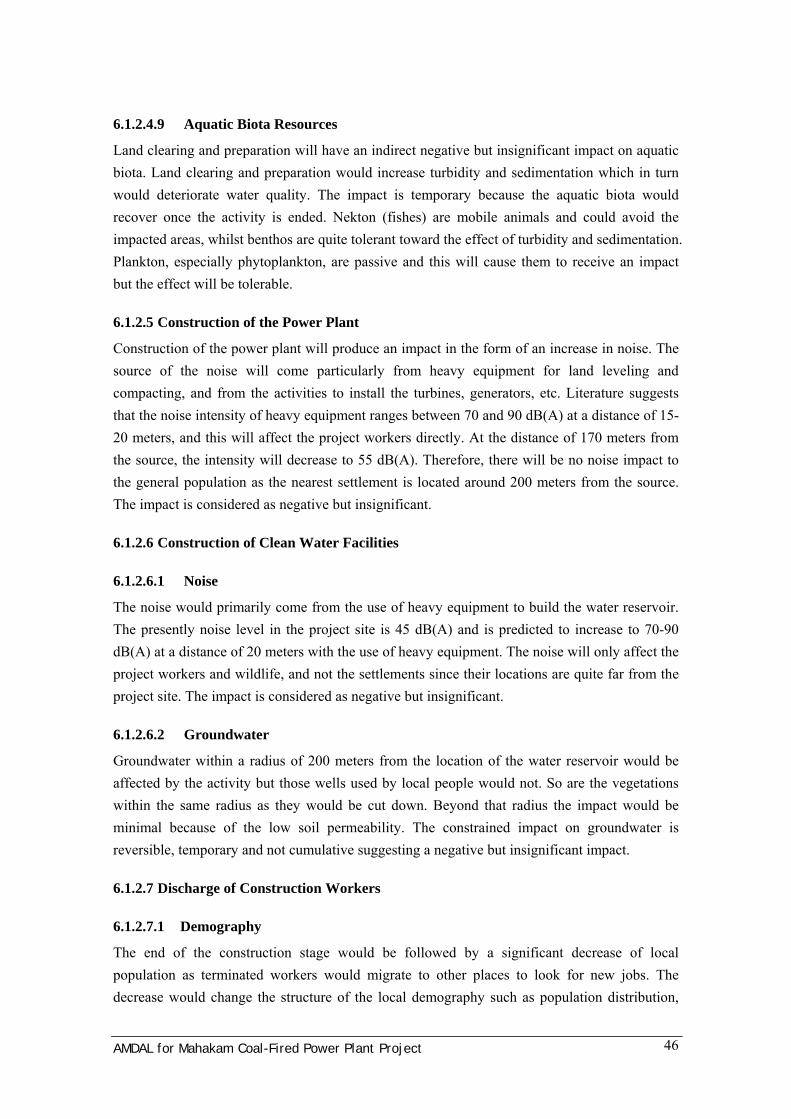
AMDAL for Mahakam Coal-Fired Power Plant Project 46
6.1.2.4.9 Aquatic Biota Resources
Land clearing and preparation will have an indirect negative but insignificant impact on aquatic biota. Land clearing and preparation would increase turbidity and sedimentation which in turn would deteriorate water quality. The impact is temporary because the aquatic biota would recover once the activity is ended. Nekton (fishes) are mobile animals and could avoid the impacted areas, whilst benthos are quite tolerant toward the effect of turbidity and sedimentation. Plankton, especially phytoplankton, are passive and this will cause them to receive an impact but the effect will be tolerable.
6.1.2.5 Construction of the Power Plant
Construction of the power plant will produce an impact in the form of an increase in noise. The source of the noise will come particularly from heavy equipment for land leveling and compacting, and from the activities to install the turbines, generators, etc. Literature suggests that the noise intensity of heavy equipment ranges between 70 and 90 dB(A) at a distance of 15-20 meters, and this will affect the project workers directly. At the distance of 170 meters from the source, the intensity will decrease to 55 dB(A). Therefore, there will be no noise impact to the general population as the nearest settlement is located around 200 meters from the source. The impact is considered as negative but insignificant.
6.1.2.6 Construction of Clean Water Facilities
6.1.2.6.1 Noise
The noise would primarily come from the use of heavy equipment to build the water reservoir. The presently noise level in the project site is 45 dB(A) and is predicted to increase to 70-90 dB(A) at a distance of 20 meters with the use of heavy equipment. The noise will only affect the project workers and wildlife, and not the settlements since their locations are quite far from the project site. The impact is considered as negative but insignificant.
6.1.2.6.2 Groundwater
Groundwater within a radius of 200 meters from the location of the water reservoir would be affected by the activity but those wells used by local people would not. So are the vegetations within the same radius as they would be cut down. Beyond that radius the impact would be minimal because of the low soil permeability. The constrained impact on groundwater is reversible, temporary and not cumulative suggesting a negative but insignificant impact.
6.1.2.7 Discharge of Construction Workers
6.1.2.7.1 Demography
The end of the construction stage would be followed by a significant decrease of local population as terminated workers would migrate to other places to look for new jobs. The decrease would change the structure of the local demography such as population distribution,
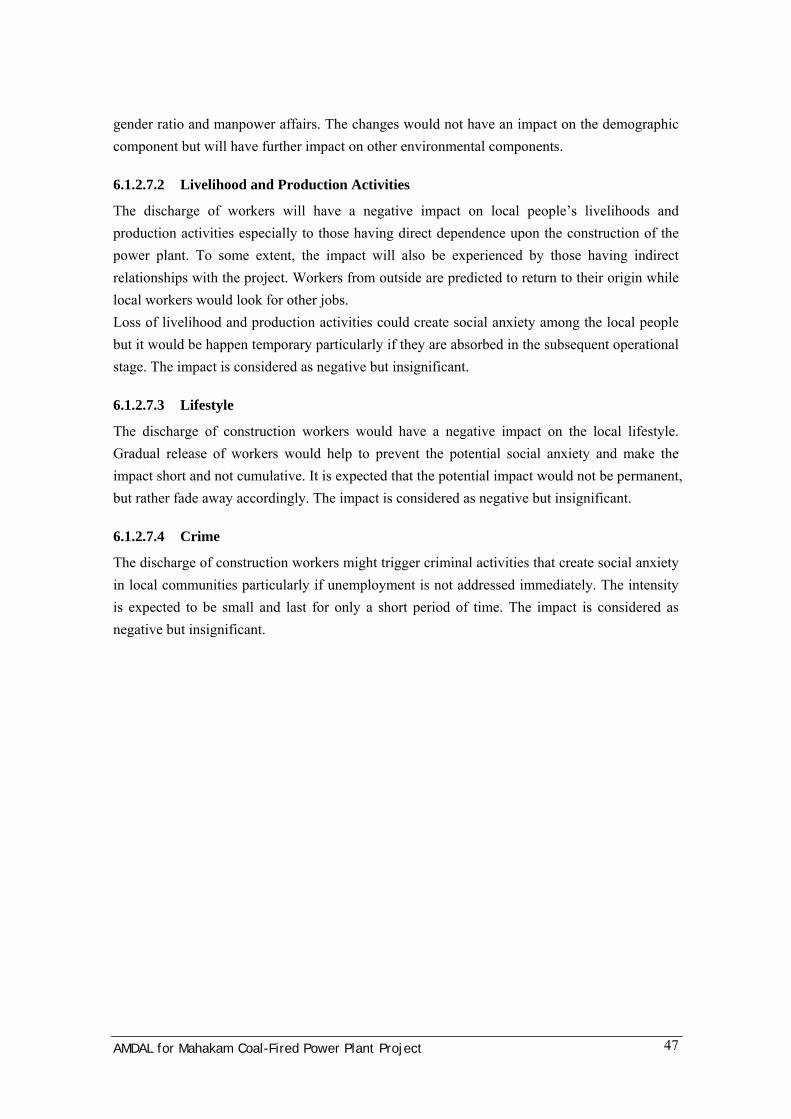
AMDAL for Mahakam Coal-Fired Power Plant Project 47
gender ratio and manpower affairs. The changes would not have an impact on the demographic component but will have further impact on other environmental components.
6.1.2.7.2 Livelihood and Production Activities
The discharge of workers will have a negative impact on local people’s livelihoods and production activities especially to those having direct dependence upon the construction of the power plant. To some extent, the impact will also be experienced by those having indirect relationships with the project. Workers from outside are predicted to return to their origin while local workers would look for other jobs. Loss of livelihood and production activities could create social anxiety among the local people but it would be happen temporary particularly if they are absorbed in the subsequent operational stage. The impact is considered as negative but insignificant.
6.1.2.7.3 Lifestyle
The discharge of construction workers would have a negative impact on the local lifestyle. Gradual release of workers would help to prevent the potential social anxiety and make the impact short and not cumulative. It is expected that the potential impact would not be permanent, but rather fade away accordingly. The impact is considered as negative but insignificant.
6.1.2.7.4 Crime
The discharge of construction workers might trigger criminal activities that create social anxiety in local communities particularly if unemployment is not addressed immediately. The intensity is expected to be small and last for only a short period of time. The impact is considered as negative but insignificant.
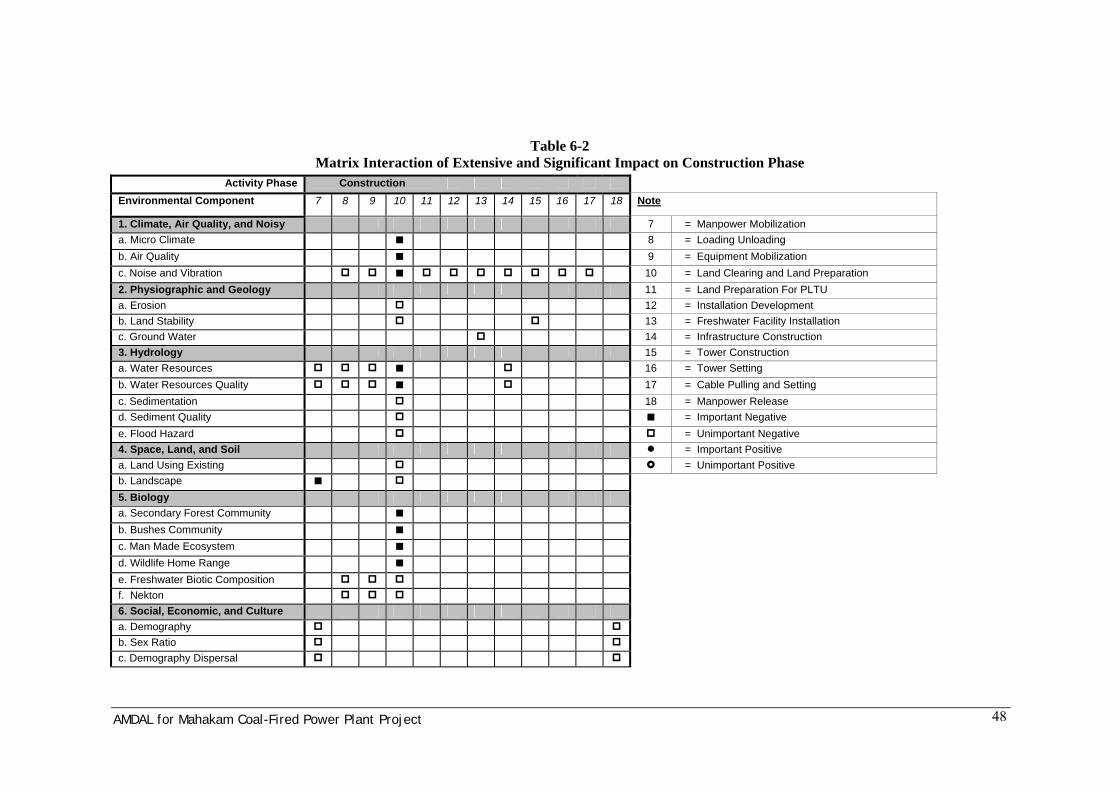
AMDAL for Mahakam Coal-Fired Power Plant Project 48
Table 6-2 Matrix Interaction of Extensive and Significant Impact on Construction Phase
Activity Phase Construction Environmental Component 7 8 9 10 11 12 13 14 15 16 17 18 Note
1. Climate, Air Quality, and Noisy 7 = Manpower Mobilization a. Micro Climate 8 = Loading Unloading b. Air Quality 9 = Equipment Mobilization c. Noise and Vibration 10 = Land Clearing and Land Preparation 2. Physiographic and Geology 11 = Land Preparation For PLTU a. Erosion 12 = Installation Development b. Land Stability 13 = Freshwater Facility Installation c. Ground Water 14 = Infrastructure Construction 3. Hydrology 15 = Tower Construction a. Water Resources 16 = Tower Setting b. Water Resources Quality 17 = Cable Pulling and Setting c. Sedimentation 18 = Manpower Release d. Sediment Quality = Important Negative e. Flood Hazard = Unimportant Negative 4. Space, Land, and Soil = Important Positive a. Land Using Existing = Unimportant Positive b. Landscape 5. Biology a. Secondary Forest Community b. Bushes Community c. Man Made Ecosystem d. Wildlife Home Range e. Freshwater Biotic Composition f. Nekton 6. Social, Economic, and Culture a. Demography
b. Sex Ratio
c. Demography Dispersal

AMDAL for Mahakam Coal-Fired Power Plant Project 49
d. Manpower
e. Livelihood
f. Traffic Hazard g. Criminality
h. Live Style
i. Acceptability j. Perception k. Acculturation 7. Health a. Health Infrastructure b. Sanitation Hazard

AMDAL for Mahakam Coal-Fired Power Plant Project 50
6.1.3 Operation Stage (Post-Construction Stage)
6.1.3.1 Manpower Recruitment and Mobilisation
6.1.3.1.1 Quality of Water Resources
Daily water requirements in the operational stage are 52,500 liters or equivalent to 31 percent of total requirements of the power plant. The production of domestic waste is estimated to be 42,000 liters per day and will contain organic pollutants such as BOD, COD and TSS. The domestic waste is planned to be sent to either a septic tank or an activated-sludge waste water treatment installation. The use of waste water treatment to maintain water quality in the receiving water body (in this case, Mahakam River) suggests that the impact should be considered as negative but insignificant.
6.1.3.1.2 Manpower Affairs and Livelihoods
It was estimated that a total of 350 workers with different educational backgrounds and skills would be employed to operate the power plant. Of this figure, 100 are to be allocated for non-skilled workers. This suggests opportunities for local people are limited since the majority of local people are only equipped with an elementary or secondary level education. Besides, locals are trained for agriculture related activities more than for industry especially electric energy supply. Nevertheless, although the employment opportunities are rather limited the net impact of the 100 new jobs for the local people is considered as positive, significant and extensive.
6.1.3.1.3 Community Perceptions
Limited employment opportunities with the power plant would create negative perceptions among the local people, and might create intra-community friction (i.e. horizontal conflict) and dislike toward the project owner (i.e. vertical conflict) because the project could not accommodate local aspirations as the number of job-seekers exceed the available openings. The impact, therefore, is considered as negative, significant and extensive.
6.1.3.2 Coal Transportation
Transportation of coal using a belt conveyor system and combined with selection of an optimum roadway is aimed to minimize the release of dust to the environment, hence it is expected to work well and negate the negative impact.
6.1.3.3 Coal Storage
6.1.3.3.1 Air Quality
The storage of coal at the project site would impact air quality in the surrounding areas since the open storage is prone to release dust when the wind blows. To minimize the likelihood of ash
AMDAL for Mahakam Coal-Fired Power Plant Project 51
escaping into the environment, it is planned to spray the storage area with water regularly. The impact is considered as negative but insignificant.
6.1.3.3.2 Potential and Quality of Water Resources
The storage of coal would indirectly affect water resource quality since the leachate waters would deteriorate the quality of the receiving water bodies. It is planned that the storage yard will be equipped with a drainage system that channels leachate waters to a sedimentation pit to settle down minerals and metals. Subsequently, the supernatant will be sent to an activated-sludge pond for further treatment. The use of specialized drainage and treatment systems suggests that the impact on water resource quality is considered as negative but insignificant.
6.1.3.4 Water Uptake and Discharge
6.1.3.4.1 Noise
The main source of noise is the operation of the pump station which is estimated to create a noise level with an intensity of 70 dB(A). The noise would create an impact throughout the operational stage but the extent is rather confined as the location of the pump station is far from the nearest settlement. Possibly, only the operators that would be exposed to the effect of the constantly high intensity noise but the damaging effect could be minimized or avoided with the use of appropriate gear such as hearing protection. The impact is considered as negative but insignificant.
6.1.3.4.2 Quality of Water Resources
The total daily water requirements of power plant during the operational stage of 9,100 m3 per day is considered to have a minor impact on the Mahakam River debit of 477,451 liters per second since the average water uptake is equivalent to a mere of 0.88 percent of the River’s average debit. The impact is therefore considered as negative but insignificant. Liquid wastes produced by the power plant will be treated first using activated-sludge to meet standard effluent criteria outlined in the Governor of East Kalimantan Regulation No. 339 Year 1988 on Liquid Waste Quality Standard (LWQS) for Industry, Hotels, Hospitals, Domestic Activities and Coal Mining. The concentration of effluents is not predicted to contribute significantly to initial concentrations of pollutants in Mahakam River since the increase of concentration is 0.3 percent for BOD, 0.057 percent for COD, and 0.2 percent for TSS. Continuous discharge of effluent to Mahakam River throughout the operation of the power plant is predicted to increase the concentration of some pollutants, hence the concentration of those pollutants in the effluent of the waste treatment must always be monitored and managed to prevent it from exceeding the effluent standards. Otherwise, it could deteriorate water quality in the long run. The impact is considered as negative significant and extensive.
6.1.3.4.3 Sediment

AMDAL for Mahakam Coal-Fired Power Plant Project 52
It is planned that the daily water uptake for the power plant will reach 9,100 m3 per day and it will be pumped using 2 pumps with a capacity of 2,500 m3 per day per unit. The suction mechanism is purposefully designed to be free from dirt and sediment; hence it will not stir the sediment and thus cause sediment quality deterioration. The impact is considered as negative but insignificant.
6.1.3.4.4 Aquatic Biota Resources
The uptake and discharge of water during the operational stage would not have any direct or extensive impact on aquatic biota such as plankton, nekton and benthos. This is because the water will be taken from the reservoir, and treated first before being discharged back to Mahakam River. The treatment is aimed to control the water temperature and acidity so the value will be at the ambient level of 27oC and neutral pH. It is expected that the treatment would significantly reduce the potential for accumulation of the impact thus it will not be harmful to aquatic biota although the discharge will take place for the entire period of operation. The impact is considered as negative but insignificant.
6.1.3.5 Burning of Coal (Operation of the Turbines)
6.1.3.5.1 Air Quality
The burning of coal will deteriorate air quality in the areas surrounding the project site and cause discomfort for local communities, especially those living in Loa Janan and II villages. Additionally, the deteriorating air quality might also affect local vegetations both natural and cultivated. The combination of the use of Low-NOx Burner technology, low sulphur content coal, and ash entrapment using the electrostatic precipitator (EP) is expected to minimize the negative impact of deteriorating air quality due to the operation of the power plant. However, the long period of continuous burning of the coal (it was estimated that the length of the power plant will be around 100 years) means that it is not possible to warrant that such negative impact would not occur in the long term even though the intensity is expected to be minor. The impact is considered as negative, significant and extensive.
6.1.3.5.2 Noise
Noise intensity of the turbine operation is estimated to be 70 dB(A), and the cooling system is estimated to be around 80 dB(A) (L10) at a distance of 25 meters from the sources and decrease to 74 dB(A) at 100 meters. These intensities would affect the workers; hence they must be equipped with relevant work safety gear to avoid harm, e.g. hearing impairment. The noise would not impact the local communities as the settlements are located quite far from the generator, hence the impact is considered as negative but insignificant.
6.1.3.5.3 Quality of Water Resources

AMDAL for Mahakam Coal-Fired Power Plant Project 53
The burning of coal will have an indirect impact on water quality. Ash and exhaust gases produced by the combustion would increase rain water acidity (decrease pH) and potentially create acid rain. Calculations predicted that the rain pH at the highest ash and exhaust gas concentrations will be 5.7 or well below neutral (pH 7). Field surveys indicated that the present Mahakam River water pH samples are between 5 and 6. The impact of the burning of the coal on the quality of the water resources is considered as negative, significant and extensive.
6.1.3.5.4 Flora and fauna Resources
Coal burning could cause deterioration of air quality in the areas surrounding the project site. The most probable cause of this would be if the electrostatic precipitator (EP) was not working effectively allowing some ashes to be released through the stack. The ashes would cover plant leaves, gradually altering the photosynthesis capacity and this could result in the demise of the plants. Although rain and wind would naturally provide help to mitigate the impact, a well-maintained EP is of paramount importance to minimize the negative impact on local flora. For animals, the ashes could cause respiration problems which could kill them in the long term but their mobility would help them to avoid the impacted areas, hence the impact of the ash is rather minor on fauna. Coal burning also produces gases such as NOx and SOx which are could potentially create acid rain and cause deterioration of water and soil quality in the surrounding areas. For plants, acid rain would make soil pH decrease hampering their growth or resulting in death. For animals, such acid rain would not affect the mobile animals but could fatally affect slow-moving animals. Since the effects of the burning of the coal could extend to a radius of 3 km from the project site, the impact is the burning of coal will have an indirect impact on water quality. Ash and exhaust gases produced by the combustion would increase rain water acidity (decrease pH) and potentially create acid rain. Calculations predicted that the rain pH at the highest ash and exhaust gas concentrations will be 5.7 or well below neutral (pH 7). Field surveys indicated that the present Mahakam River water pH samples are between 5 and 6. The impact of the burning of the coal on the quality of the water resources is considered as negative, significant and extensivecategorized as negative, significant and extensive.
6.1.3.5.5 Public Health
Coal burning would affect and decrease air quality in the areas surrounding the power plant, which in turn would impact the public health. The most vulnerable humans would be the older people, toddlers and children. Analysis indicated that the pollution would be concentrated in Loa Duri Ulu village. The impact is cumulative and indirect, suggesting chronic effects in the long-term, and therefore is considered as negative and significant.
6.1.3.6 Coal Ash Collection
Fly ash and bottom ash produced by the burning of the coal will be collected and stored in covered hoppers. The cover would only be opened when the transport trucks are ready for

AMDAL for Mahakam Coal-Fired Power Plant Project 54
deployment in order to minimize emission of ashes into the environment. Since the effect would be minor and localized, the impact is considered as negative but insignificant.
6.1.3.7 Coal Ash Transportation
Transportation of coal ash will be done by covered trunks but the exact route has not been decided yet. Emission of pollutant gases is possible during transportation and would impact air quality negatively but is predicted to be minor if the route does not pass near any settlements. However, the impact could be negative and significant if the route passes near the settlements.
6.1.3.8 Coal Ash Storage
The bottom ash of from the burning of the coal is planned for other uses, such as a component of building materials or for other industrial purposes. However, the plan has not yet been finalized. If the bottom ash is unusable, it will be sent and stored in the disposal site of the PT Bukit Baiduri Energy coal mine located around 10 kilometers to the north of the project site. The bottom ash is suspected to still have remains of pyrite (FeS2) and other metals and minerals.
6.1.3.8.1 Air Quality
The storage of coal ash would have a negative but insignificant and not extensive impact. This is because the ashes will be stored in an old mine quarry and thus protected from blowing wind. The impact on air quality is predicted to be insignificant since the length of time that it takes for coal ash removal from the trucks is very short and the extent will be limited to the mine area, which is far from settlements and other local activities.
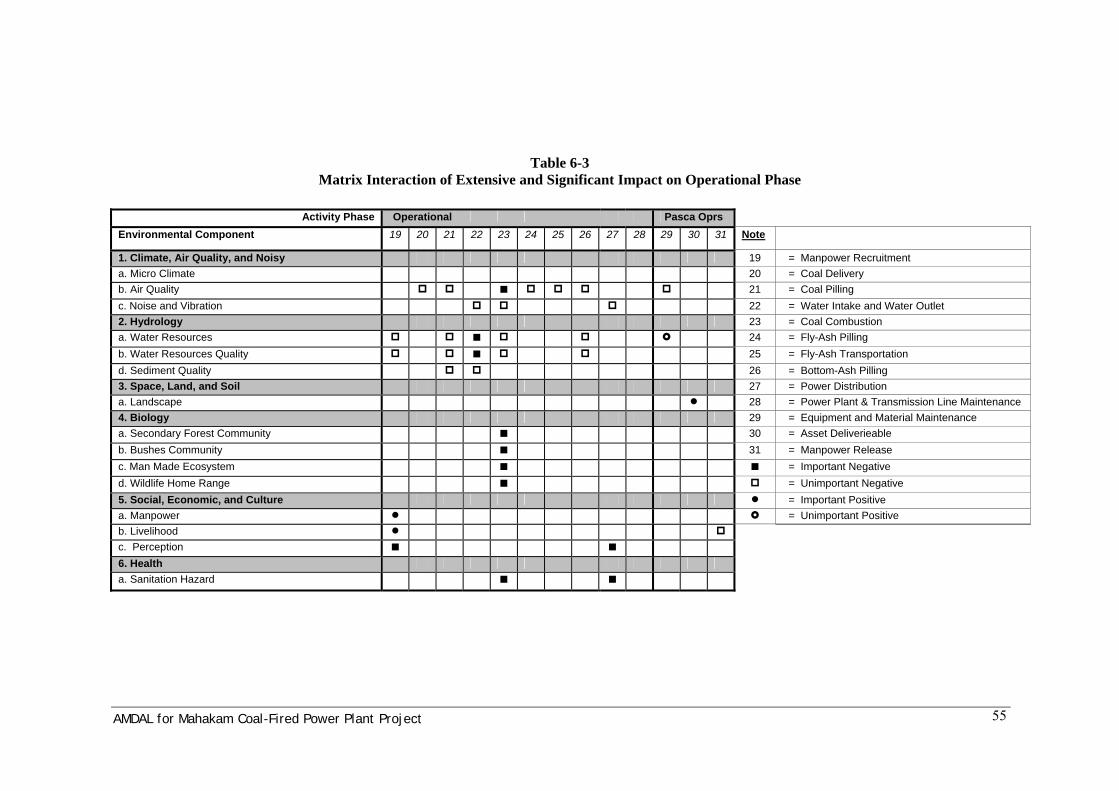
AMDAL for Mahakam Coal-Fired Power Plant Project 55
Table 6-3 Matrix Interaction of Extensive and Significant Impact on Operational Phase
Activity Phase Operational Pasca Oprs
Environmental Component 19 20 21 22 23 24 25 26 27 28 29 30 31 Note
1. Climate, Air Quality, and Noisy 19 = Manpower Recruitment a. Micro Climate 20 = Coal Delivery b. Air Quality 21 = Coal Pilling c. Noise and Vibration 22 = Water Intake and Water Outlet 2. Hydrology 23 = Coal Combustion a. Water Resources 24 = Fly-Ash Pilling b. Water Resources Quality 25 = Fly-Ash Transportation d. Sediment Quality 26 = Bottom-Ash Pilling 3. Space, Land, and Soil 27 = Power Distribution a. Landscape 28 = Power Plant & Transmission Line Maintenance 4. Biology 29 = Equipment and Material Maintenance a. Secondary Forest Community 30 = Asset Deliverieable b. Bushes Community 31 = Manpower Release c. Man Made Ecosystem = Important Negative d. Wildlife Home Range = Unimportant Negative 5. Social, Economic, and Culture = Important Positive a. Manpower = Unimportant Positive b. Livelihood
c. Perception 6. Health a. Sanitation Hazard

AMDAL for Mahakam Coal-Fired Power Plant Project 56
6.1.4 Post-Operation Stage
6.1.4.1 Handling of Equipment and Constructed Facilities
6.1.4.1.1 Air Quality
Demobilization of equipment that is no longer unusable would create a negative impact on air quality but the nature is temporary and the extent is limited to the project site only. The impact therefore is considered as negative but insignificant and not extensive.
6.1.4.1.2 Water Resource Potential
The existence of a water reservoir would have a positive impact on local communities as it could function as a clean water source and as a tourism spot as well.
6.1.4.2 Hand Over of Assets and Equipment
6.1.4.2.1 Spatial Planning
The handing-over of assets and equipment, particularly for transmission lines, will give the land-owners the opportunity to manage the ‘abandoned’ lands and use them for more productive activities. One obvious possibility would be the increase of land price. Besides, the hand-over of assets and equipment would ease the spatial planning of the area. The impact is considered as positive but insignificant.
6.1.4.3 Discharge of Manpower
6.1.4.3.1 Livelihood and Production Activities
At the end of the operational stage, a number of workers will be discharged. This situation will have been long been predicted and would be anticipated by meeting the prevailing government regulations on manpower affairs to minimize or eliminate unnecessary conflicts. Special attention, however, needs to be taken for workers indirectly linked to the project as they would lose their livelihoods and income accordingly. If not handled properly this would create social tensions and unease. The discharge of workers obviously would create a negative impact, but because the extent and the number of affected people will be relatively few the impact is considered as negative but insignificant.
AMDAL for Mahakam Coal-Fired Power Plant Project 57
6.2 Impact Analysis for Environmental Management and Monitoring
6.2.1 Environmental Component – Air Quality
6.2.1.1 Extensive and Significant Impact – Coal Burning (Turbine Operation)
Air quality would be impacted negatively, significantly and extensively by the burning of the coal to operate the turbines and it would provoke discomfort and increase the incident of respiration disease among the local people. Management Guideline
• Concentrations of dust and exhaust gases must be managed and monitored, both at the emission source and in the surrounding areas, so that they meet local government requirements
6.2.2 Environmental Component – Noise
6.2.2.1 Extensive and Significant Impact – Land Clearing and Preparation
Noise intensity in the project site would be impacted negatively, significantly and extensively by the land clearing and preparation during the construction stage. Management Guideline
• Relevant and strict regulations and procedures for civil construction should be established to minimise the impact
• Construction activities should be scheduled to minimise the effect of noise intensity, e.g. by not doing construction jobs during the night
6.2.3 Environmental Component – Water Resources and Quality
6.2.3.1 Extensive and Significant Impact – Land Clearing and Preparation
Land clearing and preparation would create a negative, significant and extensive impact on the environmental component of the quality of the water resources. Management Guideline
• Run-off should be controlled, e.g., managing land contour
• Run-off should not be channelled directly to Mahakam River but dispersed to relevant facilities first
• Preserve vegetation in unused lands in the project site
AMDAL for Mahakam Coal-Fired Power Plant Project 58
6.2.4 Environmental Component – Space, Land and Soil
6.2.4.1 Extensive and Significant Impact – Land Acquisition
Components of space, land and soil, particularly of land ownership, land-use and community perceptions would be impacted by land acquisition. Management Guideline
• A socialisation program must be carried out in order to make local people aware of the land acquisition mechanism and compensation process. Special attention should be emphasised for owners of the land under the transmission lines to achieve a common agreement that the compensation scheme is different than for those in the project site
• As far as possible, land acquisition should involve local formally and informally prominent persons, land owners and local government officials
• The land compensation process must be conducted as transparently as possible and include the disclosure of cost components of land status legalisation and involve the local people, the project owner and the local government
• The value and provision of land compensation should be negotiated through consultations and decided proportionally
6.2.4.2 Extensive and Significant Impact – Spatial Planning
Land acquisition would also impact the spatial planning component, extensively and significantly. Management Guideline
• Detailed spatial planning for Loa Janan is necessary to reduce the negative impacts
• The capacity of the village and district government apparatus must be improved to cope with the insufficient public service systems and facilities
6.2.5 Environmental Component – Flora and Fauna
6.2.5.1 Extensive and Significant Impact – Flora and Fauna
Flora & fauna would be impacted by land clearing and coal burning. Land clearing would negatively impact terrestrial wildlife, whereas coal burning would negatively impact vegetations and threaten the aquatic/river environment and wildlife habitats. Management Guideline
• Land clearing should be conducted gradually to enable wildlife to migrate safely.
• Prohibitions on wildlife trapping and hunting must be established.
AMDAL for Mahakam Coal-Fired Power Plant Project 59
• Concentrations of dust and exhaust gases from the burning of the coal should be controlled to prevent them from damaging vegetations and wildlife habitats.
6.2.6 Environmental Component – Socio-Economic
6.2.6.1 Extensive and Significant Impact – Socio-Economic
Components of manpower affairs and livelihood and production activities would be impacted positively, significantly and extensively by manpower recruitment and mobilization of manpower. Management Guideline
• Give priority to the local people, especially those experiencing income loss or decrease due to land acquisition, for the available jobs/positions according to their educational background and skill
• Give priority to the use of local resources and production activities that have direct links with the planned activity
6.2.7 Environmental Component – Socio-Cultural
6.2.7.1 Extensive and Significant Impact – Socio-Cultural
Social-cultural components such as demography, lifestyle and crime rates would be impacted negatively but indirectly by manpower recruitment and mobilization. Management Guideline
• Both direct and induced workers associated with the project, including their families, must be systematically recorded
• Neighbourhood safety systems involving both the authorities and local communities should be improved
6.2.8 Environmental Component – Public Health
6.2.8.1 Extensive and Significant Impact – Public Health
The public health component would be impacted either by (a) potential for disease outbreak due to poor environmental sanitation as a consequence of a drastic increase in population/workers and insufficient facilities, or by (b) poor air quality due to burning coal for the turbine operation. Management Guideline
• Quantity and quality of public health facilities must be improved
• Environmental sanitation must be developed and improved

AMDAL for Mahakam Coal-Fired Power Plant Project 60
Chapter 7 STAKEHOLDER MEETINGS
7.1 The objective of the stakeholder meetings
After the AMDAL study had been implemented, stakeholder meetings (Public Consultancy) were executed for the local communities around the planned power plant construction site. The Public Consultancy was executed in two places assumed to be especially influenced by the power plant construction. These were executed according to the "JICA environment and society consideration guideline". Residents, NGOs, the provincial government, city organizations, county organizations, the village mayors, the army, the police, and the city council members, etc. participated in these meetings, and there was an active opinion exchange. The remarks regarding the power plant construction were very positive and supportive even though anxiety regarding the possible environmental impacts had risen. This is because electricity shortages and high unemployment continue to be chronic.
7.2 Public Consultancy
7.2.1 Loa Duri Ulu Village
Place: Loa Duri Ulu Village, Loa Janan District, Kutai Kartenegara Province Date: 11 December 2006 Attendees: Table 7-1 Main questions and requests from the attendees were as follows.
• What kind of industrial waste is produced by the activities?
• What kind of jobs will be produced by the project? I want to demand training so that we have a chance for employment.
• I want to welcome this project because of the chance of finding employment.
• I want you to hire a local builder for the construction of the power plant in order to improve the local economy.
• The proposal to use the unsalable coal is welcomed by the local community.
7.2.2 Sungai Kunjang
Place: Sungai Kunjang, Samarinda City Date: 12 December 2006 Attendees: Table 7-1 Main questions and requests from the attendees were as follows.

AMDAL for Mahakam Coal-Fired Power Plant Project 61
• What will be the impact of the exhaust gases when the fine coal and the low grade coal are used for fuel?
• What impact does the colliery have on the Mahacam River now?
• Which regions would be influenced by the power plant?
• The power plant creates job opportunities. I want you to give me training because we local people don't have the required technology,
Table 7-1 Attendees of public consultancy No. Loa Duri Ulu No. Sungai Kunjang 1 Camat Loa Janan 1 Camat Sungai Kunjang 2 Babinsan Desa Loa Duri Ulu 2 Polsek S. Kunjang 3 BABIM ICRMTIB MRS LDU 3 Ketua RT. 14 Loa Buah 4 Kades Loa Duri Ulu 4 Ketua RT. 11 Loa Buah 5 Dinas Pertambangan Prop. Kaltim 5 Dinas Pertambangan 6 RT 7/5 LDU 6 -- 7 RT 02/1 LDU 7 Loa Buah 8 RT 16/5 LDU 8 Loa Buah 9 Ketua BPP LDU 9 Sungai Kunjang 10 Kapolsek Loa Janan 10 BAPEDALDA Samarinda 11 BPD Anggota 11 Kosi PMK 12 BESSIE 12 Sek Coal 13 Staf Desa 13 Kantor Pertambangan Smd 14 Kadus G LDU 15 Loa Duri 16 RT 14 Loa Duri 17 Wakil RT 14 18 Staf Desa Loa Duri 19 Staf Desa 20 Staf Desa 21 Staf Desa 22 BAPEDALDA 23 RT 16/5 Kutai Baru 24 Wakil BPD Loa Duri 25 Kantor Camat Loa Janan