Embed Size (px)
Citation preview

ProposedProposedTentativeTentative
BudgetBudget
First Public Hearing – August 2, 2012
BudgetBudgetFirst Public HearingFirst Public Hearing
August 2, 2012
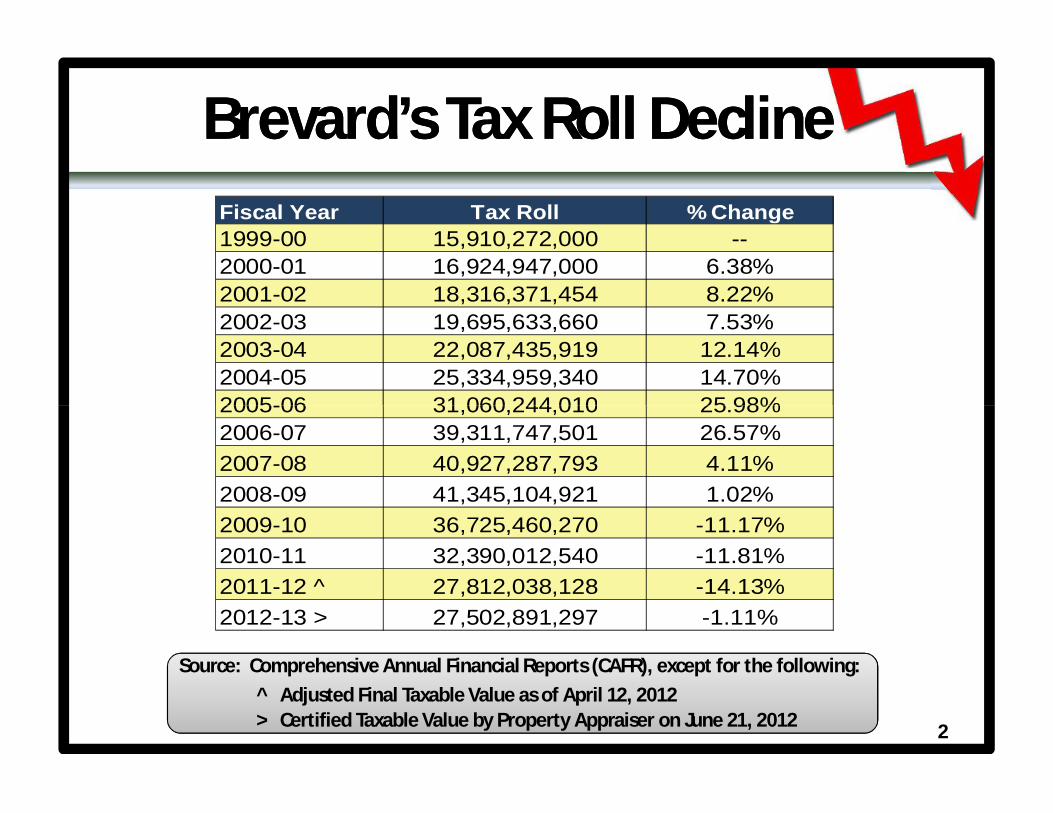
Brevard’s Tax Roll DeclineBrevard’s Tax Roll DeclineFiscal Year Tax Roll % Change1999-00 15,910,272,000 --2000-01 16,924,947,000 6.38%2001-02 18,316,371,454 8.22%2002-03 19,695,633,660 7.53%2003-04 22,087,435,919 12.14%2004-05 25,334,959,340 14.70%2005-06 31,060,244,010 25.98%2005-06 31,060,244,010 25.98%2006-07 39,311,747,501 26.57%
2007-08 40,927,287,793 4.11%
2008-09 41,345,104,921 1.02%
2009-10 36,725,460,270 -11.17%
2010-11 32,390,012,540 -11.81%
2011-12 ^ 27,812,038,128 -14.13%
2012-13 > 27,502,891,297 -1.11%
Source: Comprehensive Annual Financial Reports (CAFR), except for the following:Source: Comprehensive Annual Financial Reports (CAFR), except for the following:^ Adjusted Final Taxable Value as of April 12, 2012> Certified Taxable Value by Property Appraiser on June 21, 2012 2

Tax Roll ChangesTax Roll Changes20112011--12 vs. 201212 vs. 2012--1313
Of the 67 School Districts in Florida:Of the 67 School Districts in Florida:
52 districts decreased between 0.01% and 8.19%
15 districts increased between 0.33% and 8.33%
3
15 districts increased between 0.33% and 8.33%
Statewide average is -2.07%
Brevard’s decrease of 1.42% is 41st in the state when ranking highest decline to lowest

History of School Board Millage LevyHistory of School Board Millage LevyFiscal Year Total Millage Difference %
1998-99 9.578 -- --
1999-00 9.171 -0.407 -4.25
2000-01 8.908 -0.263 -2.87
2001-02 8.674 -0.234 -2.63
2002-03 8.605 -0.069 -0.80
2003-04 8.405 -0.200 -2.32
2004-05 8.194 -0.211 -2.51
2005-06 7.963 -0.231 -2.822005-06 7.963 -0.231 -2.82
2006-07 7.667 -0.296 -3.72
2007-08 7.531 -0.136 -1.77
2008-09 7.661 0.130 1.73
2009-10 7.687 0.026 0.34
2010-11 7.653 -0.034 -0.44
2011-12 8.112 0.459 6.00
2012-13 8.096 -0.016 -0.20
-1.482 -15.47Difference Since 1998-99
4
Note: Each year the Board has levied the maximum allowed by law without voter referendum.

Proposed Millage ChangesProposed Millage Changes
Millage required by the State to be levied
If not, would receive no Federal, State or Local dollars
Required Local Effort (RLE) 5.598 mills
5
2012-13 requirement of 5.581 mills, plus prior years
2011-12 Prior Period Funding Adjustment of 0.017 mills
0.017 mills generates $443,341
RLE comprises 69% of the total proposed millage levy

Proposed Millage ChangesProposed Millage Changes
2008-09 Legislation mandated transfer of 0.250 mills from Capital to Operating 2009-10 Legislation authorized to transfer 0.250 mills from Capital to Operating – optional
Discretionary Millage 0.748 mills
6
Attempt of Legislature to hold total millage at same level, but used to balance Operating Budget
This budget assumes will still move 0.250 mills from the Capital Projects Fund to the Operating Fund
Currently subject to Compression by the StateState guarantees average per FTE of $370.98State will provide Brevard $95.28 per FTE or $6,825,224Without compression 0.748 mills generates $19,749,276

Proposed Millage ChangesProposed Millage Changes
Currently subject to Compression by State
Fourth year as option for the Board with 2012-13 being the last year(2 years by legislative authority and 2 years by voter approval)
Discretionary Critical Needs (Operating) Millage 0.250 mills
7
(2 years by legislative authority and 2 years by voter approval)
Voters approved in November, 2010 for the Board to have the authority to continue for 2 years
State guarantees average per FTE of $123.99
State will provide Brevard $31.84 per FTE or $2,280,805
Without compression 0.250 mills generates $6,600,694

Proposed Millage ChangesProposed Millage Changes
2008-09 Legislation mandated transfer of 0.250 mills from Capital to Operating
2009-10 Legislation authorized to transfer 0.250 mills from Capital to Operating – optional
Capital Outlay Millage 1.500 mills
8
Capital to Operating – optional
Attempt of Legislature to hold total millage at same level, but used to balance Operating Budget
This budget assumes will still move 0.250 mills from the Capital Projects Fund to the Operating Fund
If millage not moved, Operating would lose approximately 1/3 (or $2.8 million) of the Discretionary Millage Compression from the State
1.500 mills generates $39,604,163

Proposed 2012Proposed 2012--13 Millage13 Millage
Actual2011-12
Increase/Decrease
5.614 5.598 -0.0160.748 0.748 0.000
Proposed2012-13
Operating - Required Local Effort - Local Discretionary
9
0.748 0.748 0.0000.250 0.250 0.0001.500 1.500 0.000
8.112 8.096 -0.016Total Millage
Capital Outlay
- Local Discretionary - Critical Needs

RolledRolled--Back Rate DetailsBack Rate DetailsThe rolled-back rate is the new year property tax levy that would(after the value of new construction is deducted) produce thesame amount of revenue as the previous year (but using thisyear’s tax roll)
• Total 2011-12 Actual Millage 8.112
10
• Total 2012-13 Rolled-Back Rate 8.2611• Total 2012-13 Proposed Millage 8.096
The 2012-13 Proposed Millage rate is:• 2.0% lower than the 2012-13 Rolled-Back Rate• 0.2% lower than the 2011-12 Actual Millage

Proposed Millage vs. RolledProposed Millage vs. Rolled--BackBack
Rolled-Back2012-13
Increase/Decrease
5.7172 5.598 -0.11920.7617 0.748 -0.0137
Proposed2012-13
Operating - Required Local Effort - Local Discretionary
11
0.7617 0.748 -0.01370.2546 0.250 -0.00461.5276 1.500 -0.0276
8.2611 8.096 -0.1651Total Millage
Capital Outlay
- Local Discretionary - Critical Needs
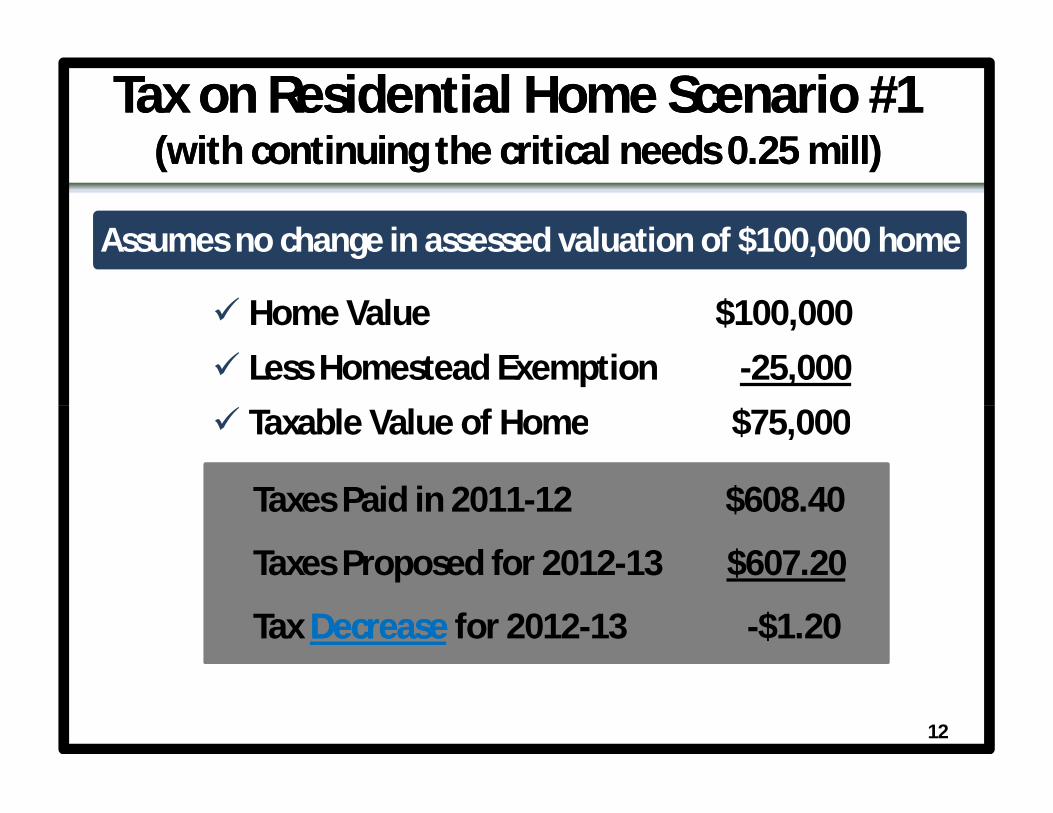
Assumes no change in assessed valuation of $100,000 home
Tax on Residential Home Scenario #1Tax on Residential Home Scenario #1(with continuing the critical needs 0.25 mill)(with continuing the critical needs 0.25 mill)
Home Value $100,000 Less Homestead Exemption -25,000 Taxable Value of Home $75,000
12
Taxable Value of Home $75,000
Taxes Paid in 2011-12 $608.40
Taxes Proposed for 2012-13 $607.20
Tax DecreaseDecrease for 2012-13 -$1.20

Tax on Residential Home Scenario #2Tax on Residential Home Scenario #2(with continuing (with continuing the critical needs 0.25 mill)the critical needs 0.25 mill)
Home Value $98,000 Less Homestead Exemption -25,000
Assumes 2% ($2,000) decrease in assessed valuation of $100,000 home
13
Taxable Value of Home $73,000
Taxes Paid in 2011-12 $608.40
Taxes Proposed for 2012-13 $591.01
Tax DecreaseDecrease for 2012-13 -$17.39

Tax on Residential Home Scenario #3Tax on Residential Home Scenario #3(with continuing (with continuing the critical needs 0.25 mill)the critical needs 0.25 mill)
Home Value $90,000 Less Homestead Exemption -25,000
Assumes 10% ($10,000) decrease in assessed valuation of $100,000 home, due to current economic conditions
14
Taxable Value of Home $65,000
Taxes Paid in 2011-12 $608.40
Taxes Proposed for 2012-13 $526.24
Tax DecreaseDecrease for 2012-13 -$82.16

Millage Decrease & Tax Roll DeclineMillage Decrease & Tax Roll Decline
2011-12 2012-13 Difference8.112 8.096 -0.016
$27,894,534,249 $27,502,891,297 -$391,642,952
$217,229,243 $213,756,872 $3,472,371Dollars Generated
MillageTax Roll
15
$217,229,243 $213,756,872 $3,472,371Dollars Generated
* Calculated by law at 96% collection rate

Dollars %Operating 543,989,380 538,855,429 -5,133,951 -0.94Special Revenue 93,882,064 92,652,846 -1,229,218 -1.31Debt Service 45,562,927 45,605,932 43,005 0.09Capital Outlay 117,451,996 98,886,591 -18,565,405 -15.81
DifferenceAmended2011-12
Tentative2012-13
Proposed Tentative BudgetProposed Tentative Budget
16
Capital Outlay 117,451,996 98,886,591 -18,565,405 -15.81Enterprise Fund 8,757,156 8,097,708 -659,448 -7.53Subtotal 809,643,523 784,098,506 -25,545,017 -3.16Less Transfers 43,555,035 44,219,062 664,027 1.52 Total 766,088,488 739,879,444 -26,209,044 -3.42Internal Service 80,564,118 75,723,193 -4,840,925 -6.01

Dollars %State-FEFP 186,380,952 211,707,047 25,326,095 13.59State - Categoricals/Other 90,816,201 92,647,860 1,831,659 2.02Local - Property Taxes 177,061,114 174,147,202 -2,913,912 -1.65Local - Other 6,351,073 5,203,078 -1,147,995 -18.08
Amended2011-12
Tentative2012-13
Difference
Operating Budget RevenueOperating Budget Revenue
17
Local - Other 6,351,073 5,203,078 -1,147,995 -18.08Total Revenue 460,609,340 483,705,187 23,095,847 5.01Other Sources 1,299,035 1,299,035 0 0.00Fund Balance 79,496,619 51,266,821 -28,229,798 -35.51Grand Total 541,404,994 536,271,043 -5,133,951 -0.95

20122012--13 Budget13 BudgetRevenue Impacts
1 New FEFP $17.96 m
2 Retirement Rate Increase -$0.81 m
3 Replacement of Ed Jobs (SBBC)* -$14.09 m
4 Categorical Obligations -$1.64 m
5 Growth (20 teachers) -$1.02 m
18
5 Growth (20 teachers) -$1.02 m
6 Charter Schools (w/ Ed Jobs) -$2.48 m
7 FTE Reserve (165 FTE/172.54 WFTE) -$0.62 m
8 Less Quarter Mill $ Due to Lower Tax Roll -$0.35 m
Total -$3.05 m
* $0.7 m for Charters included in line 6

Recurring Cuts to BudgetRecurring Cuts to Budget
Line Item Reduction AmountCompression Reserve $1.4 m
Class Size Reduction $0.8 m
TAN Interest Reserve $0.5 m
Closure of Riverview $0.8 m
Bus Driver Units $0.2 m
19
Bus Driver Units $0.2 m
Overtime $0.1 m
Electricity $0.2 m
SSNP $0.2 m
McKay Scholarships $0.5 m
Projected Tax Collections (96.6%) $1.1 m
Charter School Reserves $0.9 m
Total $6.7 m

Change in DCDChange in DCDFiscal Year DCD %
2003-04 0.9699 -0.0059 0.60%
2004-05 0.9755 0.0056 0.58%
2005-06 0.9804 0.0049 0.50%
2006-07 0.9865 0.0061 0.62%
2007-08 0.9845 -0.0020 -0.20%2008-09 0.9843 -0.0002 -0.02%
Difference
2008-09 0.9843 -0.0002 -0.02%2009-10 0.9892 0.0049 0.50%2010-11 0.9938 0.0046 0.47%2011-12 1.0014 0.0076 0.76%
2012-13 1.0059 0.0045 0.45%
20
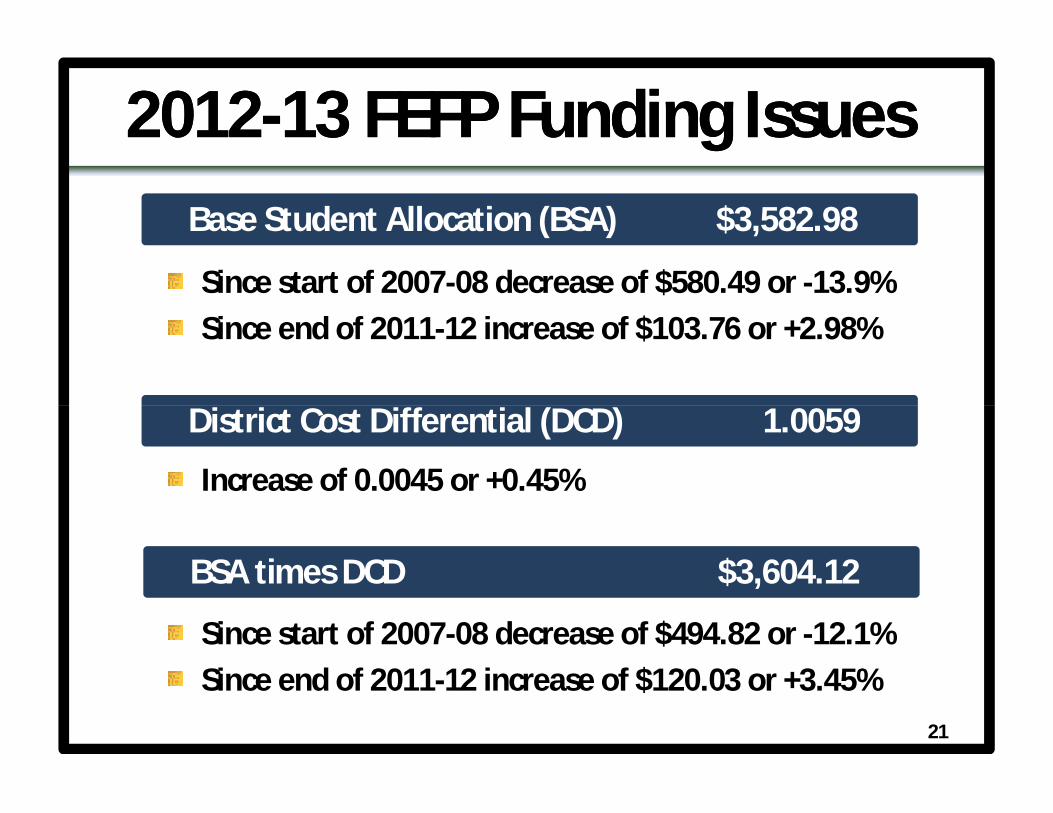
Since start of 2007-08 decrease of $580.49 or -13.9%Since end of 2011-12 increase of $103.76 or +2.98%
20122012--13 FEFP Funding Issues13 FEFP Funding IssuesBase Student Allocation (BSA) $3,582.98
District Cost Differential (DCD) 1.0059
Increase of 0.0045 or +0.45%
Since start of 2007-08 decrease of $494.82 or -12.1%Since end of 2011-12 increase of $120.03 or +3.45%
District Cost Differential (DCD) 1.0059
BSA times DCD $3,604.12
21

2003-04 3,630.03 0.9699 3,520.77 69.262004-05 3,670.26 0.9755 3,580.34 59.572005-06 3,742.42 0.9804 3,669.07 88.732006-07 3,981.61 0.9865 3,927.86 258.792007-08 * 4,163.47 0.9845 4,098.94 171.082007-08 4,079.74 0.9845 4,016.50 -82.44
DifferenceFiscal Year BSA DCD BSA * DCD
Base Student Allocation & District Cost DifferentialBase Student Allocation & District Cost Differential
2007-08 4,079.74 0.9845 4,016.50 -82.442008-09 * 3,971.74 0.9843 3,909.38 -107.122008-09 3,886.14 0.9843 3,825.13 -84.252009-10 3,630.62 0.9892 3,591.41 -233.722010-11 3,623.76 0.9938 3,601.29 9.882011-12 ^ 3,479.22 1.0014 3,484.09 -117.202012-13 > 3,582.98 1.0059 3,604.12 120.03
Source: Final FEFP Calculation for each year except as follows:* 1st FEFP Calculation ^ 4th FEFP Calculation > 2nd FEFP Calculation
22

Membership Percent
2000-01 70,658 655 0.942001-02 71,625 967 1.372002-03 72,533 908 1.272003-04 73,912 1,379 1.902004-05 75,216 1,304 1.76
Growth/Decline
Number Year
Student GrowthStudent Growth
2004-05 75,216 1,304 1.762005-06 76,062 846 1.122006-07 75,676 -386 -0.512007-08 75,235 -441 -0.582008-09 74,000 -1,235 -1.642009-10 73,352 -648 -0.882010-11 72,913 -439 -0.602011-12 72,906 -7 -0.012012-13 * 73,489 583 0.80
* Projected for 2012-1323

Total District Charters2000-01 70,658 69,608 1,0502001-02 71,625 70,212 1,4132002-03 72,533 70,957 1,5762003-04 73,912 72,150 1,7622004-05 75,216 73,099 2,1172005-06 76,062 73,230 2,832
Year
History of Student MembershipHistory of Student Membership
2005-06 76,062 73,230 2,8322006-07 75,676 72,210 3,4662007-08 75,235 72,215 3,0202008-09 74,000 70,951 3,0492009-10 73,352 70,152 3,2002010-11 72,913 69,459 3,4542011-12 72,906 70,320 2,5862012-13 * 73,489 70,809 2,680
* Projected for 2012-1324

2000-01 655 368 2872001-02 967 604 3632002-03 908 745 1632003-04 1,379 1,193 1862004-05 1,304 949 3552005-06 846 131 715
Total ChartersDistrictYear
Details of Membership GrowthDetails of Membership Growth
2005-06 846 131 7152006-07 -386 -1,020 6342007-08 -441 5 -4462008-09 -1,235 -1,264 292009-10 -648 -799 1512010-11 -439 -693 2542011-12 -7 861 -8682012-13 * 583 489 94
* Projected for 2012-1325

Year KSC CCAFS Total2005-06 5,633 1,571 7,2042006-07 5,174 1,565 6,7392007-08 5,025 1,440 6,4652008-09 4,935 1,355 6,290
Students with Parents WorkingStudents with Parents Workingat KSC or CCAFS at KSC or CCAFS –– Historical TotalsHistorical Totals
2008-09 4,935 1,355 6,2902009-10 4,619 1,231 5,8502010-11 3,941 1,152 5,0932011-12 2,707 1,147 3,854
Note: From 2010-11 to 2011-12, there has been a decrease of 1,239 (-24.3%)
26

GradePreK 35 20 55
K 123 54 1771 122 45 1672 152 58 2103 129 77 2064 157 74 231
KSC CCAFS Total
Students with Parents WorkingStudents with Parents Workingat KSC or CCAFSat KSC or CCAFS
4 157 74 2315 171 76 2476 176 83 2597 204 93 2978 239 97 3369 306 119 425
10 295 109 40411 273 121 39412 325 121 446
Total 2,707 1,147 3,85427

Actual ProposedPositions 2011-12 2012-13 Number PercentClassroom Teachers 4,785.96 4,795.26 9.30 0.2Instructional Support 460.09 459.29 -0.80 -0.2Instructional Assistants 839.35 855.71 16.36 1.9Support - School-Level 2,373.02 2,356.87 -16.15 -0.7
Change
History of Change in Employee PositionsHistory of Change in Employee PositionsActual 2011Actual 2011--12 vs. Proposed 201212 vs. Proposed 2012--1313
Support - School-Level 2,373.02 2,356.87 -16.15 -0.7Administrators - School-Level 231.00 228.00 -3.00 -1.3Support - District-Level 326.85 340.35 13.50 4.1Administrators - District-Level 39.00 40.00 1.00 2.6Total 9,055.27 9,075.48 20.21 0.2
Membership 72,906 73,489 583 0.8FTE 71,057.19 71,633.33 576.14 0.8
Note: Excludes Adult Education Teachers/Other but includes Head Start28

Actual ProposedPositions 2007-08 2012-13 Number PercentClassroom Teachers 4,935.07 4,795.26 -139.81 -2.8Instructional Support 456.70 459.29 2.59 0.6Instructional Assistants 878.02 855.71 -22.31 -2.5Support - School-Level 2,713.87 2,356.87 -357.00 -13.2
Change
History of Change in Employee PositionsHistory of Change in Employee PositionsActual 2007Actual 2007--08 vs. Proposed 201208 vs. Proposed 2012--1313
Support - School-Level 2,713.87 2,356.87 -357.00 -13.2Administrators - School-Level 242.00 228.00 -14.00 -5.8Support - District-Level 372.19 340.35 -31.84 -8.6Administrators - District-Level 50.00 40.00 -10.00 -20.0Total 9,647.85 9,075.48 -572.37 -5.9
Membership 75,235 73,489 -1,746 -2.3FTE 73,465.54 71,633.33 -1,832.21 -2.5
Note: Excludes Adult Education Teachers/Other but includes Head Start
29

Positions 2011-12Classroom Teachers 24.00Instructional Support 3.00Instructional Assistants 25.00Support - School-Level --Administrators - School-Level --
Head Start Employee PositionsHead Start Employee Positions
Administrators - School-Level --Support - District-Level 6.00Administrators - District-Level --Total 58.00
30

Actual ProposedPositions 2011-12 2012-13 Number PercentClassroom Teachers 4,785.96 4,771.26 -14.70 -0.3Instructional Support 460.09 456.29 -3.80 -0.8Instructional Assistants 839.35 830.71 -8.64 -1.0Support - School-Level 2,373.02 2,356.87 -16.15 -0.7
Change
History of Change in Employee PositionsHistory of Change in Employee PositionsActual 2011Actual 2011--12 vs. Proposed 201212 vs. Proposed 2012--1313
Without Head StartWithout Head Start
Support - School-Level 2,373.02 2,356.87 -16.15 -0.7Administrators - School-Level 231.00 228.00 -3.00 -1.3Support - District-Level 326.85 334.35 7.50 2.3Administrators - District-Level 39.00 40.00 1.00 2.6Total 9,055.27 9,017.48 -37.79 -0.4
Membership 72,906 73,489 583 0.8FTE 71,057.19 71,633.33 576.14 0.8
Note: Excludes Adult Education Teachers/Other31

Actual ProposedPositions 2007-08 2012-13 Number PercentClassroom Teachers 4,935.07 4,771.26 -163.81 -3.3Instructional Support 456.70 456.29 -0.41 -0.1Instructional Assistants 878.02 830.71 -47.31 -5.4Support - School-Level 2,713.87 2,356.87 -357.00 -13.2
Change
History of Change in Employee PositionsHistory of Change in Employee PositionsActual 2007Actual 2007--08 vs. Proposed 201208 vs. Proposed 2012--1313
Without Head StartWithout Head Start
Support - School-Level 2,713.87 2,356.87 -357.00 -13.2Administrators - School-Level 242.00 228.00 -14.00 -5.8Support - District-Level 372.19 334.35 -37.84 -10.2Administrators - District-Level 50.00 40.00 -10.00 -20.0Total 9,647.85 9,017.48 -630.37 -6.5
Membership 75,235 73,489 -1,746 -2.3FTE 73,465.54 71,633.33 -1,832.21 -2.5
Note: Excludes Adult Education Teachers/Other32

Amended2011-12
Tentative2012-13 Difference
PECO-New Construction 0 0 0 0PECO - Maintenance 0 0 0 0Other-State 466,002 510,000 43,998 9.44Local Revenue 40,685,473 42,671,763 1,986,290 4.88
%
Capital Projects RevenuesCapital Projects Revenues
Local Revenue 40,685,473 42,671,763 1,986,290 4.88Total Revenues 41,151,475 43,181,763 2,030,288 4.93Other Sources 11,991,177 4,500,000 -7,491,177 -62.47Fund Balance 64,309,344 51,204,828 -13,104,516 -20.38 Total 117,451,996 98,886,591 -18,565,405 -15.81
33

Project AmountRemodel/Renovation/Maintenance $7,100,000Food Services Maintenance $500,000Health and Safety Projects $150,000Portable Relocation $150,00010 School Buses $1,000,000Sunrise Standard & Other Technology $1,000,000
Capital Projects ExpendituresCapital Projects Expenditures
Sunrise Standard & Other Technology $1,000,000Repair at Failure $360,000Sub-Total of Projects Funded with New Dollars $10,260,000COP Payment $26,138,256RAN Payment $8,315,907Reserved for Impact Fee Projects $2,967,600Total Capital Projects Funded with New Dollars $47,681,763Capital Projects/Debt Funded by Fund Balance $51,204,828Grand Total $98,886,591
34

November 15 – Budget Workshop – Future Capital Funding Options
March 2 – Florida Legislative Session ended
May 15 – Budget Workshop – 2012-13 Budget & Beyond
TimelineTimeline
May 15 – Budget Workshop – 2012-13 Budget & Beyond
June 12 - Budget Workshop – Future Capital Needs
June 28 –Preliminary Budget Workshop – Looking Forward
July 10 – Board Meeting – Board approves language related to ½ cent sales tax for November 6 referendum
35

July 28 – Newspaper advertisement for 1st Public Hearing
August 2 – First Public Hearing to Adopt Tentative Budget and Millage, 5:30 p.m. at Educational Services Facility
Third week of August – Proposed Tax Notices mailed by
Timeline (cont.)Timeline (cont.)
Third week of August – Proposed Tax Notices mailed by Tax Collector to property owners, which also advertises the 2nd and Final Hearing
September 6 – 2nd Public Budget Hearing to Adopt Final Budget and Millage, 5:30 p.m. at Educational Services Facility
36

Minor changes made since the June workshop
Old year being compared to new year
2011-12: Adopted Budget (9/8/11)
Amended Budget (as of 5/31/12)
Format of Budget BooksFormat of Budget Books
37
Amended Budget (as of 5/31/12)
2012-13: Preliminary Budget
Reminder that the percent of total for each column has been included in the book for easy reference.
Note: Budget books dating back to 1967-68 are available in the reference section of all Brevard public libraries.

Format of Budget BooksFormat of Budget BooksReminder that new salary object codes are being utilized in the Operating Budget (see page 15)
Final year-end budget and expenditures will be provided for final public hearing
38
provided for final public hearing
All information will be updated for August(including automated labor and actual fund balances)
Still incorporating ARRA funding as part of the Special Revenue budget

Next StepsNext StepsContinue to review budgeted line items (including automated labor, 2011-12 expenditures, and fund balances)
Continue updates at future Board Meetings
Monitor for any further revenue shortfalls
39
Monitor for any further revenue shortfalls
Monitor various Estimating Conferences
Final public hearing to adopt millage and annual budget:
September 6, 2012 at 5:30 p.m. in the Board Room

uestionsuestions
nswersnswersnswersnswers