Embed Size (px)
Citation preview
Prospects for Carbon Capture and Storage Technologies
Soren Anderson and Richard Newell
January 2003 • Discussion Paper 02–68
Resources for the Future 1616 P Street, NW Washington, D.C. 20036 Telephone: 202–328–5000 Fax: 202–939–3460 Internet: http://www.rff.org
© 2003 Resources for the Future. All rights reserved. No portion of this paper may be reproduced without permission of the authors. Discussion papers are research materials circulated by their authors for purposes of information and discussion. They have not necessarily undergone formal peer review or editorial treatment.

Prospects for Carbon Capture and Storage Technologies
Soren Anderson and Richard Newell
Abstract
Carbon capture and storage (CCS) technologies remove carbon dioxide from flue gases for storage in geologic formations or the ocean. We find that CCS is technically feasible and economically attractive within the range of carbon policies discussed domestically and internationally. Current costs are about $200 to $250 per ton of carbon, although costs are sensitive to fuel prices and other assumptions and could be reduced significantly through technical improvements. Near-term prospects favor CCS for certain industrial sources and electric power plants, with storage in depleted oil and gas reservoirs. Deep aquifers may provide an attractive longer-term storage option, whereas ocean storage poses greater technical and environmental uncertainty. Vast quantities of economically recoverable fossil fuels, sizable political obstacles to their abandonment, and inherent delay associated with developing alternative energy sources suggest that CCS should be seriously considered in the portfolio of options for addressing climate change, alongside energy efficiency and carbon-free energy.
Key Words: carbon, capture, storage, sequestration, climate change, technology
JEL Classification Numbers: Q30, Q40, O30

Contents
1. Introduction...........................................................................................................................................1 1.1 Drivers of global climate change ..................................................................................................2 1.2 The potential role of carbon capture and storage ..........................................................................4 1.3 Importance of the “energy penalty,” reference technology, and model assumptions for carbon
capture and storage costs...............................................................................................................7 2. Opportunities for CO2 capture..........................................................................................................10
2.1 Electric power generation ...........................................................................................................11 2.1.1 Conventional power plants with chemical absorption of CO2 .......................................12 2.1.2 IGCC plants with physical absorption of CO2 ...............................................................13 2.1.3 Pure oxygen combustion................................................................................................15
2.2 Industry .......................................................................................................................................16 2.2.1 Petroleum refining .........................................................................................................16 2.2.2 Chemicals.......................................................................................................................17 2.2.3 Iron and steel manufacture.............................................................................................18 2.2.4 Cement manufacture ......................................................................................................18 2.2.5 Natural gas production...................................................................................................19 2.2.6 Hydrogen production from natural gas for industrial uses.............................................20 2.2.7 Future hydrogen production...........................................................................................21
3. CO2 transportation and storage ........................................................................................................22 3.1 Transportation .............................................................................................................................22 3.2 Geologic storage .........................................................................................................................24
3.2.1 Depleted oil and gas reservoirs ......................................................................................24 3.2.2 Aquifers .........................................................................................................................26 3.2.3 Enhanced coal-bed methane ..........................................................................................28
3.3 Ocean storage..............................................................................................................................29 3.4 Other options...............................................................................................................................31
3.4.1 Direct use .......................................................................................................................31 3.4.2 Conversion to carbonates...............................................................................................32 3.4.3 Biological conversion to fuels .......................................................................................33
3.5 Regulatory issues and leakage ....................................................................................................33 4. Carbon capture and storage cost modeling for electricity generation...........................................34
4.1 Plant-level modeling of carbon capture and storage ...................................................................34 4.2 Integrated modeling of carbon capture and storage ....................................................................37
4.2.1 MIT EPPA world economy model.................................................................................38 4.2.2 Carnegie Mellon electricity sector model ......................................................................40 4.2.3 Pacific Northwest National Laboratory MiniCAM world economy model...................42
5. Summary and conclusion ...................................................................................................................43 Appendix: Alternative capture technologies...........................................................................................47
A.1 Adsorption...................................................................................................................................47 A.2 Cryogenic separation ..................................................................................................................48 A.3 Membrane separation..................................................................................................................49 A.4 Clathrate hydrates .......................................................................................................................50
Tables .........................................................................................................................................................51 Figures........................................................................................................................................................55 References ..................................................................................................................................................60
1
Prospects for Carbon Capture and Storage Technologies
Soren Anderson and Richard Newell∗
1. Introduction
Energy efficiency improvements and switching from fossil fuels toward less carbon-
intensive energy sources were once seen as the only realistic means of reducing carbon dioxide
(CO2) emissions. In recent years, however, analysts and policymakers have begun to recognize
the potential for a third option—the development of “end-of-pipe” technologies that would allow
for the continued utilization of fossil fuel energy sources while significantly reducing carbon
emissions. These technologies have collectively come to be known as carbon capture and
storage (CCS) technologies. Using these technologies, CO2 would be “captured” from large,
stationary sources (e.g., power plant flue gases), preventing its release to the atmosphere. This is
analogous to the removal of sulfur dioxide from emissions using end-of-pipe “scrubbers.”
Following capture, the CO2 would be compressed and transported to a location where it would be
stored (e.g., a deep aquifer, depleted oil field, or deep ocean). In contrast to indirect forms of
sequestration (e.g., forestation or enhanced ocean uptake of CO2), which rely on removing CO2
from the atmosphere, CCS would avoid atmospheric emissions altogether.
One sign of the increased seriousness with which policymakers view the potential for
CCS is the budget devoted by the U.S. Department of Energy to research on CCS, which has
increased from about $1 million in 1998 to a 2003 budget request of $54 million, just five years
later (see Figure 1). Another sign is that the Intergovernmental Panel on Climate Change (IPCC)
∗ Newell is a Fellow and Anderson is a Research Assistant at Resources for the Future, Washington, DC. We thank Howard Herzog, Jake Jacoby, and Ed Rubin for comments on a previous version of this paper, and we acknowledge financial support from U.S. Department of Energy grant DE-FG02-98ER62702. The views expressed in the paper do not, however, necessarily reflect those of DOE or these individuals.

Resources for the Future Anderson and Newell
2
recently convened a group of policymakers and experts to outline the structure of a future IPCC
special report on CCS technologies (Intergovernmental Panel on Climate Change 2002).
In this paper, we synthesize the existing literature to examine the prospects for CCS in
terms of its technical feasibility, cost, timing, ancillary environmental effects, and potential
contribution to an overall climate policy portfolio. Although these issues have been addressed in
several academic, international, and U.S. governmental reports (Riemer, Audus, and Smith 1993;
Adams et al. 1994; Ishitani and Johansson 1996; Chargin and Socolow 1997; Herzog, Drake, and
Adams 1997; U.S. Department of Energy 1999; Moomaw and Moreira 2001), and articles in the
popular economic and scientific press (Parson and Keith 1998; Herzog 2000, 2001; Economist
2002), we make a number of important new contributions. We have endeavored to make this the
most accessible, comprehensive, and up-to-date review of CCS. We systematically present both
the carbon reduction potential and the estimated mitigation cost associated with CCS
technologies as applied to electric power generation and various industrial emissions sources. In
addition to reporting capture costs, this review is unique in systematically including transport and
storage costs in these estimates, and in reporting costs across studies in a consistent manner.
Moreover, we present a careful discussion of CCS costs that helps clarify some of the differences
among cost estimates reported in the literature, drawing particular attention to the critical role of
natural gas prices. Finally, we discuss and interpret the most recent integrated modeling results,
synthesizing insight from these studies regarding the potential role of CCS technologies under
future climate policies.
1.1 Drivers of global climate change
Global climate change has rapidly become one of the most prominent environmental and
energy policy issues of our age. Although scientific and economic uncertainties remain, there is
little doubt: human beings are altering the earth’s climate. Through the burning of fossil fuels,

Resources for the Future Anderson and Newell
3
certain industrial processes, and various land use practices, we are contributing greatly to the
accumulation of so-called greenhouse gases (GHGs) in the atmosphere, which trap heat and
block outward radiation. By far the most prevalent of these GHGs is CO2. From 1991 to 2000,
CO2 accounted for 82% of total U.S. GHG emissions in terms of its global warming potential
(Energy Information Administration 2001).1 About 96% of these carbon emissions resulted from
the combustion of fossil fuels for energy (U.S. Environmental Protection Agency 2002). For
these reasons, climate change discussions have tended to focus on the reduction of CO2
generated during the combustion of fossil fuels.
The following identity has proven useful as a way of understanding the main drivers of
CO2 emissions:
22
CO emissionsEnergy consumptionCO emissions GDPUnit GDP Unit energy consumption
= × × ,
where GDP (gross domestic product) is a measure of the size of an economy. Even though the
factors in this identity are by no means independent of one another, it is still useful to consider
them in isolation. Energy consumption per unit of GDP is a measure of the “energy intensity” of
the economy. Thus, a number of policies aim to reduce carbon emissions through increased
energy efficiency (e.g., fuel economy standards for cars or energy efficiency standards for
appliances). The last factor, CO2 emissions per unit of energy consumption, is a measure of the
“carbon intensity” of the energy we use. Policies targeted at this factor have typically focused on
reducing the carbon content of energy through switching to lower-carbon fossil fuels (e.g., coal
to natural gas), and promoting low-carbon or carbon-free alternatives such as renewables (e.g.,
1 This figure takes into consideration the “global warming potential” of CO2 and other gases. The radiative force of methane (CH4), for example, is 30 times greater than that of CO2. The estimated residence time of CO2 in the atmosphere is about a century, however, whereas CH4 dissipates in only a decade. To account for this difference, climate analysts have devised what is known as global warming potential to provide a standard unit of comparison of various GHGs.

Resources for the Future Anderson and Newell
4
wind, biomass, solar, hydropower) and nuclear power. CCS would reduce the effective carbon
intensity of energy by directly removing CO2 from flue gases and industrial processes and
preventing its release to the atmosphere.
1.2 The potential role of carbon capture and storage
Some suggest that the “carbon problem” could be solved through the increased use of
renewable energy sources. Even if renewables become cost-competitive, however, which is an
open question, the time it will take them to penetrate the market implies significant continued use
of fossil fuels in the interim. Others see a built-in solution to the problem of fossil-fuel
combustion: there is a limited supply of fossil fuels, and at some point, their use will become too
costly, forcing a switch to alternative energy sources. Thus, the policy should be to wait until the
fossil fuel supply is depleted and allow rising fossil fuel prices to induce the development of
renewable energy sources. But this argument assumes that fossil fuels will become scarce before
the gradual atmospheric buildup of GHGs becomes too costly in terms of its effect on terrestrial
ecosystems and human societies.
As Figure 2 demonstrates, the carbon content of proven fossil fuel reserves exceeds
cumulative historic carbon emissions from 1860 through 1998 by a factor of 5. Moreover, future
years will likely bring the development of even more reserves, as undeveloped fossil fuel
resources become technically and economically recoverable. Thus, at current rates of extraction,
it could well be hundreds of years before the current fossil fuel supply is exhausted. Add to this
the fact that rapidly developing countries like China and India show little interest in abandoning
the use of their relatively inexpensive coal reserves, which constitute 20% of the global total
(Energy Information Administration 2002). These two countries alone are projected to account
for 22% of global annual emissions by 2020 (Energy Information Administration 2002).

Resources for the Future Anderson and Newell
5
Putting this in perspective, people often speak of doubling the preindustrial concentration
of atmospheric carbon to 450 parts per million by volume (ppmv), which could result in global
temperature increases of almost 2 degrees Celsius above 1990 levels by 2100 (Watson 2001,
p.101). Stabilization at this level is associated with approximately 400 gigatons (billion metric
tons) of carbon (GtC) of additional emissions, which assumes we would leave about 70% of the
carbon held in current proven reserves untouched (Moomaw and Moreira 2001)—not to mention
the reserves yet to be developed. This seems unlikely, given that the total value of U.S. fossil
fuel production was nearly $150 billion in 2000 alone (Energy Information Administration
2001). The huge stock of wealth invested in fossil fuels stands as a large political obstacle to any
policy that would significantly curtail their continued use. The history of failed attempts to raise
U.S. energy taxes attests to this political reality. These reasons all suggest that we will continue
to consume fossil fuels for many years to come, releasing a large portion of carbon stores into the
atmosphere in the form of CO2. Given our likely reliance on fossil fuels in the near and
foreseeable future, policymakers are looking for alternative ways of reducing carbon emissions.
Many view CCS technologies as a promising third alternative to increasing energy
efficiency and switching to less carbon-intensive energy sources. Carbon capture technologies
themselves are not new. Specialized chemical solvents were developed more than 60 years ago
to remove CO2 from impure natural gas, and natural gas operations continue to use these solvents
today. In addition, several power plants and other industrial plants use the same or similar
solvents to recover CO2 from their flue gases for application in the foods-processing and
chemicals industries. Finally, a variety of alternative methods are used to separate CO2 from gas
mixtures during the production of hydrogen for petroleum refining, ammonia production, and
other industries (Herzog 1999). All of these capture technologies are considered relatively

Resources for the Future Anderson and Newell
6
mature. Still, some believe that substantial technical improvements and cost reductions could be
realized were these technologies applied on a large scale (Herzog, Drake, and Adams 1997).
We also have significant experience with some carbon storage technologies. As oil prices
rose in the late 1970s and early 1980s, U.S. oil producers found it profitable to extract oil from
previously depleted oil fields by means of enhanced oil recovery (EOR) methods. These methods
involve injecting liquefied CO2 to repressurize the field, which facilitates the extraction of
additional oil but may also store the injected CO2. These operations induced a handful of fossil
fuel power producers to capture CO2 from their flue gases for use in EOR. Although falling
energy prices have caused these particular capture operations to shut down, the use of EOR
methods continues. Today, EOR operations account for 9 million (metric) tons of carbon (MtC),
or about 80% of the CO2 used by industry every year (U.S. Department of Energy 2003; Chargin
and Socolow 1997). About 20% of the CO2 used in EOR comes from the purification of natural
gas (Simbeck 2002), and a Canadian EOR operation recently began injecting CO2 captured from
a coal gasification plant in North Dakota. Most injected CO2 is extracted from natural
formations, however, and does not represent a net reduction in emissions.
Worldwide, the only known industrial operation engaged in CCS for the purpose of
avoiding carbon emissions is Statoil’s natural gas mining operation off the shore of Norway. As
in other natural gas operations, chemical solvents are used to remove CO2 from the natural gas,
which is approximately 9% CO2 by volume. Rather than pay Norway’s hefty carbon emissions
tax—which was lowered from about $200 per ton of carbon (tC) to $140/tC in 2000 (Herzog
2001)—Statoil has been compressing and injecting the captured CO2 into a deep, saltwater
aquifer below the ocean floor since 1996. The project incurred an incremental investment cost of
$80 million dollars, with an annual tax savings of $55 million dollars. Scientific monitoring of
the site indicates that the aquifer is indeed holding the injected CO2, though continued

Resources for the Future Anderson and Newell
7
monitoring, modeling, and analysis will provide a better indication of storage stability (Torp
2000).
Although CCS technologies are currently not widely used as a way to avoid carbon
emissions, we have already seen that it is technically feasible to capture CO2 from flue gases and
store it in geologic formations. In the presence of a sufficiently high implicit or explicit price on
carbon, there is evidence that CCS technologies can be economically sensible as well. In this
paper, we examine opportunities for applying CCS technologies on a much larger scale, while
considering issues of cost, timing, and ancillary environmental effects. We find that CCS
technologies could play an important role in mitigating carbon emissions, conditional on policies
that impose a sufficiently stringent constraint on such emissions. Prospects appear to be most
promising for carbon capture from electric power generation and some industrial sources, with
storage in geologic formations such as depleted oil and gas reservoirs and deep aquifers. Current
cost estimates for these scenarios range from about $200/tC to $250/tC avoided. However, future
costs are likely to decline, perhaps substantially, with technological advances and are particularly
sensitive to assumptions regarding natural gas prices. CCS could constitute a substantial share of
mitigation effort within several decades, significantly reducing the cost of mitigation. Although
the potential for CCS technologies is large, a number of technical and political issues regarding
the suitability of storage options need to be resolved before their widespread application would
be possible.
1.3 Importance of the “energy penalty,” reference technology, and model assumptions for carbon capture and storage costs
Before launching into the body of the paper, we pause here to clarify how several
important considerations influence the variety of CCS cost measures that appear in the literature.
First, because the capture process uses energy, it has a parasitic effect on electricity production.

Resources for the Future Anderson and Newell
8
For a fixed output of electricity, carbon capture imposes a so-called energy penalty by increasing
the fossil fuel energy needed to generate that fixed output. Hence, the quantity of carbon
captured and stored will be greater than the quantity of carbon actually avoided. For electricity
production, average capture costs in $/tC avoided are given by (c1 – c0)/(e0 – e1), where c is the
cost of electricity production in kilowatt-hours ($/kWh),2 e is the rate of carbon emissions
(tC/kWh), and the subscripts denote these variables with and without capture (1 and 0,
respectively).3 These calculations often ignore CO2 transportation and storage costs, however,
which are generally reported in $/tC stored. To add storage costs to capture costs in $/tC
avoided, storage costs must be adjusted upward to reflect the fact that the ratio of carbon
captured to carbon avoided is greater than 1.4 All cost estimates in this paper are given in average
$/tC avoided, including transport and storage, unless otherwise noted.
Second, when making judgments about the competitiveness of CCS, the choice of the
comparison plant (i.e., the c0 and e0 above) is also an important consideration. As demonstrated
in Table 1, assumptions about the reference plant can have a dramatic effect on CCS costs. One
approach is to calculate the incremental cost of applying CCS to a particular generation
technology (e.g., a pulverized-coal plant with CCS compared with the same plant without CCS),
as given by the bold figures in Table 1. This type of cost estimate is a necessary ingredient to
building up a portfolio of technology options from which one might choose in order to minimize
the cost of attaining a given carbon reduction target. We present this type of incremental CCS
2 Electricity production costs refer to busbar costs (i.e., they ignore transmission and distribution), unless otherwise noted. 3 Similar methods can be used to calculate costs in other industries—that is, by taking c to be the cost of production of the relevant good, and e to be the carbon emissions rate per unit of production of that good. 4 This can be done by multiplying transport and storage costs in $/tC stored by the ratio of total carbon captured to total tons avoided (and assuming that the process of transportation and storage itself contributes negligibly to carbon emissions).

Resources for the Future Anderson and Newell
9
cost estimate throughout Section 2, so that we can clearly distinguish the relative costs of
applying CCS to different specific power generation technologies.
Nonetheless, the true cost competitiveness of CCS as a means of carbon mitigation
relative to business-as-usual is best measured by comparing a CCS plant with its closest marginal
competitor, which can only be determined in context. This is the economically relevant cost
concept for understanding the carbon price, or marginal cost relative to baseline, at which CCS
technologies may come on line—and for gauging the attractiveness of CCS relative to other
mitigation options, such as fuel switching and energy-efficiency improvements. For example, the
relevant point of comparison for a new integrated gasification combined-cycle (IGCC) coal plant
with CCS may not be a new IGCC plant without CCS, but rather a new natural gas combined-
cycle (NGCC) plant. Confusing the incremental cost of applying CCS to a given technology with
the carbon price (marginal carbon cost) at which CCS becomes competitive will lead to
misestimation of true mitigation costs—unless the reference technology is in fact the marginal
business-as-usual technology. Taking our IGCC example, Table 1 illustrates that if a new NGCC
is the relevant reference case, a new IGCC plant with CCS entails costs of over $500/tC—not the
smaller $140/tC relative to an IGCC reference plant. Section 4 further clarifies this issue and
presents results from modeling efforts that directly confront the computation of carbon prices at
which CCS becomes attractive. Throughout the paper we are careful to distinguish the cost
concept being used if it is sensitive to this base case issue.
Finally, most cost calculations are sensitive to various modeling assumptions, especially
with regard to natural gas prices, which may change significantly.5 Table 1 assumes gas prices of
5 Average gas prices may not only be relatively volatile—take the 300% spike from about $3 per million Btu (MBtu) in early 2000 to $9/MBtu in early 2001 as a recent example (Energy Information Administration 2002)—they may also increase significantly over this century. Although the Department of Energy does not forecast significantly rising reference-case gas prices over the next two decades (Energy Information Administration 2003),
Resources for the Future Anderson and Newell
10
$3/MBtu, which is the average price over the past decade (Energy Information Administration
2002). If gas prices are twice as high as assumed in Table 1, then the reference technology for
new plants switches from an NGCC to a pulverized-coal (PC) plant. As shown in Table 2, this
change in reference plant significantly decreases the carbon price at which new PC, NGCC, and
IGCC plants with CCS become competitive, since a reference coal plant without CCS has a
higher rate of emissions than an NGCC. Different assumptions regarding technological advance
and future cost reductions can also dramatically affect results.
In Section 2 we identify opportunities for carbon capture in particular industries. In
Section 3 we discuss transportation and storage of CO2. Section 4 describes recent modeling
efforts and their insights into the costs and possible timing of CCS technologies. Section 4
summarizes and concludes. A description of alternative capture technologies is contained in the
Appendix.
2. Opportunities for CO2 capture
As shown in Table 3, the United States emitted nearly 1.6 GtC in 2000. About 97% of
these emissions came from the use of fossil fuels, virtually all of which was released through
combustion (Energy Information Administration 2001). About 40% of carbon emissions came
from the generation of electricity. Not counting indirect emissions associated with the
consumption of electricity, the transportation and industrial sectors also accounted for a
significant portion of emissions, at 32% and 15%, respectively. Finally, the commercial and
residential sectors accounted for a combined 11% of CO2 emissions from fossil fuels, net of
electricity-related emissions (Energy Information Administration 2001).
gas supplies are in relatively short supply compared with coal. Hence, most CCS modeling studies assume or predict rising gas prices, due in part to the imposition of climate policies that encourage greater natural gas use (see Section

Resources for the Future Anderson and Newell
11
These sectors all emit significant quantities of carbon, but not all are amenable to CCS.
Because of their high capital costs and economies of scale, CCS technologies are particularly
well suited to large, stationary sources of CO2 emissions; power plants are the clearest
contenders. But energy intensive industries like oil refining, iron and steel manufacturing, and
cement production also combust large quantities of fossil fuels and have significant carbon
emissions. The cost of capture from these sources depends primarily on the properties of their
flue gas streams: costs generally fall with higher concentrations of CO2 and lower temperatures.
In addition to those combustion sources, natural gas operations produce concentrated CO2
by-products for which the incremental cost of capture and compression is relatively low.
Similarly, most of the hydrogen used in ammonia manufacture, oil refining, and other industries
is derived from the decarbonization of fossil fuels, which also generates a by-product stream of
CO2 and presents low-cost opportunities for CCS. Were hydrogen production from fossil fuels to
increase substantially—as would likely occur in a move toward a so-called hydrogen economy—
then low-cost opportunities for CCS would be even greater.
2.1 Electric power generation
The U.S. power generation sector produced more than 17.5 trillion kWh of electricity
between 1995 and 1999, resulting in 3.1 GtC of emissions. About 78% of these emissions came
from coal-fired power plants, and 14% came from natural gas–fired power plants. The remaining
8% came from the combustion of petroleum, light oil, methane, coal-oil mixture, propane gas,
blast furnace gas, wood, and refuse. Coal plants, which account for the majority of emissions,
emitted 0.27 kg C/kWh during this period, compared with only 0.17 kg C/kWh for natural gas
(Energy Information Administration 2001). As large, stationary sources of CO2 emissions, these
4.2).

Resources for the Future Anderson and Newell
12
plants represent the foremost opportunity for CCS. Given current technology and gas prices of
$3/MBtu, recent estimates suggest that the incremental cost of applying CCS to new
conventional coal or natural gas plants would be about $225/tC to $230/tC (David and Herzog
2000). The cost of retrofitting an existing conventional coal plant with CCS technologies would
be about $190/tC (Simbeck 2001).6,7 These costs are within the range of mitigation costs
estimated by several models for domestic U.S. compliance with the Kyoto Protocol (about a 30%
reduction in carbon emissions from baseline in 2010) (Hourcade and Shukla 2001).
2.1.1 Conventional power plants with chemical absorption of CO2 Most coal-burning power plants use simple, steam-driven turbines to produce electricity,
while most new natural gas plants employ a gas turbine and use excess heat to power a second,
steam-driven turbine. For flue gas streams with low or moderate concentrations of CO2, as are
typically found in these plants, the best existing capture method is absorption using a chemical
solvent such as monoethanol amine (MEA). Because CO2 is an acid gas, alkaline solvents such
as MEA form chemical bonds with CO2 and can absorb it from a flue gas stream. Once the CO2
has been absorbed, these solvents can be “regenerated” by applying heat, releasing a stream of
CO2, and allowing the solvent to be recycled. These techniques have been used to recover by-
product CO2 or directly manufacture CO2 from fossil fuel combustion for decades.8 Although
chemical absorption can remove CO2 at low concentrations, breaking the chemical bond between
6 When necessary, we converted all cost figures to U.S. $2000 using the annual Producer Price Index and average annual exchange rates, with the exception of figures from studies that were published during or after 2000. 7 Both David and Herzog (2000) and Simbeck (2001) provide the spreadsheet data that underlie their analyses; we manipulated these data to make gas prices consistent between the two sets of estimates. These costs also include our addition of transport and storage costs of $37/tC stored, which is the midpoint of previous estimates (Herzog, Drake, and Adams 1997) and is used in recent modeling exercises (McFarland, Herzog, and Reilly 2002; McFarland et al. 2001). Recent work suggests that combined transport and storage costs may be somewhat lower, however (Bock et al. 2002). 8 Chemical absorption is also a common method used by the foods and beverages industry to recover CO2 released during fermentation processes.

Resources for the Future Anderson and Newell
13
the CO2 and the chemical solvent is energy intensive. Moreover, contaminants typically found in
flue gases (e.g., SO2, NOX, hydrocarbons, and particulates) usually need to be removed prior to
capture, as they can inhibit the ability of solvents to absorb CO2. Note, therefore, that the CCS
cost estimates cited typically assume that these pollutants have already been controlled, and thus
the cost of their removal is not included in CCS costs.
Postcombustion chemical absorption imposes an energy penalty of about 15% to 30% for
natural gas plants and 30% to 60% for coal plants (Herzog, Drake, and Adams 1997; Turkenburg
and Hendriks 1999; David and Herzog 2000). Pilot studies aimed at improving the absorption
process show that the use of new solvent technologies (e.g., membranes that facilitate contact
between flue gases and chemical solvents) and better integration of capture technologies can
lower energy penalties to about 20% for conventional coal and about 10% for natural gas
(Herzog, Drake, and Adams 1997; David and Herzog 2000). Reduced thermal efficiencies and
significant capital costs for capture increase the busbar cost of electricity by about 80% for coal
and by 50% for natural gas (Turkenburg and Hendriks 1999). With today’s technologies, the
incremental cost of applying CCS by means of chemical absorption to new conventional coal and
gas plants is about $225/tC to $230/tC, but near-term technical improvements (i.e., 2012
technology) could reduce these costs to about $160/tC to $190/tC (David and Herzog 2000).
Retrofitting existing coal plants with chemical capture currently costs about $190/tC (Simbeck
2001).9
2.1.2 IGCC plants with physical absorption of CO2 The “decarbonization” of fossil fuels and potential movement toward a hydrogen-based
energy system may provide unique opportunities for CCS. In the integrated gasification
9 These costs include our addition of transport and storage costs of $37/tC stored.

Resources for the Future Anderson and Newell
14
combined-cycle (IGCC) process, coal is gasified to form a mixture of carbon monoxide (CO)
and hydrogen (H2) known as synthesis gas (syngas). In IGCC without capture, syngas is
combusted directly in gas turbines. In IGCC with capture, syngas undergoes an additional
reaction with steam in the presence of catalysts to form a mixture of H2 and CO2. The H2 is
separated for use in a combined-cycle gas turbine, generating a pure stream of CO2 that can be
directly compressed and stored. Two IGCC demonstration projects funded by the U.S.
Department of Energy were recently completed in Florida and Indiana, and a third project is
operating in Tennessee with partial funding from the Department of Energy. Several companies
have announced plans to use coal gasification technologies in future power plants. There have
been no such demonstration plants with capture of CO2, though research at various Department
of Energy laboratories and industry sites is looking into improved technologies for CO2 and
hydrogen separation (U.S. Department of Energy 2003).
For source streams with high concentrations of CO2, as would be found in an IGCC plant,
physical absorption using a solvent like Selexol (dimethylether of polyethylene glycol) or
Rectisol (cold methanol) represents a less costly alternative to chemical absorption. The
absorptive capacity of these solvents increases with external gas pressure and decreases with
temperature, so applying heat or easing external pressure will regenerate the solvents and release
the CO2. Regeneration of physical solvents is not as energy intensive as for chemical absorption,
and energy penalties for IGCC plants are about 15% (David and Herzog 2000). Thus, the
incremental cost of applying capture is lower for IGCC plants than for conventional natural gas
and coal plants. The estimated cost of electricity for new IGCC plants without capture is only
slightly higher than for a new conventional coal plant, and costs are expected to fall with further
development (Herzog, Drake, and Adams 1997). Nonetheless, conventional gas plants beat both
coal technologies when gas prices are sufficiently low (David and Herzog 2000).

Resources for the Future Anderson and Newell
15
The incremental cost of applying CCS to a new IGCC plant is currently about $140/tC,
and near-term technical improvements could reduce costs to about $100/tC (David and Herzog
2000). The cost of replacing an existing conventional coal plant facility with IGCC and CCS (at
the same site) is currently about $150/tC (Simbeck 2001).10,11 Recall from Table 1 and the
discussion above, however, that although these costs are lower than for CCS applied to
conventional coal and gas plants, the true cost of carbon mitigation through IGCC with CCS is
likely to be much greater. This is because IGCC without CCS is unlikely to be the relevant
reference technology for comparison.
2.1.3 Pure oxygen combustion A potential alternative to these absorption technologies would be to combust fossil fuels
in pure oxygen instead of air, which contains approximately 78% nitrogen by volume. If nitrogen
were removed from the process, flue gas streams would have a much higher concentration of
CO2, reducing or eliminating the need for costly CO2 capture. Moreover, NOX emissions (a
source of acid rain and an ozone precursor) and the subsequent need for scrubbing would be
reduced significantly. Finally, trace pollutants such as NOX and SO2 could potentially be
compressed and stored along with CO2, allowing control costs to be “shared” among pollutants
and resulting in a zero-emissions power plant—assuming, of course, that the environmental
effects of jointly storing these other pollutants are acceptable. The obvious drawback to this
technique is that production of oxygen in an air separation unit is quite costly (Herzog, Drake,
and Adams 1997), and thus capture costs are higher than for other techniques (Göttlicher and
Pruschek 1997).
10 These costs include our addition of transport and storage costs of $37/tC stored. 11 Goldthorpe and Davison (2000) find that physical absorption processes by means of a specialized solvent (i.e., Selexol) and plain seawater combined with ocean storage have similar mitigation costs for a plant near the ocean.

Resources for the Future Anderson and Newell
16
2.2 Industry
Within the industrial sector, manufacturing alone accounts for about 81% of energy-
related carbon emissions (Energy Information Administration 2001, 2000; U.S. Environmental
Protection Agency 1998). Energy-intensive industries like petroleum refining, petrochemicals,
iron and steel manufacturing, and cement, lime, and soda ash production all depend on
significant process heat and steam, which are typically derived from the combustion of fossil
fuels. In principle, it is possible to capture CO2 from the flue gases of these industries—most
likely with a chemical absorbent like MEA in essentially the same process as for power plants. In
practice, however, opportunities for carbon capture vary from industry to industry, and from
plant to plant. In some cases, it may be straightforward to build or retrofit a manufacturing plant
to accommodate carbon capture; in other cases, these changes may not be compatible with
particular manufacturing processes.
In addition to emissions from fossil fuel combustion, industries such as natural gas and
hydrogen production (e.g., in petroleum refining and ammonia manufacture) currently employ
capture technologies to separate CO2 from gas mixtures. Although there are some commercial
uses for this CO2, most is simply vented to the atmosphere. These industries represent relatively
inexpensive first options for CCS, since incremental costs would include only transportation and
storage. The total estimated cost of CCS is 55% to 80% lower for these industries than for
electric power generation, or about $50 to $90/tC rather than $200 to $250/tC.
2.2.1 Petroleum refining Within the manufacturing sector, the single largest source of carbon emissions is the
petroleum refining industry, which accounted for 74.3 MtC or about 16% of industrial emissions
Seawater scrubbing has low capture efficiency, however, and so the quantity of carbon avoided is less.
Resources for the Future Anderson and Newell
17
in 1994, not including emissions from industrial electricity use. About 78% of these emissions
came from the combustion of waste products (e.g., petroleum coke and still gas), petroleum
fuels, and natural gas to produce the heat and steam required by all processes (Energy
Information Administration 2000; U.S. Environmental Protection Agency 1998). CCS applied to
these emissions would likely incur comparable or slightly greater capture and storage costs than
for electric power plants (Thambimuthu, Davison, and Gupta 2002; Herzog, Drake, and Adams
1997), with chemical absorption being the most promising method for CO2 removal. The
remaining 22% of refinery emissions resulted from the noncombustion use of fossil fuels, such
as the production of hydrogen from natural gas in dedicated facilities or from the gasification of
petroleum residues and waste products. Incremental mitigation costs for CCS applied to these
processes are significantly lower, since the processes already generate relatively pure streams of
CO2. The cost of capture and storage from Dutch residue gasification plants has been estimated
at $90/tC (Farla, Hendriks, and Blok 1995).12 We consider dedicated hydrogen production from
natural gas below, in Section 2.2.6.
2.2.2 Chemicals The chemicals industry is the second-largest source of manufacturing emissions and
accounted for 52.6 MtC in 1994, or about 12% of industrial carbon emissions, not including
electricity. About 77% of these emissions came from the combustion of fossil fuels (Energy
Information Administration 2000; U.S. Environmental Protection Agency 1998). The cost of
capture from the flue gases of various Dutch petrochemical industries (e.g., ethylene, propylene,
butadiene, and benzene manufacture) using an MEA solvent has been estimated at about $245/tC
12 This includes our addition of transport and storage costs of $37/tC captured and stored. The authors did not provide information regarding the ratio of carbon captured to carbon avoided, however, so we simply assumed a ratio of 1. This assumption may lead to an underestimation of cost, though it is probably slight, given that the incremental energy requirements (i.e., extra fossil fuel consumption) in this scenario would be relatively low.

Resources for the Future Anderson and Newell
18
(Farla, Hendriks, and Blok 1995).13 The remaining 23% of these emissions came from the
nonfuel use of fossil fuel resources, such as hydrogen production from natural gas during
ammonia manufacture. Again, we consider hydrogen production from natural gas below, in
Section 2.2.6.
2.2.3 Iron and steel manufacture Iron and steel production is the third-largest source of emissions among manufacturing
industries, accounting for 32.6 MtC or about 7% of industrial emissions in 1994, net of
electricity (Energy Information Administration 2000). Most flue gas emissions result from the
direct combustion of fossil fuels; a small fraction comes from the oxidization of metallurgical
coke in the blast furnace. In an integrated steel plant that uses a basic oxygen furnace to convert
pig iron to steel, approximately 80% of carbon emissions is contained in flue gas from the blast
furnace, and an additional 20% is contained in coke-oven gas and basic oxygen furnace gas
(Farla, Hendriks, and Blok 1995).14 Preliminary calculations suggest that 71% of Dutch iron and
steel emissions could be avoided by applying CCS technologies to blast furnace gases at a cost of
about $195/tC (Farla, Hendriks, and Blok 1995).15
2.2.4 Cement manufacture In cement manufacture, limestone is heated (calcined) in a cement kiln to produce lime,
which is then combined with other materials to produce clinker—an intermediate product in the
manufacture of cement. Roughly one-half of cement industry emissions comes from the
calcination of limestone, which releases a concentrated CO2 by-product that amounted to 11 MtC
13 This includes our addition of transport and storage costs of $37/tC captured and stored. We converted this to $50/tC avoided multiplying by (1.62 MtC/1.2 MtC), the ratio of annual carbon captured to carbon avoided. 14 About 15% of the carbon introduced into the process ends up being incorporated either into the steel or into slag or by-products and is thus sequestered from the atmosphere. 15 This includes our addition of transport and storage costs of $37/tC captured and stored. We converted this to

Resources for the Future Anderson and Newell
19
in 2000 (Energy Information Administration 2001). About 6.2 MtC came from the direct
combustion of fossil fuels in 1994 (Energy Information Administration 2000).16 Consequently,
flue gas concentrations of CO2 are relatively high in cement manufacture, ranging from 14% to
33% (Hendriks et al. 1998). Preliminary calculations suggest that the application of CCS
technologies in cement production could reduce carbon emissions by as much as 65% to 70%. If
feasible, capture and storage costs would likely be $180/tC to $915/tC avoided (Hendriks et al.
1998, Gale, 2000 #22). Similarly, the calcination of limestone in commercial lime production
generated 4.3 MtC of process-related emissions in 2000 (Energy Information Administration
2001), and an additional 1.7 MtC came from the direct combustion of fossil fuels in 1994
(Energy Information Administration 2000).17 Mitigation costs for CCS would likely be similar to
those for cement manufacture.
2.2.5 Natural gas production Natural gas contains up to 20% CO2 by volume, most of which must be removed to
produce pipeline-quality gas. In fact, MEA solvents were developed some 60 years ago
specifically for this purpose. Some of this CO2 is used for industrial applications—20% of the
CO2 used in EOR operations, for example, comes from the purification of natural gas (Simbeck
2002). But most of the CO2 from natural gas purification is simply released to the atmosphere;
these operations vented 5 MtC in 2000 (Energy Information Administration 2001). This CO2
could, however, be compressed and stored in various geological formations, as demonstrated by
Statoil’s gas production operation at Sleipner, offshore Norway. Compression and injection of
$46/tC avoided multiplying by (2.52 MtC/2 MtC), the ratio of annual carbon captured to carbon avoided. 16 The cement industry had a total of 8.6 MtC of energy-related emissions. We multiplied this figure by 0.72, the ratio of direct combustion emissions to total energy-related emissions for the entire stone, clay, and glass industry to get the 6.2 MtC figure above. 17 We multiplied 2.4 MtC of total energy-related emissions by 0.72 to get the 1.7 MtC figure. See footnote 16.

Resources for the Future Anderson and Newell
20
CO2 at Sleipner raised total commercial gas production costs by about 1% (Hanisch 1998;
Johnson 2000), with mitigation costs of about $55/tC avoided to store the CO2 that was already
being captured (Herzog 2000). Nearly 3 MtC has been stored to date (Arts et al. 2002).
2.2.6 Hydrogen production from natural gas for industrial uses Of the 9 Mt of hydrogen used by industry in 1990, about 30% was used during the
manufacture of ammonia, and about 60% was used for petroleum refining (Chargin and Socolow
1997). Approximately 98% of the hydrogen used in ammonia production comes from the
catalytic steam reforming of natural gas, which released a by-product stream of pure CO2
representing 5.2 MtC in 2000 (U.S. Environmental Protection Agency 2002). Approximately
40% of the hydrogen used in petroleum refining is produced in dedicated facilities, most of
which also use steam reforming of natural gas (Chargin and Socolow 1997)—though some
refineries use petroleum residues as a feedstock, as described above. Dedicated hydrogen
production facilities in petroleum refineries generated 4.2 MtC of emissions in 1990. Finally, a
small amount of so-called merchant hydrogen is produced annually by one firm for distribution
and sale to another, with emissions of approximately 0.4 MtC in 1990 (Chargin and Socolow
1997).18 Most of these processes rely on adsorption (with a d) technologies to separate CO2 from
hydrogen.19
Because hydrogen production in these industries already involves the capture and
separation of CO2, the incremental cost of applying CCS technologies (i.e., additional cleanup,
18 Every 1 Mt of hydrogen produced from natural gas results in about 2 MtC of CO2 emissions (Chargin and Socolow 1997). Thus, emissions from dedicated facilities in petroleum refineries is given by (60%)·(9 Mt hydrogen)·(40%)·(2 MtC/Mt hydrogen) = 4.3 MtC. “Merchant hydrogen” accounted for 2% of total production, implying (2%)·(9 Mt hydrogen)·(2 MtC/Mt hydrogen) = 0.4 MtC of CO2 emissions. 19 Adsorption (with a d) refers to the capture of CO2 on the surface of a high-surface-area solid. Absorption (with a b), as described above in Sections 2.1.1 and 2.1.2, refers to the capture of CO2 in a liquid chemical solvent (e.g., MEA for PC plant flue gas) or liquid physical solvent (e.g., Selexol for separation of CO2 from hydrogen in an IGCC plant). See Appendix, Section A.1.

Resources for the Future Anderson and Newell
21
compression, transportation, and injection) is among the lowest for all CCS opportunities.
Chargin and Socolow (1997) estimate that the incremental cost of separation and compression
would add only 10% to the cost of hydrogen production in a large facility. After adding
transportation and storage, this implies a mitigation cost of about $75/tC.20 Others have
estimated the cost to be about $50/tC (Blok et al. 1997).21 Finally, the mitigation cost of CCS has
been estimated at about $70/tC for hydrogen production during ammonia manufacture in the
Dutch fertilizer industry (Farla, Hendriks, and Blok 1995).22
2.2.7 Future hydrogen production Most sources of CO2 emissions from primary fossil fuel combustion in the residential,
commercial, and transportation sectors are not currently amenable to CCS technologies. Many
researchers believe, however, that hydrogen has the potential to replace gasoline and other
petroleum-based fuels as the primary energy carrier within these sectors (e.g., for use in
hydrogen fuel cells). Were this to happen, direct carbon emissions from these sectors would be
eliminated. Hydrogen would most likely come from syngas derived from steam-reformed natural
gas or gasified coal (described above), unconventional hydrocarbon fuels, municipal wastes, or
biomass.23
Hydrogen production from these sources would release a pure stream of CO2, creating a
relatively low-cost opportunity for the large-scale application of CCS technologies (Chargin and
20 The incremental cost of capture and compression is $0.52/GJ of hydrogen, and the rate of carbon emissions without capture is 0.014 tC/GJ (Chargin and Socolow 1997). Assuming that carbon emissions from the capture process itself are negligible (see footnote 12), then capture costs are ($0.52/GJ)/(0.014 tC/GJ) = $37/tC avoided. We add a transport and storage cost of $37/tC. 21 This includes the cost of 100 km of pipeline transport to and storage in depleted natural gas fields, as calculated by the authors. This value assumes a 10% discount rate (costs are $40/tC with a 5% discount rate). 22 This includes our addition of transport and storage costs of $37/tC captured and stored. The ratio of carbon captured to carbon avoided cited in this study is 1. 23 It is also possible to produce hydrogen through the electrolysis of water, though this is more costly than other methods. Further, while this process incurs no direct carbon emissions, it could generate indirect emissions if the

Resources for the Future Anderson and Newell
22
Socolow 1997). Capture costs would likely be similar to capture costs for hydrogen and
ammonia production (see above). Still, the widespread use of hydrogen-powered vehicles will
depend on the development of an infrastructure for hydrogen supply and distribution that, if it
occurs, would likely occur only after significant delay (Simbeck 2002).
3. CO2 transportation and storage
Once CO2 has been captured, cleaned, and compressed, it must be transported and stored
in a suitable location. Several options have been suggested, including depleted oil and natural gas
fields, deep coal beds, saline aquifers, and the ocean. Although estimated storage costs are small
relative to capture, the capacity, storage integrity, technological feasibility, and potential
environmental impacts of these storage options are uncertain. Moreover, transport costs often
depend on a fortuitous matching of CO2 sources and storage locations, generating considerable
variations in cost. The combined costs of transport and storage are typically estimated to range
from about $20/tC to $55/tC stored (Herzog, Drake, and Adams 1997). There may be limited
opportunities for net benefits of $15/tC to $30/tC stored, however, in the case of EOR and
enhanced coal-bed methane recovery operations that generate revenue in excess of storage costs
(Stevens and Gale 2000; Stevens et al. 1998). We discuss these issues below, with summary
information appearing in Table 4.
3.1 Transportation
Transport in dedicated pipelines is the most promising method for delivering captured
CO2 to storage facilities, though other methods, such as barges or ships for ocean storage, have
been suggested (Adams et al. 1994; Herzog, Drake, and Adams 1997). The oil and gas industry
necessary electricity were derived from fossil fuel combustion.

Resources for the Future Anderson and Newell
23
has years of experience with CO2 pipelines, transporting CO2 hundreds of kilometers for use in
EOR operations. Large-scale CO2 transport would undoubtedly require the development of
additional infrastructure, though there may be limited opportunities to use existing oil and gas
pipelines when the fields they serve are retired and converted to storage sites (Adams et al.
1994).
Transport costs are dominated by the investment in pipeline infrastructure. According to
Blok et al. (1997), investment costs I are given by
0.9(190 955 ) ,I d L= + ⋅ ⋅
where d is the diameter of the pipeline (m), and L is the pipeline length (m). Assuming a pipeline
diameter of 0.5m (the optimal diameter for an hourly flow of 135tC/hr, according to the authors),
this implies a total investment of about $700,000 per km.24 Operation and maintenance costs are
small in comparison, and the average cost of transporting CO2 falls dramatically with scale.
Transport costs are also reduced significantly when CO2 has been pressurized to its liquid form,
though most storage options require pressurized injection of CO2 anyway. Transport costs are
estimated to be about $5/tC to $10/tC per 100 km when matched to a coal plant of typical size
(Herzog, Drake, and Adams 1997).
Although transport of concentrated CO2 presents some concerns for human health—CO2
is denser than air and could cause suffocation in the event of a pipeline break and mass release—
the avoidance of low-lying and densely populated areas would mitigate the harm from possible
pipeline breaks (Adams et al. 1994).25 Further, experience with pipeline transport in the oil and
24 This translates to $7/tC per 100 km, assuming a constant 135tC/hr flow, with costs annualized over 20 years at a 10% discount rate ($700,000/km x 100 ÷ 135tC/hr ÷ 8760 hr/yr x 0.12/yr = $7/tC per 100 km). 25 In 1986, a sudden release of CO2 gas was emitted from the volcanic Lake Nyos in Cameroon, suffocating 1,700 people and hospitalizing 845 others in the valley below. Although concentrated releases of CO2 on this massive scale would be highly unlikely for CO2 transportation and storage, this freak occurrence illustrates the concerns regarding CO2 storage.

Resources for the Future Anderson and Newell
24
gas industry suggests that these risks are low. Still, the general public’s perceptions of risk could
pose potential obstacles to the siting of CO2 pipelines.
3.2 Geologic storage
Storage of CO2 in geologic formations, particularly in depleted oil and gas reservoirs,
represents the best near-term option for application of CCS technologies. Ignoring transportation,
the cost of geologic storage is about $5/tC to $30/tC stored (Herzog, Drake, and Adams 1997).
Costs, including transportation, are roughly comparable with ocean storage options, but storage
of CO2 in geologic formations is considerably better understood than ocean storage. Further, the
environmental risks and uncertainties seem much lower for geologic storage. Thus, although
some environmental groups have become more receptive to carbon capture and geologic storage
(including geologic storage under the ocean), they remain strongly against ocean storage.
3.2.1 Depleted oil and gas reservoirs Storage of CO2 in depleted oil and gas reservoirs may represent the best near-term
storage option. EOR operations currently pipe CO2 hundreds of kilometers for injection into
depleted oil fields, facilitating the extraction of oil where it would otherwise be too costly or
impossible to recover. About 9 MtC of CO2 was pumped into the ground for EOR in 2000 (U.S.
Department of Energy 2003). In September 2000, the Pan Canadian Resources Ltd. EOR
operation began injecting CO2 into the Weyburn oil field in southeastern Saskatchewan using by-
product CO2 piped 320 km from a coal gasification plant in North Dakota. It is expected that
about 5 MtC will be stored over the Weyburn project’s 25-year lifetime (Moberg, Stewart, and
Stachniak 2002). Although CO2 storage at Weyburn represents a net reduction in carbon
emissions, most EOR operations currently obtain their CO2 from natural formations and do not
contribute to the reduction of carbon emissions.

Resources for the Future Anderson and Newell
25
The price paid for CO2 by EOR operations is about $40/tC to $65/tC (Stevens and Gale
2000; Chargin and Socolow 1997). Thus, for limited amounts of CO2 used in EOR, storage could
generate net benefits ranging from $15/tC to $30/tC stored (Stevens, Kuuskraa, and Gale
2000).26 Opportunities for EOR would be insufficient, however, for larger amounts of CO2
storage. Further, if CCS technologies were applied widely, the market price paid by EOR
operations for CO2 would almost certainly plummet, implying little or no economic value for
captured CO2. Storage of CO2 in gas reservoirs would also be unlikely to generate many
opportunities for positive economic value, since up to 95% of natural gas can be recovered using
conventional extraction techniques, whereas conventional oil recovery leaves about 75% of the
oil in the ground (van der Meer 2002). Where feasible, however, there is limited evidence that
enhanced natural gas recovery through injection of CO2 could generate a positive economic
value of about $30/tC stored (Blok et al. 1997).
There is an estimated 1 GtC of storage capacity in currently abandoned U.S. oil and gas
fields, with an eventual capacity of about 25–30 GtC in the United States (Winter and Bergman
1996; Stevens, Kuuskraa, and Gale 2000). To get a rough sense of this magnitude, if 100% of
U.S. carbon emissions were captured and stored in these reservoirs, this would imply that about
15 to 20 years of emissions could be stored at the current U.S. emissions rate of 1.6 GtC per
year. Effective capacities could be lower, however, if water from other nearby formations has
intruded into depleted reservoirs. Storage costs in these reservoirs could range from $5/tC to
$70/tC stored, with a base case estimate of about $15/tC (Bock et al. 2002).
Finally, current knowledge suggests that storage of CO2 in depleted oil and gas reservoirs
carries the least potential environmental risk. These sites have already demonstrated their ability
26 In recent work, Bock et al. (2002) estimate that EOR storage of CO2 could generate net benefits as high as $335/tC stored, or cost as much as $270/tC stored; in their base-case calculation, EOR generates average net benefits

Resources for the Future Anderson and Newell
26
to store pressurized fluids for millions of years, and knowledge gained during exploration for oil
and gas has led to a relatively good understanding of the formations. Environmental risks do
exist, however, including potential leakage of CO2 through natural pathways or fractures caused
by injection into geologic formations with possible contamination of groundwater. Leakage from
surface installations and wells is also possible, though experience from EOR has demonstrated
that these risks can be mitigated through quality construction, maintenance, operation, and
control of storage facilities (Adams et al. 1994). The reservoir-monitoring project at the
Weyburn EOR facility will provide further information regarding the long-term storage capacity
and integrity of these locations (Brown et al. 2001).
3.2.2 Aquifers While depleted oil and gas reservoirs represent the best near-term storage option, deep
aquifers may represent a better option in the longer term, as shown in Table 3. Deep aquifers,
whose locations are mapped in Figure 3, are generally better matched to sources of emissions
than oil and gas reservoirs, implying lower transport costs. Further, while the specific properties
of oil and gas reservoirs are better understood, the potential U.S. storage capacity of aquifers is
much larger, ranging from 1 GtC to 150 GtC (Bergman and Winter 1996). If 100% of U.S.
carbon emissions were captured and stored in these reservoirs, this would imply as many as 100
years of emissions could be stored. Estimated costs are about $5/tC to $45/tC stored, with a base
case estimate of about $10/tC (Bock et al. 2002).
Although there is some uncertainty regarding the environmental effects of CO2 storage in
aquifers, adverse effects can be mitigated by choosing suitable storage locations. Suitable
aquifers will have an impermeable cap, prohibiting the release of injected CO2, but will have
of about $45/tC stored.

Resources for the Future Anderson and Newell
27
high permeability and porosity below, allowing large quantities of injected CO2 to be distributed
uniformly (Herzog, Drake, and Adams 1997). Most such aquifers are saline and separated
geologically from shallower freshwater aquifers and surface water supplies used by humans.
Theoretically, there is the potential for leakage into groundwater drinking supplies, but the risk is
small. Several states have in fact permitted the limited storage of various hazardous and
nonhazardous liquid and gaseous wastes in deep aquifers. Injected CO2 would likely displace
formation water at first but would eventually dissolve into pore fluids. Under ideal
circumstances, chemical reactions between absorbed CO2 and surrounding rock would lead to
the formation of highly stable carbonates, implying even longer storage times (Johnson 2000).
Still, given the uncertainty of these processes, better scientific information is needed
regarding how long CO2 can remain stored in aquifers and the means by which this process
occurs. Toward this end, the U.S. Department of Energy is funding a research team headed by
American Electric Power and Battelle to begin studying potential aquifer sites in the Ohio River
Valley, the heart of the largest concentration of fossil fuel power plants in the United States.
Beneath the Ohio–West Virginia border lies the massive Mount Simon sandstone saline
formation (U.S. Department of Energy 2002).
Statoil’s natural gas mining and CO2 injection operation off the shore of Norway also
provides an excellent opportunity to obtain more information. To date, nearly 3 MtC has been
stored in the Utsira aquifer formation (Arts et al. 2002). Statoil is currently taking core samples
from the formation and will use seismic methods to follow the movement of the injected bubble
of CO2; release of the data from these measurements is expected shortly. Exxon, Mobil, and
Pertamina are planning a similar but much larger project at Indonesia’s Natuna natural gas field
off the shore of Borneo, in the South China Sea. Carbon contained in this natural gas (70% CO2
by volume) will be brought to the surface at a rate of 30 MtC per year, or 100 times the rate at

Resources for the Future Anderson and Newell
28
Sleipner. The plan involves capturing 90% of this CO2 and injecting it into a nearby deep aquifer
(Chargin and Socolow 1997). The project sponsors reasoned that by the time of peak production,
they were likely to face political and economic difficulties if they vented the CO2 to the
atmosphere; such a release would create a massive point source equal to about 0.5% of current
global CO2 emissions from fossil fuels.
3.2.3 Enhanced coal-bed methane Deep coal beds may provide additional opportunities for CO2 storage. As with EOR,
storage of CO2 in coal deposits has the potential to generate economic benefits. Under certain
conditions, CO2 injected into a coal seam can displace fossil fuel methane that is adsorbed on
coal surfaces, allowing the methane to be recovered and put to economic use. This technology is
in its early stages of development. Burlington Resources’ Allison Unit pilot project in the San
Juan basin in New Mexico is the only commercial recovery operation (Stevens et al. 1998). The
Alberta Research Council is leading a group of various national and international organizations
to explore opportunities for enhanced coal-bed methane recovery and is currently conducting
field tests in Fenn Big Valley, Alberta (International Energy Agency Greenhouse Gas R&D
Program 2003). Opportunities for coal-bed methane in the United States could provide an
estimated 5–10 GtC of storage capacity (Stevens et al. 1998; Chargin and Socolow 1997;
Herzog, Drake, and Adams 1997). This amounts to about three to six years of emissions storage
if 100% of current U.S. carbon emissions were captured and stored in these reservoirs. Enhanced
coal-bed methane storage of CO2 could generate net benefits as high as $95/tC stored, or cost as
much as $70/tC stored, with a base case net benefit of about $20/tC (Bock et al. 2002).

Resources for the Future Anderson and Newell
29
3.3 Ocean storage
In terms of capacity, the oceans are by far the largest potential location for storage of
captured CO2. The oceans already contain some 40,000 GtC of carbon, mainly as stable
carbonate ions, and have a virtually unlimited capacity to absorb even more (Chargin and
Socolow 1997). Natural ocean uptake of CO2 is a slow process that works over millennia to
balance atmospheric and oceanic concentrations of CO2. Anthropogenic emissions of carbon
have upset this balance, and there is currently an estimated net flow of 2 GtC per year from the
atmosphere to ocean surface waters, which are eventually transferred to the deeper ocean.
Indeed, roughly 90% of present-day emissions will eventually end up in the ocean, but we know
little about the effect on marine organisms and ecosystems (Chargin and Socolow 1997).
Direct injection of captured CO2 into the ocean would greatly accelerate the process,
bypassing the potentially damaging atmospheric concentrations of CO2 but generating certain
new risks. As with natural absorption, direct injection of CO2 increases the acidity of the
ocean—but at a rate that may not give marine organisms time to adapt. By applying what they
deem an “acceptable” increase in average ocean water acidity, scientists have estimated the
storage capacity of the ocean at roughly 1,000 to 10,000 GtC (Chargin and Socolow 1997). If
100% of global carbon emissions were captured and stored in the ocean, this would imply
roughly 200 to 2,000 years of emissions storage at the current global emissions rate of 6.1 GtC
per year. If CO2 can be injected at depths of 1,000 meters or more, then storage times of
thousands of years are possible (Herzog, Drake, and Adams 1997).
There are several potential methods for ensuring that injected CO2 reaches these depths
(Adams et al. 1994; Herzog, Drake, and Adams 1997; International Energy Agency Greenhouse
Gas R&D Program 2003). The most practical near-term option appears to be injection at depths
of 1,000 to 1,500 meters by means of a pipeline or towed pipeline, which would create a rising

Resources for the Future Anderson and Newell
30
stream of CO2 that would be absorbed into the surrounding waters. Alternatively, a carefully
controlled shallow release of dense seawater and absorbed CO2 would sink to the deeper ocean,
especially if aided by a natural sinking current—such as where salty Mediterranean waters enter
the Atlantic Ocean. Third, experiments show that CO2 exceeds the density of seawater at 3,000
meters and deeper (U.S. Department of Energy 2003). If CO2 were injected at these depths, it
would sink to the ocean floor to form a stable, isolated “lake.” Finally, solid CO2, or “dry ice,” is
1.5 times as dense as surface-level seawater. Some have suggested that blocks of dry ice could be
dropped into the ocean and sink to depths sufficient for long-term storage (U.S. Department of
Energy 2003; Adams et al. 1994; Herzog, Drake, and Adams 1997). Unfortunately, refrigeration
and compression of CO2 are quite costly.
The cost and technical feasibility for ocean storage depend on the transport distance and
the depth of injection. Shorter transport distances favor pipeline injection, and the oil and gas
industry have experience with underwater pipelines up to depths of 850 meters (Adams et al.
1994). Pipeline transportation and storage would incur costs of about $10/tC to $50/tC, with a
base case estimate of $20/tC (Bock et al. 2002). Injection farther from shore favors a towed
pipeline, and there has been some limited research in this area. The success of a shallow release
of a dense CO2 and seawater mixture depends on having a good location with the proper slope,
as well as on designing a device that will sufficiently concentrate CO2 to get negative buoyancy.
Currently, the only proven technology is injection from the bottom of a pipe.
Although the ocean has a huge storage capacity, the environmental effects of ocean
storage are more uncertain than for geologic storage. The primary issue would be the increased
acidity of the ocean, though we should keep in mind that the ocean will eventually absorb about
90% of present-day atmospheric emissions anyway, also leading to increased acidity. The direct
injection of CO2 into the deep ocean would increase average acidity only slightly more, and

Resources for the Future Anderson and Newell
31
would redirect most of this increase to the deep ocean (Chargin and Socolow 1997), where there
appears to exist relatively little marine life (Adams et al. 1994). But direct injection would also
lead to more rapid and localized effects. If injected CO2 were sufficiently dispersed, as could
occur from a deeply towed pipeline, then mortality of marine organisms could be completely
avoided. On the other hand, the high concentrations of CO2 needed for shallow-water injection
could lead to significant increases in acidity over several kilometers (Adams et al. 1994). These
changes could have serious adverse impacts on marine organisms, such as effects on metabolism
and respiration, reduced growth rates for marine algae and bacteria, physiological distress for
mollusks, and disruption of the formation of calcareous skeletons (Adams et al. 1994). For most
methods, however, acidity would increase primarily at depths of 1,000 meters or greater, with
less serious environmental effects.
3.4 Other options
3.4.1 Direct use In addition to storage options, there may be some limited opportunities for direct
economic use of captured CO2. Industry uses approximately 10 MtC per year, 80% of it for
EOR, as described above; most of the remainder is used in the foods-processing and chemicals
industries (Chargin and Socolow 1997). The use of captured CO2 in these industries would
displace CO2 that currently comes from natural formations, resulting in a net reduction in carbon
emissions. Further, CO2 could be used as a feedstock for plastics or inorganic carbonates, and
new discoveries in chemistry and bioprocessing could lead to additional uses. Still, the market
for these uses seems likely to remain small relative to the large quantities of CO2 that would
become available upon the widespread application of CCS. See Herzog et al. (Herzog, Drake,
and Adams 1997) for further information on these other storage options and the U.S. Department

Resources for the Future Anderson and Newell
32
of Energy (U.S. Department of Energy 1999) for an overview of current research and
development efforts.
3.4.2 Conversion to carbonates Once CO2 enters the natural environment (e.g., the ocean or a deep aquifer), a natural
weathering process begins to occur, whereby CO2 reacts with alkaline rocks (e.g., magnesium
and calcium materials) to form highly stable, environmentally benign, and nonhazardous
carbonate compounds. Left to nature, this process can take millennia—but it takes just minutes in
an industrial setting. The concept of conversion is to accelerate this process by reacting CO2 with
carbonate materials prior to injection so that it enters the environment in a more stable form to
begin with—thereby greatly reducing or eliminating concerns about increased ocean acidity,
leakage from geologic reservoirs to human water supplies, leakage to the atmosphere, and safety
(Herzog 2002).
The techniques, however, involve processing large quantities of calcium- or magnesium-
rich rock—several times the weight of CO2 sequestered. Hence, mineral conversion presents
significant potential for adverse environmental impacts, comparable to issues caused by
quarrying and mining operations of similar size (Herzog 2002). Overall, the operation would be
slightly smaller than present-day U.S. coal mining. The incremental increase in energy needed
for pulverization and handling of rock would be about 1% to 15% of the total energy needed for
storage (Herzog, Drake, and Adams 1997). Estimated costs for this process are about $220/tC to
$360/tC stored, ignoring capture and transportation; costs per ton avoided would be higher,
given that the process itself would consume energy and contribute to carbon emissions (Herzog
2002). Others have considered integrating seawater scrubbing of CO2, carbonate conversion, and
ocean injection, with a cumulative capture and storage cost of $65/tC to $470/tC avoided
(Caldeira and Rau 2000).

Resources for the Future Anderson and Newell
33
3.4.3 Biological conversion to fuels Flue gases from industrial processes could be fed directly into ponds containing high
concentrations of microalgae, which can convert solar energy to biomass at about 1% to 3%
efficiency—though bioengineering and other technological improvements promise higher
efficiencies (Herzog, Drake, and Adams 1997). Biomass grown using this method could be
harvested and converted to fuels, displacing some fossil fuel consumption. Unfortunately, this
process would have high water, natural solar energy, and land requirements—a 500 MW power
plant would need 50 to 100 square km of pond area—and these types of inputs are not generally
found in the same locations as power plants. Further, even with enormously high flue gas
concentrations of CO2, only about 54% of a power plant’s annual CO2 production could be
captured (Ormerod, Riemer, and Smith 1995). Thus, this option could displace perhaps only 1%
of total current U.S. emissions, though in more favorable climates it may be possible to capture a
significantly greater portion of power plant emissions for bioconversion to fuels (Herzog, Drake,
and Adams 1997). With typical solar radiation levels and current technology, costs have been
estimated at $350/tC avoided, though they could potentially fall to $150/tC under ideal
conditions (Ormerod, Riemer, and Smith 1995).
3.5 Regulatory issues and leakage
Most CCS research to date has focused on the costs and technical feasibility of CO2
capture and storage. Recently, researchers have begun to consider the risks and regulatory issues
associated with storage in more detail. Wilson and Keith (2002) conclude that even though the
United States has considerable experience with injecting fluids underground and has developed
an extensive regulatory framework to minimize the risks associated with these activities, the
future of CO2 storage regulation is unclear. Given the myriad of existing regulations, it would be
difficult to include geologic storage of CO2 in the existing regulatory structure, and a separate
Resources for the Future Anderson and Newell
34
regulatory approach may be required. Reiner and Herzog (2002) conclude that legitimate
political opposition to the siting of storage facilities, while often strong, could be overcome
through transparency, compensation, monitoring, and enforcement.
Researchers have also begun to treat the issue of CO2 leakage more explicitly. As
Hawkins (2002) points out, if one assumes that 100% of carbon reductions comes through CCS, ,
a long-term, system-wide retention rate of 99.9 percent would still result in a global emissions
source of 1 to 2 GtC per year in 2200 for stabilization targets of 450 to 750 ppmv. Leakage of
this magnitude would account for 20% to 100% of total annual allowable emissions under these
stabilization scenarios. As Herzog et al. (Herzog, Caldeira, and Reilly 2003) observe, however,
even temporary storage associated with a “leaky” reservoir has value in providing both a delay in
the onset of climate change, and additional time to develop other, low-cost mitigation options.
Still, many analysts and environmental advocates argue that caution is required, given the
significant uncertainty in our knowledge regarding the storage time of injected CO2, the potential
for a catastrophic leak, the precise environmental consequences of CCS, and the challenge of
developing alternative mitigation options if CCS fails (Muttitt and Diss 2001).
4. Carbon capture and storage cost modeling for electricity generation
4.1 Plant-level modeling of carbon capture and storage
To assess the competitiveness of CCS versus other carbon mitigation options, we need
some measure of the cost of mitigation using CCS technologies. Unfortunately, thus far the
literature has struggled to provide clear answers in this regard. Given cost and performance data
for two new power plants (i.e., a plant with CCS and its non-CCS counterpart), a number of
studies have calculated average plant-level cost ($/tC) by dividing the difference in the cost of
electricity generation ($/kWh) by the difference in carbon emissions (tC/kWh), as described in

Resources for the Future Anderson and Newell
35
Section 1.3.27 As shown in Table 1, recent estimates put current CCS costs at about $230/tC for
new pulverized-coal plants, $225/tC for new natural gas combined-cycle plants (NGCC), and
$140/tC for new integrated gasification combined-cycle (IGCC) coal plants, relative to those
generation technologies without CCS (David and Herzog 2000). The current estimated cost of
retrofitting an existing pulverized-coal plant with MEA capture of CO2 is about $190/tC
(Simbeck 2001). These costs all assume a natural gas price of $3/MBtu and transport and storage
costs of $37/tC stored.
Using the Integrated Environmental Control Model (ICEM), researchers at Carnegie
Mellon University have conducted more advanced plant-level analyses of CCS in the electricity
generation sector by incorporating uncertainty and variability for about 30 independent model
parameters. These include both plant and CCS performance parameters (e.g., energy penalty and
capture efficiency), as well as various cost parameters (e.g., fuel prices and CCS storage costs)
(Rao and Rubin 2002; Rubin, Rao, and Berkenpas 2001). Ignoring uncertainty, the authors find
that the incremental cost of applying CCS to a new PC plant is about $215/tC (Rao and Rubin
2002).28 Allowing for uncertainty, however, they find that costs would range from $115/tC to
$270/tC (95% confidence interval), with a probability-weighted mean value of $185/tC. These
results suggest that the deterministic estimates discussed above may misstate mean costs while
failing to reflect the true range of potential costs.29
As those and other researchers have been quick to point out, however, plant-level cost
estimates are sensitive to the reference plant chosen, and the appropriate base case is the closest
27 A number of studies also compare energy penalties, though energy penalties only reflect differences in thermal efficiencies and are clearly an inadequate measure of costs. 28 This is comparable to the estimate of about $230/tC above. Rao and Rubin (2002) assume a lower transportation and storage cost of $18/tC stored. If we assume the same, then the numbers in David and Herzog (2000) imply an incremental CCS cost of $205/tC. 29 In earlier work, Rubin et al. (2001) find a lower deterministic cost value of $210/tC, and a higher probability-

Resources for the Future Anderson and Newell
36
competitor at the margin. One way of visualizing this margin is to compare the cost of electricity
for competing options at different carbon prices (Johnson and Keith 2001)—as demonstrated, for
example, by Figure 4. When the price of carbon emissions is zero, plants without CCS produce
electricity at a lower cost than their CCS counterparts. As the price of carbon rises, however,
adding CCS becomes increasingly attractive by virtue of its lower rate of emissions. Eventually,
the price of carbon is such that the cost of electricity generation with and without CCS is
equivalent, as indicated by the circles in Figure 4. Note that these prices are identical to the costs
from above—about $225/tC for NGCC and $190/tC for PC retrofits—since they are based on the
same underlying estimates (Simbeck 2001; David and Herzog 2000). As we have already
discussed, however, these numbers can be both misleading and irrelevant. In this example, we
see that existing coal plants produce the cheapest electricity for all carbon prices up to about
$125/tC. Then new NGCC plants produce the cheapest electricity until carbon prices reach
$225/tC, at which point NGCC with capture produces the cheapest electricity. PC plants
retrofitted with CCS are uneconomic at any carbon price under the assumptions of the figure,
even though the CCS costs for coal retrofits are only $190/tC, whereas the incremental cost of
adding CCS to a new NGCC plant is $225/tC.
However useful that analysis, its embedded assumptions (e.g., fuel prices, fuel
characteristics, and plant efficiencies) are subject to uncertainty and change. Were gas prices
higher, for example, the NGCC lines would both be shifted upward, implying that replacement
of an existing PC with a new NGCC plant would be economical only at a higher carbon price.
Rubin et al. (2001) demonstrate the importance of incorporating such uncertainty. Still, with or
without uncertainty, these plant-level analyses are unable to provide us with a clear
weighted mean value of about $240/tC.

Resources for the Future Anderson and Newell
37
understanding of how the presence of CCS technologies affects the overall shape of the marginal
abatement cost curve for carbon emissions. Such an analysis would consider the following
effects: dispatch among existing technologies; fuel switching and plant retirement; shifts toward
potentially unregulated sources of emissions (e.g., from utility to nonutility electricity
generation); retrofitting existing plants with CCS technologies; future cost reductions, energy
efficiency improvements, and technological innovations; changing fuel prices; and the response
of electricity demand to price changes. Several studies have incorporated such effects into
integrated modeling frameworks. We discuss the results of these studies below.
4.2 Integrated modeling of carbon capture and storage
Recent integrated modeling efforts at MIT (McFarland, Reilly, and Herzog 2003),
Carnegie Mellon University (Johnson and Keith 2001), and Pacific Northwest National
Laboratory (Edmonds et al. 2002) have examined the role of CCS technologies under various
carbon policies. Although these models differ significantly in methodology and geographic
scope, the CCS results are fairly consistent, as shown in Table 5. CCS technologies are typically
found to enter in about 20 to 35 years at carbon prices of $50/tC to $100/tC. Also notable is the
finding that IGCC plants with CCS appear surprisingly competitive in these models, eventually
surpassing NGCC as the dominant fossil fuel technology. These results appear to differ markedly
from the results presented above, which indicate that NGCC plants without CCS are the relevant
reference technology and, consequently, that the carbon price at which new plants with CCS
become competitive is at least $200/tC.
There are two primary sources for these apparent inconsistencies. First, these models all
make assumptions regarding future technology and technological change that could lower the
cost of CCS by about one-third compared with our estimates above (David and Herzog 2000).
Second, and more importantly, these models all predict (either through endogenous modeling or

Resources for the Future Anderson and Newell
38
assumptions of exogenous change) that natural gas prices will rise significantly in this century.
Gas price increases lead to a reduction in the carbon price at which PC plants and IGCC plants
with CCS become competitive (and an increase in the carbon price at which NGCC plants
become competitive) relative to an NGCC plant without capture. This is demonstrated by the
differences between Table 1 (relatively low 2000 gas prices) and Table 2 (high gas prices). If gas
prices rise sufficiently, the relevant reference technology actually shifts from NGCC plants
without capture to IGCC and PC plants without capture. Since IGCC plants and PC plants
without capture both have relatively high carbon emissions compared with NGCC plants, this
shift leads to a discontinuous drop in the carbon price at which CCS technologies for IGCC and
PC plants become competitive.
We briefly describe the models below and give their key results, emphasizing the date
and carbon price at which CCS technologies begin to penetrate, the dynamics of competing CCS
technologies over time, and their overall significance in electricity production. The models have
been refined over the past several years to better reflect economic theory and reality and to
incorporate new information regarding CCS; we have attempted to include only the most recent
results available.
4.2.1 MIT EPPA world economy model The Emissions Prediction and Policy Analysis (EPPA) model at MIT is the only general
equilibrium framework in which CCS technologies have been studied (Biggs 2000; Biggs et al.
2000; McFarland et al. 2001; McFarland, Reilly, and Herzog 2003; McFarland, Herzog, and
Reilly 2002). The model encompasses 12 world regions linked by international trade, nine
sectors of production, and a representative consumer in each region. The model is solved in five-
year intervals between 1995 and 2100. In recent applications (McFarland, Herzog, and Reilly
2002; McFarland, Reilly, and Herzog 2003; McFarland et al. 2001), the model explicitly

Resources for the Future Anderson and Newell
39
incorporates new NGCC and IGCC plants with CCS, as well as new NGCC plants without CCS.
CCS cost parameters come from David and Herzog (2000) and represent moderate technical
improvements on current technology (we discuss current technologies above, in Section 4.1).
The rest of the electricity sector comprises nuclear power and an aggregate “conventional mix”
of all other generation technologies (i.e., conventional coal, oil, natural gas, and hydroelectric
power). The model does not include the possibility of CCS retrofits. Electricity and energy prices
(including natural gas prices) are determined endogenously, and technological improvements in
energy efficiency are exogenous to the analysis.
Recent EPPA modeling efforts examine the role of CCS in multiple world regions (e.g.,
the United States, Japan, Europe, and India) in response to a carbon tax that grows from $50/tC
in 2010 to a maximum of $200/tC in 2040 (McFarland, Reilly, and Herzog 2003). The
imposition of a price on carbon emissions initially leads to increased electricity production from
NGCC—and a corresponding increase in gas prices. NGCC with CCS and IGCC with CCS enter
in 2020 at a carbon price of $100/tC, which implies that gas prices have by this time increased
sufficiently to shift the reference technology from NGCC to IGCC without capture.30 NGCC
plants with CCS account for a maximum of 16% of total electricity production in 2040, but
rising gas prices over time lead to a decline in their competitiveness. Thus, IGCC with CCS
becomes the dominant technology, eventually accounting for 50% of total generation by 2100.
The pattern and timing of these changes are fairly consistent across all world regions, except in
Europe, where significantly higher base-year electricity prices imply significantly higher capture
30 If gas prices were low (say $3/MBtu), NGCC would still be the relevant reference technology—and NGCC with CCS and IGCC with CCS would become competitive only at carbon prices of about $190/tC and $370/tC, respectively (David and Herzog 2000). Note that these figures assume moderate technical improvements on current technology as estimated by David and Herzog (2000).

Resources for the Future Anderson and Newell
40
costs and keep CCS from ever entering, and in Japan, where modeling assumptions make gas
price changes less important than in other regions.31
Overall, the results of the EPPA studies show that presence of CCS technologies leads to
a smaller reduction in the demand for coal, oil, and gas while making electricity generation from
coal more attractive than gas. The benefits of CCS technologies include a reduction in electricity
prices over time and greater economic welfare relative to scenarios without CCS technologies
(McFarland, Reilly, and Herzog 2003). In earlier studies, the model predicts that up to 38 GtC of
carbon would be captured in the United States, which would be unlikely to exceed estimated
geologic storage capacity, as shown in Table 4 (McFarland et al. 2001).32
4.2.2 Carnegie Mellon electricity sector model Researchers at Carnegie Mellon University have examined CCS technologies in the
context of an electricity sector model of the Mid-Atlantic Area Council (MAAC) of the North
American Electricity Reliability Council (Johnson and Keith 2001, 2001). The model assumes a
centrally controlled utility that minimizes capital and operating costs to meet electricity demand
over the 40-year planning horizon from 2000 to 2040. Generic plant categories are specified by
cost and performance parameters designed to model the MAAC region in each of the model’s
nine time periods (i.e., at five-year intervals from 2000 to 2040). CCS technologies are available
for new NGCC and IGCC plants, as well as for retrofits of existing PC plants using data from
David and Herzog (2000) and Simbeck (2001). CO2 capture parameters remain static over time
and reflect the authors’ judgment regarding the probable state of technology in 2015; a fixed cost
31 McFarland et al. (2003) find qualitatively similar results in a 550 ppmv stabilization scenario, where IGCC and NGCC with CCS enter in 2040 at a carbon price of $100/tC. 32 Both McFarland et al. (2001) and McFarland et al. (2002) highlight a number of uncertainties in these estimates, including the rate of technological change, fuel prices, economic growth and baseline emissions, emissions constraints, and the details of the permit trading system.

Resources for the Future Anderson and Newell
41
of $25/tC is assumed for CO2 transport and storage. Given exogenous fuel prices and plant
parameters, the model dispatches installed capacity to meet peak and off-peak electricity demand
in each time period.
Johnson and Keith (2001) first examine the attractiveness of CCS under different carbon
prices. They find that CCS retrofits of existing PC plants could be competitive at $50/tC, that a
mix of new IGCC with CCS and PC CCS retrofits makes sense at $75/tC, and that NGCC with
CCS is not competitive until the price of carbon exceeds $175/tC. These results, which imply
different CCS costs than those discussed above, partially reflect different assumptions (e.g., less
costly 2015 technology) and exogenously rising natural gas prices, but also reflect the dynamic
nature of plant dispatch and utilization with respect to carbon prices. Changes in utilization can
mean that CCS technologies become competitive at a lower carbon price than that suggested by
static models (Johnson and Keith 2001).
With the imposition of a fixed carbon price of $150/tC , electricity production shifts
immediately to conventional NGCC plants. Coal plants retrofitted with CCS and IGCC plants
with CCS also enter immediately. Exogenously rising natural gas prices mean that IGCC plants
with CCS become increasingly attractive over time. These plants account for about 35% of total
electricity production by 2040, and PC retrofits account for about 10% of production.
Figure 5 presents the mitigation cost curve for the Carnegie Mellon model, expressed in
terms of percentage reductions from total baseline carbon emissions. For moderate reductions,
fuel switching from coal to natural gas and reordering of plant dispatch are the least costly
options. Without CCS, reductions above 50% come only at high carbon prices, as renewable
energy sources become economically competitive. CCS technologies play a significant role in
reducing mitigation costs for reductions above 50% and carbon prices above $75/tC. For
example, a $200/tC charge on emissions would yield a 50% reduction in emissions without CCS

Resources for the Future Anderson and Newell
42
but an 80% reduction in emissions with CCS. These results demonstrate the potential role of
CCS in the electricity supply sector.33
4.2.3 Pacific Northwest National Laboratory MiniCAM world economy model The MiniCAM model of Pacific Northwest National Laboratory is a partial equilibrium
model of the world economy that simulates interactions between various drivers of energy use to
project greenhouse emissions in 14 world regions. The electricity generation sector in the model
includes fossil fuel, renewable, and nuclear generation technologies, and these technologies are
specified by fuel costs, operating and maintenance costs, and capital costs (Kim and Edmonds
2000). Edmonds et al. (2002) use this model to examine the role of CCS technologies for coal
and natural gas using assumptions of moderate technological advance and cost reductions.34,35
These and other technological improvements are exogenous to the analysis, but fuel prices and
energy demand are determined endogenously. The model runs in 15-year increments from 1990
through 2095, with a uniform carbon price applied across all sectors.
After the imposition of carbon constraints in 1990 that achieve atmospheric stabilization
of 550 ppmv, Edmonds et al. (2002) find that natural gas with CCS and coal with CCS enter
between 2020 and 2035 at a carbon price of $90/tC. In 2100, natural gas with CCS and coal with
CCS account for 15% and 6% of total global electricity production, respectively.
33 The overall results are sensitive to changes in assumptions regarding gas prices, the initial distribution of capacity, electricity demand and the cost of CCS technologies. For instance, new coal CCS enters earlier in scenarios where gas prices or electricity demand are higher. Further, mitigation costs are uniformly higher if one considers that the electricity supply sector is already becoming less carbon intensive as coal plants are replaced with less costly natural gas. 34 CCS is assumed to impose a 25% energy penalty and an 88% capital cost penalty for coal in 1990; by 2100, these figures fall to 15% and 63%, respectively. CCS imposes a 15% energy penalty and an 89% capital cost penalty for natural gas in 1990; by 2100, these penalties fall to 10% and 72%, respectively. 35 Edmonds et al. (2002) also examine the role of CCS under assumptions of highly advanced CCS technology and significant future cost reductions. In an earlier paper, Kim and Edmonds (2000) use the MiniCAM modeling framework to examine CCS under the assumption that the Department of Energy’s highly optimistic “Vision 21” goals will be realized. Given the admittedly optimistic assumptions of these analyses, the results are better understood as an indication of what might happen if CCS costs fall dramatically, rather than what is likely to happen.

Resources for the Future Anderson and Newell
43
In an earlier paper, Kim and Edmonds (2000) find that highly optimistic assumptions
regarding future cost reductions in CCS, combined with atmospheric stabilization at a stringent
450 ppmv, would result in approximately 850 GtC captured worldwide. This estimate can be
thought of as an upper bound on the ultimate storage capacity needed for about 100 years of CO2
capture and storage, given 21st-century population levels and energy demand. This figure is
toward the bottom of the current estimated range of total worldwide geologic storage capacity of
370 GtC to 3,000 GtC (Gale 2002) and is well below the estimated storage capacity of the ocean.
5. Summary and conclusion
We are greatly contributing to the accumulation of CO2 and other greenhouse gases in the
atmosphere, primarily through the unchecked combustion of fossil fuels. The significant wealth
invested in fossil fuel reserves and infrastructure, combined with relatively costly and limited
alternative energy resources (e.g., solar power, wind, and biomass), suggests that the world’s
economies will continue to consume significant fossil fuel resources in the foreseeable future.
Carbon capture and storage technologies could provide a partial solution to this dilemma by
facilitating less costly reductions in carbon emissions through the continued use of fossil fuels.
Experience with these technologies in the oil, gas, and other niche industries shows that their
application to carbon mitigation is technically feasible.
The existing evidence also suggests that these technologies could be economically
attractive, given sufficiently stringent climate policies. Niche industries such as natural gas and
hydrogen production already produce pure streams of CO2, which could be compressed and
diverted to storage sites at relatively low costs (i.e., under $50/tC). In fact, natural gas production
is the only known case in which CCS technologies have been applied for the sole purpose of
emissions reduction. This and similar opportunities are, however, quite small. Recent estimates

Resources for the Future Anderson and Newell
44
suggest that the application of CCS in the electric power and industrial sectors could
significantly reduce total U.S. emissions at a current cost of about $200/tC to $250/tC avoided.
This is within the range of estimated costs for domestic U.S. compliance with the Kyoto
Protocol, and many expect that these costs could fall substantially with time and technological
development. In addition, a rise in natural gas prices—as would likely occur with the onset of a
price on carbon emissions—could also lower the carbon price at which CCS technologies
become competitive.
Although CCS may be economic under stringent climate policies, a number of technical,
environmental, and political issues arise with regard to transportation and storage of captured
CO2. Despite significant experience with storage of CO2 and other substances in underground
reservoirs, there is substantial uncertainty regarding how much CO2 such reservoirs can hold,
how long injected CO2 would remain trapped, and whether injected CO2 would escape from
storage reservoirs to other formations. The effects of ocean storage are even more uncertain,
raise additional environmental concerns, and are more likely to generate controversy. Storage of
CO2 as carbonates could lessen many of the concerns related to ocean storage but would generate
other environmental concerns and would entail substantially higher storage costs. Although the
safety hazards of storage leakage are likely minimal, the public’s perceptions of risk could pose
potential obstacles to the siting of storage and transportation facilities, and it is unclear whether
and how current pipeline transport and underground storage regulations would apply to CCS.
Finally, leakage from storage facilities would weaken CCS as a source of permanent emissions
reductions, though CCS could still provide valuable temporary storage while less costly
permanent means of mitigation are being developed (e.g., renewable energy sources).
Several modeling studies suggest that CCS could play an important role in mitigating
carbon emissions, conditional on policies that impose a sufficiently high implicit or explicit price

Resources for the Future Anderson and Newell
45
on such emissions. The results indicate that fuel switching from coal to natural gas and energy
efficiency improvements would be the least costly options for moderate reductions in emissions.
For larger reductions and higher carbon prices, however, CCS substantially lowers mitigation
costs. Assuming no barriers to implementation other than cost (i.e., ignoring political and
environmental issues) and given certain assumptions (e.g., regarding fuel prices and energy
demand), these studies suggest that a significant number of new plants with CCS would enter the
power supply sector within the next few decades, though CCS retrofits could enter in just a few
years given a sufficiently high price on emissions. The availability and use of CCS technologies
would decrease reliance on renewable energy sources while encouraging electricity production to
shift from natural gas to coal power. CCS would significantly reduce the present value of the
cost of mitigation over time. Finally, CCS would result in the capture of significant quantities of
CO2 without exceeding most current storage capacity estimates.
In our estimation, both practical experience and detailed technical and engineering cost
studies have demonstrated that CCS is both technologically and economically feasible, given
policies that place a significant constraint on carbon emissions. What has not been demonstrated
is the integrity of potential transportation networks and storage reservoirs and public acceptance
of these systems. CCS, even if it proves a competitive mitigation option, will not succeed if the
public’s and environmental advocates’ concerns regarding the efficacy and safety of CO2
transport and storage are not addressed. It would seem, then, that policymakers should help
facilitate this discussion so that if and when CCS technologies are truly needed to bury CO2, they
themselves are not buried by controversy.
In sum, at the present time prospects appear to be most promising for carbon capture
from electric power generation and some industrial sources, with storage in geologic formations,
such as depleted oil and gas reservoirs and deep aquifers. It would therefore seem prudent for

Resources for the Future Anderson and Newell
46
analysts, advocates, and policymakers to seriously consider carbon capture and storage in the
portfolio of options for addressing global climate change, alongside energy efficiency and fuel
switching to less carbon-intensive energy sources. Further efforts are needed, however, in
demonstrating the economic and technical feasibility of large-scale CCS, exploring options for
lowering the cost of CCS technologies, researching technical aspects and environmental
consequences of various storage options, and considering the constraints and opportunities
provided by legislation, regulation, and public opinion on widespread application of CCS.

47
Appendix: Alternative capture technologies
Physical and chemical absorption (as described in Section 2.1) currently represent the
most promising options for CO2 capture, but significant research has been devoted to exploring
more speculative capture technologies. Most of these technologies have been developed for use
in other applications, and some even enjoy commercial success in several industries. Adsorption
technologies, for instance, are commonly used to separate CO2 from CO2-H2 gas mixtures during
the production of hydrogen. The speculation surrounding these technologies, then, is whether
they would be competitive with alternative capture techniques (i.e., MEA and physical
absorption) when applied outside these niche industries—for example, in the electric power
sector.
A.1 Adsorption
Adsorption (with a d) is the process by which a gas fixes to the surface of a solid. Some
porous solids with large surface areas are able to adsorb large quantities of gas per unit of
volume. This is how gas masks, which use an adsorbent bed of charcoal, remove toxic gases
from breathed air. In adsorption, gases fix to the surface of a solid by either chemical or physical
attraction. For applications involving the separation of CO2 from power plant flue gases,
adsorbent beds of alumina, zeolite molecular sieves (natural or manufactured aluminosilicate),
and activated carbon may be most applicable. As with absorption (with a b), there is a trade-off
between the stronger attraction of a gas to an adsorbent solid and the energy cost of regeneration
(i.e., removal of the adsorbed gas).

Resources for the Future Anderson and Newell
48
After the gas has been adsorbed, the adsorbent bed may be regenerated using a variety of
methods. In pressure swing adsorption (PSA), the external pressure of the scrubber is lowered
until trapped gases are released from the adsorbent bed. PSA is the most common method used
in hydrogen production from steam-reformed natural gas, and CO2 is typically adsorbed on a bed
of activated carbon. Temperature swing adsorption (TSA) involves heating the system until
captured gases are driven from the adsorbent bed. TSA is more time consuming—taking hours,
versus seconds with PSA—and requires larger adsorbent beds. A third method involves running
a stream of fluid over the adsorbent bed to wash away trapped gases. Fourth, a gas stream
containing materials that “bump” trapped gas from its location can be used to regenerate the bed.
Finally, a more experimental process involves using an electrically conductive bed of activated
carbon that selectively adsorbs CO2, then releases it when voltage is applied, allowing for
regeneration without costly temperature and pressure changes (Riemer, Audus, and Smith 1993).
A.2 Cryogenic separation
Cryogenic separation involves the compression and cooling of gas mixtures in multiple
stages to induce phase changes in CO2 and other gases, which allow them to be separated. This
process is most effective when feed gases contain components with very different boiling points
(Herzog, Drake, and Adams 1997). In practice, the process is complicated by contaminants.
Water vapor, for example, can lead to the formation of CO2 and ice formations (called clathrate
hydrates) that plug equipment. In addition to water vapor, there are other gases (e.g., SO2 and
NOX) that can interfere with cryogenic processes. Further, the phase behavior of CO2 itself is
complicated and can lead to the formation of solids that plug equipment and reduce heat transfer
rates. Finally, because of the constant need for pressurization and refrigeration, cryogenic

Resources for the Future Anderson and Newell
49
processes are inherently energy intensive. Nonetheless, cryogenic separation could be effective
for certain large, highly concentrated source streams of CO2.
A.3 Membrane separation
Gas separation membranes can also be used to capture CO2. Here, the success of
separation is determined by the permeability and selectivity of the membrane. The permeability
of a gas through a membrane is defined as its rate of flow through the membrane, given its
pressure differential across the membrane. The selectivity of a membrane is the relative
permeability of gas components—that is, the ability of one gas to permeate faster than another.
In the ideal case, separation of CO2 would involve a concentrated CO2 source stream with few
contaminant gases, combined with a permeable membrane that is highly selective with respect to
CO2.
In practice, however, source streams generally have low pressures, low concentrations of
CO2, and many component gases (e.g., NOX, SOX, and water vapor). Further, membranes with
high selectivity are hard to come by—increasing the permeability of one gas often involves
increasing the permeability of another, thereby decreasing selectivity. In general, the selectivity
of most membranes is not sufficient to achieve desired purity on the first pass. Thus, multistage
processes—involving recycled mixtures—are necessary. The larger number of membranes leads
to increased compression and capital costs. Several gas separation membranes are available, such
as polymer membranes, palladium membranes, facilitated transport membranes, and molecular
sieves—though some have been used only in laboratory settings (Riemer, Audus, and Smith
1993).

Resources for the Future Anderson and Newell
50
Gas absorption membranes serve as a contacting device between gas mixtures (e.g., flue
gases) and liquid absorbents (e.g., MEA solvents), increasing the efficiency of physical or
chemical absorption. Here, the membrane’s function is to keep the gas and liquid flows separate,
minimizing entrapment, flooding, channeling, and foaming. In addition, the equipment in gas
absorption membranes tends to be more compact than for conventional membranes, reducing
capital costs (Miesen and Shuai 1997). One limitation of using membranes in this setting is that
the absorption liquid and gas stream must have similar pressure levels.
A.4 Clathrate hydrates
Although clathrate hydrates can impede cryogenic processes, the formation of clathrate
hydrates can also be used to separate CO2 from gas mixtures. When CO2 and water are combined
at various combinations of high pressure and low temperature, they form CO2 clathrate hydrates
(i.e., ice crystals that contain CO2 gas molecules within the crystalline structure). In the case of
CO2 separation from hydrogen, CO2 would form clathrate hydrates but H2 would not, allowing
the two gases to be separated. Once captured, the CO2 clathrate hydrates could be transported as
slurry in chilled pipelines at much lower pressures than those required for pure CO2 (reducing
compression costs) and injected directly into a suitable storage location (Chargin and Socolow
1997).

Resources for the Future Anderson and Newell
51
Tables
Table 1. Sensitivity of carbon capture costs to reference plant ($3/MBtu gas price)
Carbon capture and storage (CCS) costs ($/tC avoided) Reference plant
Retrofit PC, CCS New PC, CCS New NGCC, CCS New IGCC, CCS Existing PC 189 316 163 260 New PC — 229 47 162 New NGCC — 741 224 542 New IGCC — 208 18 138 Note: PC = pulverized coal. NGCC = natural gas combined cycle. IGCC = integrated gasification combined cycle. Bold figures show incremental CCS costs where the same generation technology is used in the reference and the CCS case. Figures are based on estimates and assumptions in David and Herzog (2000) for new PC, NGCC, and IGCC plants, and Simbeck (2001) for existing PC plants and retrofits, except that estimates have been adjusted to have the same gas price ($3/MBtu) and transport and storage costs ($37/tC stored).
Table 2. Sensitivity of carbon capture costs to reference plant ($6/MBtu gas price)
Carbon capture and storage (CCS) costs ($/tC avoided) Reference plant
Retrofit PC, CCS New PC, CCS New NGCC, CCS New IGCC, CCS Existing PC 241 316 248 260 New PC — 229 152 162 New NGCC — 482 256 298 New IGCC — 208 129 138 Note: Table 2 is identical to Table 1 (i.e., sources and assumptions) except that it assumes a 100% higher gas price of $6/MBtu. At these gas prices, a new NGCC plant without capture produces electricity at a bus bar cost of $0.052/kWh and ceases to be the lowest-cost “reference technology” for new power plants. For new plants, a PC plant without capture produces the cheapest electricity at $0.044/kWh, followed by IGCC without capture at $0.050/tC. Note that the PC retrofit estimates in Simbeck (2001) specify the use of a natural gas boiler for additional steam production, which explains why CCS costs in the retrofit scenario rise with gas prices.

Resources for the Future Anderson and Newell
52
Table 3. U.S. CO2 emissions and cost of capture and storage, 2000
Emissions source
Carbon emissions
(MtC) Percentage of total emissions
Capture and storage cost
($/tC avoided)
Primary energy use 1,556.8 97.4 Electricity generation 641.6 40.2 200-250
Coal 522.4 32.7 Natural gas 93.2 5.8 Petroleum 26.0 1.6
Transportation 513.9 32.2 Industrial 234.1 14.7
Petroleum refining (combustion, 57.8 MtC = 4.1% of total in 1994) ≈ electricity? Petroleum refining (noncombustion, 16.5 MtC = 1.1% of total in 1994) 50-90 Chemicals (combustion, 40.6 MtC = 2.8% of total in 1994) 245 Chemicals (noncombustion, 12.0 MtC = 0.8% of total in 1994) ≈ hydrogen? Iron and steel (32.6 MtC = 2.3% of total in 1994) 195 Cement (6.3 MtC = 0.4% of total in 1994) 180-915 Lime (1.7 MtC = 0.1% of total in 1994) ≈ cement? Hydrogen production (noncombustion, 17.8 MtC = 1.3% of total in 1990) 50-75
Residential 101.9 6.4 Commercial 65.3 4.1
Industrial process emissions 40.9 2.6 Cement manufacture 11.3 0.7 180-915 Lime manufacture 4.3 0.3 ≈ cement? Carbon dioxide in natural gas 5.0 0.3 55 (Sleipner) Ammonia manufacture (i.e., hydrogen production) 4.9 0.3 70 (fertilizer) Waste combustion 7.1 0.4 Natural gas flaring 4.5 0.3 Other industrial 3.8 0.2
Total 1,597.7 100.0 Note: Emissions for 2000 are from the Energy Information Administration (2001). Figures for ammonia manufacture are from the Environmental Protection Agency (2002) and have been subtracted from industrial energy use emissions to avoid double counting. No breakdown of industrial energy use emissions is available for 2000; we include older numbers in parentheses for a rough sense of scale (Energy Information Administration 2000; Chargin and Socolow 1997). Note, however, that there is overlap among nonfuel emissions in petroleum refining (e.g., hydrogen production), chemicals (e.g., hydrogen production in ammonia manufacture), ammonia manufacture (e.g., hydrogen production) under industrial processes (below), and all hydrogen production. Costs include our addition of a transport and storage cost of $37/tC stored, except where authors already included such costs. Sources for capture costs are cited in text; see Section 2.
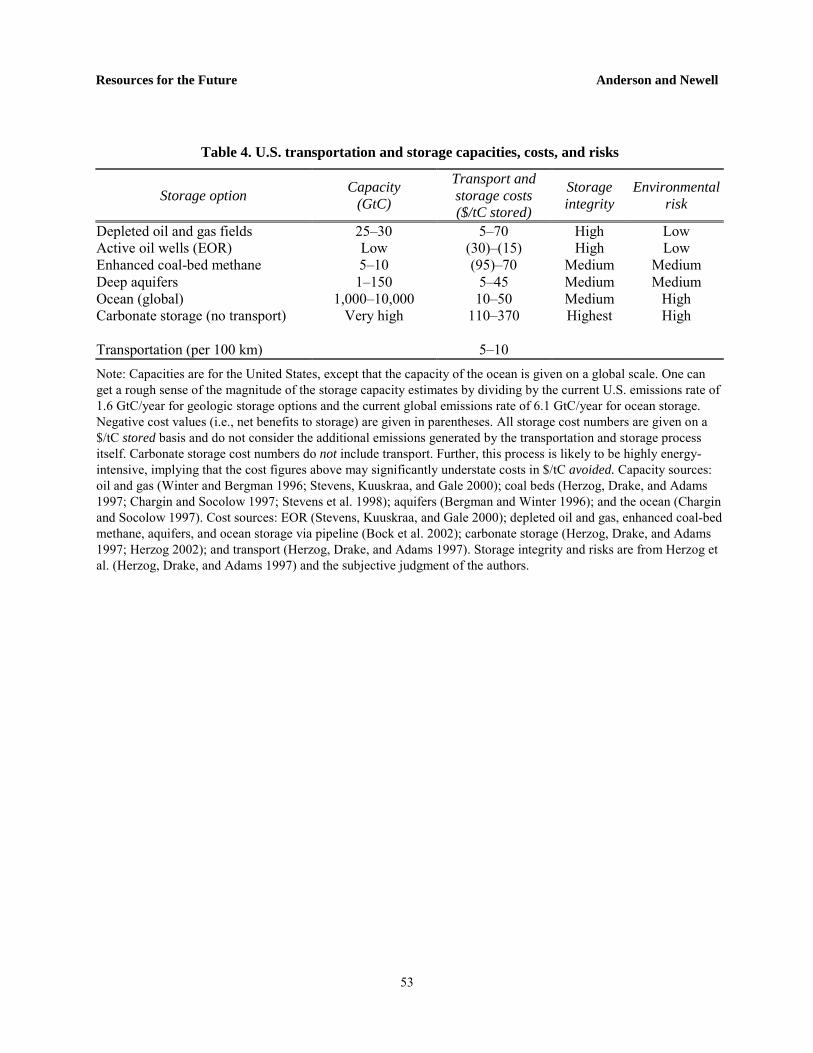
Resources for the Future Anderson and Newell
53
Table 4. U.S. transportation and storage capacities, costs, and risks
Storage option Capacity (GtC)
Transport and storage costs ($/tC stored)
Storage integrity
Environmental risk
Depleted oil and gas fields 25–30 5–70 High Low Active oil wells (EOR) Low (30)–(15) High Low Enhanced coal-bed methane 5–10 (95)–70 Medium Medium Deep aquifers 1–150 5–45 Medium Medium Ocean (global) 1,000–10,000 10–50 Medium High Carbonate storage (no transport) Very high 110–370 Highest High Transportation (per 100 km) 5–10 Note: Capacities are for the United States, except that the capacity of the ocean is given on a global scale. One can get a rough sense of the magnitude of the storage capacity estimates by dividing by the current U.S. emissions rate of 1.6 GtC/year for geologic storage options and the current global emissions rate of 6.1 GtC/year for ocean storage. Negative cost values (i.e., net benefits to storage) are given in parentheses. All storage cost numbers are given on a $/tC stored basis and do not consider the additional emissions generated by the transportation and storage process itself. Carbonate storage cost numbers do not include transport. Further, this process is likely to be highly energy-intensive, implying that the cost figures above may significantly understate costs in $/tC avoided. Capacity sources: oil and gas (Winter and Bergman 1996; Stevens, Kuuskraa, and Gale 2000); coal beds (Herzog, Drake, and Adams 1997; Chargin and Socolow 1997; Stevens et al. 1998); aquifers (Bergman and Winter 1996); and the ocean (Chargin and Socolow 1997). Cost sources: EOR (Stevens, Kuuskraa, and Gale 2000); depleted oil and gas, enhanced coal-bed methane, aquifers, and ocean storage via pipeline (Bock et al. 2002); carbonate storage (Herzog, Drake, and Adams 1997; Herzog 2002); and transport (Herzog, Drake, and Adams 1997). Storage integrity and risks are from Herzog et al. (Herzog, Drake, and Adams 1997) and the subjective judgment of the authors.

Resources for the Future Anderson and Newell
54
Table 5. Key results for CCS costs in electricity sector from integrated modeling studies
Study, scenario, and timeframe CCS technology CCS entry price ($/tC)
CCS entry year
Max share of electricity
production, year
NGCC 100 2020 16%, 2040 EPPA, global price of $50/tC in 2010, rising to $200/tC by 2040, 1995-2095 IGCC 100 2020 50%, 2100
NGCC 175 — — IGCC 75 Immediate 35%, 2040 CMU, $150/tC applied across MAAC
region, 2000-2040 PC retrofit 50 Immediate 10%, 2040 MiniCam, stabilization at 550 ppmv, 1995-2095 NGCC 90 2020-2035 15%, 2095
New PC 90 2020-2035 6%, 2095
Note: MIT Emissions Prediction and Policy Analysis (EPPA) results are from McFarland et al. (2003). Carnegie Mellon University (CMU) results are from Johnson and Keith (2001). MiniCAM results from Pacific Northwest National Laboratory are from Edmonds et al. (2002). The $175/tC entry price for NGCC plants in the CMU results represents the level at which NGCC would penetrate, were the 2000–2040 tax higher than $150/tC.

Resources for the Future Anderson and Newell
55
Figures
32
54
1
6
9
18
0
10
20
30
40
50
60
1998 1999 2000 2001 2002 2003
Year
$ (m
illio
ns)
requested
Figure 1. U.S. Department of Energy budget for carbon capture and storage research
Source: Connaughton (2002).

Resources for the Future Anderson and Newell
56
0
1,000
2,000
3,000
4,000
5,000
Cumulative emissions,1860-1998
Reserves Resources Additional occurrences
GtC
CoalGasOil
Figure 2. Carbon content of global oil, gas, and coal reserves compared with cumulative historic emissions from 1860 to 1998
Note: The bars are not cumulative—that is, resources and additional occurrences are in addition to reserves. Reserves are generally taken to be those quantities that geological and engineering information indicates with reasonable certainty can be recovered in the future from known reservoirs under existing economic and operating conditions. Resources are deposits that do not currently meet the criteria of proven reserves but may be converted to reserves given future advances in geosciences, technological improvements, and market conditions. Additional occurrences distinguish resources whose existence and technical and economic recoverability are most speculative. Data are from IPCC (Moomaw and Moreira 2001).

Resources for the Future Anderson and Newell
57
Figure 3. Deep saline aquifers in the United States
Note: Locations of aquifers are circumscribed with bold line. Map is from the Department of Energy (2002).

Resources for the Future Anderson and Newell
58
0.00
1.00
2.00
3.00
4.00
5.00
6.00
7.00
8.00
9.00
10.00
0 50 100 150 200 250 300
Carbon price ($/tC)
Cos
t of e
lect
ricity
($/k
Wh)
Existing PC NGCC
PC retrofit (capture) NGCC (capture)
Figure 4. Cost of electricity with and without CCS versus hypothetical price of carbon emissions
Note: Cost numbers are from David and Herzog (2000) for NGCC plants and from Simbeck (2001) for existing PC plants and retrofits. These include our addition of a transport and storage cost of $37/tC stored, which we converted to $/tC avoided based on authors’ estimates regarding the ratio of carbon captured to carbon avoided. The figure assumes a natural gas price of $3/MBtu. See Section 2.1.1.

Resources for the Future Anderson and Newell
59
0% 80%60%40%20%
250
200
50
100
150
300
0
Percentage of Emissions Avoided
Carb
on P
rice
($/tC
)
With CCS
Without CCS
With & without CCS
0% 80%60%40%20%
250
200
50
100
150
300
0
Percentage of Emissions Avoided
Carb
on P
rice
($/tC
)
0% 80%60%40%20%
250
200
50
100
150
300
0
Percentage of Emissions Avoided
Carb
on P
rice
($/tC
)
With CCS
Without CCS
With & without CCS
With CCS
Without CCS
With & without CCS
Figure 5. Carbon mitigation cost for electricity generation (Johnson and Keith 2001)
Note: Figure presents the carbon mitigation cost curve expressed in terms of percentage reductions from business-as-usual emissions from electricity generation over the 40-year period from 2000 to 2040. The model is calibrated to reflect the generating capacity of the Mid-Atlantic Area Council (MAAC) of the North American Electricity Reliability Council, as well as the technological composition of its generating capacity. See Section 4.2.2.

Resources for the Future Anderson and Newell
60
References
Adams, D., W. Ormerod, P. Riemer, and A. Smith. 1994. Carbon Dioxide Disposal from Power
Stations. Cheltenham, United Kingdom: International Energy Agency Greenhouse Gas
R&D Program.
Arts, R., R. Elsayed, L. van der Meer, O. Eiken, S. Østmo, A. Chadwick, G. Kirby, and B.
Zinszner. 2002. Estimation of the mass of injected CO2 at Sleipner using time-lapse
seismic data. Paper read at European Association of Geoscientists and Engineers Annual
Conference and Exhibition, May, at Florence, Italy.
Bergman, P.D., and E.M. Winter. 1996. Disposal of Carbon Dioxide in Deep Saline Aquifers in
the US. Paper read at United States/Japan Joint Technical Workshop, September 30 -
October 2, at State College, PA.
Biggs, Sean D. 2000. Sequestering Carbon from Power Plants: The Jury is Still Out. Masters
Thesis, Technology and Policy Program, Massachusetts Institute of Technology,
Cambridge, MA.
Biggs, Sean D., Howard Herzog, John Reilly, and Henry Jacoby. 2000. Economic Modeling of
CO2 Capture and Sequestration. Paper read at Fifth International Conference on
Greenhouse Gas Control Technologies, August, at Cairns, Australia.
Blok, Kornelis, R. H. Williams, R. E. Katofsky, and Chris A. Hendriks. 1997. Hydrogen
Production from Natural Gas, Sequestration of Recovered CO2 in Depleted Gas Wells and
Enhanced Natural Gas Recovery. Energy 22 (2-3):161-168.
Bock, Bert, Richard Rhudy, Howard Herzog, Michael Klett, John Davison, Daniel G. De La
Torre Ugarte, and Dale R. Simbeck. 2002. Economic Evaluation of CO2 Storage and Sink
Enhancement Options. Washington, DC: U.S. Department of Energy & Tennessee Valley
Authority Public Power Institute.
Brown, K., W. Jazrawi, R. Moberg, and M. Wilson. 2001. Role of Enhanced Oil Recovery in
Carbon Sequestration: The Weyburn Monitoring Project, a case study. Paper read at First
National Conference on Carbon Sequestration, May 14-17, at Washington, DC.

Resources for the Future Anderson and Newell
61
Caldeira, Ken, and Greg H. Rau. 2000. Accelerating carbonate dissolution to sequester carbon
dioxide in the ocean: Geochemical implications. Geophysical Research Letters 27 (2):225-
228.
Chargin, Anthony, and Robert Socolow. 1997. Fuels Decarbonization and Carbon Sequestration:
Report of a Workshop. Princeton, NJ: Princeton University, Center for Energy and
Environmental Studies, School of Engineering and Applied Science.
Connaughton, James L. 2002. Statement on United States Global Climate Change Strategy for
the Joint Hearing before the Committee On Environment and Public Works and the
Committee on Foreign Relations. Washington, DC: United States Senate.
David, Jeremy, and Howard J. Herzog. 2000. The Cost of Carbon Capture. Paper read at Fifth
International Conference on Greenhouse Gas Control Technologies, August 13-16, at
Cairns, Australia.
Economist, The. 2002. Fired up with ideas. The Economist, July 6, 78-79.
Edmonds, James A., John Clarke, James J. Dooley, Son H. Kim, and Steven J. Smith. 2002.
Modeling Greenhouse Gas Energy Technology Responses to Climate Change. Paper read
at Sixth International Conference on Greenhouse Gas Control Technologies, September 30
- October 4, at Kyoto, Japan.
Energy Information Administration. 2003. Energy-Related Carbon Emissions in Manufacturing
1994. U.S. Department of Energy, October 2000 [cited January 2003]. Available from
http://www.eia.doe.gov/emeu/efficiency/carbon_emissions/carbon_mfg.html.
———. 2001. Annual Energy Review 2000. Washington, DC: U.S. Department of Energy.
———. 2002. International Energy Annual 2000. Washington, DC: U.S. Department of Energy.
———. 2003. Natural Gas Prices by Sector. U.S. Department of Energy, December 2002 [cited
January 2003]. Available from
http://www.eia.doe.gov/oil_gas/natural_gas/info_glance/prices.html.
———. 2003. Annual Energy Outlook 2003. Washington, DC: Department of Energy.
Farla, C. M., Chris A. Hendriks, and Kornelis Blok. 1995. Carbon Dioxide Recovery from
Industrial Processes. Energy Conversion Management 36 (6-9):827-830.
Resources for the Future Anderson and Newell
62
Gale, John. 2002. Geological storage of CO2: What's known, where are the gaps and what more
needs to be done. Paper read at Sixth International Conference on Greenhouse Gas
Control Technologies, September 30 - October 4, at Kyoto, Japan.
Goldthorpe, Steve, and John Davison. 2000. Capture of CO2 using water scrubbing. Paper read at
Fifth International Conference on Greenhouse Gas Control Technologies, August 13-16,
at Cairns, Australia.
Göttlicher, G., and R. Pruschek. 1997. Comparison of CO2 Removal Systems for Fossil-Fuelled
Power Plant Processes. Energy Conversion Management 38 (Supplement):S173 - S178.
Hanisch, Carola. 1998. The Pros and Cons of Carbon Dioxide Dumping. Environmental Science
& Technology, January, 20A.
Hawkins, David G. 2002. Passing Gas: Policy Implications of Leakage from Geologic Carbon
Storage Sites. Paper read at Sixth International Conference on Greenhouse Gas Control
Technologies, September 30 - October 4, at Kyoto, Japan.
Hendriks, Chris A., E. Worrell L. Price, N. Martin, L. Ozawa Meida, D. de Jager, and P. Riemer.
1998. Emission Reduction of Greenhouse Gases from the Cement Industry. Paper read at
Fourth International Conference on Greenhouse Gas Control Technologies, August 30 -
September 2, at Interlaken, Switzerland.
Herzog, Howard J. 1999. An Introduction to CO2 Separation and Capture Technologies:
Massachusetts Institute of Technology, Energy Laboratory, Working Paper.
———. 2000. Capturing Greenhouse Gases. Scientific American 282 (2):72-79.
———. 2000. The Economics of CO2 Separation and Capture. Technology 7 (S1):13-23.
———. 2001. What Future for Carbon Capture and Sequestration? Environmental Science and
Technology, April 1, 148A-153A.
———. 2002. Carbon Sequestration via Mineral Carbonation: Overview and Assessment.
Cambridge, Massachusetts: Massachusetts Institute of Technology, Laboratory for Energy
and the Environment.
Herzog, Howard J., Ken Caldeira, and John Reilly. 2003. An Issue of Permanence: Assessing the
Effectiveness of Temporary Carbon Storage. Climatic Change (forthcoming).

Resources for the Future Anderson and Newell
63
Herzog, Howard J., Elisabeth Drake, and Eric Adams. 1997. CO2 Capture, Reuse, and Storage
Technologies for Mitigating Global Climate Change. Cambridge, MA: Massachusetts
Institute of Technology Energy Laboratory, A White Paper.
Hourcade, Jean-Charles, and Priyadarshi Shukla. 2001. Global, Regional, and National Costs and
Ancillary Benefits of Mitigation. In Climate Change 2001: Mitigation. Contribution of
Working Group III to the Third Assessment Report of the Intergovernmental Panel on
Climate Change, edited by B. Metz, O. Davidson, R. Swart and J. Pan. Cambridge:
Cambridge University Press.
Intergovernmental Panel on Climate Change. 2002. IPCC Workshop on Carbon Capture and
Storage. Regina, Canada.
International Energy Agency Greenhouse Gas R&D Program. 2003. Capture and Storage of CO2
[Web Page]. International Energy Agency 2003 [cited January 2003]. Available from
http://www.ieagreen.org.uk/removal.htm.
———. 2003. CO2-Enhanced Coal Bed Methane Recovery [Web Page]. International Energy
Agency 2003 [cited January 2003]. Available from http://www.ieagreen.org.uk/ecbm.htm.
Ishitani, H., and T. B. Johansson. 1996. Energy Supply Mitigation Options. In Climate Change
1995: Impacts, Adaptations and Mitigation of Climate Change. Contribution of Working
Group III to the Second Assessment Report of the Intergovernmental Panel on Climate
Change, edited by R. T. Watson, M. C. Zinyowera and R. H. Moss. Cambridge:
Cambridge University Press.
Johnson, James W. 2000. A Solution for Carbon Dioxide Overload. Science & Technology
Review, December.
Johnson, Timothy L., and David W. Keith. 2001. Electricity from Fossil Fuels Without CO2
Emissions: Assessing the Costs of Carbon Dioxide Capture and Sequestration in US
Electricity Markets. Journal of the Air & Waste Management Association (forthcoming)
51:1452-1459.
———. 2001. Fossil Electricity and CO2 Sequestration: How Natural Gas Prices, Initial
Conditions and Retrofits Determine the Cost of Controlling CO2 Emissions. Energy Policy
(forthcoming).

Resources for the Future Anderson and Newell
64
Kim, Son H., and James A. Edmonds. 2000. Potential for Advanced Carbon Capture and
Sequestration Technologies in a Climate Constrained World. Washington, DC: Pacific
Northwest National Laboratory.
McFarland, Jim, Howard J. Herzog, John Reilly, and Henry Jacoby. 2001. Economic Modeling
of Carbon Capture and Sequestration Technologies. Paper read at First National
Conference on Carbon Sequestration, May 14-17, at Washington, DC.
McFarland, Jim, Howard Herzog, and John Reilly. 2002. Economic Modeling of the Global
Adoption of Carbon Capture and Sequestration Technologies. Paper read at Sixth
International Conference on Greenhouse Gas Control Technologies, September 30 -
October 4, at Kyoto, Japan.
McFarland, Jim, John Reilly, and Howard Herzog. 2003. Representing energy technologies in
top-down economic models using bottom-up information. Energy Economics
(forthcoming).
Miesen, Axel, and Xiaoshan Shuai. 1997. Research and Development Issues in CO2 Capture.
Energy Conversion Management 38 (S):S37-S42.
Moberg, R., D.B. Stewart, and D. Stachniak. 2002. The IEA Weyburn CO2 Monitoring and
Storage Project. Paper read at Sixth International Conference on Greenhouse Gas Control
Technologies, September 30 - October 4, at Kyoto, Japan.
Moomaw, William R., and Jose Roberto Moreira. 2001. Technological and Economic Potential
of Greenhouse Gas Emissions Reduction. In Climate Change 2001: Mitigation.
Contribution of Working Group III to the Third Assessment Report of the
Intergovernmental Panel on Climate Change, edited by B. Metz, O. Davidson, R. Swart
and J. Pan. Cambridge: Cambridge University Press.
Muttitt, Greg, and Ben Diss. 2001. Carbon injection: an addict's response to climate change. The
Ecologist, October 22.
Ormerod, W., P. Riemer, and A. Smith. 1995. Carbon Dioxide Utilisation. Cheltenham, United
Kingdom: International Energy Agency Greenhouse Gas R&D Program.
Parson, E. A., and David W. Keith. 1998. Fossil Fuels Without CO2 Emissions. Science 282
(5391):1053-1054.

Resources for the Future Anderson and Newell
65
Rao, Anand B., and Edward S. Rubin. 2002. A Technical, Economic, and Environmental
Assessment of Amine-Based CO2 Capture Technology for Power Plant Greenhouse Gas
Control. Environmental Science and Technology 36:4467-4475.
Reiner, D.M., and Howard J. Herzog. 2002. A Search for Regulatory Analogs to Carbon
Sequestration. Paper read at Sixth International Conference on Greenhouse Gas Control
Technologies, September 30 - October 4, at Kyoto, Japan.
Riemer, P., Harry Audus, and A. Smith. 1993. Carbon Dioxide Capture from Power Stations.
Cheltenham, United Kingdom: International Energy Agency Greenhouse Gas R&D
Program.
Rubin, Edward S., Anand B. Rao, and Michael B. Berkenpas. 2001. A Multi-Pollutant
Framework for Evaluating CO2 Control Options for Fossil Fuel Power Plants. Paper read
at First National Conference on Carbon Sequestration, May 14-17, at Washington, DC.
Simbeck, Dale R. 2001. CO2 Mitigation Economics for Existing Coal-Fired Power Plants. Paper
read at Pittsburgh Coal Conference, December 4, at Newcastle, NSW, Australia.
———. 2002. CO2 Capture and Storage: The Essential Bridge to the Hydrogen Economy. Paper
read at Sixth International Conference on Greenhouse Gas Control Technologies,
September 30 - October 4, at Kyoto, Japan.
Stevens, Scott H., and John Gale. 2000. Geologic CO2 sequestration may benefit upstream
industry. Oil and Gas Journal 98 (20).
Stevens, Scott H., Vello A. Kuuskraa, and John Gale. 2000. Sequestration of CO2 in depleted oil
and gas fields; global capacity, costs and barriers. Paper read at Fifth International
Conference on Greenhouse Gas Control Technologies, August 13-16, at Cairns, Australia.
Stevens, Scott H., Vello A. Kuuskraa, Denis Spector, and Pierce Riemer. 1998. CO2
Sequestration in Deep Coal Seams: Pilot Results and Worldwide Potential. Paper read at
Fourth International Conference on Greenhouse Gas Control Technologies, August 30 -
September 2, at Interlaken, Switzerland.
Thambimuthu, Kelly V., John Davison, and Murlidhar Gupta. 2002. CO2 Capture and Storage. In
IPCC Workshop on Carbon Capture and Storage, edited by Intergovernmental Panel on
Climate Change. Regina, Canada.

Resources for the Future Anderson and Newell
66
Torp, Tore A. 2000. Saline Aquifer CO2 Storage: Final Technical Report. Cheltenham, United
Kingdom: Statoil and the International Energy Agency.
Turkenburg, Wim C., and Chris A. Hendriks. 1999. Fossil fuels in a sustainable energy supply:
the signficance of CO2 removal. Utrecht, The Netherlands: Ministry of Economic Affairs,
The Hague.
U.S. Department of Energy. 1999. Carbon Sequestration Research and Development.
Washington, DC: Office of Science and Office of Fossil Energy.
———. 2003. A Climate Change Solution Beneath Our Feet? [Web Page]. Office of Fossil
Energy, November 21 2002 [cited January 2003]. Available from
http://www.fe.doe.gov/techline/tl_sequestration_aep.shtml.
———. 2003. Carbon Sequestration [Web Page]. National Energy Technology Laboratory
2003 [cited January 2003]. Available from
http://www.netl.doe.gov/coalpower/sequestration/.
———. 2003. Gasification Technologies [Web Page]. Office of Fossil Energy 2003 [cited
January 2003]. Available from
http://www.fe.doe.gov/coal_power/gasification/index.shtml.
U.S. Environmental Protection Agency. 1998. Inventory of U.S. Greenhouse Gas Emissions and
Sinks: 1990-1996. Washington, DC: Office of Policy, Planning, and Evaluation.
———. 2002. Inventory of U.S. Greenhouse Gas Emissions and Sinks: 1990-2000. Washington,
DC: Office of Atmospheric Programs.
van der Meer, L. G. H. 2002. CO2 Storage in the Subsurface. Paper read at Sixth International
Conference on Greenhouse Gas Control Technologies, September 30 - October 4, at
Kyoto, Japan.
Watson, Robert T. et al. 2001. Climate Change 2001: Synthesis Report. An Assessment of the
Intergovernmental Panel on Climate Change. Cambridge: Cambridge University Press.
Wilson, Elizabeth J., and David W. Keith. 2002. Geologic Carbon Storage: Understanding the
Rules of the Underground. Paper read at Sixth International Conference on Greenhouse
Gas Control Technologies, September 30 - October 4, at Kyoto, Japan.

Resources for the Future Anderson and Newell
67
Winter, E.M., and P.D. Bergman. 1996. Potential for Terrestrial Disposal of Carbon Dioxide in
the US. Paper read at US/Japan Joint Technical Workshop, September 30 - October 2, at
State College, PA.