Embed Size (px)
Citation preview
Peter Viebahn, Daniel Vallentin, Samuel Höller
Prospects of Carbon Capture and Storage (CCS) in China’s Power Sector
An Integrated Assessment
Originally published in: Applied Energy, 157 (2015), 157, 229-244 DOI: 10.1016/j.apenergy.2015.07.023

Peter Viebahn a,* Daniel Vallentin a Samuel Höller a
Prospects of Carbon Capture and Storage (CCS) in China’s Power An Integrated Assessment
a Wuppertal Institute for Climate, Environment and
Energy, Germany * Corresponding author:
Peter Viebahn Wuppertal Institute for Climate, Environment and Energy Döppersberg 19 42103 Wuppertal Germany
E-mail: [email protected] Phone: +49 202 2492-306 Fax: +49 202 2492-198
This is the author’s version of a work that was accepted for publication. Changes resulting from the publishing process, such as editing, corrections and structural formatting, may not be reflected in this document. Changes may have been made to this work since it was submitted for publication. A definitive version was sub-sequently published in the Journal cited above.
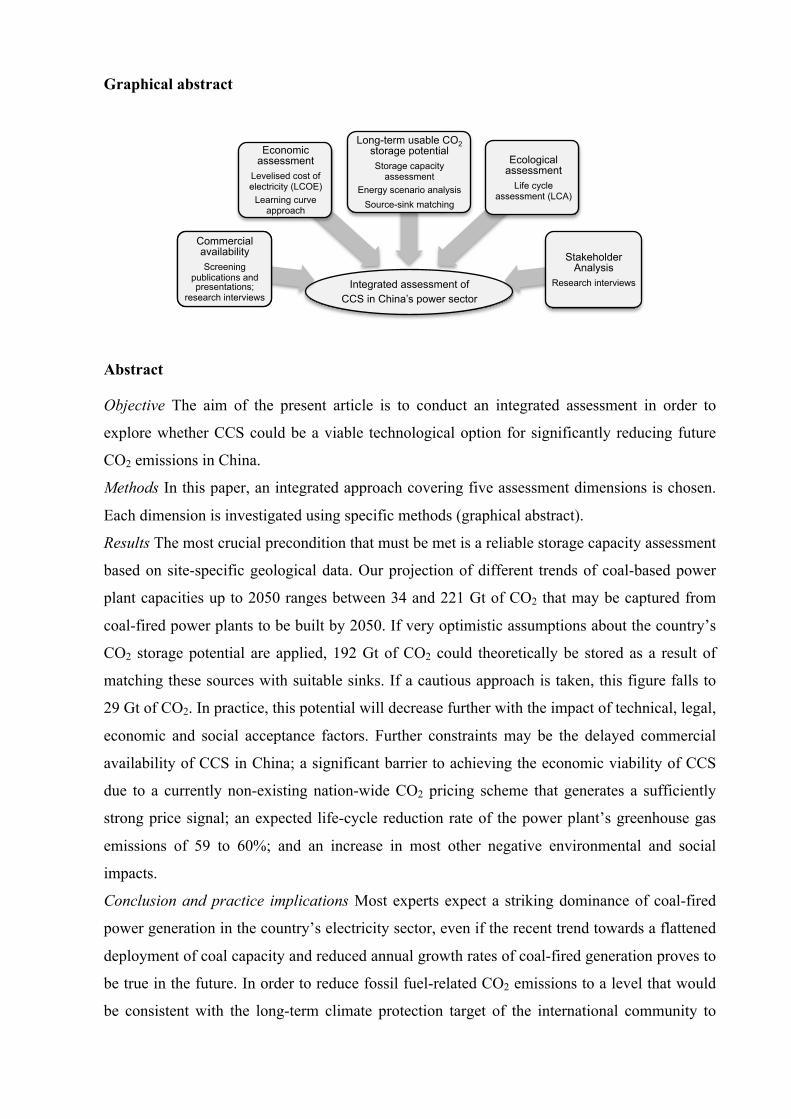
Graphical abstract
Abstract
Objective The aim of the present article is to conduct an integrated assessment in order to
explore whether CCS could be a viable technological option for significantly reducing future
CO2 emissions in China.
Methods In this paper, an integrated approach covering five assessment dimensions is chosen.
Each dimension is investigated using specific methods (graphical abstract).
Results The most crucial precondition that must be met is a reliable storage capacity assessment
based on site-specific geological data. Our projection of different trends of coal-based power
plant capacities up to 2050 ranges between 34 and 221 Gt of CO2 that may be captured from
coal-fired power plants to be built by 2050. If very optimistic assumptions about the country’s
CO2 storage potential are applied, 192 Gt of CO2 could theoretically be stored as a result of
matching these sources with suitable sinks. If a cautious approach is taken, this figure falls to
29 Gt of CO2. In practice, this potential will decrease further with the impact of technical, legal,
economic and social acceptance factors. Further constraints may be the delayed commercial
availability of CCS in China; a significant barrier to achieving the economic viability of CCS
due to a currently non-existing nation-wide CO2 pricing scheme that generates a sufficiently
strong price signal; an expected life-cycle reduction rate of the power plant’s greenhouse gas
emissions of 59 to 60%; and an increase in most other negative environmental and social
impacts.
Conclusion and practice implications Most experts expect a striking dominance of coal-fired
power generation in the country’s electricity sector, even if the recent trend towards a flattened
deployment of coal capacity and reduced annual growth rates of coal-fired generation proves to
be true in the future. In order to reduce fossil fuel-related CO2 emissions to a level that would
be consistent with the long-term climate protection target of the international community to
Integrated assessment of CCS in China’s power sector
Commercial availability Screening
publications and presentations;
research interviews
Economic assessment
Levelised cost of electricity (LCOE)
Learning curve approach
Long-term usable CO2 storage potential Storage capacity
assessment Energy scenario analysis
Source-sink matching
Ecological assessment
Life cycle assessment (LCA)
Stakeholder Analysis
Research interviews
2
which China is increasingly committing itself, this option may require the introduction of CCS.
However, a precondition for opting for CCS would be finding robust solutions to the
constraints highlighted in this article. Furthermore, a comparison with other low-carbon
technology options may be useful in drawing completely valid conclusions on the economic,
ecological and social viability of CCS in a low-carbon policy environment. The assessment
dimensions should be integrated into macro-economic optimisation models by combining
qualitative with quantitative modelling, and the flexible operation of CCS power plants should
be analysed in view of a possible role of CCS for balancing fluctuating renewable energies.
Keywords
CCS; China; integrated assessment; power sector, CO2 storage potential
Table Nomenclature
Acronym Abbreviation
E1 high coal development pathway CCS carbon (dioxide) capture and storage
E2 middle coal development pathway CCUS carbon (dioxide) capture, use and storage
E3 low coal development pathway EGR enhanced gas recovery
S1 high storage scenario EOR enhanced oil recovery
S2 intermediate storage scenario FGDS flue gas desulphurisation units
S3 low storage scenario FLH full load hours
GHG greenhouse gas
IGCC integrated gasification combined cycle
LCA life cycle assessment
LCOE levelised cost of electricity
NGO non-governmental organisation
O&M operation and maintenance
PC pulverised coal
PLF plant load factor
R&D(&D) research and development (and demonstration)
SC supercritical USC ultra-supercritical
1 Introduction
Carbon capture and storage (CCS) for reducing carbon dioxide emissions from fossil fuel-fired
power plants and industrial sources is the subject of intensive global debate. CCS is considered
a technology option that could contribute significantly to achieving the objective of decreasing
greenhouse gas (GHG) emissions by 50 to 85% by 2050 [1]. This radical reduction is
3
imperative in order to prevent the rise in global average temperature from exceeding a
threshold of 2°C above preindustrial times by 2100 [2]. For the time being, however, unabated
use of coal is on the rise [3]. This development is mainly driven by coal-consuming emerging
economies that are experiencing a rapidly growing demand for energy. The aim of the present
article is to explore whether CCS in the power sector could be a viable low-carbon option for
China, which is one of these key countries. Although coal consumption in China seems to have
flattened since 2014 [4] following a steady increase for years [3], CCS may be necessary in
China to enable the country to meet the long-term climate protection target of the international
community to which China is increasingly committing itself [5]. A corresponding analysis for
India has already been provided [6]; the case of South Africa will be presented in a separate
publication.
In China, CCS has been discussed intensively, mainly by focusing on the concept to combine
capture with the use of CO2 (CCUS) for enhanced oil (EOR) or gas recovery (EGR). However,
if a strong GHG reduction is required and CCS is deemed to be a key reduction strategy, CO2
will also have to be sequestered in other formations. Thus, an important aspect for assessing
CCS is knowing whether China has adequate storage capacity [7]. Our main research question
is therefore to estimate how much CO2 can potentially be stored securely in the long term in
geological formations and to determine the relation between this storage potential and the
potential required. Further research questions involve estimating when CCS technology could
become commercially available, evaluating the costs involved and the ecological implications
and stakeholder positions towards CCS. The present article does not aim to elaborate the role
CCS could play in a future sustainable energy system in China compared to other low-carbon
technology options such as renewable energies. Although this question is highly challenging,
this article focuses on a sound analysis of CCS by providing the basis for a future comparative
assessment.
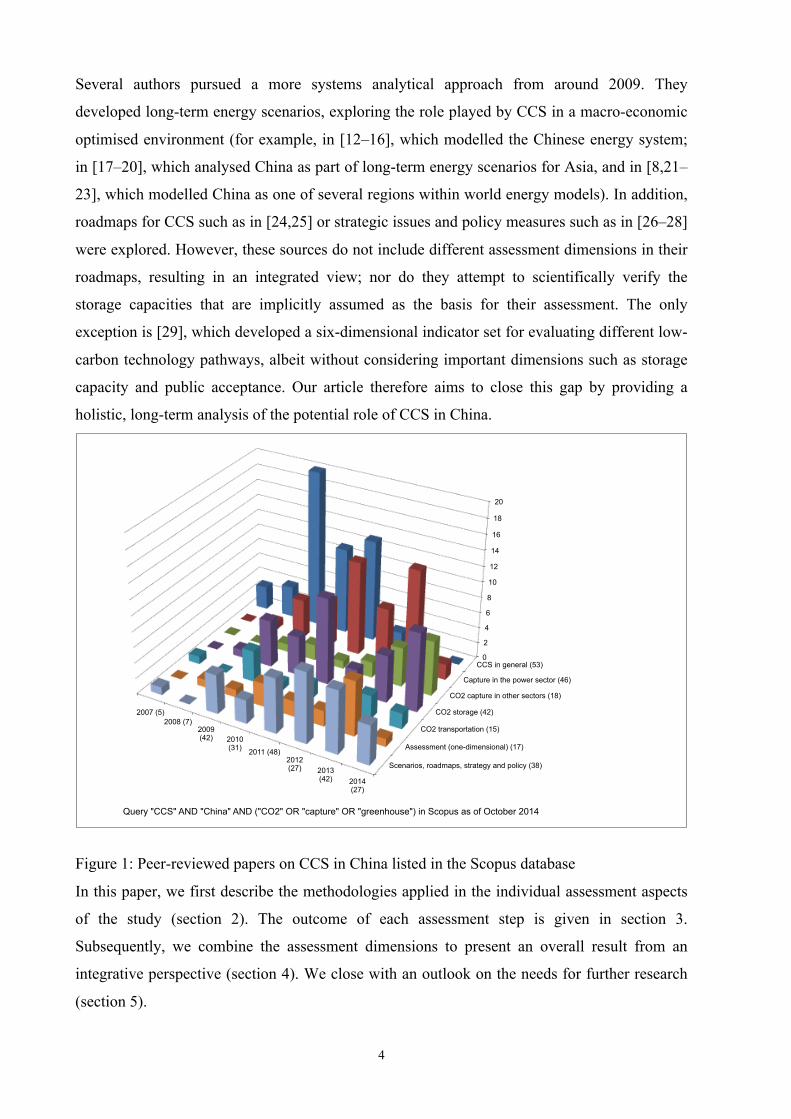
To our knowledge, no assessment with a comparable comprehensive scope has been published
before. As an analysis of peer-reviewed literature illustrates, CCS in China started gaining
interest in 2007/2008, when publications first mentioned CCS as a possible mitigation measure
in coal-consuming countries (Figure 1). While articles with a more general view on CCS
peaked in 2009, the number of publications that explore the challenges of both CO2 capture in
the power sector and CO2 storage grew from 2009. There were therefore very few one-
dimensional assessments, most of which focused on public acceptance and life cycle analysis
(LCA). An increasing number of authors refer to the uncertainties and challenges faced by
CCS, such as increased energy and water consumption, inadequate storage capacities or
potential CO2 leakages, which could hamper the large-scale deployment of CCS [8–11].
4
Several authors pursued a more systems analytical approach from around 2009. They
developed long-term energy scenarios, exploring the role played by CCS in a macro-economic
optimised environment (for example, in [12–16], which modelled the Chinese energy system;
in [17–20], which analysed China as part of long-term energy scenarios for Asia, and in [8,21–
23], which modelled China as one of several regions within world energy models). In addition,
roadmaps for CCS such as in [24,25] or strategic issues and policy measures such as in [26–28]
were explored. However, these sources do not include different assessment dimensions in their
roadmaps, resulting in an integrated view; nor do they attempt to scientifically verify the
storage capacities that are implicitly assumed as the basis for their assessment. The only
exception is [29], which developed a six-dimensional indicator set for evaluating different low-
carbon technology pathways, albeit without considering important dimensions such as storage
capacity and public acceptance. Our article therefore aims to close this gap by providing a
holistic, long-term analysis of the potential role of CCS in China.
Figure 1: Peer-reviewed papers on CCS in China listed in the Scopus database
In this paper, we first describe the methodologies applied in the individual assessment aspects
of the study (section 2). The outcome of each assessment step is given in section 3.
Subsequently, we combine the assessment dimensions to present an overall result from an
integrative perspective (section 4). We close with an outlook on the needs for further research
(section 5).
CCS in general (53)
Capture in the power sector (46)
CO2 capture in other sectors (18)
CO2 storage (42)
CO2 transportation (15)
Assessment (one-dimensional) (17)
Scenarios, roadmaps, strategy and policy (38)
0
2
4
6
8
10
12
14
16
18
20
2014 (27)
2013 (42)
2012 (27)
2011 (48)
2010 (31)
2009 (42)
2008 (7) 2007 (5)
Query "CCS" AND "China" AND ("CO2" OR "capture" OR "greenhouse") in Scopus as of October 2014
5
2 Methodologies
In this paper, we chose an integrated approach covering five assessment dimensions. Each
dimension is investigated using specific methods (see graphical abstract).
(1) The assessment of the commercial availability of CCS technology in China is based on
screening publications and presentations by international CCS experts. The term commercial
availability refers to the time when the complete CCS chain could be in commercial operation.
This incorporates large-scale CCS-based power plants, transportation and storage, which
cannot be considered independently [30].
(2) The derivation of China’s long-term usable CO2 storage potential consists of three different
steps: A) The aim of the storage capacity assessment is to systematically analyse and compare
existing capacity estimates for China using the methodology linked to the “techno-economic
resource-reserve pyramid for CO2 storage capacity” [31]. The resulting storage scenarios (S1–
S3) represent a range between a high and a low estimate of China’s storage potential. For the
detailed methodology and the results of this step, the authors refer to [32].
B) An energy scenario analysis is used to estimate the amount of CO2 emissions that could
potentially be captured from power plants by 2050. Based on existing long-term energy
scenarios for China, three long-term coal development pathways for power plants (E1–E3) are
developed. They indicate a development between a “high carbon” and a “low carbon” strategy.
In the next step, assumptions are drawn on how many of these power plants could be built or
retrofitted with CO2 capture. Finally, the quantity of CO2 that could be separated is calculated
for the pathways assuming different parameters such as the CO2 capture rate and the efficiency
penalty. CO2 emissions are cumulated over the life time of all power plants newly built up to
2050. It should be noted that coal development pathways differ from energy scenarios: whilst
energy scenarios provide a consistent framework for the analysis of long-term energy
strategies, the pathways applied here are taken from different existing scenario studies. They
are only used to illustrate the different CCS development pathways to obtain an understanding
of the level of separated CO2 emissions that could be available for storage.
C) In order to achieve a source-sink match, the storage scenarios are combined with the coal
development pathways to obtain a total matched capacity for each combination of S1–S3 and
E1–E3. The result is the matched capacity, which is the next step up in the storage pyramid
concept [6]. Due to missing data and the consequential heuristic approach, matching is
performed manually without using a geographic information system. The emission data from
each pathway is divided amongst the administrative divisions where they occur. An
investigation is made into whether the emissions located the closest to the storage formations of
S1–S3 could be stored there. Since one basin comprises the area of several divisions, the match
6
is at the division-to-basin level. The selected aquifer basins extend several hundred kilometres
and are usually larger than one division, which covers 100,000 km2 on average. The exact
position of sub-basins is not known. The maximum distance between sources and sinks is
therefore arbitrarily defined as roughly 500 km, a transport distance that has been estimated to
be economically viable [33]. Capacities within the storage scenarios are listed for each basin,
and divisions are attributed to these basins. This is carried out in two steps: divisions in which
at least parts of basins are situated are selected first; a qualitative geographical overlap is then
conducted between storage basins and emission clusters in each selected division based on
figures by [34]. Finally, a total matched capacity is derived for each combination of S1–S3 and
E1–E3.
(3) The aim of the economic assessment is to conduct a comparative analysis of the long-term
development of the levelised cost of electricity (LCOE) of coal-fired power plants with and
without CCS in China. The analysis is built upon three main methodological principles: firstly,
cost calculations are based on the capacity development of power plants up to 2050 given in
E1–E3. Secondly, data from existing studies and the knowledge of numerous experts
interviewed during the course of this study are used to define and quantify important cost
parameters, such as capital costs and operation and maintenance (O&M) costs. Whenever
possible, country-specific conditions and data are taken into account. This is particularly true
for plant capital costs. Thirdly, the assessment uses learning rates to project a long-term cost
development. All cost data and parameters are fed into the general equation to calculate the
development of LCOE.
(equation 1)
where
and
LCOE = levelised costs of electricity generation. [LCOE] = USD/kWhel
CCap = specific capital expenditure. [CCap] = USD/kWel
CO&M = specific operating and maintenance costs. [CO&M] = USD/kWel
af = annuity factor. [af] = %/a
I = real interest rate. [interest] = %
n = depreciation period. [n] = a
CTS = specific cost of CO2 transportation and storage. [CO&M] = USD/kWhel
Cfuel = specific fuel costs (including CO2 penalty). [CFuel] = USD/kWhel
capacity = full load hours. [operating lifetime] = h/a
LCOE =CCap +CO&M( ) ⋅af
capacity+CTS +Cfuel
€
af =I ⋅ (1+ I)n
(1+ I)n −1
7
(4) In order to assess the possible environmental impacts of CCS, a prospective LCA of
potential future CCS-based coal-fired power plants in China is performed and the
environmental impacts are compared with power plants without CCS. The LCA is performed
according to the international standard ISO 14 040/44. The life cycle impact assessment
(LCIA) is based on the method CML 2001 [35]. The life cycle approach includes the upstream
and downstream parts, such as the provision of additional fuels or the transportation and
storage of CO2.
(5) Stakeholders are key players in implementing and deploying new and innovative
technologies. Hence, an important assessment instrument is to analyse their positions regarding
the prospects of CCS. The overall aim of the analysis is to reflect the state of the CCS debate in
China and to draw up a map of key stakeholders and their respective positions. The analysis is
based mainly on 22 research interviews conducted with CCS and energy experts from the
national government, science, industry and societal organisations in 2011. The interviews were
guided by a questionnaire containing open questions, giving interviewees the opportunity to
elaborate on their positions freely and to identify parameters affecting the prospects of CCS in
China (see supplementary information).
3 Analyses and outcomes of the individual assessment aspects
3.1 Commercial availability of CCS technology
It is unlikely that CCS will be commercially available in China before 2030. At the
international level, experts from scientific institutions and non-governmental organisations
(NGOs) expect a later large-scale availability than previously assumed due to the low carbon
pricing level, delayed demonstration projects and a lack of public acceptance in potential
storage regions [36–41]. Although CO2 capture is currently undergoing substantial
development and several CCS demonstration projects have been launched in China [9], a lack
of business cases and the uncertainties in climate change policy [10] are hampering the launch
of commercial technology. We therefore choose the year 2030 as the start of operation of large-
scale CCS projects in the “base case”. In order to consider further possible delays, 2035 and
2040 are regarded as sensitivity cases AV1 and AV2.
3.2 Long-term usable CO2 storage potential for China’s power sector
3.2.1 Analysis of storage potential for China
An analysis of all known country-wide studies that analysed the CO2 storage potential in China
[34,42–45] revealed a huge range of CO2 storage capacity from 32 to 3,090 Gt, covering oil
and gas fields, saline aquifers and coal seams [32]. This capacity has to be classified as
8
theoretical on the techno-economic resource-reserve pyramid [6], since no efficiency factors
were applied. In order to allow for the prevailing uncertainties, we developed three storage
scenarios [32] (Table 1). These are based on existing country-wide results cross-checked with
more basin- and site-specific study results to detect the most appropriate theoretical storage
capacity. Furthermore, in the case of saline aquifers the wide range of storage efficiencies used
in the basin- and site-specific studies was grouped into three categories and the mean efficiency
of each group (2%, 13% and 50%) was determined for application in our storage scenarios.
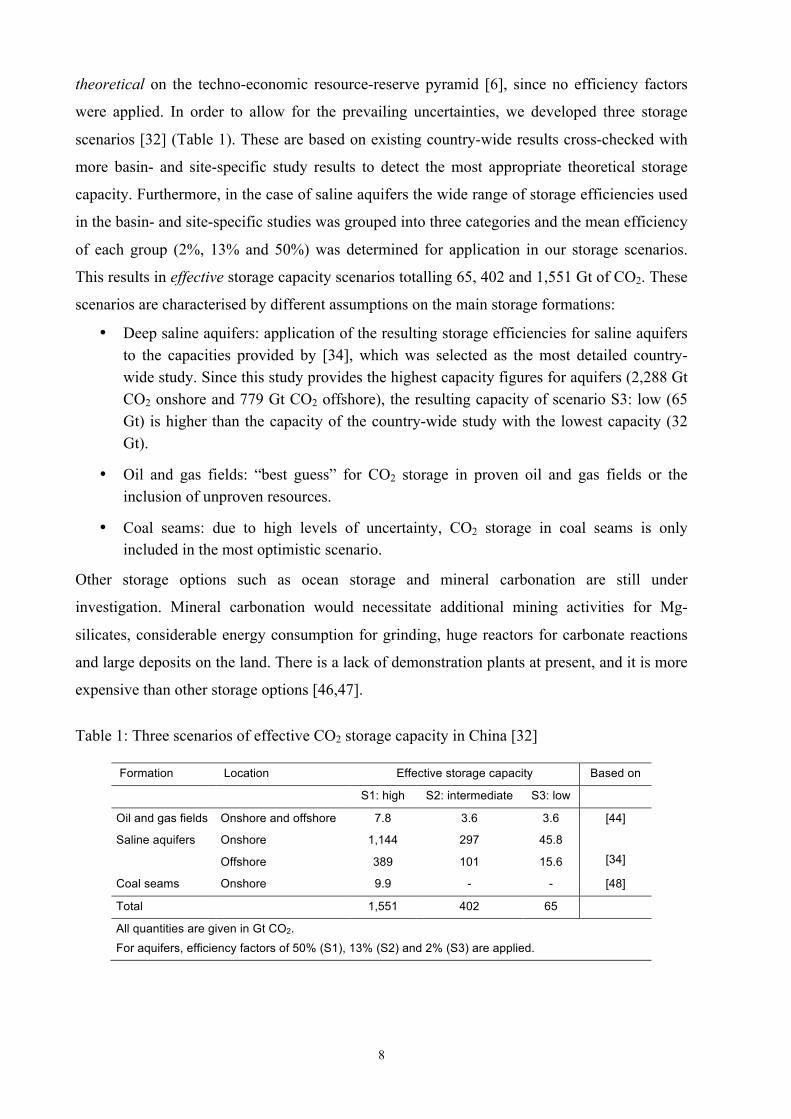
This results in effective storage capacity scenarios totalling 65, 402 and 1,551 Gt of CO2. These
scenarios are characterised by different assumptions on the main storage formations:
• Deep saline aquifers: application of the resulting storage efficiencies for saline aquifers to the capacities provided by [34], which was selected as the most detailed country-wide study. Since this study provides the highest capacity figures for aquifers (2,288 Gt CO2 onshore and 779 Gt CO2 offshore), the resulting capacity of scenario S3: low (65 Gt) is higher than the capacity of the country-wide study with the lowest capacity (32 Gt).
• Oil and gas fields: “best guess” for CO2 storage in proven oil and gas fields or the inclusion of unproven resources.
• Coal seams: due to high levels of uncertainty, CO2 storage in coal seams is only included in the most optimistic scenario.
Other storage options such as ocean storage and mineral carbonation are still under
investigation. Mineral carbonation would necessitate additional mining activities for Mg-
silicates, considerable energy consumption for grinding, huge reactors for carbonate reactions
and large deposits on the land. There is a lack of demonstration plants at present, and it is more
expensive than other storage options [46,47].
Table 1: Three scenarios of effective CO2 storage capacity in China [32]
Formation Location Effective storage capacity Based on
S1: high S2: intermediate S3: low
Oil and gas fields Onshore and offshore 7.8 3.6 3.6 [44]
Saline aquifers Onshore 1,144 297 45.8 [34] Offshore 389 101 15.6
Coal seams Onshore 9.9 - - [48]
Total 1,551 402 65
All quantities are given in Gt CO2. For aquifers, efficiency factors of 50% (S1), 13% (S2) and 2% (S3) are applied.
9
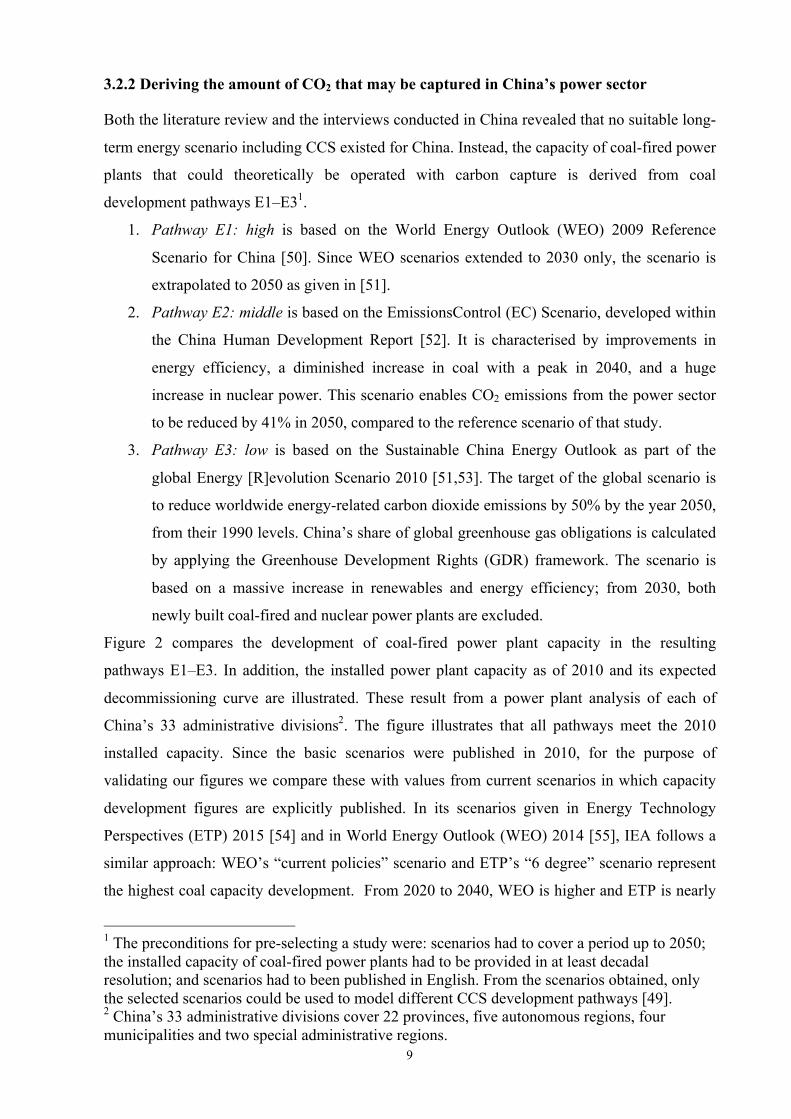
3.2.2 Deriving the amount of CO2 that may be captured in China’s power sector
Both the literature review and the interviews conducted in China revealed that no suitable long-
term energy scenario including CCS existed for China. Instead, the capacity of coal-fired power
plants that could theoretically be operated with carbon capture is derived from coal
development pathways E1–E31.
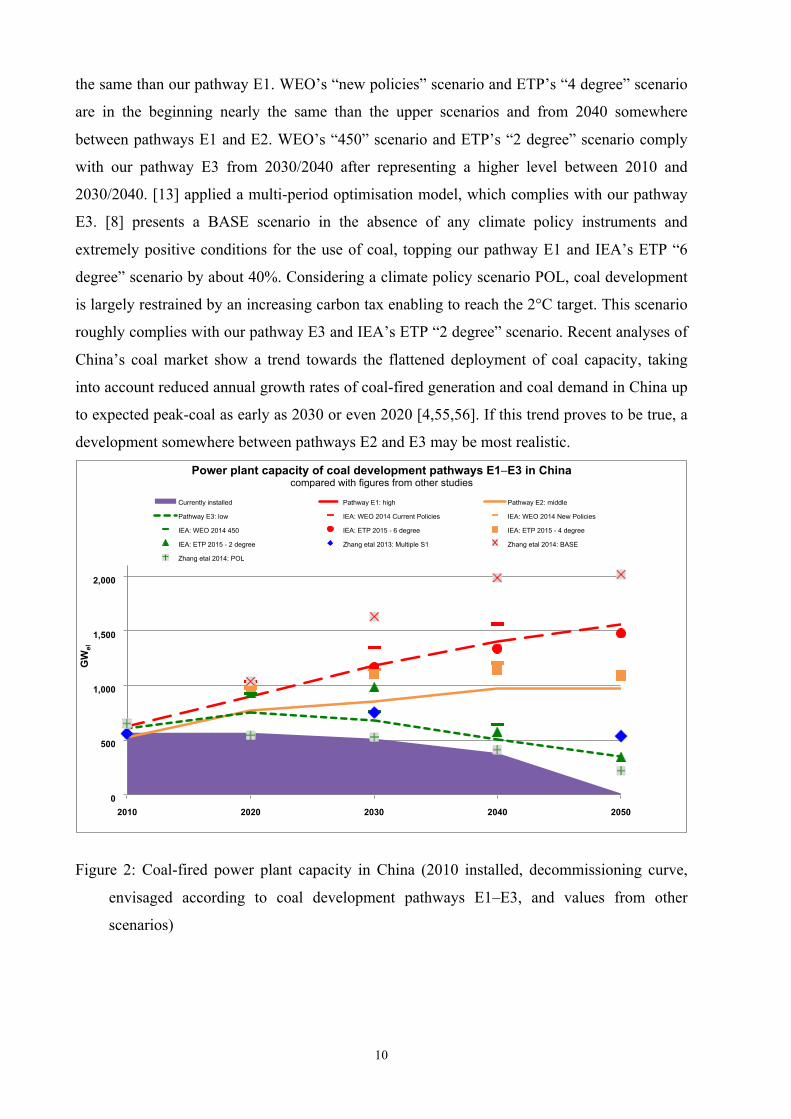
1. Pathway E1: high is based on the World Energy Outlook (WEO) 2009 Reference
Scenario for China [50]. Since WEO scenarios extended to 2030 only, the scenario is
extrapolated to 2050 as given in [51].
2. Pathway E2: middle is based on the EmissionsControl (EC) Scenario, developed within
the China Human Development Report [52]. It is characterised by improvements in
energy efficiency, a diminished increase in coal with a peak in 2040, and a huge
increase in nuclear power. This scenario enables CO2 emissions from the power sector
to be reduced by 41% in 2050, compared to the reference scenario of that study.
3. Pathway E3: low is based on the Sustainable China Energy Outlook as part of the
global Energy [R]evolution Scenario 2010 [51,53]. The target of the global scenario is
to reduce worldwide energy-related carbon dioxide emissions by 50% by the year 2050,
from their 1990 levels. China’s share of global greenhouse gas obligations is calculated
by applying the Greenhouse Development Rights (GDR) framework. The scenario is
based on a massive increase in renewables and energy efficiency; from 2030, both
newly built coal-fired and nuclear power plants are excluded.
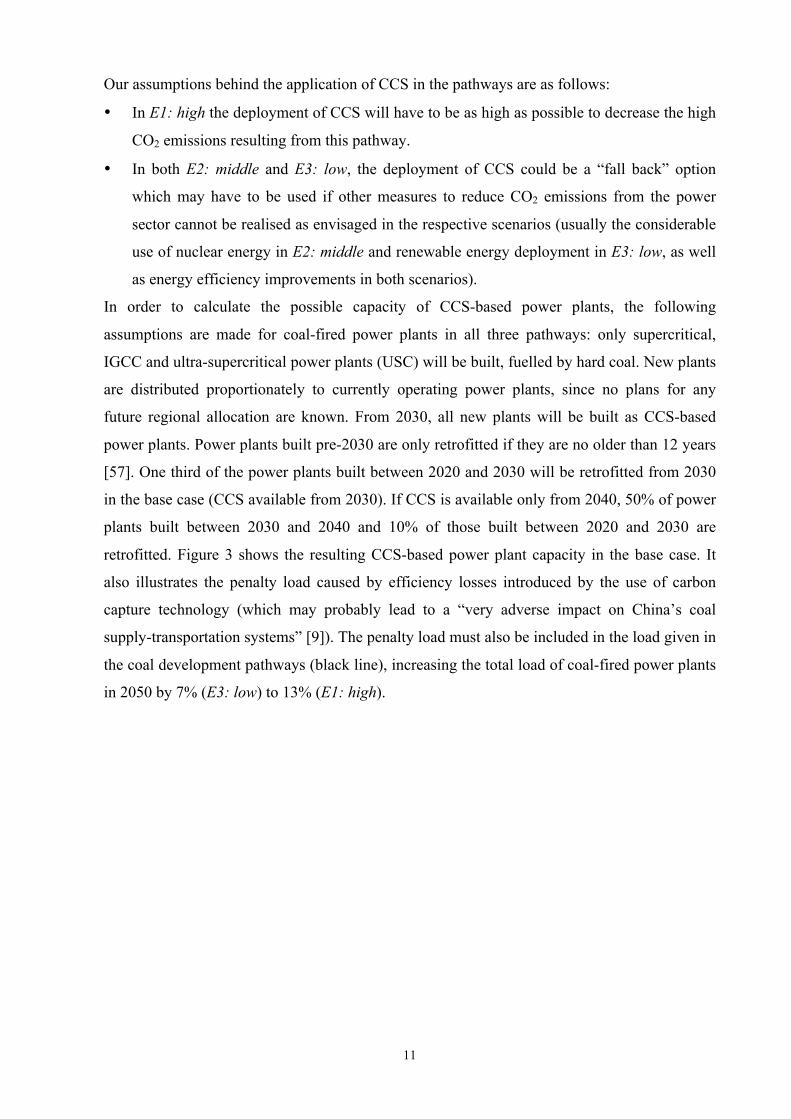
Figure 2 compares the development of coal-fired power plant capacity in the resulting
pathways E1–E3. In addition, the installed power plant capacity as of 2010 and its expected
decommissioning curve are illustrated. These result from a power plant analysis of each of
China’s 33 administrative divisions2. The figure illustrates that all pathways meet the 2010
installed capacity. Since the basic scenarios were published in 2010, for the purpose of
validating our figures we compare these with values from current scenarios in which capacity
development figures are explicitly published. In its scenarios given in Energy Technology
Perspectives (ETP) 2015 [54] and in World Energy Outlook (WEO) 2014 [55], IEA follows a
similar approach: WEO’s “current policies” scenario and ETP’s “6 degree” scenario represent
the highest coal capacity development. From 2020 to 2040, WEO is higher and ETP is nearly
1 The preconditions for pre-selecting a study were: scenarios had to cover a period up to 2050; the installed capacity of coal-fired power plants had to be provided in at least decadal resolution; and scenarios had to been published in English. From the scenarios obtained, only the selected scenarios could be used to model different CCS development pathways [49]. 2 China’s 33 administrative divisions cover 22 provinces, five autonomous regions, four municipalities and two special administrative regions.
10
the same than our pathway E1. WEO’s “new policies” scenario and ETP’s “4 degree” scenario
are in the beginning nearly the same than the upper scenarios and from 2040 somewhere
between pathways E1 and E2. WEO’s “450” scenario and ETP’s “2 degree” scenario comply
with our pathway E3 from 2030/2040 after representing a higher level between 2010 and
2030/2040. [13] applied a multi-period optimisation model, which complies with our pathway
E3. [8] presents a BASE scenario in the absence of any climate policy instruments and
extremely positive conditions for the use of coal, topping our pathway E1 and IEA’s ETP “6
degree” scenario by about 40%. Considering a climate policy scenario POL, coal development
is largely restrained by an increasing carbon tax enabling to reach the 2°C target. This scenario
roughly complies with our pathway E3 and IEA’s ETP “2 degree” scenario. Recent analyses of
China’s coal market show a trend towards the flattened deployment of coal capacity, taking
into account reduced annual growth rates of coal-fired generation and coal demand in China up
to expected peak-coal as early as 2030 or even 2020 [4,55,56]. If this trend proves to be true, a
development somewhere between pathways E2 and E3 may be most realistic.
Figure 2: Coal-fired power plant capacity in China (2010 installed, decommissioning curve,
envisaged according to coal development pathways E1–E3, and values from other
scenarios)
0
500
1,000
1,500
2,000
2010 2020 2030 2040 2050
GW
el
Power plant capacity of coal development pathways E1–E3 in China compared with figures from other studies
Currently installed Pathway E1: high Pathway E2: middle
Pathway E3: low IEA: WEO 2014 Current Policies IEA: WEO 2014 New Policies
IEA: WEO 2014 450 IEA: ETP 2015 - 6 degree IEA: ETP 2015 - 4 degree
IEA: ETP 2015 - 2 degree Zhang etal 2013: Multiple S1 Zhang etal 2014: BASE
Zhang etal 2014: POL
11
Our assumptions behind the application of CCS in the pathways are as follows:
• In E1: high the deployment of CCS will have to be as high as possible to decrease the high
CO2 emissions resulting from this pathway.
• In both E2: middle and E3: low, the deployment of CCS could be a “fall back” option
which may have to be used if other measures to reduce CO2 emissions from the power
sector cannot be realised as envisaged in the respective scenarios (usually the considerable
use of nuclear energy in E2: middle and renewable energy deployment in E3: low, as well
as energy efficiency improvements in both scenarios).
In order to calculate the possible capacity of CCS-based power plants, the following
assumptions are made for coal-fired power plants in all three pathways: only supercritical,
IGCC and ultra-supercritical power plants (USC) will be built, fuelled by hard coal. New plants
are distributed proportionately to currently operating power plants, since no plans for any
future regional allocation are known. From 2030, all new plants will be built as CCS-based
power plants. Power plants built pre-2030 are only retrofitted if they are no older than 12 years
[57]. One third of the power plants built between 2020 and 2030 will be retrofitted from 2030
in the base case (CCS available from 2030). If CCS is available only from 2040, 50% of power
plants built between 2030 and 2040 and 10% of those built between 2020 and 2030 are
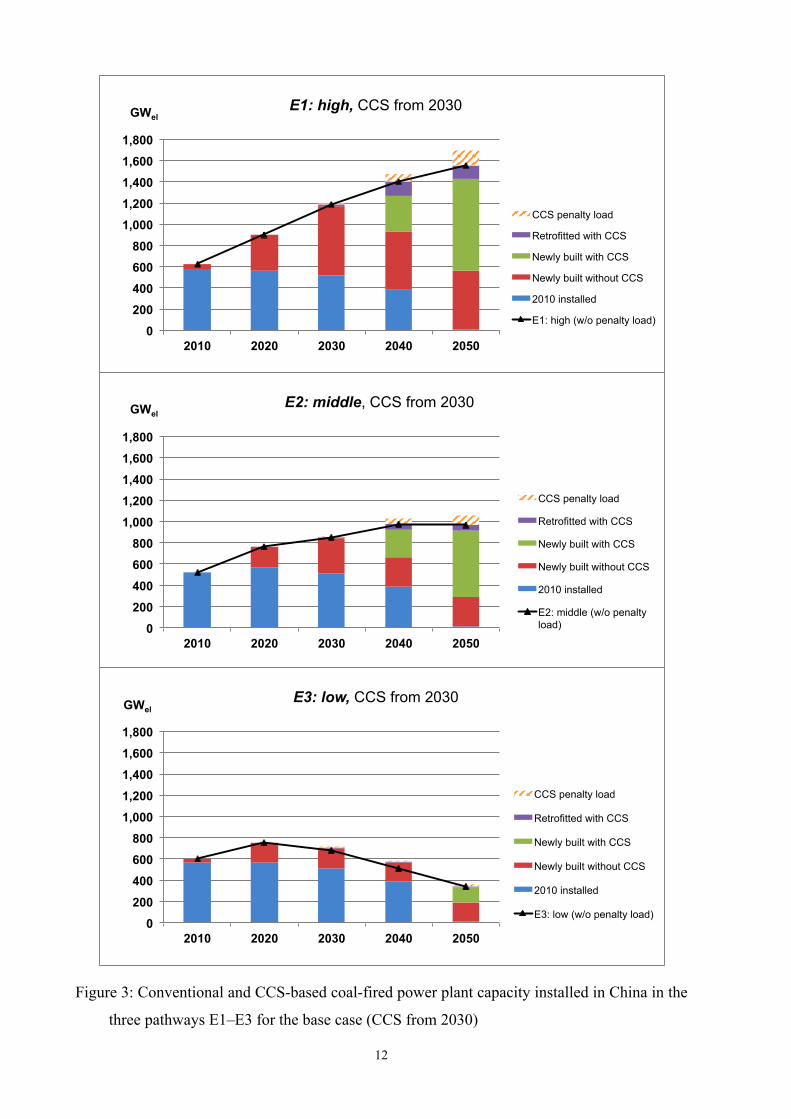
retrofitted. Figure 3 shows the resulting CCS-based power plant capacity in the base case. It
also illustrates the penalty load caused by efficiency losses introduced by the use of carbon
capture technology (which may probably lead to a “very adverse impact on China’s coal
supply-transportation systems” [9]). The penalty load must also be included in the load given in
the coal development pathways (black line), increasing the total load of coal-fired power plants
in 2050 by 7% (E3: low) to 13% (E1: high).
12
Figure 3: Conventional and CCS-based coal-fired power plant capacity installed in China in the
three pathways E1–E3 for the base case (CCS from 2030)
0 200 400 600 800
1,000 1,200 1,400 1,600 1,800
2010 2020 2030 2040 2050
GWel E1: high, CCS from 2030
CCS penalty load
Retrofitted with CCS
Newly built with CCS
Newly built without CCS
2010 installed
E1: high (w/o penalty load)
0 200 400 600 800
1,000 1,200 1,400 1,600 1,800
2010 2020 2030 2040 2050
GWel E2: middle, CCS from 2030
CCS penalty load
Retrofitted with CCS
Newly built with CCS
Newly built without CCS
2010 installed
E2: middle (w/o penalty load)
0 200 400 600 800
1,000 1,200 1,400 1,600 1,800
2010 2020 2030 2040 2050
GWel E3: low, CCS from 2030
CCS penalty load
Retrofitted with CCS
Newly built with CCS
Newly built without CCS
2010 installed
E3: low (w/o penalty load)
13
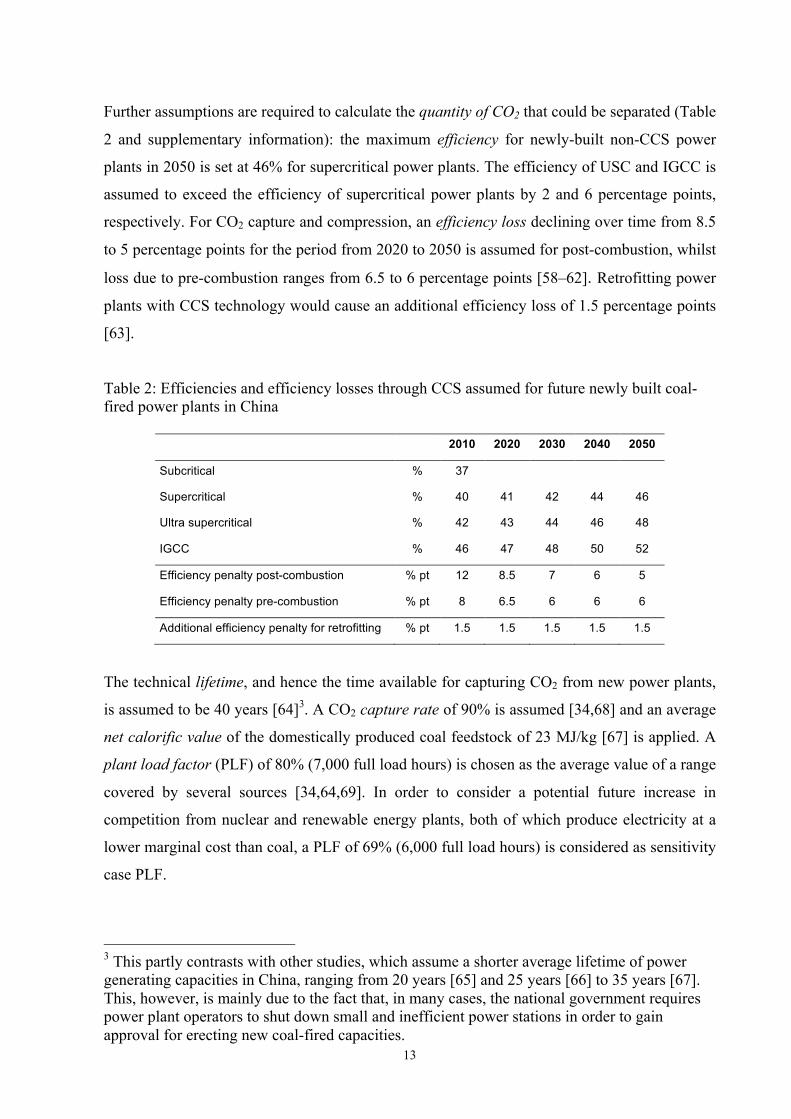
Further assumptions are required to calculate the quantity of CO2 that could be separated (Table
2 and supplementary information): the maximum efficiency for newly-built non-CCS power
plants in 2050 is set at 46% for supercritical power plants. The efficiency of USC and IGCC is
assumed to exceed the efficiency of supercritical power plants by 2 and 6 percentage points,
respectively. For CO2 capture and compression, an efficiency loss declining over time from 8.5
to 5 percentage points for the period from 2020 to 2050 is assumed for post-combustion, whilst
loss due to pre-combustion ranges from 6.5 to 6 percentage points [58–62]. Retrofitting power
plants with CCS technology would cause an additional efficiency loss of 1.5 percentage points
[63].
Table 2: Efficiencies and efficiency losses through CCS assumed for future newly built coal-fired power plants in China
2010 2020 2030 2040 2050
Subcritical % 37
Supercritical % 40 41 42 44 46
Ultra supercritical % 42 43 44 46 48
IGCC % 46 47 48 50 52
Efficiency penalty post-combustion % pt 12 8.5 7 6 5
Efficiency penalty pre-combustion % pt 8 6.5 6 6 6
Additional efficiency penalty for retrofitting % pt 1.5 1.5 1.5 1.5 1.5
The technical lifetime, and hence the time available for capturing CO2 from new power plants,
is assumed to be 40 years [64]3. A CO2 capture rate of 90% is assumed [34,68] and an average
net calorific value of the domestically produced coal feedstock of 23 MJ/kg [67] is applied. A
plant load factor (PLF) of 80% (7,000 full load hours) is chosen as the average value of a range
covered by several sources [34,64,69]. In order to consider a potential future increase in
competition from nuclear and renewable energy plants, both of which produce electricity at a
lower marginal cost than coal, a PLF of 69% (6,000 full load hours) is considered as sensitivity
case PLF.
3 This partly contrasts with other studies, which assume a shorter average lifetime of power generating capacities in China, ranging from 20 years [65] and 25 years [66] to 35 years [67]. This, however, is mainly due to the fact that, in many cases, the national government requires power plant operators to shut down small and inefficient power stations in order to gain approval for erecting new coal-fired capacities.
14
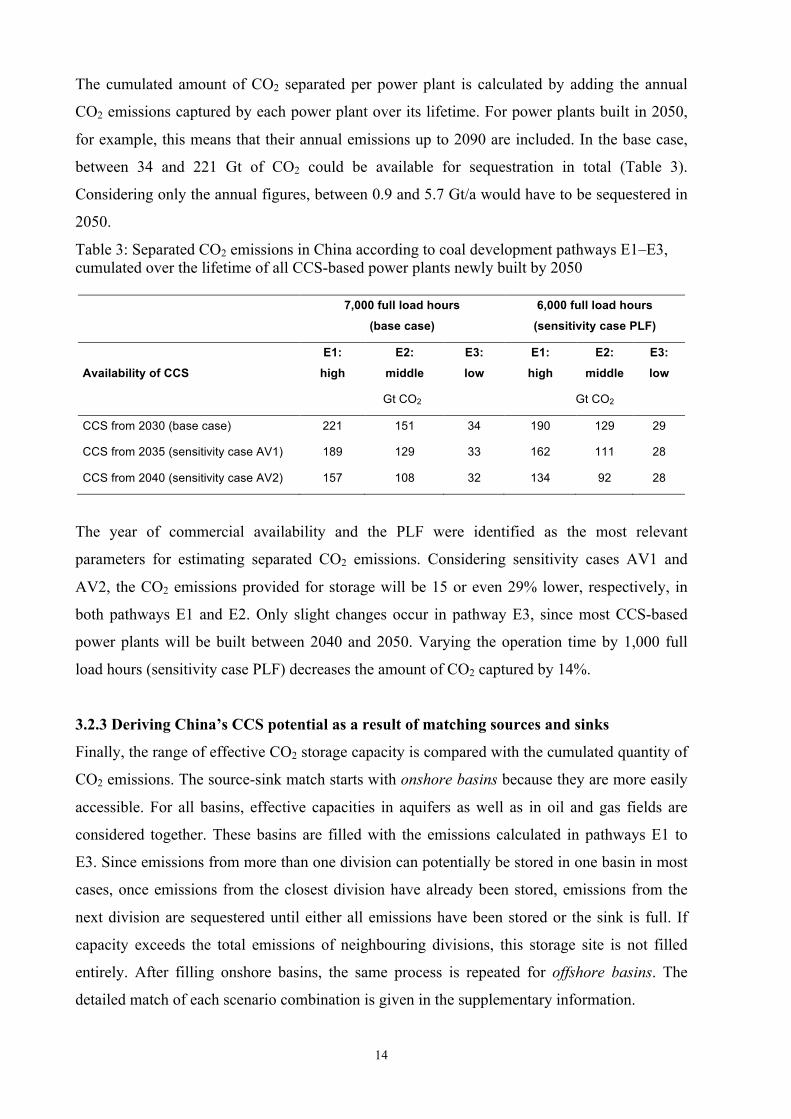
The cumulated amount of CO2 separated per power plant is calculated by adding the annual
CO2 emissions captured by each power plant over its lifetime. For power plants built in 2050,
for example, this means that their annual emissions up to 2090 are included. In the base case,
between 34 and 221 Gt of CO2 could be available for sequestration in total (Table 3).
Considering only the annual figures, between 0.9 and 5.7 Gt/a would have to be sequestered in
2050.
Table 3: Separated CO2 emissions in China according to coal development pathways E1–E3, cumulated over the lifetime of all CCS-based power plants newly built by 2050
7,000 full load hours
(base case)
6,000 full load hours
(sensitivity case PLF)
Availability of CCS
E1:
high
E2:
middle
E3:
low
E1:
high
E2:
middle
E3:
low
Gt CO2 Gt CO2
CCS from 2030 (base case) 221 151 34 190 129 29
CCS from 2035 (sensitivity case AV1) 189 129 33 162 111 28
CCS from 2040 (sensitivity case AV2) 157 108 32 134 92 28
The year of commercial availability and the PLF were identified as the most relevant
parameters for estimating separated CO2 emissions. Considering sensitivity cases AV1 and
AV2, the CO2 emissions provided for storage will be 15 or even 29% lower, respectively, in
both pathways E1 and E2. Only slight changes occur in pathway E3, since most CCS-based
power plants will be built between 2040 and 2050. Varying the operation time by 1,000 full
load hours (sensitivity case PLF) decreases the amount of CO2 captured by 14%.
3.2.3 Deriving China’s CCS potential as a result of matching sources and sinks
Finally, the range of effective CO2 storage capacity is compared with the cumulated quantity of
CO2 emissions. The source-sink match starts with onshore basins because they are more easily
accessible. For all basins, effective capacities in aquifers as well as in oil and gas fields are
considered together. These basins are filled with the emissions calculated in pathways E1 to
E3. Since emissions from more than one division can potentially be stored in one basin in most
cases, once emissions from the closest division have already been stored, emissions from the
next division are sequestered until either all emissions have been stored or the sink is full. If
capacity exceeds the total emissions of neighbouring divisions, this storage site is not filled
entirely. After filling onshore basins, the same process is repeated for offshore basins. The
detailed match of each scenario combination is given in the supplementary information.
15
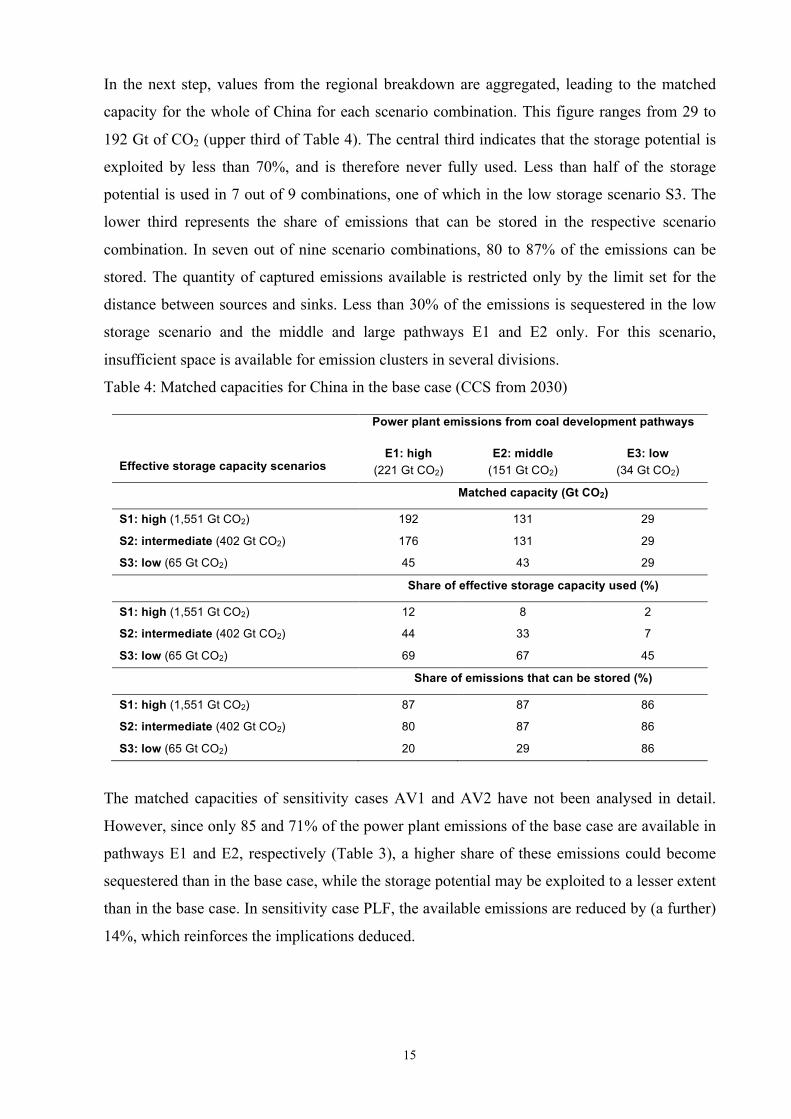
In the next step, values from the regional breakdown are aggregated, leading to the matched
capacity for the whole of China for each scenario combination. This figure ranges from 29 to
192 Gt of CO2 (upper third of Table 4). The central third indicates that the storage potential is
exploited by less than 70%, and is therefore never fully used. Less than half of the storage
potential is used in 7 out of 9 combinations, one of which in the low storage scenario S3. The
lower third represents the share of emissions that can be stored in the respective scenario
combination. In seven out of nine scenario combinations, 80 to 87% of the emissions can be
stored. The quantity of captured emissions available is restricted only by the limit set for the
distance between sources and sinks. Less than 30% of the emissions is sequestered in the low
storage scenario and the middle and large pathways E1 and E2 only. For this scenario,
insufficient space is available for emission clusters in several divisions.
Table 4: Matched capacities for China in the base case (CCS from 2030)
Power plant emissions from coal development pathways
Effective storage capacity scenarios E1: high
(221 Gt CO2) E2: middle
(151 Gt CO2) E3: low
(34 Gt CO2)
Matched capacity (Gt CO2)
S1: high (1,551 Gt CO2) 192 131 29
S2: intermediate (402 Gt CO2) 176 131 29
S3: low (65 Gt CO2) 45 43 29
Share of effective storage capacity used (%)
S1: high (1,551 Gt CO2) 12 8 2
S2: intermediate (402 Gt CO2) 44 33 7
S3: low (65 Gt CO2) 69 67 45
Share of emissions that can be stored (%)
S1: high (1,551 Gt CO2) 87 87 86
S2: intermediate (402 Gt CO2) 80 87 86
S3: low (65 Gt CO2) 20 29 86
The matched capacities of sensitivity cases AV1 and AV2 have not been analysed in detail.
However, since only 85 and 71% of the power plant emissions of the base case are available in
pathways E1 and E2, respectively (Table 3), a higher share of these emissions could become
sequestered than in the base case, while the storage potential may be exploited to a lesser extent
than in the base case. In sensitivity case PLF, the available emissions are reduced by (a further)
14%, which reinforces the implications deduced.
16
3.3 Economic assessment of CCS in China’s power sector
The assessment of LCOE of coal-fired power plants in China is based on a comprehensive set
of assumptions for the base case. Although an increasing capacity of USC plants has been
installed in China in recent years, our estimation concentrates on SC plants because most of the
existing cost assessments refer to these plants. Furthermore, SC plants constitute approximately
40% of China’s coal-fired power capacities commissioned over the last five years [70]. They
are still expected to remain a relevant plant type in China in the decades ahead because they
constitute a widely deployed, mature and reliable technology. IGCC plants are not considered
since the technology is stagnant at the demonstration stage and involves rather high
uncertainties [71], in spite of ambitious demonstration projects such as the GreenGen initiative.
The basic plant parameters for SC plants with and without CCS are for the most part consistent
with those presented for the base case in section 3.2.2 (see also supplementary information).
For newly built SC plants, an average net thermal efficiency of 41% is assumed for the pre-
2020 period and 44% for post-2030 as the mean of the expected development from 2030 to
2050. An efficiency loss of 6 percentage points is chosen as the mean of the efficiency
penalties from 2030 to 2050. Since in the base case CCS starts no earlier than 2030, with
capacities being installed gradually in the ensuing years, the cost assessment provides figures
for CCS plants for 2040 and 2050 only.
Our figures for current plant capital costs and costs of operation and maintenance (O&M)
represent an average value of several existing cost assessments [65–67,72–74], all factoring in
China’s country-specific conditions. Capacities of SC plants considered in these sources range
from 559 to 1,320 MWel. Their capital costs range from 520 to 874 USD/kWel, due to the effect
of economies of scale and differing basic assumptions, such as plant designs with or without
flue gas desulphurisation units (FGDS). We choose the mean value of this range (625
USD/kWel) as it reflects a good balance of anticipated economies of scale due to increasing
plant units in China and a rising share of plants equipped with FGDS units. O&M costs are
given as a percentage rate of plant capital costs and are assumed to be 4% [73].
If post-combustion equipment is added to SC plants, its capital costs are estimated to be
equivalent to 75% of non-CCS plant capital costs; O&M costs are assumed to increase by 83%
(both figures represent an average value of figures from [36,63,75]). The total capital costs for
the power plants considered are allocated to individual years on an annuity basis. An interest
rate of 10% and a depreciation period of 25 years according to [66,69] yield an annuity factor
of approximately 11% per annum (see general LCOE equation in the supplementary
information).
17
The cost development of future power plants is derived by applying learning rates, taking into
account newly installed capacities of SC units with and without CCS at the global level. As
projected in the Blue Map scenario of IEA [76], it is assumed that 663 GW CCS-based coal-
fired power plants will be installed globally by 2050. Based on [77], the learning rates for
power plants with and without CCS are derived as 3.9% and 1.7% for capital costs and 5.8%
and 2.5% for O&M costs, respectively. For CCS-based power plants, these are lower than one
might expect because in the case of CCS only the additional expenditure for CO2 capture
follows the learning curve, whilst the current SC plant is a widely mature and deployed
technology.
Coal prices are an important parameter of LCOE. Since energy security is a top priority of
China’s national government, the figures given below will showcase the development of LCOE
in China under a 90:10 balance of domestic and imported coal, an import rate also assumed by
[55]. This assessment follows the assumption by [67] that the price of domestic hard coal in
China will increase at a growth rate (exponent) of 0.9%/a, starting with USD 86.34 per tonne in
2010 [72]. The price of imported hard coal is assumed to follow the growth rate of the
international oil price based on evidence from previous decades ($2011 87/barrel in 2010, $2011
115/barrel in 2030, and up to $2011 132/barrel in 2050, based on [50]). This price path leads to
feedstock costs of the envisaged hard coal mix of $2011 3.44/kWh in 2010, $2011 3.89/kWh in
2030 and $2011 4.63/kWh in 2050 for China’s SC plants without CCS. For SC plants with CCS,
feedstock costs increase to $2011 4.55/kWh, $2011 4.51/kWh and $2011 5.36/kWh, accordingly.
Average transport costs over a distance of 250 km under specific Chinese conditions are
assumed to be $2011 3.30/t CO2 [78]. This estimate is significantly below international figures
due to lower costs for labour and, in particular, equipment in China.
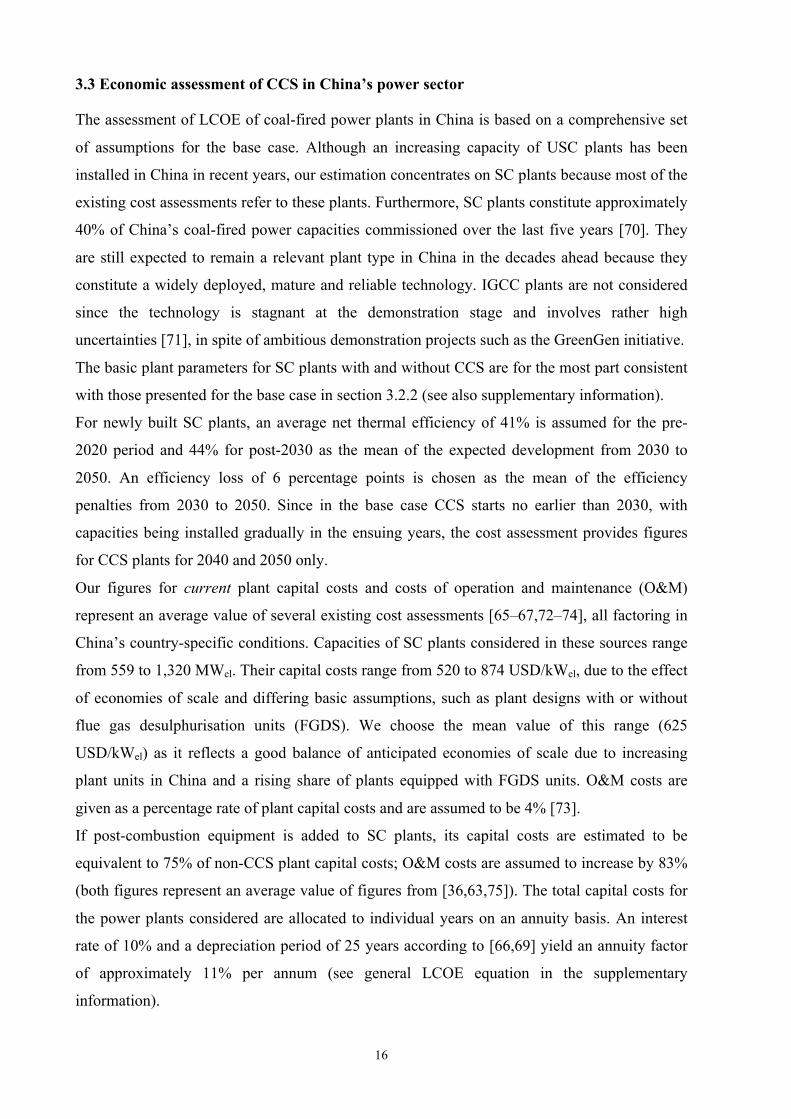
Due to their rather low learning rates, cost reductions of CCS over time are merely moderate
and overcompensated by increasing fuel costs (Figure 4). Overall, LCOE of CCS plants are 29
to 32% higher than those without CCS.
18
Figure 4: LCOE in China with and without CCS in coal development pathways E1: high to E3:
low
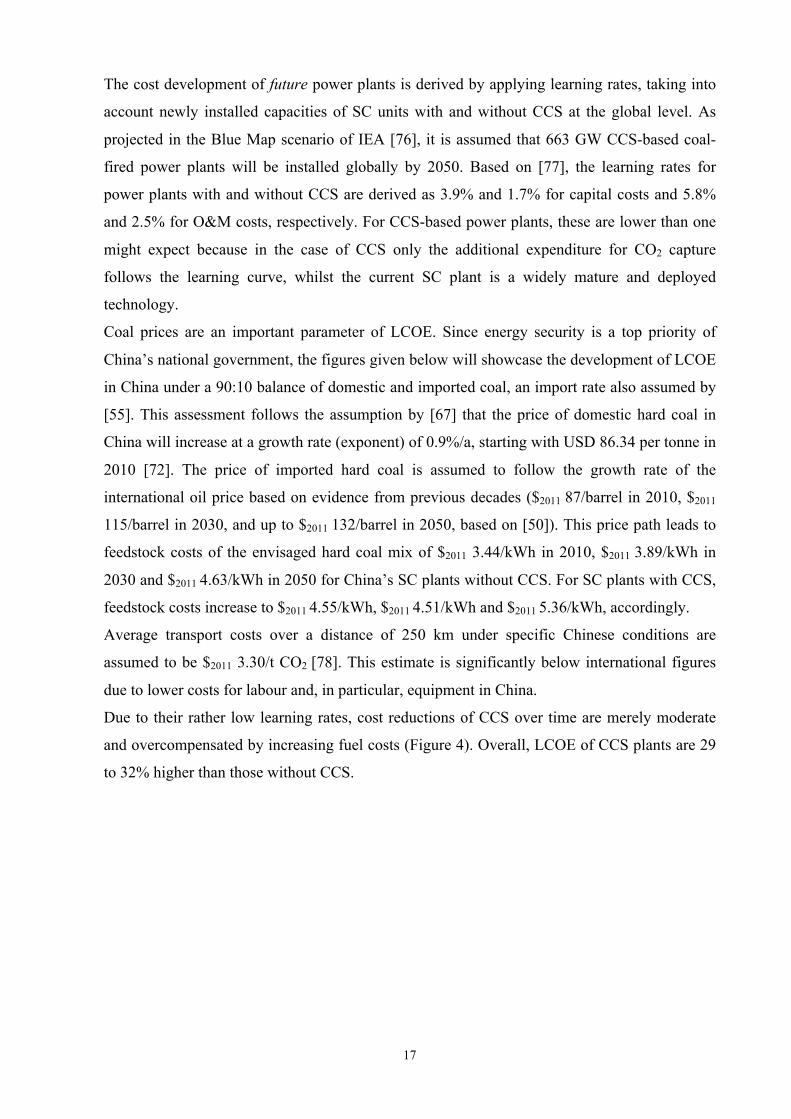
Illustrating LCOE by cost category shows which parameters are responsible for the high cost
penalty of CCS. In pathway E2 (Figure 5), additional fuel costs represent the largest share
(44%) of the additional LCOE of $2011 1.69/kWh in 2050, followed by capital expenditure for
CO2 capture (22%) and CO2 storage (20%).
Figure 5: Additions to LCOE in China resulting from CCS by cost category in coal
development pathway E2: middle
0
1
2
3
4
5
6
7
8
2010 2020 2030 2040 2050
US-
ct20
11/k
Wh
E1: high to E3: low: levelised costs of electricity (LCOE) with and w/o CCS, w/o CO2 penalty 10% imported coal; 90% domestic coal
E1: high, w/o CCS
E1: high, with CCS
E2: middle, w/o CCS
E2: middle, with CCS
E3: low, w/o CCS
E3: low, with CCS
0
1
2
3
4
5
6
7
8
2040 2050
US-
ct20
11/k
Wh
E2: middle: levelised costs of electricity (LCOE) with CCS, w/o CO2 penalty 10% imported coal; 90% domestic coal
Capital costs (excl. CO2 capture) O&M costs excl. CO2 capture Fuel costs excl. CO2 capture
Capital costs of CO2 capture O&M costs of CO2 capture Additional fuel costs with CO2 capture
CO2 transport CO2 storage
Additional costs for
CCS Additional costs for
CCS
19
The high impact of fuel costs is due to significantly lower plant capital costs in China
compared to industrialised countries. This could lead to the conclusion being drawn that the
cost barrier that needs to be overcome to achieve the economic viability of CCS plants is
significantly lower in China than in industrialised countries. However, even in other emerging
economies such as India [6], specific ambient conditions lead to higher plant investment costs.
Furthermore, it must be noted that sensitivities in the development of Chinese domestic coal
and imported coal may significantly affect the results of the cost analysis presented. Some
authors now assume an increasing quantity of imported coal and thus an increasing foreign
dependency rate. The reasons for this are the expected peaking of coal in China [4,56,79–81]
and the limited availability of cheap coal [8]. As a sensitivity case, we therefore analyse the
case that coal imports would provide 50% of the feedstock used in 2050. The feedstock costs
for non-CCS plants and CCS plants would grow to $2011 5.28/kWh or $2011 6.11/kWh,
respectively, and therefore increase by 14% compared to a 90:10 balance of domestic and
imported coal in the same year. In pathway E2, illustrated in Figure 5, LCOE of non-CCS
plants and CCS plants would increase by 10 to 11% in 2050, making it highly sensitive to
changes in feedstock costs. Although feedstock costs account for 75% of LCOE, other cost
parameters may be subject to sensitive developments. In particular, the development of plant
capital costs under different learning rates and gradually increasing labour costs in China may
have a notable impact on plant LCOE, and could be part of further more comprehensive cost
assessments of CCS plants in China. Finally, a lower operation time as assumed in sensitivity
case FLH (6,000 instead of 7,000 full load hours and therefore a 14% lower average utilisation
rate) would nearly proportionally increase LCOE according to equation 1.
Despite the potential impact of sensitivities on the economic performance of CCS plants in
China, our analysis enables the robust conclusion to be drawn that the cost penalty of CCS will
most likely remain significant, requiring stimulating policy incentives such as a CO2 price to
induce the technology’s commercialisation. Since several Chinese administrative divisions
have recently introduced emission trading pilot schemes, the vision of a nation-wide carbon
pricing system is taking shape. For this reason, the present study investigates the impact of a
CO2 penalty on LCOE of CCS of power plants with and without CCS (see Figure 6 illustrating
pathway E2). In our scenarios, CO2 costs start at $2011 42/t CO2 in 2020, reaching $2011 56/t CO2
in 2040 and rising to $2011 63/t CO2 in 2050 [49].
20
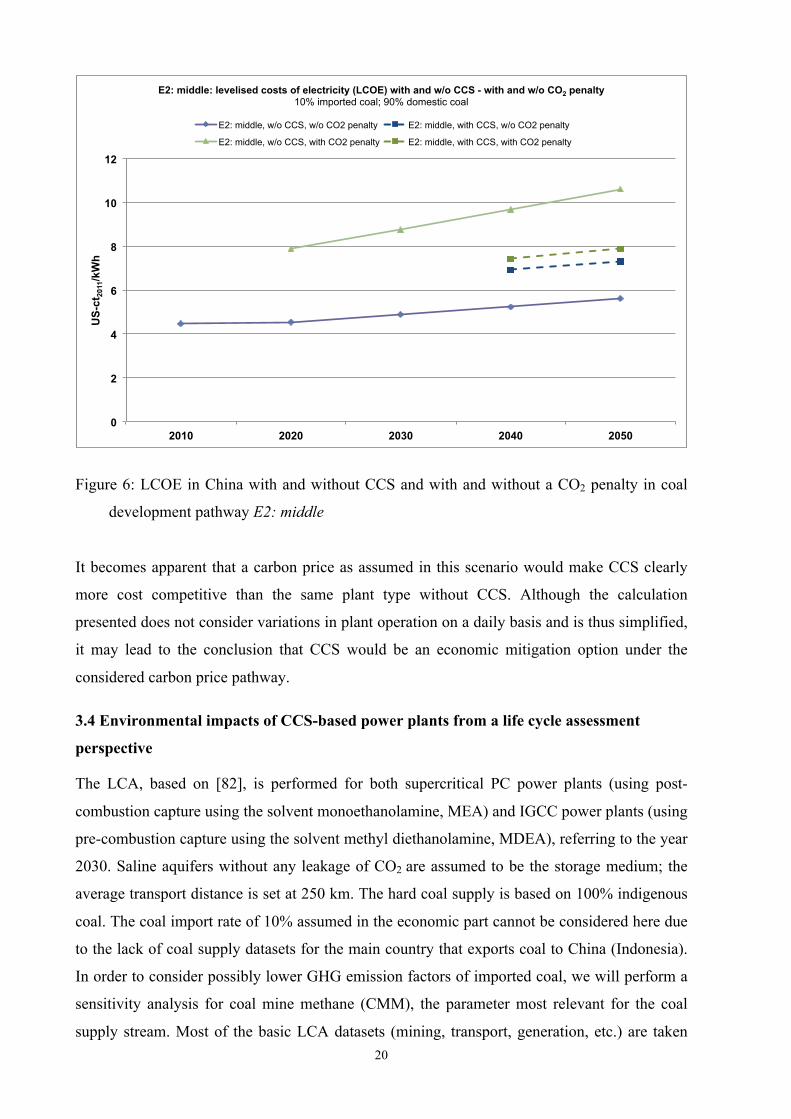
Figure 6: LCOE in China with and without CCS and with and without a CO2 penalty in coal
development pathway E2: middle
It becomes apparent that a carbon price as assumed in this scenario would make CCS clearly
more cost competitive than the same plant type without CCS. Although the calculation
presented does not consider variations in plant operation on a daily basis and is thus simplified,
it may lead to the conclusion that CCS would be an economic mitigation option under the
considered carbon price pathway.
3.4 Environmental impacts of CCS-based power plants from a life cycle assessment
perspective
The LCA, based on [82], is performed for both supercritical PC power plants (using post-
combustion capture using the solvent monoethanolamine, MEA) and IGCC power plants (using
pre-combustion capture using the solvent methyl diethanolamine, MDEA), referring to the year
2030. Saline aquifers without any leakage of CO2 are assumed to be the storage medium; the
average transport distance is set at 250 km. The hard coal supply is based on 100% indigenous
coal. The coal import rate of 10% assumed in the economic part cannot be considered here due
to the lack of coal supply datasets for the main country that exports coal to China (Indonesia).
In order to consider possibly lower GHG emission factors of imported coal, we will perform a
sensitivity analysis for coal mine methane (CMM), the parameter most relevant for the coal
supply stream. Most of the basic LCA datasets (mining, transport, generation, etc.) are taken
0
2
4
6
8
10
12
2010 2020 2030 2040 2050
US-
ct20
11/k
Wh
E2: middle: levelised costs of electricity (LCOE) with and w/o CCS - with and w/o CO2 penalty 10% imported coal; 90% domestic coal
E2: middle, w/o CCS, w/o CO2 penalty E2: middle, with CCS, w/o CO2 penalty
E2: middle, w/o CCS, with CO2 penalty E2: middle, with CCS, with CO2 penalty
21
from the LCA database ecoinvent 2.2 and adapted to the conditions considered (for example,
the transport distance of CO2, the calorific value of coal, etc.). Efficiencies and efficiency
losses in the year 2030 are taken from Table 2. A CO2 separation rate of 90% is assumed.
Despite the fact that China has several large uncontrolled coal fires that emit substantial
amounts of carbon dioxide and other greenhouse gases, these emissions are disregarded in our
analysis (and consistently excluded from the original ecoinvent dataset “Hard coal, at mine
[CN]”). Since coal fires are not only ignited naturally, but usually through human influence
[83], they cannot essentially be connected to coal mining activities caused by large-scale power
production, although this context has not yet been fully discussed. CMM emissions are
included as given in the aforementioned ecoinvent dataset (0.0169 kg CH4/kg coal),
representing the situation in China in 1990. Depending on the calorific value and the efficiency
of the power plant, CMM causes additional GHG emissions of 154 and 137 g CO2-eq/kWhel (in
the case of the modelled PC and IGCC, respectively).
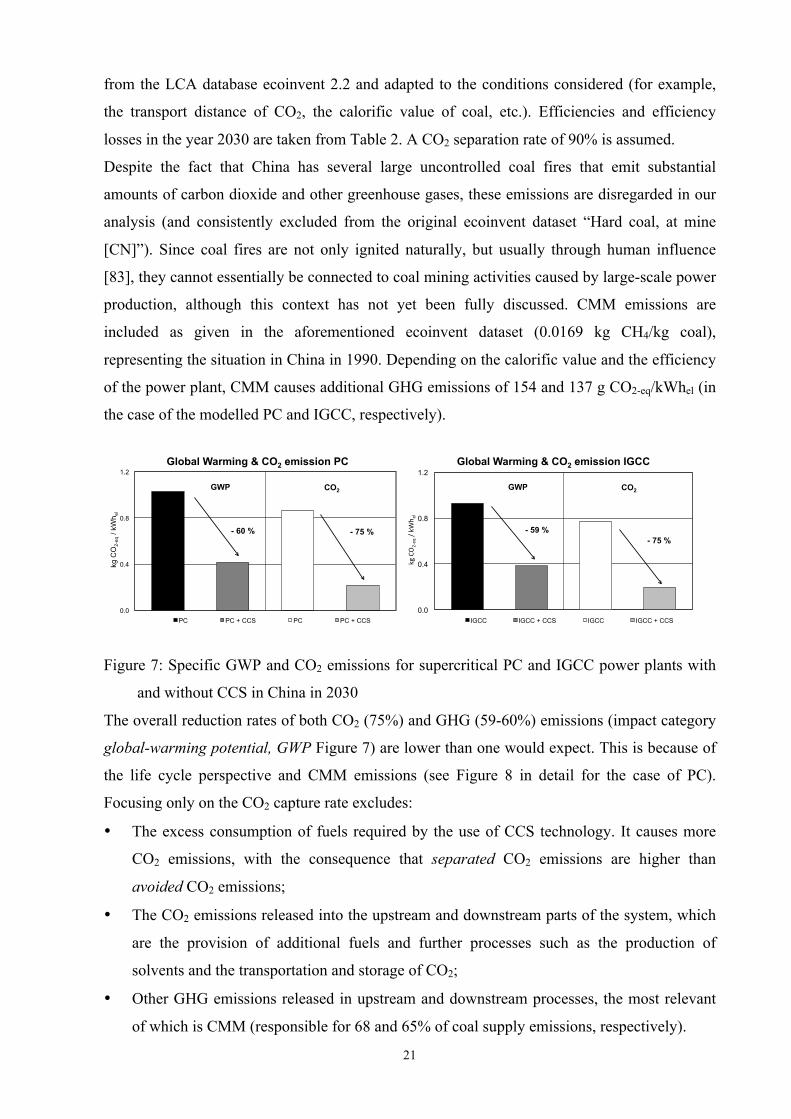
Figure 7: Specific GWP and CO2 emissions for supercritical PC and IGCC power plants with
and without CCS in China in 2030
The overall reduction rates of both CO2 (75%) and GHG (59-60%) emissions (impact category
global-warming potential, GWP Figure 7) are lower than one would expect. This is because of
the life cycle perspective and CMM emissions (see Figure 8 in detail for the case of PC).
Focusing only on the CO2 capture rate excludes:
• The excess consumption of fuels required by the use of CCS technology. It causes more
CO2 emissions, with the consequence that separated CO2 emissions are higher than
avoided CO2 emissions;
• The CO2 emissions released into the upstream and downstream parts of the system, which
are the provision of additional fuels and further processes such as the production of
solvents and the transportation and storage of CO2;
• Other GHG emissions released in upstream and downstream processes, the most relevant
of which is CMM (responsible for 68 and 65% of coal supply emissions, respectively).
0.0
0.4
0.8
1.2
kg C
O2-
eq /
kWh e
l
Global Warming & CO2 emission PC
PC PC + CCS PC PC + CCS
- 75 %
GWP CO2
- 60 %
0.0
0.4
0.8
1.2
kg#CO2'eq#/#kW
h el!
Global Warming & CO2 emission IGCC
IGCC IGCC + CCS IGCC IGCC + CCS
- 75 %
GWP CO2
- 59 %
22
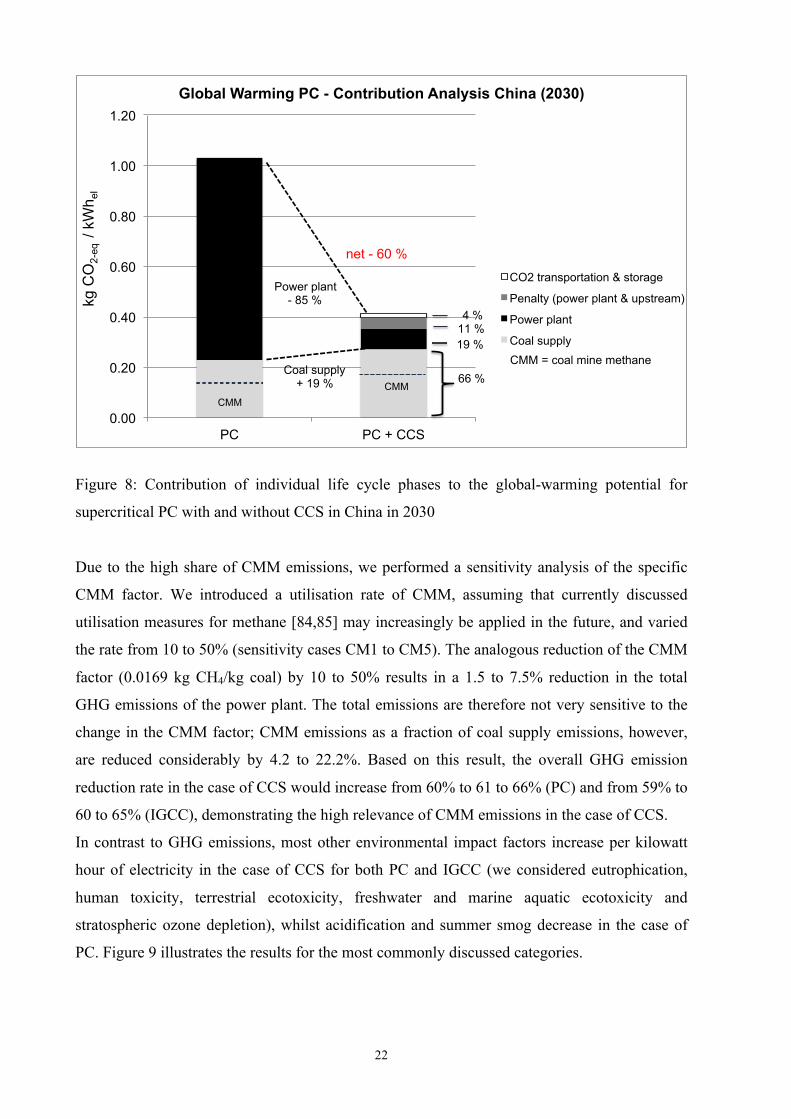
Figure 8: Contribution of individual life cycle phases to the global-warming potential for
supercritical PC with and without CCS in China in 2030
Due to the high share of CMM emissions, we performed a sensitivity analysis of the specific
CMM factor. We introduced a utilisation rate of CMM, assuming that currently discussed
utilisation measures for methane [84,85] may increasingly be applied in the future, and varied
the rate from 10 to 50% (sensitivity cases CM1 to CM5). The analogous reduction of the CMM
factor (0.0169 kg CH4/kg coal) by 10 to 50% results in a 1.5 to 7.5% reduction in the total
GHG emissions of the power plant. The total emissions are therefore not very sensitive to the
change in the CMM factor; CMM emissions as a fraction of coal supply emissions, however,
are reduced considerably by 4.2 to 22.2%. Based on this result, the overall GHG emission
reduction rate in the case of CCS would increase from 60% to 61 to 66% (PC) and from 59% to
60 to 65% (IGCC), demonstrating the high relevance of CMM emissions in the case of CCS.
In contrast to GHG emissions, most other environmental impact factors increase per kilowatt
hour of electricity in the case of CCS for both PC and IGCC (we considered eutrophication,
human toxicity, terrestrial ecotoxicity, freshwater and marine aquatic ecotoxicity and
stratospheric ozone depletion), whilst acidification and summer smog decrease in the case of
PC. Figure 9 illustrates the results for the most commonly discussed categories.
0.00
0.20
0.40
0.60
0.80
1.00
1.20
PC PC + CCS
kg C
O2-
eq /
kWh e
l Global Warming PC - Contribution Analysis China (2030)
CO2 transportation & storage
Penalty (power plant & upstream)
Power plant
Coal supply
Coal supply + 19 %
Power plant - 85 %
66 %
11 % 4 %
net - 60 %
19 %
!!!CMM
CMM !!!
CMM = coal mine methane
23
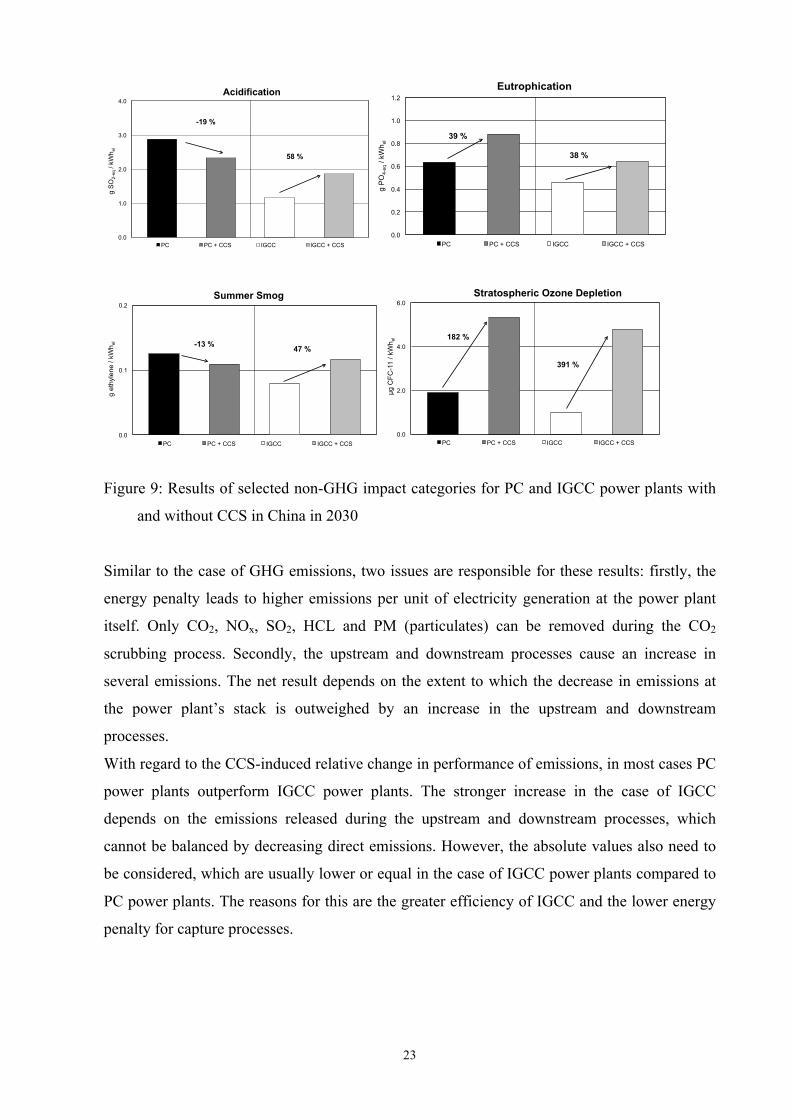
Figure 9: Results of selected non-GHG impact categories for PC and IGCC power plants with
and without CCS in China in 2030
Similar to the case of GHG emissions, two issues are responsible for these results: firstly, the
energy penalty leads to higher emissions per unit of electricity generation at the power plant
itself. Only CO2, NOx, SO2, HCL and PM (particulates) can be removed during the CO2
scrubbing process. Secondly, the upstream and downstream processes cause an increase in
several emissions. The net result depends on the extent to which the decrease in emissions at
the power plant’s stack is outweighed by an increase in the upstream and downstream
processes.
With regard to the CCS-induced relative change in performance of emissions, in most cases PC
power plants outperform IGCC power plants. The stronger increase in the case of IGCC
depends on the emissions released during the upstream and downstream processes, which
cannot be balanced by decreasing direct emissions. However, the absolute values also need to
be considered, which are usually lower or equal in the case of IGCC power plants compared to
PC power plants. The reasons for this are the greater efficiency of IGCC and the lower energy
penalty for capture processes.
0.0
1.0
2.0
3.0
4.0 g
SO
2-eq
/ kW
h el
Acidification
PC PC + CCS IGCC IGCC + CCS
58 %
-19 %
0.0
0.2
0.4
0.6
0.8
1.0
1.2
g PO
4-eq
/ kW
h el
Eutrophication
PC PC + CCS IGCC IGCC + CCS
38 %
39 %
0.0
0.1
0.2
g et
hyle
ne /
kWh e
l
Summer Smog
PC PC + CCS IGCC IGCC + CCS
47 % -13 %
0.0
2.0
4.0
6.0
µg C
FC-1
1 / k
Wh e
l
Stratospheric Ozone Depletion
PC PC + CCS IGCC IGCC + CCS
391 %
182 %
24
3.5 Analysis of stakeholder positions
During the interviews we conducted within this study (see supplementary information), it
became apparent that China’s national government recognised CCS as a potentially relevant
technology option for mitigating CO2 emissions from large-scale, fossil-fired plants in 2007.
This was the year when former President Hu Jintao highlighted research on CCS as one
element of a research agenda towards the introduction of a low-carbon development [86].
Former Premier Wen Jiabao hosted a workshop on reducing CO2 emissions in the same year,
which further boosted the attraction of CCS as a mitigation pathway. These statements and
actions by China’s national leaders were translated into national plans and policy initiatives in
the ensuing years. The national government increased its R&D budget for CCS-related
activities for the period of the 12th Five Year Plan (2011-2015). For example, the budget for the
first year of the 12th Five-Year Plan period was estimated to be nearly as high as the overall
budget for CCS in the whole 11th Five-Year Plan period [87]. The focus of the government’s
efforts, though, is not merely on CCS, but on CCUS in order to exploit additional value
creation opportunities. Due to the activities described, China has made significant progress in
recent years in establishing pilot plants at industrial scales, proving that it can realise such
projects in very short timescales [9].
Despite these steps, CCS was not a top priority on China’s carbon mitigation agenda in the
past. The government choose a rather cautious approach, considering CCS as a reserve
technology that may be required in the future, whilst its large-scale application was expected to
be some time away [87]. Possible future binding mitigation obligations arising from
international climate negotiations were thought to be a potential trigger for the future
deployment of CCS in China [64,87,88]. The introduction of regional emission trading pilots
could enhance such a development. China has since become a front-runner on CCS, by
accumulating significant know-how on the CO2 capture process and achieving significant
progress in establishing pilot plants on an industrial scale whilst other demonstration plant
activities throughout the world stagnate [40]. Furthermore, climate policy in China focuses
increasingly on the goal of reducing CO2 and instruments for achieving this goal. Examples
include the recent U.S.-China Joint Announcement on Climate Change, which lends
considerable support to CCS; the introduction of an emissions cap; and a 40% carbon intensity
reduction target for the industry [5,89].
The governmental strategy on CCS is led by the National Energy Administration (NEA) as part
of the National Development and Reform Commission (NDRC). However, several other
25
ministries and governmental units are responsible for specific sub-questions, such as the
Ministry of Science and Technology (MOST), which is in charge of CCS-related research and
development activities, and the Ministry of Environmental Protection (MEP), which is
responsible for the potential long-term environmental impacts of CCS.
In the industry sector, some of China’s major industrial stakeholders have become increasingly
active in the field of developing, testing and demonstrating carbon capture, use and storage
technologies. They have accumulated significant technical know-how on CO2 capture
processes and are assumed to be able to build most parts of a power plant with CO2 capture
equipment based on Chinese technologies [89,90]. One of China’s most active players is China
Huaneng Group, China’s largest power producer. This group established the GreenGen
Corporation to promote CCS in a 250 MW IGCC plant in Tianjin City, Bohai Rim. Shenhua,
China’s largest coal-mining company, launched a small-scale CCS operation at its coal
liquefaction plant in Inner Mongolia. In the oil industry, PetroChina and Sinopec are fostering
the research, development and demonstration (RD&D) of CO2 storage in combination with
EOR. China’s oil companies are considered key players for realising CO2 storage projects
because they have exclusive access to geological data on underground potential storage sites
[91].
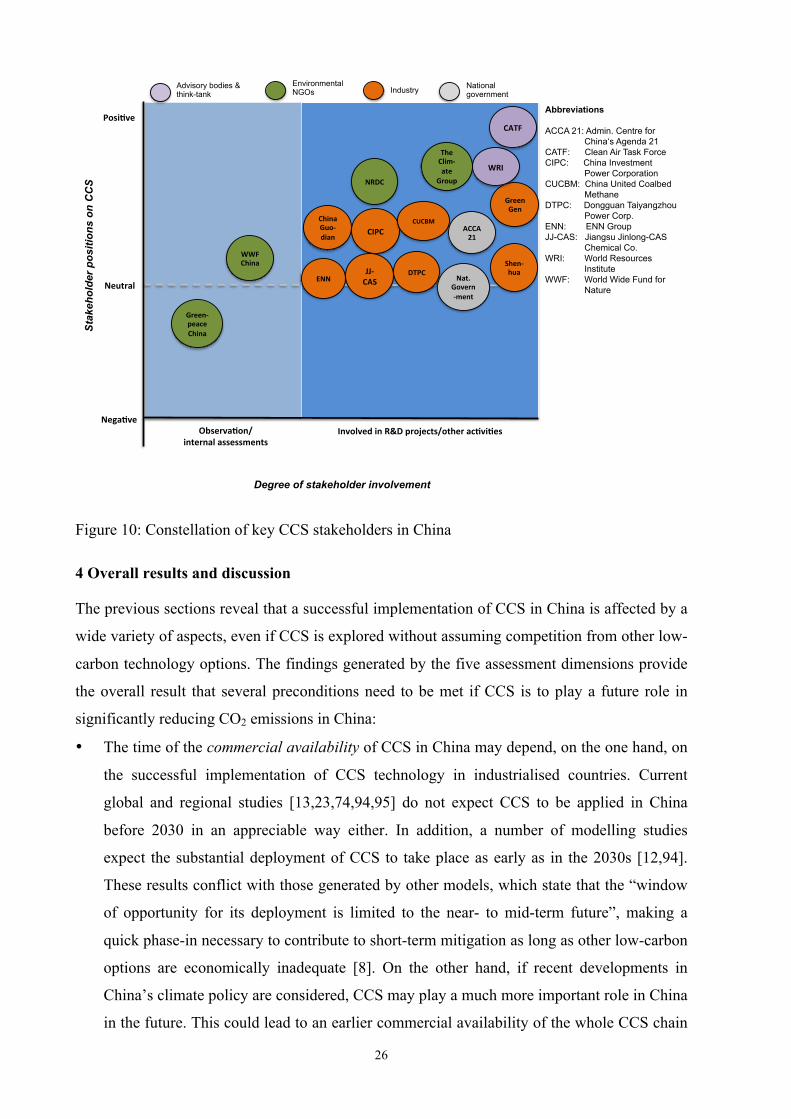
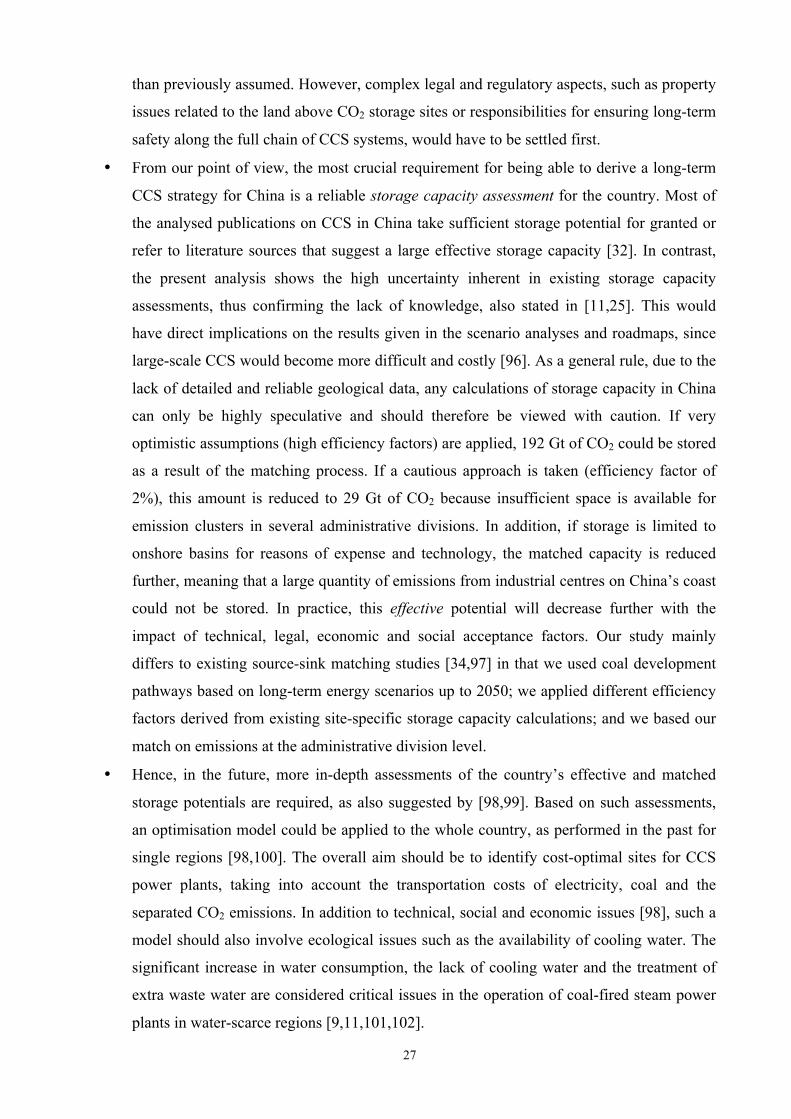
Environmental NGOs, such as the World Resources Institute (WRI), WWF China, Greenpeace
China, the Climate Group and the U.S. NGO Natural Resources and Defense Council (NRDC)
also address CCS in China, but it is not their top priority. Their positions are mixed. For
example, while WWF China considers CCS as a “necessary evil” [92], Greenpeace China
opposes it [93]. Figure 10 illustrates the constellation of actors in the Chinese CCS discourse.
26
Figure 10: Constellation of key CCS stakeholders in China
4 Overall results and discussion
The previous sections reveal that a successful implementation of CCS in China is affected by a
wide variety of aspects, even if CCS is explored without assuming competition from other low-
carbon technology options. The findings generated by the five assessment dimensions provide
the overall result that several preconditions need to be met if CCS is to play a future role in
significantly reducing CO2 emissions in China:
• The time of the commercial availability of CCS in China may depend, on the one hand, on
the successful implementation of CCS technology in industrialised countries. Current
global and regional studies [13,23,74,94,95] do not expect CCS to be applied in China
before 2030 in an appreciable way either. In addition, a number of modelling studies
expect the substantial deployment of CCS to take place as early as in the 2030s [12,94].
These results conflict with those generated by other models, which state that the “window
of opportunity for its deployment is limited to the near- to mid-term future”, making a
quick phase-in necessary to contribute to short-term mitigation as long as other low-carbon
options are economically inadequate [8]. On the other hand, if recent developments in
China’s climate policy are considered, CCS may play a much more important role in China
in the future. This could lead to an earlier commercial availability of the whole CCS chain
Posi%ve(
Nega%ve(
Neutral(Nat.(
Govern3ment(
Observa%on/(internal(assessments(
Involved(in(R&D(projects/other(ac%vi%es(
ACCA(21(
China(Guo3dian(
ENN(
CIPC(
Green(Gen(
WWF(China(
Advisory bodies & think-tank
Environmental NGOs Industry National
government
Abbreviations ACCA 21: Admin. Centre for China‘s Agenda 21 CATF: Clean Air Task Force CIPC: China Investment Power Corporation CUCBM: China United Coalbed Methane DTPC: Dongguan Taiyangzhou Power Corp. ENN: ENN Group JJ-CAS: Jiangsu Jinlong-CAS Chemical Co. WRI: World Resources Institute WWF: World Wide Fund for Nature
WRI(
Degree of stakeholder involvement
Sta
keho
lder
pos
ition
s on
CC
S
Shen3hua(
CUCBM(
JJ3CAS(
DTPC(
Green3peace(China(
The(Clim3ate(
Group(NRDC(
CATF(
27
than previously assumed. However, complex legal and regulatory aspects, such as property
issues related to the land above CO2 storage sites or responsibilities for ensuring long-term
safety along the full chain of CCS systems, would have to be settled first.
• From our point of view, the most crucial requirement for being able to derive a long-term
CCS strategy for China is a reliable storage capacity assessment for the country. Most of
the analysed publications on CCS in China take sufficient storage potential for granted or
refer to literature sources that suggest a large effective storage capacity [32]. In contrast,
the present analysis shows the high uncertainty inherent in existing storage capacity
assessments, thus confirming the lack of knowledge, also stated in [11,25]. This would
have direct implications on the results given in the scenario analyses and roadmaps, since
large-scale CCS would become more difficult and costly [96]. As a general rule, due to the
lack of detailed and reliable geological data, any calculations of storage capacity in China
can only be highly speculative and should therefore be viewed with caution. If very
optimistic assumptions (high efficiency factors) are applied, 192 Gt of CO2 could be stored
as a result of the matching process. If a cautious approach is taken (efficiency factor of
2%), this amount is reduced to 29 Gt of CO2 because insufficient space is available for
emission clusters in several administrative divisions. In addition, if storage is limited to
onshore basins for reasons of expense and technology, the matched capacity is reduced
further, meaning that a large quantity of emissions from industrial centres on China’s coast
could not be stored. In practice, this effective potential will decrease further with the
impact of technical, legal, economic and social acceptance factors. Our study mainly
differs to existing source-sink matching studies [34,97] in that we used coal development
pathways based on long-term energy scenarios up to 2050; we applied different efficiency
factors derived from existing site-specific storage capacity calculations; and we based our
match on emissions at the administrative division level.
• Hence, in the future, more in-depth assessments of the country’s effective and matched
storage potentials are required, as also suggested by [98,99]. Based on such assessments,
an optimisation model could be applied to the whole country, as performed in the past for
single regions [98,100]. The overall aim should be to identify cost-optimal sites for CCS
power plants, taking into account the transportation costs of electricity, coal and the
separated CO2 emissions. In addition to technical, social and economic issues [98], such a
model should also involve ecological issues such as the availability of cooling water. The
significant increase in water consumption, the lack of cooling water and the treatment of
extra waste water are considered critical issues in the operation of coal-fired steam power
plants in water-scarce regions [9,11,101,102].
28
• The economic assessment reveals a significant barrier to achieving the economic viability
of CCS in China under current conditions, making policy incentives a crucial precondition
for CCS commercialisation. However, due to lower plant capital costs, the cost penalty in
China is significantly lower than in industrialised countries or other emerging economies.
Introducing a carbon price could therefore significantly improve the competitiveness of
CCS plants over non-CCS plants and outweigh the cost penalty of CCS plants. However,
the stimulating economic framework conditions in China may be offset in the decades
ahead as Chinese labour and equipment costs are expected to increase steadily. Bearing in
mind that the share of imported coal could grow in the future, the future development of
the coal markets should be observed carefully with regard to possible implications for
China’s energy security
• The findings of the prospective LCA comply with results of earlier studies [103–105], but
yield conflicting results. Firstly, the total GHG emissions per unit of electricity output are
considerably reduced. However, the reduction rate over the whole life cycle of only 59 to
60% may call into question the benefits of the huge investments that would be required for
the deployment of a comprehensive CCS infrastructure in China. This rate is 14 percentage
points lower than that calculated for India [6], mainly due to high coalbed methane
emissions. Furthermore, it is presumed here that there would be no leakages at the storage
sites. This is somewhat optimistic, not only taking into account the fact that considerable
technology advancements on monitoring and modelling CO2 long-term storage safety
would be necessary [106]. The assumption of some leakage over time could significantly
change the balance of CO2 emissions. Secondly, most other environmental and social
impacts of coal-fired power plants would increase with the use of CCS. Due to the
additional primary energy demands of CCS, further environmental and social issues that
were not included in our LCA will also increase (for example, air quality, noise, mine
waste, health risks, displacement and resettlement). Thirdly, the development of scrubbing
technology was only considered in terms of decreasing efficiency losses. If more
environmentally benign technologies entered the market, the results of the prospective
LCA could change due to different upstream processes. Finally, an LCA does not include a
risk analysis, which would have to cover the risks of transporting and storing CO2 or health
risks due to additional coal mining.
• As [8] also emphasises, strong advocates for CCS from government and business would be
needed to establish optimal conditions for a prominent development of CCS in China. A
wide range of stakeholders are currently working on CCS and fostering the technology’s
demonstration and development. The industry seems to be able to build most parts of a
29
power plant with CO2 capture equipment based on Chinese technologies, meaning that
China could potentially benefit from future export opportunities for CO2 capture
technologies.
• Last but not least, it should be pointed out that a long-term roadmap of CCS in China’s
industry could refine our source-sink match by including separated CO2 emissions from
cement, iron and steel industries as well as non-power gasification-based coal to the oil,
gas and chemicals sector [9]. Since only 12 to 69% of the effective storage capacities is
used, even in pathway E1: high (Table 4), a considerable amount of industrial CO2
emissions could additionally be stored. A rough calculation by the authors revealed that
additional CO2 emissions from industry would only slightly increase the share of
theoretical storage capacity used, but would not alter the results fundamentally [49]. This is
supported by results from [107], which estimates that 446 and 937 Mt of CO2 may be
separated in the cement, iron and steel, and chemicals industries by 2050 and 2095,
respectively. These amounts would equal less than 1.5% of the available effective storage
capacity in the low storage scenario S3. Besides capturing CO2, the analysis of the
potentials and constraints of CO2 usage in both the industry and for EOR and EGR would
complement such a roadmap.
5 Conclusions and outlook
China, the biggest emerging economy, is experiencing a rapidly growing demand for energy.
Although the deployment of renewable energies is growing strongly, most experts expect a
striking dominance of coal-fired power generation in the country’s electricity sector, even if the
recent trend towards flattened the deployment of coal capacity and reduced annual growth rates
of coal-fired generation proves to be true in the future. In order to reduce fossil fuel-related
CO2 emissions to a level that would be consistent with the long-term target of the international
community to which China is increasingly committing itself, this option would require the
introduction of CCS. However, a precondition for opting for CCS would be finding robust
solutions to the constraints highlighted in this article. In this connection, it should be noted that
our findings are subject to a number of highly uncertain assumptions and data. Although the
most relevant parameters were varied via a sensitivity analysis, our analysis should be extended
as soon as more precise data becomes available in the different assessment dimensions.
Furthermore, it needs to be taken into account that CCS plants will face strong competition
from other low-carbon technologies, especially renewable energy technologies. Thus, CCS
plants would need to be compared with other low-carbon technology options to draw fully
valid conclusions on the economic, ecological and social viability of CCS in a low-carbon
30
policy environment. Most renewable energy technologies, for example, indicate much higher
learning rates than those expected for supercritical PC plants with CCS. Such a comparative
analysis was previously conducted for Germany [38]. It might be extended by weighting all the
dimensions considered, for example, by applying a multi-criteria analysis involving different
stakeholder groups.
Finally, in our opinion a set of different assessment dimensions (those considered here plus
others such as risk assessment, public welfare, acceptance, technology innovation and
management efforts as considered in [8,10,29,106]) should be integrated into macro-economic
optimisation models. Such models usually aim to provide the lowest cost options of different
scenarios for achieving long-term mitigation goals. However, these models lack the integration
of qualitative issues. This means that they risk drawing incorrect conclusions for policy-makers
if CCS is presented as the most cost-effective technology option whilst neglecting important
issues that could hinder implementation or make it difficult, yielding higher costs than initially
calculated. However, this task involves a great deal of methodological challenges. Furthermore,
the role of CCS in the electricity sector needs to be assessed with models with a high time
resolution in order to account for the difference between CCS and stochastic renewables in
terms of power supply security and stability. First of all, work on the flexible operation of CCS
power plants [108,109] should be extended to obtain a complete picture of the possible role
played by CCS in an integrated energy system.
References
[1] IEA. Energy Technology Perspectives 2012: Pathways to a Clean Energy System. Paris: International Energy Agency; 2012.
[2] IPCC. Climate Change 2014. IPCC Fifth Assessment Report (AR5). Geneva: Intergovernmental Panel on Climate Change; 2014.
[3] BP. BP Statistical Review of World Energy June 2014. London: 2014. [4] Citygroup. The Unimaginable: Peak Coal in China. 2013. [5] The White House. FACT SHEET: U.S.-China Joint Announcement on Climate Change
and Clean Energy Cooperation 2014. [6] Viebahn P, Vallentin D, Höller S. Prospects of carbon capture and storage (CCS) in
India’s power sector – An integrated assessment. Appl Energ 2014;117:62–75. doi:10.1016/j.apenergy.2013.11.054.
[7] Dooley JJ. Valuing national and basin level geologic CO2 storage capacity assessments in a broader context. Int J Greenh Gas Con 2011;5:177–8. doi:10.1016/j.ijggc.2010.07.002.
[8] Zhang S, Bauer N, Luderer G, Kriegler E. Role of technologies in energy-related CO2 mitigation in China within a climate-protection world: A scenarios analysis using REMIND. Appl Energ 2014;115:445–55. doi:10.1016/j.apenergy.2013.10.039.
[9] Minchener AJ. Gasification based CCS challenges and opportunities for China. Fuel 2014;116:904–9. doi:10.1016/j.fuel.2013.02.046.
[10] Zhu L, Fan Y. A real options–based CCS investment evaluation model: Case study of
31
China’s power generation sector. Appl Energ 2011;88:4320–33. doi:10.1016/j.apenergy.2011.04.005.
[11] Zhou W, Zhu B, Fuss S, Szolgayová J, Obersteiner M, Fei W. Uncertainty modeling of CCS investment strategy in China’s power sector. Appl Energ 2010;87:2392–400. doi:10.1016/j.apenergy.2010.01.013.
[12] Lucas PL, Shukla PR, Chen W, van Ruijven BJ, Dhar S, den Elzen MGJ, et al. Implications of the international reduction pledges on long-term energy system changes and costs in China and India. Energy Policy 2013;63:1032–41. doi:10.1016/j.enpol.2013.09.026.
[13] Zhang D, Liu P, Ma L, Li Z. A multi-period optimization model for planning of China’s power sector with consideration of carbon dioxide mitigation-The importance of continuous and stable carbon mitigation policy. Energy Policy 2013;58:319–28. doi:10.1016/j.enpol.2013.03.017.
[14] Chen W. The Potential Role of CCS to Mitigate Carbon Emissions in Future China. Energy Procedia 2011;4:6007–14. doi:16/j.egypro.2011.02.604.
[15] Yin X, Chen W. Comparison of carbon emission scenarios predicted by the China TIMES model. Qinghua Daxue Xuebao/Journal of Tsinghua University 2013;53:1315–21.
[16] Li A, Li Z. General equilibrium analysis of energy-saving and lowcarbonized development for coal utilization in China. Energy Procedia 2012;14:1951–9. doi:10.1016/j.egypro.2011.12.1193.
[17] Okagawa A, Masui T, Akashi O, Hijioka Y, Matsumoto K, Kainuma M. Assessment of GHG Emission Reduction Pathways in a Society Without Carbon Capture and Nuclear Technologies. Energ Econ 2012;34, Supplement 3:S391–8. doi:10.1016/j.eneco.2012.07.011.
[18] Mori S. An Assessment of the Potentials of Nuclear Power and Carbon Capture and Storage in the Long-Term Global Warming Mitigation Options Based on Asian Modeling Exercise Scenarios. Energ Econ 2012;34, Supplement 3:S421–8. doi:10.1016/j.eneco.2012.03.017.
[19] Mi R, Ahammad H, Hitchins N, Heyhoe E. Development and Deployment of Clean Electricity Technologies in Asia: A Multi-Scenario Analysis Using GTEM. Energ Econ 2012;34, Supplement 3:S399–409. doi:10.1016/j.eneco.2012.06.001.
[20] Luderer G, Pietzcker RC, Kriegler E, Haller M, Bauer N. Asia’s role in mitigating climate change: A technology and sector specific analysis with ReMIND-R. Energ Econ 2012;34:S378–90. doi:10.1016/j.eneco.2012.07.022.
[21] Labriet M, Kanudia A, Loulou R. Climate mitigation under an uncertain technology future: A TIAM-World analysis. Energ Econ 2012;34:S366–77. doi:10.1016/j.eneco.2012.02.016.
[22] Selosse S, Assoumou E, Maïzi N. Climate policy impacts on energy system: A long-term analysis with the TIMES Integrated Assessment Model (TIAM-FR). Proceedings IMETI 2011, vol. 2, 2011, p. 169–73.
[23] Ricci O, Selosse S. Global and Regional Potential for Bioelectricity with Carbon Capture and Storage. Energy Policy 2013;52:689–98. doi:10.1016/j.enpol.2012.10.027.
[24] Dahowski RT, Davidson CL, Dooley JJ. Comparing large scale CCS deployment potential in the USA and China: A detailed analysis based on country-specific CO2 transport & storage cost curves. Energy Procedia 2011;4:2732–9. doi:16/j.egypro.2011.02.175.
[25] Liu H, Gallagher KS. Catalyzing strategic transformation to a low-carbon economy: A CCS roadmap for China. Energy Policy 2010;38:59–74. doi:10.1016/j.enpol.2009.08.063.
[26] Cai W, Wang C, Chen J, Wang K, Zhang Y, Lu X. Comparison of CO2 Emission Scenarios and Mitigation Opportunities in China’s Five Sectors in 2020. Energy Policy
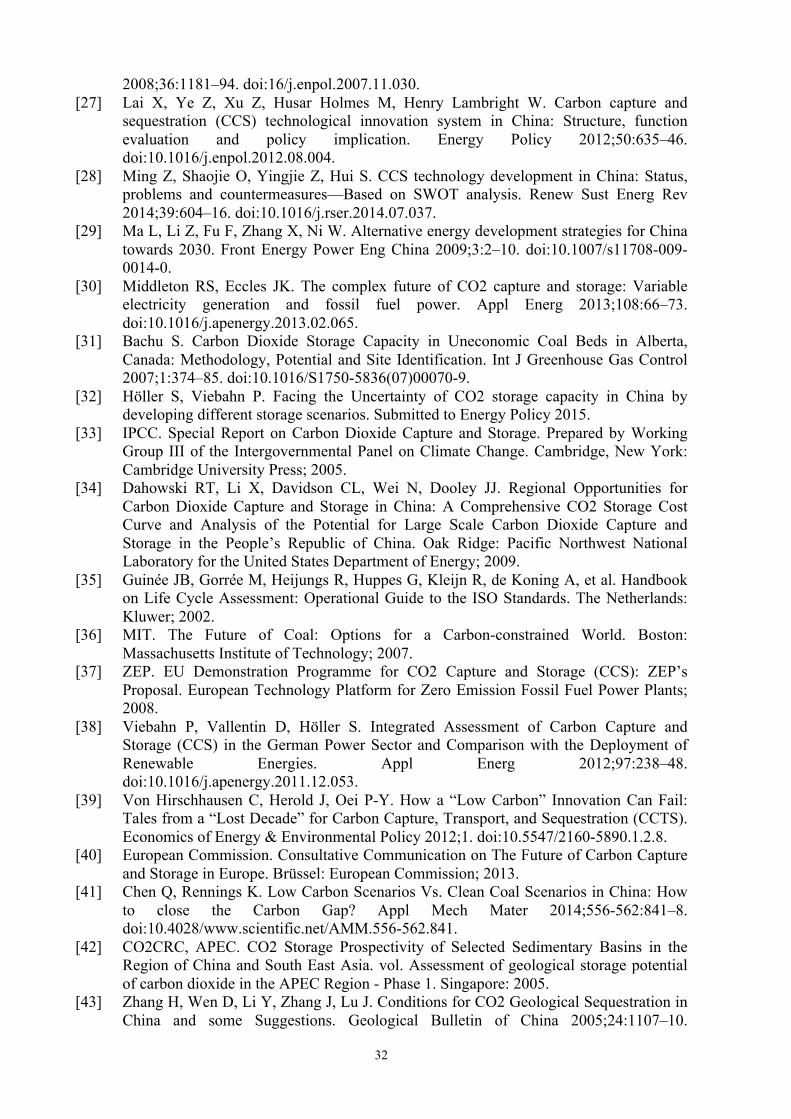
32
2008;36:1181–94. doi:16/j.enpol.2007.11.030. [27] Lai X, Ye Z, Xu Z, Husar Holmes M, Henry Lambright W. Carbon capture and
sequestration (CCS) technological innovation system in China: Structure, function evaluation and policy implication. Energy Policy 2012;50:635–46. doi:10.1016/j.enpol.2012.08.004.
[28] Ming Z, Shaojie O, Yingjie Z, Hui S. CCS technology development in China: Status, problems and countermeasures—Based on SWOT analysis. Renew Sust Energ Rev 2014;39:604–16. doi:10.1016/j.rser.2014.07.037.
[29] Ma L, Li Z, Fu F, Zhang X, Ni W. Alternative energy development strategies for China towards 2030. Front Energy Power Eng China 2009;3:2–10. doi:10.1007/s11708-009-0014-0.
[30] Middleton RS, Eccles JK. The complex future of CO2 capture and storage: Variable electricity generation and fossil fuel power. Appl Energ 2013;108:66–73. doi:10.1016/j.apenergy.2013.02.065.
[31] Bachu S. Carbon Dioxide Storage Capacity in Uneconomic Coal Beds in Alberta, Canada: Methodology, Potential and Site Identification. Int J Greenhouse Gas Control 2007;1:374–85. doi:10.1016/S1750-5836(07)00070-9.
[32] Höller S, Viebahn P. Facing the Uncertainty of CO2 storage capacity in China by developing different storage scenarios. Submitted to Energy Policy 2015.
[33] IPCC. Special Report on Carbon Dioxide Capture and Storage. Prepared by Working Group III of the Intergovernmental Panel on Climate Change. Cambridge, New York: Cambridge University Press; 2005.
[34] Dahowski RT, Li X, Davidson CL, Wei N, Dooley JJ. Regional Opportunities for Carbon Dioxide Capture and Storage in China: A Comprehensive CO2 Storage Cost Curve and Analysis of the Potential for Large Scale Carbon Dioxide Capture and Storage in the People’s Republic of China. Oak Ridge: Pacific Northwest National Laboratory for the United States Department of Energy; 2009.
[35] Guinée JB, Gorrée M, Heijungs R, Huppes G, Kleijn R, de Koning A, et al. Handbook on Life Cycle Assessment: Operational Guide to the ISO Standards. The Netherlands: Kluwer; 2002.
[36] MIT. The Future of Coal: Options for a Carbon-constrained World. Boston: Massachusetts Institute of Technology; 2007.
[37] ZEP. EU Demonstration Programme for CO2 Capture and Storage (CCS): ZEP’s Proposal. European Technology Platform for Zero Emission Fossil Fuel Power Plants; 2008.
[38] Viebahn P, Vallentin D, Höller S. Integrated Assessment of Carbon Capture and Storage (CCS) in the German Power Sector and Comparison with the Deployment of Renewable Energies. Appl Energ 2012;97:238–48. doi:10.1016/j.apenergy.2011.12.053.
[39] Von Hirschhausen C, Herold J, Oei P-Y. How a “Low Carbon” Innovation Can Fail: Tales from a “Lost Decade” for Carbon Capture, Transport, and Sequestration (CCTS). Economics of Energy & Environmental Policy 2012;1. doi:10.5547/2160-5890.1.2.8.
[40] European Commission. Consultative Communication on The Future of Carbon Capture and Storage in Europe. Brüssel: European Commission; 2013.
[41] Chen Q, Rennings K. Low Carbon Scenarios Vs. Clean Coal Scenarios in China: How to close the Carbon Gap? Appl Mech Mater 2014;556-562:841–8. doi:10.4028/www.scientific.net/AMM.556-562.841.
[42] CO2CRC, APEC. CO2 Storage Prospectivity of Selected Sedimentary Basins in the Region of China and South East Asia. vol. Assessment of geological storage potential of carbon dioxide in the APEC Region - Phase 1. Singapore: 2005.
[43] Zhang H, Wen D, Li Y, Zhang J, Lu J. Conditions for CO2 Geological Sequestration in China and some Suggestions. Geological Bulletin of China 2005;24:1107–10.
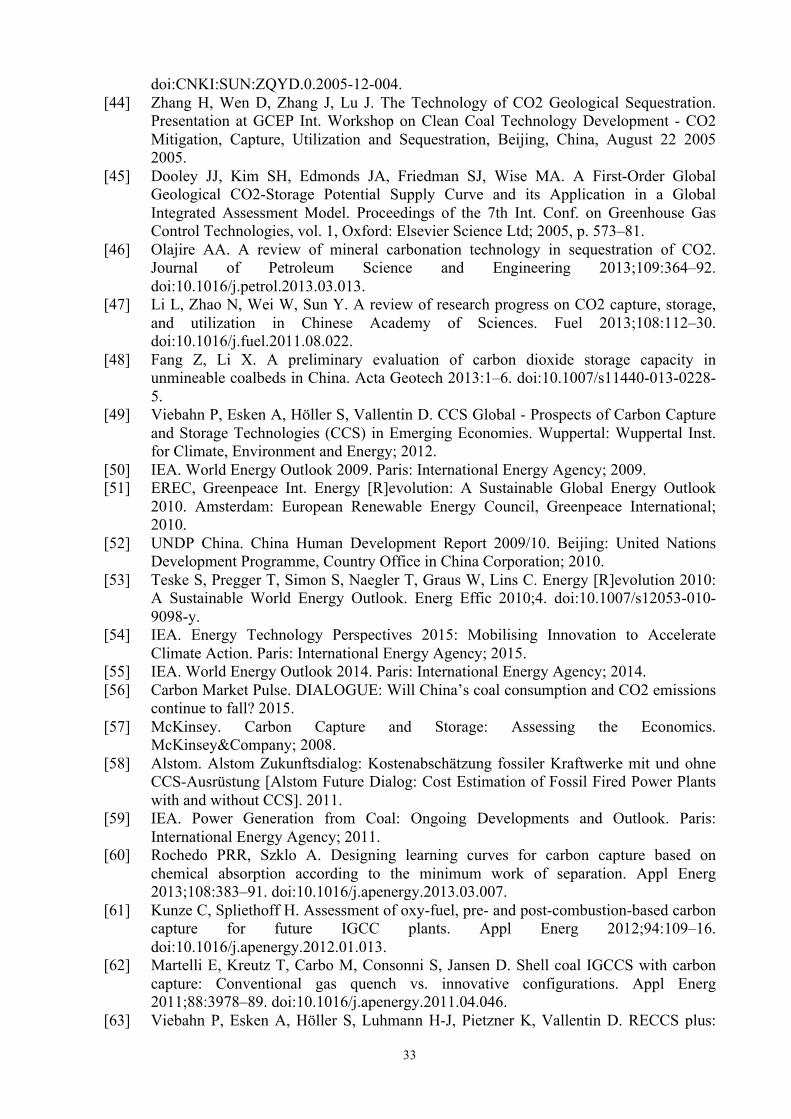
33
doi:CNKI:SUN:ZQYD.0.2005-12-004. [44] Zhang H, Wen D, Zhang J, Lu J. The Technology of CO2 Geological Sequestration.
Presentation at GCEP Int. Workshop on Clean Coal Technology Development - CO2 Mitigation, Capture, Utilization and Sequestration, Beijing, China, August 22 2005 2005.
[45] Dooley JJ, Kim SH, Edmonds JA, Friedman SJ, Wise MA. A First-Order Global Geological CO2-Storage Potential Supply Curve and its Application in a Global Integrated Assessment Model. Proceedings of the 7th Int. Conf. on Greenhouse Gas Control Technologies, vol. 1, Oxford: Elsevier Science Ltd; 2005, p. 573–81.
[46] Olajire AA. A review of mineral carbonation technology in sequestration of CO2. Journal of Petroleum Science and Engineering 2013;109:364–92. doi:10.1016/j.petrol.2013.03.013.
[47] Li L, Zhao N, Wei W, Sun Y. A review of research progress on CO2 capture, storage, and utilization in Chinese Academy of Sciences. Fuel 2013;108:112–30. doi:10.1016/j.fuel.2011.08.022.
[48] Fang Z, Li X. A preliminary evaluation of carbon dioxide storage capacity in unmineable coalbeds in China. Acta Geotech 2013:1–6. doi:10.1007/s11440-013-0228-5.
[49] Viebahn P, Esken A, Höller S, Vallentin D. CCS Global - Prospects of Carbon Capture and Storage Technologies (CCS) in Emerging Economies. Wuppertal: Wuppertal Inst. for Climate, Environment and Energy; 2012.
[50] IEA. World Energy Outlook 2009. Paris: International Energy Agency; 2009. [51] EREC, Greenpeace Int. Energy [R]evolution: A Sustainable Global Energy Outlook
2010. Amsterdam: European Renewable Energy Council, Greenpeace International; 2010.
[52] UNDP China. China Human Development Report 2009/10. Beijing: United Nations Development Programme, Country Office in China Corporation; 2010.
[53] Teske S, Pregger T, Simon S, Naegler T, Graus W, Lins C. Energy [R]evolution 2010: A Sustainable World Energy Outlook. Energ Effic 2010;4. doi:10.1007/s12053-010-9098-y.
[54] IEA. Energy Technology Perspectives 2015: Mobilising Innovation to Accelerate Climate Action. Paris: International Energy Agency; 2015.
[55] IEA. World Energy Outlook 2014. Paris: International Energy Agency; 2014. [56] Carbon Market Pulse. DIALOGUE: Will China’s coal consumption and CO2 emissions
continue to fall? 2015. [57] McKinsey. Carbon Capture and Storage: Assessing the Economics.
McKinsey&Company; 2008. [58] Alstom. Alstom Zukunftsdialog: Kostenabschätzung fossiler Kraftwerke mit und ohne
CCS-Ausrüstung [Alstom Future Dialog: Cost Estimation of Fossil Fired Power Plants with and without CCS]. 2011.
[59] IEA. Power Generation from Coal: Ongoing Developments and Outlook. Paris: International Energy Agency; 2011.
[60] Rochedo PRR, Szklo A. Designing learning curves for carbon capture based on chemical absorption according to the minimum work of separation. Appl Energ 2013;108:383–91. doi:10.1016/j.apenergy.2013.03.007.
[61] Kunze C, Spliethoff H. Assessment of oxy-fuel, pre- and post-combustion-based carbon capture for future IGCC plants. Appl Energ 2012;94:109–16. doi:10.1016/j.apenergy.2012.01.013.
[62] Martelli E, Kreutz T, Carbo M, Consonni S, Jansen D. Shell coal IGCCS with carbon capture: Conventional gas quench vs. innovative configurations. Appl Energ 2011;88:3978–89. doi:10.1016/j.apenergy.2011.04.046.
[63] Viebahn P, Esken A, Höller S, Luhmann H-J, Pietzner K, Vallentin D. RECCS plus:
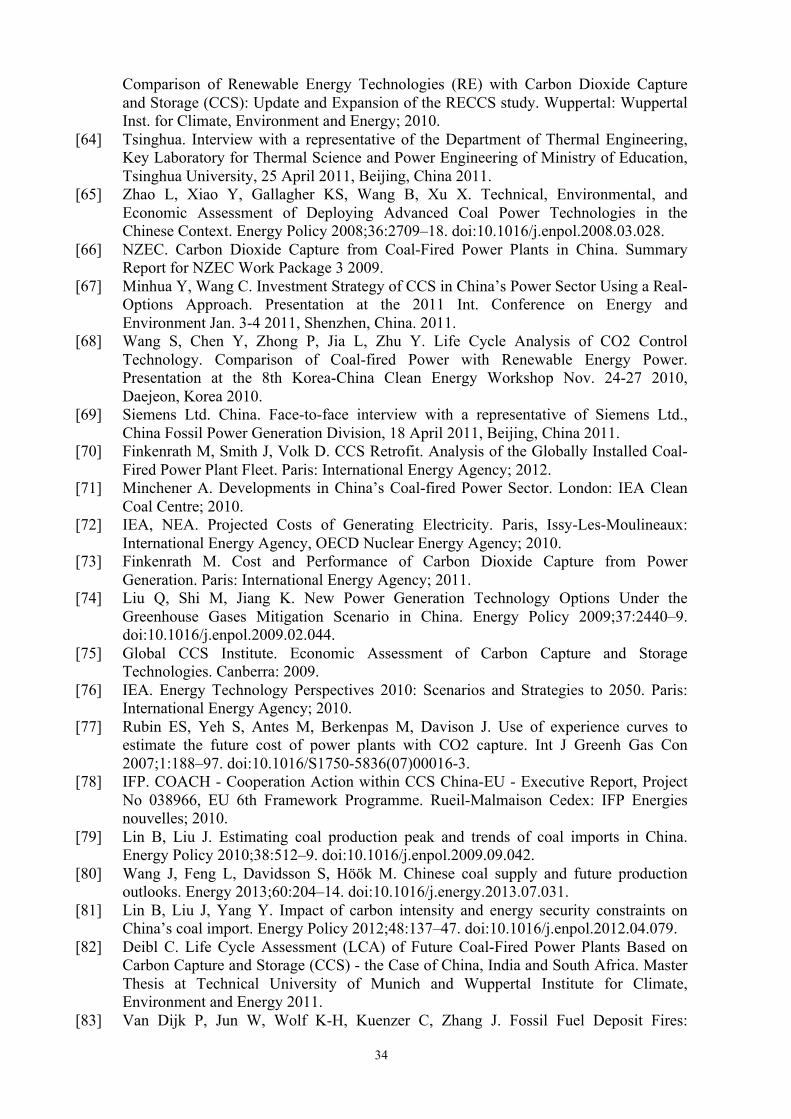
34
Comparison of Renewable Energy Technologies (RE) with Carbon Dioxide Capture and Storage (CCS): Update and Expansion of the RECCS study. Wuppertal: Wuppertal Inst. for Climate, Environment and Energy; 2010.
[64] Tsinghua. Interview with a representative of the Department of Thermal Engineering, Key Laboratory for Thermal Science and Power Engineering of Ministry of Education, Tsinghua University, 25 April 2011, Beijing, China 2011.
[65] Zhao L, Xiao Y, Gallagher KS, Wang B, Xu X. Technical, Environmental, and Economic Assessment of Deploying Advanced Coal Power Technologies in the Chinese Context. Energy Policy 2008;36:2709–18. doi:10.1016/j.enpol.2008.03.028.
[66] NZEC. Carbon Dioxide Capture from Coal-Fired Power Plants in China. Summary Report for NZEC Work Package 3 2009.
[67] Minhua Y, Wang C. Investment Strategy of CCS in China’s Power Sector Using a Real-Options Approach. Presentation at the 2011 Int. Conference on Energy and Environment Jan. 3-4 2011, Shenzhen, China. 2011.
[68] Wang S, Chen Y, Zhong P, Jia L, Zhu Y. Life Cycle Analysis of CO2 Control Technology. Comparison of Coal-fired Power with Renewable Energy Power. Presentation at the 8th Korea-China Clean Energy Workshop Nov. 24-27 2010, Daejeon, Korea 2010.
[69] Siemens Ltd. China. Face-to-face interview with a representative of Siemens Ltd., China Fossil Power Generation Division, 18 April 2011, Beijing, China 2011.
[70] Finkenrath M, Smith J, Volk D. CCS Retrofit. Analysis of the Globally Installed Coal-Fired Power Plant Fleet. Paris: International Energy Agency; 2012.
[71] Minchener A. Developments in China’s Coal-fired Power Sector. London: IEA Clean Coal Centre; 2010.
[72] IEA, NEA. Projected Costs of Generating Electricity. Paris, Issy-Les-Moulineaux: International Energy Agency, OECD Nuclear Energy Agency; 2010.
[73] Finkenrath M. Cost and Performance of Carbon Dioxide Capture from Power Generation. Paris: International Energy Agency; 2011.
[74] Liu Q, Shi M, Jiang K. New Power Generation Technology Options Under the Greenhouse Gases Mitigation Scenario in China. Energy Policy 2009;37:2440–9. doi:10.1016/j.enpol.2009.02.044.
[75] Global CCS Institute. Economic Assessment of Carbon Capture and Storage Technologies. Canberra: 2009.
[76] IEA. Energy Technology Perspectives 2010: Scenarios and Strategies to 2050. Paris: International Energy Agency; 2010.
[77] Rubin ES, Yeh S, Antes M, Berkenpas M, Davison J. Use of experience curves to estimate the future cost of power plants with CO2 capture. Int J Greenh Gas Con 2007;1:188–97. doi:10.1016/S1750-5836(07)00016-3.
[78] IFP. COACH - Cooperation Action within CCS China-EU - Executive Report, Project No 038966, EU 6th Framework Programme. Rueil-Malmaison Cedex: IFP Energies nouvelles; 2010.
[79] Lin B, Liu J. Estimating coal production peak and trends of coal imports in China. Energy Policy 2010;38:512–9. doi:10.1016/j.enpol.2009.09.042.
[80] Wang J, Feng L, Davidsson S, Höök M. Chinese coal supply and future production outlooks. Energy 2013;60:204–14. doi:10.1016/j.energy.2013.07.031.
[81] Lin B, Liu J, Yang Y. Impact of carbon intensity and energy security constraints on China’s coal import. Energy Policy 2012;48:137–47. doi:10.1016/j.enpol.2012.04.079.
[82] Deibl C. Life Cycle Assessment (LCA) of Future Coal-Fired Power Plants Based on Carbon Capture and Storage (CCS) - the Case of China, India and South Africa. Master Thesis at Technical University of Munich and Wuppertal Institute for Climate, Environment and Energy 2011.
[83] Van Dijk P, Jun W, Wolf K-H, Kuenzer C, Zhang J. Fossil Fuel Deposit Fires:
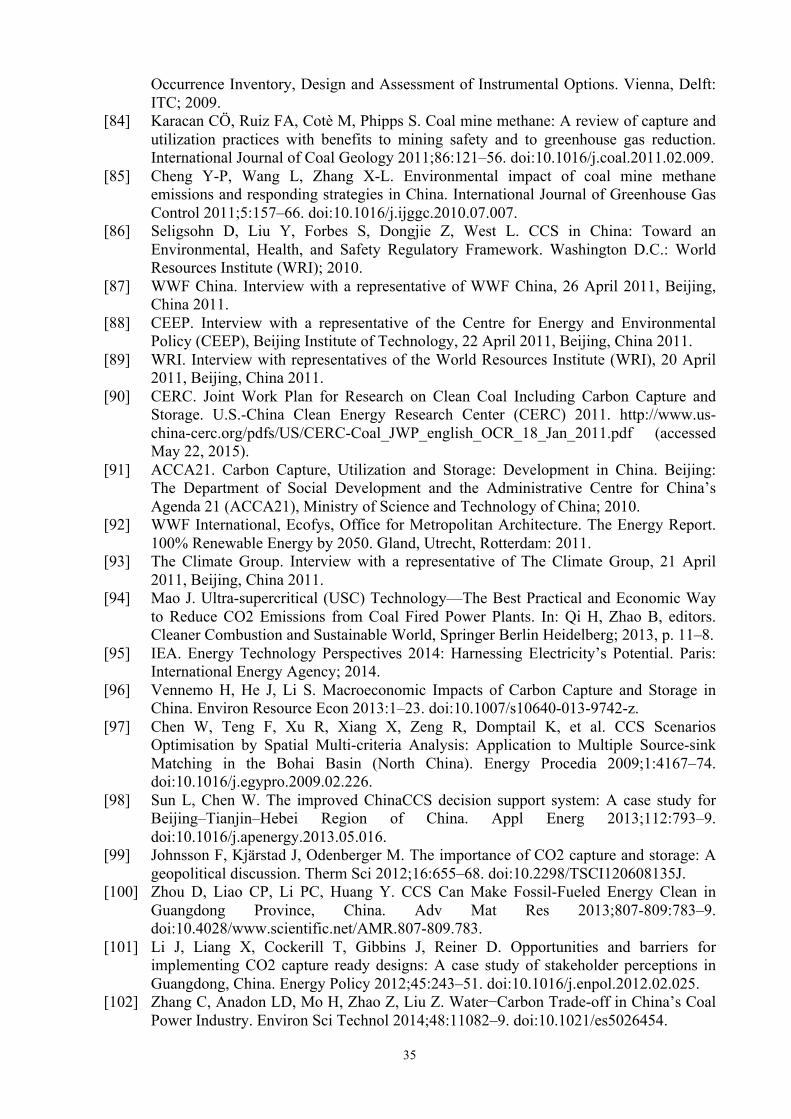
35
Occurrence Inventory, Design and Assessment of Instrumental Options. Vienna, Delft: ITC; 2009.
[84] Karacan CÖ, Ruiz FA, Cotè M, Phipps S. Coal mine methane: A review of capture and utilization practices with benefits to mining safety and to greenhouse gas reduction. International Journal of Coal Geology 2011;86:121–56. doi:10.1016/j.coal.2011.02.009.
[85] Cheng Y-P, Wang L, Zhang X-L. Environmental impact of coal mine methane emissions and responding strategies in China. International Journal of Greenhouse Gas Control 2011;5:157–66. doi:10.1016/j.ijggc.2010.07.007.
[86] Seligsohn D, Liu Y, Forbes S, Dongjie Z, West L. CCS in China: Toward an Environmental, Health, and Safety Regulatory Framework. Washington D.C.: World Resources Institute (WRI); 2010.
[87] WWF China. Interview with a representative of WWF China, 26 April 2011, Beijing, China 2011.
[88] CEEP. Interview with a representative of the Centre for Energy and Environmental Policy (CEEP), Beijing Institute of Technology, 22 April 2011, Beijing, China 2011.
[89] WRI. Interview with representatives of the World Resources Institute (WRI), 20 April 2011, Beijing, China 2011.
[90] CERC. Joint Work Plan for Research on Clean Coal Including Carbon Capture and Storage. U.S.-China Clean Energy Research Center (CERC) 2011. http://www.us-china-cerc.org/pdfs/US/CERC-Coal_JWP_english_OCR_18_Jan_2011.pdf (accessed May 22, 2015).
[91] ACCA21. Carbon Capture, Utilization and Storage: Development in China. Beijing: The Department of Social Development and the Administrative Centre for China’s Agenda 21 (ACCA21), Ministry of Science and Technology of China; 2010.
[92] WWF International, Ecofys, Office for Metropolitan Architecture. The Energy Report. 100% Renewable Energy by 2050. Gland, Utrecht, Rotterdam: 2011.
[93] The Climate Group. Interview with a representative of The Climate Group, 21 April 2011, Beijing, China 2011.
[94] Mao J. Ultra-supercritical (USC) Technology—The Best Practical and Economic Way to Reduce CO2 Emissions from Coal Fired Power Plants. In: Qi H, Zhao B, editors. Cleaner Combustion and Sustainable World, Springer Berlin Heidelberg; 2013, p. 11–8.
[95] IEA. Energy Technology Perspectives 2014: Harnessing Electricity’s Potential. Paris: International Energy Agency; 2014.
[96] Vennemo H, He J, Li S. Macroeconomic Impacts of Carbon Capture and Storage in China. Environ Resource Econ 2013:1–23. doi:10.1007/s10640-013-9742-z.
[97] Chen W, Teng F, Xu R, Xiang X, Zeng R, Domptail K, et al. CCS Scenarios Optimisation by Spatial Multi-criteria Analysis: Application to Multiple Source-sink Matching in the Bohai Basin (North China). Energy Procedia 2009;1:4167–74. doi:10.1016/j.egypro.2009.02.226.
[98] Sun L, Chen W. The improved ChinaCCS decision support system: A case study for Beijing–Tianjin–Hebei Region of China. Appl Energ 2013;112:793–9. doi:10.1016/j.apenergy.2013.05.016.
[99] Johnsson F, Kjärstad J, Odenberger M. The importance of CO2 capture and storage: A geopolitical discussion. Therm Sci 2012;16:655–68. doi:10.2298/TSCI120608135J.
[100] Zhou D, Liao CP, Li PC, Huang Y. CCS Can Make Fossil-Fueled Energy Clean in Guangdong Province, China. Adv Mat Res 2013;807-809:783–9. doi:10.4028/www.scientific.net/AMR.807-809.783.
[101] Li J, Liang X, Cockerill T, Gibbins J, Reiner D. Opportunities and barriers for implementing CO2 capture ready designs: A case study of stakeholder perceptions in Guangdong, China. Energy Policy 2012;45:243–51. doi:10.1016/j.enpol.2012.02.025.
[102] Zhang C, Anadon LD, Mo H, Zhao Z, Liu Z. Water−Carbon Trade-off in China’s Coal Power Industry. Environ Sci Technol 2014;48:11082–9. doi:10.1021/es5026454.
36
[103] Viebahn P. Life Cycle Assessment for Power Plants with CCS. In: Stolten D, Scherer V, editors. Efficient Carbon Capture for Coal Power Plants, Weinheim: WILEY-VCH; 2011, p. 83–109.
[104] Singh B, Strømman AH, Hertwich EG. Comparative Life Cycle Environmental Assessment of CCS Technologies. Int J Greenh Gas Con 2011;5:911–21. doi:10.1016/j.ijggc.2011.03.012.
[105] Schreiber A, Zapp P, Marx J. Meta-Analysis of Life Cycle Assessment Studies on Electricity Generation with Carbon Capture and Storage. J Ind Ecol 2012;16:S155–68. doi:10.1111/j.1530-9290.2011.00435.x.
[106] Jiang X, Akber Hassan WA, Gluyas J. Modelling and monitoring of geological carbon storage: A perspective on cross-validation. Appl Energ 2013;112:784–92. doi:10.1016/j.apenergy.2013.01.068.
[107] Zhou S, Kyle GP, Yu S, Clarke LE, Eom J, Luckow P, et al. Energy use and CO2 emissions of China’s industrial sector from a global perspective. Energy Policy 2013;58:284–94. doi:10.1016/j.enpol.2013.03.014.
[108] Ludig S, Haller M, Bauer N. Tackling long-term climate change together: The case of flexible CCS and fluctuating renewable energy. Energy Procedia 2011;4:2580–7. doi:10.1016/j.egypro.2011.02.156.
[109] Nimtz M, Krautz H-J. Flexible Operation of CCS Power Plants to Match Variable Renewable Energies. Energy Procedia 2013;40:294–303. doi:10.1016/j.egypro.2013.08.034.
Acknowledgements
This paper is based on the CCS global report [49], which was supported financially by the
German Federal Ministry for the Environment, Nature Conservation and Nuclear Safety. We
thank Prof. Can Wang (Tsinghua University, Beijing) for his critical review of the underlying
China study as part of this report. Updated information has been included in this article. We
would like to thank our colleague Sascha Samadi for his useful comments and suggestions
about an earlier version of this paper. Furthermore, we thank Teresa Gehrs (LinguaConnect) for
proof-reading the manuscript and the anonymous reviewers for their valuable comments and
suggestions.